Embed Size (px)
Citation preview
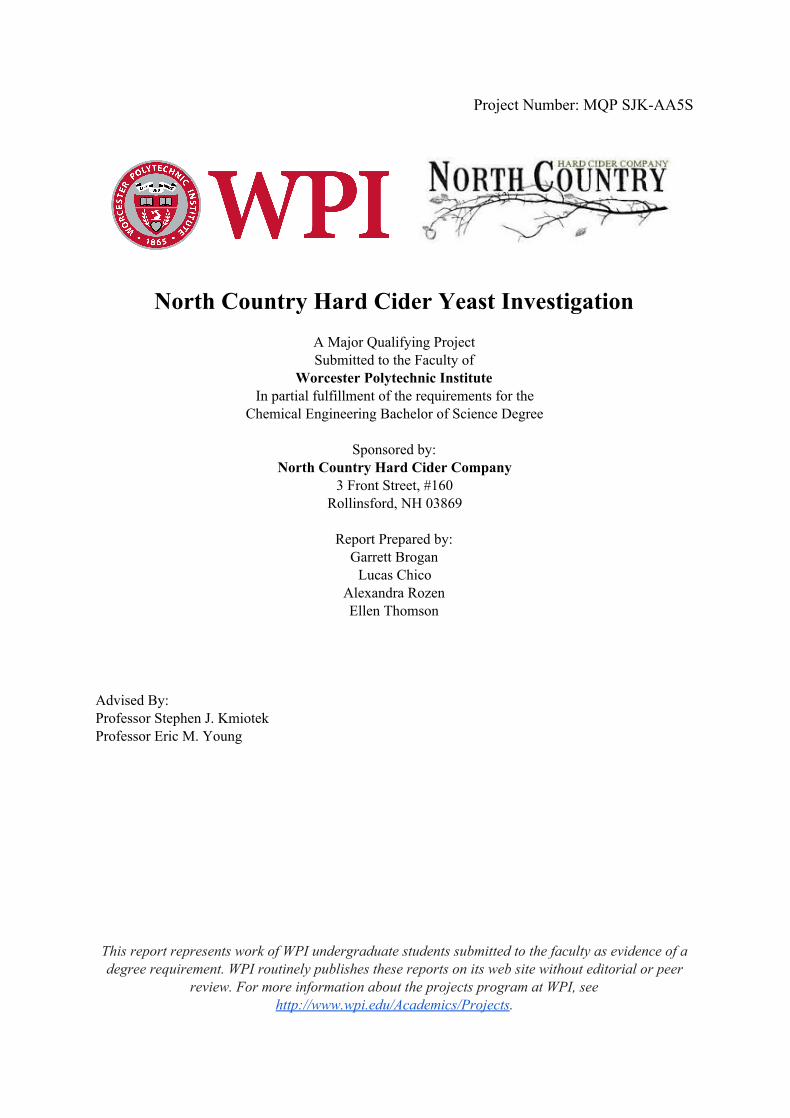
Project Number: MQP SJK-AA5S
North Country Hard Cider Yeast Investigation
A Major Qualifying Project Submitted to the Faculty of
Worcester Polytechnic Institute In partial fulfillment of the requirements for the
Chemical Engineering Bachelor of Science Degree
Sponsored by: North Country Hard Cider Company
3 Front Street, #160 Rollinsford, NH 03869
Report Prepared by:
Garrett Brogan Lucas Chico
Alexandra Rozen Ellen Thomson
Advised By: Professor Stephen J. Kmiotek Professor Eric M. Young This report represents work of WPI undergraduate students submitted to the faculty as evidence of a degree requirement. WPI routinely publishes these reports on its web site without editorial or peer
review. For more information about the projects program at WPI, see http://www.wpi.edu/Academics/Projects.
1
ABSTRACT
This project worked in collaboration with North Country Hard Cider, a hard cidery established in 2014, to investigate two areas of interest. The first focused on yeast removal and product turbidity based on the flow rate through a centrifuge. Data was collected at various flow rates in order to optimize centrifuge performance. Turbidity and yeast count data for final products were determined to provide a baseline for future product development. The second experiment aimed to identify and create a profile of the various yeast strains found in the different steps of the fermenting process. Yeast strains were identified through DNA isolation, amplification, and sequencing. This information can be used for further product development and improving product consistency at North Country.
2 | P a g e
ACKNOWLEDGEMENTS Our group would like to thank the following people for their contributions to our Major Qualifying Project:
● Professor Stephen Kmiotek for his knowledge, advice, and constant support and positivity throughout this project.
● Professor Eric Young for his invaluable contribution of knowledge, lab space, and guidance through difficult yeast identification processes.
● Ron Dixon and Silas Gordon for allowing us to expand our knowledge and complete this project for their business.
● Professor Michael Buckholt for his constant help providing equipment and teaching of procedures used in this project.
● Joseph Collins for his advice and assistance with background knowledge of the project and in the lab procedures.
● Professor John Bergendahl for his providing and assistance with equipment. ● Professor David Adams for his early contributions to the success of this project. ● Professor William Clark for providing us with lab equipment.
3 | P a g e

TABLE OF CONTENTS
INTRODUCTION 6
BACKGROUND 7
1. North Country Hard Cider 7
2. Importance of Nutrients in the Making Hard Cider 7
2.1 YAN Test Analysis 7
2.2 Apple Variety 8
3. Settling 8
3.1 Flocculation and Crashing 8
3.2 Centrifuges 9
3.2.1 Types of Centrifuges 10
3.3 Turbidity 10
4. Yeast 10
4.1 Yeast and Fermentation 10
4.2 Quantifying Yeast in a Sample 12
5. Yeast Identification 12
5.1 Plating and Growing Yeast Cultures 13
5.2 DNA Isolation and Purification 13
5.3 Polymerase Chain Reaction (PCR) 14
METHODOLOGY 15
Part 1: Turbidity Determination 15
Part 2: Yeast Quantification 15
Part 3: Yeast Strain Identification 20
RESULTS AND DISCUSSION 26
1. Turbidity Testing of Final Products 26
2. Optimization of the Centrifuge: An Investigation 26
Yeast Concentration vs. Flow Rate of Centrifuge 27
Yeast Concentration vs. Turbidity 30
Turbidity vs. Flow Rate of Centrifuge 31
Centrifuge Performance Compared to North Country’s Natural Settling Process 32
3. Identification of Yeast Profile 33
4 | P a g e
Berry Brett 34
Double Down 34
Bitter Bros 35
Firestarter 35
Fresh Juice 35
Post Centrifuge Fresh Juice 36
General Discussion 36
CONCLUSION AND RECOMMENDATIONS 38
WORKS CITED 39
APPENDIX 43
APPENDIX I - Example Calculations for Quantifying Yeast in the Standard and Cider
Samples. 43
APPENDIX II - Yeast Concentration Data Tables 44
APPENDIX III - Images of Grown YPD Agar Plates 45
APPENDIX IV - Full Sequenced Results 47
APPENDIX V - Full Blast Results 52
5 | P a g e
LIST OF TABLES Table 1: A list of nutrients that can be used to increase the nitrogen concentration of raw cider.
10
Table 2: Summary of samples tested. 21
Table 3: PCR thermocycling steps. 25
Table 4: Descriptions of each sample collected. 27
Table 5: Turbidity of final product samples. 28
Table 6: Concentration of yeast and turbidity of the samples taken from the centrifuge runs.
29
Table 7: Concentration of yeast in final product samples. 34
Table 8: Colony descriptions. 36
6 | P a g e
LIST OF FIGURES Figure 1: Yeast cell structure that allows flocculation. 11
Figure 2: The process of alcohol fermentation. 13
Figure 3: Hemocytometer. 14
Figure 4: Turbidimeter used in the experimentation. 17
Figure 5: North Country Hard Cider’s centrifuge control and tasting valves. 18
Figure 6: Example of a bottom left quadrant of the hemocytometer with an uncountable number of yeast cells.
19
Figure 7: Example of a hemocytometer view from batch 131 that contains noise. 19
Figure 8: Example image of a hemocytometer quadrant (bottom right) with yeast cells loaded.
20
Figure 9: Quadrant streak method. 23
Figure 10: Tm calculator results for the primers. 25
Figure 11: Example of Eton Bioscience DNA sequencing order form. 26
Figure 12: Partial chromatogram results for the reverse K ITS4 sample. 26
Figure 13: Sequence results for the reverse K ITS4 sample. 27
Figure 14: Graph of yeast concentration versus gallons per minute of all samples. 30
Figure 15: Graph of yeast concentration versus gallons per minute for batch 164 and 181.
31
Figure 16: Graph of yeast concentration versus gallons per minute of Honeycrisp apple batches.
32
Figure 17: Graph of yeast concentration versus turbidity of all samples. 33
Figure 18: Graph of turbidity versus flow rate through the centrifuge of all samples. 34
7 | P a g e
INTRODUCTION North Country Hard Cider is a hard apple cider company located in Rollinsford, New
Hampshire. The company was started in 2014 by Ron Dixon, Silas Gordon, and Ivan Gordon with the goal to produce a 100% natural cider without synthetic additives, preservatives, or filtration. Two years later, the company has stayed true to this promise and has become an extremely successful cidery. North Country produces between 7 and 15 blue barrels (bbl) of cider for each batch of apples from orchards in Maine, New Hampshire, and New York. These apples arrive to North Country in the form of UV-treated apple juice. The cider is pumped into one of seven fermentation tanks, yeast is added, and the fermentation process is run until the cider reaches between 4.5% and 6% alcohol by volume. After the desired alcohol content is reached, the yeast is cold crashed out of the process by filling the cooling jacket on the reactor with glycerol. The immediately settled yeast is siphoned off, the fermented cider is transferred to a settling bin, and the bin is kept in cold storage to further settle. When the cider reaches a desired clarity and taste, determined by visual and taste inspection, it is carbonated, kegged, and released as product. North Country is constantly experimenting with different flavors of cider by utilizing the different types of apples and adding natural juices like cranberry and pomegranate juice, and cinnamon. There are at least six different products on tap at North Country, and a few are sold as bottled products.
Aside from using a specific gravity test to determine the alcohol content of their cider, North Country relies on qualitative testing to determine the quality of their product. The variations in their process and taste tests sometimes cause inconsistencies in North Country’s products. The purpose of this Major Qualifying Project is to provide North Country with scientific data about their cider to help improve and streamline their process. Specifically, the project focuses on a study of the use of a centrifuge and an analysis of the yeast present in the cider. Objectives The objectives of the project are as follows:
1. Identify target turbidity settings for a centrifuge by determining the turbidity of the final cider products.
2. Optimize the centrifuge performance to a target final product. a. Minimize the yeast concentration based upon flow rate. b. Evaluate the relationship between yeast concentration and turbidity. c. Analyze the relationship between turbidity and flow rate. d. Evaluate yeast concentration in final cider products to determine a standard.
3. Obtain a profile of yeast strains present in North Country products.
8 | P a g e

BACKGROUND 1. North Country Hard Cider
The fermenting of wine and the brewing of beer has been around for more than 10,000 years but the production of cider through the fermentation of apples is a more recent process. The general process for making hard cider involves the fermentation of apple juices 1
using yeast to break down glucose into ethanol and carbon dioxide [C6H12O6 (glucose) → 2 C2H5OH (ethanol) + 2 CO2 (carbon dioxide)]. The yeast used in the fermentation process can 2
come from wild yeast strains that naturally exist on the apples, but this process is extremely slow. It is common practice for brewers to add their own yeast strains to obtain a faster fermentation and desired flavor or alcohol content. After the fermentation process reaches the desired alcohol content, most brewers will filter out the yeast from the final cider product.2 Another common practice in cider production , similar to wineries, is the addition of sulphites in order to cull the populations of microorganisms, such as unwanted wild yeasts and bacteria that spoil the taste of the final product. 3
North Country Hard Cider uses a very common yeast strain, Saccharomyces cerevisiae “US-05 Chico” yeast that is used by many beer and cider brewers. However, North Country has a strong commitment to an all natural cider, and therefore does not follow what would be considered many of the common practices of cider making. In order to keep the cider naturally sweet, North Country stops their fermentation before the yeast converts all available glucose into ethanol. This leaves the natural sugars and flavors of the apples in the final cider, eliminating the need to add sweeteners to the product later on. Additionally, instead of filtering yeast out of their product,a process known as “cold crashing” is used to deactivate the yeast to stop the fermentation process. Cold crashing requires lowering the temperature of the cider to the point necessary to deactivate, but not kill, the “US-05” yeast strain. This occurs at about 36OF, and is followed by settling out the yeast. North Country is also unique in that they do not add any sulfites or other preservatives to their cider. North Country Hard Cider determines the quality of their cider mostly by taste, with the exception of pH and sugar tests, to determine total acidity and alcohol content respectively. 2. Importance of Nutrients in the Making Hard Cider
The fermenting of hard cider can be an unpredictable process. There are many conditions that limit or accelerate fermentation including temperature, nutrients, and alcohol content. The availability of nutrients is extremely important for the fermentation process. Nitrogen is the primary growth-limiting nutrient for yeast cell growth, and a deficiency of nitrogen will create a by-product of hydrogen sulfide (H2S) and a sulfur odor in the cider. In 4
order to ensure that a healthy fermentation occurs, the nutrient concentration in the apples should be evaluated. A yeast assimilable nitrogen (YAN) test can be used to “evaluate the nutrients that the cider needs to obtain a nourishing fermentation.” The YAN test determines 5
the amount of organic nitrogen, or primary amino nitrogen, and the inorganic nitrogen, or ammonia, through chemical analysis from a UV spectrometer.5 After this test is complete, the brew master will be able to judge if nitrogen adjustments need to be made.
1 (Encyclopædia Britannica) 2 (Helmenstine) 3 (Lea) 4 (Kelkar & Dolan) 5 (Tran, Johnston, Gonzalez, & Collins)
9 | P a g e
2.1 YAN Test Analysis
The variety, season, and age of raw apple change the nutrient concentration dramatically. The Scott Laboratories cider handbook states that the target YAN for a batch of raw cider is 150 - 200 mg/L. Once the YAN testing is complete, and a batch is noted as 6
nitrogen deficient, there are many ways to adjust the level. One way includes adding the proper amount of nutrients, of which contain nitrogen, to the cider. Table 1 reveals a list of different nutrients that Scott Laboratories recommends using as additives.
Yeast Nutrient YAN Contribution
Nutrient Dose 20 g/hL (1.7 lb/1000 gal)
Dose 25 g/hL (2 lb/1000 gal)
Dose 30 g/hL (2.5 lb/1000 gal) YAN Source
Anchorferm 2 mgN/L 2.5 mgN/L Not recommended Organic nitrogen from autolyzed yeast
DAP 50 mgN/L 63 mgN/L Inorganic nitrogen
Fermaid A 30 mgN/L 36 mgN/L Inorganic nitrogen (from DAP) and organic nitrogen from autolyzed yeast
Fermaid K 25 mgN/L 30 mgN/L Inorganic nitrogen (from DAP) and organic nitrogen from autolyzed yeast
Fermaid O 10 mgN/L 12 mgN/L Organic nitrogen from autolyzed yeast
Go-Ferm 7.5 mgN/L 10 mgN/L Organic nitrogen from autolyzed yeast
Go-Ferm Protect
Evaluation 7.5 mgN/L 10 mgN/L Organic nitrogen from autolyzed yeast
Nutrient Vit End 7 mgN/L 8.5 mgN/L Organic nitrogen from autolyzed yeast
Phosphate Titres 50 mgN/L 63 mgN/L Inorganic nitrogen
SIY 33 (Fermaid
2133) 8 mgN/L 10 mgN/L Organic nitrogen from autolyzed yeast
Table 1: A list of nutrients that can be used to increase the nitrogen concentration of raw cider.6
Scott Laboratories also provides methods on how to add the nutrients when the batch has a YAN values of greater than 200 mg/L, between 125 and 200 mg/L, and less than 125 mg/L. 2.2 Apple Variety
YAN test results are dependent on “climate, soil, farming techniques, apple maturity, and apple variety”.5 The juice of apples can have nitrogen levels between 75 and 150 mg/L depending on the maturity of the orchard and the types of fertilizers used in the growing process.4 The nitrogen levels play a critical role in the growth of yeast and the rate of fermentation.
6 (Dekramer)
10 | P a g e
Research has found that yeast development depends on the initial level of nitrogen in the cider and that complete fermentation occurs faster with larger initial nitrogen levels. The 7
Brazilian study that revealed these relationships used Fuji, Gala, and Joaquina apples, of which are ordered from highest to lowest nitrogen concentration and complete fermentation occurred in 10.5, 12, and 19 days respectively.5 North Country uses many different types of apples for their different varieties of ciders, and thus each variety of cider ferments in a unique way. 3. Settling
A key aspect of the cider process at North Country is the separation of the crashed yeast and the hard cider product. Currently, this separation is done by settling. This settling requires months to accomplish and is very inefficient. North Country is interested in better methods of separation, however they wish to keep their product as natural as possible. This eliminates the possibility for North Country to use filtration to separate the yeast from the product because filtration can remove other desired natural components from the cider along with the yeast. The most promising improvement to the settling process for North Country is the use of a centrifuge.
3.1 Flocculation and Crashing
The property that allows yeast to settle is flocculation, which is the result of the interaction of flocculins on the yeast cells. Flocculation causes yeast cells to clump together in larger, heavier masses called flocs, which settle out of the cider more easily than individual yeast cells. The main factors that affect yeast flocculation are pH and temperature. The ideal pH for flocculation of most yeast strains is between 3.8 and 5.3. Flocculation is promoted 8
best at lower temperatures, but the ideal temperature is strain specific. Flocs will either settle to the bottom of a solution (Lager type yeast), or float
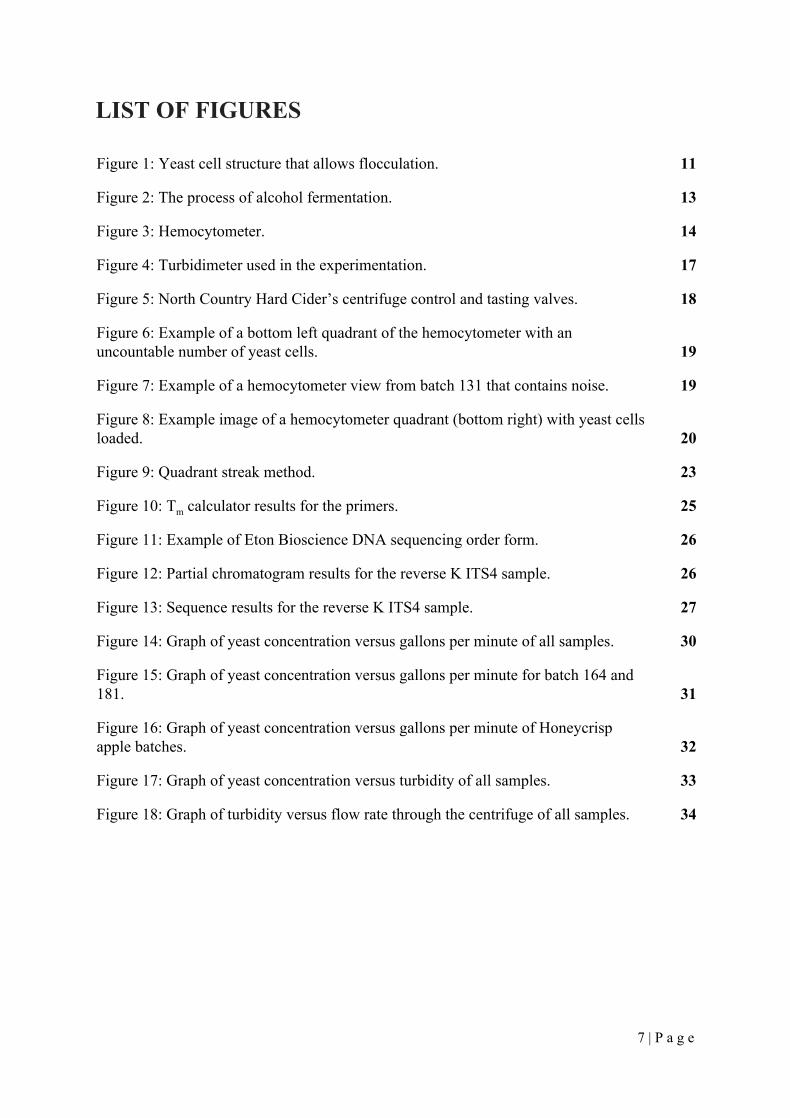
to the top (Ale type yeast). As the flocculation process progresses, the fermentation process slows down and eventually stops, as the yeast in flocs has ceased fermentation. Flocculation occurs due to a nutrient present in the cell walls of yeast, known as mannose. Also embedded in yeast cell walls are flocculins, which are proteins that bind to mannose. Calcium present in solution activates the flocculins in yeast cells to bind to mannose in other yeast cells, thus forming flocs of yeast. The presence of free mannose in solution, but not present in the yeast, can occupy the flocculins and thus limit flocculation in the solution.8 An illustration of flocculation can be seen below in Figure 1.
Figure 1: Yeast cell structure that allows flocculation.8
At the same time the yeast flocculates and settles, the fermentation process yields. This is due to the yeast becoming dormant in low temperatures. As mentioned previously, North 9
7 (Alberti, Vieira, Drilleau, Wosiacki, & Nogueira) 8 (Verstrepen, Derdelinckx, Verachtert, & Delvaux)
9 (Colby)
11 | P a g e

Country uses US-05 yeast, which ferments between 15 and 22oC. Below this range, the yeast will undergo crashing and cease fermentation.
Crashing is a process used in the production of hard ciders to stop the fermentation process and settle out the yeast and other particles in the cider. As is done at North Country, the product undergoes cold crashing, occurring with the assistance of refrigeration. In the presence of cold, the yeast flocculates (clumps) together and simultaneously begins to settle to the bottom of the solution. 10
“Racking” is another process involved in cold crashing. Once the product undergoes crashing, and the yeast and other particles have settled, the product is racked. This means that the supernatant is separated from the sediment. This removes yeast from the product and 11
adds clarity. North Country Hard Cider follows a typical process of up to six rounds of racking and crashing in between, with only two rounds of racking when the centrifuge is used. This process ensures that the product is sufficiently clarified. 3.2 Centrifuges
One method to increase the efficiency of sedimentation of yeast is to utilize a centrifuge. A centrifuge is a device that separates liquids and solids based upon their densities. A spinning vessel inside of the centrifuge contains the materials in need of separation. At high accelerations of this vessel, the denser solid material moves to the outside of the vessel while the liquid remains in the center. 3.2.1 Types of Centrifuges
A tubular bowl centrifuge consists of a bowl where material in need of separation enters from the bottom. As the material fills the bowl, a driving apparatus creates spinning of the material in the bowl. This spinning creates the force that pulls the heavier material to the outside of the bowl while the less dense material remains on the inside. The less dense material, in this case liquid cider, can then be drawn out of the bowl from the middle, while the solids at the outside of the bowl must be removed manually. A continuous decanter centrifuge has a permanent wall bowl with an axis of rotation that causes the liquid material to be drawn to the end of the bowl with the larger radius while the solid material in the bowl is drawn off at the smaller end of the bowl. The disk centrifuge, which is commonly used in the brewing industry, contains numerous stacked disk which the liquid flows through in an upward pattern. As the liquid moves up the disks, the solids are collected on top of the disks and the centrifugal force moves these solids to the outside of the disk where they can be collected. The force that a typical disk centrifuge produces can be up to 14,000 times the force of gravity, decreasing the necessary settling time to a fraction of gravitational settling. 12
The centrifuge that North Country is experimenting with is a disk centrifuge. 3.3 Turbidity
As a means to determine how well a product has been settled, cider makers will commonly perform tests to determine a product's turbidity. Turbidity is defined as the amount of light scattered by the particles present in a fluid, with higher turbidity meaning more scattered light. Turbidity meters shine a light through a sample of liquid and measure the amount of scattered light in NTU, or nephelometric turbidity units. While North Country 13
10 (Soares) 11 (Dixon) 12 (Catalano, Palazzolo, Robertson, et al.) 13 (Swanson & Baldwin)
12 | P a g e

determines the quality of the finished product based upon taste, there is also a visual assessment of the clarity of the product. Testing for turbidity in the product can produce quantitative data for product clarity so that North Country no longer has rely on qualitative factors to determine clarity. Because the test centrifuge used by North Country does not has an attached flow meter but not a turbidity meter, the turbidites of different samples will need to be measured in order to give recommendations for ideal turbidites once a centrifuge with turbidity setting capabilities is acquired.
4. Yeast 4.1 Yeast and Fermentation
Yeast is a single cell fungi that provides the needed catalysts in the reaction process that converts sugar to alcohol. In a very common biochemical reaction, yeast reacts with glucose to produce ethanol and carbon dioxide. Commonly used in bakeries to provide carbon dioxide to rise dough, yeast is also used to produce the ethanol present in alcoholic beverages, such as beer and hard cider.5 As a fungi, yeast exists in many strains with a spectrum of unique characteristics.
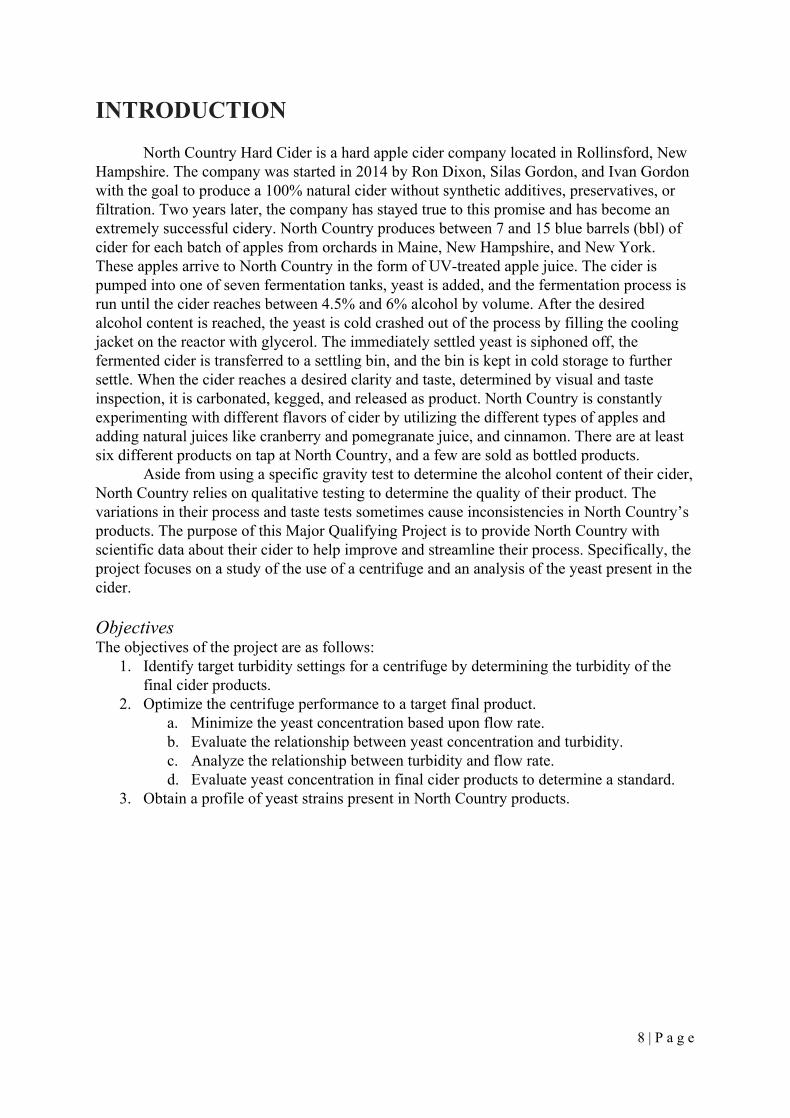
Fermentation is the process that yeast undergo to produce ATP (a molecule used by yeast cells for energy) from glucose or fructose. Fermentation occurs as alcohol fermentation or lactic acid fermentation. The yeast used in brewing undergoes alcoholic fermentation as the mechanism to produce ATP. Simplified, this fermentation proceeds in two pathways: converting glucose (or fructose) to pyruvate, and converting pyruvate to ethanol. The process is illustrated below.
Figure 2: The process of alcohol fermentation. 14
Overall, the pathway converting glucose to pyruvate consumes 1 glucose molecule, 2
ATP molecules, and 2 ADP molecules to form 1 pyruvate molecule and 4 ATP molecules. In this pathway, the molecule NAD+ (the oxidized form of nicotinamide adenine dinucleotide) is reduced to NADH by accepting. In order to regenerate the NAD+ from NADH, so as to allow for more glucose conversion, the pyruvate molecule releases a carbon dioxide (CO2) molecule and becomes acetaldehyde, which then Oxidizes the NADH molecule to NAD+ and becomes an ethanol molecule, the desired end product in alcohol fermentation.
The type of yeast that carries out the above described alcoholic fermentation are yeast in the Saccharomyces genus.15 The particular yeast used by North Country Hard Cider goes
14 (Khan Academy)
13 | P a g e
by SaFale US-05, and is a form of the Saccharomyces cerevisiae strain of yeast. Produced by Fermentis, SaFale US-05 is a dry yeast with the only additive being the emulsifier E491. US-05 produces fermentation ideally between 15 and 22 C. 15
4.2 Quantifying Yeast in a Sample
In order to determine if a settling method is effective and efficient, the amount of yeast in a sample can be quantified. Quantifying the amount of yeast present in a sample can be done in many different ways ranging in complexity, but three more common ways include cell staining, hemocytometer use, and automated cell counter.
Viability assessments are often completed on samples that contain yeast in order to monitor the yeast production and fermentation, through knowing concentration of alive and dead cells. Cell staining includes “staining the cells with a chosen dye and counting a small 16
portion of the cells manually under a light microscope.” The most common dyes include 17
methylene blue and methylene violet, and only dead cells become stained. Cells can be counted using a hemocytometer, whether they are stained or not.
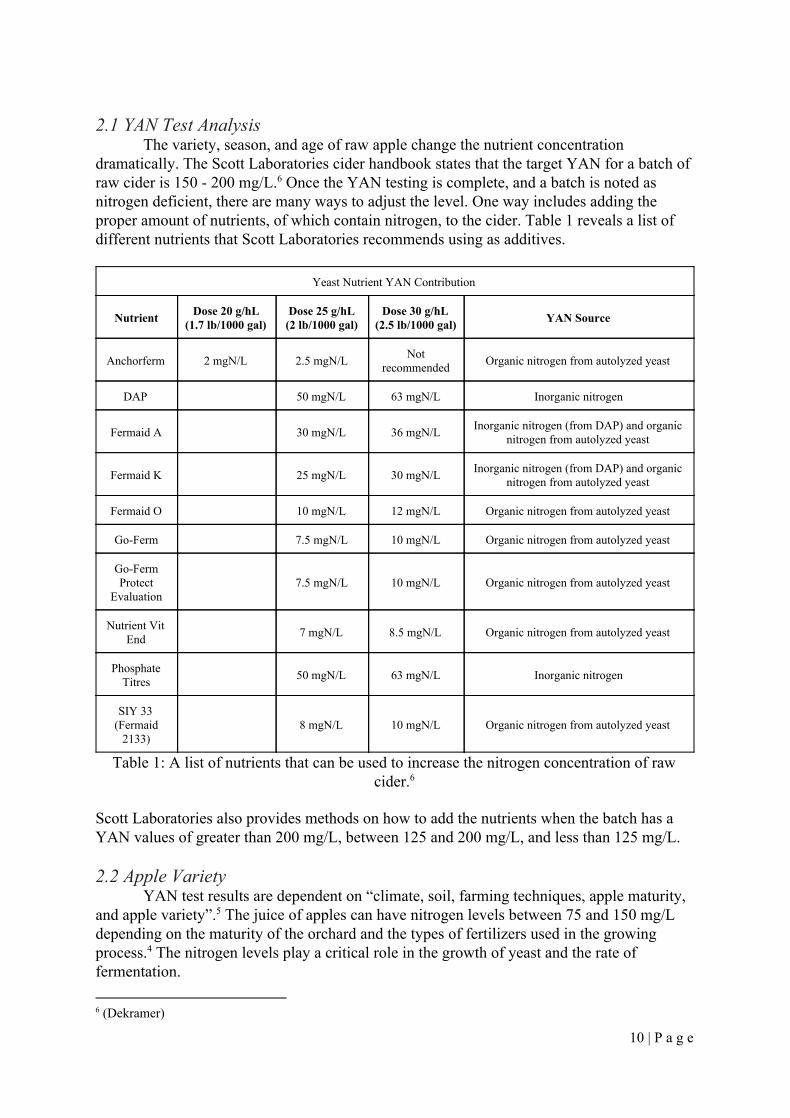
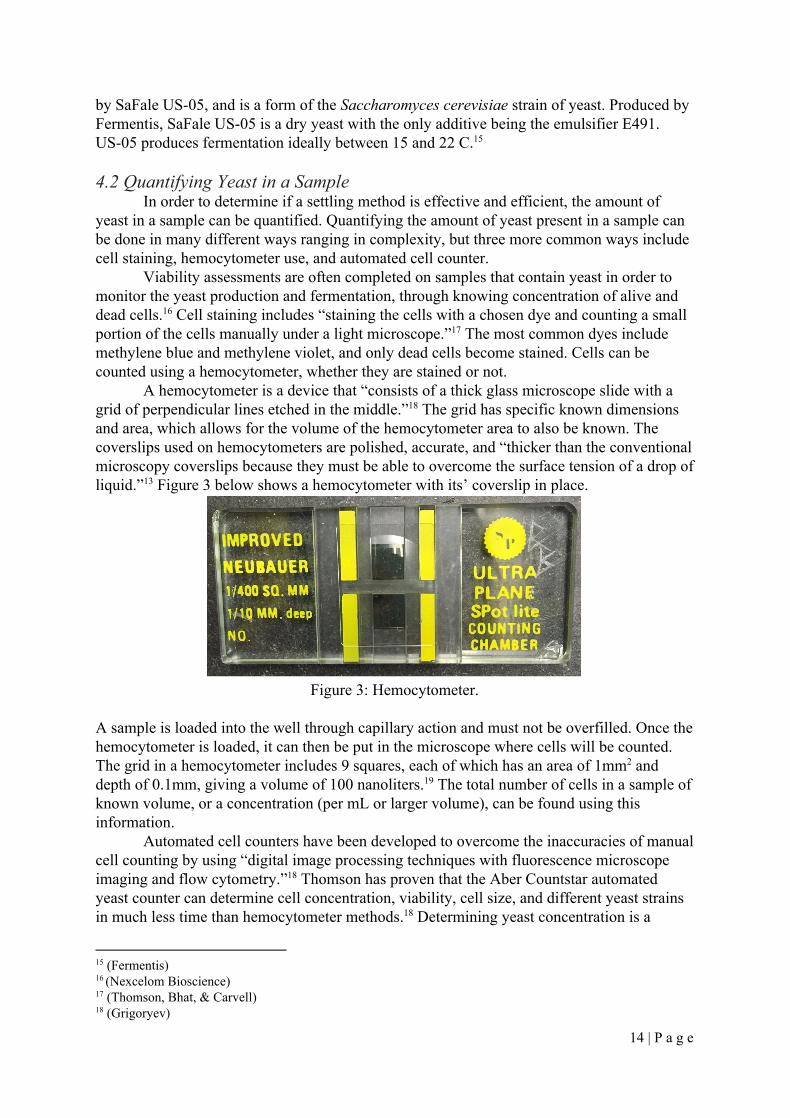
A hemocytometer is a device that “consists of a thick glass microscope slide with a grid of perpendicular lines etched in the middle.” The grid has specific known dimensions 18
and area, which allows for the volume of the hemocytometer area to also be known. The coverslips used on hemocytometers are polished, accurate, and “thicker than the conventional microscopy coverslips because they must be able to overcome the surface tension of a drop of liquid.”13 Figure 3 below shows a hemocytometer with its’ coverslip in place.
Figure 3: Hemocytometer.
A sample is loaded into the well through capillary action and must not be overfilled. Once the hemocytometer is loaded, it can then be put in the microscope where cells will be counted. The grid in a hemocytometer includes 9 squares, each of which has an area of 1mm2 and depth of 0.1mm, giving a volume of 100 nanoliters.19 The total number of cells in a sample of known volume, or a concentration (per mL or larger volume), can be found using this information.
Automated cell counters have been developed to overcome the inaccuracies of manual cell counting by using “digital image processing techniques with fluorescence microscope imaging and flow cytometry.”18 Thomson has proven that the Aber Countstar automated yeast counter can determine cell concentration, viability, cell size, and different yeast strains in much less time than hemocytometer methods.18 Determining yeast concentration is a
15 (Fermentis) 16 (Nexcelom Bioscience) 17 (Thomson, Bhat, & Carvell) 18 (Grigoryev)
14 | P a g e
common lab practice and a specific method is chosen based on the available equipment, time, and expertise of the investigators. 5. Yeast Identification 5.1 Plating and Growing Yeast Cultures
For research purposes, yeast and other microorganisms are grown in/on a media that contains nutrients necessary for the growth and survival of the microorganisms. This media is available in two forms: as a liquid (broth), and as a solid (agar). When the solid media is used, it is applied to the base of a petri dish. This combination is known as an agar plate. Typically, the media is chosen based on what microorganisms need to be developed. In the case of yeast, a common media to use is YPD. 19
YPD stands for yeast extract, peptide and dextrose. These represent the three nutrients used in the media to feed the growth of yeast cultures. Other medias exist for yeast plating, such as YPG (yeast extract, peptide, glycerol) and YPAD (yeast extract, peptide, adenine sulfide, and dextrose) and function to develop yeast colonies with the goal of preventing certain mutations. For the purposes of this MQP, YPD was a sufficient media. This was due to the lack of insight on which species of yeast we may find going into the identification portion of the project. Since YPD is non-selective towards the common yeast species, it was the ideal candidate. 20
Agar plates are used in conjunction with samples that are thought to contain microorganisms that will incubate/grow on the plate. Typically a sterile instrument known as an inoculating loop is used to introduce the microorganisms to the plate. Once the sample is introduced, the plate is left in a warm environment of about 30°C until a sufficient number of distinct “colonies” or groupings of the microorganism cells have visibly developed on the plate. Once this has happened, individual cell colonies can be isolated and used for various purposes, or even re-plated to grow more of the specific microorganism. Additionally, plates that have developed yeast colonies may be preserved for a few months if properly sealed and refrigerated at around 4°C. 21
5.2 DNA Isolation and Purification
Proper DNA isolation is greatly dependent on the organism that the DNA is taken from. In order to use sequenced DNA to identify which species or strain of an organism is present in a sample, it is vital to first determine which section of DNA is appropriate to identify the target organism. In the case of yeast identification, the section of DNA that is used to identify between different species and strains is the section known as Internal Transcribed Spacer (ITS) 1 to ITS4. This region of DNA is from the mitochondria, 22
therefore primers that amplify ITS1 and ITS2 cannot be used to identify bacteria. 23
Before DNA can be amplified and sequenced, it must first be removed from cells, isolated from other material, and purified. The steps involved in this can vary depending on the methods the scientist decides to follow, but will always involve the same basic steps. First, if the cells have a cell wall it, it needs to be removed or broken open through chemical or physical means. There are then several chemical and centrifugal steps that are used in succession to continually remove all other components of a cell until there is only DNA
19 (University of Utah) 20 (Sigma Aldrich. “Introduction to Yeast Media.”) 21 (Sigma Aldrich. “Yeast Growth Protocols.”) 22 (Wang, Hu, Long, et al.) 23 (Gomes, Kasuya, de Barros, et al.)
15 | P a g e
remaining. In order to make sure that only the target sections of DNA are amplified, PCR primers are introduced to the isolated and purified DNA samples. These primers are specifically designed to bind to certain sections of the DNA and facilitate DNA replication, which is catalyzed by the DNA polymerase enzyme.22 Again in the case of yeast identification, ITS1 and ITS4 primers would be used to isolate that specific region of the yeast DNA. This allows only that section of DNA be amplified before sequencing can occur. The specific chemical and centrifugal steps can vary and the steps that were employed by our team are discussed in detail in the Methodology section. 5.3 Polymerase Chain Reaction (PCR)
PCR is a process used to amplify a specific section of DNA. PCR was developed by biologist Kary Mullis, for which he was awarded the 1993 Nobel Prize in Chemistry. PCR 24
works by first using heat to separate DNA into two single strands. Following this, each single strand is replicated into normal double stranded DNA by a heat resistant enzyme. A PCR machine will then cycle this process of heating and enzyme-catalyzed DNA replication, making two new strands of DNA for every one strand that previously existed.
PCR is important in that it mass duplicates DNA from a small amount. When a small amount of DNA is isolated from a few cells, it can be copied and duplicated via PCR until there is a sufficient amount of DNA to sequence and identify microbes down to the Genus and oftentimes Species. 25
24 (Nobel Prize Organization) 25 (National Human Genome Research Institute)
16 | P a g e
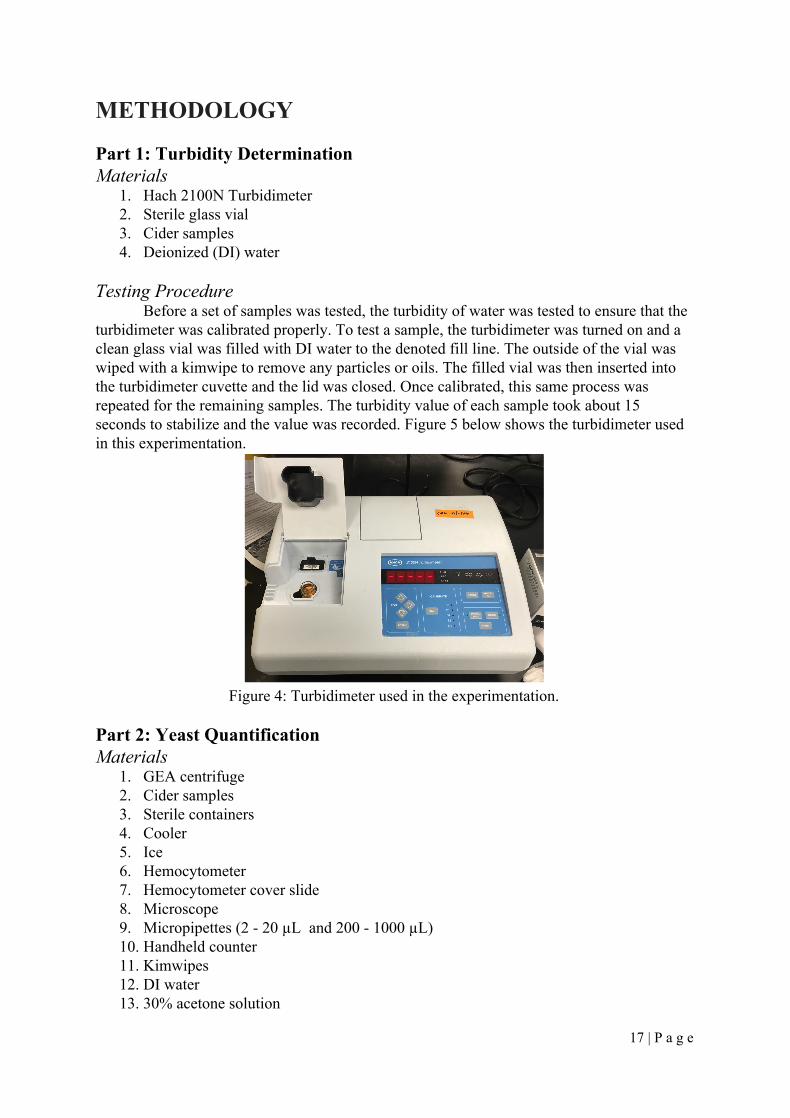
METHODOLOGY Part 1: Turbidity Determination Materials
1. Hach 2100N Turbidimeter 2. Sterile glass vial 3. Cider samples 4. Deionized (DI) water
Testing Procedure
Before a set of samples was tested, the turbidity of water was tested to ensure that the turbidimeter was calibrated properly. To test a sample, the turbidimeter was turned on and a clean glass vial was filled with DI water to the denoted fill line. The outside of the vial was wiped with a kimwipe to remove any particles or oils. The filled vial was then inserted into the turbidimeter cuvette and the lid was closed. Once calibrated, this same process was repeated for the remaining samples. The turbidity value of each sample took about 15 seconds to stabilize and the value was recorded. Figure 5 below shows the turbidimeter used in this experimentation.
Figure 4: Turbidimeter used in the experimentation.
Part 2: Yeast Quantification Materials
1. GEA centrifuge 2. Cider samples 3. Sterile containers 4. Cooler 5. Ice 6. Hemocytometer 7. Hemocytometer cover slide 8. Microscope 9. Micropipettes (2 - 20 µL and 200 - 1000 µL) 10. Handheld counter 11. Kimwipes 12. DI water 13. 30% acetone solution
17 | P a g e
14. US Chico yeast Sample Collection
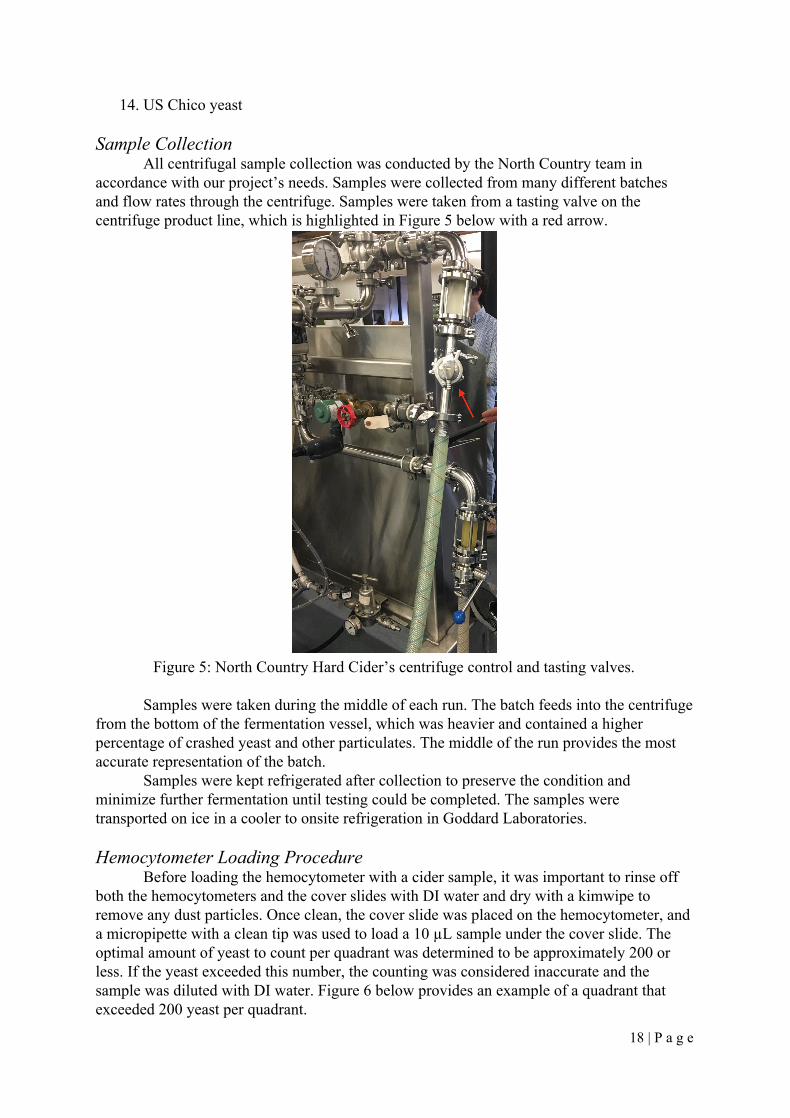
All centrifugal sample collection was conducted by the North Country team in accordance with our project’s needs. Samples were collected from many different batches and flow rates through the centrifuge. Samples were taken from a tasting valve on the centrifuge product line, which is highlighted in Figure 5 below with a red arrow.
Figure 5: North Country Hard Cider’s centrifuge control and tasting valves.
Samples were taken during the middle of each run. The batch feeds into the centrifuge
from the bottom of the fermentation vessel, which was heavier and contained a higher percentage of crashed yeast and other particulates. The middle of the run provides the most accurate representation of the batch.
Samples were kept refrigerated after collection to preserve the condition and minimize further fermentation until testing could be completed. The samples were transported on ice in a cooler to onsite refrigeration in Goddard Laboratories. Hemocytometer Loading Procedure
Before loading the hemocytometer with a cider sample, it was important to rinse off both the hemocytometers and the cover slides with DI water and dry with a kimwipe to remove any dust particles. Once clean, the cover slide was placed on the hemocytometer, and a micropipette with a clean tip was used to load a 10 µL sample under the cover slide. The optimal amount of yeast to count per quadrant was determined to be approximately 200 or less. If the yeast exceeded this number, the counting was considered inaccurate and the sample was diluted with DI water. Figure 6 below provides an example of a quadrant that exceeded 200 yeast per quadrant.
18 | P a g e
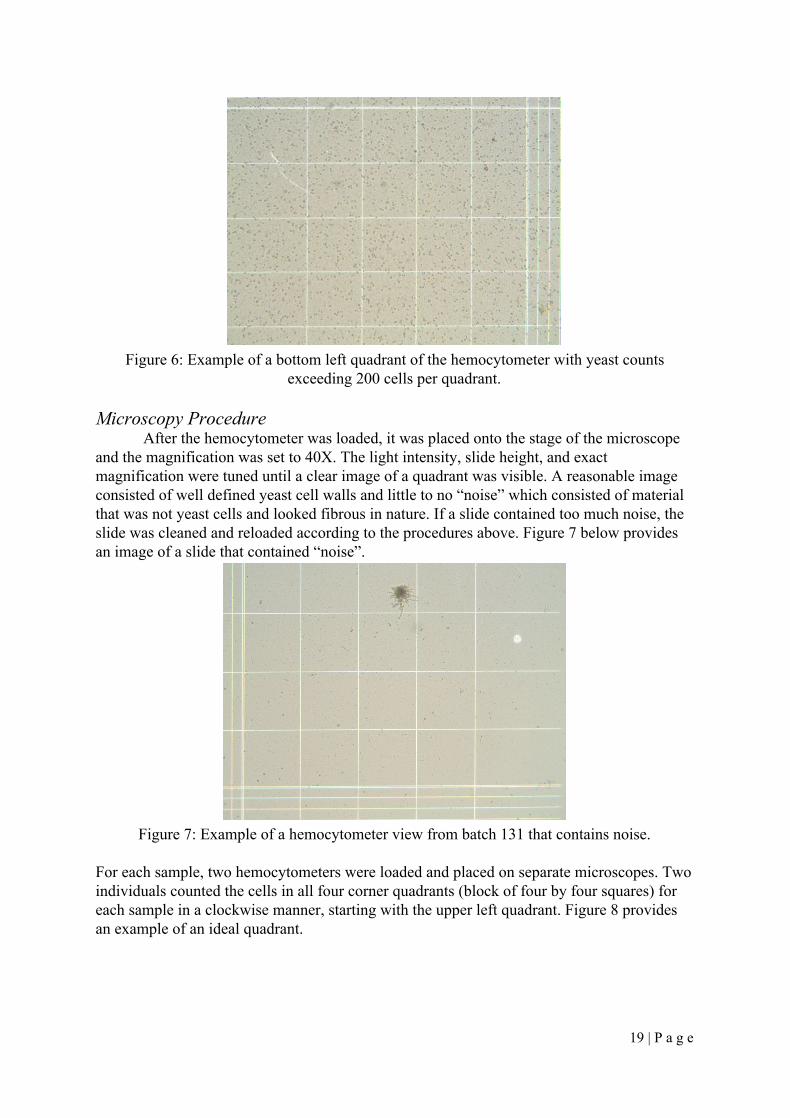
Figure 6: Example of a bottom left quadrant of the hemocytometer with yeast counts
exceeding 200 cells per quadrant.
Microscopy Procedure After the hemocytometer was loaded, it was placed onto the stage of the microscope
and the magnification was set to 40X. The light intensity, slide height, and exact magnification were tuned until a clear image of a quadrant was visible. A reasonable image consisted of well defined yeast cell walls and little to no “noise” which consisted of material that was not yeast cells and looked fibrous in nature. If a slide contained too much noise, the slide was cleaned and reloaded according to the procedures above. Figure 7 below provides an image of a slide that contained “noise”.
Figure 7: Example of a hemocytometer view from batch 131 that contains noise.
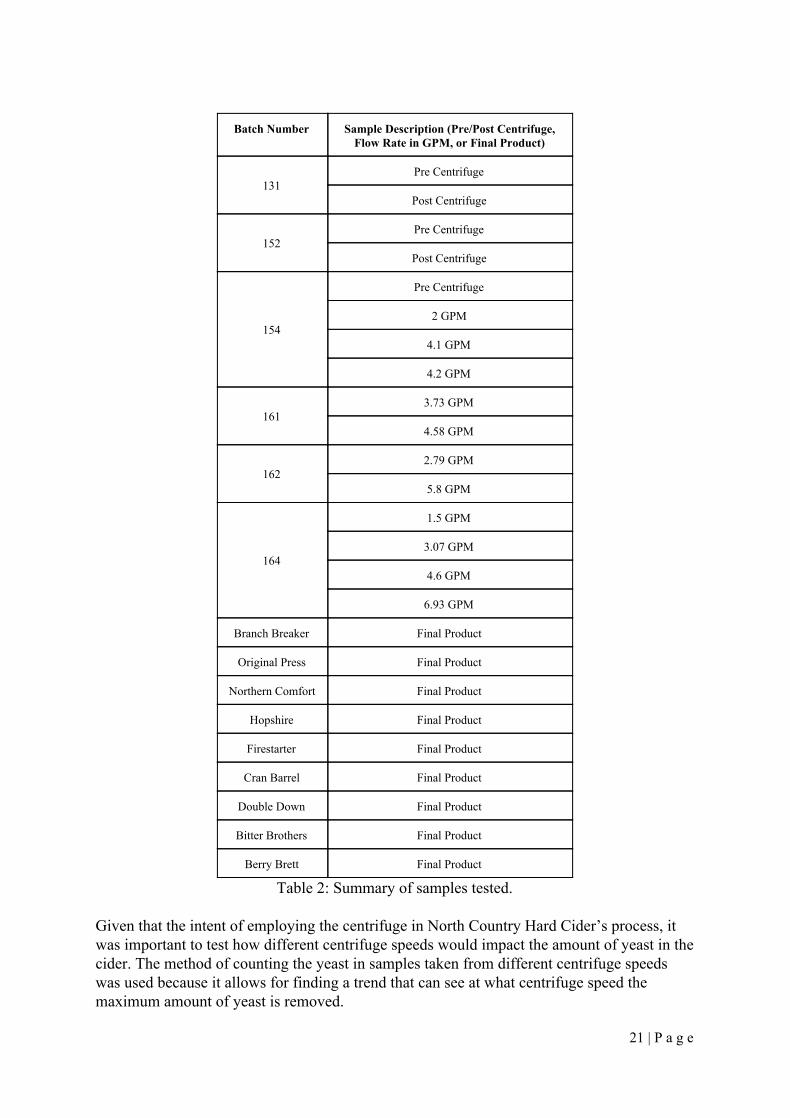
For each sample, two hemocytometers were loaded and placed on separate microscopes. Two individuals counted the cells in all four corner quadrants (block of four by four squares) for each sample in a clockwise manner, starting with the upper left quadrant. Figure 8 provides an example of an ideal quadrant.
19 | P a g e
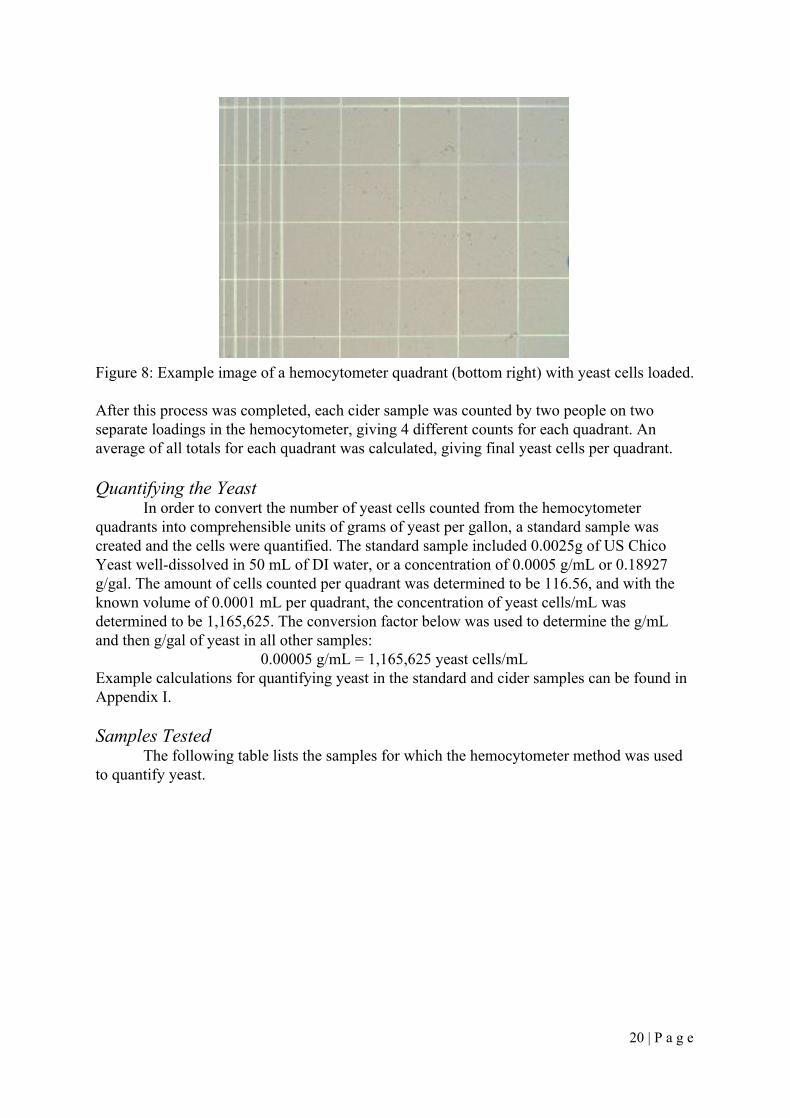
Figure 8: Example image of a hemocytometer quadrant (bottom right) with yeast cells loaded. After this process was completed, each cider sample was counted by two people on two separate loadings in the hemocytometer, giving 4 different counts for each quadrant. An average of all totals for each quadrant was calculated, giving final yeast cells per quadrant. Quantifying the Yeast
In order to convert the number of yeast cells counted from the hemocytometer quadrants into comprehensible units of grams of yeast per gallon, a standard sample was created and the cells were quantified. The standard sample included 0.0025g of US Chico Yeast well-dissolved in 50 mL of DI water, or a concentration of 0.0005 g/mL or 0.18927 g/gal. The amount of cells counted per quadrant was determined to be 116.56, and with the known volume of 0.0001 mL per quadrant, the concentration of yeast cells/mL was determined to be 1,165,625. The conversion factor below was used to determine the g/mL and then g/gal of yeast in all other samples:
0.00005 g/mL = 1,165,625 yeast cells/mL Example calculations for quantifying yeast in the standard and cider samples can be found in Appendix I. Samples Tested
The following table lists the samples for which the hemocytometer method was used to quantify yeast.
20 | P a g e
Batch Number Sample Description (Pre/Post Centrifuge,
Flow Rate in GPM, or Final Product)
131 Pre Centrifuge
Post Centrifuge
152 Pre Centrifuge
Post Centrifuge
154
Pre Centrifuge
2 GPM
4.1 GPM
4.2 GPM
161 3.73 GPM
4.58 GPM
162 2.79 GPM
5.8 GPM
164
1.5 GPM
3.07 GPM
4.6 GPM
6.93 GPM
Branch Breaker Final Product
Original Press Final Product
Northern Comfort Final Product
Hopshire Final Product
Firestarter Final Product
Cran Barrel Final Product
Double Down Final Product
Bitter Brothers Final Product
Berry Brett Final Product
Table 2: Summary of samples tested. Given that the intent of employing the centrifuge in North Country Hard Cider’s process, it was important to test how different centrifuge speeds would impact the amount of yeast in the cider. The method of counting the yeast in samples taken from different centrifuge speeds was used because it allows for finding a trend that can see at what centrifuge speed the maximum amount of yeast is removed.
21 | P a g e
Part 3: Yeast Strain Identification Materials
1. Micropipettes (2 - 20 µL and 200 - 1000 µL) 2. Technova YPD Agar plates 3. Celltreat Sterilized 10 microliter Inoculating Loop 4. Falcon 14 mL Polypropylene Round-Bottom Tube 5. 1.5ml Microcentrifuge Tubes 6. Eppendoff Minispin Centrifuge 7. YPD Liquid Broth 8. Sunrise Science Products YEP Broth 9. Sigma-Aldrich D-(+)-Glucose Powder (Glucose Powder) 10. 50 mM EDTA (pH 8.0) 11. Zymolyase, resuspended with Nuclease-Free Water to a final concentration of 75
units/µl 12. Ice Bath 13. Isopropanol (Room Temperature) 14. 70% Ethanol (Room Temperature) 15. 31.1 nM ITS1 Primer 16. 33.7 nM ITS4 Primer 17. OneTaq® 2X Master Mix with Standard Buffer 18. Denuclearized Water 19. Bio Rad Dyad Peltier Thermal Cycler 20. Plastic Bag 21. A Plasmid Editor Program 22. PCR Tubes
Sample Collection
Samples were collected by North Country using the same process as mentioned above. For this testing, the samples were left out at room temperature in order for the yeast to begin to reproduce before plating occurred. The samples were shaken each day and the carbon dioxide was released from the vessels. Plate Preparation and Procedure
Fully prepared YPD agar plates were ordered from Technova and used for the yeast growing processes. To begin, the cap of the sample is removed and the sterile inoculating loop was used to remove a loopful of the sample. The cap of the sample was replaced in order to minimize contamination. The lid of the agar plate was opened just enough to insert the inoculating loop and streak the plate. The plate was streaked in 3 or 4 sections, using a new sterile loop for each. The streaking pattern can be seen in the figure below.
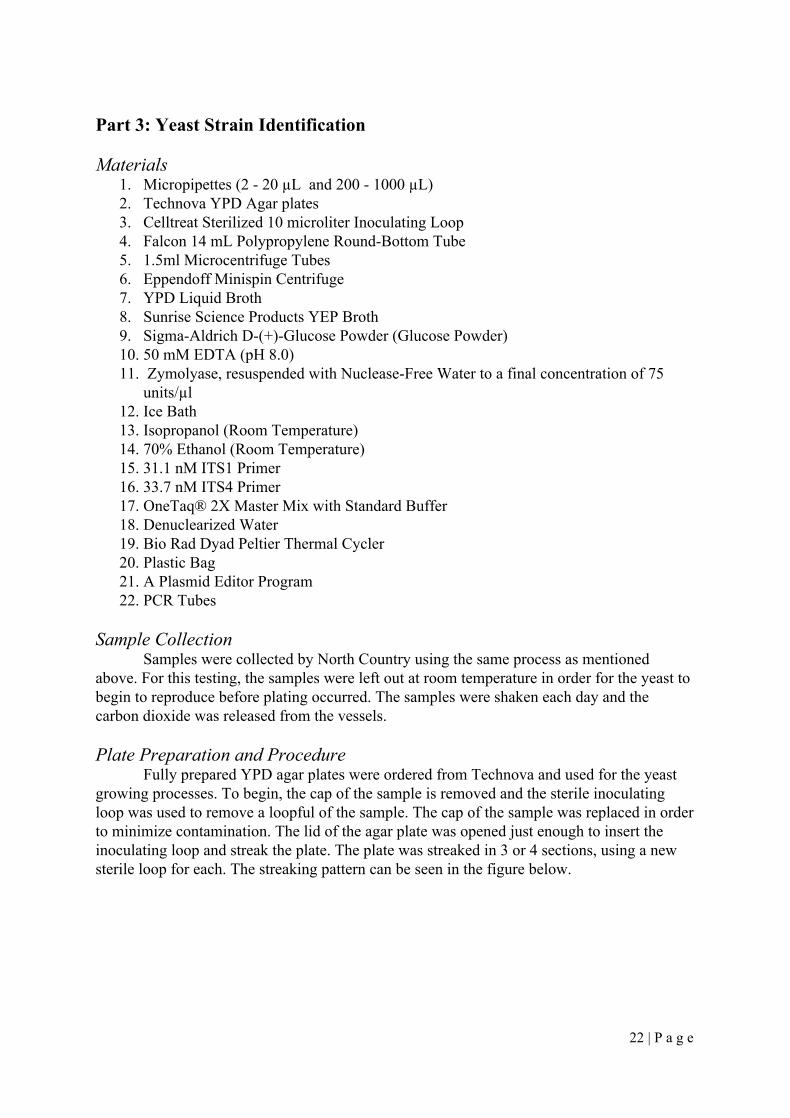
22 | P a g e
Figure 9: Quadrant streak method. 26
Each quadrant from Figure 9 represented the following growth patterns:
1. Area of initial inoculation and the first streak yields heavy growth. 2. Area of the second streak from area 1, which yields dense growth. 3. Area of the third streak from area 2, which yields weak growth. 4. Area of the fourth streak from area 3, which yields single colonies.
After the streaking process was complete, the lid of the agar plate is put down fully and the plate was left to grow at room temperature. Yeast Colony Transplant/Preparation
During the growth process, one of the colonies on the Bitter Brothers plate, had a unique pink color and texture. This colony was removed from the original plate using an inoculating loop and replated using the same streaking process as above, in order to isolate the species better. DNA Isolation and Purification
This next step included isolating the DNA from the different types of colonies that grew on the YPD Agar plates. The methodology for this process was taken from the Wizard® Genomic DNA Purification Kit Protocol. 27
1. Grew a yeast culture in a tube of YPD broth for 20 hours. a. The YPD broth was made by combining 15 g of YEP and 10 g of dextrose
with 500 mL of DI water. The solution was made in a glass liter bottle and autoclaved.
b. 14 mL polypropylene round-bottom tubes were filled with 5 mL of liquid YPD.
c. Single colonies were pulled off of a plate with a pipet tip and mixed into the liquid YPD in the labeled tube.
2. Added 1 mL of a culture grown for 20 hours in YPD broth to a 1.5 mL microcentrifuge tube.
3. Centrifuged at 13,400 rpm for 2 minutes to pellet the cells. Removed the supernatant, leaving the pellet.
26 (VALUE) 27 (Promega)
23 | P a g e

4. Resuspended the cells thoroughly in 293 µl of 50 mM EDTA. 5. Added 10 µl of 75 units/µl zymolyase, and gently pipet 4 times to mix. 6. Incubated the sample at 37°C for 60 minutes to digest the cell wall. Cooled to room
temperature. 7. Centrifuged the sample at 13,400 rpm for 2 minutes and then removed the
supernatant. 8. Added 300µl of Nuclei Lysis Solution to the cell pellet and gently pipetted to mix. 9. Added 100µl of Protein Precipitation Solution and vortexed vigorously at high speed
for 20 seconds. 10. Let the sample sit on ice for 5 minutes. 11. Centrifuged at 13,400 rpm for 3 minutes. 12. Transferred the supernatant containing the DNA to a clean 1.5ml microcentrifuge tube
containing 300µl of room temperature isopropanol. 13. Gently mixed by inversion until the thread-like strands of DNA form a visible mass. 14. Centrifuged at 13,400 rpm for 2 minutes. 15. Carefully decanted the supernatant and drained the tube on clean absorbent paper.
Added 300µl of room temperature 70% ethanol and gently inverted the tube several times to wash the DNA pellet.
16. Centrifuged at 13,400 rpm for 2 minutes. Carefully aspirated all of the ethanol. 17. Drained the tube on clean absorbent paper and allow the pellet to air-dry for 10–15
minutes. 18. Added 50µl of DNA Rehydration Solution. 19. Added 1.5µl of RNase Solution to the purified DNA sample. Vortex the sample for 1
second. Centrifuge briefly in a microcentrifuge for 5 seconds to collect the liquid and incubate at 37°C for 15 minutes.
20. Stored the DNA at 2–8°C until prepared for PCR. PCR
These methods include the steps taken to prepare the isolated DNA for PCR and the execution of PCR. The protocol from the OneTaq® 2X MasterMix package were used as guidelines. 28
1. Prepared the primers through rehydration. a. Added 311µl of nucleus free water to the ITS1 vial, making 100 mM solution.
i. This primer was used to isolate the base sequence (5’-3’) TCCGTAGGTGAACCTGCGG.23
b. Added 337µl of nuclease free water to the ITS4, making 100 mM solution. i. This primer was used to isolate the base sequence (5’-3’)
TCCTCCGCTTATTGATATGC.23
2. Made a 10 mM solutions with these primers - 10ul in 90 ul of nuclease free water. 3. Added the components below to a sterile thin-walled PCR tube to create a 50 µl
reaction and gently mixed the reaction: a. 25 µl Master Mix b. 2.5 µl of each primer c. 2 µl of DNA sample d. 18 µl of nuclease free water
4. Transferred PCR tubes to a PCR machine and began thermocycling using the conditions below:
28 (New England BioLaboratories. Protocol for OneTaq® 2X Master Mix with Standard Buffer (M0482).)
24 | P a g e
STEP TEMP (OC) TIME (s)
Initial Denaturation 94 30
30 Cycles - Melting Annealing Extension
94 50 68
15 15
120
Final Extension 68 300
Hold 10 Until samples are
removed
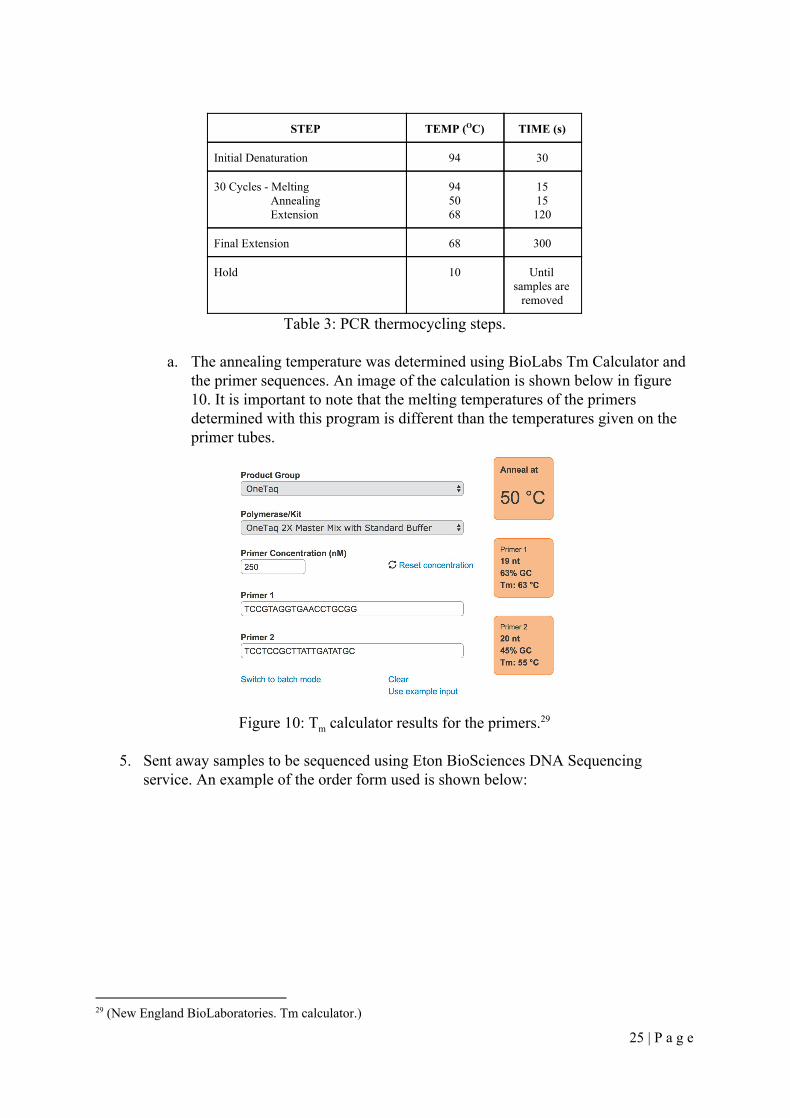
Table 3: PCR thermocycling steps.
a. The annealing temperature was determined using BioLabs Tm Calculator and the primer sequences. An image of the calculation is shown below in figure 10. It is important to note that the melting temperatures of the primers determined with this program is different than the temperatures given on the primer tubes.
Figure 10: Tm calculator results for the primers. 29
5. Sent away samples to be sequenced using Eton BioSciences DNA Sequencing
service. An example of the order form used is shown below:
29 (New England BioLaboratories. Tm calculator.)
25 | P a g e
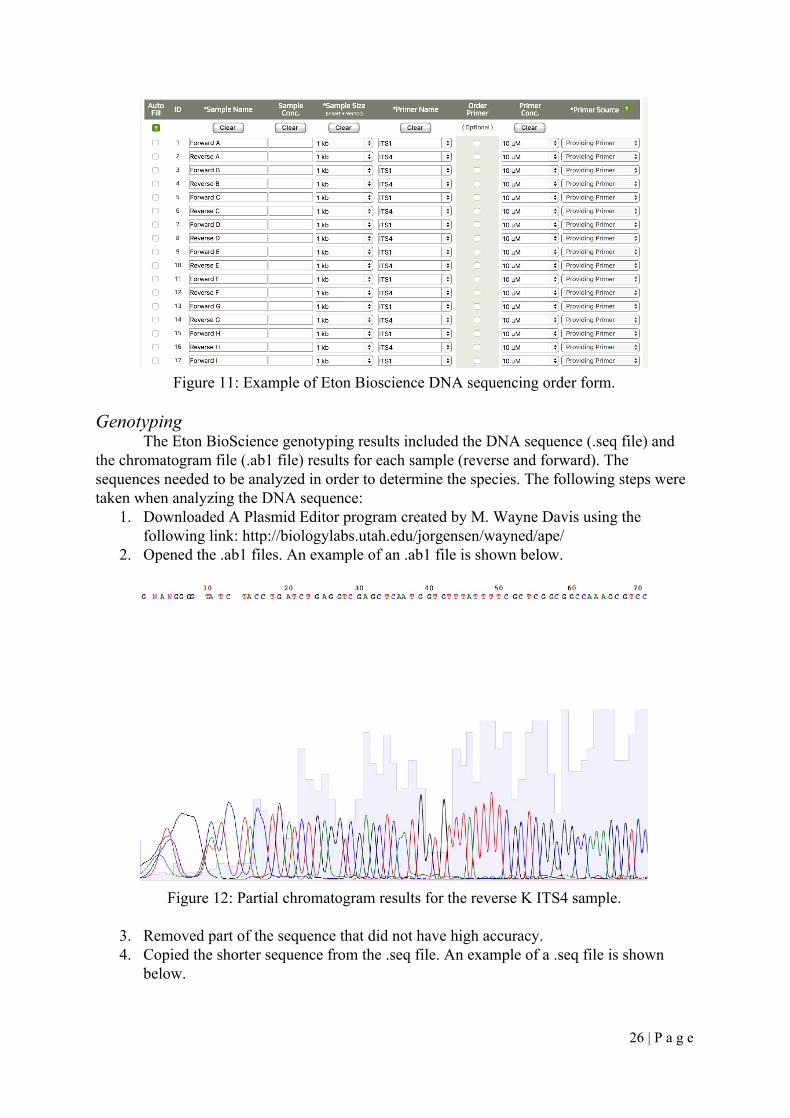
Figure 11: Example of Eton Bioscience DNA sequencing order form.
Genotyping
The Eton BioScience genotyping results included the DNA sequence (.seq file) and the chromatogram file (.ab1 file) results for each sample (reverse and forward). The sequences needed to be analyzed in order to determine the species. The following steps were taken when analyzing the DNA sequence:
1. Downloaded A Plasmid Editor program created by M. Wayne Davis using the following link: http://biologylabs.utah.edu/jorgensen/wayned/ape/
2. Opened the .ab1 files. An example of an .ab1 file is shown below.
Figure 12: Partial chromatogram results for the reverse K ITS4 sample.
3. Removed part of the sequence that did not have high accuracy. 4. Copied the shorter sequence from the .seq file. An example of a .seq file is shown
below.
26 | P a g e
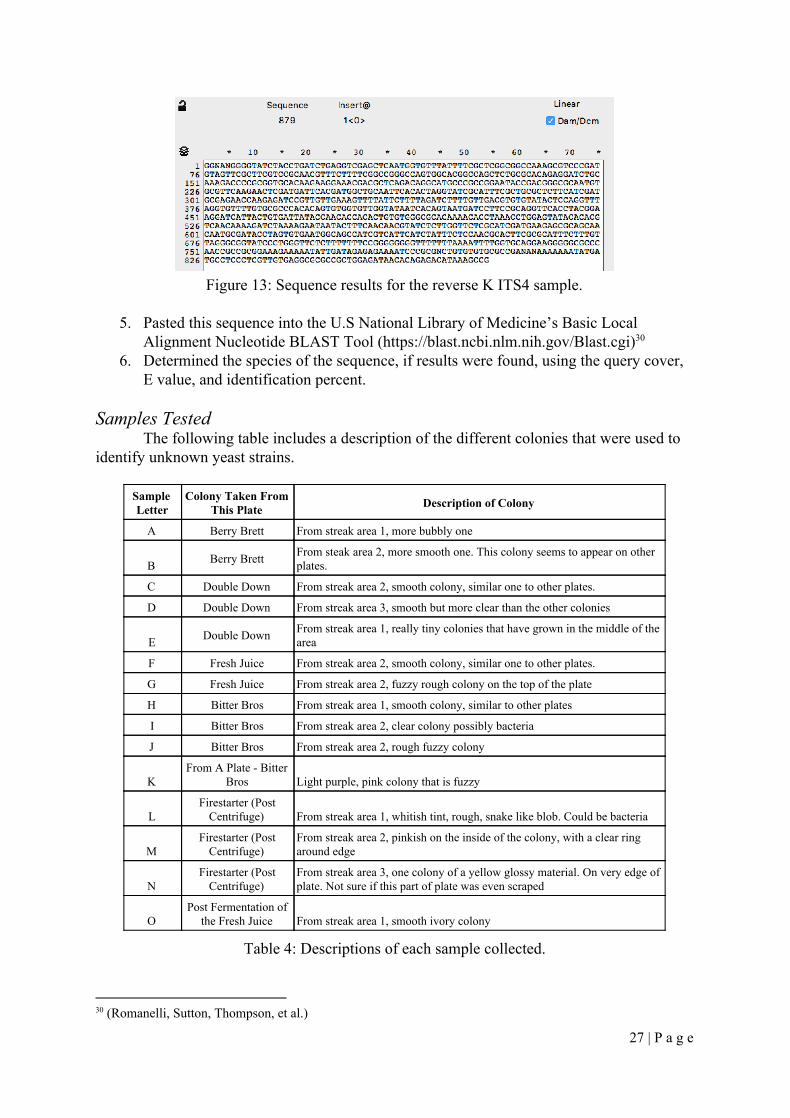
Figure 13: Sequence results for the reverse K ITS4 sample.
5. Pasted this sequence into the U.S National Library of Medicine’s Basic Local
Alignment Nucleotide BLAST Tool (https://blast.ncbi.nlm.nih.gov/Blast.cgi) 30
6. Determined the species of the sequence, if results were found, using the query cover, E value, and identification percent.
Samples Tested
The following table includes a description of the different colonies that were used to identify unknown yeast strains.
Sample Letter
Colony Taken From This Plate Description of Colony
A Berry Brett From streak area 1, more bubbly one
B Berry Brett From steak area 2, more smooth one. This colony seems to appear on other plates.
C Double Down From streak area 2, smooth colony, similar one to other plates.
D Double Down From streak area 3, smooth but more clear than the other colonies
E Double Down From streak area 1, really tiny colonies that have grown in the middle of the area
F Fresh Juice From streak area 2, smooth colony, similar one to other plates.
G Fresh Juice From streak area 2, fuzzy rough colony on the top of the plate
H Bitter Bros From streak area 1, smooth colony, similar to other plates
I Bitter Bros From streak area 2, clear colony possibly bacteria
J Bitter Bros From streak area 2, rough fuzzy colony
K From A Plate - Bitter
Bros Light purple, pink colony that is fuzzy
L Firestarter (Post
Centrifuge) From streak area 1, whitish tint, rough, snake like blob. Could be bacteria
M Firestarter (Post
Centrifuge) From streak area 2, pinkish on the inside of the colony, with a clear ring around edge
N Firestarter (Post
Centrifuge) From streak area 3, one colony of a yellow glossy material. On very edge of plate. Not sure if this part of plate was even scraped
O Post Fermentation of
the Fresh Juice From streak area 1, smooth ivory colony
Table 4: Descriptions of each sample collected.
30 (Romanelli, Sutton, Thompson, et al.)
27 | P a g e

RESULTS AND DISCUSSION 1. Turbidity Testing of Final Products
The results of the turbidity testing of the final cider products are summarized in the table below.
Final Products Description Turbidity (NTU)
Branch Breaker Ginger Gold 19.9
Original Press Jonagold, Honeycrisp, Mac, Cortland, and Rhode Island Greening 172
Northern Comfort Original Press base with cinnamon, allspice, clove, ginger, bitter orange peel 16.3
Hopshire Ginger gold base and Mac/Cortland dry hopped with Mosaic and Citra hops 285
Firestarter Mac/Cortland base infused with cinnamon, fresh habanero, and pomegranate juice 46.9
Cran Barrel Rhode Island Greening base with minor amounts of other apples and infused with cranberry concentrate and barrel aged 43.3
Double Down Various apple base, barrel-aged cider 309
Bitter Brothers Rhode Island Greening base, bourbon barrel-aged cider with
minor amounts of Mac, Cortland, Honeycrisp, Fuji, and Golden Russet apples.
267
Berry Brett
Jonagold, Fuji, and Honeycrisp base fermented with house yeast, then racked to barrels where blueberry concentrate and blackberry
puree were added and brettanomyces pitched, cider was then allowed to age for 3-4 months
121
Table 5: Turbidity of final product samples.
The turbidity of each of the final products is extremely varied. This is due to the composition of the different types of apples used to produce the cider, as well as the different additions like hops, cinnamon, juice concentrates and any other additives. North Country’s current system of determining when a final product is ready to be kegged or bottled is based upon flavor and desired visual clarity. Because the determined turbidites reflect the clarity of the product, a centrifuge with a turbidity meter can be used to produce products with these turbidites and thus the ideal clarity. For reference, water has a turbidity of 0.05-10 NTU while milk can reach turbidites over 4000 NTU. 31
2. Optimization of the Centrifuge: An Investigation The investigation of the centrifuge involved quantifying the amount of yeast and
determining the turbidity of samples from various batches run through the centrifuge at various flow rates. Centrifuges can perform differently depending on the type of apples used in the cider, amount of yeast originally present, presence of other particulates like cinnamon or hops, time in the run the sample is taken, and consistency of the inlet flow. In order to determine how the centrifuge could be optimized, the data collected were analyzed in four ways: yeast concentration compared to inlet flow rate, yeast concentration compared to
31 (Daly)
28 | P a g e

turbidity, turbidity compared to inlet flow rate, and centrifuge performance compared to the natural settling process. Table 6 below provides a summary of the data collected and Appendix II provides the full data tables used in the calculations.
Batch Number Apple Type Description of When Sample was
Taken (Pre/Post Centrifuge or GPM) Yeast Concentration
(g/gal) Turbidity
(NTU)
131 Ginger Gold
Pre Centrifuge 4.7751 -
Post Centrifuge 0.0728 236
152 Honeycrisp Pre Centrifuge 3.6984 -
Post Centrifuge 0.0275 241
154 Jonegold
Pre Centrifuge 3.0813 2338
2 0.0033 248
4.1 0.0056 309
4.2 0.0047 267
161 Honeycrisp 3.73 0.0992 121
4.58 0.0062 103
162 Honeycrisp 2.79 0.0659 62.6
5.8 0.209 45
164 Crabby Bastard
1.5 0.0337 677
3.07 0.0032 123
4.6 0.0025 204
6.93 0.0449 239
181 Honey Crisp
Pre Centrifuge 0.9778 224
1 0.0018 32.6
2 0.0015 72.5
3.06 0.0008 55
4.6 0.0026 66.7
Table 6: Concentration of yeast and turbidity of the samples taken from the centrifuge runs. Yeast Concentration vs. Flow Rate of Centrifuge
It was assumed that the GEA centrifuge would remove yeast in a parabolic way, with a minimum amount of yeast present for a certain volumetric flow rate in the run. Theoretically, when the centrifuge is running too slowly, the yeast cannot spin to the outside of the centrifuge, therefore they remain suspended in the solution. Additionally, as the centrifuge is running too quickly, there is not enough time spent in the centrifuge for the yeast to fully spin out. The results of the experimentation between yeast concentration and flow can be seen in Figure 14 below.
29 | P a g e
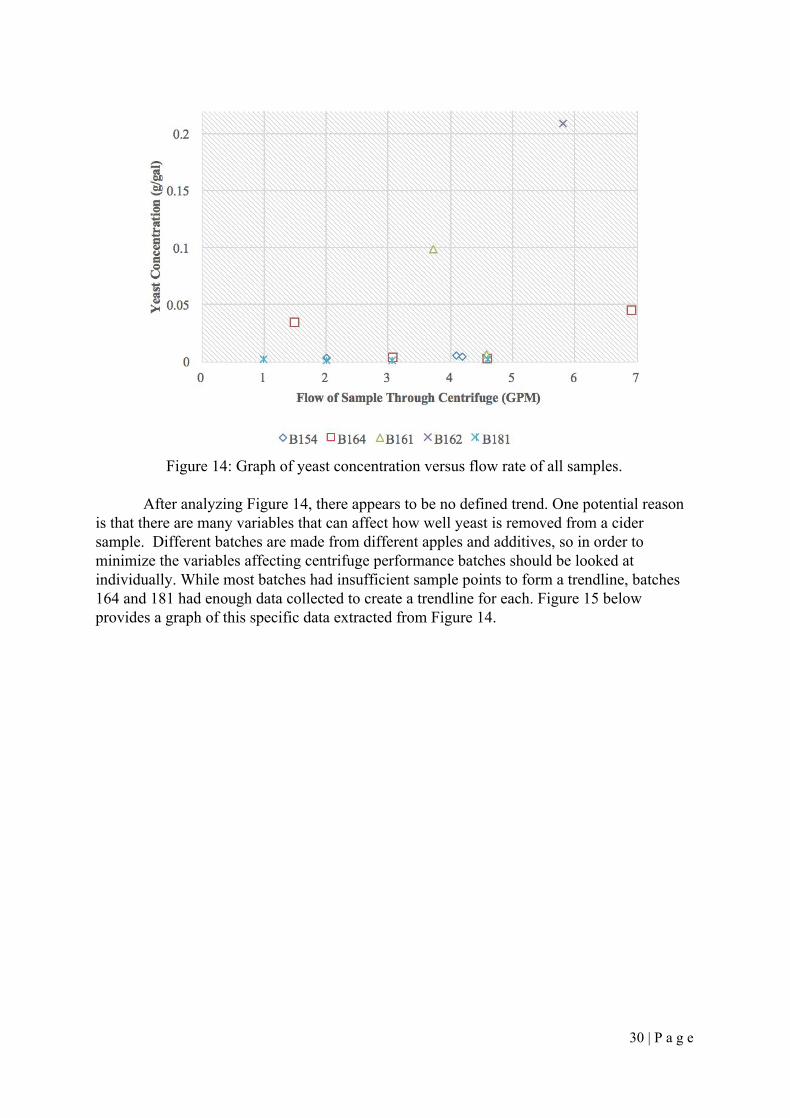
Figure 14: Graph of yeast concentration versus flow rate of all samples.
After analyzing Figure 14, there appears to be no defined trend. One potential reason
is that there are many variables that can affect how well yeast is removed from a cider sample. Different batches are made from different apples and additives, so in order to minimize the variables affecting centrifuge performance batches should be looked at individually. While most batches had insufficient sample points to form a trendline, batches 164 and 181 had enough data collected to create a trendline for each. Figure 15 below provides a graph of this specific data extracted from Figure 14.
30 | P a g e
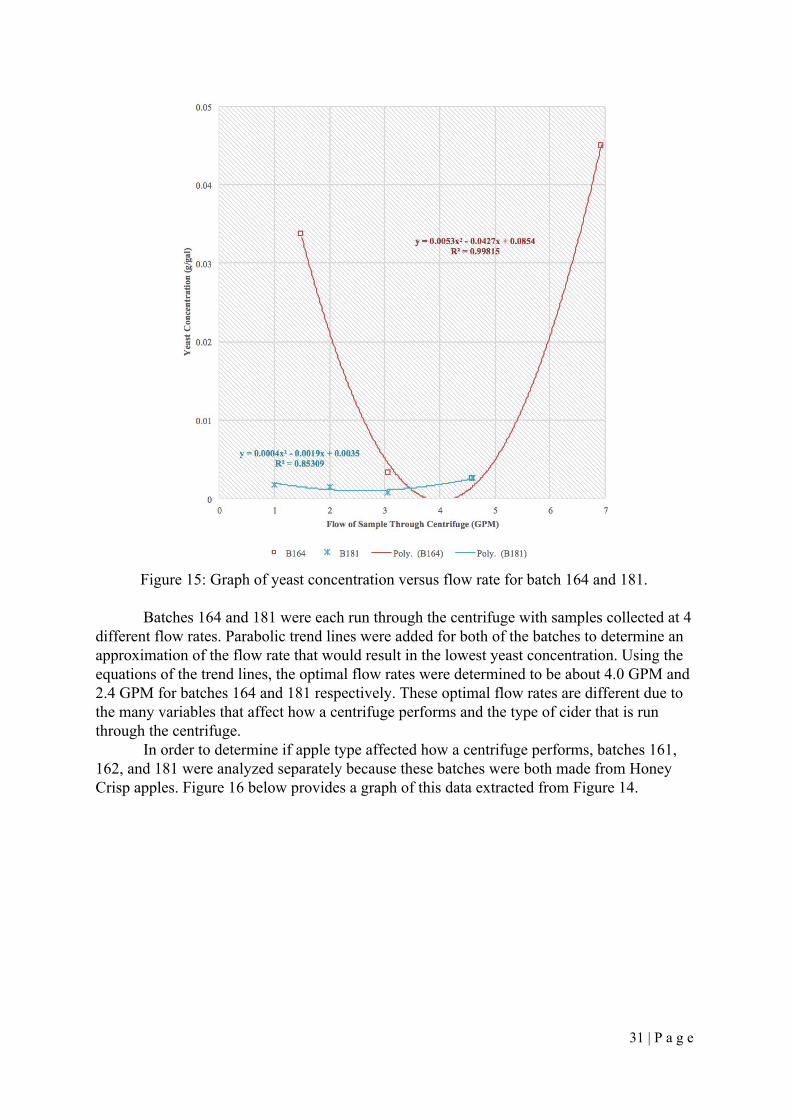
Figure 15: Graph of yeast concentration versus flow rate for batch 164 and 181.
Batches 164 and 181 were each run through the centrifuge with samples collected at 4
different flow rates. Parabolic trend lines were added for both of the batches to determine an approximation of the flow rate that would result in the lowest yeast concentration. Using the equations of the trend lines, the optimal flow rates were determined to be about 4.0 GPM and 2.4 GPM for batches 164 and 181 respectively. These optimal flow rates are different due to the many variables that affect how a centrifuge performs and the type of cider that is run through the centrifuge.
In order to determine if apple type affected how a centrifuge performs, batches 161, 162, and 181 were analyzed separately because these batches were both made from Honey Crisp apples. Figure 16 below provides a graph of this data extracted from Figure 14.
31 | P a g e
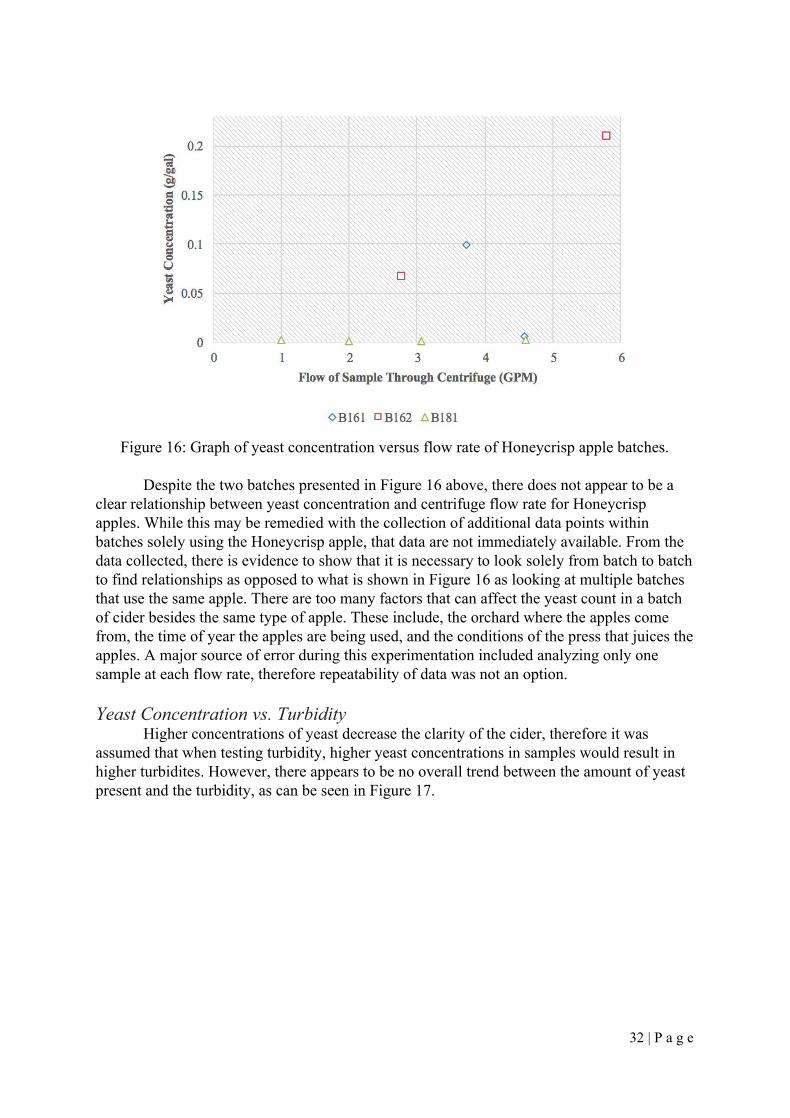
Figure 16: Graph of yeast concentration versus flow rate of Honeycrisp apple batches.
Despite the two batches presented in Figure 16 above, there does not appear to be a
clear relationship between yeast concentration and centrifuge flow rate for Honeycrisp apples. While this may be remedied with the collection of additional data points within batches solely using the Honeycrisp apple, that data are not immediately available. From the data collected, there is evidence to show that it is necessary to look solely from batch to batch to find relationships as opposed to what is shown in Figure 16 as looking at multiple batches that use the same apple. There are too many factors that can affect the yeast count in a batch of cider besides the same type of apple. These include, the orchard where the apples come from, the time of year the apples are being used, and the conditions of the press that juices the apples. A major source of error during this experimentation included analyzing only one sample at each flow rate, therefore repeatability of data was not an option. Yeast Concentration vs. Turbidity
Higher concentrations of yeast decrease the clarity of the cider, therefore it was assumed that when testing turbidity, higher yeast concentrations in samples would result in higher turbidites. However, there appears to be no overall trend between the amount of yeast present and the turbidity, as can be seen in Figure 17.
32 | P a g e
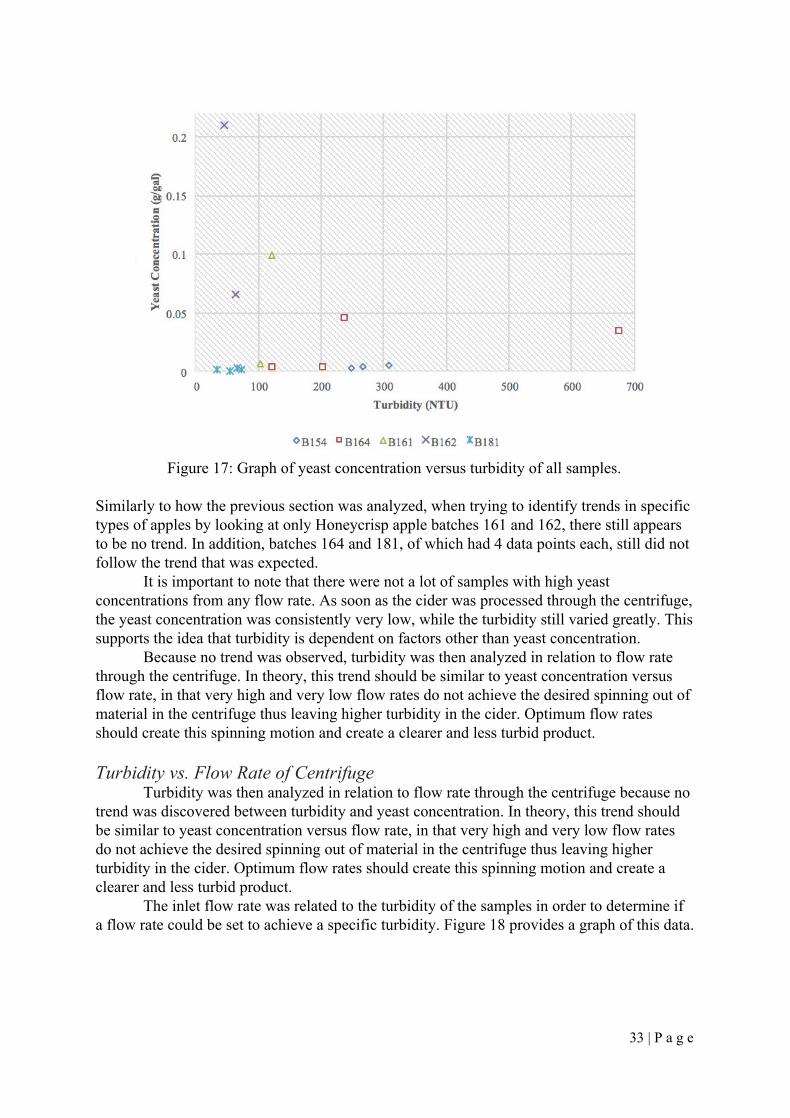
Figure 17: Graph of yeast concentration versus turbidity of all samples.
Similarly to how the previous section was analyzed, when trying to identify trends in specific types of apples by looking at only Honeycrisp apple batches 161 and 162, there still appears to be no trend. In addition, batches 164 and 181, of which had 4 data points each, still did not follow the trend that was expected.
It is important to note that there were not a lot of samples with high yeast concentrations from any flow rate. As soon as the cider was processed through the centrifuge, the yeast concentration was consistently very low, while the turbidity still varied greatly. This supports the idea that turbidity is dependent on factors other than yeast concentration.
Because no trend was observed, turbidity was then analyzed in relation to flow rate through the centrifuge. In theory, this trend should be similar to yeast concentration versus flow rate, in that very high and very low flow rates do not achieve the desired spinning out of material in the centrifuge thus leaving higher turbidity in the cider. Optimum flow rates should create this spinning motion and create a clearer and less turbid product. Turbidity vs. Flow Rate of Centrifuge
Turbidity was then analyzed in relation to flow rate through the centrifuge because no trend was discovered between turbidity and yeast concentration. In theory, this trend should be similar to yeast concentration versus flow rate, in that very high and very low flow rates do not achieve the desired spinning out of material in the centrifuge thus leaving higher turbidity in the cider. Optimum flow rates should create this spinning motion and create a clearer and less turbid product.
The inlet flow rate was related to the turbidity of the samples in order to determine if a flow rate could be set to achieve a specific turbidity. Figure 18 provides a graph of this data.
33 | P a g e
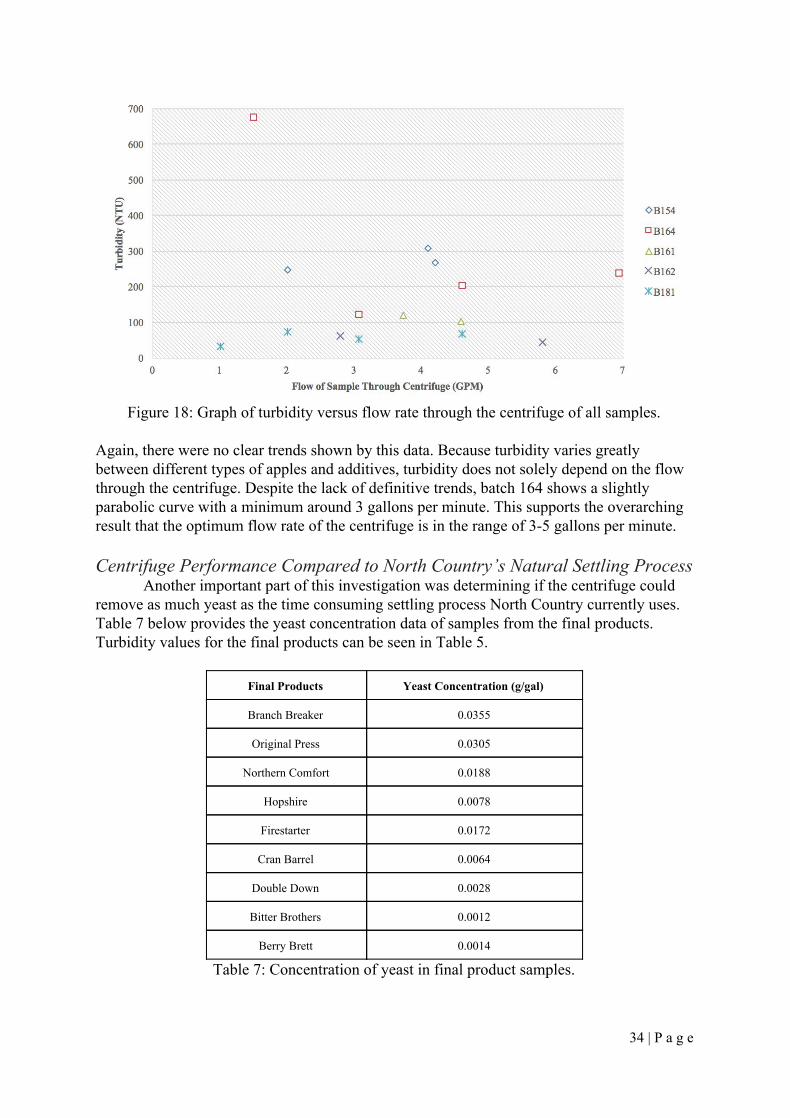
Figure 18: Graph of turbidity versus flow rate through the centrifuge of all samples.
Again, there were no clear trends shown by this data. Because turbidity varies greatly between different types of apples and additives, turbidity does not solely depend on the flow through the centrifuge. Despite the lack of definitive trends, batch 164 shows a slightly parabolic curve with a minimum around 3 gallons per minute. This supports the overarching result that the optimum flow rate of the centrifuge is in the range of 3-5 gallons per minute. Centrifuge Performance Compared to North Country’s Natural Settling Process
Another important part of this investigation was determining if the centrifuge could remove as much yeast as the time consuming settling process North Country currently uses. Table 7 below provides the yeast concentration data of samples from the final products. Turbidity values for the final products can be seen in Table 5.
Final Products Yeast Concentration (g/gal)
Branch Breaker 0.0355
Original Press 0.0305
Northern Comfort 0.0188
Hopshire 0.0078
Firestarter 0.0172
Cran Barrel 0.0064
Double Down 0.0028
Bitter Brothers 0.0012
Berry Brett 0.0014
Table 7: Concentration of yeast in final product samples.
34 | P a g e
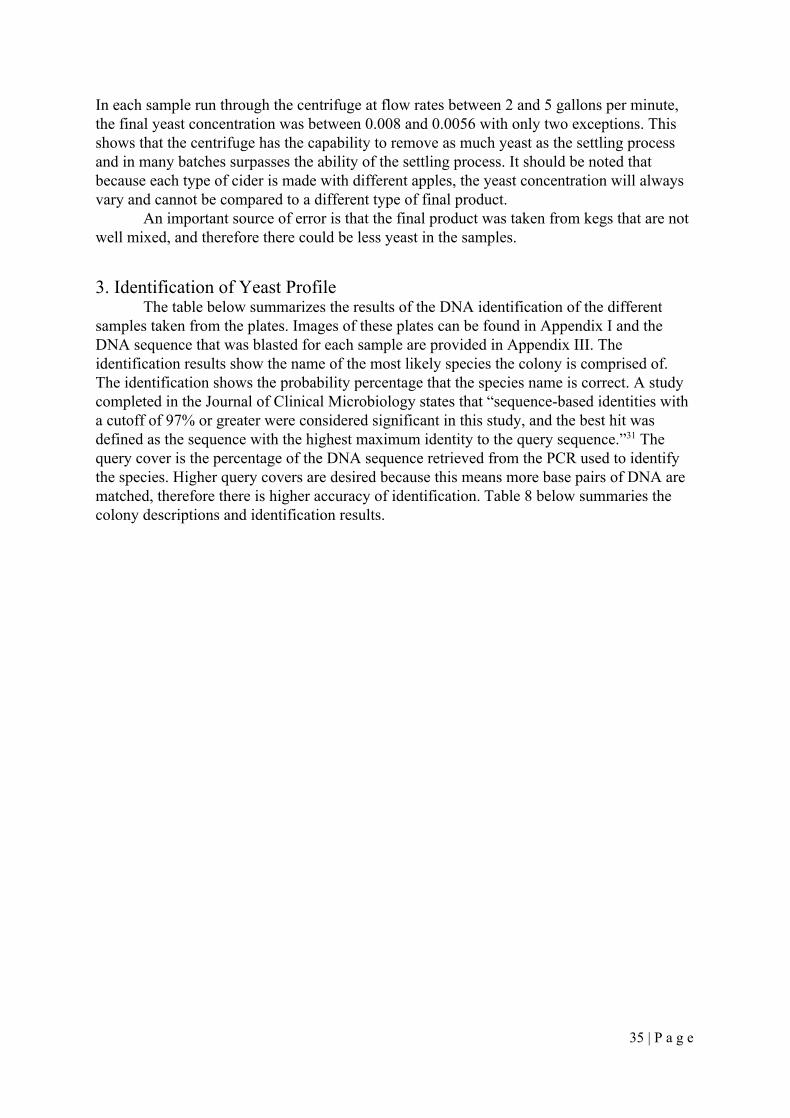
In each sample run through the centrifuge at flow rates between 2 and 5 gallons per minute, the final yeast concentration was between 0.008 and 0.0056 with only two exceptions. This shows that the centrifuge has the capability to remove as much yeast as the settling process and in many batches surpasses the ability of the settling process. It should be noted that because each type of cider is made with different apples, the yeast concentration will always vary and cannot be compared to a different type of final product.
An important source of error is that the final product was taken from kegs that are not well mixed, and therefore there could be less yeast in the samples. 3. Identification of Yeast Profile
The table below summarizes the results of the DNA identification of the different samples taken from the plates. Images of these plates can be found in Appendix I and the DNA sequence that was blasted for each sample are provided in Appendix III. The identification results show the name of the most likely species the colony is comprised of. The identification shows the probability percentage that the species name is correct. A study completed in the Journal of Clinical Microbiology states that “sequence-based identities with a cutoff of 97% or greater were considered significant in this study, and the best hit was defined as the sequence with the highest maximum identity to the query sequence.”31 The query cover is the percentage of the DNA sequence retrieved from the PCR used to identify the species. Higher query covers are desired because this means more base pairs of DNA are matched, therefore there is higher accuracy of identification. Table 8 below summaries the colony descriptions and identification results.
35 | P a g e
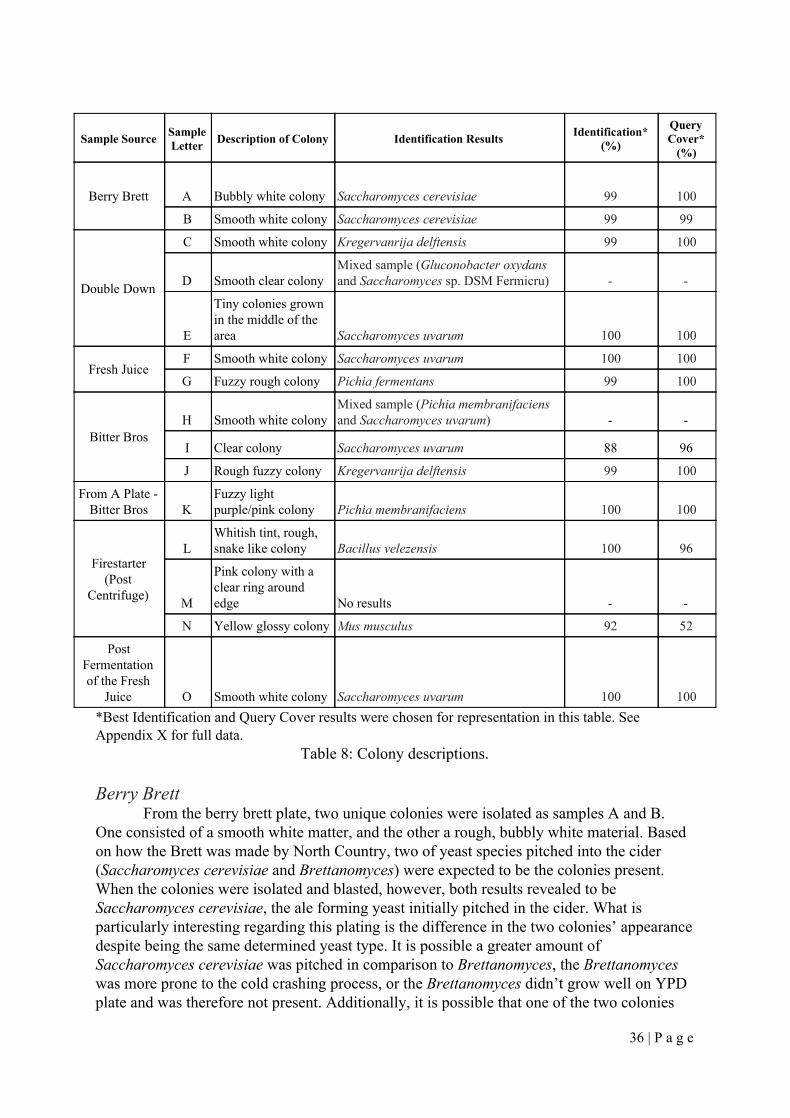
Sample Source Sample Letter Description of Colony Identification Results Identification*
(%)
Query Cover*
(%)
Berry Brett A Bubbly white colony Saccharomyces cerevisiae 99 100
B Smooth white colony Saccharomyces cerevisiae 99 99
Double Down
C Smooth white colony Kregervanrija delftensis 99 100
D Smooth clear colony Mixed sample (Gluconobacter oxydans and Saccharomyces sp. DSM Fermicru) - -
E
Tiny colonies grown in the middle of the area Saccharomyces uvarum 100 100
Fresh Juice F Smooth white colony Saccharomyces uvarum 100 100
G Fuzzy rough colony Pichia fermentans 99 100
Bitter Bros H Smooth white colony
Mixed sample (Pichia membranifaciens and Saccharomyces uvarum) - -
I Clear colony Saccharomyces uvarum 88 96
J Rough fuzzy colony Kregervanrija delftensis 99 100
From A Plate - Bitter Bros K
Fuzzy light purple/pink colony Pichia membranifaciens 100 100
Firestarter (Post
Centrifuge)
L Whitish tint, rough, snake like colony Bacillus velezensis 100 96
M
Pink colony with a clear ring around edge No results - -
N Yellow glossy colony Mus musculus 92 52
Post Fermentation of the Fresh
Juice O Smooth white colony Saccharomyces uvarum 100 100 *Best Identification and Query Cover results were chosen for representation in this table. See Appendix X for full data.
Table 8: Colony descriptions. Berry Brett
From the berry brett plate, two unique colonies were isolated as samples A and B. One consisted of a smooth white matter, and the other a rough, bubbly white material. Based on how the Brett was made by North Country, two of yeast species pitched into the cider (Saccharomyces cerevisiae and Brettanomyces) were expected to be the colonies present. When the colonies were isolated and blasted, however, both results revealed to be Saccharomyces cerevisiae, the ale forming yeast initially pitched in the cider. What is particularly interesting regarding this plating is the difference in the two colonies’ appearance despite being the same determined yeast type. It is possible a greater amount of Saccharomyces cerevisiae was pitched in comparison to Brettanomyces, the Brettanomyces was more prone to the cold crashing process, or the Brettanomyces didn’t grow well on YPD plate and was therefore not present. Additionally, it is possible that one of the two colonies
36 | P a g e
was a mixed colony of yeast, with Brettanomyces being the other yeast, that couldn’t be identified. This possibility is supported by the reverse sequence of DNA in Berry Brett’s A sample (the bubbly rough colony) returned no match, while the forward sequence of the same sample had a 100% match to Saccharomyces cerevisiae. This may indicate several things, including but not limited to the presence of another yeast type in the sample taken from the colony, a failed PCR process in reproducing the DNA, error with DNA isolation or sequencing steps, or the presence of a microbe that was incompatible with the sequence primers we chose. Double Down
The Double Down sample grew three identifiable species on the plate, which were removed from the plate as samples C, D, and E. Sample C was a smooth white colony, which was identified as the yeast Kregervanrija delftensis. The information that is available about Kregervanrija delftensis includes weak fermentation performance, origin from the skin of fruits, being a spoilage organism in beverages, and ceasing to grow below 37℃. Sample D 32
consisted of smooth, semi-transparent, cells. The blast results of the isolated DNA resulted in a mixed colony of Gluconobacter oxydans, a spoilage bacteria that forms acetic acid , and a 33
unique wine yeast known as Saccharomyces DSM fermicru. This wine yeast was identified at a 96% identification, 1% under the recommended percentage, but shows some interesting traits. The yeast is a variation on Saccharomyces cerevisiae, ferments ideally between 15 - 25℃, and has a high alcohol tolerance of up to 15.5%. Lastly, sample E isolated from 34
Double Down was identified as Saccharomyces uvarum. This yeast is a lager yeast, and is suspected to be the main form of wild yeast in North Country’s product, given its prevalence in many other ciders tested. Saccharomyces uvarum is known as a “cryotolerant” strain of yeast, meaning it is relatively unaffected by a decrease in temperature. In comparison to 35
North Country’s main yeast, Saccharomyces cerivisiae, Saccharomyces uvarum becomes more competitive as the temperature of the batch drops, since it doesn’t cease fermentation and flocculate like cerevisiae. While the uvarum species has weaker fermentation, it will still continue to consume sugars after the cider is crashed and racked. Bitter Bros
This cider grew three identifiable species on the plate, which were removed from the plate as samples H, I, and J. Samples I and J were identified as Saccharomyces uvarum and Kregervanrija delftensis respectively. These species were found in the similar barrel-aged Double Down cider, and thus this identification may reveal that the barrels contain these wild yeast species and provide unique flavors to the final products. The yeast species Kregervanrija delftensis appears to be uniquely found in barrel aged ciders, as can be seen by its presence in Double Down and Bitter Bros. In addition, sample H was also identified as a mix of the aforementioned Saccharomyces uvarum with a unique yeast, Pichia membranifaciens. The colony taken for sample H showed a distinct pink color in its cells. When isolated and grown on a separate plate, the pink cells were identified again as Pichia membranifaciens. This particular yeast is a spoilage organism that produces several acids and is commonly found on the surface of wines. 36
32 (Fell, Kurtzman, & Boekhout) 33 (Hardy Diagnostics) 34 (DSM Food Specialties) 35 (López-Malo, Querol, & Guillamon) 36 (JGI Fungal Genomics Resource)
37 | P a g e
Firestarter
The firestarter cider grew three unique species when plated and were isolated as samples L, M, and N. Sample L was a rough, snake-like colony and was identified as a bacteria called Bacillus velezensis The characteristics of this bacteria “include methanol utilization, plant-growth promotion, biocontrol of phytopathogens, and induced systemic resistance of the host.” However, this identification was only at a 28% query cover, meaning 37
the result is not reliable. The ITS1 region is not a DNA region present in bacteria, and therefore the PCR could not have amplified it. It is possible that different region of DNA was amplified which returned this sequencing identification, but the result cannot be deemed accurate because of bacteria’s lack of the correct region. Sample M was found to be unidentifiable. Again because the primers are specific to yeast, they were not able to identify this species however it is most likely a bacteria or other type of organism based on the colony’s appearance. Sample N was only able to be identified with a query cover of 52% and the identification of 92%, which is extremely unreliable. While it was identified as Mus musculus, which is common house mouse DNA, this identification is most likely incorrect because of the extremely poor query cover and low identification percent. Fresh Juice
The fresh juice contained two different types of yeasts. The samples were taken as F and G. Sample F was identified as another Saccharomyces uvarum colony. Sample G was found to be Pichia fermentans, which is a yeast found on different parts of the human body and the environment including in soil, leaves, and fruit. Like most other yeasts, Pichia 38
fermentans ferments mainly glucose and is best grown in temperatures of 37℃. This information is extremely valuable because it confirms that there are wild yeasts present on the fresh apples, or that wild yeast strains are being picked up in the juicing facilities.
Post Centrifuge Fresh Juice
The fresh juice sample was plated after the fermentation and centrifuge processes were complete in order to determine if any of the naturally occurring yeasts remained after these steps. Only one type of species was presumed to grow on this plate, and a colony was removed as sample O. This sample’s DNA was determined to be be Saccharomyces uvarum. This indicates that while the other types of wild yeasts are most likely outcompeted during fermentation or are more easily centrifuged out, the Saccharomyces uvarum withstands the fermentation and does not fully leave the cider even with the use of a centrifuge. General Discussion
The “Chico” yeast that is pitched into most of the North Country ciders is known as Saccharomyces cerevisiae (an information pamphlet on this species is shown in Appendix IV). It would be expected that Saccharomyces cerevisiae would be found in most, if not all, cider samples tested, but it was only found in the Berry Brett sample. This unexpected result could be due to the fact that both Saccharomyces cerevisiae and Saccharomyces uvarum had similar growth characteristics on the YPD plate. It was difficult to differentiate and isolate one species from another species, meaning that in a sample where Saccharomyces uvarum was found, it was possible that Saccharomyces cerevisiae was also present and not isolated
37 (Cai, Kang, Xi, et al. ) 38 (GCM)
38 | P a g e
for amplification. Another likely reason why samples did not return Saccharomyces cerevisiae could be due to the North Country yeast cold crashing process. The process that the North Country team uses to stop fermentation is specifically designed to remove and kill the Chico yeast pitched for fermentation. Other species of yeast that may be more resilient to colder temperatures are not targeted by this crashing. For example, Saccharomyces uvarum is a traditional yeast used to produce lagers and is better adapted to survive colder temperatures, allowing it to survive after the cold crash. Both cerevisiae and uvarum are the same yeast genus, Saccharomyces, and thus the different cells could undergo a process known as hybridization where they can reproduce together and only be identified as a single species, Saccharomyces uvarum.
Similar to the Berry Brett cider, which uses a special type of yeast known as Brettanomyces, the yeast identification did not return any results that showed this Brettanomyces in this cider. This yeast is pitched once the cider is barreled, after it has already undergone the normal North Country fermentation process. While some of the same theories about why Saccharomyces cerevisiae was not found in most of the ciders, it is also possible that the Brettanomyces yeast dies off naturally during the aging process of this particular cider or even that it is an easier yeast to settle out.
Within the five final product ciders and one fresh juice sample there were several different species of yeast and bacteria found. This raises the question about where these yeast species come from. Saccharomyces uvarum and Pichia fermentans were both found in the fresh juice, and these species were identified in the final product cider as well. These strains may survive the fermentation process without being outcompeted and are able to survive the cold crashing process. Although there were only two species identified in fresh juice sample, it is possible that different batches of juice could contain other yeast and bacteria species, especially if apples are in a cold storage facilities and exposed to various different organisms as they sit. The other yeast strains found in the products could be due to contaminants in the environment around the North Country facility or in the different brewing equipment. For example, Kregervanrija delftensis yeast was found in two different products, Double Down and Bitter Bros, both of which are special barrel aged products. Although it was not identified in the third barrel aged product, Berry Brett, it is possible that this yeast could live in the barrels used or be picked up from the environment while being transferred to barrels or the location of the aging.
In addition, the Firestarter cider returned unexpected results, with not a single species of yeast identified. From the beginning growth on the YPD plate, the Firestarter sample had unique characteristics when compared with the yeast growing on the other plates. Although it could not be definitively concluded within the scope of this project, the uniqueness of this sample presume that likely a different species of bacteria, and not yeast, is present.
39 | P a g e

CONCLUSION AND RECOMMENDATIONS
All of the the information collected in this project can be used in recommendations for North Country Hard Cider and expanded upon for future investigations. The experimentation conducted revealed distinctive results, but there are still many questions and concepts left for further examination. Turbidity
When North Country integrates a turbidity driven centrifuge in their process, it is recommended that further experimentation is done to determine the ideal turbidity that will produce the desired flavors and clarity of each type of cider. The degree of accuracy between a new centrifuge and the test centrifuge used in this project could vary, and therefore the turbidity results found through this project should be taken as a reference and not as fact. It is also recommended that when aiming for a specific turbidity with a turbidity driven centrifuge, the meter is set below the desired turbidity and tested periodically for taste. If the meter is set immediately to the required turbidity, there is a risk that flavor will be lost before this turbidity is reached based upon varied characteristics of different batches. Centrifuge
Quantifying the number of yeast cells in the different final product samples helped to confirm that the crashing and racking process was effective at removing most of yeast from the cider. Yeast quantification with the non-final product samples, particularly with regards to samples taken before, during, and after running the centrifuge, were rather inconclusive. One of the major reasons for this is a lack of data. The concept of counting yeast during the centrifuge process was intended to develop a profile of how much yeast is spun out of the cider at different speeds (in gallons per minute of feed into the centrifuge). As more samples are taken for varying centrifuge speed, the results will become more definitive. One reason for the lack of data lies in the difficulty involved in collecting and transporting samples to the lab space. This limited the number of samples that could be counted in the hemocytometer. Furthermore, the centrifuge is a new addition to North Country, therefore there may be some inconsistencies in how the samples were collected due to the process of learning how to use the device. This may have skewed the data, as there is potential that the samples were collected differently. Due to these difficulties, strong conclusions could not be drawn as to what centrifuge speed removes the most yeast for the fastest rate of feed to the centrifuge. Organism Identification
The yeast identification and profile experimentation yielded definitive results for several of the products. However, in the process of identifying yeast, samples that were potentially bacteria were also discovered. Based on budgetary and time constraints, only a limited number of DNA samples could be sequenced for the various species of yeast. There is room for more extensive research on yeast present in other types of cider as well as research into different bacterium present. This experiment was also limited to identifying different yeast strains but not the exploration of effects of the different species, whether positive or negative. It is recommended that North Country conducts experiments or projects focused solely on organism identification and then later look at what the possible effects different organisms have on their products.
40 | P a g e
WORKS CITED Alberti, A., Vieira, R. G., Drilleau, J. F., Wosiacki, G., & Nogueira, A. Apple Wine
Processing with Different Nitrogen Contents. Brazilian Archives of Biology and Technology, 54(3), (2011): 551-558. doi:10.1590/S1516-89132011000300017
Bisson, Linda. “Section 3 - The Alcoholic Fermentation.” University of California at Davis,
2011. Retrieved from http://lfbisson.ucdavis.edu/PDF/VEN124%20Section%203.pdf Cai, X., Kang, X., Xi, H., Liu, C., & Xue, Y. “Complete Genome Sequence of the
Endophytic Biocontrol Strain Bacillus Velezensis CC09.” Genome Announcements, 4(5), (2016): e01048-16.
Catalano, S., Palazzolo, J., Robertson, M., et al. “Encyclopedia of Chemical Engineering
Equipment: Centrifuges.” University of Michigan, 2016. Retrieved from http://encyclopedia.che.engin.umich.edu/Pages/SeparationsMechanical/Centrifuges/Centrifuges.html
Colby, Chris. “Cold Weather Fermentation Tips.” [Beer & Wine Journal], November 2013.
Retrieved from http://beerandwinejournal.com/cold-tips/ Daly, John. “Setting the Standard for Automation: What is Turbidity?” International Society
of Automation (ISA), South Fork Instruments, Inc, 2007. Retreived from http://www.isanorcal.org/download/tech2007_presentations/turbidity.pdf
Dekramer, Rebekka Swanson. Cider Handbook 2014-2015. Scott Laboratories, 2014.
Retrieved from http://www.scottlab.com/pdf/2014CiderHandbook.pdf Dixon R.. Personal Correspondence. North Country Hard Cider, September 2016. DSM Food Specialties. “Fermicru 4F9 - Wine Yeast.” DSM Food Specialties, June 2006.
Retrieved from http://www.pros.co.nz/PDF/PDS/FERMICRU%204F9%20Tech%20Sheet%2006-06.pdf
Encyclopædia Britannica. “Fermentation.” Encyclopædia Britannica, 2015. Retrieved from
https://www.britannica.com/science/fermentation Fell, J. W., Kurtzman, C. P., & Boekhout, T. The Yeasts: A Taxonomic Study. Elsevier B.V.:
vol. 1, 5th Ed, (2011). Fermentis. “Safale US-05.” S.LLesaffre, n.d.. Retrieved from
http://www.fermentis.com/wp-content/uploads/2012/02/SFA_US05.pdf Global Catalogue of Microorganisms (GCM). “Pichia Fermantans.” GCM, n.d. Retrieved
from: http://gcm.wfcc.info/speciesPage.jsp?strain_name=Pichia%20fermentans
41 | P a g e
Gomes, Eliane A., Maria Catarina M. Kasuya, Everaldo G. de Barros, Arnaldo C. Borges & Elza F. Araújo. “Polymorphism in the Internal Transcribed Apacer (ITS) of the Ribosomal DNA of 26 Isolates of Ectomycorrhizal Fungi.” Genet. Mol. Biol. vol.25 no.4 São Paulo: (2002).
Grigoryev, Yevgeniy. “Cell Counting with a Hemocytometer: Easy as 1, 2, 3.” BitesizeBio,
December 2014. Retrieved from http://bitesizebio.com/13687/cell-counting-with-a-hemocytometer-easy-as-1-2-3/
Hardy Diagnostics. “Gluconobacter.” Hardy Diagnostics - Product Catalog, n.d.. Retrieved
from https://catalog.hardydiagnostics.com/cp_prod/Content/hugo/Gluconobacter.htm Helmenstine, Anne. “What is Fermentation?” About Education, 2016. Retrieved from
http://chemistry.about.com/od/lecturenoteslab1/f/What-Is-Fermentation.htm JGI Fungal Genomics Resource. “Pichia Membranifaciens.” JGI Fungal Portal , n.d..
Retrieved from http://genome.jgi.doe.gov/Picme1/Picme1.home.html Kelkar, S., & Dolan, K. Modeling the Effects of Initial Nitrogen Content and Temperature on
Fermentation Kinetics of Hard Cider.” Journal of Food Engineering, 109(3), (2012): 588. doi:10.1016/j.jfoodeng.2011.10.020
Khan Academy. “Fermentation and Anaerobic Respiration.” Khan Academy, n.d.. Retrieved
from https://www.khanacademy.org/science/biology/cellular-respiration-and-fermentation/variations-on-cellular-respiration/a/fermentation-and-anaerobic-respiration
Lea, A. “Sulphur Dioxide - The Cider Maker’s Friend.” [The Cider Workshop], July 7, 2011.
Retrieved from http://www.cider.org.uk/sulphite.html López-Malo, M., Querol, A., & Guillamon, J. M. “Metabolomic Comparison of
Saccharomyces Cerevisiae and the Cryotolerant Species S. Bayanus Var. Uvarum and S. Kudriavzevii During Wine Fermentation at Low Temperature.” PLOS ONE, 2013. Retrieved from http://journals.plos.org/plosone/article?id=10.1371%2Fjournal.pone.0060135#s4
National Human Genome Research Institute. “Polymerase Chain Reaction (PCR) Fact
Sheet.” National Human Genome Research Institute, n.d.. Retrieved from https://www.genome.gov/10000207/polymerase-chain-reaction-pcr-fact-sheet/
New England BioLaboratories. “Protocol for OneTaq® 2X Master Mix with Standard Buffer
(M0482).” New England BioLaboratories, 2016. Retreived from https://www.neb.com/protocols/2012/09/06/protocol-for-onetaq-2x-master-mix-with-standard-buffer-m0482
New England BioLaboratories. “Tm Calculator.” NEBtools, 2016. Retrieved from
http://tmcalculator.neb.com/#!/
42 | P a g e

Nexcelom Bioscience. “Yeast Concentration & Viability.” Nexcelom Bioscience, n.d.. Retrieved from http://www.nexcelom.com/Applications/Yeast-Viability.html#feature1b
Nobel Prize Organization. “All Nobel Prizes.” Nobel Prize Organization, n.d.. Retrieved from
https://www.nobelprize.org/nobel_prizes/lists/all/ Promega. “Wizard® Genomic DNA Purification Kit Technical Manual. Promega
Corporation.” Promega, 2014. Retrieved from http://www.promega.com/resources/protocols/technical-manuals/0/wizard-genomic-dna-purification-kit-protocol/
Romanelli, Anna M., Deanna A. Sutton, Elizabeth H. Thompson, Michael G. Rinaldi, &
Brian L. Wickes. “Sequence-Based Identification of Filamentous Basidiomycetous Fungi from Clinical Specimens: A Cautionary Note.” Journal of Clinical Microbiology 48 (3), (2010): 741-52.
Soares, E. V. “Flocculation in Saccharomyces Cerevisiae: A Review.” Journal of Applied
Microbiology, 110(1), (2011): 1-18. doi:10.1111/j.1365-2672.2010.04897.x Sigma Aldrich. “Introduction to Yeast Media.” Sigma Aldrich, n.d.. Retrieved from
http://www.sigmaaldrich.com/technical-documents/articles/biology/Introduction-yeast-media.html
Sigma Aldrich. “Yeast Growth Protocols.” Sigma Aldrich, n.d.. Retrieved from
http://www.sigmaaldrich.com/technical-documents/protocols/biology/yeast-growth-protocols.html
Swanson, H. A. & Baldwin, H. L.. “A primer on Water Quality: Turbidity.” United States
Geological Survey, December 2016. Retrieved from http://water.usgs.gov/edu/turbidity.html
Thomson, K., Bhat, A., & Carvell, J. “Comparison of a New Digital Imaging Technique for
Yeast Cell Counting and Viability Assessments with Traditional Methods.” Journal of the Institute of Brewing, 121(2), (2015): 231-237. doi:10.1002/jib.224
Tran, Lina Student author -- CM, Johnston, Paul Wei Student author -- CM, Gonzalez, Daniel
Student author -- CM, Collins, Joseph Heath Student author -- CM, Kmiotek, Stephen James Faculty advisor -- CM, & Wobbe, Clarence Richard Faculty advisor -- CH. Improvement of hard cider production. Worcester, MA: Worcester Polytechnic Institute, (2015).
University of Utah. ”Making Agar Plates”. University of Utah: Health Sciences - Genetics
Learning Center, n.d.. Retrieved from http://teach.genetics.utah.edu/content/microbiology/plates/
43 | P a g e
Verstrepen, K. J., Derdelinckx, G., Verachtert, H., & Delvaux, F. R. “Yeast Flocculation: What Brewers Should Know.” Applied Microbiology and Biotechnology, 61(3), (2003): 197-205. doi:10.1007/s00253-002-1200-8
Virtual Amrite Laboratories Universalizing Education (VALUE). “Streak Plate Method.”
Amrite Vishwa Vidyapeetham University - Ministry of Human Resources Department, 2017. Retrieved from http://vlab.amrita.edu/?sub=3&brch=73&sim=213&cnt=2
Wang, Huxuan, Zhongqiu Hu, Fangyu Long, Chen Niu, Yahong Yuan, & Tianli Yue.
“Characterization of Osmotolerant Yeasts and Yeast-like Molds from Apple Orchards and Apple Juice Processing Plants in China and Investigation of Their Spoilage Potential.” Journal of Food Science, vol. 80 (8), (2015): M1850-60
44 | P a g e

APPENDIX APPENDIX I - Example Calculations for Quantifying Yeast in the Standard and Cider Samples. Standard Sample Amount of US Chico Yeast = 0.0025 g Volume of DI Water = 50 mL Concentration (g/mL) = 0.0025 g/ 50 mL = 0.00005 g/mL
= 0.00005 g/mL * (3785.41 mL/gallon) = 0.18927 g/gal Cells per Quadrant Counted = 116.5625 Concentration (yeast cells/mL) = 116.5625/0.0001 mL = 1165625 yeast/mL Branch Breaker (Final Product) Cells per Quadrant Counted = 21.875 Volume of Quadrant = 0.0001 mL Concentration (yeast cells/mL) = 21.875/0.0001 mL = 218750 yeast/mL Concentration (g/mL) = [(218750 yeast/mL) / (1165625 yeast/mL)] * 0.00005 g/mL = 0.000009383 g/mL Concentration (g/gal) = 0.000009383 g/mL * (3785.41 mL/gallon)= 0.03552 g/gal
45 | P a g e

APPENDIX II - Yeast Concentration Data Tables
46 | P a g e
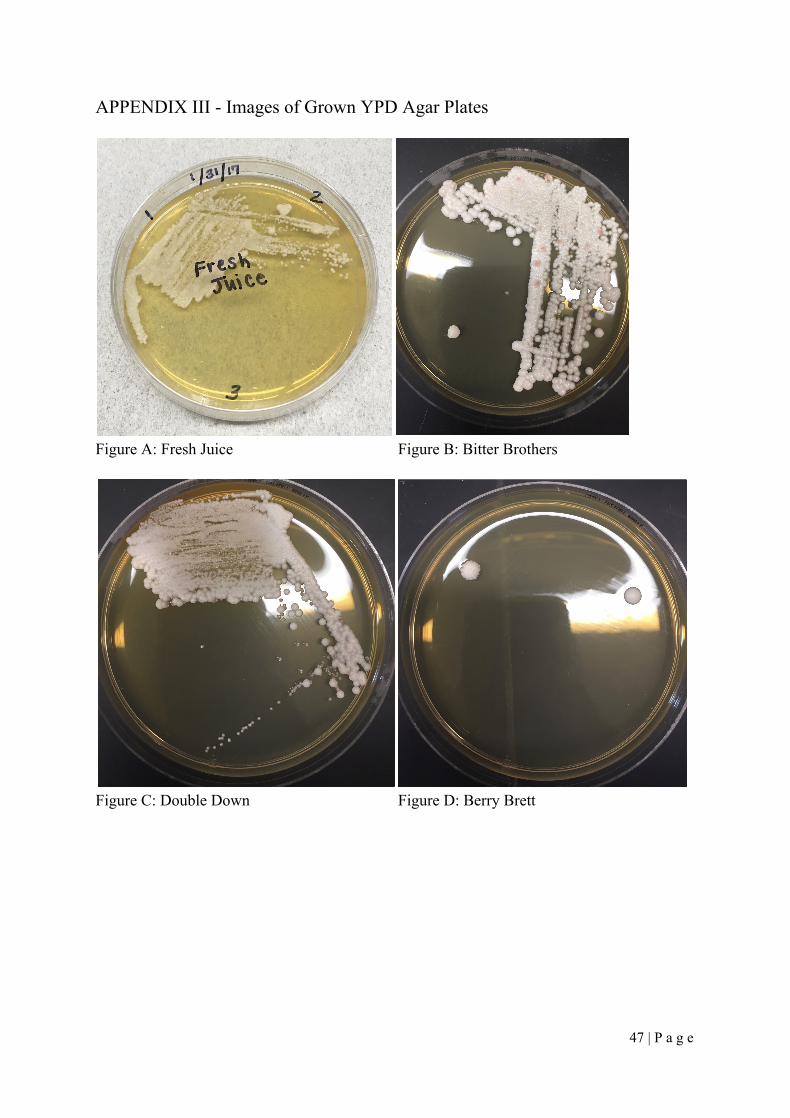
APPENDIX III - Images of Grown YPD Agar Plates
Figure A: Fresh Juice Figure B: Bitter Brothers
Figure C: Double Down Figure D: Berry Brett
47 | P a g e
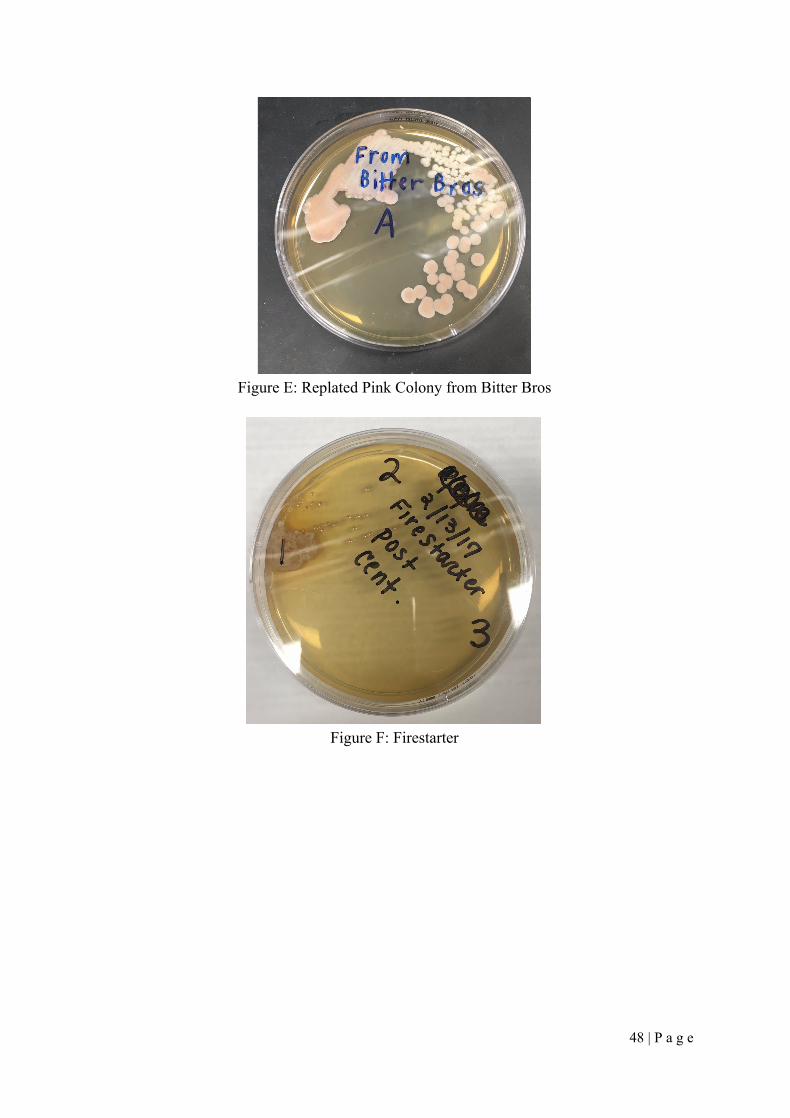
Figure E: Replated Pink Colony from Bitter Bros
Figure F: Firestarter
48 | P a g e
APPENDIX IV - Full Sequenced Results Forward A TTTTTTGTTTTGGCAAGAGCATGAGAGCTTTTACTGGGCAAGAAGACAAGAGATGGAGAGTCCAGCCGGGCCTGCGCTTAAGTGCGCGGTCGTGCTAGGCTTGTAAGTTTCTTTCTTGCTATTCCAAACGGTGAGAGATTTCTGTGCTTTTGTTATAGGACAATTAAAACCGTTTCAATACAACACACTGTGGAGTTTTCATATCTTTGCAACTTTTTCTTTGGGCATTCGAGCAATCGGGGCCCAGAGGTAACAAACACAAACAATTTTATCTATTCATTAAATTTTTGTCAAAAACAAGAATTTTCGTAACTGGAAATTTTAAAATATTAAAAACTTTCAACAACGGATCTCTTGGTTCTCGCATCGATGAAGAACGCAGCGAAATGCGATACGTAATGTGAATTGCAGAATTCCGTGAATCATCGAATCTTTGAACGCACATTGCGCCCCTTGGTATTCCAGGGGGCATGCCTGTTTGAGCGTCATTTCCTTCTCAAACATTCTGTTTGGTAGTGAGTGATACTCTTTGGAGTTAACTTGAAATTGCTGGCCTTTTCATTGGATGTTTTTTTTCCAAAGAGAGGTTTCTCTGCGTGCTTGAGGTATAATGCAAGTACGGTCGTTTTAGGTTTTACCAACTGCGGCTAATCTTTTTTATACTGAGCGTATTGGAACGTTATCGATAAGAAGAGAGCGTCTAGGCGAACAATGTTCTTAAAGTTTGACCTCAAATCAGGTAGGAGTACCCGCTGAACTTAAGCATATCAATAAGACAGGGGGAAAAGAT Reverse A GCGCGCACTTTTACTGGACTCTAGACCAGGGGGGAGAGCCAGCAGGGCTCTCCACCGGTGGGGACGCGGGCATTGGCCTTGGGTCTCGTTTACGACGGGGGAAAGTTTTTGTGGGATGAAATGGACAGCGAGCCTTGTTCATTAAGGACGAGGCGAATATTCCTCACTCCTCCCGTTTACATTGGGGTCACTAGCCATCGCTACAGAGGGGTAACACACGGAAAGATTTTGCGATTCGAGAATTTGTGTGTAAAAAAAAATATTTTTCTA Forward B GATTTTTTTGTTTTGGCAAGAGCATGAGAGCTTTTACTGGGCAAGAAGACAAGAGATGGAGAGTCCAGCCGGGCCTGCGCTTAAGTGCGCGGTCTTGCTAGGCTTGTAAGTTTCTTTCTTGCTATTCCAAACGGTGAGAGATTTCTGTGCTTTTGTTATAGGACAATTAAAACCGTTTCAATACAACACACTGTGGAGTTTTCATATCTTTGCAACTTTTTCTTTGGGCATTCGAGCAATCGGGGCCCAGAGGTAACAAACACAAACAATTTTATTTATTCATTAAATTTTTGTCAAAAACAAGAATTTTCGTAACTGGAAATTTTAAAATATTAAAAACTTTCAACAACGGATCTCTTGGTTCTCGCATCGATGAAGAACGCAGCGAAATGCGATACGTAATGTGAATTGCAGAATTCCGTGAATCATCGAATCTTTGAACGCACATTGCGCCCCTTGGTATTCCAGGGGGCATGCCTGTTTGAGCGTCATTTCCTTCTCAAACATTCTGTTTGGTAGTGAGTGATACTCTTTGGAGTTAACTTGAAATTGCTGGCCTTTTCATTGGATGTTTTTTTTCCAAAGAGAGGTTTCTCTGCGTGCTTGAGGTATAATGCAAGTACGGTCGTTTTAGGTTTTACCAACTGCGGCTAATCTTTTTTATACTGAGCGTATTGGAACGTTATCGATAAGAAGAGAGCGTCTAGGCGAACAATGTTCTTAAAGTTTGACCTCAAATCAGGTAGGAGACCCGCTGAACTTAGCATATCAATAAGCAGGAGGAAAAAAA Reverse B TTTGAGGTCAAACTTTAAGAACATTGTTCGCCTAGACGCTCTCTTCTTATCGATAACGTTCCAATACGCTCAGTATAAAAAAGATTAGCCGCAGTTGGTAAAACCTAAAACGACCGTACTTGCATTATACCTCAAGCACGCAGAGAAACCTCTCTTTGGAAAAAAAACATCCAATGAAAAGGCCAGCAATTTCAAGTTAACTCCAAAGAGTATCACTCACTACCAAACAGAATGTTTGAGAAGGAAATGACGCTCAAACAGGCATGCCCCCTGGAATACCAAGGGGCGCAATGTGCGTTCAAAGATTCGATGATTCACGGAATTCTGCAATTCACATTACGTATCGCATTTCGCTGCGTTCTTCATCGATGCGAGAACCAAGAGATCCGTTGTTGAAAGTTTTTAATATTTTAAAATTTCCAGTTACGAAAATTCTTGTTTTTGACAAAAATTTAATGAATAAATAAAATTGTTTGTGTTTGTTACCTCTGGGCCCCGATTGCTCGAATGCCCAAAGAAAAAGTTGCAAAGATATGAAAACTCCACAGTGTGTTGTATTGAAACGGTTTTAATTGTCCTATAACAAAAGCACAGAAATCTCTCACCGTTTGGAATAGCAAGAAAGAAACTTACAAGCCTAGCAAGACCGCGCACTTAAGCGCAGGCCCGGCTGGACTCTCCATCTCTTGTCTTCTTGCCCAGTAAAAGCTCTCATGCTCTTGCCAAAACAAAAAAATCCATTTTCAAAATTATTAAATTTCTTTAATGATCCTTCCGCAGGTCACCCTACGGAAGGATCATTAAAGAAATTTAATAATTTTGAAATGGATTTTTTGTTTG Forward C TGAACTTTTATTAGAGCAAAACTTATTAAACATGTTTTTTTTTATATTGTCAAGAAAATAATAAAGTGAAAACTTTCAACAACGGATCTCTTGGTTCTCGCATCGATGAAGAGCGCAGCGAAATGCGATAATTAATGTGAATTGCAGATTTTCGTGAATCATCGAGTTCTTGAACGCACATTGCGCCCTCTGGTATTCCGGAGGGCATGTCTGTTTGAGCGTCATTTCATTCTCACTTTACAGTGGTTATGACATTGCCACTAGTTTTAATTAATTGTGTGGCTCTGTTGAAAAAGATTAGGAATACACCAAAGAACTAGGTTTACACCTCTTTGGAGTGTCCTTTTTTAAAAAAAAAATCAGAAAGTTTGACCTCAAATCAGATAGGAATACCCGCTGAACTTAAGCATATCAA
49 | P a g e
Reverse C AAACTTTCTGATTTTTTTTTTAAAAAAGGACACTCCAAAGAGGTGTAAACCTAGTTCTTTGGTGTATTCCTAATCTTTTTCAACAGAGCCACACAATTAATTAAAACTAGTGGCAATGTCATAACCACTGTAAAGTGAGAATGAAATGACGCTCAAACAGACATGCCCTCCGGAATACCAGAGGGCGCAATGTGCGTTCAAGAACTCGATGATTCACGAAAATCTGCAATTCACATTAATTATCGCATTTCGCTGCGCTCTTCATCGATGCGAGAACCAAGAGATCCGTTGTTGAAAGTTTTCACTTTATTATTTTCTTGACAATATAAAAAAAAACATGTTTAATAAGTTTTGCTCTAATAAAAGTTCACAGTGTGTTAATGACAAAAATGTCAATCAGTAATGATCCTTCCGCAGGTTCACCTACGGAAGGATCATTACTGATTGACATTTTTGTCATTAACACACTGTGAACTTTTATTAGAGCAAAACTTATTAAACATGTTTTTTTTTATATTGTCAAGAAAATAATAAAGTGAAAACTTTCAACAACGGATCTCTTGGTTCTCGCATCGATGAAGAGCGCAGCGAAATGCGATAATTAATGTGAATTGCAGATTTTCGTGAATCATCGAGTTCTTGAACGCACATTGCGCCCTCTGGTATTCCGGAGGGCATGTCTGTTTGAGC Forward D TCCTGACACGCTGGCCCATGTCCGAAATATGAGACCGATGGCCAGATATGTTTTAGTGCGCGAGACGATCCTGGAGGATTAGCCGCAGGGCGCCGACTACATATCCCTTCCTATAATTTTCCCGGGCTAGCAGCTCGATTGGTTAGAGCACACGCTTGAGAAACGTGGGGTCGGAGCCTCAAGTCCTCCCTGGCCCACCCGAGATCACCCTCATATTTCAGCTGGCAGAGCACCTGCTTTGCAAGCAGGTGTGCGTCGGTTCGAACCCGTCTGCCTCCACCAGTCACGGATGAGACTTCGGTCTCCTCTGACTGGTGGAGAGCTCGAGATCTGGTCCATAAGGTAAAATCATAGGAAACTGGACGGCTGTTTCCTGATCCTGTCTCCACGAGGTTGTATGACTCGTCAGGTATGTTGGGTCTTTTAGACTGTGAATAGGTAGGTGCGTAGGCTGCTTGTGCCATTTCCGGGGTGGTCTGACCCGGTGCTGTGGAGCTTACGCTTCATTGCAATGCTAAGGATATGGGGAAGCATTCAGACAGCGTGAAGAAAAGTGTGACTGACACCGCATAAGTGCGGCAGTCGGCAGCATCTTTGTGGTGTGGCTGGTTTCTGTGCATGTGTCTTTCATCCTCGGATGAAGAATGATGTGAGAATGAGAAGGGCGATCGGTGGATGCCTTGGCGCTCACATGCGATGAATCACGTGGTACGCTGTGAAAAGCCATGTAGAGCCGCAAACAGGCTTTGATCCGTGGATGTCCGCATGGCGCAACCGCCTCGCAAGATGATCATGCACTGAATCATAGGTGTATGAGGCAGGCTTGTGCACTGAACATCTAGTACCTGTAGAAAAGATTTAACAGCATTCCGCTCGTAGTTTCGATTAGCGAGGAGCCGGCCATGTCTGATTACGACATGTGACGCTCGGAAAGTCTGGCAGAATGGGTG Reverse D CCACTCTCTTCTTATCGATACCGTTTCAATGCGCGCCGTACAAAAAAGATTAGCCGCAGTTGGCAAAACCTAAAACGACCGTACTGGCATTATACCTCAAGCACGCAGAGAAACCTCTCTTTGGGAAAAAAACATCCAATGAAAAGGCAGCAATTTCAGGTTAACTCCAAAGAGTATCACTCACTACCAAACAGAATGTTTGAGAAGAAAATGACGCTCAAACAGGCATGCCCCCTGGAATACCAAGGGGCGCAATGTGCGTTCAAAGATTCGATGATTCAGGGAATTCTGGAATTCACATTACGTATCGCATTTCGCTGCGTTCTTCATCGATGCGAGAACCATGAGATCCGTGTTGAAAAATTTTAATATTTTAAAAT Forward E GAACGCACATTGCGCCCCTTGGTATTCCAGGGGGCATGCCTGTTTGAGCGTCATTTCCTTCTCAAACATTCTGTTTGGTAGTGAGTGATACTCTCTGGAGTTAACTTGAAATTGCTGGCCTTTTCATTGGATGTTTTTTTTCCAAAGAGAGGTTTCTCTGCGTGCTTGAGGTATAATGCAAGTACGGTCGTTTTAGGTTTTACCAACTGCGGCTAATCTTTTTTGTACTGAGCGTATTGAAACGTTATCGATAAGAAGAGAGCGTCTAGGCGAACAATGTTCTTAAAGTTTGACCTCAAATCAGGTAGGAGTACCCGCTG Reverse E AACAGAGAAGTCTCACTGTTTGGAATAGCAAGAAAGAAATTTGCAAGCCTAGCAAGACCGCGCACTTAAGCGCAGGCCCGGCTGGACTCTCCATCTCTTGTCTTCTTGCCCAGTAAAAGCTCTCACGCTCTTGCCAAAACAAAAAAATCCAATATCAAAATTATTAAATTTCTTTAATGA Forward F ATTTTTTTGTTTTGGCAAGAGCGTGAGAGCTTTTACTGGGCAAGAAGACAAGAGATGGAGAGTCCAGCCGGGCCTGCGCTTAAGTGCGCGGTCTTGCTAGGCTTGCAAATTTCTTTCTTGCTATTCCAAACAGTGAGACTTCTCTGTTTTTGTTATAGGACAATTAAAACCGTTTCAATACAACACACTGTGGAGTTTTTATACTTTTGCAACTTTTTCTTTGGGCTTCGAGCAATCGAGCCCAGAGGTAACAAACACAAACAATTTTATTTATTCATTAAATTTTTGTCAAAAACAAGAATTTTCGTAACTGGAAATTTTAAAAATAATTAAAAACTTTCAACAACGGATCTCTTGGTTCTCGCATCGATGAAGAACGCAGCGAAATGCGATACGTAATGTGAATTGCAGAATTCCGTGAATCATCGAATCTTTGAACGCACATTGCGCCCCTTGGTATTCCAGGGGGCATGCCTGTTTGAGCGTCATTTCCTTCTCAAACATTCTGTTTGGTAGTGAGTGATACTCTCTGGAGTTAACTTGAAATTGCTGGCCTTTTCATTGGATGTTTTTTTTCCAAAGAGAGGTTTCTCTGCGTGCTTGAGGTATAATGCAAGTACGGTCGTTTTAGGTTTTACCAACTGCGGCTAATCTTTTTTGTACTGAGCGTATTGAAACGTTATCGATAAGAAGAGAGCGTCTAGGCGAACAATGTTCTTAAAGTTTGACCTCAAATCAGGTAGGAGTACC
50 | P a g e
Reverse F AACTTTAAGAACATTGTTCGCCTAGACGCTCTCTTCTTATCGATAACGTTTCAATACGCTCAGTACAAAAAAGATTAGCCGCAGTTGGTAAAACCTAAAACGACCGTACTTGCATTATACCTCAAGCACGCAGAGAAACCTCTCTTTGGAAAAAAAACATCCAATGAAAAGGCCAGCAATTTCAAGTTAACTCCAGAGAGTATCACTCACTACCAAACAGAATGTTTGAGAAGGAAATGACGCTCAAACAGGCATGCCCCCTGGAATACCAAGGGGCGCAATGTGCGTTCAAAGATTCGATGATTCACGGAATTCTGCAATTCACATTACGTATCGCATTTCGCTGCGTTCTTCATCGATGCGAGAACCAAGAGATCCGTTGTTGAAAGTTTTTAATTATTTTTAAAATTTCCAGTTACGAAAATTCTTGTTTTTGACAAAAATTTAATGAATAAATAAAATTGTTTGTGTTTGTTACCTCTGGGCTCGATTGCTCGAAGCCCAAAGAAAAAGTTGCAAAAGTATAAAAACTCCACAGTGTGTTGTATTGAAACGGTTTTAATTGTCCTATAACAAAAACAGAGAAGTCTCACTGTTTGGAATAGCAAGAAAGAAATTTGCAAGCCTAGCAAGACCGCGCACTTAAGCGCAGGCCCGGCTGGACTCTCCATCTCTTGTCTTCTTGCCCAG Forward G CACACTGCGTGGGCGACACGAAACACCGAAACCGAACGCACGCCGTCAAGCAAGAAATCCACAAAACTTTCAACAACGGATCTCTTGGTTCTCGCATCGATGAAGAGCGCAGCGAAATGCGATACCTAGTGTGAATTGCAGCCATCGTGAATCATCGAGTTCTTGAACGCACATTGCGCCCGCTGGTATTCCGGCGGGCATGCCTGTCTGAGCGTCGTTTCCTTCTTGGAGCGGAGCTTCAGACCTGGCGGGCTGTCTTTCGGGACGGCGCGCCCAAAGCGAGGGGCCTTCTGCGCGAACTAGACTGTGCGCGCGGGGCGGCCGGCGAACTTATTACCAAGCTCGACCTCAGATCAGGCAGGAGTACCCGCTGAACTTAAGCATATCAAT Reverse G TTGGTAATAAGTTCGCCGGCCGCCCCGCGCGCACAGTCTAGTTCGCGCAGAAGGCCCCTCGCTTTGGGCGCGCCGTCCCGAAAGACAGCCCGCCAGGTCTGAAGCTCCGCTCCAAGAAGGAAACGACGCTCAGACAGGCATGCCCGCCGGAATACCAGCGGGCGCAATGTGCGTTCAAGAACTCGATGATTCACGATGGCTGCAATTCACACTAGGTATCGCATTTCGCTGCGCTCTTCATCGATGCGAGAACCAAGAGATCCGTTGTTGAAAGTTTTGTGGATTTCTTGCTTGACGGCGTGCGTTCGGTTTCGGTGTTTCGTGTCGCCCACGCAGTGTGGTGTATAAATCACAGTAATGATCCTTCCGCAGGTTCACCTACGGAAGGATCATTACTGTGATTTATACACCACACTGCGTGGGCGACACGAAACACCGAAACCGAACGCACGCCGTCAAGCAAGAAATCC Forward H GATACGTAATGTGAATTGCAGAATTCCGTGAATCATCGAATCTTTGAACGCACATTGCGCCCCTTGGTATTCCAGGGGGCATGCCTGTTTGAGCGTCATTTCCTTCTCAAACATTCTGTTTGGTAGTGAGTGATACTCTCTGGAGTTAACTTGAAATTGCTGGCCTTTTCATTGGGATGTTTTTTTTCCAAAGAGAGGTTTCTCTGCGTGCTTGAGGTATAATGCAAGTACGGTCGTTTTAGGTTTTACC Reverse H CGCTCTCTTCTTATCGATAACGTTTCAATACGCTCAGTACAAAAAAGATTAGCCGCAGTTGGTAAAACCTAAAACGACCGTACTTGCATTATACCTCAAGCACGCAGAGAAACCTCTCTTTGGAAAAAAAACATCCAATGAAAAGGCCAGCAATTTCAAGTTAACTCCAGAGAGTATCACTCACTACCAAACAGAATGTTTGAGAAGGAAATGACGCTCAAACAGGCATGCCCCCTGGAATACCAAGGGGCGCAATGTGCGTTCAAAGATTCGATGATTCACGGAATTCTGCAATTCACATTACGTATCGCATTTCGCTGCGTTCTTCATCGATGCGAGAACCAAGAGATCCGTTGTTGAAAGTTTTTAATTATTTTTAAAATTTCCAGTTACGAAAATTCTTGTTTTTGACAAAAATTTAATGAATAAATAAAATTGTTTGTGTTTGTTACCTCTGGGCTCGATTGCTCGAAGCCCAAAGAAAAAGTTGCAAAAGTATAAAAACTCCACAGTGTGTTGTATTGAAACGGTTTTAATTGTCCTATAACAAAAACAGAGAAGTCTCACTGTTTGGAATAGCAAGAAAGAAATTTGCAAGCCTAGCAAGACCGCGCACTTAA Forward I TTTAAGTGGCCAGACGATCCTGCTTGATTACCCGCAGGGCACCGACTTTTCCTCCCTTCATATAATTTTCCCGGGCTAGCAGATGGATTTTTTAGAGGACATCCTGGAGGGACCTGGGGTCGGAGCCTCAAGTCGTCCCTGGCCCACCAGAGATCACCCTCATTGTTCAGATGAGAGAGAGCTGCTTTTTAGCAGGTGGTCGGCTGATCTAACCCGTCTGCCTCCATCAGTCAAGGTTGAGACTTCGGTCTCGTCTGAGTGGTGGAGAGCTCGAGATCTGGTCCCTAAGGGAAAATCATAAGAAACGGGACGGCTGTTTCCTGATCCTGTCTCCACGAAGGTTTATGACTCGTCTGGTATGTTGGGTCTTCTAGAGCGTGAATAGGTTTCCCGCGCTGTGCTGCGGGTGC
51 | P a g e
Reverse I TGAAAGTTTTTAATTATTTTTAAAATTTCC Forward J ATCGAGACGCGTCAGACGCTCCGTAGAGAAAGCTTTCCCGCCGTGCAATAGCTAATAGGACCGTACTTGAATTATACGACAAGCACCCATAGAAGCTCTCTTTGAAAAAAAAACATCCAATGAAAAGGCCAACAATTTCAAGTTAACTCGGGAGAGAATCACTCACTACCAAACGAAAGGTTTGAGAAGGAAATGACGCTCAAACAGGCATGCCCCCGGGAATACCAAGGGGGCAAATGTGCCTTCAAAGATTCGATGATTCATGGAATTCGGCAATTCACATTACGTATGTCGTTTCGCTGATCTCTTCATACATGCCAGAACCAAGAGATCCGTTGTTGAAAGTTTTTAATTATTTTTAAAATTTCCAGATACGAAAATTCGTGTTTTTGACAAAAATTTAATGAAT Reverse J ACTTTCTGATTTTTTTTTTAAAAAAGGACACTCCAAAGAGGTGTAAACCTAGTTCTTTGGTGTATTCCTAATCTTTTTCAACAGAGCCACACAATTAATTAAAACTAGTGGCAATGTCATAACCACTGTAAAGTGAGAATGAAATGACGCTCAAACAGACATGCCCTCCGGAATACCAGAGGGCGCAATGTGCGTTCAAGAACTCGATGATTCACGAAAATCTGCAATTCACATTAATTATCGCATTTCGCTGCGCTCTTCATCGATGCGAGAACCAAGAGATCCGTTGTTGAAAGTTTTCACTTTATTATTTTCTTGACAATATAAAAAAAAACATGTTTAATAAGTTTTGCTCTAATAAAAGTTCACAGTGTGTTAATGACAAAAATGTCAATCAGTAATGATCCTTCCGCAGGTTCACCTACGGAAGGATCATTACTGATTGACATTTTTGTCATTAACACACTGTGAACTTTTATTAGAGCAAAACTTATTAAACATGTTTTTTTTTATATTGTCAAGAAAATAATAAAGTGAAAA Forward K GGAGTATACACACGTCAACAAAAGATCTAAAAGAATAAAACTTTCAACAACGGATCTCTTGGTTCTCGCATCGATGAAGAGCGCAGCGAAATGCGATACCTAGTGTGAATTGCAGCCATCGTGAATCATCGAGTTCTTGAACGCACATTGCGCCCGTCGGTATTCCGGCGGGCATGCCTGTCTGAGCGTCGTTTCCTTCTTGTGCACCGCGGGGTCTTTGCAGATCCTCT Reverse K TCGCTCGGCGGCCAAAGCGTCCCGATGTAGTTCGCTTCGTCCGCAACGTTTCTTTTCGGCCGGGCCAGTGGCACGGCCAGCTCTGCGCACAGAGGATCTGCAAAGACCCCGCGGTGCACAAGAAGGAAACGACGCTCAGACAGGCATGCCCGCCGGAATACCGACGGGCGCAATGTGCGTTCAAGAACTCGATGATTCACGATGGCTGCAATTCACACTAGGTATCGCATTTCGCTGCGCTCTTCATCGATGCGAGAACCAAGAGATCCGTTGTTGAAAGTTTTATTCTTTTAGATCTTTTGTTGACGTGTGTATACTCCAGGTTTAGGTGTTTTGTGCGCCCACACAGTGTGGTGTTGGTATAATCACAGTAATGATCCTTCCGCAGGTTCACCTACGGAAGGATCATTACTGTGATTATACCAACACC Forward L TGTTTGGAATCTCATTCATATATTCGACTCGCTGGTTTTTCGTGTTTTGATCGAGCGTCTGTAACATTCGGGCAGTGGATGTCTGAATGTACTCCCGATTTTCTGATTTACCGAAGGTACAATTTAGAAAGGTCATGTTTGGTGTTCATCAATCTCAGACTGCGCTCAGTATAATTTTGGTCGGCATTAAAATACGCGGGGATGTATCTTTGCACTCCCCCGCTCCCACAGTCAAGGATAATCCGAAGCATCAGAAGTGCATCGGCAAAAGACGTGGTGTAGGTTATTCCTTGAGAACTCCTGCACAGGACTAACCGGCGAGTTATTCCTGTTCGGTTTTTCCATAGATTCACCTTAAGATCCCGTGGATGTTTCCGCTTCCCCTTATCATCACGATGAAAATCACCCGCGGGAACTTCGTTTCATCGGCGCGGACTTCTCTTCGCAGCTCCGATGACTGCTGGTCAACTAAATCCACTGACGAACTATTCTCTTTTATTGAGCAGGAATATATAGGCGATATCTCTAACGCCGTTTCACGTGATACATTCAAACGCTTTTTGAATGGTTTTTCTAAAAAACAATGAACCCCGGGAGATTACATTTGTTGGTACACAGCTATGAGATATACGCGATCTTGGAGGAATGCTGGTCGTGTATCTCGTTCCGAAACGGATGACTGAGCTGCTTTTTCTACCGACTTTCTCAACAATGCCGGCGTGATCTAACCAATTTTATCATCCTAAAAGTTCCACACGATTCTGAATTAATCCAAATTTGTCGTTCCATCGAATGCGTACGTTTTTGCGCGATGTATGGCGTGGCGCAGCGGGGAGAAACTTTCCACAAGATAGCAGCCGGCAACTGGATTCTTGCTTTCGAGCAGGCTTAGCCGATTTGCTGACTGCCTTGGGAAAATTCTGCCAGCACGGCCACCCATCAATGGCGGC Reverse L CAGGACAAGGAGACAATTGTGAGACCTTATGGCTCACGCTTCCGAGCATCATTTCTTTAAATCCGCTGATTCCGCGGCTTCCGACGACAATCAGATTGAAATGCTGTTCTTTCGCTATGTTTAAAATTTGATGCGCAGGTTCACCTACGGA
52 | P a g e
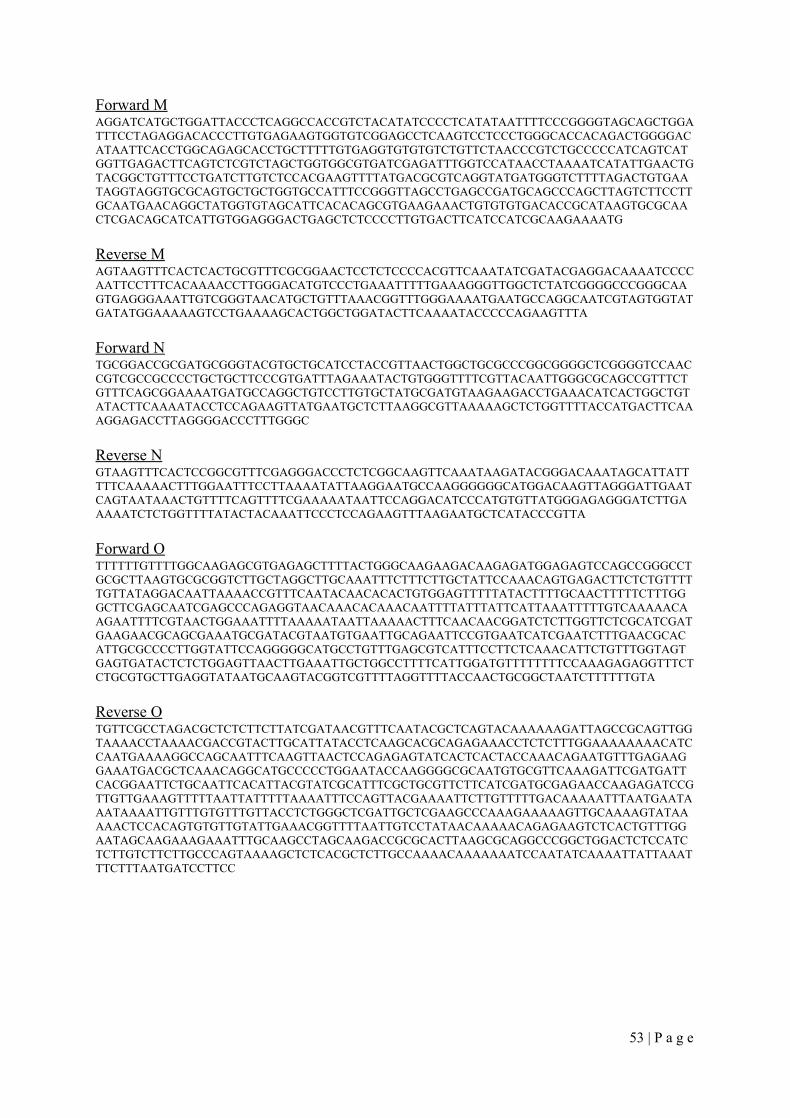
Forward M AGGATCATGCTGGATTACCCTCAGGCCACCGTCTACATATCCCCTCATATAATTTTCCCGGGGTAGCAGCTGGATTTCCTAGAGGACACCCTTGTGAGAAGTGGTGTCGGAGCCTCAAGTCCTCCCTGGGCACCACAGACTGGGGACATAATTCACCTGGCAGAGCACCTGCTTTTTGTGAGGTGTGTGTCTGTTCTAACCCGTCTGCCCCCATCAGTCATGGTTGAGACTTCAGTCTCGTCTAGCTGGTGGCGTGATCGAGATTTGGTCCATAACCTAAAATCATATTGAACTGTACGGCTGTTTCCTGATCTTGTCTCCACGAAGTTTTATGACGCGTCAGGTATGATGGGTCTTTTAGACTGTGAATAGGTAGGTGCGCAGTGCTGCTGGTGCCATTTCCGGGTTAGCCTGAGCCGATGCAGCCCAGCTTAGTCTTCCTTGCAATGAACAGGCTATGGTGTAGCATTCACACAGCGTGAAGAAACTGTGTGTGACACCGCATAAGTGCGCAACTCGACAGCATCATTGTGGAGGGACTGAGCTCTCCCCTTGTGACTTCATCCATCGCAAGAAAATG Reverse M AGTAAGTTTCACTCACTGCGTTTCGCGGAACTCCTCTCCCCACGTTCAAATATCGATACGAGGACAAAATCCCCAATTCCTTTCACAAAACCTTGGGACATGTCCCTGAAATTTTTGAAAGGGTTGGCTCTATCGGGGCCCGGGCAAGTGAGGGAAATTGTCGGGTAACATGCTGTTTAAACGGTTTGGGAAAATGAATGCCAGGCAATCGTAGTGGTATGATATGGAAAAAGTCCTGAAAAGCACTGGCTGGATACTTCAAAATACCCCCAGAAGTTTA Forward N TGCGGACCGCGATGCGGGTACGTGCTGCATCCTACCGTTAACTGGCTGCGCCCGGCGGGGCTCGGGGTCCAACCGTCGCCGCCCCTGCTGCTTCCCGTGATTTAGAAATACTGTGGGTTTTCGTTACAATTGGGCGCAGCCGTTTCTGTTTCAGCGGAAAATGATGCCAGGCTGTCCTTGTGCTATGCGATGTAAGAAGACCTGAAACATCACTGGCTGTATACTTCAAAATACCTCCAGAAGTTATGAATGCTCTTAAGGCGTTAAAAAGCTCTGGTTTTACCATGACTTCAAAGGAGACCTTAGGGGACCCTTTGGGC Reverse N GTAAGTTTCACTCCGGCGTTTCGAGGGACCCTCTCGGCAAGTTCAAATAAGATACGGGACAAATAGCATTATTTTTCAAAAACTTTGGAATTTCCTTAAAATATTAAGGAATGCCAAGGGGGGCATGGACAAGTTAGGGATTGAATCAGTAATAAACTGTTTTCAGTTTTCGAAAAATAATTCCAGGACATCCCATGTGTTATGGGAGAGGGATCTTGAAAAATCTCTGGTTTTATACTACAAATTCCCTCCAGAAGTTTAAGAATGCTCATACCCGTTA Forward O TTTTTTGTTTTGGCAAGAGCGTGAGAGCTTTTACTGGGCAAGAAGACAAGAGATGGAGAGTCCAGCCGGGCCTGCGCTTAAGTGCGCGGTCTTGCTAGGCTTGCAAATTTCTTTCTTGCTATTCCAAACAGTGAGACTTCTCTGTTTTTGTTATAGGACAATTAAAACCGTTTCAATACAACACACTGTGGAGTTTTTATACTTTTGCAACTTTTTCTTTGGGCTTCGAGCAATCGAGCCCAGAGGTAACAAACACAAACAATTTTATTTATTCATTAAATTTTTGTCAAAAACAAGAATTTTCGTAACTGGAAATTTTAAAAATAATTAAAAACTTTCAACAACGGATCTCTTGGTTCTCGCATCGATGAAGAACGCAGCGAAATGCGATACGTAATGTGAATTGCAGAATTCCGTGAATCATCGAATCTTTGAACGCACATTGCGCCCCTTGGTATTCCAGGGGGCATGCCTGTTTGAGCGTCATTTCCTTCTCAAACATTCTGTTTGGTAGTGAGTGATACTCTCTGGAGTTAACTTGAAATTGCTGGCCTTTTCATTGGATGTTTTTTTTCCAAAGAGAGGTTTCTCTGCGTGCTTGAGGTATAATGCAAGTACGGTCGTTTTAGGTTTTACCAACTGCGGCTAATCTTTTTTGTA Reverse O TGTTCGCCTAGACGCTCTCTTCTTATCGATAACGTTTCAATACGCTCAGTACAAAAAAGATTAGCCGCAGTTGGTAAAACCTAAAACGACCGTACTTGCATTATACCTCAAGCACGCAGAGAAACCTCTCTTTGGAAAAAAAACATCCAATGAAAAGGCCAGCAATTTCAAGTTAACTCCAGAGAGTATCACTCACTACCAAACAGAATGTTTGAGAAGGAAATGACGCTCAAACAGGCATGCCCCCTGGAATACCAAGGGGCGCAATGTGCGTTCAAAGATTCGATGATTCACGGAATTCTGCAATTCACATTACGTATCGCATTTCGCTGCGTTCTTCATCGATGCGAGAACCAAGAGATCCGTTGTTGAAAGTTTTTAATTATTTTTAAAATTTCCAGTTACGAAAATTCTTGTTTTTGACAAAAATTTAATGAATAAATAAAATTGTTTGTGTTTGTTACCTCTGGGCTCGATTGCTCGAAGCCCAAAGAAAAAGTTGCAAAAGTATAAAAACTCCACAGTGTGTTGTATTGAAACGGTTTTAATTGTCCTATAACAAAAACAGAGAAGTCTCACTGTTTGGAATAGCAAGAAAGAAATTTGCAAGCCTAGCAAGACCGCGCACTTAAGCGCAGGCCCGGCTGGACTCTCCATCTCTTGTCTTCTTGCCCAGTAAAAGCTCTCACGCTCTTGCCAAAACAAAAAAATCCAATATCAAAATTATTAAATTTCTTTAATGATCCTTCC
53 | P a g e
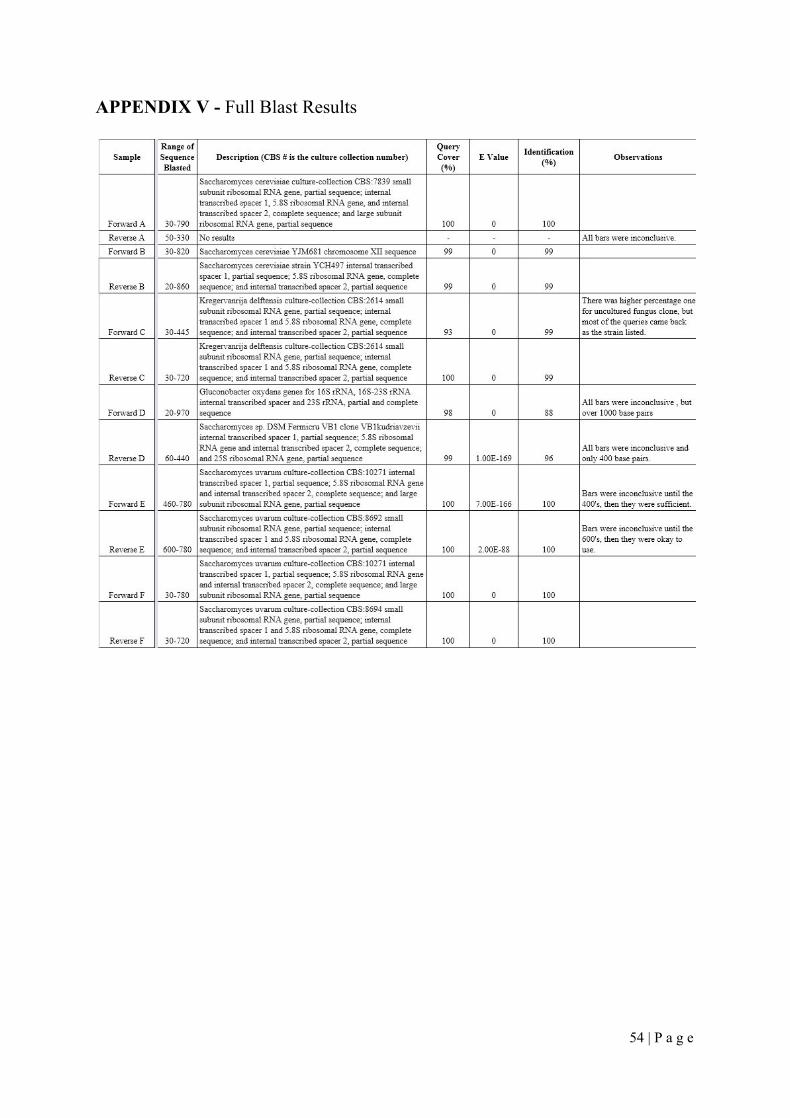
APPENDIX V - Full Blast Results
54 | P a g e
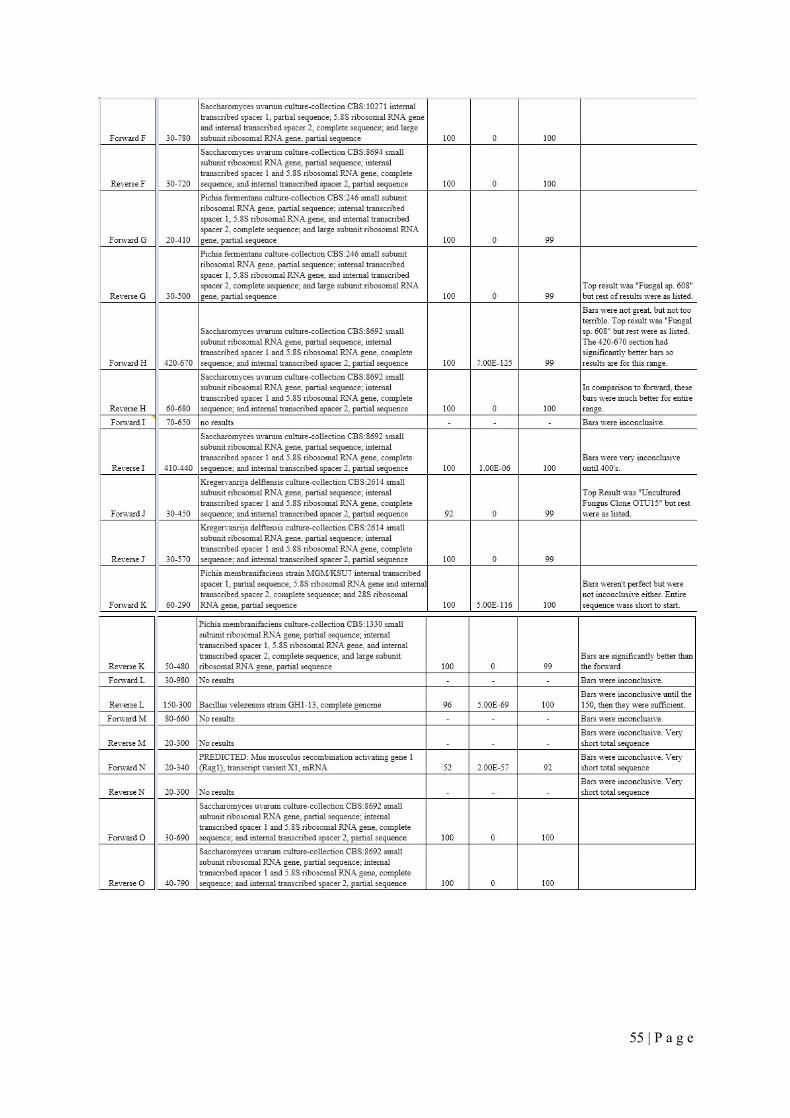
55 | P a g e