Embed Size (px)
Citation preview

North Dakota EcoNomic impact of aviatioNDecember 2010
Prepared for: The North Dakota Aeronautics Commission
Prepared by:Wilbur Smith Associates6600 Clough PikeCincinnati, OH 45244513-233-3700
With assistance from:Kadrmas Lee & Jacksonand Agency MABU
“The preparation of this document was financed in part through a planning grant from the Federal Aviation Administration (FAA) as approved under the Airport and Airway Improvement Act of 1982. The contents of this report reflect the views of the Consultant, which is responsible for the facts and the accuracy of the data depicted herein, and do not necessarily reflect the official views or policy of the FAA. Acceptance of this report by the FAA does not in any way constitute a commitment on the part of the United States to participate in any development depicted therein, nor does it indicate that the proposed development is environmentally acceptable in accordance with applicable public laws.”

i
Table of ConTenTsIntroduction ..................................................................................................................................................1
Study Summary ............................................................................................................................................2
Socioeconomic Overview of North Dakota ............................................................................................ 9
Population .................................................................................................................................................. 9
Gross State Product And Industry Mix ................................................................................................ 12
Employment ............................................................................................................................................ 13
Per Capita Personal Income ................................................................................................................. 14
Study Approach ..........................................................................................................................................15
The Economic Modeling Process ......................................................................................................... 15
Data Requirements For The Economic Modeling Process ............................................................... 16
Surveys, Data Collection Methods, And Model Assumptions ......................................................... 17
Airport Operations And On-Airport Activities ................................................................................. 18
Commercial Service Visitors ............................................................................................................. 19
General Aviation Visitors ................................................................................................................. 21
Study Multipliers – Secondary Impacts .......................................................................................... 23
Employment, Payroll, And Output Impacts For Study Airports ...................................................... 24
Employment Impacts ............................................................................................................................. 24
Employment from On-Airport Activity ............................................................................................. 25
Employment from Commercial Service Visitor Spending ............................................................. 25
Employment from General Aviation Visitor Spending ................................................................... 26
Total Employment .............................................................................................................................. 26
Payroll Impacts ....................................................................................................................................... 27
Payroll from On-Airport Activity ...................................................................................................... 27
Payroll from Commercial Service Visitor Spending ....................................................................... 27
Payroll from General Aviation Visitor Spending ............................................................................. 28
Total Annual Payroll ........................................................................................................................... 28
Output Impacts ....................................................................................................................................... 29
Output from On-Airport Activity and Businesses ......................................................................... 29
Output from Commercial Service Visitor Spending ....................................................................... 29
Output from General Aviation Visitor Spending ............................................................................ 30
Total Annual Output .......................................................................................................................... 30
Aviation Market Segment Analysis ........................................................................................................ 31
Aerial Applicators ................................................................................................................................... 33
Air Ambulance ....................................................................................................................................... 34
Air Cargo ................................................................................................................................................. 34
Aircraft Maintenance ............................................................................................................................. 34

ii
Airlines ..................................................................................................................................................... 35
Airport Management ............................................................................................................................. 35
Concessions ............................................................................................................................................ 35
Corporate Flight Departments ............................................................................................................. 35
FBOs ......................................................................................................................................................... 36
Flight Instruction ................................................................................................................................... 36
Government ............................................................................................................................................ 37
Military ..................................................................................................................................................... 37
Visitors .................................................................................................................................................... 37
Additional Areas of Economic Benefit ................................................................................................... 38
Off-Airport Aerospace Manufacturing Impacts ................................................................................ 38
Estimating Impacts with an Input-Output Model ......................................................................... 39
Data Requirements for Aerospace Manufacturing Impact Estimates ........................................ 39
Aerospace Manufacturing Impacts ................................................................................................ 39
Unmanned Aerial Systems .................................................................................................................. 40
Benefits from Agricultural Applicators .............................................................................................. 41
Travel Agencies ....................................................................................................................................... 41
Airport and Heliport Use by Hospitals ................................................................................................ 42
Patient Transfers................................................................................................................................. 42
Clinics .................................................................................................................................................. 43
Air Cargo Uses .................................................................................................................................... 43
Other Comments ............................................................................................................................... 43
Qualitative Airport Benefits ................................................................................................................. 44
Tax Impacts ..................................................................................................................................................45
State and Local Sales Tax Rates .......................................................................................................... 45
Lodging and Restaurant Tax Rates ...................................................................................................... 45
Rental Car Tax Rates .............................................................................................................................. 46
Tax Estimation Methodology ................................................................................................................. 46
Taxes Generated by On-Airport Businesses ....................................................................................... 49
Taxes Paid by Commercial Service Visitors ........................................................................................ 49
Taxes Paid by General Aviation Visitors .............................................................................................. 50
Taxes Paid by Employees of On-Airport Businesses ......................................................................... 51
Taxes Paid by Employees Supported by Visitor Spending ............................................................... 51
Aviation Fuel Taxes ................................................................................................................................. 51
Total Airport-Related Taxes ................................................................................................................... 51
Tax Summary .......................................................................................................................................... 51
Economic Impact Summary ..................................................................................................................... 52
Appendix.....................................................................................................................................................A-1

iii
figuresFigure 1: North Dakota Airports Included In Economic Impact Analysis ............................................... 3
Figure 2: 2000-2010 North Dakota Population Growth ............................................................................. 10
Figure 3: 2010-2020 North Dakota Population Growth Forecast ............................................................. 11
Figure 4: Percentage of Airport Economic Output by Market Segment ................................................ 33
TablesTable 1: Total Economic Impacts for North Dakota Airports..................................................................... 6
Table 2: North Dakota Gross State Product by Industry For 2008 .......................................................... 13
Table 3: North Dakota Employment by Industry For 2009 ....................................................................... 14
Table 4: Enplanements & Percent Visitors at North Dakota Commercial Service Airports - 2010 .... 20
Table 5: North Dakota RIMS II Multipliers by Economy Sector ............................................................ 24
Table 6: North Dakota On-Airport Employment ....................................................................................... 25
Table 7: North Dakota Employment from Commercial Service Visitor Spending ............................... 26
Table 8: North Dakota Employment from General Aviation Visitor Spending ..................................... 26
Table 9: North Dakota Total Airport Employment ..................................................................................... 27
Table 10: North Dakota On-Airport Activity Payroll .................................................................................. 27
Table 11: North Dakota Annual Payroll from Commercial Service Visitor Spending ......................... 28
Table 12: North Dakota Annual Payroll from General Aviation Visitor Spending ................................ 28
Table 13: North Dakota Airports Total Annual Payroll ............................................................................. 29
Table 14: North Dakota On-Airport Activity Output .................................................................................. 29
Table 15: North Dakota Output from Commercial Service Visitor Spending ....................................... 30
Table 16: North Dakota Output from General Aviation Visitor Spending ............................................. 30
Table 17: North Dakota Airports Total Annual Output ............................................................................. 31
Table 18: North Dakota Airport Total Impacts by Market Segment ....................................................... 32
Table 19: Total Economic Impact of Off-Airport Aerospace Manufacturing in North Dakota ............ 39
Table 20: Total Economic Impact of Off-Airport Aerial Applicators in North Dakota .......................... 41
Table 21: Total Economic Impact of Travel Agencies in North Dakota .................................................. 42
Table 22: Sales Tax Rates for Regions Associated with North Dakota Airports - 2010 ....................... 47
Table 23: Airport-Related Taxes from North Dakota Airports - 2010 ...................................................... 51
Table 24: Economic Impact Summary for Aviation in North Dakota ..................................................... 53

1
inTroduCTion In today’s global economy, air transportation provides vital links that enable businesses to function efficiently and improve the quality of life for residents of North Dakota. Airports and aviation help to both support and stimulate economic activity throughout the state. The North Dakota Department of Transportation’s Division of Aviation completed this study in 2010 to measure the value of airports and aviation-related activity in North Dakota. The statewide economic impact study shows how aviation serves as an economic engine for North Dakota. The study also documents various ways air transportation is used in North Dakota and other benefits that air transportation supports, many of which are found away from airports.
Aviation benefits North Dakota in many ways. Air transportation is essential for business attraction and retention. Airports play a key role in economic development for many communities. In today’s time-sensitive environment, air transportation improves overall business efficiency by enabling businesses to improve customer service and the delivery of their products to market. Airports in North Dakota are the gateway to the nation’s air transportation system and the world’s economy.
Air transportation brings tourists to the state, enabling them to enjoy the open spaces and natural beauty of North Dakota. While there, these visitors spend money locally on food, lodging, and other items in mutually beneficial transactions. Residents of North Dakota use airports for travel, connecting them to family and friends through the convenience of modern air travel.
The primary effort of this study involved identifying the economic benefits associated with the eight commercial service and 81 general aviation airports that serve communities throughout North Dakota. However, there are benefits associated with aviation-related activities that are found beyond the boundaries of the airport. This study estimates the economic benefits of these additional off-airport, yet aviation-related, activities.
Air transportation is not only important to businesses in North Dakota, it also helps to support tourism, agriculture, emergency medical services, the military, and public safety. Airports enable doctors to reach smaller towns in North Dakota, and they facilitate the transfer of patients to larger medical centers. Airports increase accessibility to better health care throughout the state. Aircraft applying pesticides to crops fly from North Dakota airports, both public and private. Airports help to support services which are vital to all citizens in North Dakota. Even if they never use an airport directly, citizens benefit from an improved quality of life that air transportation helps to support. Through simple things such as package delivery and the ability to visit family and friends, aviation in North Dakota helps promote safer, healthier, and more productive lives.
North Dakota EcoNomic impact of aviatioN

2
sTudy summaryThe 89 public-use airports in North Dakota are important transportation resources as well as critical economic catalysts. Figure 1 shows the location of each of these airports. Airports in North Dakota support the air travel needs of North Dakota residents, businesses, and visitors. This report highlights the important economic contributions that North Dakota realizes from its airports by quantifying employment, payroll, and total economic activity. The analysis presented in this report considers the annual economic benefits accrued in 2010 associated with airport operations, on-airport construction, visitors who arrive via commercial airlines, and visitors who arrive on privately-owned general aviation aircraft. These on-airport impacts are reported for each individual airport. These impacts are then broken down by sub-industry segments to give a clearer picture of what parts of the aviation industry make the greatest contribution to North Dakota’s economy.
In addition, this study summarizes other benefits attributed to aviation in North Dakota. Some of these benefits are from aviation businesses that operate off-airport and an estimate of their economic benefits is included in this analysis. Other areas of aviation provide benefits that go beyond the economic value associated with jobs, payroll and output. These additional areas that were analyzed are:
Off-Airport Aerospace Manufacturing – North Dakota has a significant number of businesses that support aviation through parts manufacturing, but these businesses are not located on an airport. A survey of these businesses produced an estimate of jobs, payroll, and output.
Unmanned Aerial Systems – North Dakota has cultivated an environment for the growth of the unmanned aerial systems (UAS) industry. As a result, a number of businesses that research, design, test, and manufacture UAS have established themselves in North Dakota and expanded their facilities, especially in the Red River Valley Research Corridor along the North Dakota and Minnesota border. Additionally, the North Dakota Air National Guard and U.S. Customs and Border Protection are increasing their use of UAS. As an offshoot of aerospace manufacturing, the impact of these businesses is included in the estimate of impacts for off-airport aerospace manufacturing. However, due to the significant amount of UAS activity in North Dakota, it was deemed worthwhile to examine UAS on its own.
Aerial Application – Most aerial applicators operate from a public airport and the economic benefits they produce were captured in the impacts associated with those airports. In North Dakota, however, there are a significant number of aerial applicators that operate from private airfields. These aerial applicators were identified from the state’s list of licensed aerial applicators. They were surveyed in order to develop an estimate of the number of employees, their payroll, and the output these aerial applicators supported.
Travel Agencies – Most travel agencies generate a significant portion of their revenues through airline ticket sales. North Dakota has a number of large travel agencies that are supported by the travel generated by the airline industry. Surveys of North Dakota travel agents obtained data used to estimate the economic impact of travel agencies.
Airport and Heliport Use by Hospitals – Many hospitals depend on aviation to quickly move critically ill or injured patients, deliver drugs and organs, and transport healthcare workers. This analysis examined how hospitals throughout North Dakota make use of local airports and heliports.

3
Fig
ure
1:
Nor
th D
akot
a A
irp
orts
In
clu
ded
In
Eco
nom
ic I
mp
act
An
alys
is
Sou
rce:
Wilb
ur S
mit
h A
ssoc
iate
s

4
Qualitative Airport Benefits – Airports provide contributions in forms other than jobs, payroll and economic activity. This section highlights some of the airport benefits that are not easily assigned a number value.
These more detailed analyses provide examples of how North Dakota airports improve the livelihoods of the residents of North Dakota, over and above the jobs, payroll, and economic output that they generate.
In 2010, North Dakota’s system of public airports was comprised of eight commercial service and 81 general aviation airports. The North Dakota Aeronautics Commission supports the operation and development of these 89 airports through grant funding, inspections, planning studies, education efforts, and communication with local, state, and federal officials. The North Dakota Aeronautics Commission also works closely with various aviation associations, including the North Dakota Aviation Council.
The system of 89 public-use airports generated $1.1 billion of economic activity and supported tens of thousands of quality jobs in 2010. This included expenditures by hundreds of on-airport businesses and hundreds of thousands of visitors, as well as the multiplier effect associated with this spending. In addition, North Dakota residents increasingly depend on civil aviation to support their health, welfare, and safety needs. In brief, the 89 public-use airports included in the system:
•Supported approximately 9,792 jobs
•Generated $365.9 million in annual payroll
•Produced $1.1 billion in annual economic activity
Clearly, the airports of North Dakota are a major catalyst to the state’s growing economy. Other findings included:
•Off-airport impacts from aerospace manufacturers, travel agents, and aerial applicators operat-ing from private airfields add another 5,688 jobs, $224 million in payroll, and $560 million in output.
•Airport impacts are fairly well diversified among the various market segments. Visitor spending accounts for the largest segment with just under 20 percent of all airport output. Aerial applica-tors are the next largest share of airport economic impacts, comprising more than 13 percent of the total.
• The total economic output and associated expenditures from North Dakota’s airports and visitors who arrive by air comprised 3.3 percent of the state’s 2009 estimated gross domestic product. When off-airport aviation impacts are included, the share of state gross domestic product related to aviation increases to 5.1 percent.
•North Dakota’s airports serve as vital business links and support critical services such as medical care, agriculture support, search and rescue, law enforcement, recreation, and environmental services.

5
Table 1 lists the total employment, payroll, and output for the 89 North Dakota study airports. These economic benefits include impacts from on-airport businesses and government agencies, spending by visitors using commercial airlines and general aviation, and the induced impacts resulting from the re-circulation of money spent by all of the aforementioned activities.

6
Table 1: Total Economic Impacts for North Dakota Airports
Associated City Airport NameTotal
EmploymentTotal
PayrollTotal
Output
COMMErCIAl SErvICE AIrPOrTS
Bismarck Bismarck 1,572 $58,286,900 $161,326,100
Devils Lake Devils Lake Regional 99 $3,157,600 $9,677,400
DickinsonDickinson-Theodore Roosevelt Regional
204 $5,867,600 $17,138,800
Fargo Hector International 4,001 $170,003,100 $425,131,500
Grand Forks Grand Forks International 1,888 $68,870,800 $207,265,400
Jamestown Jamestown Regional 121 $3,676,400 $13,104,300
Minot Minot International 732 $22,757,900 $70,559,200
Williston Sloulin Field International 255 $7,765,800 $26,781,200
COMMErCIAl SErvICE AIrPOrTS TOTAl 8,872 $340,386,100 $930,983,900 GENErAl AvIATION AIrPOrTS
Arthur Arthur Less than 1 $5,200 $27,100
Ashley Ashley Municipal 10 $272,300 $1,168,400
Beach Beach 1 $43,600 $122,500
Beulah Beulah 32 $981,300 $4,544,000
Bottineau Bottineau Municipal 13 $366,100 $2,193,600
Bowbells Bowbells Municipal Less than 1 $5,200 $27,000
Bowman Bowman Municipal 16 $261,000 $1,027,500
Cando Cando Municipal 6 $145,900 $858,500
Carrington Carrington Municipal 11 $281,500 $1,746,900
Casselton Casselton Robert Miller Regional 47 $1,337,300 $6,457,600
Cavalier Cavalier Municipal 16 $398,800 $3,306,700
Columbus Columbus Municipal Less than 1 $5,400 $27,400
Cooperstown Cooperstown Municipal 6 $158,000 $811,400
Crosby Crosby Municipal 12 $369,700 $2,379,700
Drayton Drayton Municipal 7 $194,400 $1,189,300
Edgeley Edgeley Municipal 6 $136,300 $775,200
Elgin Elgin Municipal Less than 1 $5,300 $27,200
Ellendale Ellendale Municipal 3 $83,800 $246,300
Enderlin Sky Haven 2 $73,000 $271,900
Fessenden Fessenden Municipal 14 $414,600 $2,784,700
Fort Yates Standing Rock 10 $290,700 $1,099,500
Gackle Gackle Municipal Less than 1 $5,200 $27,000
Garrison Garrison Municipal 6 $235,900 $1,114,400
Garrison Dam Garrison Dam Recreational Airpark 1 $2,000 $3,900
Glen Ullin Glen Ullin Regional Less than 1 $23,800 $88,200
Grafton Hutson Field 36 $997,000 $3,740,900
Gwinner Gwinner-Roger Melroe Field 19 $289,000 $970,000

7
Associated City Airport NameTotal
EmploymentTotal
PayrollTotal
Output
Harvey Harvey Municipal 26 $797,600 $5,202,200
Hazelton Hazelton Municipal 12 $342,500 $2,283,000
Hazen Mercer County Regional 8 $150,200 $807,000
Hettinger Hettinger Municipal 21 $597,800 $2,258,300
Hillsboro Hillsboro Municipal 30 $713,900 $4,001,900
International Peace Garden-Dunseith
International Peace Garden 2 $27,300 $88,900
Kenmare Kenmare Municipal 7 $191,700 $1,032,000
Killdeer Weydahl Field Less than 1 $6,200 $30,700
Kindred Hamry Field 35 $1,208,700 $4,370,800
Kulm Kulm Municipal Less than 1 $7,800 $36,600
Lakota Lakota Municipal 4 $105,900 $402,000
LaMoure LaMoure Rott Municipal 11 $354,200 $2,174,500
Langdon Robertson Field 14 $404,700 $2,642,600
Larimore Larimore Municipal 26 $783,700 $5,140,500
Leeds Leeds Municipal Less than 1 $5,600 $28,500
Lidgerwood Lidgerwood Municipal Less than 1 $2,400 $9,500
Linton Linton Municipal 8 $229,600 $1,286,100
Lisbon Lisbon Municipal 12 $396,200 $2,018,300
Maddock Maddock Municipal 11 $367,700 $2,038,500
Mandan Mandan Municipal 31 $1,003,600 $4,390,900
Mayville Mayville Municipal 16 $429,600 $1,749,000
McClusky McClusky Municipal 1 $15,600 $16,200
McVille McVille Municipal Less than 1 $1,700 $7,900
Milnor Milnor Municipal Less than 1 $6,500 $32,000
Minto Minto Municipal Less than 1 $8,000 $34,200
Mohall Mohall Municipal 22 $665,200 $3,849,800
Mott Mott Municipal 17 $432,800 $1,373,400
Napoleon Napoleon Municipal 6 $177,100 $872,900
New Rockford Tomlinson Field 8 $233,100 $1,561,900
New Town New Town Municipal 1 $41,400 $217,600
Northwood Northwood Municipal-Vince Field 7 $193,800 $1,045,000
Oakes Oakes Municipal 7 $201,600 $1,348,600
Page Page Regional 17 $501,100 $4,141,000
Park River Park River-W C Skjerven Field 24 $681,500 $1,978,000
Parshall Parshall-Hankins 4 $97,600 $475,100
Pembina Pembina Municipal 6 $161,700 $596,600
Plaza Trulson Field Less than 1 $5,400 $27,400
Richardton Richardton 0 $0 $3,400
Rolette Rolette Less than 1 $4,100 $13,600
Rolla Rolla Municipal 16 $620,200 $2,515,800

8
Associated City Airport NameTotal
EmploymentTotal
PayrollTotal
Output
Rugby Rugby Municipal 16 $351,400 $2,846,600
St. Thomas St. Thomas Municipal 6 $171,700 $1,096,600
Stanley Stanley Municipal 5 $133,900 $714,300
Tioga Tioga Municipal 17 $463,300 $1,923,400
Towner Towner Municipal 3 $113,500 $760,500
Turtle Lake Turtle Lake Municipal Less than 1 $2,600 $8,800
Valley City Barnes County Municipal 31 $636,700 $4,274,000
Wahpeton Harry Stern 94 $2,615,700 $11,585,200
Walhalla Walhalla Municipal 13 $298,500 $3,709,400
Washburn Washburn Municipal 6 $145,200 $655,600
Watford City Watford City Municipal 21 $511,600 $3,003,600
West Fargo West Fargo Municipal 24 $457,600 $2,004,100
Westhope Westhope Municipal Less than 1 $2,200 $8,500
Wishek Wishek Municipal Less than 1 $11,800 $43,000
GENErAl AvIATION AIrPOrTS TOTAl 920 $25,473,300 $131,772,600 All AIrPOrTS TOTAl 9,792 $365,859,400 $1,062,756,500 Note: Airports with less than one employee represent part-time work by one or more people.Sources: Wilbur Smith Associates and RIMS II multipliers.Prepared: December 2010.
A more detailed breakout of this information can be found in the appendix at the end of this report.

9
soCioeConomiC overview of norTh dakoTaThe magnitude of the economic impact of North Dakota’s airports is linked to the demand that is generated within the state for aviation services. While some amount of air traffic will be tied to the state’s tourism activities, much of the growth in aviation activity in North Dakota is driven by its residents and businesses. As population, employment, and income levels rise in the state, demand for airline travel, air cargo shipments, personal flying, and other aviation-related activities also rises. This section will inventory North Dakota’s general economic characteristics.
PopulationIn terms of population, North Dakota is among the smaller states in the U.S. In 2000, the U.S. Census Bureau reported that North Dakota had a population of 641,183. By 2010, the population had grown to 672,591, representing an average annual growth rate of approximately 0.5 percent. Compared to national trends, North Dakota’s population growth lags significantly. From 2000 to 2010, the U.S. population grew at an average annual growth rate of 0.9 percent. North Dakota’s slow population growth is reflected at the county level, where only 10 out of the state’s 53 counties showed an increase in population over the past decade. Figure 2 illustrates population growth rates for North Dakota by county from 2000 to 2010. As can be seen in the figure, the fastest growing counties are those counties with large cities, such as Cass County (Fargo), and Burleigh County (Bismarck).
Future population projections based on U.S. Census data indicate that the population growth trends experienced from 2000 to 2010 will slow even more. North Dakota’s population as a whole is expected to grow at an average annual rate of only 0.2 percent from 2010 to 2020. The national population is expected to grow at an annual rate of 1.0 percent. Even though North Dakota’s population growth is expected to slow over the next decade, it is expected to distribute that slow growth more evenly among its counties than has occurred historically.
From 2010 to 2020, North Dakota is projected to show positive growth in 22 of its 53 counties. As in the past decade, future population growth is expected to be highest in counties with large cities, such as Cass County and Burleigh County. Figure 3 shows population growth rate forecasts for North Dakota by county from 2010 to 2020. Counties expected to see the largest declines in population are concentrated in the southeast part of the state, and in west central parts of the state.
Despite North Dakota’s slow growth population, it has thrived financially, as illustrated in the following sections that examine several economic measures of the state.

10
Fig
ure
2:
2000
-201
0 N
orth
Dak
ota
Pop
ula
tion
Gro
wth
Sou
rce:
Wilb
ur S
mit
h A
ssoc
iate
s; U
.S. C
ensu
s B
urea
u

11
Fig
ure
3:
2010
-202
0 N
orth
Dak
ota
Pop
ula
tion
Gro
wth
For
ecas
t
Sou
rce:
Wilb
ur S
mit
h A
ssoc
iate
s; U
.S. C
ensu
s B
urea
u; W
oods
& P
oole
Eco
nom
ics,
Inc.

12
Gross State Product And Industry MixNorth Dakota’s Gross State Product (the state equivalent of Gross Domestic Product) in 2009 was nearly $31.9 billion. This was an increase of 6.7 percent annually from $17.8 billion in 2000.
By comparison, the national Gross Domestic Product grew 4.1 percent annually during the same period. The economy of North Dakota is relatively diversified as no single industry, with the exception of government, represents more than 10 percent of the gross state product.
Historically, a major sector of North Dakota’s economy has been agriculture, driven by the global demand for grain and food exports. The major crops raised in North Dakota include sunflower seeds, barley, and wheat. Energy is also a major part of North Dakota’s economy. The Bakken Formation in the western part of the state is a focal point for oil extraction and exploration efforts. Wind energy is also a developing industry in North Dakota, thanks to the state’s open areas.
Government is the largest sector of North Dakota’s economy, as local, state, and federal governments constitute more than 14 percent of the gross state product, as shown in Table 2. The next largest sectors are agriculture and health care, both of which contribute 8.4 percent to North Dakota’s economy. Trade, in the form of wholesale and retail, add 6.9 percent and 6.7 percent to the state’s gross domestic product.
Durable goods manufacturing rounds out those industries in North Dakota that comprise more than 6 percent of the state’s gross product, with 6.4 percent. Aerospace plays a major role in the productivity of durable goods manufacturing, as several large aviation corporations have manufacturing facilities in North Dakota, including Goodrich Cargo Systems; Killdeer Mountain Manufacturing, an aircraft parts manufacturer; and Cirrus Design, producer of high performance, four-seat, single-engine aircraft.

13
Table 2: North Dakota Gross State Product by Industry For 2008
IndustryGross State Product
(In Millions)Percent
Agriculture, Forestry, Fishing, and Hunting $2.7 8.4%
Mining $1.0 4.0%
Utilities $0.9 2.7%
Construction $1.4 4.5%
Durable Goods Manufacturing $1.6 6.4%
Non-durable Goods Manufacturing $1.1 2.7%
Wholesale Trade $2.4 6.9%
Retail Trade $2.0 6.7%
Transportation and Warehousing $1.4 4.6%
Information $1.0 3.2%
Finance and Insurance $2.2 5.3%
Real Estate, Rental, and Leasing $3.5 8.1%
Professional and Technical Services $1.1 3.4%
Management of Companies $0.3 1.0%
Administrative and Waste Service $0.5 1.6%
Educational Services $0.1 0.4%
Health Care and Social Assistance $2.7 8.4%
Arts, Entertainment, and Recreation $0.1 0.5%
Accommodation and Food Services $0.8 2.4%
Other Services $0.8 2.1%
Government $4.4 14.1%
TOTAl $31.9 100.0%Source: US Bureau of Economic Analysis, December 2010.
EmploymentIn 2009, the workforce in North Dakota totaled 491,889 workers. This was an increase of 1.2 percent annually from the 2000 level of 443,449 employees. This growth in jobs was double that of the national annual average growth rate of 0.6 percent. Table 3 presents employment in North Dakota categorized by industry for the year 2009.
Despite the recent economic woes that have driven the 2009 national unemployment rate to 9.3 percent, workers are in demand in North Dakota, as indicated by the state’s 2009 unemployment rate of 4.3 percent, the lowest of any state in the country. The most recent data for November 2010 indicates that the hiring trend in North Dakota has continued, with the state’s unemployment rate dropping to 3.8 percent, while the national unemployment rate rose to 9.8 percent.
Part of this growth is the result of North Dakota’s focus on expanding agriculture, advanced manufacturing, technology-based businesses, energy, and tourism.1 Aviation has a role in all of these industries, from crop dusting operations, to research and development of unmanned aerial systems (UAS), to providing transportation for everyone from oil exploration workers to tourists.
1 What’s North Dakota’s Secret, June 30, 2009, Forbes.com

14
Table 3: North Dakota Employment by Industry For 2009
Industry Employment Percent
Agriculture, Forestry, Fishing, and Hunting 35,131 7.1%
Mining 9,531 1.9%
Utilities 3,481 0.7%
Construction 28,980 5.9%
Durable Goods Manufacturing 16,187 3.3%
Non-durable Goods Manufacturing 8,649 1.8%
Wholesale Trade 21,309 4.3%
Retail Trade 53,131 10.8%
Transportation and Warehousing 15,769 3.2%
Information 8,425 1.7%
Finance and Insurance 24,961 5.1%
Real Estate, Rental, and Leasing 15,571 3.2%
Professional and Technical Services 19,173 3.9%
Management of Companies 4,389 0.9%
Administrative and Waste Service 16,741 3.4%
Educational Services 5,178 1.1%
Health Care and Social Assistance 58,767 11.9%
Arts, Entertainment, and Recreation 7,138 1.5%
Accommodation and Food Services 32,871 6.7%
Other Services 24,701 5.0%
Government 81,806 16.6%
TOTAl 491,889 100%Source: US Bureau of Economic Analysis, December 2010
Per Capita Personal IncomePersonal income can be used as an indication of how much people will spend on the consumption of goods and services, including aviation. It can be assumed that the greater the amount of income, the greater the purchasing power one has. Per capita personal income for the state of North Dakota was approximately $25,100 in 2000, and grew to an estimated $40,800 by 2010. The change in this figure represents an annual growth rate of 5.0 percent. By comparison, per capita personal income for the U.S. as a whole grew at a 3.4 percent annual growth rate. The state’s focus on developing and attracting industries with higher average pay, such as UAS firms, is largely responsible for the state’s per capita income growing faster than the national average.
North Dakota’s estimated per capita income of $40,800 in 2010 was slightly behind the national average of $41,800. This would indicate that continued emphasis on high tech business with above average paying jobs, many of which are found in the aviation industry, would result in North Dakota’s per capita income continuing to grow faster than the national average.
In summary, North Dakota has a population that is growing slower than the national average. However, it is a population that is expected to have greater job opportunities than other states, and experience rising pay scales. This will likely result in an expanding economy for North Dakota and its citizens, one that can be expected to grow faster than the national average.

15
sTudy approaChThe total economic impact of each airport in this analysis is quantified in terms of employment, payroll, and output. Output represents total spending or economic activity and accounts for the total value of aviation-related activities supported by the airports included in this analysis. This section presents the economic impact of the airports in terms of three aviation-dependent groups:
•Airport operations and on-airport activities
•Visitors traveling to North Dakota via commercial airlines
•Visitors traveling to/within North Dakota via general aviation aircraft
Airport operations and on-airport activities, as well as North Dakota visitors, are responsible for a significant percentage of the economic activity or benefit associated with the airports. However, other aspects of aviation make significant contributions to the state’s economy.
Several industry sectors that are not based on airports but still rely on aviation create economic benefits. These industries are off-airport aerospace manufacturing, off-airport aerial applicators, and travel agencies. Surveys were sent to these businesses to estimate the economic impact they provide in North Dakota.
Many hospitals routinely use aviation to provide health services. A survey of North Dakota hospitals was performed as part of this study to qualitatively assess how those hospitals use aviation, their local airports and any helipad associated with the hospital.
The Economic Modeling ProcessAll economic impacts from the 89 airports considered in this analysis were calculated using an input-output model. The input-output model considers economic benefits associated with on-airport activities, commercial service visitors, and general aviation visitors arriving at the airports. Impacts are discussed as:
First round Impacts – First round impacts include benefits associated with businesses located at the airport, which are directly related to the provision of general aviation services. These impacts include the employment, payroll, and spending of businesses such as fixed base operators (FBOs), flight schools, aircraft repair facilities, and on-airport government entities, including airport management and operations staff. Capital expenditures are also included in first round impacts.
First round impacts also occur as a result of air travel (both scheduled commercial and general aviation), but generally take place off-airport. These impacts are attributed to the expenditures of visitors who arrive in North Dakota by air. Visitor expenditures support employment and payroll in service-related industries such as lodging, food and beverage, retail, and entertainment. Certain visitor spending for aviation-related goods and services (such as avgas purchases by visiting general aviation pilots) is not accounted for in the visitor expenses. Instead, it is included in the appropriate FBO’s economic impacts.
Secondary Impacts – Secondary impacts consist of induced impacts. Induced impacts are the benefits resulting from the re-circulation of on-airport and visitor spending impacts within the economy. This re-circulation is typically referred to as the multiplier effect. For example, as airport employees spend their salary for housing, food, and services, those expenditures circulate through the economy resulting in increased spending, payroll, and employment throughout North Dakota. As this money is spent over and over again, some of it leaks beyond the boundaries of North

16
Dakota, and thus no longer benefits the state’s citizens. The economic model uses parameters specific to North Dakota to estimate the leakage effect associated with these secondary impacts.
Total Impacts – Total impacts are the sum of all first round (on-airport and visitor spending) and secondary (induced) economic activities attributable to an airport or the system of airports.
The Regional Input-Output Modeling System (RIMS II) model was used to measure the multiplier effect and to quantify induced impacts. An input-output model, in its most basic form, is a linear model that estimates purchases and sales between various sectors of the economy. This modeling process is considered to be one of the leading methods available for estimating the total economic impact of an industry (in this case, airports). The U.S. Bureau of Economic Analysis (BEA) initially developed the RIMS system in the 1970s. BEA updated the model in the 1980s, calling it RIMS II. It is now considered one of the standard methods for evaluating the economic contribution of public facilities.
The RIMS II model contains a large economic database that is used to generate input-output tables. RIMS II multipliers and data tables specific to North Dakota’s industrial sectors were obtained and used in this analysis. The RIMS II input-output model used for this analysis requires impact estimates for three separate components of the economy. These categories are:
Employment – Employment is based on the total of full-time jobs plus part-time jobs. In this analysis, two part-time positions are the equivalent of a single full-time position.
Payroll – Payroll represents the annual salary, wages, and benefits paid to all employees.
Economic Output (Spending) – Output for on-airport activities is typically assumed to be the sum of annual gross sales and average annual capital expenditures. While this assumption works well for profit-oriented tenants, it must be modified for organizations that do not generate sales, such as government tenants or corporate flight departments. In order to estimate the impact of these important tenant-related activities, output is assumed to be the sum of payroll, operating expenditures, and average annual capital improvement outlays. While airlines do generate sales, ticket revenue is usually transferred outside the area being modeled. This makes it difficult to assign that revenue to specific airports, so airlines are treated in a manner similar to organizations that do not generate sales. For visitors using an airport, output is assumed to equal visitor spending.
It is important to note that payroll and output cannot be combined because elements of economic benefit related to payroll are also contained, to some extent, in the output estimate. Each of the three impact components (employment, payroll, and output) stands alone as a measure of an airport’s or the airport system’s total economic impact.
Data requirements For The Economic Modeling ProcessA number of data collection efforts were undertaken to gather information related to economic activity occurring at the North Dakota airports considered in this analysis. These data were inputs to the modeling process to identify total economic impacts. The following groups were part of the data gathering effort to estimate first round impacts:
Airport Operations – This group includes airport tenants that are businesses with employees, such as airlines, FBOs, flight schools, concessionaires, airport restaurants, and governmental agencies. Governmental agencies include public airport sponsors, Federal Aviation Administration (FAA), as well as various other state and federal agencies.

17
Commercial Service visitors – This group includes estimated non-local passengers (visitors) arriving via commercial airlines. Average visitor spending for this group was estimated from passenger surveys conducted for this analysis at all eight of North Dakota’s commercial service airports, along with data from other economic impact studies.
General Aviation visitors – Impacts from general aviation visitors are produced by non-local passengers arriving via private or business aircraft. General aviation visitors are associated with that portion of each airport’s itinerant general aviation operations that are transient (or visiting) in nature. Itinerant operations are those that leave the airport’s local airspace. Some itinerant operations at an airport are attributable to residents of the airport’s market area who fly their planes to more distant locations and subsequently return to their home airport. The remaining itinerant operations are attributed to visitors. Itinerant operations performed by visitors are considered transient operations. Impacts for this group were estimated using survey data from airports across North Dakota.
Construction Impacts – Each year, airports undertake capital improvement projects (CIP), such as runway rehabilitation or terminal improvements. In addition, businesses and other agencies undertake capital improvement projects. These projects employ persons in jobs such as construction, architecture, engineering, and consulting. For this analysis, construction impacts are included in the first round impact category. The following steps were used to estimate construction impacts:
1. CIP data for 2008-2010 was gathered from airport managers as well as aviation-related businesses and government agencies located on each airport.
2. CIP data for the period was averaged to avoid showing peaks or troughs in construction activity.
3. The RIMS II model indicates that every $1 million spent annually on construction activity sup-ports approximately 9.5 construction-related jobs in North Dakota. These jobs include construc-tion workers, equipment operators, foremen, engineers, architects, and managers.
4. Data from the U.S. Bureau of Labor Statistics was used to determine average pay for con-struction workers in North Dakota, and this average was applied to each construction-related employee to determine payroll related to CIP activity.
First round economic impacts presented in this report were estimated primarily through surveys undertaken specifically to support this study. RIMS II multipliers were then applied to first round impacts to estimate subsequent secondary economic impacts.
Surveys, Data Collection Methods, And Model AssumptionsThe model requires an extensive data gathering effort in order to estimate first round impacts. Those efforts and their results are explained, along with the assumptions needed to arrive at first round impacts.

18
The methods used to collect information from each group considered in the first round impacts are discussed in the ensuing sections, followed by an explanation of the secondary impacts resulting from the re-circulation of the first round impacts.
Airport Operations And On-Airport ActivitiesAirport sponsors/owners were contacted to provide names, mailing addresses, and telephone numbers for each airport tenant. All airport tenant/businesses having aviation-related employees on North Dakota airports during 2010 were contacted to collect information regarding their economic activity. Since the purpose of this study was to measure the economic impacts of each North Dakota airport, a distinction was made between those on-airport tenants that depended on the airport and those that did not. For example, an insurance business located on an airport would not be designated as aviation-related since an insurance business does not need an airport to operate. A survey was provided to each aviation-related tenant and follow-up calls were made to obtain responses and to verify information on returned surveys. Airport tenants at each airport were grouped into 24 categories to aid in analysis. These categories consisted of:
•Airlines (passenger only)
•Aerial applicators
•Air ambulances
•Air cargo
•Aircraft maintenance
•Airport management (subdivided into large and small airports based on employment)
•Air traffic control (this was subdivided into public, i.e., FAA, and private ATC)
•Charter
•Concessions
•Corporate flight departments
• FBOs (this was subdivided into small and
large FBO categories based on employment)
• Federal government (not including ATC or TSA)
• Flight instruction (this was subdivided into independent flight schools and those associ-ated with colleges/universities)
•Ground transportation
•Hangar rental/development
•Military
•Parking
•Rental car
•State/local government
• Transportation Security Administration
The survey sent to each airport tenant, including airport sponsors/managers, requested the following information:
• Type of aviation activity conducted by the business/tenant
•Number of full-time and part-time employees
• Estimated total annual wages and benefits paid to employees in 2010
• Estimated total capital improvement expenditures for each year, 2008 through 2010
• Estimated total operating expenses (excluding payroll and capital improvements previously

19
identified) for 2010
• Estimated total gross sales (where applicable) by the business on the airport in 2010
In addition, on-airport entities were asked to identify any businesses that sub-lease property from them so that they could be included in the analysis.
A high response rate was desired for the airport tenant/business survey. Several rounds of follow-up telephone calls were made to non-responding entities and to airport managers to obtain the greatest response rate possible for on-airport employment. For airport tenant/businesses who did not supply complete information on payroll, expenses, output, and CIP, estimates were developed using ratios of payroll, expenses, output, and CIP per employee. These ratios were developed from survey data obtained from those tenants and businesses who did respond to the survey. For those categories of tenants that did not have sufficient North Dakota data to provide reliable averages, additional data was used from economic studies conducted in nearby states.
For purposes of estimating secondary impacts, airport tenants were classified into one of three categories (aviation, concession, and government), based upon the nature of their business. This was done to facilitate subsequent RIMS II modeling of secondary impact multipliers. For this analysis, a set of aviation multipliers was used for airlines, aircraft maintenance, FBOs, air cargo, flight schools, and corporate flight departments. Retail, food and beverage, car rental, and parking tenants had a set of concession multipliers applied to estimate secondary impacts. Government related entities, including military units, received their own set of multipliers for estimating secondary impacts. Impacts stemming from construction projects were broken out from each tenant so a set of construction-related multipliers could be used before adding those impacts back into the on-airport benefits.
Commercial Service VisitorsAirline flights to and from North Dakota’s commercial service airports provide access for business- and leisure-related visitors. Visitors using commercial service airports as a gateway to the state contribute to the economy through their expenditures for food, lodging, entertainment, transportation, retail sales, and other goods and services. Numerous service industries also benefit from the multiplier or spin-off effects stemming from visitor spending. North Dakota is home to eight commercial service airports. The busiest airports in Bismarck and Fargo provide air service to many destinations, such as major hubs in Denver and Minneapolis. The smaller communities of Devils Lake, Dickinson, and Jamestown have more limited airline service subsidized through the FAA’s Essential Air Service program. The cities of Grand Forks, Minot, and Williston serve their region with commercial service, with Minot providing air transportation for many military members serving on the air force base.
The spending patterns of commercial service visitors to North Dakota were estimated based on the results of departing passenger surveys at each of the eight commercial service airports. More than 1,000 passengers were surveyed, with responses coming from each airport proportional to the number of enplaned passengers.

20
During passenger surveys, departing passengers were interviewed prior to boarding and asked several questions. Departing passengers were first asked to indicate whether they were a resident of the airport area or a visitor. Those passengers who indicated that they were visitors were asked several questions to determine the following:
• The purpose of their trip (e.g., business, personal, military)
•Duration of their stay
• Total expenditures during their stay in each of the following categories: lodging, food and bever-age, rental car or taxi, retail, entertainment/recreation, and other
• The total number of people that accounted for the expenditure estimates they identified
For each commercial service airport, the following methodology was used to estimate commercial service visitor impacts.
Airport managers estimated enplanements for 2010 using data through July of 2010. The percentage of visiting passengers was estimated for each airport, using a sampling of FAA origin and destination data from 2009. This data for each airport is shown in Table 4. Visiting passengers ranged from 39 percent at Grand Forks International Airport to 59 percent at Dickinson-Theodore Roosevelt Regional Airport.
Table 4: Enplanements & Percent visitors at North Dakota Commercial Service Airports - 2010Associated City Enplanements Percent Visitors Visitors
COMMErCIAl SErvICE AIrPOrTS
Bismarck 190,000 42% 79,040
Devils Lake Regional 4,300 52% 2,249
Dickinson-Theodore Roosevelt Regional 10,000 59% 5,910
Hector International 370,000 40% 147,630
Grand Forks International 113,280 39% 44,519
Jamestown Regional 4,300 41% 1,767
Minot International 74,500 46% 33,898
Sloulin Field International 14,439 55% 7,970
TOTAl 780,819 41% 322,983 Source: NDAC records and FAA O&D data. Prepared: September 2010.
Using survey data gathered from departing airline passengers at each North Dakota commercial service airport, average length of stay and average daily expenditures (less rental car expenditures, which are captured in the on-airport impacts of the rental car companies) were estimated for each airport. These estimates were applied to the number of annual visitors for each airport to determine total economic activity (or output) generated by commercial airline visitors on an annual basis.
The following example demonstrates the calculations used to estimate commercial service visitor impacts. For ease of reading, rounded numbers are used and any variation in calculations are the result of rounding.
An estimated 113,280 enplaned passengers flew out of Grand Forks International Airport during 2010. Passenger survey data indicates that 39.3 percent of these enplanements were visitors to the area, or approximately 44,520 visitors travelled through Grand Forks International Airport.

21
113,280 enplanements x 39.3 percent visitors = 44,520 visitors
Survey data from Grand Forks International Airport provided an estimated average spending of $220 per visitor during their stay. This average was used to calculate visitors’ annual spending (or output) of approximately $9.8 million.
44,520 visitors x $220 per visitor per stay = $9.8 million
In order to estimate employment associated with commercial service visitor expenditures, North Dakota specific employment ratios per $1 million of visitor output were developed using the RIMS II model. It was estimated that approximately 19.4 persons were employed in North Dakota as result of every $1 million in commercial service visitor output. That results in an estimated 190 visitor-related jobs associated with the spending by visitors arriving via Grand Forks International Airport on commercial airlines.
$9.8 million x 19.4 ÷ $1,000,000 = 190 jobs
In order to estimate payroll impacts associated with employment supported by commercial service visitors, average state wages for appropriate industry sectors were applied to the estimated number of employees supported by commercial airline visitor spending. Most visitor expenditures take place in the hotel/motel, food/beverage, entertainment, retail, and transportation sectors. Based on data obtained from the U.S. Bureau of Labor Statistics, an average payroll of $21,400 per employee in North Dakota was assumed for these job categories.
190 jobs x $21,400 = $4.1 million annual payroll
The same calculation was used for each commercial service airport, using the average expenditure per visitor per trip as appropriate. Detailed tables showing the commercial service visitor impacts at each commercial service airport can be found in the appendix at the end of this report.
General Aviation Visitors General aviation refers to all segments of aircraft activity that are not related to the commercial airlines or the military. Visitors to North Dakota use general aviation aircraft to enjoy both the leisure opportunities available in North Dakota as well as to conduct business.
The North Dakota Aeronautics Commission supports the Fly North Dakota Airports Passport Program that encourages pilots to visit all airports in the state while also promoting aviation safety and history.
The economic activity produced by general aviation visitors in North Dakota was determined by surveying transient pilots and passengers. Surveys were delivered to FBO managers throughout the state system of airports. The survey requested the following information:
• The airport where the survey was received
• The number of travelers in the aircraft

22
• The type of aircraft
• The purpose of the trip
• The length of stay in the airport area
• The estimated expenditures during the trip
•Where the aircraft is based
• The approximate number of annual trips in general aviation aircraft made by the pilot for busi-ness, pleasure, and training purposes
• Further comments regarding the value of the North Dakota aviation system to the pilot and his or her business
This survey data was used to develop an estimate of visitor expenditures. These estimates included the average number of visitors per aircraft, and the average expenditure per visitor per trip. Recognizing that these averages vary at different types of airports, North Dakota’s airports were grouped into one of four categories based initially on the airport’s classification in the state system plan. Survey data within each group of airports was used to estimate the average number of visitors per arriving aircraft, how long those visitors stayed, and how much each spent during their stay.
Some airports were then shifted to a category with higher spending averages based on the presence of significant oil, wind, or other energy enterprises in the area. Certain airports were identified as providing access to popular hunting areas or lodges and were shifted to categories with higher average visitor spending.
Data from the state’s most recent system plan were used to develop estimates at each airport of itinerant aircraft operations, which are operations by aircraft coming from another airport. Since many of these operations are aircraft that are returning to their home base, an estimate of true transient aircraft was needed. It was assumed that between 33 percent and 50 percent of itinerant aircraft operations were true transients, depending upon the airport, based on reviews with NDAC staff. Together, all of these estimates were used to assess the level of general aviation visitor spending at each airport as illustrated in the following example.
Harry Stern Airport in Wahpeton was estimated to have approximately 5,900 itinerant operations in 2010, or 2,950 annual itinerant arrivals (since it is assumed that all arrivals have a corresponding departure). Furthermore, it was assumed that 50 percent of these itinerant arrivals were true transient arrivals, or:
2,950 itinerant arrivals x 50 percent = 1,475 transient arrivals.
Transient pilot survey data for the group of airports including Harry Stern provided estimates of the average number of visitors per aircraft, including the pilot (2.5 visitors), and the average spending ($50 per visitor per trip). These averages were used to calculate the total annual visitors (3,688 visitors) and the impacts of those visitors spending in the region around Harry Stern, or approximately $184,375 per year. It should be noted that visitor spending does not include purchases on the airport. For example, FBO services or fuel purchases are removed from this calculation. These are included in the direct impacts associated with each on-airport tenant.
1,475 transient arrivals x 2.5 visitors per arrival = 3,688 visitors
3,688 visitors x $50 per visitor = $184,375 annual spending by visitors to Harry Stern Airport

23
To determine payroll and employment impacts resulting from this visitor spending (or output), multiplier ratios based on $1 million of output were used. In other words, ratios developed by the input-output model indicate that for every $1 million of general aviation visitor output, approximately 23.0 full-time positions in other industries are created. Most of these jobs are in the service and retail sectors. Visitors using general aviation at Harry Stern Airport would then support approximately 4.2 full-time positions.
$184,375 x 23.0 jobs ÷ $1,000,000 = 4.2 jobs
The average annual statewide salary for service/retail industries ($21,400) was then applied to the estimate of employment to calculate the payroll impacts associated with general aviation visitors. In this example, visitor-related payroll created by the 4.2 full-time positions is estimated to total approximately $86,200
4.2 jobs x $21,400 = $90,600 annual payroll
The operational and visitor impact data for each study airport can be found in the appendix at the end of this report.
Study Multipliers – Secondary ImpactsEmployment, payroll, and output impacts derived from on-airport businesses/tenants and activities, as well as visitors, comprise each airport’s first round economic impacts. As these impacts enter the economy, they circulate among other sectors, creating a secondary impact of additional spending beyond the first round. This phenomenon is referred to the multiplier effect.
Multiplier effects arise from various interdependencies within an economic system. For example, the operation of an airport requires inputs in the form of supplies, equipment, and maintenance. These inputs generate a boost in sales for those businesses providing these services and products. Moreover, the goods and services themselves require inputs for their production. The process continues as a large number of impacts re-circulate through the economy. The total requirement for goods and services is the multiple of the initial needs of the airports considered in this analysis; hence it is referred to using the term “multiplier.”
Multipliers for estimating secondary impacts were derived from the RIMS II model. The multipliers used in this analysis were developed specifically to measure the economic impacts that occur within different sectors of the North Dakota economy. Table 5 summarizes the multipliers used for modeling the secondary impacts of on-airport activities and visitor spending.

24
Table 5: North Dakota rIMS II Multipliers by Economy Sector
Economy SectorEmployment
MultiplierPayroll
MultiplierOutput
Multiplier
Government 1.96 1.77 1.77
Construction C.I.P. (Note 1) 1.64 1.51 1.64
Concessions (Note 2) 1.28 1.52 1.61
Aviation (Note 3) 2.22 1.75 1.64
Commercial Service Visitor Expenditures (Note 4) 1.34 1.57 1.62
General Aviation Visitor Expenditures (Note 4) 1.27 1.57 1.65Sources: Wilbur Smith Associates and RIMS II multipliers.Notes: 1. Construction multipliers are the weighted average of the Construction; Architectural, Engineering, and Related Services; and Commercial and
Industrial Machinery and Equipment Repair and Maintenance multipliers.2. Concessions multipliers are the weighted average of the Retail Trade; Business Support Services; Hotels and Motels, including Casino Hotels;
and Food Services and Drinking Places multipliers.3. Aviation multipliers are the weighted average of the Aircraft Manufacturing; Aircraft Engine and Engine Parts Manufacturing; Other Aircraft
Parts and Auxiliary Equipment Manufacturing; and Air Transportation multipliers.4. Visitor expenditures multipliers are the weighted average of the Retail Trade; Automotive Equipment Rental and Leasing; Hotels and Motels,
including Casino Hotels; and Food Services and Drinking Places multipliers. Weightings were different for commercial service and general aviation visitor multipliers to reflect the difference in their spending habits.
Prepared: December 2010.
The multipliers presented in Table 5 were used to estimate secondary impacts in this analysis. For example, $100 in first round expenditures (output) in the aviation sector supports a total output impact equivalent to $164. In this example, secondary impacts would be $64 ($164 minus $100).
The methodology discussed in this section was applied to each of the study airports. By following this methodology, estimates of total employment, annual payroll, and annual output/spending associated with each airport were developed.
employmenT, payroll, and ouTpuT impaCTs for sTudy airporTsThe airports in this analysis help to accommodate the travel needs of business and leisure visitors to North Dakota. The airports themselves are also significant generators of economic activity. Airports help to support jobs, payroll, and output for North Dakota’s economy. The following sections discuss economic impacts associated with employment, annual payroll, and total annual economic activity (output) for study airports. The combined impact of all of North Dakota’s 89 airports is shown in each section. Detailed tables showing the impacts of each individual airport can be found in the appendix at the end of this report.
Employment ImpactsThe findings of this analysis indicate that airports in North Dakota are an important source of jobs. Employment, as defined in this analysis, is based on estimates where part-time jobs are treated as half of a full-time job. Employment impacts are calculated for on-airport businesses/tenants and for visitor-related spending. On-airport activity includes private businesses and government agencies. For on-airport military units with an aviation-related mission, their employment was also considered. Spending for capital improvement projects (CIP) and other improvement and construction projects also contributes to on-airport employment.

25
Employment from On-Airport ActivityTable 6 identifies the total number of jobs supported by on-airport aviation-related tenants and businesses at system airports. These jobs comprise those people who are engaged in the provision of aviation-related services on the airport, such as aircraft fuel sales, aircraft maintenance, flight training, aircraft manufacturing, and charter services. In the case of the North Dakota Air National Guard at Hector International, the full and part-time military personnel associated with aviation-related activities were included, with the substantial number of drilling reservists treated as part-time employees. In addition, construction workers supported by airport CIPs were included in this analysis.
In total, there are 3,377 first round jobs supported by the operation of North Dakota’s airports. It is important to note that this employment estimate does not include jobs associated with non-aviation businesses which, for various reasons, are located on an airport. For instance, some airports have industrial or business parks that include companies that are not related to the airport or aviation in any way. Additionally, businesses were not included if they were not on airport property. The most significant example of this is the Goodrich Cargo Systems facility in Jamestown, which is not inside the airport fence and not included among the on-airport impacts.2 Employment related to these businesses is not included in the employment estimate shown in Table 6.
Table 6: North Dakota On-Airport Employment
First RoundEmployment
SecondaryEmployment
TotalEmployment
Commercial Service Airports On-Airport Employment 2,945 2,796 5,741
General Aviation Airports On-Airport Employment 432 409 841
TOTAl ON-AIrPOrT EMPlOyMENT 3,377 3,205 6,582 Source: Wilbur Smith Associates and RIMS II multipliers.Prepared: December 2010.
Secondary impacts are those jobs that are created by multiplier effects stemming from first round jobs associated with tenants and businesses at North Dakota’s airports. For example, an employee of a fuel distributor may owe a portion of his job to an airport since the distributor sells fuel to the airport’s FBO. As a result of on-airport tenant activity, additional secondary employment is created. Secondary impacts associated with the day-to-day operation of North Dakota’s airports add 3,205 positions to the economy. When first round and secondary employment is considered, North Dakota’s airport tenants contributed 6,582 jobs to North Dakota’s employment base. Of this total, 5,741 jobs are associated with the commercial service airports and 841 jobs are associated with the general aviation airports.
Employment from Commercial Service Visitor SpendingVisitors arriving via commercial airlines spend money, which supports jobs beyond those found at the airport. Table 7 identifies the number of employees in North Dakota whose jobs are supported by the spending of visitors arriving on commercial airlines via North Dakota’s eight airports with commercial service.
2 The Goodrich Cargo Systems impacts are included in the off-airport aerospace manufacturing analysis, found later in this report.

26
Table 7: North Dakota Employment from Commercial Service visitor Spending
First RoundEmployment
SecondaryEmployment
TotalEmployment
Commercial Service Visitor Employment 2,033 684 2,717 Sources: Wilbur Smith Associates and RIMS II multipliers.Prepared: December 2010.
As previously discussed, it is possible to calculate visitor spending, and subsequently, the number of jobs supported by visitors. First round jobs supported by visitor spending are attributed to a variety of sectors; however, most of the jobs are concentrated in the hotel/motel, restaurant, leisure and entertainment, and retail sectors.
There are an estimated 2,033 first round jobs directly supported by commercial service visitor spending. Secondary impacts include those jobs that exist due to the multiplier effect. Secondary impacts result in 684 additional positions supported by the spending of commercial service visitors. When first round and secondary visitor-related employment impacts are combined, approximately 2,717 jobs are supported by spending from visitors to North Dakota who arrive via the commercial airlines.
Employment from General Aviation Visitor SpendingSimilar to visitors using commercial airline service, intra-state and inter-state visitors using general aviation aircraft typically spend money while visiting, thereby helping to support additional employment. Table 8 identifies the number of North Dakota jobs supported by spending from visitors using general aviation aircraft to travel to the state.
Table 8: North Dakota Employment from General Aviation visitor Spending
First RoundEmployment
SecondaryEmployment
TotalEmployment
Commercial Service Airport General Aviation Visitor Employment 323 91 414
General Aviation Airport Visitor Employment 63 16 79
TOTAl GENErAl AvIATION vISITOr EMPlOyMENT 386 107 493Source: Wilbur Smith Associates and RIMS II multipliers.Prepared: December 2010.
First round jobs associated with general aviation visitor spending are usually found off-airport and are attributed to a variety of sectors; however, most of these jobs are concentrated in the hotel/motel, restaurant, recreational and entertainment, and retail sectors. As a result of general aviation visitor expenditures in North Dakota, there are 386 first round jobs supported in North Dakota.
Secondary employment includes those jobs that exist due to continued circulation (multiplier impact) of general aviation visitor expenditures. Secondary impacts result in 107 additional jobs. When first round and secondary general aviation visitor-related employment impacts are combined, 493 jobs are supported by the spending of visitors using general aviation aircraft in North Dakota.
Total EmploymentTable 9 identifies the total number of jobs supported by activities at study airports. As a result of on-airport activities and spending by visitors using the study airports, there are 5,796 first round

27
jobs. The multiplier effect (secondary impact) adds 3,996 additional jobs. In total, 9,792 jobs are supported in North Dakota by aviation-related operators, businesses, and visitors to the study airports.
Table 9: North Dakota Total Airport Employment
Total First RoundEmployment
Total SecondaryEmployment
TotalEmployment
Commercial Service Airport Employment 5,301 3,571 8,872
General Aviation Airport Employment 495 425 920
TOTAl EMPlOyMENT 5,796 3,996 9,792 Source: Wilbur Smith Associates and RIMS II multipliers.Prepared: December 2010.
Payroll ImpactsEmployment linked to study airports results in a significant annual payroll benefit to North Dakota’s economy. Payroll impacts relate to the previously identified employment associated with on-airport businesses and their activities, commercial service visitor spending, and general aviation visitor spending.
Payroll from On-Airport Activity Table 10 identifies annual payroll benefits associated with on-airport activity at each of the study airports.
Table 10: North Dakota On-Airport Activity PayrollFirst Round
PayrollSecondary
PayrollTotal
Payroll
Commercial Service Airports On-Airport Payroll $ 151,254,500 $ 109,971,000 $ 261,225,500
General Aviation Airports On-Airport Payroll $ 13,914,400 $ 9,412,300 $ 23,326,700
TOTAl ON-AIrPOrT PAyrOll $ 165,168,900 $ 119,383,300 $ 284,552,200 Sources: Wilbur Smith Associates and RIMS II multipliers.Prepared: December 2010.
Payroll supported by airport construction projects, and on-airport payroll from the North Dakota Air National Guard at Hector International are also included.
This study shows that first round annual payroll impacts are nearly $165.2 million. This payroll impact ripples throughout the North Dakota economy, creating secondary payroll impacts that can be measured through the RIMS II model. The secondary annual payroll impact related to on-airport tenants and businesses at the study airports, estimated through the RIMS II multipliers, is approximately $119.4 million. Total payroll impacts produced by airports, which include first round and secondary annual payroll, are approximately $284.6 million annually.
Payroll from Commercial Service Visitor SpendingTable 11 identifies the annual payroll impact attributed to employees whose jobs are supported by spending by commercial service visitors using the study airports.

28
Table 11: North Dakota Annual Payroll from Commercial Service visitor Spending
First RoundPayroll
SecondaryPayroll
TotalPayroll
Commercial Service Visitor Payroll $43,506,200 $24,810,200 $68,316,400 Sources: Wilbur Smith Associates and RIMS II multipliers.Prepared: December 2010.
First round payroll consists of wages and benefits paid to employees working at restaurants, hotels/motels, retail businesses, and other service industries that are used by commercial service visitors. First round annual payroll attributable to spending by commercial service visitors is estimated at more than $43.5 million.
As employees in the service industries spend their earnings, the money continues to circulate in North Dakota, generating additional employment and subsequent payroll. Annual secondary payroll impacts associated with commercial service visitor-supported employment are estimated at more than $24.8 million. When first round and secondary annual payroll impacts stemming from commercial service visitor spending in North Dakota are combined, a total annual payroll impact in excess of $68.3 million is produced.
Payroll from General Aviation Visitor SpendingTable 12 identifies the payroll impacts attributed to spending by visitors using general aviation to reach North Dakota.
Table 12: North Dakota Annual Payroll from General Aviation visitor Spending
First RoundPayroll
SecondaryPayroll
TotalPayroll
Commercial Service Airport Payroll $ 6,922,300 $ 3,921,900 $ 10,844,200
General Aviation Airport Payroll $ 1,370,000 $ 776,600 $ 2,146,600
TOTAl GENErAl AvIATION vISITOr PAyrOll $ 8,292,300 $ 4,698,500 $ 12,990,800 Sources: Wilbur Smith Associates and RIMS II multipliers.Prepared: December 2010.
First round payroll includes salaries paid to employees working in visitor-related businesses and other service industries that are utilized by general aviation visitors. First round annual payroll attributable to spending by general aviation visitors is estimated at approximately $8.3 million.
As employees in the visitor-related industries spend their payroll, this spending continues to circulate, generating additional employment and subsequent payroll. The secondary annual payroll impact associated with general aviation visitor spending is estimated at approximately $4.7 million. When first round and secondary payroll impacts stemming from general aviation visitor spending are combined, a total payroll impact of approximately $13.0 million is produced.
Total Annual PayrollThe combined benefits of airport businesses/tenants, on-airport activities, commercial service visitor, and general aviation visitor-related payroll in North Dakota is identified in Table 13. The collective first round annual payroll impact supported by the study airports is nearly $217.0 million. With approximately $148.9 million in secondary annual payroll benefits, nearly $365.9 million in total annual payroll is realized in North Dakota as a result of visitor spending and on-airport activity associated with the study airports.
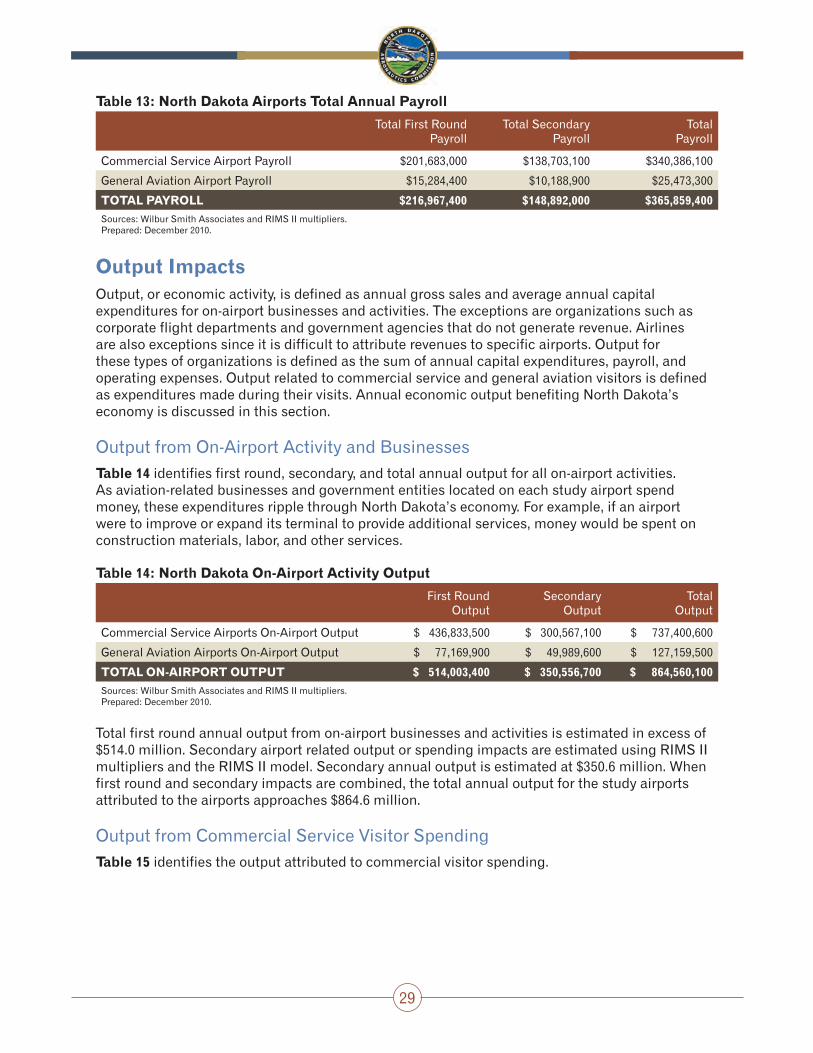
29
Table 13: North Dakota Airports Total Annual Payroll
Total First RoundPayroll
Total SecondaryPayroll
TotalPayroll
Commercial Service Airport Payroll $201,683,000 $138,703,100 $340,386,100
General Aviation Airport Payroll $15,284,400 $10,188,900 $25,473,300
TOTAl PAyrOll $216,967,400 $148,892,000 $365,859,400 Sources: Wilbur Smith Associates and RIMS II multipliers.Prepared: December 2010.
Output ImpactsOutput, or economic activity, is defined as annual gross sales and average annual capital expenditures for on-airport businesses and activities. The exceptions are organizations such as corporate flight departments and government agencies that do not generate revenue. Airlines are also exceptions since it is difficult to attribute revenues to specific airports. Output for these types of organizations is defined as the sum of annual capital expenditures, payroll, and operating expenses. Output related to commercial service and general aviation visitors is defined as expenditures made during their visits. Annual economic output benefiting North Dakota’s economy is discussed in this section.
Output from On-Airport Activity and Businesses Table 14 identifies first round, secondary, and total annual output for all on-airport activities. As aviation-related businesses and government entities located on each study airport spend money, these expenditures ripple through North Dakota’s economy. For example, if an airport were to improve or expand its terminal to provide additional services, money would be spent on construction materials, labor, and other services.
Table 14: North Dakota On-Airport Activity Output
First RoundOutput
SecondaryOutput
TotalOutput
Commercial Service Airports On-Airport Output $ 436,833,500 $ 300,567,100 $ 737,400,600
General Aviation Airports On-Airport Output $ 77,169,900 $ 49,989,600 $ 127,159,500
TOTAl ON-AIrPOrT OUTPUT $ 514,003,400 $ 350,556,700 $ 864,560,100 Sources: Wilbur Smith Associates and RIMS II multipliers.Prepared: December 2010.
Total first round annual output from on-airport businesses and activities is estimated in excess of $514.0 million. Secondary airport related output or spending impacts are estimated using RIMS II multipliers and the RIMS II model. Secondary annual output is estimated at $350.6 million. When first round and secondary impacts are combined, the total annual output for the study airports attributed to the airports approaches $864.6 million.
Output from Commercial Service Visitor SpendingTable 15 identifies the output attributed to commercial visitor spending.

30
Table 15: North Dakota Output from Commercial Service visitor Spending
First RoundOutput
SecondaryOutput
TotalOutput
Commercial Service Visitor Output $104,954,600 $65,320,000 $170,274,600 Sources: Wilbur Smith Associates and RIMS II multipliers.Prepared: December 2010.
First round output is comparable to total annual visitor expenditures. First round output from commercial service visitor spending is estimated at approximately $105.0 million. As the service industries re-spend this output, the spending continues to circulate resulting in secondary impacts. Secondary annual impacts related to commercial service visitor output or spending are estimated at more than $65.3 million. In total, the combined annual output from commercial service visitor spending approaches $170.3 million.
Output from General Aviation Visitor Spending Table 16 identifies the output attributed to general aviation visitors flying in and out of airports in North Dakota. First round annual output is comparable to all general aviation visitor expenditures at these airports and is estimated at almost $16.9 million.
Table 16: North Dakota Output from General Aviation visitor Spending
First RoundOutput
SecondaryOutput
TotalOutput
Commercial Service Airport Output $ 14,090,400 $ 9,218,300 $ 23,308,700
General Aviation Airport Output $ 2,789,100 $ 1,824,000 $ 4,613,100
TOTAl GENErAl AvIATION vISITOr OUTPUT $ 16,879,500 $ 11,042,300 $ 27,921,800 Sources: Wilbur Smith Associates and RIMS II multipliers.Prepared: December 2010.
As the service industries re-spend first round output, money continues to circulate, resulting in secondary impacts. The secondary impacts related to general aviation visitor output are estimated at more than $11.0 million each year. The total annual output from spending by visitors arriving via general aviation visitors at North Dakota’s airports is approximately $27.9 million.
Total Annual OutputThe total combined annual output related to on-airport activities and commercial service and general aviation visitor spending is presented in Table 17. First round annual output measures more than $635.8 million. Secondary output impacts are estimated in excess of $426.9 million annually. Combined first round and secondary output from airport activities, visitors, and the multiplier effect produce a total annual output estimate of approximately $1.1 billion for North Dakota’s economy which comprises 3.3 percent of North Dakota’s estimated gross domestic product of $31.9 billion.

31
Table 17: North Dakota Airports Total Annual Output
Total First RoundOutput
Total SecondaryOutput
TotalOutput
Commercial Service Airport Output $555,878,500 $375,105,400 $930,983,900
General Aviation Airport Output $79,959,000 $51,813,600 $131,772,600
TOTAl OUTPUT $635,837,500 $426,919,000 $1,062,756,500 Sources: Wilbur Smith Associates and RIMS II multipliers.Prepared: December 2010.
The $1.1 billion of economic output from North Dakota’s airports are the result of a multitude of aviation market segments working together to provide the infrastructure and services needed to keep North Dakota’s aviation operations working smoothly. The next section examines these aviation submarkets in more detail.
aviaTion markeT segmenT analysisThe economic impacts found at each of North Dakota’s airports come from a variety of sectors in the aviation industry. For purposes of analysis, the total impacts, including secondary impacts, for all of North Dakota’s 89 airports were allocated to one of 13 market segments:
•Aerial Applicators
•Air Ambulance
•Air Cargo
•Aircraft Maintenance
•Airlines
•Airport Management
•Concession
•Corporate Flight Departments
• FBOs
• Flight Instruction
•Government
•Military
•Visitors
Table 18 shows the total impacts in terms of employment, payroll, and output for each of these market segments. These impacts include all first round and secondary impacts.

32
Table 18: North Dakota Airport Total Impacts by Market Segment
Market SegmentTotal
Employment1Total
PayrollTotal
Output
Aerial Applicators 552 $24,491,400 $142,545,700
Air Ambulance 57 $2,522,100 $10,353,500
Air Cargo 339 $13,354,700 $52,935,400
Aircraft Maintenance 144 $5,358,300 $19,398,800
Airlines 429 $19,823,800 $60,296,400
Airport Management 803 $25,748,800 $90,757,400
Concession 228 $7,734,100 $47,037,800
Corporate Flight Departments 160 $7,363,500 $24,496,200
FBOs 673 $20,750,800 $109,271,700
Flight Instruction 711 $22,178,400 $77,527,300
Government 859 $48,499,500 $84,489,400
Military 1,627 $86,726,800 $145,450,500
Visitors 3,210 $81,307,200 $198,196,400
AIrPOrT IMPACT TOTAlS 9,792 $365,859,400 $1,062,756,500 Sources: Wilbur Smith Associates and RIMS II multipliers.1Includes multiplier impacts.Prepared: December 2010.
Overall, the aviation industry in North Dakota is fairly well diversified, with most segments comprising less than 10 percent of the total output, and the largest segment – Visitors – making up less than 20 percent of the total output, as shown in Figure 4.

33
Figure 4: Percentage of Airport Economic Output by Market Segment
Source: Wilbur Smith Associates; RIMS II multipliers. Prepared: December 2010.
A more detailed discussion of each segment follows.
Aerial ApplicatorsData was gathered on the state’s aerial applicators through both an on-airport survey effort and a review of the state’s list of licensed aerial applicators. Comparing the results helped determine which aerial applicators operate from private airfields so that their off-airport impacts could be estimated separately, as detailed later in this report.
The data was also useful in corroborating how many acres of crops were sprayed by aerial applicators working in North Dakota. It is estimated that in 2010, approximately 2.8 million acres of crops in North Dakota had some type of aerial application applied. Every year, aerial applicators spray crops in North Dakota with pesticides to impede crop-damaging diseases, insects, and weeds. The expense associated with applying chemicals by air is usually substantial, which explains why aerial applicators contribute more than 13 percent to the total airport economic output, making it the third largest market segment, behind visitors and the military.
This category also includes the economic benefits associated with cloud seeding operations, such as Weather Modification, Inc. Cloud seeding companies benefit farmers by using aircraft to deliver
Aerial Applicators13%
Air Ambulance1%
Air Cargo5%
Aircraft Maintenance2%
Airlines6%Military
14%
Visitors19%
Airport Management9%
Concession4%
Corporate Flight Departments2%FBOs
10%
Flight Instruction7%
Government8%
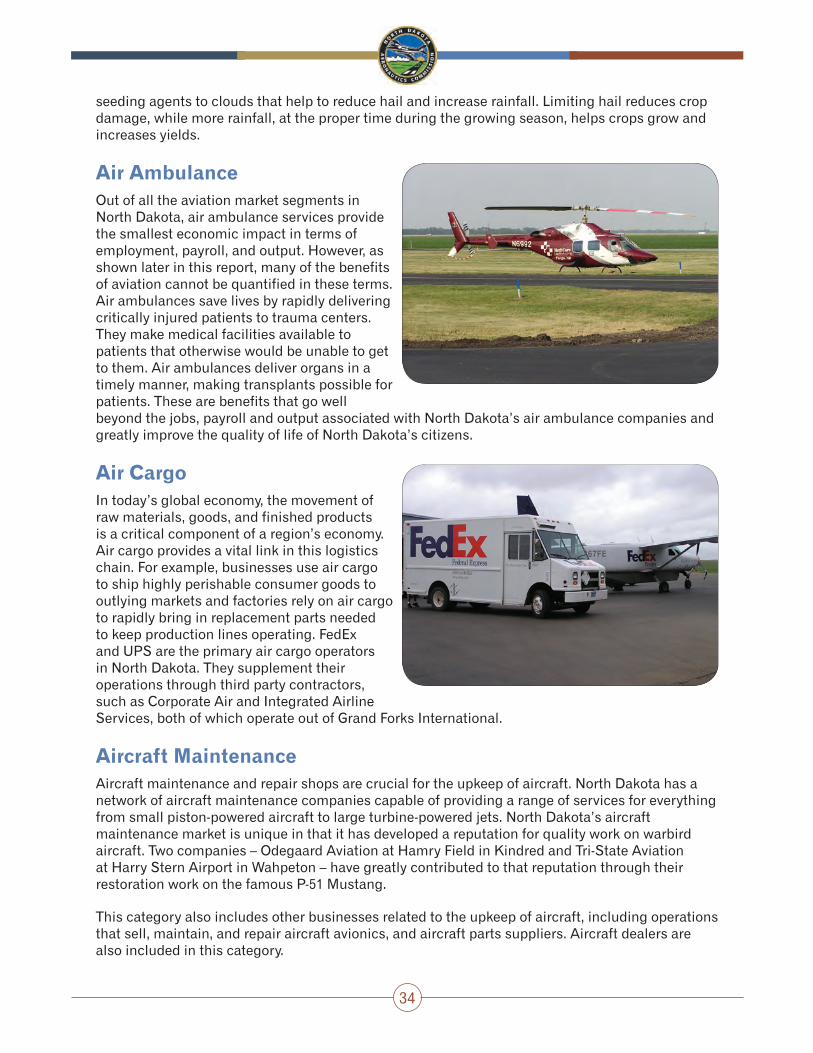
34
seeding agents to clouds that help to reduce hail and increase rainfall. Limiting hail reduces crop damage, while more rainfall, at the proper time during the growing season, helps crops grow and increases yields.
Air Ambulance Out of all the aviation market segments in North Dakota, air ambulance services provide the smallest economic impact in terms of employment, payroll, and output. However, as shown later in this report, many of the benefits of aviation cannot be quantified in these terms. Air ambulances save lives by rapidly delivering critically injured patients to trauma centers. They make medical facilities available to patients that otherwise would be unable to get to them. Air ambulances deliver organs in a timely manner, making transplants possible for patients. These are benefits that go well beyond the jobs, payroll and output associated with North Dakota’s air ambulance companies and greatly improve the quality of life of North Dakota’s citizens.
Air Cargo In today’s global economy, the movement of raw materials, goods, and finished products is a critical component of a region’s economy. Air cargo provides a vital link in this logistics chain. For example, businesses use air cargo to ship highly perishable consumer goods to outlying markets and factories rely on air cargo to rapidly bring in replacement parts needed to keep production lines operating. FedEx and UPS are the primary air cargo operators in North Dakota. They supplement their operations through third party contractors, such as Corporate Air and Integrated Airline Services, both of which operate out of Grand Forks International.
Aircraft MaintenanceAircraft maintenance and repair shops are crucial for the upkeep of aircraft. North Dakota has a network of aircraft maintenance companies capable of providing a range of services for everything from small piston-powered aircraft to large turbine-powered jets. North Dakota’s aircraft maintenance market is unique in that it has developed a reputation for quality work on warbird aircraft. Two companies – Odegaard Aviation at Hamry Field in Kindred and Tri-State Aviation at Harry Stern Airport in Wahpeton – have greatly contributed to that reputation through their restoration work on the famous P-51 Mustang.
This category also includes other businesses related to the upkeep of aircraft, including operations that sell, maintain, and repair aircraft avionics, and aircraft parts suppliers. Aircraft dealers are also included in this category.

35
AirlinesCommercial airlines make it possible for North Dakota travelers to reach all parts of the state from nearly anywhere in the U.S., or the world. They bring businessmen and tourists from outside the state. They enable North Dakotans to visit family and friends at far away destinations. In 2010, approximately 781,000 airline passengers flew from airports in North Dakota. In short, airlines are likely the most visible aspect of the aviation industry to the public, yet still account for less than 6 percent of all the economic activity associated with North Dakota’s airports.
In addition to providing North Dakota’s citizens access to the national air transportation system through eight airports with airline service, these airlines also move air cargo. This category also includes impacts from those companies that provide dedicated airline services, such as airline catering companies or ground handling businesses.
Airport Management North Dakota’s airport management accounts for more than $90 million of economic output. Much of that activity is from capital improvement projects, as airport staff work to maintain and improve their extensive infrastructure. A great deal of effort was put forth to gather all of the impacts associated with management of North Dakota’s airports. Data was generally available for the larger airports. For the smaller airports, it was not uncommon to find a local business – often the airport FBO or an aerial applicator – in charge of running the airport. In such a case, efforts were made to separate what was business-related activity and what was airport management-related activity. For small airports that are not attended, efforts were made to estimate the full-time equivalent work that was collectively performed by various city or county employees to maintain the airport. For example, someone had to spend some amount of time paying the airport bills, someone else had to respond to FAA paperwork, etc. For this reason, even airports that are unattended have employment associated with their management.
ConcessionsConcessions include all of the service businesses at airports, such as rental car companies and parking lots. It also includes airport restaurants, airport gift shops, and other airport retailers, like news-stands. In North Dakota, all of the concession businesses are found at commercial service airports, where the higher traffic helps support demand for these companies. The rental car companies tend to have the largest impact in terms of economic output, with parking management firms also contributing significantly to the economy.
Corporate Flight Departments Corporate flight departments provide air travel flexibility to their passengers by making use of thousands of general aviation airports that typically get passengers closer to their destination than a commercial airport can. These departments range from small operations with a single piston-powered aircraft to large organizations with several jet aircraft and a staff of flight crews and maintenance personnel. Corporate flight departments can make it possible for large businesses

36
to manage and supervise facilities in remote areas that are not easily accessible by commercial airline travel.
In addition to private companies, the flight departments of government agencies, such as the North Dakota Highway Patrol and the North Dakota Department of Transportation, are also included in this category.
FBOsProviding fuel is the main criteria for defining an aviation business as a fixed base operator (FBO), although they frequently provide other services, such as aircraft maintenance, a courtesy car, and aircraft catering. These operations often serve as the communities “air gateway” and can provide the first impression of the airport and community to visitors arriving by aircraft.
At the smaller airports, it is not unusual to have the FBO run the entire airport, making them responsible for the day-to-day management of the airport, providing services such as equipment and building maintenance, snow removal, and grounds upkeep. Larger airports may have more than one FBO providing fuel and other services, since the large volume of operations can support sufficient fuel sales to keep multiple FBOs in business. At the commercial service airports, FBOs may provide fueling services to the airlines. For these reasons, the FBO market segment accounted for more than $109 million in economic output, which is more than 10 percent of all airport economic output.
Charter operators and air taxi companies are also included in this market segment.
Flight Instruction An essential component of any aviation system is a pipeline for providing the talent pool necessary to keep the complex machinery operating. Flight schools are the first step for developing pilots that keep aircraft flying. While the military provides some of the trained pilots found among the commercial and professional flyers in the U.S., the demand far outstrips what the military can provide, so civilian flight schools are needed to fill the gap.
Most flight schools are smaller businesses, often with part-time instructors providing lessons on the weekend or evenings. The notable exception is the University of North Dakota’s John D. Odegard School of Aerospace Sciences. The school offers four-year programs of study in air traffic control, aviation management, commercial aviation, and unmanned aerial systems. With a large aircraft fleet based at Grand Forks International, flight instruction is a major part of the curriculum, making UND’s John D. Odegard School of Aerospace Sciences the major contributor
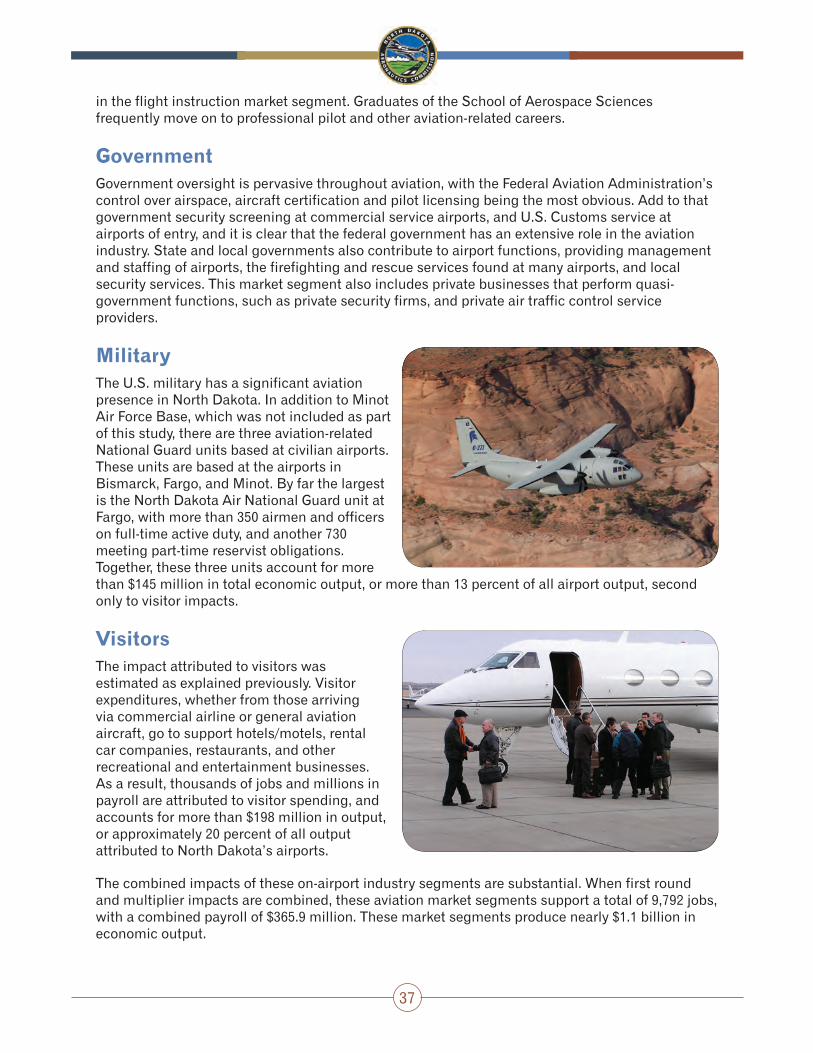
37
in the flight instruction market segment. Graduates of the School of Aerospace Sciences frequently move on to professional pilot and other aviation-related careers.
Government Government oversight is pervasive throughout aviation, with the Federal Aviation Administration’s control over airspace, aircraft certification and pilot licensing being the most obvious. Add to that government security screening at commercial service airports, and U.S. Customs service at airports of entry, and it is clear that the federal government has an extensive role in the aviation industry. State and local governments also contribute to airport functions, providing management and staffing of airports, the firefighting and rescue services found at many airports, and local security services. This market segment also includes private businesses that perform quasi-government functions, such as private security firms, and private air traffic control service providers.
MilitaryThe U.S. military has a significant aviation presence in North Dakota. In addition to Minot Air Force Base, which was not included as part of this study, there are three aviation-related National Guard units based at civilian airports. These units are based at the airports in Bismarck, Fargo, and Minot. By far the largest is the North Dakota Air National Guard unit at Fargo, with more than 350 airmen and officers on full-time active duty, and another 730 meeting part-time reservist obligations. Together, these three units account for more than $145 million in total economic output, or more than 13 percent of all airport output, second only to visitor impacts.
visitors The impact attributed to visitors was estimated as explained previously. Visitor expenditures, whether from those arriving via commercial airline or general aviation aircraft, go to support hotels/motels, rental car companies, restaurants, and other recreational and entertainment businesses. As a result, thousands of jobs and millions in payroll are attributed to visitor spending, and accounts for more than $198 million in output, or approximately 20 percent of all output attributed to North Dakota’s airports.
The combined impacts of these on-airport industry segments are substantial. When first round and multiplier impacts are combined, these aviation market segments support a total of 9,792 jobs, with a combined payroll of $365.9 million. These market segments produce nearly $1.1 billion in economic output.

38
While the economic output of North Dakota’s airports is significant, there are additional benefits that aviation provides North Dakota’s citizens beyond those benefits associated with the state’s public-use airports. The next sections describe some of these other benefits and the impacts they have on the state and its people.
addiTional areas of eConomiC benefiTAs detailed previously, certain areas of aviation provide benefits to North Dakota that are not located at a public-use airport and are therefore not captured in the traditional economic model described above. These additional areas of economic benefit are:
•Off-Airport Aerospace Manufacturing
•Unmanned Aerial Systems
•Aerial applicators
• Travel agents
•Hospitals
•Qualitative airport benefits
This section describes the benefits associated with these specific areas and the methods used to estimate their nature and scope.
Off-Airport Aerospace Manufacturing Impacts While the majority of economic benefits from aviation are found at North Dakota’s airports, the state has a significant amount of aviation-related activity that takes place away from airports. This includes the development, production, and manufacturing of aircraft, aviation support systems, aircraft components, and unmanned aerial systems (discussed in a separate section of this report). Many companies that specialize in manufacturing aircraft parts and sub-assemblies do not need an airport location to operate, still it is important to include these businesses in an assessment of aviation’s impact.
North Dakota is home to a number of significant aviation manufacturing firms. Notable aerospace firm Northrup Grumman operates two facilities in North Dakota, one in Grand Forks and the other in New Town. The state also contributes to the success of one of the newer general aviation aircraft manufacturers. Cirrus Design manufactures composite components at its Grand Forks factory for its popular SR-20, SR-22, and SR-22T single-engine aircraft.
Another major contributor to North Dakota’s economy is the Goodrich Cargo Systems facility in Jamestown. The plant manufactures cargo systems for commercial airline freight and passenger aircraft and supports hundreds of jobs and millions in economic output.

39
Without these North Dakota-based businesses, numerous on-airport aviation-related businesses would not be able to operate as efficiently as they do, if at all. So, in addition to the workforce directly employed by these businesses, many other aviation workers in North Dakota depend upon these businesses. This section estimates the economic impacts of this important off-airport industry sector.
Estimating Impacts with an Input-Output ModelAs with other economic impacts previously discussed in this report, total economic impacts associated with the aerospace manufacturing industry are quantified in terms of employment, payroll, and output. As before, employment is expressed in full-time equivalents (FTE), where each part-time job is treated as half a full-time job. First round and secondary impacts were estimated through the use of the RIMS II model, using North Dakota multipliers tailored for the typed of manufacturing each business conducted. More information on the modeling process used in this analysis can be found in the previous section entitled The Economic Modeling Process.
There are approximately 33 aerospace manufacturing businesses located off-airport in North Dakota. For the most part, these aerospace businesses are engaged in manufacturing aircraft parts, components, subsystems, or researching and developing unmanned aerial systems. The following section describes where the information used to estimate the impacts of these businesses was obtained.
Data Requirements for Aerospace Manufacturing Impact EstimatesSurveys were sent to all 33 off-airport aerospace manufacturers. For those that did not respond to the survey, employment data were obtained from sources such as the North Dakota Department of Commerce, local chambers of commerce and economic development corporations, Manta, and Dun and Bradstreet. This employment data was converted to a full-time equivalent employment number by treating each part-time employee as half of a full-time employee.
Estimates of payroll, sales and capital improvement projects were based on average per employee ratios reported by on-airport aircraft manufacturing and maintenance firms in North Dakota. These estimates of first round impacts were used in the model to produce estimates of secondary and total impacts.
Aerospace Manufacturing Impacts The economic benefits associated with off-airport aerospace manufacturing in North Dakota are significant. As shown in Table 19, this sector of the North Dakota economy is directly responsible for more than 2,000 jobs.
Table 19: Total Economic Impact of Off-Airport Aerospace Manufacturing in North Dakota Employment Payroll Output
First Round Impacts 2,039 $ 110,283,900 $ 322,704,800
Secondary Impacts 2,395 $ 76,769,200 $ 163,855,500
TOTAl IMPACTS 4,434 $ 187,053,100 $ 486,560,300 Source: Dun & Bradstreet, RIMS II Multipliers, Manta, North Dakota Department of Commerce, and Wilbur Smith Associates.Prepared: December 2010.
The 2,039 off-airport aerospace manufacturing first round jobs earned a combined payroll of nearly $110.3 million and generated an economic output of more than $322.7 million. Secondary impacts,

40
resulting from the re-circulation of the direct economic benefits, added another 2,395 jobs with nearly $76.8 million in payroll and $163.9 million in output.
Adding all these benefits together, off-airport aerospace manufacturing supports 4,434 jobs that earn almost $187.1 million in payroll and produce $486.6 million in economic output.
Unmanned Aerial Systems One growing area of aerospace manufacturing warranted additional scrutiny. Unmanned aerial systems, or UAS, are becoming more prevalent throughout the U.S., in part because of efforts undertaken in North Dakota.
In the past decade, North Dakota has emerged as a burgeoning center for UAS research, development, and operation. In 2002, the Red River Research Corridor, located in the Red River Valley region of North Dakota and Minnesota, was established with the aim of increasing the economic competiveness of the region through innovations in science and technology. Research in the area of UAS is a big part of that effort. Since 2002, the number of jobs in the UAS and related fields has grown considerably. The Red River Research Corridor has helped foster the growth of UAS companies, as well as bring to the region major producers of unmanned aerial vehicles (UAVs).
In the Grand Forks area, UAS development has been spurred on by the Grand Forks Air Force Base and the University of North Dakota’s John D. Odegard School of Aerospace Sciences. The base is transitioning to a mission involving the use of RQ-4 Global Hawk UAVs, with the first aircraft arriving in the summer of 2011.
The School of Aerospace Sciences, with its long history of aviation education, was designated in 2006 by the Department of Defense as a Center of Excellence for UAS Education. The school works closely with major UAS developers to improve the use of UAS. Lockheed Martin provides the school with access to an unmanned aerial vehicle as part of a $1 million in-kind support for UAS studies.
As part of the off-airport aerospace manufacturing analysis, an effort was made to assess how much impact UAS-related companies have had in North Dakota. One challenging aspect of such an analysis is determining how to evaluate companies that are only partially involved in UAS work. For example, a company may manufacture a line of servos, some of which are used in UAS. The difficulty is in judging how many of the company’s employees and how much of the company’s output should be attributed to UAS. In the end, this study attempted to use conservative estimates, so this estimate may understate the actual economic impact of UAS in North Dakota. As with the off-airport aerospace manufacturing economic impacts, the UAS economic impacts used North Dakota specific multipliers to estimate secondary impacts so that total impacts – both first round and secondary impacts – could be estimated. Keep in mind that the estimate of UAS impacts is a subset of the off-airport aerospace manufacturing and is included in that estimate.
The total impact from these UAS businesses is estimated at approximately $27.1 million. The UAS industry supports 231 jobs with a total payroll of $8.3 million.

41
Benefits from Agricultural Applicators North Dakota has a large agriculture industry, producing some of the largest sunflower seed and wheat crops in the nation. Aviation has a significant role in supporting the North Dakota agricultural industry. As stated above, aerial applicators applied pesticides to nearly 3 million acres of North Dakota crops. Most of those aerial applicators operated from public airports. However, a comparison of state records with airport tenant lists reveals that a good number of aerial applicators operate from private airfields. Surveys were sent to these off-airport aerial applicators and impact estimates were made for those that didn’t respond using average per capita payroll, gross sales and CIP expenditures based on data from on-airport aerial applicators.
Total impacts of off-airport aerial applicators were estimated using the RIMS II multipliers for North Dakota. As shown in Table 20, off-airport aerial applicators supported 36 first round jobs with a payroll of nearly $1.4 million and produced an economic output of approximately $11.1 million. When all impacts are taken into account, off-airport aerial applicators are responsible for 66 jobs, almost $2.4 million in payroll, and nearly $19.3 million in output in addition to the benefits discussed in the on-system airport section.
Table 20: Total Economic Impact of Off-Airport Aerial Applicators in North Dakota Employment Payroll Output
First Round Impacts 36 $ 1,358,600 $ 11,063,600
Secondary Impacts 30 $ 1,015,700 $ 8,231,300
TOTAl IMPACTS 66 $ 2,374,300 $ 19,294,900 Source: RIMS II Multipliers, and Wilbur Smith Associates.Prepared: December 2010.
Travel AgenciesTravel agencies rely upon booking airline tickets for a large part of their business. These companies range from small home-based businesses to large corporations with dedicated call centers employing hundreds of agents. Unlike most industries in North Dakota, the travel agency industry has undergone a significant contraction. Industry consolidation coupled with a vibrant state economy that puts positive pressure on wages, has resulted in a number of large travel agency call centers shutting down. For example, American Express pulled out of Dickinson in 2009, taking hundreds of jobs. Nevertheless, travel agencies, as shown in Table 21, employ nearly 1,200 workers with a payroll of more than $34 million and produce a total economic output in excess of $54 million.

42
Table 21: Total Economic Impact of Travel Agencies in North Dakota
Employment Payroll Output
First Round Impacts 865 $ 22,767,700 $ 33,773,600
Secondary Impacts 324 $ 11,399,800 $ 20,531,00
TOTAl IMPACTS 1,189 $ 34,167,500 $ 54,304,600 Source: RIMS II Multipliers, and Wilbur Smith Associates.Prepared: December 2010.
Airport and Heliport Use by HospitalsAviation is used by hospitals throughout North Dakota. For most, that use comes in the form of rapidly transporting patients from accident scenes to emergency facilities or from one health care facility to another. The ability to rapidly and safely move patients and medical personnel throughout North Dakota is an aviation benefit whose value exceeds what can be measured in terms of jobs, payroll, and economic output. When a medivac flight transports a trauma patient to a hospital, possibly saving a life in the process, the benefit far exceeds the economic impact of operating the medivac flight.
Other hospitals use airports to bring specialists to the area to hold clinics. This section examines the ways that hospitals across North Dakota use aviation to support the healthcare system and improve lives.
To better understand the important roles that airports play in supporting medical care, 53 hospitals across North Dakota were sent surveys asking for information on their use of aircraft to transport patients, which airports their patients and medical teams use, the use of local airports to support clinics held at the hospital, and the use of hospital-operated helipads. Additional questions asked for information on the hospital’s use of air cargo to ship items such as medical equipment, lab work, and documents.
During the survey effort, 33 hospitals submitted data, resulting in a response rate in excess of 62 percent. Hospitals from 30 different cities across North Dakota responded, providing a cross-section sampling of how hospitals throughout North Dakota, from rural regions to major metropolitan areas, make use of airports. Nearly 50 percent of responding hospitals indicated that they used some aspect of aviation in their operations.
Patient TransfersPatient transfers were the most common use of aviation for North Dakota’s hospitals. More than 45 percent reported using either fixed-wing aircraft or helicopters to move patients in and out of the area using their local airports. Fixed-wing aircraft were somewhat more popular, with more than 36 percent of responding hospitals indicating their use, while 28 percent reported using helicopters. Hospitals reported using aircraft for patient transfers anywhere from less than once per month to as many as 45 times per month, with a median use of twice per month.
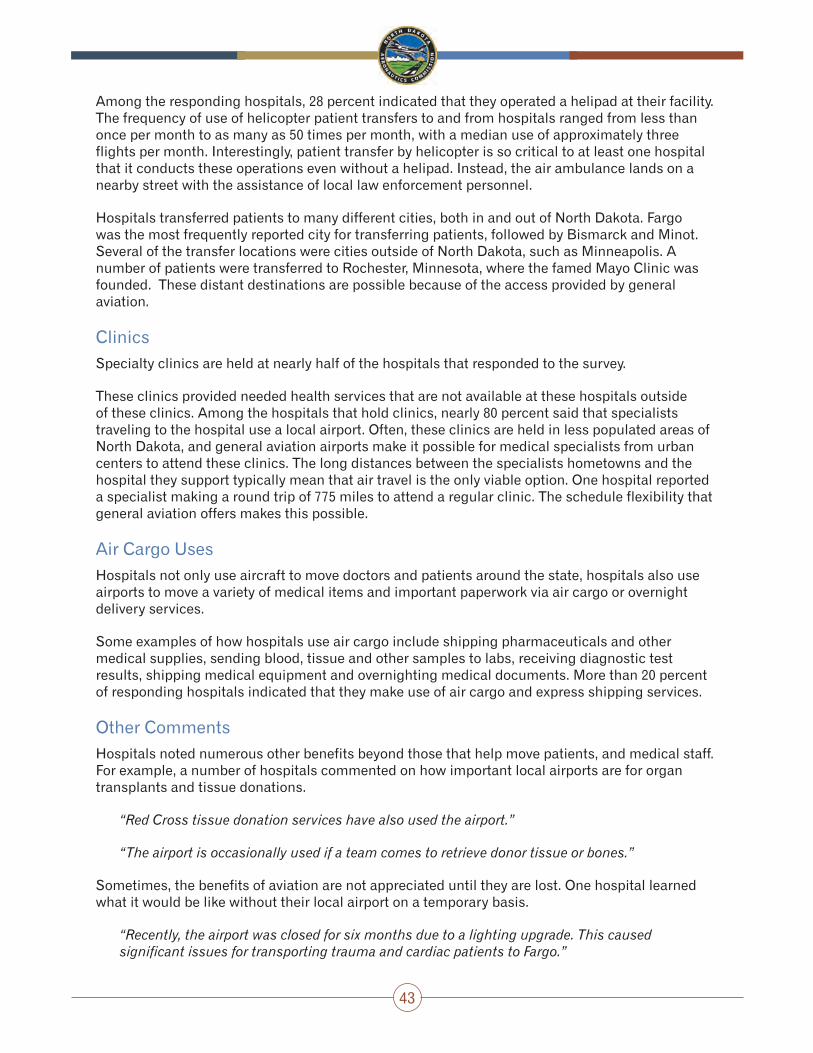
43
Among the responding hospitals, 28 percent indicated that they operated a helipad at their facility. The frequency of use of helicopter patient transfers to and from hospitals ranged from less than once per month to as many as 50 times per month, with a median use of approximately three flights per month. Interestingly, patient transfer by helicopter is so critical to at least one hospital that it conducts these operations even without a helipad. Instead, the air ambulance lands on a nearby street with the assistance of local law enforcement personnel.
Hospitals transferred patients to many different cities, both in and out of North Dakota. Fargo was the most frequently reported city for transferring patients, followed by Bismarck and Minot. Several of the transfer locations were cities outside of North Dakota, such as Minneapolis. A number of patients were transferred to Rochester, Minnesota, where the famed Mayo Clinic was founded. These distant destinations are possible because of the access provided by general aviation.
ClinicsSpecialty clinics are held at nearly half of the hospitals that responded to the survey.
These clinics provided needed health services that are not available at these hospitals outside of these clinics. Among the hospitals that hold clinics, nearly 80 percent said that specialists traveling to the hospital use a local airport. Often, these clinics are held in less populated areas of North Dakota, and general aviation airports make it possible for medical specialists from urban centers to attend these clinics. The long distances between the specialists hometowns and the hospital they support typically mean that air travel is the only viable option. One hospital reported a specialist making a round trip of 775 miles to attend a regular clinic. The schedule flexibility that general aviation offers makes this possible.
Air Cargo UsesHospitals not only use aircraft to move doctors and patients around the state, hospitals also use airports to move a variety of medical items and important paperwork via air cargo or overnight delivery services.
Some examples of how hospitals use air cargo include shipping pharmaceuticals and other medical supplies, sending blood, tissue and other samples to labs, receiving diagnostic test results, shipping medical equipment and overnighting medical documents. More than 20 percent of responding hospitals indicated that they make use of air cargo and express shipping services.
Other CommentsHospitals noted numerous other benefits beyond those that help move patients, and medical staff. For example, a number of hospitals commented on how important local airports are for organ transplants and tissue donations.
“Red Cross tissue donation services have also used the airport.”
“The airport is occasionally used if a team comes to retrieve donor tissue or bones.”
Sometimes, the benefits of aviation are not appreciated until they are lost. One hospital learned what it would be like without their local airport on a temporary basis.
“Recently, the airport was closed for six months due to a lighting upgrade. This caused significant issues for transporting trauma and cardiac patients to Fargo.”

44
This hospital found that, in addition to the increased transport time resulting in increased risk to patients, it also resulted in increased costs because of the added expenses associated with medical staff that needed to accompany the patient and return when forced to use ground transportation.
Some hospitals commented on the advantages a local business can provide when transacting business.
“We have also had consultants fly in from Sioux Falls, SD, to our local airport.”
Finally, one hospital pointed out that the frequency of use of aviation is not nearly as important as simply having it available for when it makes a difference.
“Air Ambulance service is critical for those patients with this need, especially transplants.”
The benefits that airports and aviation provide hospitals throughout North Dakota are vital to those that need it. Without these airports and the air ambulances that serve them, the quality of life that North Dakotans enjoy would be diminished.
Qualitative Airport Benefits Beyond the quantitative aspects of aviation benefits that have been discussed previously, there are also qualitative benefits that deserve consideration when the total value of an airport system is analyzed. Qualitative benefits are those activities which take place at an airport on a regular basis that add to the quality of life, but are difficult to assign a dollar value. Qualitative benefits typically enhance the health, welfare, or safety of individuals in the airport’s market area. While it may be difficult to place a dollar value on such impacts, these benefits improve the quality of life of North Dakota’s residents in a variety of ways.
The activities contributing to the qualitative benefits vary throughout the airport system, yet each airport contributes in some way to the quality of life of residents of North Dakota. Some examples of the qualitative benefits of aviation at North Dakota system airports include:
• Facilitating emergency medical transport
•Providing police support
•Conducting search-and-rescue operations
•Supporting the U.S. military and other govern-ment organizations
•Assisting with prisoner transport
•Serving as a staging area for community events
•Supporting statewide agricultural activities
•Providing entertainment opportunities (e.g., museums, air shows)
•Hosting school field trips and other educational events
Information supplied by the airports themselves has highlighted some of the more notable examples of the qualitative benefits derived from North Dakota’s airport system. Numerous life-saving emergency medical evacuations and operations occur at airports throughout the state. In

45
addition, airports in North Dakota play an important role in agricultural production, as detailed previously.
Based on information provided by airports that responded to our survey efforts, Table A-19 in the appendix attempts to tabulate the qualitative benefits each airport provides. The activities listed in Table A-19 are not all inclusive, but instead account for the most common types of aviation operations at these airports. Other additional aviation activity likely takes place at these airports beyond what is shown in Table A-19.
What is most notable is no matter how large or small the contributions, all airports contribute in some way to the quality of life of North Dakota residents.
Tax impaCTsIn addition to generating economic benefits, airport activity produces tax revenues for North Dakota and local municipalities. This section explains the methodology for estimating tax revenues generated by airport activity and examines those estimated tax revenue impacts from airport activity. This analysis only examines the tax impacts from on-airport business and the spending by commercial service and general aviation visitors of the 89 study airports. It does not take into account tax impacts from off-airport aviation-related activities.
This tax analysis examined the estimated taxes generated through the state sales tax, local sales taxes, lodging taxes, rental car taxes, and aviation fuel taxes. This analysis made estimates of taxes paid by on-airport business tenants, taxes paid by visitors arriving by both commercial airlines and general aviation aircraft, and taxes paid by employees supported by airport-related activity. These employees included those working on the airport for business and government tenants and those off-airport supported by visitor spending.
Sales taxes in North Dakota are fairly straight forward and, for purposes of this analysis, consist of a state sales tax, a number of local sales taxes, lodging taxes, and rental car taxes. These are explained below in their individual sections.
State and local Sales Tax ratesNorth Dakota has a state sales tax of 5 percent that is directed to the state’s general fund. In addition to the state sales tax, local governments also have the option of imposing a local option sales tax. Each of these additional taxes can be up to 1 percent for a total of 3 percent in additional sales taxes.
lodging and restaurant Tax ratesLodging taxes are used by counties and cities throughout North Dakota and are charged as a percent of the cost of guest accommodations. Lodging taxes are often used in areas that are destinations for tourist or business travel. The philosophy behind a lodging tax is that the tax helps to offset the cost of services provided to visitors versus residents and thus balances the tax burden more evenly across users. Lodging tax rates range from 1 percent to 3 percent, with 2 percent being the most common.
Cities are also permitted to levy a restaurant and lodging sales tax in addition to the lodging tax. Nearly all municipalities that levy this tax do so at the 1 percent level. Grand Forks is the notable exception with their 0.3 percent lodging and restaurant tax.

46
rental Car Tax ratesVisitors using rental cars pay sales tax on the cost of the rented vehicle. This sales tax includes North Dakota’s 5 percent sales tax. In addition, rental car transactions are subject to a 3 percent rental surcharge tax over and above the sales taxes that are imposed. Certain jurisdictions impose an additional 1 percent sales tax on car rental transactions. Rental car companies may impose additional fees (such as energy recovery fees or concession fees) but these are additional costs of the transaction, not taxes.
Tax Estimation MethodologyThis analysis began with establishing the sales tax rates to which each system airport was subjected. All airports are subject to North Dakota’s 5 percent state sales tax. Most airports are subject to additional sales taxes. The North Dakota Office of State Tax Commissioner provided sales tax rates, effective as of October 1, 2010, for all North Dakota counties and, where applicable, municipalities. The tax rates for retail sales, lodging, restaurants, and rental cars, shown in Table 22, were assigned to each airport based upon the county it was located in, along with any city taxes, if applicable.
Using these tax rates, estimates of taxes paid by on-airport businesses, by visitors arriving by airport, by employees of the on-airport businesses, and by employees supported by visitor spending were determined.

47
Table 22: Sales Tax rates for regions Associated with North Dakota Airports - 2010
Associated City Airport NameRetail
TaxRestaurant
TaxLodging
TaxRental
Car Tax
COMMErCIAl AIrPOrTS
Bismarck Bismarck 6.0% 7.0% 9.0% 9.0%
Devils Lake Devils Lake Regional 7.0% 9.0% 10.0% 8.0%
DickinsonDickinson-Theodore Roosevelt Regional
6.5% 9.0% 9.5% 8.0%
Fargo Hector International 7.0% 8.0% 10.0% 8.0%
Grand Forks Grand Forks International 6.8% 8.5% 10.0% 9.0%
Jamestown Jamestown Regional 7.0% 9.0% 10.0% 8.0%
Minot Minot International 7.0% 8.0% 10.0% 9.0%
Williston Sloulin Field International 7.5% 7.5% 9.5% 8.0%
GENErAl AvIATION AIrPOrTS
Arthur Arthur 5.0% 5.0% 5.0% 8.0%
Ashley Ashley Municipal 6.0% 7.0% 8.0% 8.0%
Beach Beach 6.0% 7.0% 8.0% 8.0%
Beulah Beulah 6.0% 9.0% 9.0% 8.0%
Bottineau Bottineau Municipal 7.0% 9.0% 10.0% 8.0%
Bowbells Bowbells Municipal 5.0% 5.0% 5.0% 8.0%
Bowman Bowman Municipal 6.0% 9.0% 9.0% 8.0%
Cando Cando Municipal 7.0% 5.0% 7.0% 8.0%
Carrington Carrington Municipal 6.0% 7.0% 8.0% 8.0%
Casselton Casselton Robert Miller Regional 6.0% 5.0% 6.0% 8.0%
Cavalier Cavalier Municipal 7.0% 5.0% 7.0% 8.0%
Columbus Columbus Municipal 5.0% 5.0% 5.0% 8.0%
Cooperstown Cooperstown Municipal 6.5% 6.0% 7.5% 8.0%
Crosby Crosby Municipal 6.0% 5.0% 6.0% 8.0%
Drayton Drayton Municipal 6.5% 9.0% 9.5% 8.0%
Edgeley Edgeley Municipal 7.0% 7.0% 8.0% 8.0%
Elgin Elgin Municipal 6.0% 5.0% 6.0% 8.0%
Ellendale Ellendale Municipal 6.0% 7.0% 7.0% 8.0%
Enderlin Sky Haven 6.0% 5.0% 6.0% 8.0%
Fessenden Fessenden Municipal 5.0% 5.0% 5.0% 8.0%
Fort Yates Standing Rock 5.0% 5.0% 5.0% 8.0%
Gackle Gackle Municipal 5.0% 5.0% 5.0% 8.0%
Garrison Garrison Municipal 5.0% 5.0% 5.0% 8.0%
Garrison Dam Garrison Dam Recreational Airpark 5.0% 8.0% 7.0% 8.0%
Glen Ullin Glen Ullin Regional 6.0% 5.0% 6.0% 8.0%
Grafton Hutson Field 7.3% 7.3% 9.3% 8.0%
Gwinner Gwinner-Roger Melroe Field 6.0% 5.0% 6.0% 8.0%
Harvey Harvey Municipal 6.0% 7.0% 8.0% 8.0%
Hazelton Hazelton Municipal 6.0% 5.0% 6.0% 8.0%

48
Associated City Airport NameRetail
TaxRestaurant
TaxLodging
TaxRental
Car Tax
Hazen Mercer County Regional 6.0% 9.0% 9.0% 8.0%
Hettinger Hettinger Municipal 6.0% 7.0% 8.0% 8.0%
Hillsboro Hillsboro Municipal 7.0% 5.0% 7.0% 8.0%
Intl. Peace Garden-Dunseith
International Peace Garden 6.0% 5.0% 6.0% 8.0%
Kenmare Kenmare Municipal 7.0% 5.0% 7.0% 8.0%
Killdeer Weydahl Field 6.5% 5.0% 6.5% 8.0%
Kindred Hamry Field 5.0% 5.0% 5.0% 8.0%
Kulm Kulm Municipal 7.0% 5.0% 7.0% 8.0%
Lakota Lakota Municipal 6.0% 9.0% 9.0% 8.0%
LaMoure LaMoure Rott Municipal 7.0% 5.0% 7.0% 8.0%
Langdon Robertson Field 7.0% 7.0% 9.0% 8.0%
Larimore Larimore Municipal 6.0% 5.0% 6.0% 8.0%
Leeds Leeds Municipal 5.0% 5.0% 5.0% 8.0%
Lidgerwood Lidgerwood Municipal 6.0% 5.0% 6.0% 8.0%
Linton Linton Municipal 7.0% 5.0% 7.0% 8.0%
Lisbon Lisbon Municipal 7.0% 9.0% 10.0% 8.0%
Maddock Maddock Municipal 6.5% 5.0% 6.5% 8.0%
Mandan Mandan Municipal 6.0% 9.0% 9.0% 8.0%
Mayville Mayville Municipal 7.0% 5.0% 7.0% 8.0%
McClusky McClusky Municipal 6.0% 5.0% 6.0% 8.0%
McVille McVille Municipal 7.0% 9.0% 10.0% 8.0%
Milnor Milnor Municipal 6.5% 5.0% 6.5% 8.0%
Minto Minto Municipal 6.3% 5.3% 6.3% 8.0%
Mohall Mohall Municipal 6.0% 5.0% 6.0% 8.0%
Mott Mott Municipal 6.5% 5.0% 6.5% 8.0%
Napoleon Napoleon Municipal 7.0% 5.0% 7.0% 8.0%
New Rockford Tomlinson Field 7.0% 5.0% 7.0% 8.0%
New Town New Town Municipal 5.0% 6.0% 6.0% 8.0%
Northwood Northwood Municipal-Vince Field 7.0% 5.0% 7.0% 8.0%
Oakes Oakes Municipal 7.0% 5.0% 7.0% 8.0%
Page Page Regional 6.0% 5.0% 6.0% 8.0%
Park River Park River-W C Skjerven Field 7.3% 5.3% 7.3% 8.0%
Parshall Parshall-Hankins 5.0% 9.0% 8.0% 8.0%
Pembina Pembina Municipal 7.5% 5.0% 7.5% 8.0%
Plaza Trulson Field 5.0% 5.0% 5.0% 8.0%
Richardton Richardton 7.0% 5.0% 7.0% 8.0%
Rolette Rolette 6.0% 5.0% 6.0% 8.0%
Rolla Rolla Municipal 7.0% 5.0% 7.0% 8.0%
Rugby Rugby Municipal 7.0% 9.0% 10.0% 8.0%
St. Thomas St. Thomas Municipal 5.0% 5.0% 5.0% 8.0%

49
Associated City Airport NameRetail
TaxRestaurant
TaxLodging
TaxRental
Car Tax
Stanley Stanley Municipal 5.0% 5.0% 5.0% 8.0%
Tioga Tioga Municipal 6.5% 6.5% 7.5% 8.0%
Towner Towner Municipal 6.0% 5.0% 6.0% 8.0%
Turtle Lake Turtle Lake Municipal 7.0% 5.0% 7.0% 8.0%
Valley City Barnes County Municipal 7.5% 9.0% 10.5% 8.0%
Wahpeton Harry Stern 7.0% 8.0% 10.0% 8.0%
Walhalla Walhalla Municipal 7.0% 6.0% 8.0% 8.0%
Washburn Washburn Municipal 7.0% 5.0% 7.0% 8.0%
Watford City Watford City Municipal 6.0% 7.0% 8.0% 8.0%
West Fargo West Fargo Municipal 6.0% 8.0% 9.0% 8.0%
Westhope Westhope Municipal 6.0% 5.0% 6.0% 8.0%
Wishek Wishek Municipal 6.0% 7.0% 8.0% 8.0%
Source: North Dakota Office of State Tax Commissioner, October 2010
Taxes Generated by On-Airport BusinessesTo estimate the sales taxes paid by on-airport businesses, each airport’s direct payroll was subtracted from its direct output to obtain the taxable expenditures attributable to that airport. The applicable sales tax rate was then applied to obtain the sales taxes paid by the airport’s on-airport businesses, using a generalized assumption that all of these expenditures occurred within the local tax district of the airport. It was also assumed that the taxable expenditures included the taxes paid and the calculation reflects that. For example:
•Minot International Airport had $25.2 million in first round on-airport output and $6.6 million in first round on-airport payroll. The tax rate for Minot International Airport is 7 percent (5 percent state sales tax, and 2 percent local sales tax). This yields approximately $1.2 million in sales taxes from Minot International Airport’s on-airport businesses for 2010.
– $25.2 million output - $6.6 million payroll = $18.6 million in taxable expenditures
– $18.6 million in taxable expenditures x 7% ÷ (1 + 7%) = $1.2 million in sales taxes
All 89 of North Dakota’s airports are estimated to have paid approximately $19.0 million in on-airport business sales taxes in 2010.
Taxes Paid by Commercial Service visitorsTo estimate the sales taxes paid by visitors arriving by commercial airline, it was necessary to estimate how visitor expenditures were allocated among lodging, restaurants, rental cars, and other purchases. Using survey data obtained for this study, each airport’s visitor expenditures were split between these four categories and the appropriate tax rates were applied. It was assumed that all of these expenditures occurred within the tax district of the airport. It was also assumed that the taxable expenditures included the taxes paid and the calculation reflects that. For example:
•Bismarck Airport had $21.3 million in commercial service visitor expenditures. Survey data estimated that 18 percent of these expenditures were on retail, 26 percent on restaurants, 37 percent on lodging, and the remaining 19 percent on rental car. The tax rates for Bismarck

50
Airport for retail sales, restaurants, lodging, and rental car are 6 percent, 7 percent, 9 percent, and 9 percent, respectively. From this data, it was estimated that Bismarck Airport’s commercial service visitors paid approximately $1.7 million in taxes in 2010.
– $21.3 million visitor expenditures x 18 percent = $3.5 million in retail sales
– $3.5 million in retail sales x 6% ÷ (1 + 6%) = $200,400 in retail sales taxes
– $21.3 million visitor expenditures x 26 percent = $7.8 million in restaurant expenditures
– $7.8 million in restaurant expenditures x 7% ÷ (1 + 7%) = $512,900 in restaurant taxes
– $21.3 million visitor expenditures x 37 percent = $7.8 million in lodging expenditures
– $7.8 million in lodging expenditures x 9% ÷ (1 + 9%) = $647,400 in lodging taxes
– $21.3 million visitor expenditures x 19 percent = $4.1 million in rental car expenditures
– $4.1 million in rental car expenditures x 9% ÷ (1 + 9%) = $338,700 in rental car taxes
– $200,400 in retail sales taxes + $512,900 in restaurant taxes + $647,400 in lodging taxes + $338,700 in rental car taxes = $1.7 million in commercial service visitor paid taxes
Commercial service visitors to North Dakota’s eight commercial service airports are estimated to have paid nearly $8.8 million through their expenditures in 2010. Hector International contributed the greatest share of those taxes, with more than $4.0 million. Bismarck Airport and Minot International also contributed more than $1 million each in taxes.
Taxes Paid by General Aviation visitorsTo estimate the sales taxes paid by visitors arriving by general aviation aircraft, it was necessary to estimate how visitor expenditures were allocated among retail sales, restaurants, lodging, and rental cars. Expenditures were estimated using survey data obtained for this study, and the appropriate tax rates were applied. It was assumed that all of these expenditures occurred within the tax district of the airport. It was also assumed that the taxable expenditures included the taxes paid and the calculation reflects that. For example:
•Mandan Municipal Airport had $329,000 in general aviation visitor expenditures. Survey data estimated that 25 percent of these expenditures were on retail sales, 14 percent on restaurants, 48 percent on lodging, and 13 percent on rental car. The tax rates for Mandan Municipal for retail sales, restaurants, lodging, and rental cars, are 6 percent, 9 percent, 9 percent, and 8 percent, respectively. It was estimated that Mandan Municipal’s general aviation visitors paid approxi-mately $24,700 in taxes in 2010.
– $329,000 visitor expenditures x 25 percent = $83,100 in retail sales
– $83,100 in retail sales x 6% ÷ (1 + 6%) = $4,700 in retail sales taxes
– $329,000 visitor expenditures x 14 percent = $45,900 in restaurant expenditures
– $45,900 in restaurant expenditures x 9% ÷ (1 + 9%) = $3,800 in restaurant taxes
– $329,000 visitor expenditures x 48 percent = $159,100 in lodging expenditures
– $159,100 in lodging expenditures x 9% ÷ (1 + 9%) = $13,100 in lodging taxes
– $329,000 visitor expenditures x 12 percent = $40,800 in rental car expenditures
– $40,800 in rental car expenditures x 8% ÷ (1 + 8%) = $3,000 in rental car taxes
– $4,700 in retail sales taxes + $3,800 in restaurant taxes + $13,100 in lodging taxes + $3,000 in rental car taxes = $24,700 in general aviation visitor paid taxes

51
General aviation visitors to North Dakota’s airports are estimated to have paid approximately $1.3 million in taxes through their expenditures in 2010.
Taxes Paid by Employees of On-Airport BusinessesEmployees that work at on-airport businesses pay sales taxes in their local community when they purchase items. The U.S. Internal Revenue Service (IRS) estimates how much in sales taxes are paid based on payroll for each state. Using this information, and the estimated average payroll for each airport, sales taxes paid by employees of on-airport businesses were estimated. These taxes were estimated at nearly $1.6 million in 2010.
Taxes Paid by Employees Supported by visitor SpendingThe employees related to visitor spending (both commercial service and general aviation visitors) also pay North Dakota sales taxes when they spend their income. As with the taxes paid by employees of on-airport businesses, these taxes were estimated using data from the IRS specific to North Dakota. Using the IRS data and an estimated annual payroll for employees supported by visitor spending, it was estimated that these employees paid $488,600 in taxes in 2010.
Aviation Fuel TaxesThe State of North Dakota imposes an 8 cents per gallon tax on both aviation gasoline and jet fuel. The proceeds of that aviation fuel tax help to fund the North Dakota Aeronautics Commission. In 2009, aviation fuel taxes amounted to $1,243,300. Data was not available at the individual airport level, so aviation fuel taxes are reported as a whole at the state level.
Total Airport-related TaxesTable 23 shows the taxes, by type, that commercial service and general aviation airports are estimated to have paid in 2010. Taxes paid by individual airports can be found in Table A-20 in the appendix.
Table 23: Airport-related Taxes from North Dakota Airports - 2010
Airport Tenant Taxes
CS Visitor Taxes
GA Visitor Taxes
Employee Taxes from
Airport Tenants
Employee Taxes from
VisitorsTotal Taxes
Commercial Airports $15,814,400 $8,766,900 $1,115,300 $1,472,500 $410,700 $27,645,100
GA Airports $3,188,000 $0 $188,700 $120,100 $77,900 $3,509,400
TOTAl TAxES $19,002,400 $8,766,900 $1,304,000 $1,592,600 $488,600 $31,154,500
Source: Wilbur Smith Associates and North Dakota Office of State Tax Commissioner, October 2010.
Aviation fuel taxes added another $1.2 million, bringing total airport taxes to nearly $32.4 million. The majority of these taxes were generated by on-airport businesses, with more than $19 million in collected taxes. Commercial service visitors were also a significant contributor to the tax base, paying nearly $8.8 million in retail sales, restaurant, lodging, and rental car taxes.
Tax SummaryThe State of North Dakota, its counties, and municipalities collect money from taxes levied on activities tied, either directly or indirectly, to North Dakota’s airports. These include taxes on visitor

52
and tenant expenditures, fuel sales, and expenditures by employees that are supported by aviation. In 2010, these taxes totaled nearly $32.4 million.
The majority of these taxes are the result of operations at commercial service airports, driven largely by the spending of visitors coming through commercial service airports. However, for regions without commercial service airports, the tax contribution from operations at general aviation operations can be significant.
As noted, airport-related taxes shown in this section are related to airport and CIP expenditures and visitor spending only. Tax benefits from induced or multiplier impacts were not included in this analysis, but would make the impact larger.
eConomiC impaCT summaryThe 89 airports considered in this analysis are a major catalyst for North Dakota’s economy. In 2010, the annual economic activity of the airports was estimated at $1.1 billion. This includes expenditures and operations associated with on-airport businesses and activities and spending by thousands of visitors using general aviation and commercial airlines to reach North Dakota. This estimate also includes secondary impacts measured using study multipliers from the economic input-output model. This economic activity is fairly well diversified, with no market segment consisting of more than 20 percent of the overall total.
Aviation benefits do not stop at the airport fence. This study also examined the benefits associated with three industries that exist because of airports but do not operate on them. Off-airport aerospace manufacturers, travel agencies, and aerial applicators operating from private airfields provide additional significant economic benefits.
Table 24 provides a summary of economic impacts for the 89 North Dakota airports analyzed in this study and the off-airport industries examined. As shown, North Dakota’s airports help to support a total of 9,792 jobs that have an annual payroll of nearly $366 million. The airports in North Dakota account for a total of approximately $1.1 billion in total annual economic output. The off-airport industries add another 5,688 jobs with a combined payroll of $224 million. The output from these industries exceeds $560 million. When the benefits of all aviation in North Dakota are added together, it accounts for 15,480 jobs, a $560 million payroll, and economic output of approximately $1.6 billion.
In addition to these quantifiable benefits, there are numerous quality of life benefits, such as medical flights, that North Dakota’s airports provide.

53
Table 24: Economic Impact Summary for Aviation in North Dakota
First RoundImpacts
SecondaryImpacts
TotalImpacts
Employment
Airport Impacts 5,796 3,996 9,792
Off-Airport Impacts 2,940 2,748 5,688
TOTAl EMPlOyMENT 8,736 6,744 15,480
Payroll
Airport Impacts $216,967,400 $148,892,000 $365,859,400
Off-Airport Impacts $134,410,200 $89,184,700 $223,594,900
TOTAl PAyrOll $351,377,600 $238,076,700 $589,454,300
Output
Airport Impacts $635,837,500 $426,919,000 $1,062,756,500
Off-Airport Impacts $367,542,100 $192,617,700 $560,159,800
TOTAl OUTPUT $1,003,379,600 $619,536,700 $1,622,916,300
Sources: Wilbur Smith Associates and RIMS II multipliers.Prepared: December 2010.
Key study findings are as follows:
• The aviation industry in North Dakota is well diversified, with none of the 13 market segments analyzed consisting of more than 20 percent of total economic output.
• The 15,480 jobs tied to aviation in North Dakota have an estimated annual payroll of $560 million.
• The total economic impact identified in this analysis ($1.6 billion) comprises 5.1 percent of North Dakota’s estimated gross domestic product of $31.9 billion.3
As this economic impact analysis has shown, airports in North Dakota are major economic catalysts for the state and for the communities they serve. In addition to economic benefits, airports provide communities with links to the national air transportation system, and they support many health, welfare, and safety services which improve the quality of life for all residents, businesses, and visitors.
3 U.S. Bureau of Economic Analysis

A-1
APPENDIX A: EcoNomIc ImPAct tAblEs This section of the North Dakota airports economic impact appendix contains tables providing details of the 2010 economic impact for each individual North Dakota airport that was part of the study. The tables present information on the number of jobs, payroll, and economic output associated with each airport’s tenants, general aviation visitors, and, where appropriate, commercial service visitors. Summary tables provide a combined total for jobs, payroll and economic output. Additional details are provided for the estimates of visitor expenditures.
Table A-1: Estimates of General Aviation Itinerant Arrivals at North Dakota Airports
Associated City AirportTotal GA
Operations
GA Itinerant Percent
GA Itinerant Operations
True Transient
Percent
GA True Transient Arrivals
CommErCIAl SErvICE AIrporTS
Bismarck Bismarck 52,000 78% 40,320 50% 10,080
Devils Lake Devils Lake Regional 23,000 31% 7,130 50% 1,783
Dickinson Dickinson-Theodore Roosevelt Regional 12,500 31% 3,875 50% 969
Fargo Hector International 74,000 65% 48,100 50% 12,025
Grand Forks Grand Forks International 225,000 38% 85,500 33% 14,108
Jamestown Jamestown Regional 37,000 30% 11,100 50% 2,775
Minot Minot International 39,800 56% 22,288 50% 5,572
Williston Sloulin Field International 23,000 52% 12,048 50% 3,012
CommErCIAl SErvICE AIrporTS ToTAl 486,300 47% 230,361 50,323 GENErAl AvIATIoN AIrporTS
Arthur Arthur 300 5% 15 33% 2
Ashley Ashley Municipal 1,200 70% 840 50% 210
Beach Beach 1,400 40% 560 50% 140
Beulah Beulah 2,400 56% 1,344 50% 336
Bottineau Bottineau Municipal 4,000 31% 1,240 33% 205
Bowbells Bowbells Municipal 400 0% 0 33% 0
Bowman Bowman Municipal 2,400 47% 1,128 50% 282
Cando Cando Municipal 3,300 10% 330 50% 83
Carrington Carrington Municipal 2,000 48% 966 50% 242
Casselton Casselton Robert Miller Regional 13,000 32% 4,160 50% 1,040
Cavalier Cavalier Municipal 3,300 20% 660 33% 109
Columbus Columbus Municipal 100 100% 100 33% 17
Cooperstown Cooperstown Municipal 4,100 39% 1,596 33% 263
Crosby Crosby Municipal 1,600 14% 229 50% 57
Drayton Drayton Municipal 600 0% 0 33% 0
Edgeley Edgeley Municipal 1,600 3% 54 50% 14
Elgin Elgin Municipal 100 46% 46 33% 8
Ellendale Ellendale Municipal 2,200 40% 880 50% 220
Enderlin Sky Haven 2,800 43% 1,217 33% 201

A-2
Associated City AirportTotal GA
Operations
GA Itinerant Percent
GA Itinerant Operations
True Transient
Percent
GA True Transient Arrivals
Fessenden Fessenden Municipal 700 0% 0 33% 0
Fort Yates Standing Rock 200 100% 200 33% 33
Gackle Gackle Municipal 100 4% 4 33% 1
Garrison Garrison Municipal 2,700 51% 1,377 50% 344
Garrison DamGarrison Dam Recreational Airpark
100 100% 100 33% 17
Glen Ullin Glen Ullin Regional 100 100% 100 50% 25
Grafton Hutson Field 5,000 71% 3,560 50% 890
Gwinner Gwinner-Roger Melroe Field 3,700 60% 2,220 50% 555
Harvey Harvey Municipal 1,500 8% 120 33% 20
Hazelton Hazelton Municipal 200 100% 200 33% 33
Hazen Mercer County Regional 600 100% 600 50% 150
Hettinger Hettinger Municipal 2,200 100% 2,200 50% 550
Hillsboro Hillsboro Municipal 3,600 95% 3,420 33% 564
Intl. Peace Garden-Dunseith International Peace Garden 300 69% 207 33% 34
Kenmare Kenmare Municipal 2,400 30% 720 50% 180
Killdeer Weydahl Field 200 0% 0 33% 0
Kindred Hamry Field 5,000 35% 1,750 33% 289
Kulm Kulm Municipal 100 0% 0 33% 0
Lakota Lakota Municipal 3,000 46% 1,380 33% 228
LaMoure LaMoure Rott Municipal 2,200 29% 638 50% 160
Langdon Robertson Field 2,000 0% 0 50% 0
Larimore Larimore Municipal 7,000 71% 4,970 33% 820
Leeds Leeds Municipal 1,600 0% 0 33% 0
Lidgerwood Lidgerwood Municipal 100 100% 100 33% 17
Linton Linton Municipal 1,800 24% 432 50% 108
Lisbon Lisbon Municipal 1,800 32% 584 33% 96
Maddock Maddock Municipal 2,200 4% 88 33% 15
Mandan Mandan Municipal 10,000 47% 4,700 50% 1,175
Mayville Mayville Municipal 6,500 55% 3,575 50% 894
McClusky McClusky Municipal 200 0% 0 33% 0
McVille McVille Municipal 500 41% 205 33% 34
Milnor Milnor Municipal 200 10% 20 33% 3
Minto Minto Municipal 1,800 22% 396 33% 65
Mohall Mohall Municipal 1,100 20% 220 33% 36
Mott Mott Municipal 1,100 19% 209 50% 52
Napoleon Napoleon Municipal 300 40% 120 50% 30
New Rockford Tomlinson Field 1,300 38% 494 33% 82
New Town New Town Municipal 700 73% 511 50% 128
Northwood Northwood Municipal-Vince Field 6,000 51% 3,043 33% 502

A-3
Associated City AirportTotal GA
Operations
GA Itinerant Percent
GA Itinerant Operations
True Transient
Percent
GA True Transient Arrivals
Oakes Oakes Municipal 1,600 10% 160 33% 26
Page Page Regional 3,500 10% 350 33% 58
Park River Park River-W C Skjerven Field 3,200 14% 448 33% 74
Parshall Parshall-Hankins 800 15% 120 50% 30
Pembina Pembina Municipal 1,300 44% 578 50% 144
Plaza Trulson Field 100 100% 100 33% 17
Richardton Richardton 100 0% 0 33% 0
Rolette Rolette 400 72% 288 33% 48
Rolla Rolla Municipal 2,400 40% 960 50% 240
Rugby Rugby Municipal 2,000 18% 360 33% 59
St. Thomas St. Thomas Municipal 1,000 24% 240 33% 40
Stanley Stanley Municipal 1,000 31% 310 50% 78
Tioga Tioga Municipal 9,000 50% 4,500 50% 1,125
Towner Towner Municipal 800 10% 80 33% 13
Turtle Lake Turtle Lake Municipal 800 39% 310 33% 51
Valley City Barnes County Municipal 4,600 54% 2,470 50% 618
Wahpeton Harry Stern 12,900 46% 5,900 50% 1,475
Walhalla Walhalla Municipal 1,300 39% 507 33% 84
Washburn Washburn Municipal 1,200 67% 804 33% 133
Watford City Watford City Municipal 2,100 40% 840 50% 210
West Fargo West Fargo Municipal 8,300 21% 1,743 50% 436
Westhope Westhope Municipal 400 51% 204 33% 34
Wishek Wishek Municipal 1,000 10% 100 50% 25
GENErAl AvIATIoN AIrporTS ToTAl 186,700 40% 75,201 16,571
All AIrporTS ToTAl 673,000 45% 305,562 22% 66,894
Source: Wilbur Smith Associates and FAA 5010 data.
Prepared: December 2010.

A-4
Table A-2: Estimates of General Aviation visitors at North Dakota Airports
Associated City AirportGA True
Transient Arrivals
Visitors per Arrival
Estimated GA Visitors
CommErCIAl SErvICE AIrporTS
Bismarck Bismarck 10,080 3.5 35,280
Devils Lake Devils Lake Regional 1,783 3.5 6,239
Dickinson Dickinson-Theodore Roosevelt Regional 969 3.5 3,391
Fargo Hector International 12,025 3.5 42,088
Grand Forks Grand Forks International 14,108 3.5 49,376
Jamestown Jamestown Regional 2,775 3.5 9,713
Minot Minot International 5,572 3.5 19,502
Williston Sloulin Field International 3,012 3.5 10,542
CommErCIAl SErvICE AIrporTS ToTAl 50,323 3.5 176,129 GENErAl AvIATIoN AIrporTS
Arthur Arthur 2 1.5 4
Ashley Ashley Municipal 210 2.5 525
Beach Beach 140 3.5 490
Beulah Beulah 336 3.5 1,176
Bottineau Bottineau Municipal 205 2.0 409
Bowbells Bowbells Municipal 0 1.5 0
Bowman Bowman Municipal 282 2.5 705
Cando Cando Municipal 83 3.5 289
Carrington Carrington Municipal 242 2.5 604
Casselton Casselton Robert Miller Regional 1,040 3.5 3,640
Cavalier Cavalier Municipal 109 2.0 218
Columbus Columbus Municipal 17 1.5 25
Cooperstown Cooperstown Municipal 263 2.0 527
Crosby Crosby Municipal 57 3.5 200
Drayton Drayton Municipal 0 2.0 0
Edgeley Edgeley Municipal 14 3.5 48
Elgin Elgin Municipal 8 1.5 11
Ellendale Ellendale Municipal 220 3.5 770
Enderlin Sky Haven 201 2.0 402
Fessenden Fessenden Municipal 0 1.5 0
Fort Yates Standing Rock 33 2.0 66
Gackle Gackle Municipal 1 1.5 1
Garrison Garrison Municipal 344 3.5 1,205
Garrison Dam Garrison Dam Recreational Airpark 17 1.5 25
Glen Ullin Glen Ullin Regional 25 3.5 88
Grafton Hutson Field 890 2.5 2,225
Gwinner Gwinner-Roger Melroe Field 555 2.5 1,388
Harvey Harvey Municipal 20 2.0 40

A-5
Associated City AirportGA True
Transient Arrivals
Visitors per Arrival
Estimated GA Visitors
Hazelton Hazelton Municipal 33 1.5 50
Hazen Mercer County Regional 150 3.5 525
Hettinger Hettinger Municipal 550 2.5 1,375
Hillsboro Hillsboro Municipal 564 2.0 1,129
Intl. Peace Garden-Dunseith International Peace Garden 34 2.0 68
Kenmare Kenmare Municipal 180 3.5 630
Killdeer Weydahl Field 0 2.0 0
Kindred Hamry Field 289 2.0 578
Kulm Kulm Municipal 0 1.5 0
Lakota Lakota Municipal 228 2.0 455
LaMoure LaMoure Rott Municipal 160 3.5 558
Langdon Robertson Field 0 3.5 0
Larimore Larimore Municipal 820 2.0 1,640
Leeds Leeds Municipal 0 2.0 0
Lidgerwood Lidgerwood Municipal 17 1.5 25
Linton Linton Municipal 108 3.5 378
Lisbon Lisbon Municipal 96 2.0 193
Maddock Maddock Municipal 15 1.5 22
Mandan Mandan Municipal 1,175 3.5 4,113
Mayville Mayville Municipal 894 3.5 3,128
McClusky McClusky Municipal 0 1.5 0
McVille McVille Municipal 34 1.5 51
Milnor Milnor Municipal 3 1.5 5
Minto Minto Municipal 65 2.0 131
Mohall Mohall Municipal 36 2.0 73
Mott Mott Municipal 52 3.5 183
Napoleon Napoleon Municipal 30 3.5 105
New Rockford Tomlinson Field 82 2.0 163
New Town New Town Municipal 128 3.5 447
Northwood Northwood Municipal-Vince Field 502 2.0 1,004
Oakes Oakes Municipal 26 2.0 53
Page Page Regional 58 2.0 116
Park River Park River-W C Skjerven Field 74 2.0 148
Parshall Parshall-Hankins 30 3.5 105
Pembina Pembina Municipal 144 2.5 361
Plaza Trulson Field 17 1.5 25
Richardton Richardton 0 1.5 0
Rolette Rolette 48 2.0 95
Rolla Rolla Municipal 240 2.5 600
Rugby Rugby Municipal 59 2.0 119
St. Thomas St. Thomas Municipal 40 2.0 79

A-6
Associated City AirportGA True
Transient Arrivals
Visitors per Arrival
Estimated GA Visitors
Stanley Stanley Municipal 78 3.5 271
Tioga Tioga Municipal 1,125 3.5 3,938
Towner Towner Municipal 13 1.5 20
Turtle Lake Turtle Lake Municipal 51 1.5 77
Valley City Barnes County Municipal 618 2.5 1,544
Wahpeton Harry Stern 1,475 2.5 3,688
Walhalla Walhalla Municipal 84 2.0 167
Washburn Washburn Municipal 133 2.0 265
Watford City Watford City Municipal 210 3.5 735
West Fargo West Fargo Municipal 436 3.5 1,525
Westhope Westhope Municipal 34 2.0 67
Wishek Wishek Municipal 25 3.5 88
GENErAl AvIATIoN AIrporTS ToTAl 16,571 2.8 46,189 All AIrporTS ToTAl 66,894 3.3 222,318
Source: Wilbur Smith Associates.
Prepared: December 2010.

A-7
Table A-3: Estimates of Annual Expenditures by General Aviation visitors to North Dakota Airports
Associated City AirportEstimated
GA Visitors
Avg. Visitor Spending per
Trip
Annual GA Visitor Expenditures
CommErCIAl SErvICE AIrporTS
Bismarck Bismarck 35,280 $ 80 $2,822,400
Devils Lake Devils Lake Regional 6,239 $ 80 $ 499,100
DickinsonDickinson-Theodore Roosevelt Regional
3,391 $ 80 $ 271,300
Fargo Hector International 42,088 $ 80 $3,367,000
Grand Forks Grand Forks International 49,376 $ 80 $3,950,100
Jamestown Jamestown Regional 9,713 $ 80 $ 777,000
Minot Minot International 19,502 $ 80 $1,560,200
Williston Sloulin Field International 10,542 $ 80 $ 843,300
CommErCIAl SErvICE AIrporTS ToTAl 176,129 $ 80 $14,090,400 GENErAl AvIATIoN AIrporTS
Arthur Arthur 4 $ 10 $ 0
Ashley Ashley Municipal 525 $ 50 $ 26,300
Beach Beach 490 $ 80 $ 39,200
Beulah Beulah 1,176 $ 80 $ 94,100
Bottineau Bottineau Municipal 409 $ 20 $ 8,200
Bowbells Bowbells Municipal 0 $ 10 $ 0
Bowman Bowman Municipal 705 $ 50 $ 35,300
Cando Cando Municipal 289 $ 80 $ 23,100
Carrington Carrington Municipal 604 $ 50 $ 30,200
Casselton Casselton Robert Miller Regional 3,640 $ 80 $ 291,200
Cavalier Cavalier Municipal 218 $ 20 $ 4,400
Columbus Columbus Municipal 25 $ 10 $ 200
Cooperstown Cooperstown Municipal 527 $ 20 $ 10,500
Crosby Crosby Municipal 200 $ 80 $ 16,000
Drayton Drayton Municipal 0 $ 20 $ 0
Edgeley Edgeley Municipal 48 $ 80 $ 3,800
Elgin Elgin Municipal 11 $ 10 $ 100
Ellendale Ellendale Municipal 770 $ 80 $ 61,600
Enderlin Sky Haven 402 $ 20 $ 8,000
Fessenden Fessenden Municipal 0 $ 10 $ 0
Fort Yates Standing Rock 66 $ 20 $ 1,300
Gackle Gackle Municipal 1 $ 10 $ 0
Garrison Garrison Municipal 1,205 $ 80 $ 96,400
Garrison Dam Garrison Dam Recreational Airpark 25 $ 10 $ 200
Glen Ullin Glen Ullin Regional 88 $ 80 $ 7,000
Grafton Hutson Field 2,225 $ 50 $ 111,300
Gwinner Gwinner-Roger Melroe Field 1,388 $ 50 $ 69,400
Harvey Harvey Municipal 40 $ 20 $ 800

A-8
Associated City AirportEstimated
GA Visitors
Avg. Visitor Spending per
Trip
Annual GA Visitor Expenditures
Hazelton Hazelton Municipal 50 $ 10 $ 500
Hazen Mercer County Regional 525 $ 80 $ 42,000
Hettinger Hettinger Municipal 1,375 $ 50 $ 68,800
Hillsboro Hillsboro Municipal 1,129 $ 20 $ 22,600
Intl. Peace Garden-Dunseith International Peace Garden 68 $ 20 $ 1,400
Kenmare Kenmare Municipal 630 $ 80 $ 50,400
Killdeer Weydahl Field 0 $ 20 $ 0
Kindred Hamry Field 578 $ 20 $ 11,600
Kulm Kulm Municipal 0 $ 10 $ 0
Lakota Lakota Municipal 455 $ 20 $ 9,100
LaMoure LaMoure Rott Municipal 558 $ 80 $ 44,700
Langdon Robertson Field 0 $ 80 $ 0
Larimore Larimore Municipal 1,640 $ 20 $ 32,800
Leeds Leeds Municipal 0 $ 20 $ 0
Lidgerwood Lidgerwood Municipal 25 $ 10 $ 200
Linton Linton Municipal 378 $ 80 $ 30,200
Lisbon Lisbon Municipal 193 $ 20 $ 3,900
Maddock Maddock Municipal 22 $ 10 $ 200
Mandan Mandan Municipal 4,113 $ 80 $ 329,000
Mayville Mayville Municipal 3,128 $ 80 $ 250,300
McClusky McClusky Municipal 0 $ 10 $ 0
McVille McVille Municipal 51 $ 10 $ 500
Milnor Milnor Municipal 5 $ 10 $ 0
Minto Minto Municipal 131 $ 20 $ 2,600
Mohall Mohall Municipal 73 $ 20 $ 1,500
Mott Mott Municipal 183 $ 80 $ 14,600
Napoleon Napoleon Municipal 105 $ 80 $ 8,400
New Rockford Tomlinson Field 163 $ 20 $ 3,300
New Town New Town Municipal 447 $ 80 $ 35,800
Northwood Northwood Municipal-Vince Field 1,004 $ 20 $ 20,100
Oakes Oakes Municipal 53 $ 20 $ 1,100
Page Page Regional 116 $ 20 $ 2,300
Park River Park River-W C Skjerven Field 148 $ 20 $ 3,000
Parshall Parshall-Hankins 105 $ 80 $ 8,400
Pembina Pembina Municipal 361 $ 50 $ 18,100
Plaza Trulson Field 25 $ 10 $ 200
Richardton Richardton 0 $ 10 $ 0
Rolette Rolette 95 $ 20 $ 1,900
Rolla Rolla Municipal 600 $ 50 $ 30,000
Rugby Rugby Municipal 119 $ 20 $ 2,400
St. Thomas St. Thomas Municipal 79 $ 20 $ 1,600

A-9
Associated City AirportEstimated
GA Visitors
Avg. Visitor Spending per
Trip
Annual GA Visitor Expenditures
Stanley Stanley Municipal 271 $ 80 $ 21,700
Tioga Tioga Municipal 3,938 $ 80 $ 315,000
Towner Towner Municipal 20 $ 10 $ 200
Turtle Lake Turtle Lake Municipal 77 $ 10 $ 800
Valley City Barnes County Municipal 1,544 $ 50 $ 77,200
Wahpeton Harry Stern 3,688 $ 50 $ 184,400
Walhalla Walhalla Municipal 167 $ 20 $ 3,300
Washburn Washburn Municipal 265 $ 20 $ 5,300
Watford City Watford City Municipal 735 $ 80 $ 58,800
West Fargo West Fargo Municipal 1,525 $ 80 $ 122,000
Westhope Westhope Municipal 67 $ 20 $ 1,300
Wishek Wishek Municipal 88 $ 80 $ 7,000
GENErAl AvIATIoN AIrporTS ToTAl 46,189 $ 60 $2,789,100 All AIrporTS ToTAl 222,318 $ 76 $16,879,500
Source: Wilbur Smith Associates.
Prepared: December 2010.
Note: Expenditures rounded to nearest hundred.

A-10
Table A-4: Estimates of Commercial Service visitors at North Dakota Airports
Airport2010 Enplaned
PassengersPercent Visitors Visitors
CommErCIAl SErvICE AIrporTS
Bismarck 190,000 41.6% 79,040
Devils Lake Regional 4,300 52.3% 2,249
Dickinson-Theodore Roosevelt Regional 10,000 59.1% 5,910
Hector International 370,000 39.9% 147,630
Grand Forks International 113,280 39.3% 44,519
Jamestown Regional 4,300 41.1% 1,767
Minot International 74,500 45.5% 33,898
Sloulin Field International 14,439 55.2% 7,970
CommErCIAl SErvICE AIrporTS ToTAl 780,819 41.4% 322,983 Source: Wilbur Smith Associates.
Prepared: December 2010.
Table A-5: Estimates of Commercial Service visitor Expenditures at North Dakota Airports
Airport Visitors Spending per Traveler Visitor Expenditures
CommErCIAl SErvICE AIrporTS
Bismarck 79,040 $270 $21,340,800
Devils Lake Regional 2,249 $240 $539,736
Dickinson-Theodore Roosevelt Regional 5,910 $765 $4,521,150
Hector International 147,630 $335 $49,456,050
Grand Forks International 44,519 $220 $9,794,189
Jamestown Regional 1,767 $290 $512,517
Minot International 33,898 $425 $14,406,438
Sloulin Field International 7,970 $550 $4,383,680
CommErCIAl SErvICE AIrporTS ToTAl 322,983 $325 $104,954,560 Source: Wilbur Smith Associates.
Prepared: December 2010.

A-11
Table A-6: North Dakota on-Airport Employment
Associated City Airport NameFirst Round
EmploymentSecondary
EmploymentTotal
Employment
CommErCIAl SErvICE AIrporTS
Bismarck Bismarck 490 447 937
Devils Lake Devils Lake Regional 38 33 71
DickinsonDickinson-Theodore Roosevelt Regional
38 40 78
Fargo Hector International 1,369 1,254 2,623
Grand Forks Grand Forks International 749 769 1,518
Jamestown Jamestown Regional 42 43 85
Minot Minot International 159 154 313
Williston Sloulin Field International 60 56 116
CommErCIAl SErvICE AIrporTS ToTAl 2,945 2,796 5,741 GENErAl AvIATIoN AIrporTS
Arthur Arthur Less than 1 0 Less than 1
Ashley Ashley Municipal 5 4 9
Beach Beach 0 0 0
Beulah Beulah 14 15 29
Bottineau Bottineau Municipal 6 7 13
Bowbells Bowbells Municipal Less than 1 0 Less than 1
Bowman Bowman Municipal 8 7 15
Cando Cando Municipal 2 3 5
Carrington Carrington Municipal 5 5 10
Casselton Casselton Robert Miller Regional 18 20 38
Cavalier Cavalier Municipal 8 8 16
Columbus Columbus Municipal Less than 1 0 Less than 1
Cooperstown Cooperstown Municipal 3 3 6
Crosby Crosby Municipal 6 6 12
Drayton Drayton Municipal 4 3 7
Edgeley Edgeley Municipal 4 2 6
Elgin Elgin Municipal Less than 1 0 Less than 1
Ellendale Ellendale Municipal 1 0 1
Enderlin Sky Haven 1 1 2
Fessenden Fessenden Municipal 7 7 14
Fort Yates Standing Rock 6 4 10
Gackle Gackle Municipal Less than 1 0 Less than 1
Garrison Garrison Municipal 2 1 3
Garrison Dam Garrison Dam Recreational Airpark 1 0 1
Glen Ullin Glen Ullin Regional Less than 1 0 Less than 1
Grafton Hutson Field 17 16 33
Gwinner Gwinner-Roger Melroe Field 9 8 17
Harvey Harvey Municipal 13 13 26

A-12
Associated City Airport NameFirst Round
EmploymentSecondary
EmploymentTotal
Employment
Hazelton Hazelton Municipal 6 6 12
Hazen Mercer County Regional 4 3 7
Hettinger Hettinger Municipal 10 9 19
Hillsboro Hillsboro Municipal 14 15 29
Intl. Peace Garden-Dunseith International Peace Garden 1 1 2
Kenmare Kenmare Municipal 3 3 6
Killdeer Weydahl Field Less than 1 0 Less than 1
Kindred Hamry Field 18 17 35
Kulm Kulm Municipal Less than 1 0 Less than 1
Lakota Lakota Municipal 3 1 4
LaMoure LaMoure Rott Municipal 5 5 10
Langdon Robertson Field 6 8 14
Larimore Larimore Municipal 11 14 25
Leeds Leeds Municipal Less than 1 0 Less than 1
Lidgerwood Lidgerwood Municipal Less than 1 0 Less than 1
Linton Linton Municipal 4 3 7
Lisbon Lisbon Municipal 6 6 12
Maddock Maddock Municipal 6 5 11
Mandan Mandan Municipal 11 10 21
Mayville Mayville Municipal 5 4 9
McClusky McClusky Municipal 1 0 1
McVille McVille Municipal Less than 1 0 Less than 1
Milnor Milnor Municipal Less than 1 0 Less than 1
Minto Minto Municipal Less than 1 0 Less than 1
Mohall Mohall Municipal 11 11 22
Mott Mott Municipal 10 7 17
Napoleon Napoleon Municipal 3 3 6
New Rockford Tomlinson Field 4 4 8
New Town New Town Municipal 0 0 0
Northwood Northwood Municipal-Vince Field 4 2 6
Oakes Oakes Municipal 4 3 7
Page Page Regional 8 9 17
Park River Park River-W C Skjerven Field 12 12 24
Parshall Parshall-Hankins 2 2 4
Pembina Pembina Municipal 3 2 5
Plaza Trulson Field Less than 1 0 Less than 1
Richardton Richardton 0 0 0
Rolette Rolette Less than 1 0 Less than 1
Rolla Rolla Municipal 7 8 15
Rugby Rugby Municipal 9 7 16
St. Thomas St. Thomas Municipal 3 3 6

A-13
Associated City Airport NameFirst Round
EmploymentSecondary
EmploymentTotal
Employment
Stanley Stanley Municipal 3 1 4
Tioga Tioga Municipal 4 4 8
Towner Towner Municipal 2 1 3
Turtle Lake Turtle Lake Municipal Less than 1 0 Less than 1
Valley City Barnes County Municipal 15 14 29
Wahpeton Harry Stern 45 44 89
Walhalla Walhalla Municipal 7 6 13
Washburn Washburn Municipal 3 3 6
Watford City Watford City Municipal 10 9 19
West Fargo West Fargo Municipal 9 11 20
Westhope Westhope Municipal Less than 1 0 Less than 1
Wishek Wishek Municipal Less than 1 0 Less than 1
GENErAl AvIATIoN AIrporTS ToTAl 432 409 841 All AIrporTS ToTAl 3,377 3,205 6,582
Source: Wilbur Smith Associates and RIMS II Multipliers.
Prepared: December 2010.

A-14
Table A-7: North Dakota General Aviation visitor-related Employment
Associated City Airport NameFirst Round
EmploymentSecondary
EmploymentTotal
Employment
CommErCIAl SErvICE AIrporTS
Bismarck Bismarck 65 18 83
Devils Lake Devils Lake Regional 11 4 15
DickinsonDickinson-Theodore Roosevelt Regional
6 2 8
Fargo Hector International 77 21 98
Grand Forks Grand Forks International 91 25 116
Jamestown Jamestown Regional 18 5 23
Minot Minot International 36 10 46
Williston Sloulin Field International 19 6 25
CommErCIAl SErvICE AIrporTS ToTAl 323 91 414 GENErAl AvIATIoN AIrporTS
Arthur Arthur 0 0 0
Ashley Ashley Municipal 1 0 1
Beach Beach 1 0 1
Beulah Beulah 2 1 3
Bottineau Bottineau Municipal 0 0 0
Bowbells Bowbells Municipal 0 0 0
Bowman Bowman Municipal 1 0 1
Cando Cando Municipal 1 0 1
Carrington Carrington Municipal 1 0 1
Casselton Casselton Robert Miller Regional 7 2 9
Cavalier Cavalier Municipal 0 0 0
Columbus Columbus Municipal 0 0 0
Cooperstown Cooperstown Municipal 0 0 0
Crosby Crosby Municipal 0 0 0
Drayton Drayton Municipal 0 0 0
Edgeley Edgeley Municipal 0 0 0
Elgin Elgin Municipal 0 0 0
Ellendale Ellendale Municipal 1 1 2
Enderlin Sky Haven 0 0 0
Fessenden Fessenden Municipal 0 0 0
Fort Yates Standing Rock 0 0 0
Gackle Gackle Municipal 0 0 0
Garrison Garrison Municipal 2 1 3
Garrison Dam Garrison Dam Recreational Airpark 0 0 0
Glen Ullin Glen Ullin Regional 0 0 0
Grafton Hutson Field 3 0 3
Gwinner Gwinner-Roger Melroe Field 2 0 2
Harvey Harvey Municipal 0 0 0
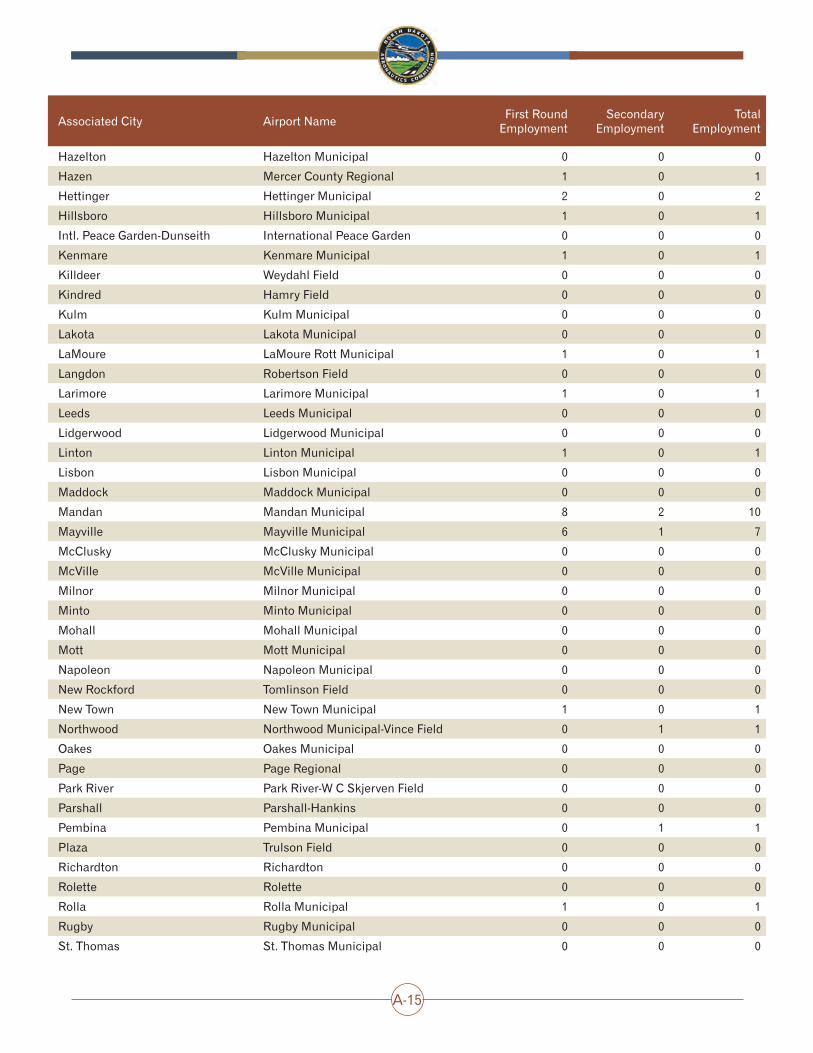
A-15
Associated City Airport NameFirst Round
EmploymentSecondary
EmploymentTotal
Employment
Hazelton Hazelton Municipal 0 0 0
Hazen Mercer County Regional 1 0 1
Hettinger Hettinger Municipal 2 0 2
Hillsboro Hillsboro Municipal 1 0 1
Intl. Peace Garden-Dunseith International Peace Garden 0 0 0
Kenmare Kenmare Municipal 1 0 1
Killdeer Weydahl Field 0 0 0
Kindred Hamry Field 0 0 0
Kulm Kulm Municipal 0 0 0
Lakota Lakota Municipal 0 0 0
LaMoure LaMoure Rott Municipal 1 0 1
Langdon Robertson Field 0 0 0
Larimore Larimore Municipal 1 0 1
Leeds Leeds Municipal 0 0 0
Lidgerwood Lidgerwood Municipal 0 0 0
Linton Linton Municipal 1 0 1
Lisbon Lisbon Municipal 0 0 0
Maddock Maddock Municipal 0 0 0
Mandan Mandan Municipal 8 2 10
Mayville Mayville Municipal 6 1 7
McClusky McClusky Municipal 0 0 0
McVille McVille Municipal 0 0 0
Milnor Milnor Municipal 0 0 0
Minto Minto Municipal 0 0 0
Mohall Mohall Municipal 0 0 0
Mott Mott Municipal 0 0 0
Napoleon Napoleon Municipal 0 0 0
New Rockford Tomlinson Field 0 0 0
New Town New Town Municipal 1 0 1
Northwood Northwood Municipal-Vince Field 0 1 1
Oakes Oakes Municipal 0 0 0
Page Page Regional 0 0 0
Park River Park River-W C Skjerven Field 0 0 0
Parshall Parshall-Hankins 0 0 0
Pembina Pembina Municipal 0 1 1
Plaza Trulson Field 0 0 0
Richardton Richardton 0 0 0
Rolette Rolette 0 0 0
Rolla Rolla Municipal 1 0 1
Rugby Rugby Municipal 0 0 0
St. Thomas St. Thomas Municipal 0 0 0

A-16
Associated City Airport NameFirst Round
EmploymentSecondary
EmploymentTotal
Employment
Stanley Stanley Municipal 0 1 1
Tioga Tioga Municipal 7 2 9
Towner Towner Municipal 0 0 0
Turtle Lake Turtle Lake Municipal 0 0 0
Valley City Barnes County Municipal 2 0 2
Wahpeton Harry Stern 4 1 5
Walhalla Walhalla Municipal 0 0 0
Washburn Washburn Municipal 0 0 0
Watford City Watford City Municipal 1 1 2
West Fargo West Fargo Municipal 3 1 4
Westhope Westhope Municipal 0 0 0
Wishek Wishek Municipal 0 0 0
GENErAl AvIATIoN AIrporTS ToTAl 63 16 79 All AIrporTS ToTAl 386 107 493
Source: Wilbur Smith Associates and RIMS II Multipliers.
Prepared: December 2010.

A-17
Table A-8: North Dakota Commercial Service visitor-related Employment
Associated City Airport NameFirst Round
EmploymentSecondary
EmploymentTotal Employment
CommErCIAl SErvICE AIrporTS
Bismarck Bismarck 413 139 552
Devils Lake Devils Lake Regional 10 3 13
Dickinson Dickinson-Theodore Roosevelt Regional 88 30 118
Fargo Hector International 958 322 1,280
Grand Forks Grand Forks International 190 64 254
Jamestown Jamestown Regional 10 3 13
Minot Minot International 279 94 373
Williston Sloulin Field International 85 29 114
CommErCIAl SErvICE AIrporTS ToTAl 2,033 684 2,717 Source: Wilbur Smith Associates and RIMS II Multipliers.
Prepared: December 2010.

A-18
Table A-9: North Dakota Airport’s Total Employment
Associated City Airport NameTotal First
Round Employment
Total Secondary
Employment
Total Employment
CommErCIAl SErvICE AIrporTS
Bismarck Bismarck 968 604 1,572
Devils Lake Devils Lake Regional 59 40 99
DickinsonDickinson-Theodore Roosevelt Regional
132 72 204
Fargo Hector International 2,404 1,597 4,001
Grand Forks Grand Forks International 1,030 858 1,888
Jamestown Jamestown Regional 70 51 121
Minot Minot International 474 258 732
Williston Sloulin Field International 164 91 255
CommErCIAl SErvICE AIrporTS ToTAl 5,301 3,571 8,872 GENErAl AvIATIoN AIrporTS
Arthur Arthur Less than 1 0 Less than 1
Ashley Ashley Municipal 6 4 10
Beach Beach 1 0 1
Beulah Beulah 16 16 32
Bottineau Bottineau Municipal 6 7 13
Bowbells Bowbells Municipal Less than 1 0 Less than 1
Bowman Bowman Municipal 9 7 16
Cando Cando Municipal 3 3 6
Carrington Carrington Municipal 6 5 11
Casselton Casselton Robert Miller Regional 25 22 47
Cavalier Cavalier Municipal 8 8 16
Columbus Columbus Municipal Less than 1 0 Less than 1
Cooperstown Cooperstown Municipal 3 3 6
Crosby Crosby Municipal 6 6 12
Drayton Drayton Municipal 4 3 7
Edgeley Edgeley Municipal 4 2 6
Elgin Elgin Municipal Less than 1 0 Less than 1
Ellendale Ellendale Municipal 2 1 3
Enderlin Sky Haven 1 1 2
Fessenden Fessenden Municipal 7 7 14
Fort Yates Standing Rock 6 4 10
Gackle Gackle Municipal Less than 1 0 Less than 1
Garrison Garrison Municipal 4 2 6
Garrison Dam Garrison Dam Recreational Airpark 1 0 1
Glen Ullin Glen Ullin Regional Less than 1 0 Less than 1
Grafton Hutson Field 20 16 36
Gwinner Gwinner-Roger Melroe Field 11 8 19
Harvey Harvey Municipal 13 13 26

A-19
Associated City Airport NameTotal First
Round Employment
Total Secondary
Employment
Total Employment
Hazelton Hazelton Municipal 6 6 12
Hazen Mercer County Regional 5 3 8
Hettinger Hettinger Municipal 12 9 21
Hillsboro Hillsboro Municipal 15 15 30
International Peace Garden-Dunseith
International Peace Garden 1 1 2
Kenmare Kenmare Municipal 4 3 7
Killdeer Weydahl Field Less than 1 0 Less than 1
Kindred Hamry Field 18 17 35
Kulm Kulm Municipal Less than 1 0 Less than 1
Lakota Lakota Municipal 3 1 4
LaMoure LaMoure Rott Municipal 6 5 11
Langdon Robertson Field 6 8 14
Larimore Larimore Municipal 12 14 26
Leeds Leeds Municipal Less than 1 0 Less than 1
Lidgerwood Lidgerwood Municipal Less than 1 0 Less than 1
Linton Linton Municipal 5 3 8
Lisbon Lisbon Municipal 6 6 12
Maddock Maddock Municipal 6 5 11
Mandan Mandan Municipal 19 12 31
Mayville Mayville Municipal 11 5 16
McClusky McClusky Municipal 1 0 1
McVille McVille Municipal Less than 1 0 Less than 1
Milnor Milnor Municipal Less than 1 0 Less than 1
Minto Minto Municipal Less than 1 0 Less than 1
Mohall Mohall Municipal 11 11 22
Mott Mott Municipal 10 7 17
Napoleon Napoleon Municipal 3 3 6
New Rockford Tomlinson Field 4 4 8
New Town New Town Municipal 1 - 1
Northwood Northwood Municipal-Vince Field 4 3 7
Oakes Oakes Municipal 4 3 7
Page Page Regional 8 9 17
Park River Park River-W C Skjerven Field 12 12 24
Parshall Parshall-Hankins 2 2 4
Pembina Pembina Municipal 3 3 6
Plaza Trulson Field Less than 1 0 Less than 1
Richardton Richardton 0 0 0
Rolette Rolette Less than 1 0 Less than 1
Rolla Rolla Municipal 8 8 16
Rugby Rugby Municipal 9 7 16

A-20
Associated City Airport NameTotal First
Round Employment
Total Secondary
Employment
Total Employment
St. Thomas St. Thomas Municipal 3 3 6
Stanley Stanley Municipal 3 2 5
Tioga Tioga Municipal 11 6 17
Towner Towner Municipal 2 1 3
Turtle Lake Turtle Lake Municipal Less than 1 0 Less than 1
Valley City Barnes County Municipal 17 14 31
Wahpeton Harry Stern 49 45 94
Walhalla Walhalla Municipal 7 6 13
Washburn Washburn Municipal 3 3 6
Watford City Watford City Municipal 11 10 21
West Fargo West Fargo Municipal 12 12 24
Westhope Westhope Municipal Less than 1 0 Less than 1
Wishek Wishek Municipal Less than 1 0 Less than 1
GENErAl AvIATIoN AIrporTS ToTAl 495 425 920 All AIrporTS ToTAl 5,796 3,996 9,792
Source: Wilbur Smith Associates and RIMS II Multipliers.
Prepared: December 2010.

A-21
Table A-10: North Dakota on-Airport payroll
Associated City Airport NameFirst Round
PayrollSecondary
PayrollTotal
Payroll
CommErCIAl SErvICE AIrporTS
Bismarck Bismarck $ 24,675,400 $ 17,560,900 $ 42,236,300
Devils Lake Devils Lake Regional $ 1,462,500 $ 975,000 $ 2,437,500
DickinsonDickinson-Theodore Roosevelt Regional
$ 1,569,900 $ 1,131,800 $ 2,701,700
Fargo Hector International $ 77,707,100 $ 57,512,300 $ 135,219,400
Grand Forks Grand Forks International $ 34,611,400 $ 24,834,600 $ 59,446,000
Jamestown Jamestown Regional $ 1,608,400 $ 1,134,000 $ 2,742,400
Minot Minot International $ 7,094,100 $ 5,087,600 $ 12,181,700
Williston Sloulin Field International $ 2,525,700 $ 1,734,800 $ 4,260,500
CommErCIAl SErvICE AIrporTS ToTAl $ 151,254,500 $ 109,971,000 $ 261,225,500 GENErAl AvIATIoN AIrporTS
Arthur Arthur $2,900 $2,300 $5,200
Ashley Ashley Municipal $ 156,000 $ 96,100 $ 252,100
Beach Beach $8,400 $5,000 $ 13,400
Beulah Beulah $ 531,600 $ 377,300 $ 908,900
Bottineau Bottineau Municipal $ 215,500 $ 144,300 $ 359,800
Bowbells Bowbells Municipal $2,900 $2,300 $5,200
Bowman Bowman Municipal $ 136,300 $ 97,600 $ 233,900
Cando Cando Municipal $ 75,300 $ 52,800 $ 128,100
Carrington Carrington Municipal $ 155,400 $ 102,900 $ 258,300
Casselton Casselton Robert Miller Regional $ 659,700 $ 453,500 $ 1,113,200
Cavalier Cavalier Municipal $ 234,600 $ 160,800 $ 395,400
Columbus Columbus Municipal $2,900 $2,300 $5,200
Cooperstown Cooperstown Municipal $ 92,600 $ 57,300 $ 149,900
Crosby Crosby Municipal $ 208,200 $ 149,200 $ 357,400
Drayton Drayton Municipal $ 116,300 $ 78,100 $ 194,400
Edgeley Edgeley Municipal $ 84,400 $ 49,000 $ 133,400
Elgin Elgin Municipal $2,900 $2,300 $5,200
Ellendale Ellendale Municipal $ 23,600 $ 12,800 $ 36,400
Enderlin Sky Haven $ 43,800 $ 23,000 $ 66,800
Fessenden Fessenden Municipal $ 240,300 $ 174,300 $ 414,600
Fort Yates Standing Rock $ 191,600 $ 98,100 $ 289,700
Gackle Gackle Municipal $2,900 $2,300 $5,200
Garrison Garrison Municipal $ 97,700 $ 64,000 $ 161,700
Garrison Dam Garrison Dam Recreational Airpark $1,000 $ 800 $1,800
Glen Ullin Glen Ullin Regional $ 11,700 $6,700 $ 18,400
Grafton Hutson Field $ 532,100 $ 379,300 $ 911,400
Gwinner Gwinner-Roger Melroe Field $ 148,600 $ 87,000 $ 235,600
Harvey Harvey Municipal $ 468,900 $ 328,100 $ 797,000

A-22
Associated City Airport NameFirst Round
PayrollSecondary
PayrollTotal
Payroll
Hazelton Hazelton Municipal $ 198,300 $ 143,800 $ 342,100
Hazen Mercer County Regional $ 74,800 $ 43,100 $ 117,900
Hettinger Hettinger Municipal $ 317,900 $ 227,000 $ 544,900
Hillsboro Hillsboro Municipal $ 405,500 $ 291,000 $ 696,500
Intl. Peace Garden-Dunseith International Peace Garden $ 17,000 $9,200 $ 26,200
Kenmare Kenmare Municipal $ 90,200 $ 62,700 $ 152,900
Killdeer Weydahl Field $3,600 $2,600 $6,200
Kindred Hamry Field $ 705,200 $ 494,600 $ 1,199,800
Kulm Kulm Municipal $4,600 $3,200 $7,800
Lakota Lakota Municipal $ 64,600 $ 34,300 $ 98,900
LaMoure LaMoure Rott Municipal $ 186,400 $ 133,400 $ 319,800
Langdon Robertson Field $ 236,500 $ 168,200 $ 404,700
Larimore Larimore Municipal $ 439,700 $ 318,800 $ 758,500
Leeds Leeds Municipal $3,200 $2,400 $5,600
Lidgerwood Lidgerwood Municipal $1,500 $ 700 $2,200
Linton Linton Municipal $ 123,300 $ 83,000 $ 206,300
Lisbon Lisbon Municipal $ 233,200 $ 160,000 $ 393,200
Maddock Maddock Municipal $ 212,800 $ 154,700 $ 367,500
Mandan Mandan Municipal $ 445,800 $ 304,600 $ 750,400
Mayville Mayville Municipal $ 143,900 $ 93,100 $ 237,000
McClusky McClusky Municipal $8,800 $6,800 $ 15,600
McVille McVille Municipal $ 900 $ 400 $1,300
Milnor Milnor Municipal $3,800 $2,700 $6,500
Minto Minto Municipal $3,500 $2,500 $6,000
Mohall Mohall Municipal $ 402,800 $ 261,300 $ 664,100
Mott Mott Municipal $ 273,200 $ 148,300 $ 421,500
Napoleon Napoleon Municipal $ 106,400 $ 64,200 $ 170,600
New Rockford Tomlinson Field $ 134,100 $ 96,500 $ 230,600
New Town New Town Municipal $9,200 $4,700 $ 13,900
Northwood Northwood Municipal-Vince Field $ 108,300 $ 70,000 $ 178,300
Oakes Oakes Municipal $ 117,500 $ 83,300 $ 200,800
Page Page Regional $ 285,800 $ 213,500 $ 499,300
Park River Park River-W C Skjerven Field $ 402,000 $ 277,200 $ 679,200
Parshall Parshall-Hankins $ 56,700 $ 34,400 $ 91,100
Pembina Pembina Municipal $ 98,000 $ 49,800 $ 147,800
Plaza Trulson Field $2,900 $2,300 $5,200
Richardton Richardton $0 $0 $0
Rolette Rolette $1,700 $ 900 $2,600
Rolla Rolla Municipal $ 347,200 $ 249,900 $ 597,100
Rugby Rugby Municipal $ 215,300 $ 134,300 $ 349,600
St. Thomas St. Thomas Municipal $ 100,000 $ 70,500 $ 170,500

A-23
Associated City Airport NameFirst Round
PayrollSecondary
PayrollTotal
Payroll
Stanley Stanley Municipal $ 70,500 $ 46,700 $ 117,200
Tioga Tioga Municipal $ 129,800 $ 91,100 $ 220,900
Towner Towner Municipal $ 65,800 $ 47,500 $ 113,300
Turtle Lake Turtle Lake Municipal $1,300 $ 700 $2,000
Valley City Barnes County Municipal $ 360,200 $ 217,100 $ 577,300
Wahpeton Harry Stern $ 1,488,600 $ 985,200 $ 2,473,800
Walhalla Walhalla Municipal $ 180,800 $ 115,100 $ 295,900
Washburn Washburn Municipal $ 89,900 $ 51,200 $ 141,100
Watford City Watford City Municipal $ 275,500 $ 190,800 $ 466,300
West Fargo West Fargo Municipal $ 213,300 $ 150,400 $ 363,700
Westhope Westhope Municipal $ 800 $ 400 $1,200
Wishek Wishek Municipal $3,700 $2,700 $6,400
GENErAl AvIATIoN AIrporTS ToTAl $13,914,400 $ 9,412,300 $23,326,700 All AIrporTS ToTAl $ 165,168,900 $ 119,383,300 $ 284,552,200
Source: Wilbur Smith Associates and RIMS II Multipliers.
Prepared: December 2010.

A-24
Table A-11: North Dakota General Aviation visitor-related payroll
Associated City Airport NameFirst Round
PayrollSecondary
PayrollTotal
Payroll
CommErCIAl SErvICE AIrporTS
Bismarck Bismarck $ 1,386,600 $785,600 $2,172,200
Devils Lake Devils Lake Regional $245,200 $138,900 $ 384,100
DickinsonDickinson-Theodore Roosevelt Regional
$133,300 $75,500 $ 208,800
Fargo Hector International $ 1,654,100 $937,200 $2,591,300
Grand Forks Grand Forks International $ 1,940,600 $ 1,099,500 $3,040,100
Jamestown Jamestown Regional $381,700 $216,300 $ 598,000
Minot Minot International $766,500 $434,200 $1,200,700
Williston Sloulin Field International $414,300 $234,700 $ 649,000
CommErCIAl SErvICE AIrporTS ToTAl $ 6,922,300 $ 3,921,900 $ 10,844,200 GENErAl AvIATIoN AIrporTS
Arthur Arthur $0 $0 $ 0
Ashley Ashley Municipal $12,900 $ 7,300 $20,200
Beach Beach $19,300 $10,900 $30,200
Beulah Beulah $46,200 $26,200 $72,400
Bottineau Bottineau Municipal $4,000 $ 2,300 $ 6,300
Bowbells Bowbells Municipal $0 $0 $ 0
Bowman Bowman Municipal $17,300 $ 9,800 $27,100
Cando Cando Municipal $11,300 $ 6,500 $17,800
Carrington Carrington Municipal $14,800 $ 8,400 $23,200
Casselton Casselton Robert Miller Regional $143,100 $81,000 $ 224,100
Cavalier Cavalier Municipal $2,100 $ 1,300 $ 3,400
Columbus Columbus Municipal $ 100 $ 100 $200
Cooperstown Cooperstown Municipal $5,200 $ 2,900 $ 8,100
Crosby Crosby Municipal $7,900 $ 4,400 $12,300
Drayton Drayton Municipal $0 $0 $ 0
Edgeley Edgeley Municipal $1,900 $ 1,000 $ 2,900
Elgin Elgin Municipal $ 100 $0 $100
Ellendale Ellendale Municipal $30,300 $17,100 $47,400
Enderlin Sky Haven $3,900 $ 2,300 $ 6,200
Fessenden Fessenden Municipal $0 $0 $ 0
Fort Yates Standing Rock $ 600 $ 400 $ 1,000
Gackle Gackle Municipal $0 $0 $ 0
Garrison Garrison Municipal $47,400 $26,800 $74,200
Garrison Dam Garrison Dam Recreational Airpark $ 100 $ 100 $200
Glen Ullin Glen Ullin Regional $3,400 $ 2,000 $ 5,400
Grafton Hutson Field $54,700 $30,900 $85,600
Gwinner Gwinner-Roger Melroe Field $34,100 $19,300 $53,400
Harvey Harvey Municipal $ 400 $ 200 $600
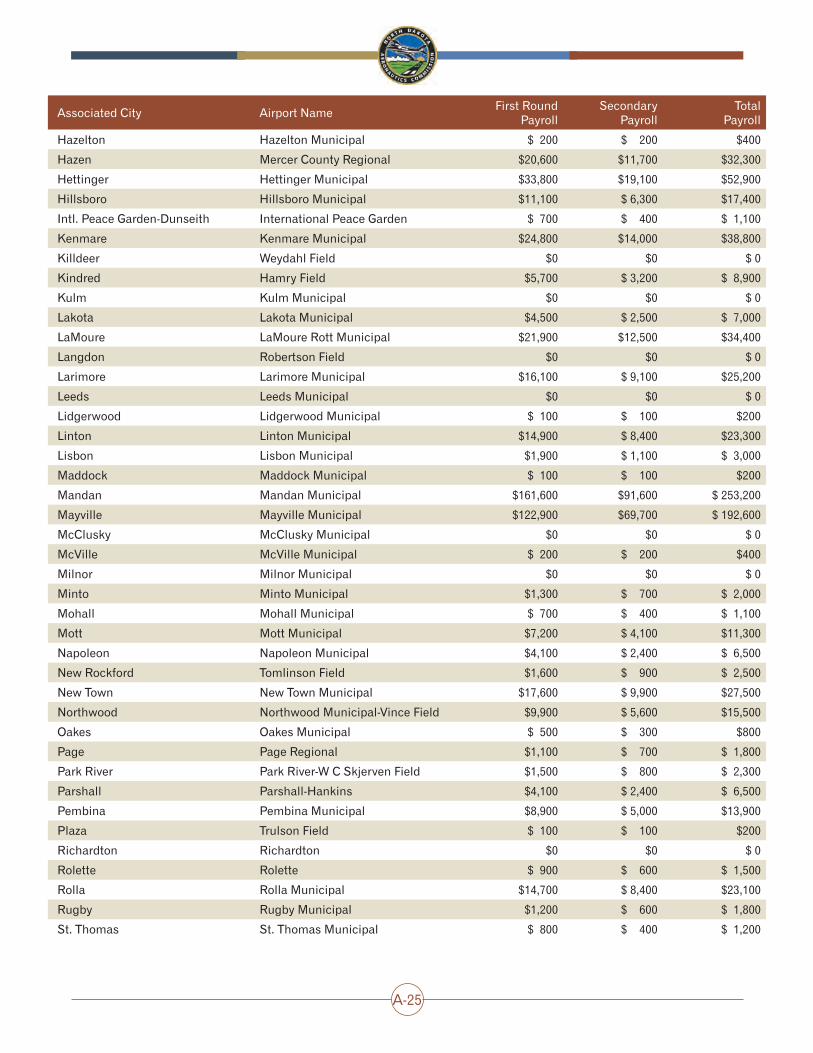
A-25
Associated City Airport NameFirst Round
PayrollSecondary
PayrollTotal
Payroll
Hazelton Hazelton Municipal $ 200 $ 200 $400
Hazen Mercer County Regional $20,600 $11,700 $32,300
Hettinger Hettinger Municipal $33,800 $19,100 $52,900
Hillsboro Hillsboro Municipal $11,100 $ 6,300 $17,400
Intl. Peace Garden-Dunseith International Peace Garden $ 700 $ 400 $ 1,100
Kenmare Kenmare Municipal $24,800 $14,000 $38,800
Killdeer Weydahl Field $0 $0 $ 0
Kindred Hamry Field $5,700 $ 3,200 $ 8,900
Kulm Kulm Municipal $0 $0 $ 0
Lakota Lakota Municipal $4,500 $ 2,500 $ 7,000
LaMoure LaMoure Rott Municipal $21,900 $12,500 $34,400
Langdon Robertson Field $0 $0 $ 0
Larimore Larimore Municipal $16,100 $ 9,100 $25,200
Leeds Leeds Municipal $0 $0 $ 0
Lidgerwood Lidgerwood Municipal $ 100 $ 100 $200
Linton Linton Municipal $14,900 $ 8,400 $23,300
Lisbon Lisbon Municipal $1,900 $ 1,100 $ 3,000
Maddock Maddock Municipal $ 100 $ 100 $200
Mandan Mandan Municipal $161,600 $91,600 $ 253,200
Mayville Mayville Municipal $122,900 $69,700 $ 192,600
McClusky McClusky Municipal $0 $0 $ 0
McVille McVille Municipal $ 200 $ 200 $400
Milnor Milnor Municipal $0 $0 $ 0
Minto Minto Municipal $1,300 $ 700 $ 2,000
Mohall Mohall Municipal $ 700 $ 400 $ 1,100
Mott Mott Municipal $7,200 $ 4,100 $11,300
Napoleon Napoleon Municipal $4,100 $ 2,400 $ 6,500
New Rockford Tomlinson Field $1,600 $ 900 $ 2,500
New Town New Town Municipal $17,600 $ 9,900 $27,500
Northwood Northwood Municipal-Vince Field $9,900 $ 5,600 $15,500
Oakes Oakes Municipal $ 500 $ 300 $800
Page Page Regional $1,100 $ 700 $ 1,800
Park River Park River-W C Skjerven Field $1,500 $ 800 $ 2,300
Parshall Parshall-Hankins $4,100 $ 2,400 $ 6,500
Pembina Pembina Municipal $8,900 $ 5,000 $13,900
Plaza Trulson Field $ 100 $ 100 $200
Richardton Richardton $0 $0 $ 0
Rolette Rolette $ 900 $ 600 $ 1,500
Rolla Rolla Municipal $14,700 $ 8,400 $23,100
Rugby Rugby Municipal $1,200 $ 600 $ 1,800
St. Thomas St. Thomas Municipal $ 800 $ 400 $ 1,200
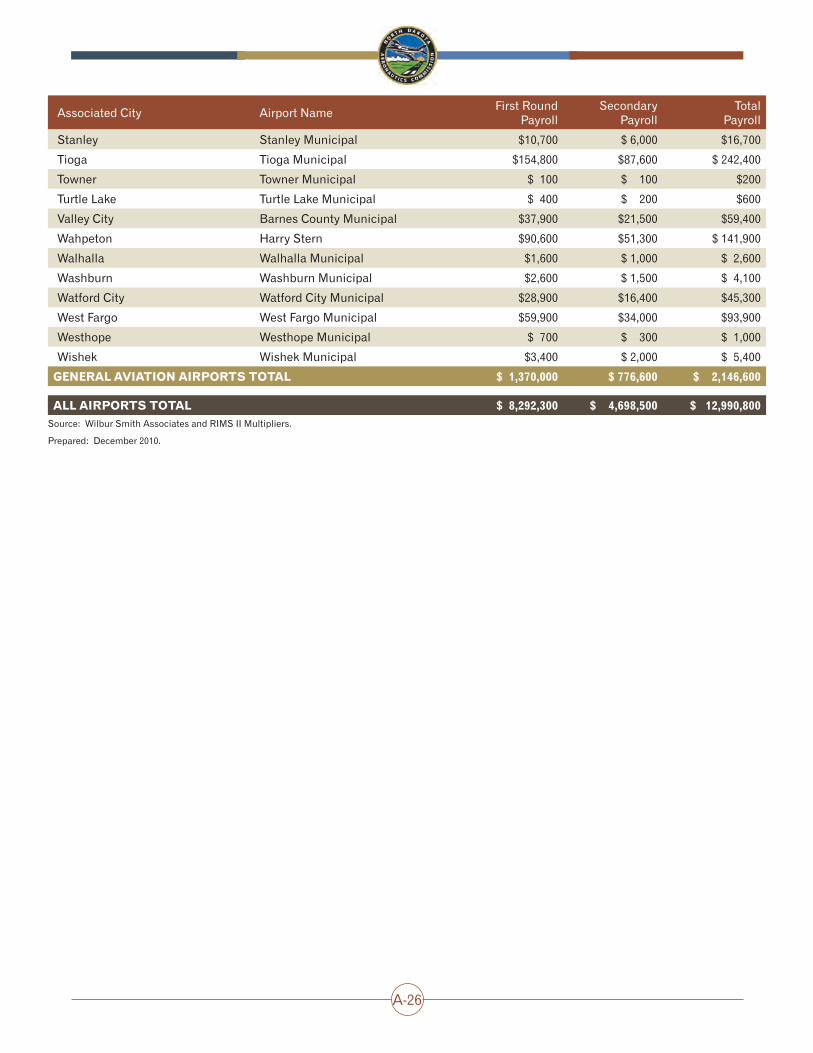
A-26
Associated City Airport NameFirst Round
PayrollSecondary
PayrollTotal
Payroll
Stanley Stanley Municipal $10,700 $ 6,000 $16,700
Tioga Tioga Municipal $154,800 $87,600 $ 242,400
Towner Towner Municipal $ 100 $ 100 $200
Turtle Lake Turtle Lake Municipal $ 400 $ 200 $600
Valley City Barnes County Municipal $37,900 $21,500 $59,400
Wahpeton Harry Stern $90,600 $51,300 $ 141,900
Walhalla Walhalla Municipal $1,600 $ 1,000 $ 2,600
Washburn Washburn Municipal $2,600 $ 1,500 $ 4,100
Watford City Watford City Municipal $28,900 $16,400 $45,300
West Fargo West Fargo Municipal $59,900 $34,000 $93,900
Westhope Westhope Municipal $ 700 $ 300 $ 1,000
Wishek Wishek Municipal $3,400 $ 2,000 $ 5,400
GENErAl AvIATIoN AIrporTS ToTAl $ 1,370,000 $ 776,600 $ 2,146,600 All AIrporTS ToTAl $ 8,292,300 $ 4,698,500 $ 12,990,800
Source: Wilbur Smith Associates and RIMS II Multipliers.
Prepared: December 2010.

A-27
Table A-12: North Dakota Commercial Service visitor-related payroll
Associated City Airport Name First Round Payroll Secondary PayrollTotal
Payroll
CommErCIAl SErvICE AIrporTS
Bismarck Bismarck $8,838,200 $5,040,200 $13,878,400
Devils Lake Devils Lake Regional $214,000 $122,000 $336,000
Dickinson Dickinson-Theodore Roosevelt Regional $1,883,200 $1,073,900 $2,957,100
Fargo Hector International $20,501,200 $11,691,200 $32,192,400
Grand Forks Grand Forks International $4,066,000 $2,318,700 $6,384,700
Jamestown Jamestown Regional $214,000 $122,000 $336,000
Minot Minot International $5,970,600 $3,404,900 $9,375,500
Williston Sloulin Field International $1,819,000 $1,037,300 $2,856,300
CommErCIAl SErvICE AIrporTS ToTAl $43,506,200 $24,810,200 $68,316,400 Source: Wilbur Smith Associates and RIMS II Multipliers.
Prepared: December 2010.

A-28
Table A-13: North Dakota Airport’s Total payroll
Associated City Airport NameTotal First Round
PayrollTotal Secondary
PayrollTotal
Payroll
CommErCIAl SErvICE AIrporTS
Bismarck Bismarck $34,900,200 $23,386,700 $58,286,900
Devils Lake Devils Lake Regional $1,921,700 $1,235,900 $3,157,600
DickinsonDickinson-Theodore Roosevelt Regional
$3,586,400 $2,281,200 $5,867,600
Fargo Hector International $99,862,400 $70,140,700 $170,003,100
Grand Forks Grand Forks International $40,618,000 $28,252,800 $68,870,800
Jamestown Jamestown Regional $2,204,100 $1,472,300 $3,676,400
Minot Minot International $13,831,200 $8,926,700 $22,757,900
Williston Sloulin Field International $4,759,000 $3,006,800 $7,765,800
CommErCIAl SErvICE AIrporTS ToTAl $201,683,000 $138,703,100 $340,386,100 GENErAl AvIATIoN AIrporTS
Arthur Arthur $2,900 $2,300 $5,200
Ashley Ashley Municipal $168,900 $103,400 $272,300
Beach Beach $27,700 $15,900 $43,600
Beulah Beulah $577,800 $403,500 $981,300
Bottineau Bottineau Municipal $219,500 $146,600 $366,100
Bowbells Bowbells Municipal $2,900 $2,300 $5,200
Bowman Bowman Municipal $153,600 $107,400 $261,000
Cando Cando Municipal $86,600 $59,300 $145,900
Carrington Carrington Municipal $170,200 $111,300 $281,500
Casselton Casselton Robert Miller Regional $802,800 $534,500 $1,337,300
Cavalier Cavalier Municipal $236,700 $162,100 $398,800
Columbus Columbus Municipal $3,000 $2,400 $5,400
Cooperstown Cooperstown Municipal $97,800 $60,200 $158,000
Crosby Crosby Municipal $216,100 $153,600 $369,700
Drayton Drayton Municipal $116,300 $78,100 $194,400
Edgeley Edgeley Municipal $86,300 $50,000 $136,300
Elgin Elgin Municipal $3,000 $2,300 $5,300
Ellendale Ellendale Municipal $53,900 $29,900 $83,800
Enderlin Sky Haven $47,700 $25,300 $73,000
Fessenden Fessenden Municipal $240,300 $174,300 $414,600
Fort Yates Standing Rock $192,200 $98,500 $290,700
Gackle Gackle Municipal $2,900 $2,300 $5,200
Garrison Garrison Municipal $145,100 $90,800 $235,900
Garrison Dam Garrison Dam Recreational Airpark $1,100 $900 $2,000
Glen Ullin Glen Ullin Regional $15,100 $8,700 $23,800
Grafton Hutson Field $586,800 $410,200 $997,000
Gwinner Gwinner-Roger Melroe Field $182,700 $106,300 $289,000
Harvey Harvey Municipal $469,300 $328,300 $797,600

A-29
Associated City Airport NameTotal First Round
PayrollTotal Secondary
PayrollTotal
Payroll
Hazelton Hazelton Municipal $198,500 $144,000 $342,500
Hazen Mercer County Regional $95,400 $54,800 $150,200
Hettinger Hettinger Municipal $351,700 $246,100 $597,800
Hillsboro Hillsboro Municipal $416,600 $297,300 $713,900
International Peace Garden-Dunseith
International Peace Garden $17,700 $9,600 $27,300
Kenmare Kenmare Municipal $115,000 $76,700 $191,700
Killdeer Weydahl Field $3,600 $2,600 $6,200
Kindred Hamry Field $710,900 $497,800 $1,208,700
Kulm Kulm Municipal $4,600 $3,200 $7,800
Lakota Lakota Municipal $69,100 $36,800 $105,900
LaMoure LaMoure Rott Municipal $208,300 $145,900 $354,200
Langdon Robertson Field $236,500 $168,200 $404,700
Larimore Larimore Municipal $455,800 $327,900 $783,700
Leeds Leeds Municipal $3,200 $2,400 $5,600
Lidgerwood Lidgerwood Municipal $1,600 $800 $2,400
Linton Linton Municipal $138,200 $91,400 $229,600
Lisbon Lisbon Municipal $235,100 $161,100 $396,200
Maddock Maddock Municipal $212,900 $154,800 $367,700
Mandan Mandan Municipal $607,400 $396,200 $1,003,600
Mayville Mayville Municipal $266,800 $162,800 $429,600
McClusky McClusky Municipal $8,800 $6,800 $15,600
McVille McVille Municipal $1,100 $600 $1,700
Milnor Milnor Municipal $3,800 $2,700 $6,500
Minto Minto Municipal $4,800 $3,200 $8,000
Mohall Mohall Municipal $403,500 $261,700 $665,200
Mott Mott Municipal $280,400 $152,400 $432,800
Napoleon Napoleon Municipal $110,500 $66,600 $177,100
New Rockford Tomlinson Field $135,700 $97,400 $233,100
New Town New Town Municipal $26,800 $14,600 $41,400
Northwood Northwood Municipal-Vince Field $118,200 $75,600 $193,800
Oakes Oakes Municipal $118,000 $83,600 $201,600
Page Page Regional $286,900 $214,200 $501,100
Park River Park River-W C Skjerven Field $403,500 $278,000 $681,500
Parshall Parshall-Hankins $60,800 $36,800 $97,600
Pembina Pembina Municipal $106,900 $54,800 $161,700
Plaza Trulson Field $3,000 $2,400 $5,400
Richardton Richardton $0 $0 $0
Rolette Rolette $2,600 $1,500 $4,100
Rolla Rolla Municipal $361,900 $258,300 $620,200
Rugby Rugby Municipal $216,500 $134,900 $351,400
St. Thomas St. Thomas Municipal $100,800 $70,900 $171,700

A-30
Associated City Airport NameTotal First Round
PayrollTotal Secondary
PayrollTotal
Payroll
Stanley Stanley Municipal $81,200 $52,700 $133,900
Tioga Tioga Municipal $284,600 $178,700 $463,300
Towner Towner Municipal $65,900 $47,600 $113,500
Turtle Lake Turtle Lake Municipal $1,700 $900 $2,600
Valley City Barnes County Municipal $398,100 $238,600 $636,700
Wahpeton Harry Stern $1,579,200 $1,036,500 $2,615,700
Walhalla Walhalla Municipal $182,400 $116,100 $298,500
Washburn Washburn Municipal $92,500 $52,700 $145,200
Watford City Watford City Municipal $304,400 $207,200 $511,600
West Fargo West Fargo Municipal $273,200 $184,400 $457,600
Westhope Westhope Municipal $1,500 $700 $2,200
Wishek Wishek Municipal $7,100 $4,700 $11,800
GENErAl AvIATIoN AIrporTS ToTAl $15,284,400 $10,188,900 $25,473,300 All AIrporTS ToTAl $216,967,400 $148,892,000 $365,859,400
Source: Wilbur Smith Associates and RIMS II Multipliers.
Prepared: December 2010.

A-31
Table A-14: North Dakota on-Airport output
Associated City Airport NameFirst Round
OutputSecondary
OutputTotal
Output
CommErCIAl SErvICE AIrporTS
Bismarck Bismarck $ 72,624,100 $ 49,410,500 $ 122,034,600
Devils Lake Devils Lake Regional $ 4,817,900 $ 3,158,300 $7,976,200
DickinsonDickinson-Theodore Roosevelt Regional
$ 5,641,300 $ 3,713,800 $9,355,100
Fargo Hector International $ 197,959,400 $ 141,366,500 $ 339,325,900
Grand Forks Grand Forks International $ 111,138,000 $ 73,703,300 $ 184,841,300
Jamestown Jamestown Regional $ 6,642,900 $ 4,344,600 $ 10,987,500
Minot Minot International $ 26,958,000 $ 17,647,800 $ 44,605,800
Williston Sloulin Field International $ 11,051,900 $ 7,222,300 $ 18,274,200
CommErCIAl SErvICE AIrporTS ToTAl $ 436,833,500 $ 300,567,100 $737,400,600 GENErAl AvIATIoN AIrporTS
Arthur Arthur $ 15,200 $ 11,800 $27,000
Ashley Ashley Municipal $ 684,100 $ 440,900 $1,125,000
Beach Beach $ 34,000 $ 23,700 $57,700
Beulah Beulah $ 2,668,000 $ 1,720,400 $4,388,400
Bottineau Bottineau Municipal $ 1,325,500 $ 854,600 $2,180,100
Bowbells Bowbells Municipal $ 15,200 $ 11,800 $27,000
Bowman Bowman Municipal $ 587,500 $ 381,700 $ 969,200
Cando Cando Municipal $ 498,500 $ 321,800 $ 820,300
Carrington Carrington Municipal $ 1,025,000 $ 672,000 $1,697,000
Casselton Casselton Robert Miller Regional $ 3,634,700 $ 2,341,200 $5,975,900
Cavalier Cavalier Municipal $ 2,007,000 $ 1,292,500 $3,299,500
Columbus Columbus Municipal $ 15,200 $ 11,800 $27,000
Cooperstown Cooperstown Municipal $ 482,000 $ 312,000 $ 794,000
Crosby Crosby Municipal $ 1,430,800 $ 922,400 $2,353,200
Drayton Drayton Municipal $ 723,100 $ 466,200 $1,189,300
Edgeley Edgeley Municipal $ 467,000 $ 301,900 $ 768,900
Elgin Elgin Municipal $ 15,200 $ 11,800 $27,000
Ellendale Ellendale Municipal $ 86,700 $ 57,700 $ 144,400
Enderlin Sky Haven $ 156,200 $ 102,400 $ 258,600
Fessenden Fessenden Municipal $ 1,694,300 $ 1,090,400 $2,784,700
Fort Yates Standing Rock $ 666,700 $ 430,600 $1,097,300
Gackle Gackle Municipal $ 15,200 $ 11,800 $27,000
Garrison Garrison Municipal $ 578,900 $ 376,000 $ 954,900
Garrison Dam Garrison Dam Recreational Airpark $2,000 $1,500 $3,500
Glen Ullin Glen Ullin Regional $ 45,400 $ 31,200 $76,600
Grafton Hutson Field $ 2,144,300 $ 1,412,600 $3,556,900
Gwinner Gwinner-Roger Melroe Field $ 516,000 $ 339,200 $ 855,200
Harvey Harvey Municipal $ 3,161,000 $ 2,039,900 $5,200,900

A-32
Associated City Airport NameFirst Round
OutputSecondary
OutputTotal
Output
Hazelton Hazelton Municipal $ 1,388,400 $ 893,800 $2,282,200
Hazen Mercer County Regional $ 440,300 $ 297,200 $ 737,500
Hettinger Hettinger Municipal $ 1,271,600 $ 873,000 $2,144,600
Hillsboro Hillsboro Municipal $ 2,407,200 $ 1,557,400 $3,964,600
Intl. Peace Garden-Dunseith International Peace Garden $ 52,500 $ 34,100 $86,600
Kenmare Kenmare Municipal $ 576,100 $ 372,500 $ 948,600
Killdeer Weydahl Field $ 17,500 $ 13,200 $30,700
Kindred Hamry Field $ 2,645,800 $ 1,705,900 $4,351,700
Kulm Kulm Municipal $ 21,100 $ 15,500 $36,600
Lakota Lakota Municipal $ 233,200 $ 153,700 $ 386,900
LaMoure LaMoure Rott Municipal $ 1,277,000 $ 823,600 $2,100,600
Langdon Robertson Field $ 1,606,900 $ 1,035,700 $2,642,600
Larimore Larimore Municipal $ 3,093,700 $ 1,992,500 $5,086,200
Leeds Leeds Municipal $ 16,200 $ 12,300 $28,500
Lidgerwood Lidgerwood Municipal $5,500 $3,600 $9,100
Linton Linton Municipal $ 749,900 $ 486,200 $1,236,100
Lisbon Lisbon Municipal $ 1,223,200 $ 788,700 $2,011,900
Maddock Maddock Municipal $ 1,239,000 $ 799,100 $2,038,100
Mandan Mandan Municipal $ 2,316,500 $ 1,530,200 $3,846,700
Mayville Mayville Municipal $ 812,400 $ 522,600 $1,335,000
McClusky McClusky Municipal $9,200 $7,000 $16,200
McVille McVille Municipal $4,200 $2,900 $7,100
Milnor Milnor Municipal $ 18,200 $ 13,700 $31,900
Minto Minto Municipal $ 17,000 $ 12,900 $29,900
Mohall Mohall Municipal $ 2,340,700 $ 1,506,700 $3,847,400
Mott Mott Municipal $ 820,600 $ 528,600 $1,349,200
Napoleon Napoleon Municipal $ 522,100 $ 336,900 $ 859,000
New Rockford Tomlinson Field $ 946,200 $ 610,300 $1,556,500
New Town New Town Municipal $ 91,800 $ 66,600 $ 158,400
Northwood Northwood Municipal-Vince Field $ 614,600 $ 397,200 $1,011,800
Oakes Oakes Municipal $ 818,100 $ 528,800 $1,346,900
Page Page Regional $ 2,516,700 $ 1,620,500 $4,137,200
Park River Park River-W C Skjerven Field $ 1,199,800 $ 773,300 $1,973,100
Parshall Parshall-Hankins $ 279,500 $ 181,700 $ 461,200
Pembina Pembina Municipal $ 344,500 $ 222,200 $ 566,700
Plaza Trulson Field $ 15,200 $ 11,800 $27,000
Richardton Richardton $1,900 $1,500 $3,400
Rolette Rolette $6,300 $4,200 $10,500
Rolla Rolla Municipal $ 1,498,400 $ 967,800 $2,466,200
Rugby Rugby Municipal $ 1,726,800 $ 1,115,900 $2,842,700
St. Thomas St. Thomas Municipal $ 664,600 $ 429,400 $1,094,000

A-33
Associated City Airport NameFirst Round
OutputSecondary
OutputTotal
Output
Stanley Stanley Municipal $ 410,500 $ 267,900 $ 678,400
Tioga Tioga Municipal $ 851,000 $ 551,300 $1,402,300
Towner Towner Municipal $ 462,600 $ 297,600 $ 760,200
Turtle Lake Turtle Lake Municipal $4,500 $3,000 $7,500
Valley City Barnes County Municipal $ 2,517,900 $ 1,628,400 $4,146,300
Wahpeton Harry Stern $ 6,855,900 $ 4,424,300 $ 11,280,200
Walhalla Walhalla Municipal $ 2,252,300 $ 1,451,600 $3,703,900
Washburn Washburn Municipal $ 392,600 $ 254,200 $ 646,800
Watford City Watford City Municipal $ 1,763,600 $ 1,142,700 $2,906,300
West Fargo West Fargo Municipal $ 1,092,100 $ 710,200 $1,802,300
Westhope Westhope Municipal $3,800 $2,500 $6,300
Wishek Wishek Municipal $ 18,000 $ 13,400 $31,400
GENErAl AvIATIoN AIrporTS ToTAl $77,169,900 $49,989,600 $127,159,500 All AIrporTS ToTAl $ 514,003,400 $ 350,556,700 $864,560,100
Source: Wilbur Smith Associates and RIMS II Multipliers.
Prepared: December 2010.

A-34
Table A-15: North Dakota General Aviation visitor-related output
Associated City Airport NameFirst Round
OutputSecondary
OutputTotal
Output
CommErCIAl SErvICE AIrporTS
Bismarck Bismarck $ 2,822,400 $ 1,846,500 $4,668,900
Devils Lake Devils Lake Regional $499,100 $326,500 $ 825,600
DickinsonDickinson-Theodore Roosevelt Regional
$271,300 $177,400 $ 448,700
Fargo Hector International $ 3,367,000 $ 2,202,800 $5,569,800
Grand Forks Grand Forks International $ 3,950,100 $ 2,584,300 $6,534,400
Jamestown Jamestown Regional $777,000 $508,300 $1,285,300
Minot Minot International $ 1,560,200 $ 1,020,700 $2,580,900
Williston Sloulin Field International $843,300 $551,800 $1,395,100
CommErCIAl SErvICE AIrporTS ToTAl $14,090,400 $ 9,218,300 $ 23,308,700 GENErAl AvIATIoN AIrporTS
Arthur Arthur $0 $ 100 $100
Ashley Ashley Municipal $26,300 $17,100 $43,400
Beach Beach $39,200 $25,600 $64,800
Beulah Beulah $94,100 $61,500 $ 155,600
Bottineau Bottineau Municipal $8,200 $ 5,300 $13,500
Bowbells Bowbells Municipal $0 $0 $ 0
Bowman Bowman Municipal $35,300 $23,000 $58,300
Cando Cando Municipal $23,100 $15,100 $38,200
Carrington Carrington Municipal $30,200 $19,700 $49,900
Casselton Casselton Robert Miller Regional $291,200 $190,500 $ 481,700
Cavalier Cavalier Municipal $4,400 $ 2,800 $ 7,200
Columbus Columbus Municipal $ 200 $ 200 $400
Cooperstown Cooperstown Municipal $10,500 $ 6,900 $17,400
Crosby Crosby Municipal $16,000 $10,500 $26,500
Drayton Drayton Municipal $0 $0 $ 0
Edgeley Edgeley Municipal $3,800 $ 2,500 $ 6,300
Elgin Elgin Municipal $ 100 $ 100 $200
Ellendale Ellendale Municipal $61,600 $40,300 $ 101,900
Enderlin Sky Haven $8,000 $ 5,300 $13,300
Fessenden Fessenden Municipal $0 $0 $ 0
Fort Yates Standing Rock $1,300 $ 900 $ 2,200
Gackle Gackle Municipal $0 $0 $ 0
Garrison Garrison Municipal $96,400 $63,100 $ 159,500
Garrison Dam Garrison Dam Recreational Airpark $ 200 $ 200 $400
Glen Ullin Glen Ullin Regional $7,000 $ 4,600 $11,600
Grafton Hutson Field $111,300 $72,700 $ 184,000
Gwinner Gwinner-Roger Melroe Field $69,400 $45,400 $ 114,800
Harvey Harvey Municipal $ 800 $ 500 $ 1,300

A-35
Associated City Airport NameFirst Round
OutputSecondary
OutputTotal
Output
Hazelton Hazelton Municipal $ 500 $ 300 $800
Hazen Mercer County Regional $42,000 $27,500 $69,500
Hettinger Hettinger Municipal $68,800 $44,900 $ 113,700
Hillsboro Hillsboro Municipal $22,600 $14,700 $37,300
Intl. Peace Garden-Dunseith International Peace Garden $1,400 $ 900 $ 2,300
Kenmare Kenmare Municipal $50,400 $33,000 $83,400
Killdeer Weydahl Field $0 $0 $ 0
Kindred Hamry Field $11,600 $ 7,500 $19,100
Kulm Kulm Municipal $0 $0 $ 0
Lakota Lakota Municipal $9,100 $ 6,000 $15,100
LaMoure LaMoure Rott Municipal $44,700 $29,200 $73,900
Langdon Robertson Field $0 $0 $ 0
Larimore Larimore Municipal $32,800 $21,500 $54,300
Leeds Leeds Municipal $0 $0 $ 0
Lidgerwood Lidgerwood Municipal $ 200 $ 200 $400
Linton Linton Municipal $30,200 $19,800 $50,000
Lisbon Lisbon Municipal $3,900 $ 2,500 $ 6,400
Maddock Maddock Municipal $ 200 $ 200 $400
Mandan Mandan Municipal $329,000 $215,200 $ 544,200
Mayville Mayville Municipal $250,300 $163,700 $ 414,000
McClusky McClusky Municipal $0 $0 $ 0
McVille McVille Municipal $ 500 $ 300 $800
Milnor Milnor Municipal $0 $ 100 $100
Minto Minto Municipal $2,600 $ 1,700 $ 4,300
Mohall Mohall Municipal $1,500 $ 900 $ 2,400
Mott Mott Municipal $14,600 $ 9,600 $24,200
Napoleon Napoleon Municipal $8,400 $ 5,500 $13,900
New Rockford Tomlinson Field $3,300 $ 2,100 $ 5,400
New Town New Town Municipal $35,800 $23,400 $59,200
Northwood Northwood Municipal-Vince Field $20,100 $13,100 $33,200
Oakes Oakes Municipal $1,100 $ 600 $ 1,700
Page Page Regional $2,300 $ 1,500 $ 3,800
Park River Park River-W C Skjerven Field $3,000 $ 1,900 $ 4,900
Parshall Parshall-Hankins $8,400 $ 5,500 $13,900
Pembina Pembina Municipal $18,100 $11,800 $29,900
Plaza Trulson Field $ 200 $ 200 $400
Richardton Richardton $0 $0 $ 0
Rolette Rolette $1,900 $ 1,200 $ 3,100
Rolla Rolla Municipal $30,000 $19,600 $49,600
Rugby Rugby Municipal $2,400 $ 1,500 $ 3,900
St. Thomas St. Thomas Municipal $1,600 $ 1,000 $ 2,600

A-36
Associated City Airport NameFirst Round
OutputSecondary
OutputTotal
Output
Stanley Stanley Municipal $21,700 $14,200 $35,900
Tioga Tioga Municipal $315,000 $206,100 $ 521,100
Towner Towner Municipal $ 200 $ 100 $300
Turtle Lake Turtle Lake Municipal $ 800 $ 500 $ 1,300
Valley City Barnes County Municipal $77,200 $50,500 $ 127,700
Wahpeton Harry Stern $184,400 $120,600 $ 305,000
Walhalla Walhalla Municipal $3,300 $ 2,200 $ 5,500
Washburn Washburn Municipal $5,300 $ 3,500 $ 8,800
Watford City Watford City Municipal $58,800 $38,500 $97,300
West Fargo West Fargo Municipal $122,000 $79,800 $ 201,800
Westhope Westhope Municipal $1,300 $ 900 $ 2,200
Wishek Wishek Municipal $7,000 $ 4,600 $11,600
GENErAl AvIATIoN AIrporTS ToTAl $ 2,789,100 $ 1,824,000 $ 4,613,100 All AIrporTS ToTAl $16,879,500 $ 11,042,300 $ 27,921,800
Source: Wilbur Smith Associates and RIMS II Multipliers.
Prepared: December 2010.

A-37
Table A-16: North Dakota Commercial Service visitor-related output
Associated City Airport Name First Round Output Secondary OutputTotal
Output
CommErCIAl SErvICE AIrporTS
Bismarck Bismarck $21,340,800 $13,281,800 $34,622,600
Devils Lake Devils Lake Regional $539,700 $335,900 $875,600
Dickinson Dickinson-Theodore Roosevelt Regional $4,521,200 $2,813,800 $7,335,000
Fargo Hector International $49,456,100 $30,779,700 $80,235,800
Grand Forks Grand Forks International $9,794,200 $6,095,500 $15,889,700
Jamestown Jamestown Regional $512,500 $319,000 $831,500
Minot Minot International $14,406,400 $8,966,100 $23,372,500
Williston Sloulin Field International $4,383,700 $2,728,200 $7,111,900
CommErCIAl SErvICE AIrporTS ToTAl $104,954,600 $65,320,000 $170,274,600 Source: Wilbur Smith Associates and RIMS II Multipliers.
Prepared: December 2010.

A-38
Table A-17: North Dakota Airport’s Total output
Associated City Airport NameTotal First Round
OutputTotal Secondary
OutputTotal
Output
CommErCIAl SErvICE AIrporTS
Bismarck Bismarck $96,787,300 $64,538,800 $161,326,100
Devils Lake Devils Lake Regional $5,856,700 $3,820,700 $9,677,400
DickinsonDickinson-Theodore Roosevelt Regional
$10,433,800 $6,705,000 $17,138,800
Fargo Hector International $250,782,500 $174,349,000 $425,131,500
Grand Forks Grand Forks International $124,882,300 $82,383,100 $207,265,400
Jamestown Jamestown Regional $7,932,400 $5,171,900 $13,104,300
Minot Minot International $42,924,600 $27,634,600 $70,559,200
Williston Sloulin Field International $16,278,900 $10,502,300 $26,781,200
CommErCIAl SErvICE AIrporTS ToTAl $555,878,500 $375,105,400 $930,983,900 GENErAl AvIATIoN AIrporTS
Arthur Arthur $15,200 $11,900 $27,100
Ashley Ashley Municipal $710,400 $458,000 $1,168,400
Beach Beach $73,200 $49,300 $122,500
Beulah Beulah $2,762,100 $1,781,900 $4,544,000
Bottineau Bottineau Municipal $1,333,700 $859,900 $2,193,600
Bowbells Bowbells Municipal $15,200 $11,800 $27,000
Bowman Bowman Municipal $622,800 $404,700 $1,027,500
Cando Cando Municipal $521,600 $336,900 $858,500
Carrington Carrington Municipal $1,055,200 $691,700 $1,746,900
Casselton Casselton Robert Miller Regional $3,925,900 $2,531,700 $6,457,600
Cavalier Cavalier Municipal $2,011,400 $1,295,300 $3,306,700
Columbus Columbus Municipal $15,400 $12,000 $27,400
Cooperstown Cooperstown Municipal $492,500 $318,900 $811,400
Crosby Crosby Municipal $1,446,800 $932,900 $2,379,700
Drayton Drayton Municipal $723,100 $466,200 $1,189,300
Edgeley Edgeley Municipal $470,800 $304,400 $775,200
Elgin Elgin Municipal $15,300 $11,900 $27,200
Ellendale Ellendale Municipal $148,300 $98,000 $246,300
Enderlin Sky Haven $164,200 $107,700 $271,900
Fessenden Fessenden Municipal $1,694,300 $1,090,400 $2,784,700
Fort Yates Standing Rock $668,000 $431,500 $1,099,500
Gackle Gackle Municipal $15,200 $11,800 $27,000
Garrison Garrison Municipal $675,300 $439,100 $1,114,400
Garrison Dam Garrison Dam Recreational Airpark $2,200 $1,700 $3,900
Glen Ullin Glen Ullin Regional $52,400 $35,800 $88,200
Grafton Hutson Field $2,255,600 $1,485,300 $3,740,900
Gwinner Gwinner-Roger Melroe Field $585,400 $384,600 $970,000
Harvey Harvey Municipal $3,161,800 $2,040,400 $5,202,200

A-39
Associated City Airport NameTotal First Round
OutputTotal Secondary
OutputTotal
Output
Hazelton Hazelton Municipal $1,388,900 $894,100 $2,283,000
Hazen Mercer County Regional $482,300 $324,700 $807,000
Hettinger Hettinger Municipal $1,340,400 $917,900 $2,258,300
Hillsboro Hillsboro Municipal $2,429,800 $1,572,100 $4,001,900
International Peace Garden-Dunseith
International Peace Garden $53,900 $35,000 $88,900
Kenmare Kenmare Municipal $626,500 $405,500 $1,032,000
Killdeer Weydahl Field $17,500 $13,200 $30,700
Kindred Hamry Field $2,657,400 $1,713,400 $4,370,800
Kulm Kulm Municipal $21,100 $15,500 $36,600
Lakota Lakota Municipal $242,300 $159,700 $402,000
LaMoure LaMoure Rott Municipal $1,321,700 $852,800 $2,174,500
Langdon Robertson Field $1,606,900 $1,035,700 $2,642,600
Larimore Larimore Municipal $3,126,500 $2,014,000 $5,140,500
Leeds Leeds Municipal $16,200 $12,300 $28,500
Lidgerwood Lidgerwood Municipal $5,700 $3,800 $9,500
Linton Linton Municipal $780,100 $506,000 $1,286,100
Lisbon Lisbon Municipal $1,227,100 $791,200 $2,018,300
Maddock Maddock Municipal $1,239,200 $799,300 $2,038,500
Mandan Mandan Municipal $2,645,500 $1,745,400 $4,390,900
Mayville Mayville Municipal $1,062,700 $686,300 $1,749,000
McClusky McClusky Municipal $9,200 $7,000 $16,200
McVille McVille Municipal $4,700 $3,200 $7,900
Milnor Milnor Municipal $18,200 $13,800 $32,000
Minto Minto Municipal $19,600 $14,600 $34,200
Mohall Mohall Municipal $2,342,200 $1,507,600 $3,849,800
Mott Mott Municipal $835,200 $538,200 $1,373,400
Napoleon Napoleon Municipal $530,500 $342,400 $872,900
New Rockford Tomlinson Field $949,500 $612,400 $1,561,900
New Town New Town Municipal $127,600 $90,000 $217,600
Northwood Northwood Municipal-Vince Field $634,700 $410,300 $1,045,000
Oakes Oakes Municipal $819,200 $529,400 $1,348,600
Page Page Regional $2,519,000 $1,622,000 $4,141,000
Park River Park River-W C Skjerven Field $1,202,800 $775,200 $1,978,000
Parshall Parshall-Hankins $287,900 $187,200 $475,100
Pembina Pembina Municipal $362,600 $234,000 $596,600
Plaza Trulson Field $15,400 $12,000 $27,400
Richardton Richardton $1,900 $1,500 $3,400
Rolette Rolette $8,200 $5,400 $13,600
Rolla Rolla Municipal $1,528,400 $987,400 $2,515,800
Rugby Rugby Municipal $1,729,200 $1,117,400 $2,846,600
St. Thomas St. Thomas Municipal $666,200 $430,400 $1,096,600

A-40
Associated City Airport NameTotal First Round
OutputTotal Secondary
OutputTotal
Output
Stanley Stanley Municipal $432,200 $282,100 $714,300
Tioga Tioga Municipal $1,166,000 $757,400 $1,923,400
Towner Towner Municipal $462,800 $297,700 $760,500
Turtle Lake Turtle Lake Municipal $5,300 $3,500 $8,800
Valley City Barnes County Municipal $2,595,100 $1,678,900 $4,274,000
Wahpeton Harry Stern $7,040,300 $4,544,900 $11,585,200
Walhalla Walhalla Municipal $2,255,600 $1,453,800 $3,709,400
Washburn Washburn Municipal $397,900 $257,700 $655,600
Watford City Watford City Municipal $1,822,400 $1,181,200 $3,003,600
West Fargo West Fargo Municipal $1,214,100 $790,000 $2,004,100
Westhope Westhope Municipal $5,100 $3,400 $8,500
Wishek Wishek Municipal $25,000 $18,000 $43,000
GENErAl AvIATIoN AIrporTS ToTAl $79,959,000 $51,813,600 $131,772,600 All AIrporTS ToTAl $635,837,500 $426,919,000 $1,062,756,500
Source: Wilbur Smith Associates and RIMS II Multipliers.
Prepared: December 2010.

A-41
Table A-18: North Dakota Airport’s Total Economic Impacts
Associated City Airport NameTotal
EmploymentTotal
PayrollTotal
Output
CommErCIAl SErvICE AIrporTS
Bismarck Bismarck 1,572 $58,286,900 $161,326,100
Devils Lake Devils Lake Regional 99 $3,157,600 $9,677,400
DickinsonDickinson-Theodore Roosevelt Regional
204 $5,867,600 $17,138,800
Fargo Hector International 4,001 $170,003,100 $425,131,500
Grand Forks Grand Forks International 1,888 $68,870,800 $207,265,400
Jamestown Jamestown Regional 121 $3,676,400 $13,104,300
Minot Minot International 732 $22,757,900 $70,559,200
Williston Sloulin Field International 255 $7,765,800 $26,781,200
CommErCIAl SErvICE AIrporTS ToTAl 8,872 $340,386,100 $930,983,900 GENErAl AvIATIoN AIrporTS
Arthur Arthur Less than 1 $5,200 $27,100
Ashley Ashley Municipal 10 $272,300 $1,168,400
Beach Beach 1 $43,600 $122,500
Beulah Beulah 32 $981,300 $4,544,000
Bottineau Bottineau Municipal 13 $366,100 $2,193,600
Bowbells Bowbells Municipal Less than 1 $5,200 $27,000
Bowman Bowman Municipal 16 $261,000 $1,027,500
Cando Cando Municipal 6 $145,900 $858,500
Carrington Carrington Municipal 11 $281,500 $1,746,900
Casselton Casselton Robert Miller Regional 47 $1,337,300 $6,457,600
Cavalier Cavalier Municipal 16 $398,800 $3,306,700
Columbus Columbus Municipal Less than 1 $5,400 $27,400
Cooperstown Cooperstown Municipal 6 $158,000 $811,400
Crosby Crosby Municipal 12 $369,700 $2,379,700
Drayton Drayton Municipal 7 $194,400 $1,189,300
Edgeley Edgeley Municipal 6 $136,300 $775,200
Elgin Elgin Municipal Less than 1 $5,300 $27,200
Ellendale Ellendale Municipal 3 $83,800 $246,300
Enderlin Sky Haven 2 $73,000 $271,900
Fessenden Fessenden Municipal 14 $414,600 $2,784,700
Fort Yates Standing Rock 10 $290,700 $1,099,500
Gackle Gackle Municipal Less than 1 $5,200 $27,000
Garrison Garrison Municipal 6 $235,900 $1,114,400
Garrison Dam Garrison Dam Recreational Airpark 1 $2,000 $3,900
Glen Ullin Glen Ullin Regional Less than 1 $23,800 $88,200
Grafton Hutson Field 36 $997,000 $3,740,900
Gwinner Gwinner-Roger Melroe Field 19 $289,000 $970,000
Harvey Harvey Municipal 26 $797,600 $5,202,200

A-42
Associated City Airport NameTotal
EmploymentTotal
PayrollTotal
Output
Hazelton Hazelton Municipal 12 $342,500 $2,283,000
Hazen Mercer County Regional 8 $150,200 $807,000
Hettinger Hettinger Municipal 21 $597,800 $2,258,300
Hillsboro Hillsboro Municipal 30 $713,900 $4,001,900
International Peace Garden-Dunseith
International Peace Garden 2 $27,300 $88,900
Kenmare Kenmare Municipal 7 $191,700 $1,032,000
Killdeer Weydahl Field Less than 1 $6,200 $30,700
Kindred Hamry Field 35 $1,208,700 $4,370,800
Kulm Kulm Municipal Less than 1 $7,800 $36,600
Lakota Lakota Municipal 4 $105,900 $402,000
LaMoure LaMoure Rott Municipal 11 $354,200 $2,174,500
Langdon Robertson Field 14 $404,700 $2,642,600
Larimore Larimore Municipal 26 $783,700 $5,140,500
Leeds Leeds Municipal Less than 1 $5,600 $28,500
Lidgerwood Lidgerwood Municipal Less than 1 $2,400 $9,500
Linton Linton Municipal 8 $229,600 $1,286,100
Lisbon Lisbon Municipal 12 $396,200 $2,018,300
Maddock Maddock Municipal 11 $367,700 $2,038,500
Mandan Mandan Municipal 31 $1,003,600 $4,390,900
Mayville Mayville Municipal 16 $429,600 $1,749,000
McClusky McClusky Municipal 1 $15,600 $16,200
McVille McVille Municipal Less than 1 $1,700 $7,900
Milnor Milnor Municipal Less than 1 $6,500 $32,000
Minto Minto Municipal Less than 1 $8,000 $34,200
Mohall Mohall Municipal 22 $665,200 $3,849,800
Mott Mott Municipal 17 $432,800 $1,373,400
Napoleon Napoleon Municipal 6 $177,100 $872,900
New Rockford Tomlinson Field 8 $233,100 $1,561,900
New Town New Town Municipal 1 $41,400 $217,600
Northwood Northwood Municipal-Vince Field 7 $193,800 $1,045,000
Oakes Oakes Municipal 7 $201,600 $1,348,600
Page Page Regional 17 $501,100 $4,141,000
Park River Park River-W C Skjerven Field 24 $681,500 $1,978,000
Parshall Parshall-Hankins 4 $97,600 $475,100
Pembina Pembina Municipal 6 $161,700 $596,600
Plaza Trulson Field Less than 1 $5,400 $27,400
Richardton Richardton 0 $0 $3,400
Rolette Rolette Less than 1 $4,100 $13,600
Rolla Rolla Municipal 16 $620,200 $2,515,800
Rugby Rugby Municipal 16 $351,400 $2,846,600
St. Thomas St. Thomas Municipal 6 $171,700 $1,096,600

A-43
Associated City Airport NameTotal
EmploymentTotal
PayrollTotal
Output
Stanley Stanley Municipal 5 $133,900 $714,300
Tioga Tioga Municipal 17 $463,300 $1,923,400
Towner Towner Municipal 3 $113,500 $760,500
Turtle Lake Turtle Lake Municipal Less than 1 $2,600 $8,800
Valley City Barnes County Municipal 31 $636,700 $4,274,000
Wahpeton Harry Stern 94 $2,615,700 $11,585,200
Walhalla Walhalla Municipal 13 $298,500 $3,709,400
Washburn Washburn Municipal 6 $145,200 $655,600
Watford City Watford City Municipal 21 $511,600 $3,003,600
West Fargo West Fargo Municipal 24 $457,600 $2,004,100
Westhope Westhope Municipal Less than 1 $2,200 $8,500
Wishek Wishek Municipal Less than 1 $11,800 $43,000
GENErAl AvIATIoN AIrporTS ToTAl 920 $25,473,300 $131,772,600 All AIrporTS ToTAl 9,792 $365,859,400 $1,062,756,500
Source: Wilbur Smith Associates and RIMS II Multipliers.
Prepared: December 2010.

A-44
Tab
le A
-19:
Qu
alit
ativ
e B
enef
its
of N
orth
Dak
ota
Air
por
ts
K
ey:
D =
Dai
ly
W =
Wee
kly
M =
Mon
thly
S =
Sea
sona
l- =
No
acti
vity
Ass
ocia
ted
Cit
yA
irpo
rt N
ame
Recreational flying
Agricultural spraying
Corporate/business activity
Aerial inspections
Air cargo
Flight training
Gateway for resort visitors
Staging area for community events
Police/law enforcement
Prisoner transport
Military exercises/training
Career training/education
Search & rescue
Civil Air Patrol
Environmental patrol
Emergency medical evacuation/patient transfer
Medical doctor transport
Forest/rangeland firefighting
Aerial photography/surveying
Real estate tours
Aerial advertising/banner towing
Youth outreach (Young Eagles, scouting, etc.)
Co
mm
ErC
IAl
SEr
vIC
E A
Irp
or
TS
Bis
mar
ckB
ism
arck
DN
DD
DD
-M
DW
DN
WD
DD
DM
SN
NS
Dev
ils L
ake
Dev
ils L
ake
Reg
iona
lD
SD
MD
WS
MM
MW
NS
WW
WW
-S
WN
S
Dic
kins
onD
icki
nson
-The
odor
e R
oose
velt
R
egio
nal
DS
DS
DW
MN
NN
MN
NW
MM
MS
NN
NW
Farg
oH
ecto
r In
tern
atio
nal
DN
DN
DD
DM
DM
DD
SW
ND
WN
SW
SW
Gra
nd F
orks
Gra
nd F
orks
Inte
rnat
iona
lD
ND
WD
DS
SD
MW
DN
WM
DD
NW
NS
S
Jam
esto
wn
Jam
esto
wn
Reg
iona
lD
SD
SD
SN
SD
NS
NN
WN
DW
NN
NN
S
Min
otM
inot
Inte
rnat
iona
lD
SD
MD
WS
SD
NW
NN
MS
DN
NN
NS
S
Will
isto
nS
loul
in F
ield
Inte
rnat
iona
lD
SD
ND
DW
NM
NN
NN
NN
D-
NN
NN
-
GEN
ErA
l A
vIA
TIo
N A
Irp
or
TS
Art
hur
Art
hur
W-
--
--
--
--
--
--
--
--
--
--
Ash
ley
Ash
ley
Mun
icip
alW
SW
NN
NN
SM
NN
MN
NM
MW
NS
NN
N
Bea
chB
each
DS
DM
M-
M-
M-
M-
MM
MM
M-
M-
--
Beu
lah
Beu
lah
DD
WW
M-
M-
M-
M-
-M
MM
M-
M-
--
Bot
tine
auB
otti
neau
Mun
icip
alD
SD
WN
DD
SD
MW
MS
SS
MW
NS
MS
S
Bow
bells
Bow
bells
Mun
icip
alD
D-
--
--
--
--
--
--
--
--
--
-
Bow
man
Bow
man
Mun
icip
alD
DM
SM
W-
--
--
--
--
-M
-S
--
-
Can
doC
ando
Mun
icip
alW
SM
NN
SN
SS
NN
SN
NS
MM
NS
SM
N
Car
ring
ton
Car
ring
ton
Mun
icip
alD
SW
SN
MS
NS
NN
NN
SS
WW
NS
NN
S
Cas
selt
onC
asse
lton
Rob
ert M
iller
Reg
iona
lD
DW
SS
DN
SD
NM
NS
SN
MN
NS
SN
S
Cav
alie
rC
aval
ier
Mun
icip
alD
SM
SN
NN
SM
NS
NN
SS
MW
NS
NN
M
Col
umbu
sC
olum
bus
Mun
icip
alM
--
--
--
--
--
--
--
--
--
--
-
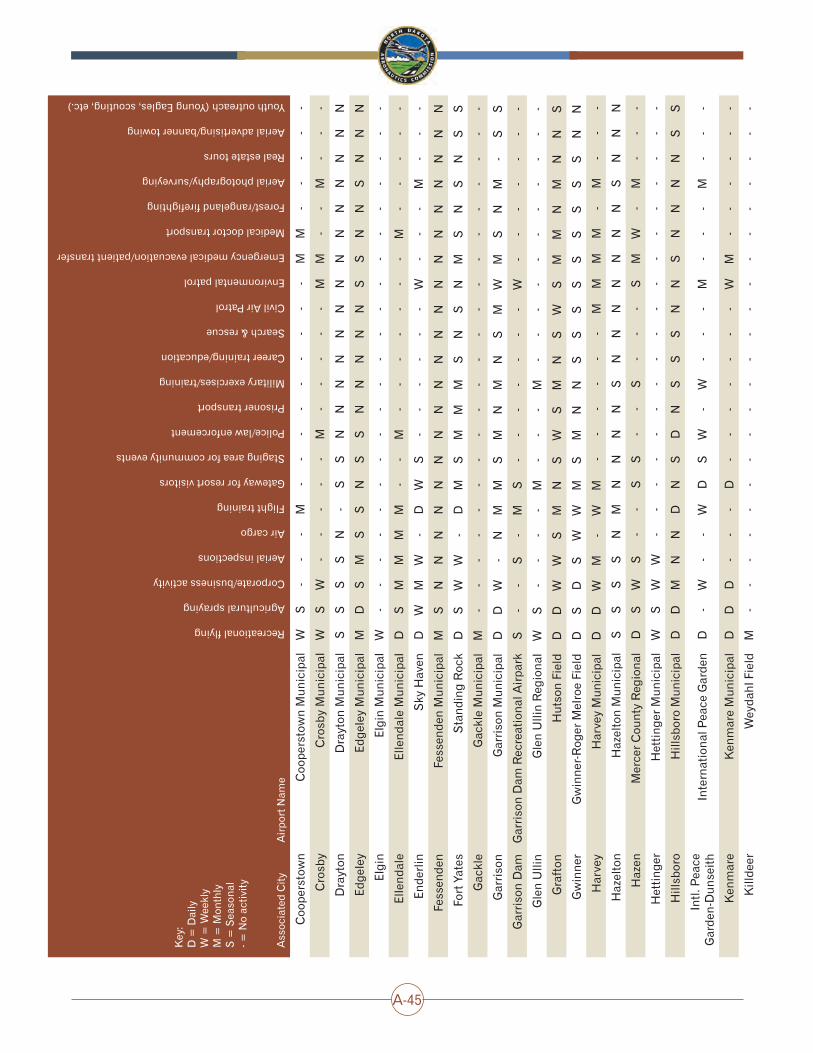
A-45
K
ey:
D =
Dai
ly
W =
Wee
kly
M =
Mon
thly
S =
Sea
sona
l- =
No
acti
vity
Ass
ocia
ted
Cit
yA
irpo
rt N
ame
Recreational flying
Agricultural spraying
Corporate/business activity
Aerial inspections
Air cargo
Flight training
Gateway for resort visitors
Staging area for community events
Police/law enforcement
Prisoner transport
Military exercises/training
Career training/education
Search & rescue
Civil Air Patrol
Environmental patrol
Emergency medical evacuation/patient transfer
Medical doctor transport
Forest/rangeland firefighting
Aerial photography/surveying
Real estate tours
Aerial advertising/banner towing
Youth outreach (Young Eagles, scouting, etc.)
Coo
pers
tow
nC
oope
rsto
wn
Mun
icip
alW
S-
--
M-
--
--
--
--
MM
--
--
-
Cro
sby
Cro
sby
Mun
icip
alW
SW
--
--
-M
--
--
-M
M-
-M
--
-
Dra
yton
Dra
yton
Mun
icip
alS
SS
SN
-S
SN
NN
NN
NN
NN
NN
NN
N
Edge
ley
Edge
ley
Mun
icip
alM
DS
MS
SN
SS
NN
NN
NS
SN
NS
NN
N
Elgi
nEl
gin
Mun
icip
alW
--
--
--
--
--
--
--
--
--
--
-
Elle
ndal
eEl
lend
ale
Mun
icip
alD
SM
MM
M-
-M
--
--
--
-M
--
--
-
Ende
rlin
Sky
Hav
enD
WM
W-
DW
S-
--
--
-W
--
-M
--
-
Fess
ende
nFe
ssen
den
Mun
icip
alM
SN
NN
NN
NN
NN
NN
NN
NN
NN
NN
N
Fort
Yat
esS
tand
ing
Roc
kD
SW
W-
DM
SM
MM
SN
SN
MS
NS
NS
S
Gac
kle
Gac
kle
Mun
icip
alM
--
--
--
--
--
--
--
--
--
--
-
Gar
riso
nG
arri
son
Mun
icip
alD
DW
-N
MM
SM
NM
N
S
M
WM
SN
M-
SS
Gar
riso
n D
amG
arri
son
Dam
Rec
reat
iona
l Air
park
S-
-S
-M
S-
--
--
--
W-
--
--
--
Gle
n U
llin
Gle
n U
llin
Reg
iona
lW
S-
--
-M
--
-M
--
--
--
--
--
-
Gra
fton
Hut
son
Fiel
dD
DW
WS
MN
SW
SM
NS
WS
MM
NM
NN
S
Gw
inne
rG
win
ner-
Rog
er M
elro
e Fi
eld
DS
DS
WW
MS
MN
NS
SS
SS
SS
SS
NN
Har
vey
Har
vey
Mun
icip
alD
DW
M-
WM
--
--
--
MM
MM
-M
--
-
Haz
elto
nH
azel
ton
Mun
icip
alS
SS
SN
MN
NN
NS
NN
NN
NN
NS
NN
N
Haz
enM
erce
r C
ount
y R
egio
nal
DS
WS
--
SS
--
S-
--
SM
W-
M-
--
Het
ting
erH
etti
nger
Mun
icip
alW
SW
W-
--
--
--
--
--
--
--
--
-
Hill
sbor
oH
illsb
oro
Mun
icip
alD
DM
NN
DN
SD
NS
SS
NN
SN
NN
NS
S
Intl
. Pea
ce
Gar
den-
Dun
seit
hIn
tern
atio
nal P
eace
Gar
den
D-
W-
-W
DS
W-
W-
--
M-
--
M-
--
Ken
mar
eK
enm
are
Mun
icip
alD
DD
--
-D
--
--
--
-W
M-
--
--
-
Kill
deer
Wey
dahl
Fie
ldM
--
--
--
--
--
--
--
--
--
--
-

A-46
K
ey:
D =
Dai
ly
W =
Wee
kly
M =
Mon
thly
S =
Sea
sona
l- =
No
acti
vity
Ass
ocia
ted
Cit
yA
irpo
rt N
ame
Recreational flying
Agricultural spraying
Corporate/business activity
Aerial inspections
Air cargo
Flight training
Gateway for resort visitors
Staging area for community events
Police/law enforcement
Prisoner transport
Military exercises/training
Career training/education
Search & rescue
Civil Air Patrol
Environmental patrol
Emergency medical evacuation/patient transfer
Medical doctor transport
Forest/rangeland firefighting
Aerial photography/surveying
Real estate tours
Aerial advertising/banner towing
Youth outreach (Young Eagles, scouting, etc.)
Kin
dred
Ham
ry F
ield
DS
D-
-D
-S
--
S-
-M
-M
--
M-
--
Kul
mK
ulm
Mun
icip
alW
--
--
--
--
--
--
--
--
--
--
-
Lako
taLa
kota
Mun
icip
alW
SS
M-
DM
--
--
--
-M
--
-M
--
-
LaM
oure
LaM
oure
Rot
t Mun
icip
alW
DW
M-
DM
--
--
--
-M
MM
-M
--
-
Lang
don
Rob
erts
on F
ield
DD
-M
-M
--
--
--
--
-M
M-
M-
--
Lari
mor
eLa
rim
ore
Mun
icip
alD
DW
M-
DM
MM
-M
--
MM
--
-M
--
-
Leed
sLe
eds
Mun
icip
al-
--
--
--
--
--
--
--
--
--
--
-
Lidg
erw
ood
Lidg
erw
ood
Mun
icip
alN
SN
NN
NN
NN
NN
NN
NN
NS
NN
NN
N
Lint
onLi
nton
Mun
icip
alD
DM
M-
WW
-W
-D
--
MW
MM
-W
--
-
Lisb
onLi
sbon
Mun
icip
alD
DM
MM
WM
MW
-M
-W
WW
WW
-M
--
-
Mad
dock
Mad
dock
Mun
icip
alD
DD
--
WD
-W
--
--
-W
WW
-W
--
-
Man
dan
Man
dan
Mun
icip
alD
SD
ND
DS
NN
NW
NN
ND
NN
NS
NS
S
May
ville
May
ville
Mun
icip
alD
SM
SN
NN
SS
NS
DS
SS
SS
NS
NN
S
McC
lusk
yM
cClu
sky
Mun
icip
alN
SN
NN
NN
NN
NN
NN
NN
NN
NN
NN
N
McV
ille
McV
ille
Mun
icip
alW
SN
NN
SN
SN
NN
NN
NN
SN
NN
NN
N
Miln
orM
ilnor
Mun
icip
alW
--
--
-M
--
--
--
--
--
--
--
-
Min
toM
into
Mun
icip
alW
S-
--
W-
--
--
--
--
--
--
--
-
Moh
all
Moh
all M
unic
ipal
DS
--
--
--
--
W-
--
--
--
--
--
Mot
tM
ott M
unic
ipal
DS
MW
NM
NN
SN
WN
SN
NS
NN
NN
NS
Nap
oleo
nN
apol
eon
Mun
icip
alS
S-
--
S-
--
--
--
--
--
-S
--
-
New
Roc
kfor
dTo
mlin
son
Fiel
d-
D/S
--
--
--
--
M
--
-S
--
--
--
-
New
Tow
nN
ew T
own
Mun
icip
alD
SW
WN
MS
SM
NW
NN
NN
NW
SS
NN
S
Nor
thw
ood
Nor
thw
ood
Mun
icip
al-V
ince
Fie
ldW
SM
--
--
--
--
--
S-
--
--
--
-
Oak
esO
akes
Mun
icip
alD
DW
M-
--
--
--
-M
M-
M-
-M
--
-

A-47
K
ey:
D =
Dai
ly
W =
Wee
kly
M =
Mon
thly
S =
Sea
sona
l- =
No
acti
vity
Ass
ocia
ted
Cit
yA
irpo
rt N
ame
Recreational flying
Agricultural spraying
Corporate/business activity
Aerial inspections
Air cargo
Flight training
Gateway for resort visitors
Staging area for community events
Police/law enforcement
Prisoner transport
Military exercises/training
Career training/education
Search & rescue
Civil Air Patrol
Environmental patrol
Emergency medical evacuation/patient transfer
Medical doctor transport
Forest/rangeland firefighting
Aerial photography/surveying
Real estate tours
Aerial advertising/banner towing
Youth outreach (Young Eagles, scouting, etc.)
Pag
eP
age
Reg
iona
lW
DS
M-
-M
--
--
--
--
--
--
--
-
Par
k R
iver
Par
k R
iver
-W C
Skj
erve
n Fi
eld
WS
M-
--
--
--
--
--
--
W-
--
--
Par
shal
lP
arsh
all-H
anki
nsD
SM
SN
WN
NN
NN
SS
SS
MN
SS
NN
S
Pem
bina
Pem
bina
Mun
icip
alW
SW
MN
MM
MD
NN
WN
SN
SN
NN
NN
N
Pla
zaTr
ulso
n Fi
eld
M-
--
--
--
--
--
--
--
--
--
--
Ric
hard
ton
Ric
hard
ton
SN
SS
NN
NN
NN
NN
SS
SN
NN
SN
NN
Rol
ette
Rol
ette
WW
WS
NS
SS
WN
WS
SM
SM
SN
SS
NS
Rol
laR
olla
Mun
icip
alS
SD
/WN
NW
MN
M
MN
NN
NN
WW
NN
NN
N
Rug
byR
ugby
Mun
icip
alW
DW
WN
NM
NW
SS
NS
SM
SW
NS
NN
N
St.
Thom
asS
t. Th
omas
Mun
icip
alW
SM
--
D-
S-
--
--
--
--
--
--
-
Sta
nley
Sta
nley
Mun
icip
alD
SM
--
M-
--
-M
--
-M
-M
--
--
-
Tiog
aTi
oga
Mun
icip
alD
DD
DW
DW
-W
-W
-M
MM
WW
--
--
-
Tow
ner
Tow
ner
Mun
icip
alN
SN
NN
NN
NN
NN
NN
NN
NN
NN
NN
N
Turt
le L
ake
Turt
le L
ake
Mun
icip
alN
NN
NN
NN
NN
NN
NN
NN
NN
NN
NN
N
Valle
y C
ity
Bar
nes
Cou
nty
Mun
icip
alD
SD
WS
DN
SD
MM
NN
NM
WW
NS
SN
S
Wah
peto
nH
arry
Ste
rnW
D/S
WM
SM
MS
SS
NS
SS
SM
M
NS
NN
M
Wal
halla
Wal
halla
Mun
icip
al-
DW
MN
NW
--
NN
NN
NS
NN
NS
NN
N
Was
hbur
nW
ashb
urn
Mun
icip
alW
SM
-N
NS
NS
NS
NN
NS
NN
NM
NN
N
Wat
ford
Cit
yW
atfo
rd C
ity
Mun
icip
alD
SW
--
D-
--
--
--
--
-W
-M
-S
-
Wes
t Far
goW
est F
argo
Mun
icip
alW
--
--
--
--
--
--
--
--
--
--
-
Wes
thop
eW
esth
ope
Mun
icip
alW
SM
MN
NN
NS
NM
NN
SN
NN
NN
NN
N
Wis
hek
Wis
hek
Mun
icip
alD
D-
--
-W
--
-M
--
--
MW
--
--
-S
ourc
e: W
ilbur
Sm
ith
Ass
ocia
tes.
Pre
pare
d: D
ecem
ber
2010
.

A-48
Tab
le A
-20:
Sal
es T
ax C
ontr
ibu
tion
s of
Nor
th D
akot
a A
irp
orts
Ass
ocia
ted
Cit
yA
irpo
rt N
ame
Air
port
Ten
ant
Taxe
sV
isit
or T
axes
Empl
oyee
Tax
es
from
Air
port
Te
nant
s
Empl
oyee
Ta
xes
from
V
isit
ors
Tota
l Tax
es
Co
mm
ErC
IAl
SEr
vIC
E A
Irp
or
TS
Bis
mar
ckB
ism
arck
$2,
209,
100
$1,
907,
200
$21
3,40
0 $
96,5
00
$4,
426,
200
Dev
ils L
ake
Dev
ils L
ake
Reg
iona
l $
135,
800
$88
,000
$
10,5
00
$4,
300
$23
8,60
0
Dic
kins
onD
icki
nson
-The
odor
e R
oose
velt
Reg
iona
l $
219,
900
$42
3,20
0 $
16,5
00
$19
,100
$
678,
700
Farg
oH
ecto
r In
tern
atio
nal
$7,
128,
100
$4,
315,
000
$77
9,50
0 $
209,
100
$12
,431
,700
Gra
nd F
orks
Gra
nd F
orks
Inte
rnat
iona
l $
4,12
8,70
0 $
1,14
9,10
0 $
345,
300
$56
,700
$
5,67
9,80
0
Jam
esto
wn
Jam
esto
wn
Reg
iona
l $
283,
700
$10
8,20
0 $
14,6
00
$5,
600
$41
2,10
0
Min
otM
inot
Inte
rnat
iona
l $
1,21
8,50
0 $
1,50
4,60
0 $
72,3
00
$63
,600
$
2,85
9,00
0
Will
isto
nS
loul
in F
ield
Inte
rnat
iona
l $
490,
600
$38
6,90
0 $
20,4
00
$21
,100
$
919,
000
Co
mm
ErC
IAl
SEr
vIC
E A
Irp
or
TS
To
TA
l $
15,8
14,4
00
$9,
882,
200
$1,
472,
500
$47
6,00
0 $
27,6
45,1
00
GEN
ErA
l A
vIA
TIo
N A
Irp
or
TS
Art
hur
Art
hur
$60
0 $
0 $
100
$0
$70
0
Ash
ley
Ash
ley
Mun
icip
al $
17,9
00
$1,
800
$90
0 $
100
$20
,700
Bea
chB
each
$70
0 $
2,70
0 $
100
$20
0 $
3,70
0
Beu
lah
Beu
lah
$10
9,00
0 $
7,10
0 $
5,60
0 $
400
$12
2,10
0
Bot
tine
auB
otti
neau
Mun
icip
al $
61,4
00
$70
0 $
1,80
0 $
0 $
63,9
00
Bow
bells
Bow
bells
Mun
icip
al $
600
$0
$10
0 $
0 $
700
Bow
man
Bow
man
Mun
icip
al $
22,8
00
$2,
600
$1,
300
$20
0 $
26,9
00
Can
doC
ando
Mun
icip
al $
25,4
00
$1,
500
$90
0 $
100
$27
,900
Car
ring
ton
Car
ring
ton
Mun
icip
al $
41,5
00
$2,
100
$1,
300
$10
0 $
45,0
00
Cas
selt
onC
asse
lton
Rob
ert M
iller
Reg
iona
l $
145,
300
$16
,700
$
5,70
0 $
1,40
0 $
169,
100
Cav
alie
rC
aval
ier
Mun
icip
al $
106,
200
$30
0 $
2,10
0 $
0 $
108,
600
Col
umbu
sC
olum
bus
Mun
icip
al $
600
$0
$10
0 $
0 $
700
Coo
pers
tow
nC
oope
rsto
wn
Mun
icip
al $
16,2
00
$70
0 $
500
$0
$17
,400
Cro
sby
Cro
sby
Mun
icip
al $
65,3
00
$90
0 $
2,10
0 $
100
$68
,400
Dra
yton
Dra
yton
Mun
icip
al $
31,4
00
$0
$1,
100
$0
$32
,500
Edge
ley
Edge
ley
Mun
icip
al $
15,5
00
$30
0 $
300
$0
$16
,100
Elgi
nEl
gin
Mun
icip
al $
700
$0
$10
0 $
0 $
800
Elle
ndal
eEl
lend
ale
Mun
icip
al $
700
$4,
000
$10
0 $
300
$5,
100
Ende
rlin
Sky
Hav
en $
700
$50
0 $
100
$0
$1,
300
Fess
ende
nFe
ssen
den
Mun
icip
al $
66,6
00
$0
$2,
600
$0
$69
,200
Fort
Yat
esS
tand
ing
Roc
k $
600
$10
0 $
100
$0
$80
0

A-49
Ass
ocia
ted
Cit
yA
irpo
rt N
ame
Air
port
Ten
ant
Taxe
sV
isit
or T
axes
Empl
oyee
Tax
es
from
Air
port
Te
nant
s
Empl
oyee
Ta
xes
from
V
isit
ors
Tota
l Tax
es
Gac
kle
Gac
kle
Mun
icip
al $
600
$0
$10
0 $
0 $
700
Gar
riso
nG
arri
son
Mun
icip
al $
18,5
00
$4,
900
$40
0 $
400
$24
,200
Gar
riso
n D
amG
arri
son
Dam
Rec
reat
iona
l Air
park
$0
$0
$10
0 $
0 $
100
Gle
n U
llin
Gle
n U
llin
Reg
iona
l $
700
$40
0 $
100
$0
$1,
200
Gra
fton
Hut
son
Fiel
d $
93,2
00
$8,
500
$5,
900
$50
0 $
108,
100
Gw
inne
rG
win
ner-
Rog
er M
elro
e Fi
eld
$6,
500
$4,
000
$1,
100
$30
0 $
11,9
00
Har
vey
Har
vey
Mun
icip
al $
139,
300
$10
0 $
4,20
0 $
0 $
143,
600
Haz
elto
nH
azel
ton
Mun
icip
al $
64,7
00
$0
$2,
300
$0
$67
,000
Haz
enM
erce
r C
ount
y R
egio
nal
$13
,100
$
3,10
0 $
400
$20
0 $
16,8
00
Het
ting
erH
etti
nger
Mun
icip
al $
46,3
00
$4,
700
$3,
500
$30
0 $
54,8
00
Hill
sbor
oH
illsb
oro
Mun
icip
al $
122,
400
$1,
400
$4,
300
$10
0 $
128,
200
Inte
rnat
iona
l Pea
ce
Gar
den-
Dun
seit
hIn
tern
atio
nal P
eace
Gar
den
$0
$10
0 $
200
$0
$30
0
Ken
mar
eK
enm
are
Mun
icip
al $
28,6
00
$3,
200
$1,
000
$20
0 $
33,0
00
Kill
deer
Wey
dahl
Fie
ld $
800
$0
$10
0 $
0 $
900
Kin
dred
Ham
ry F
ield
$76
,300
$
600
$6,
500
$10
0 $
83,5
00
Kul
mK
ulm
Mun
icip
al $
800
$0
$10
0 $
0 $
900
Lako
taLa
kota
Mun
icip
al $
1,40
0 $
700
$10
0 $
0 $
2,20
0
LaM
oure
LaM
oure
Rot
t Mun
icip
al $
67,2
00
$2,
900
$1,
900
$20
0 $
72,2
00
Lang
don
Rob
erts
on F
ield
$83
,800
$
0 $
2,30
0 $
0 $
86,1
00
Lari
mor
eLa
rim
ore
Mun
icip
al $
144,
300
$1,
900
$4,
500
$20
0 $
150,
900
Leed
sLe
eds
Mun
icip
al $
600
$0
$10
0 $
0 $
700
Lidg
erw
ood
Lidg
erw
ood
Mun
icip
al $
0 $
0 $
0 $
0 $
0
Lint
onLi
nton
Mun
icip
al $
34,8
00
$1,
900
$1,
100
$10
0 $
37,9
00
Lisb
onLi
sbon
Mun
icip
al $
55,1
00
$30
0 $
2,20
0 $
0 $
57,6
00
Mad
dock
Mad
dock
Mun
icip
al $
59,8
00
$0
$2,
400
$0
$62
,200
Man
dan
Man
dan
Mun
icip
al $
88,4
00
$24
,700
$
3,30
0 $
1,50
0 $
117,
900
May
ville
May
ville
Mun
icip
al $
34,0
00
$16
,000
$
1,10
0 $
1,20
0 $
52,3
00
McC
lusk
yM
cClu
sky
Mun
icip
al $
0 $
0 $
200
$0
$20
0
McV
ille
McV
ille
Mun
icip
al $
100
$0
$0
$0
$10
0
Miln
orM
ilnor
Mun
icip
al $
800
$0
$10
0 $
0 $
900
Min
toM
into
Mun
icip
al $
700
$20
0 $
100
$0
$1,
000
Moh
all
Moh
all M
unic
ipal
$86
,600
$
100
$2,
600
$0
$89
,300

A-50
Ass
ocia
ted
Cit
yA
irpo
rt N
ame
Air
port
Ten
ant
Taxe
sV
isit
or T
axes
Empl
oyee
Tax
es
from
Air
port
Te
nant
s
Empl
oyee
Ta
xes
from
V
isit
ors
Tota
l Tax
es
Mot
tM
ott M
unic
ipal
$0 $
900
$40
0 $
100
$1,
400
Nap
oleo
nN
apol
eon
Mun
icip
al $
16,9
00
$50
0 $
500
$0
$17
,900
New
Roc
kfor
dTo
mlin
son
Fiel
d $
50,6
00
$20
0 $
1,30
0 $
0 $
52,1
00
New
Tow
nN
ew T
own
Mun
icip
al $
2,90
0 $
2,00
0 $
0 $
200
$5,
100
Nor
thw
ood
Nor
thw
ood
Mun
icip
al-V
ince
Fie
ld $
25,7
00
$1,
300
$80
0 $
100
$27
,900
Oak
esO
akes
Mun
icip
al $
42,8
00
$10
0 $
1,10
0 $
0 $
44,0
00
Pag
eP
age
Reg
iona
l $
126,
000
$10
0 $
3,30
0 $
0 $
129,
400
Par
k R
iver
Par
k R
iver
-W C
Skj
erve
n Fi
eld
$37
,700
$
200
$3,
700
$0
$41
,600
Par
shal
lP
arsh
all-H
anki
ns $
6,60
0 $
600
$30
0 $
0 $
7,50
0
Pem
bina
Pem
bina
Mun
icip
al $
400
$1,
200
$0
$10
0 $
1,70
0
Pla
zaTr
ulso
n Fi
eld
$60
0 $
0 $
100
$0
$70
0
Ric
hard
ton
Ric
hard
ton
$10
0 $
0 $
0 $
0 $
100
Rol
ette
Rol
ette
$0
$10
0 $
0 $
0 $
100
Rol
laR
olla
Mun
icip
al $
68,7
00
$1,
900
$3,
500
$10
0 $
74,2
00
Rug
byR
ugby
Mun
icip
al $
80,9
00
$20
0 $
1,60
0 $0
$82
,700
St.
Thom
asS
t. Th
omas
Mun
icip
al $
24,7
00
$10
0 $
1,00
0 $0
$25
,800
Sta
nley
Sta
nley
Mun
icip
al $
13,3
00
$1,
100
$70
0 $
100
$15
,200
Tiog
aTi
oga
Mun
icip
al $
40,2
00
$21
,100
$
1,30
0 $
1,50
0 $
64,1
00
Tow
ner
Tow
ner
Mun
icip
al $
21,5
00
$0
$70
0 $
0 $
22,2
00
Turt
le L
ake
Turt
le L
ake
Mun
icip
al $
0 $
0 $
0 $
0 $
0
Valle
y C
ity
Bar
nes
Cou
nty
Mun
icip
al $
112,
800
$6,
500
$1,
600
$40
0 $
121,
300
Wah
peto
nH
arry
Ste
rn $
265,
300
$14
,800
$
11,8
00
$90
0 $
292,
800
Wal
halla
Wal
halla
Mun
icip
al $
122,
000
$20
0 $
1,20
0 $
0 $
123,
400
Was
hbur
nW
ashb
urn
Mun
icip
al $
9,00
0 $
300
$30
0 $
0 $
9,60
0
Wat
ford
Cit
yW
atfo
rd C
ity
Mun
icip
al $
75,3
00
$4,
000
$2,
700
$30
0 $
82,3
00
Wes
t Far
goW
est F
argo
Mun
icip
al $
44,1
00
$9,
000
$2,
800
$60
0 $
56,5
00
Wes
thop
eW
esth
ope
Mun
icip
al $
100
$10
0 $
0 $
0 $
200
Wis
hek
Wis
hek
Mun
icip
al $
700
$50
0 $
100
$0
$1,
300
GEN
ErA
l A
vIA
TIo
N A
Irp
or
TS
To
TA
l $
3,18
8,00
0 $
188,
700
$12
0,10
0 $
12,6
00
$3,
509,
400
All
AIr
po
rT
S T
oT
Al
$19
,002
,400
$
10,0
70,9
00
$1,
592,
600
$48
8,60
0 $
31,1
54,5
00
Sou
rce:
Wilb
ur S
mit
h A
ssoc
iate
s an
d R
IMS
II M
ulti
plie
rs.
Pre
pare
d: D
ecem
ber
2010
.