Embed Size (px)
Citation preview
North Texas Municipal Water District“Regional Service Through Unity …
Meeting Our Region’s Needs Today and Tomorrow”
Water System Member Cities and Customers MeetingNovember 18, 2015
Water System MCC Meeting - Outline• Water Supply Update - Billy George
• LBCR & Main Stem PS Permitting Update - Billy George
• NTMWD Public Relations Update - Janet Rummel
• Water Conservation Update - Denise Hickey
• Total Coliform Rule - Elizabeth Turner
• TCEQ Nitrification Rule - Elizabeth Turner
• Wylie WTP Construction Update - Joe Bernosky
• Critical Plant Shutdown Update - Joe Bernosky
• Upcoming Meetings - Billy George
Water System MCC Meeting - Outline• Water Supply Update - Billy George
• LBCR & Main Stem PS Permitting Update - Billy George
•
•
•
•
•
•
•
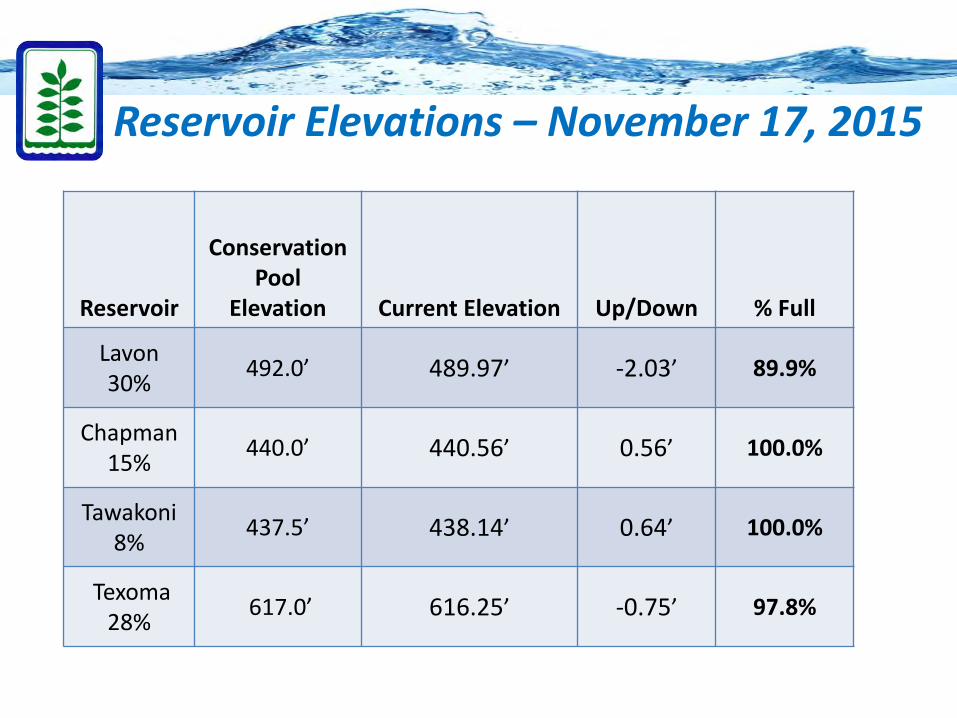
Reservoir Elevations – November 17, 2015
Reservoir
Conservation Pool
Elevation Current Elevation Up/Down % Full
Lavon30% 492.0’ 489.97’ -2.03’ 89.9%
Chapman15% 440.0’ 440.56’ 0.56’ 100.0%
Tawakoni8% 437.5’ 438.14’ 0.64’ 100.0%
Texoma28% 617.0’ 616.25’ -0.75’ 97.8%

Lower Bois d’Arc Creek Reservoir (LBCR) “First major reservoir to be constructed in Texas in the last 30 years”
• Section 404 Permit– Pursuing receipt of permit by June 2016 (water needed by
2020)– Holding workshops with resource agencies to address
comments. Most notable questions involve:• Alternatives to LBCR• Functional assessment of environmental impacts• Assessment and mitigation of stream impacts
– Attended kickoff meeting on November 12th with resourceagencies for additional field work
– New “reference wetlands” under evaluation– “Ground truthing” of prior field analysis underway
Main Stem Pump Station and Pipeline• CWA Section 404 & 408 Permit:
– NTMWD pursuing a Regional General Permit 12 (Covers bothSection 404 & 408)
– NTMWD received draft permit conditions (under review byNTMWD team)
– Analysis from USACE hydraulics and hydrologic review toNTWMD this week
– Permit required to start construction
Main Stem Pump Station and Pipeline• NTMWD Lavon Bed and Banks Permit
– Permit under review by TCEQ
• Water Right Permit– Existing water right holders will be provided notice of
application and may submit comments
Water System MCC Meeting - Outline•
•
• NTMWD Public Relations Update - Janet Rummel
•
•
•
•
•
•
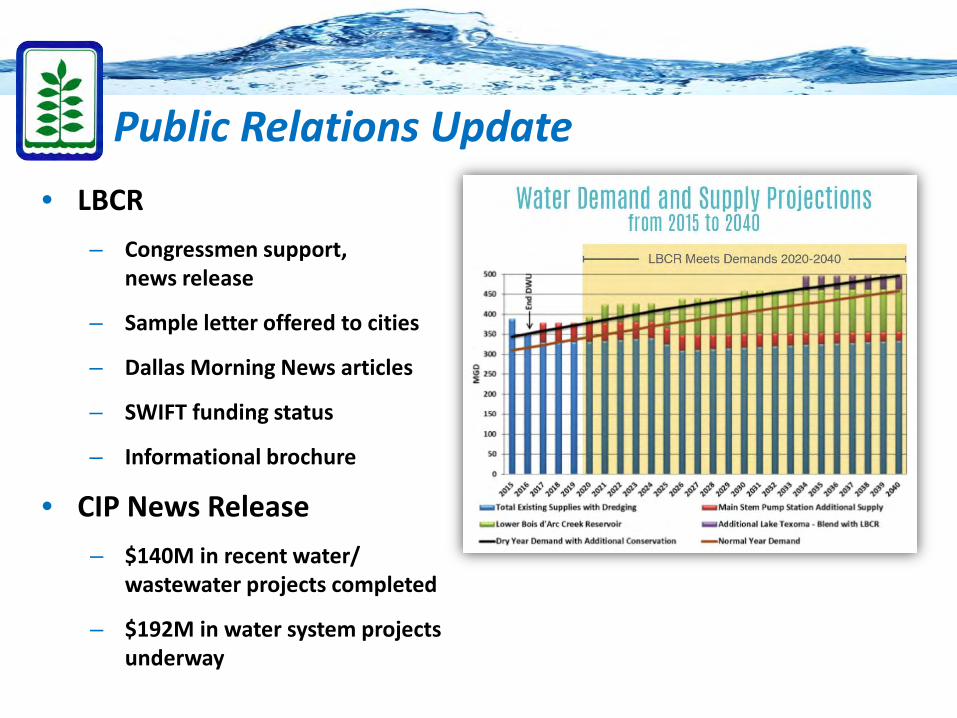
• LBCR– Congressmen support,
news release
– Sample letter offered to cities
– Dallas Morning News articles
– SWIFT funding status
– Informational brochure
• CIP News Release– $140M in recent water/
wastewater projects completed
– $192M in water system projects underway
Public Relations Update
Water System MCC Meeting - Outline•
•
•
• Water Conservation Update - Denise Hickey
•
•
•
•
•

1295476
14,43062
568261
1,04692
256101
21255
WaterMyYardSubscribers – 3,212Frisco WaterWise Subscribers – 14,774
11/16/2015 10/16/2015
Allen 145 144
Farmersville 54 54
Forney 77 76
Frisco 14,774 14,612
Garland 68 67
McKinney 633 596
Mesquite 281 278
Plano 1,163 1,099
Princeton 99 98
Richardson 291 270
Rockwall 111 108
Royse City 22 20
Wylie 268 265
WMY Total 3,212 3,075
WaterMyYard.org
Second Rain GaugesBeing Installed Soon
5 Major Projects
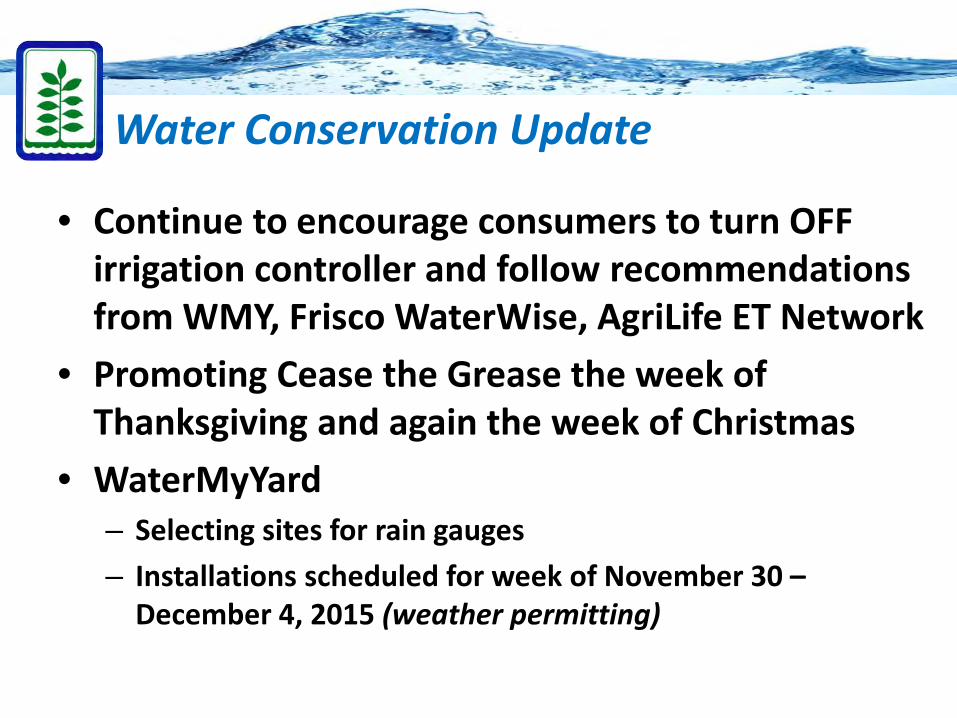
• Continue to encourage consumers to turn OFF irrigation controller and follow recommendations from WMY, Frisco WaterWise, AgriLife ET Network
• Promoting Cease the Grease the week of Thanksgiving and again the week of Christmas
• WaterMyYard– Selecting sites for rain gauges– Installations scheduled for week of November 30 –
December 4, 2015 (weather permitting)
Water Conservation Update
5 Major Projects
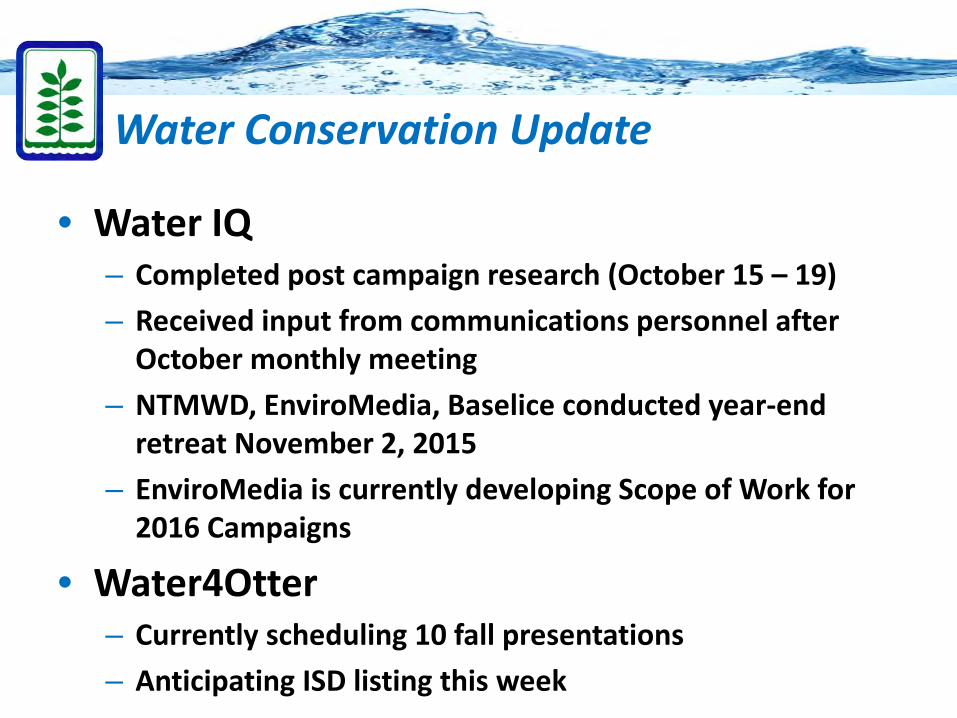
• Water IQ – Completed post campaign research (October 15 – 19)– Received input from communications personnel after
October monthly meeting– NTMWD, EnviroMedia, Baselice conducted year-end
retreat November 2, 2015– EnviroMedia is currently developing Scope of Work for
2016 Campaigns
• Water4Otter– Currently scheduling 10 fall presentations– Anticipating ISD listing this week
Water Conservation Update

5 Major Projects
• NTMWD partnering with AgriLife to provide regional classes– Lawn Care and Efficient Irrigation– Water Efficient Landscaping
Regional Landscaping Classes
LOCATION: AgriLife Center, Coit Road, Dallas TX
February 20, 2016Lawn Care & Efficient Irrigation
9 am – 12 noon
April 2, 2016Water Efficient Landscaping
9 am – 12 noon
LOCATION: Terrell (TBA)February 13, 2016
Lawn Care & Efficient Irrigation9 am – 12 noon
April 9, 2016Water Efficient Landscaping
9 am – 12 noon
Water System MCC Meeting - Outline•
•
•
•
• Total Coliform Rule - Elizabeth Turner
• TCEQ Nitrification Rule - Elizabeth Turner
•
•
•
• The RTCR establishes a maximum contaminant level (MCL) for E. coli and uses E. coli and total coliforms to initiate a “find and fix” approach to address fecal contamination that could enter into the distribution system.
• The RTCR requires public water systems (PWSs) to perform assessments to identify sanitary defects and subsequently take action to correct any identified sanitary defects.
• Beginning April 1, 2016, the State must perform a special monitoring evaluation during each sanitary survey to review the status of the system, including the distribution system, to determine whether the system is on an appropriate monitoring schedule.
Revised Total Coliform Rule

TCEQ Primacy Extension until February 13, 2017
• Proposal Agenda May 11, 2016• Rule Filed/Published/SOS May 11 – 27, 2016• Public Comment Period-Start May 27, 2016 • Public Hearing Date/Time July 7, 2016• Public Comment Period-End July 12, 2016 • Adoption Agenda October 19, 2016• Rule Effective Date November 11, 2016• Federal requirements for the Revised Total Coliform Rule
(RTCR) will take effect April 1, 2016.
TCEQ Draft Rule Making Timeline
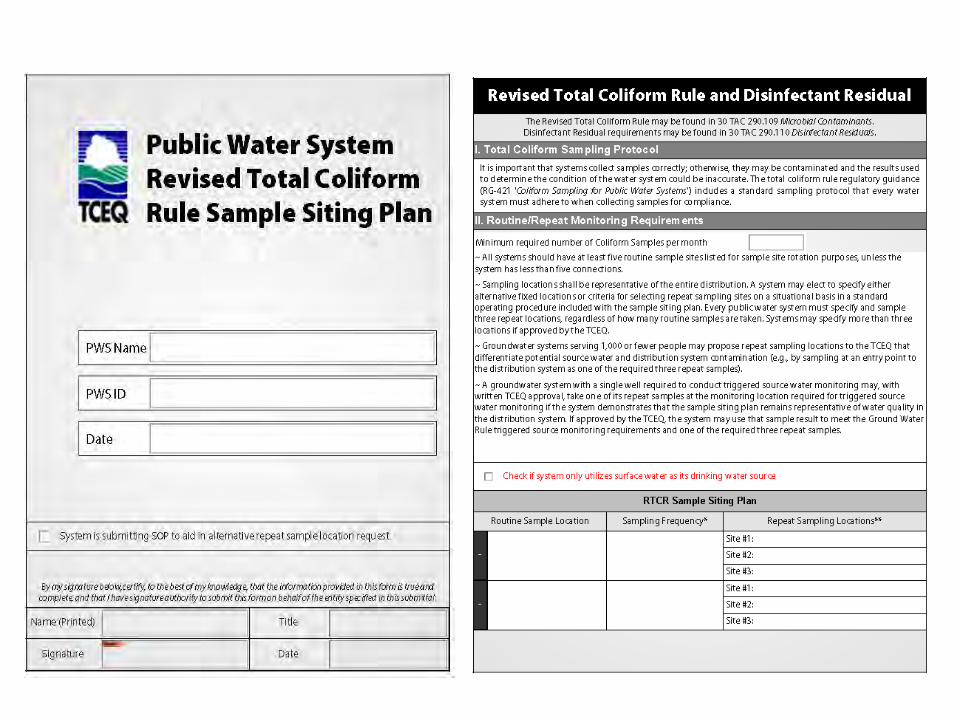
Before March 31, 2016, all PWSs:• Must develop a written sample siting plan that identifies
the system’s sample collection schedule and all sample sites, including sites for routine and repeat monitoring oran SOP on how utility will select repeat sites.
• PWSs monitoring quarterly or annually must also identify additional routine monitoring sites in their sample siting plans.
• Submit to: Texas Commission on Environmental QualityAttn: Drinking Water Quality TeamRTCR Sample Siting PlanPublic Drinking Water SectionP.O. Box 13087 (MC-155)Austin, Texas 78711-3087
Sample Site Plan
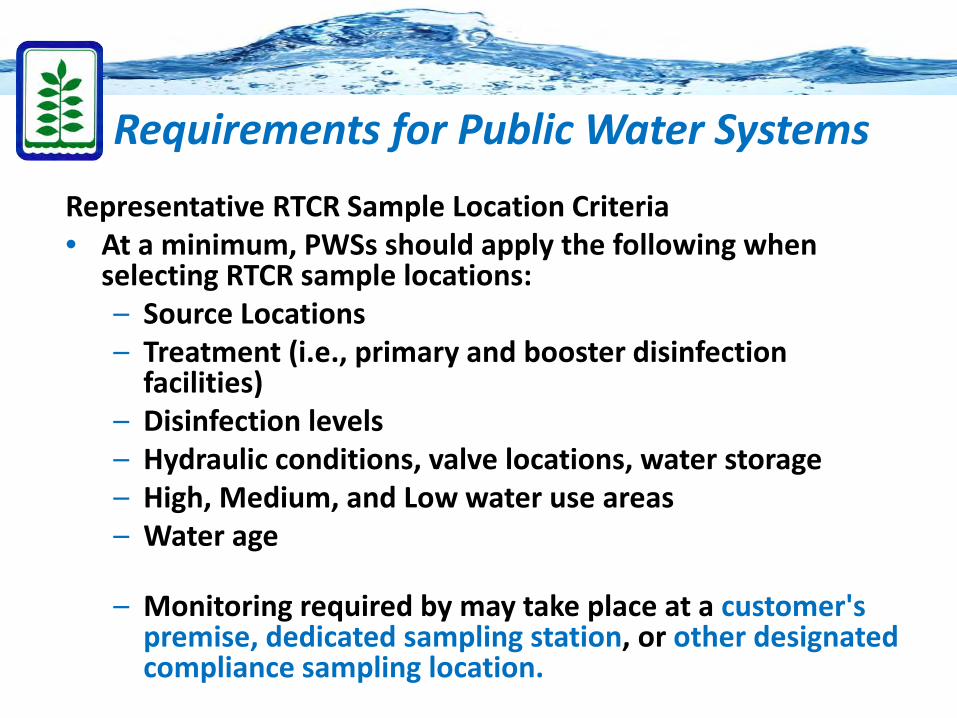
Representative RTCR Sample Location Criteria• At a minimum, PWSs should apply the following when
selecting RTCR sample locations:– Source Locations– Treatment (i.e., primary and booster disinfection
facilities)– Disinfection levels– Hydraulic conditions, valve locations, water storage– High, Medium, and Low water use areas– Water age
– Monitoring required by may take place at a customer's premise, dedicated sampling station, or other designated compliance sampling location.
Requirements for Public Water Systems
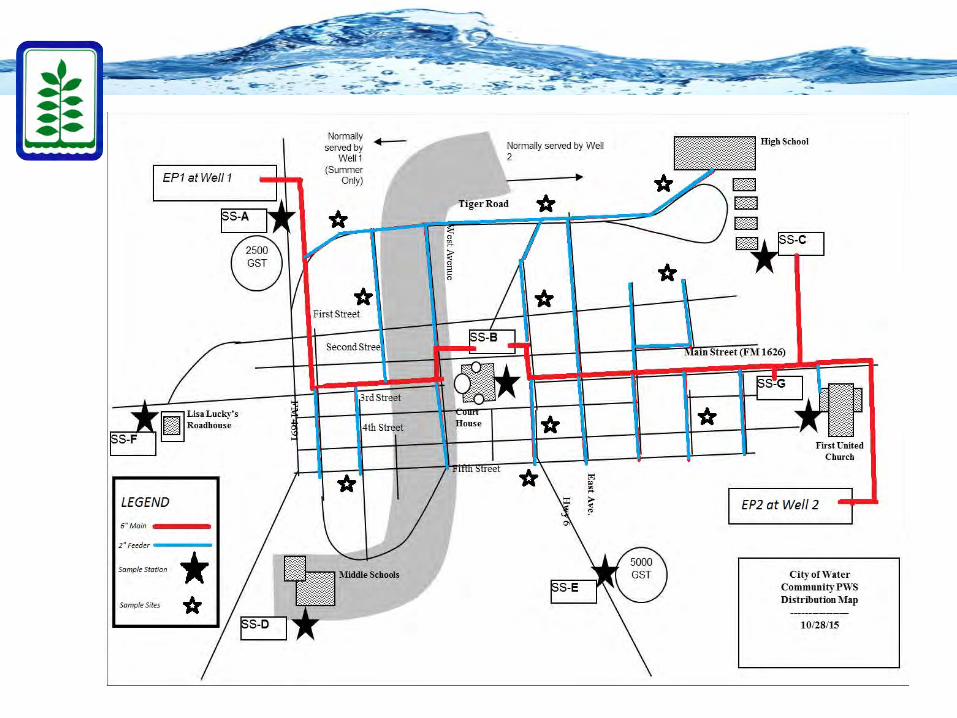
• RTCR Sample Sites • Source Locations• Treatment (i.e., primary and booster disinfection facilities)• Water Storage Facilities • Distribution Lines and Size• Pressure Plane Boundaries• Interconnections
Include as many maps as necessary to provide details
Sample Site Map

• Required for any positive sample
• Original site, within 5 service connections upstream, within 5 connections downstream or per SOP
Repeat Samples
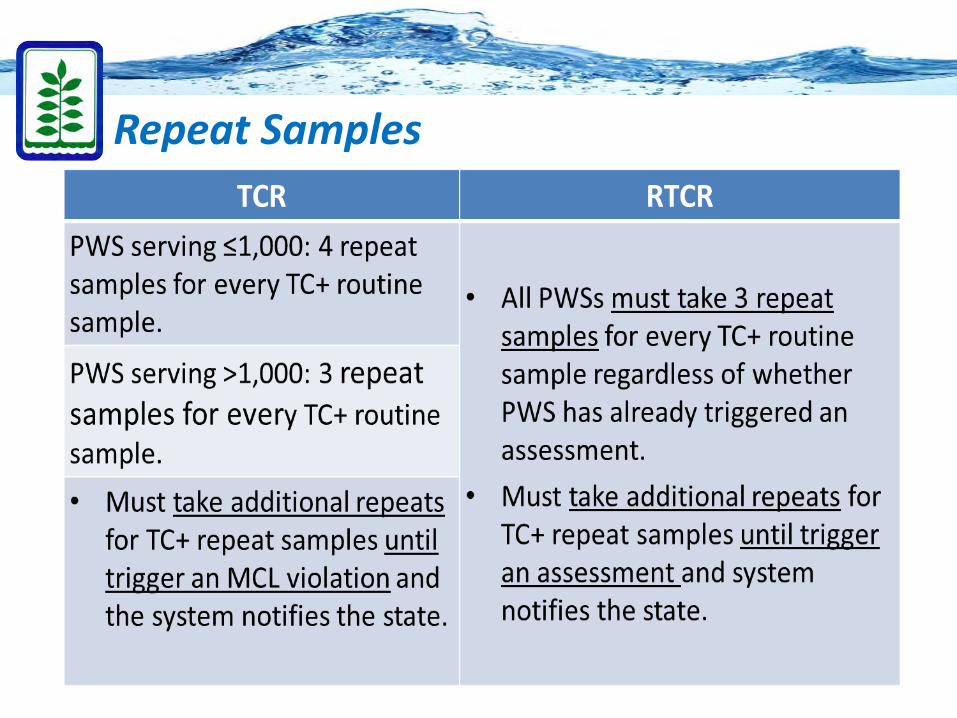
Repeat Samples
Purpose of Level 1 and Level 2 Assessments• To find sanitary defects at the PWS including:
– Sanitary defects that could provide a pathway of entry for microbial contamination, or
– Sanitary defects that indicate failure (existing or potential) of protective barriers against microbial contamination.
RTCR Assessments and Corrective Actions
Examples of Sanitary Defects not limited to: (2)
40 CFR §141.2 Definitions.- Sanitary defect is a defect that could provide a pathway of entry for microbial contamination into the distribution system or that is indicative of a failure or imminent failure in a barrier that is already in place.• No backflow protection/cross-connection control • Line breaks• Low distribution system pressure• Inadequate disinfection levels or treatment• Deteriorated water storage facilities or infrastructure
Sanitary Defects
• Assessment due to state within 30 days of trigger event.
• Corrective Actions- If the State reviews the completed and determines that the assessment is not sufficient (including any proposed timetable for any corrective actions not already completed), the State must consult with the system.
• If the State requires revisions after consultation, the system must submit a revised assessment form to the State on an agreed-upon schedule not to exceed 30 days from the date of the consultation.
Assessment Deadlines
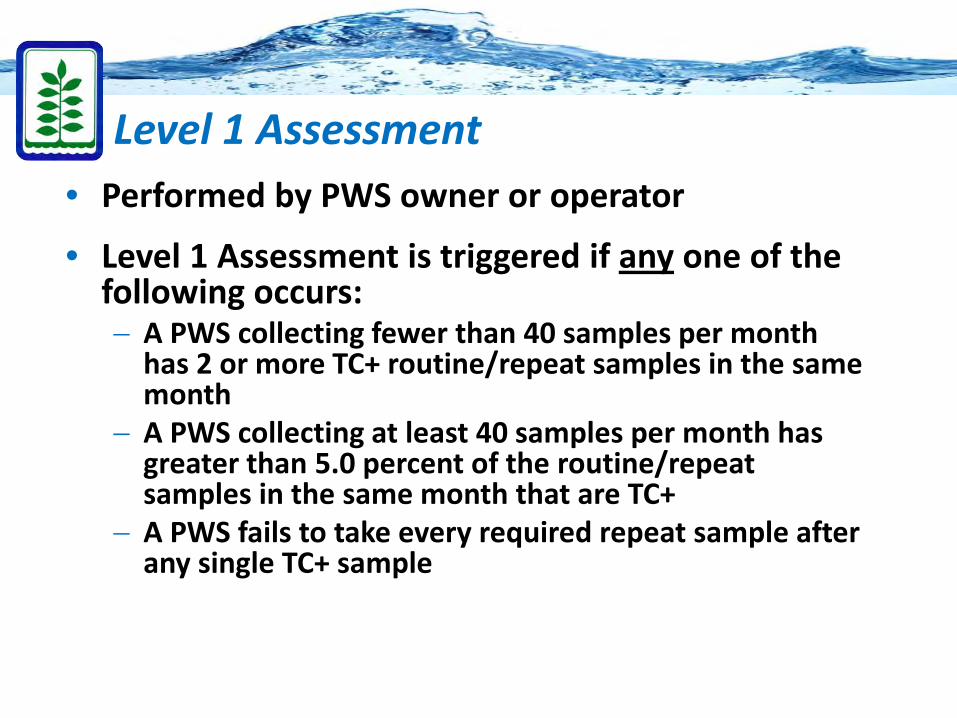
• Performed by PWS owner or operator
• Level 1 Assessment is triggered if any one of the following occurs: − A PWS collecting fewer than 40 samples per month
has 2 or more TC+ routine/repeat samples in the same month
− A PWS collecting at least 40 samples per month has greater than 5.0 percent of the routine/repeat samples in the same month that are TC+
− A PWS fails to take every required repeat sample after any single TC+ sample
Level 1 Assessment
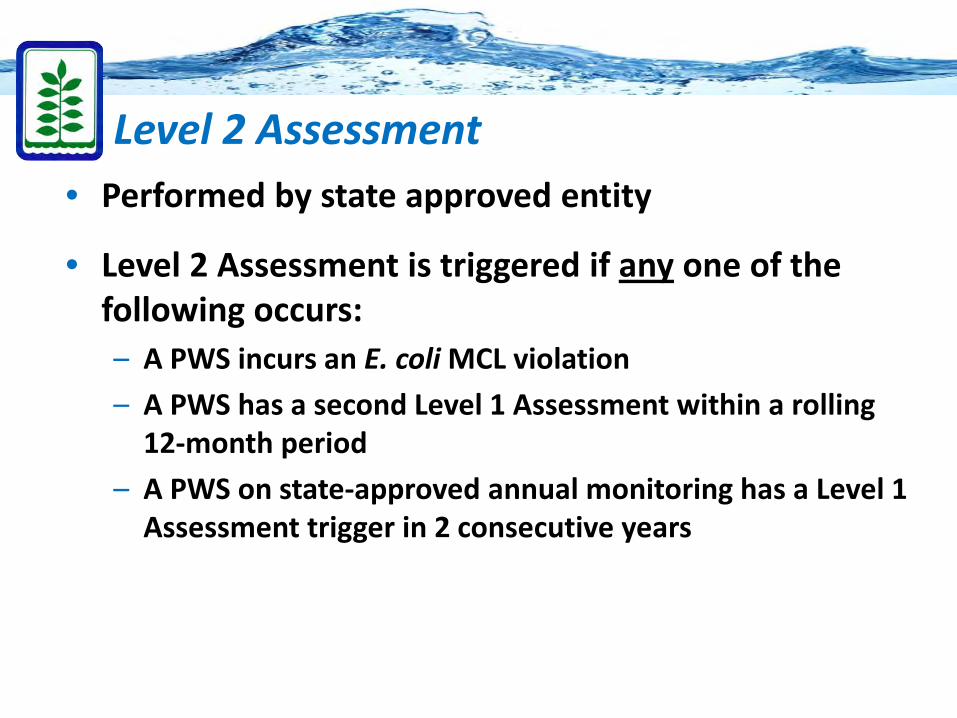
• Performed by state approved entity
• Level 2 Assessment is triggered if any one of the following occurs: – A PWS incurs an E. coli MCL violation– A PWS has a second Level 1 Assessment within a rolling
12-month period– A PWS on state-approved annual monitoring has a Level 1
Assessment trigger in 2 consecutive years
Level 2 Assessment
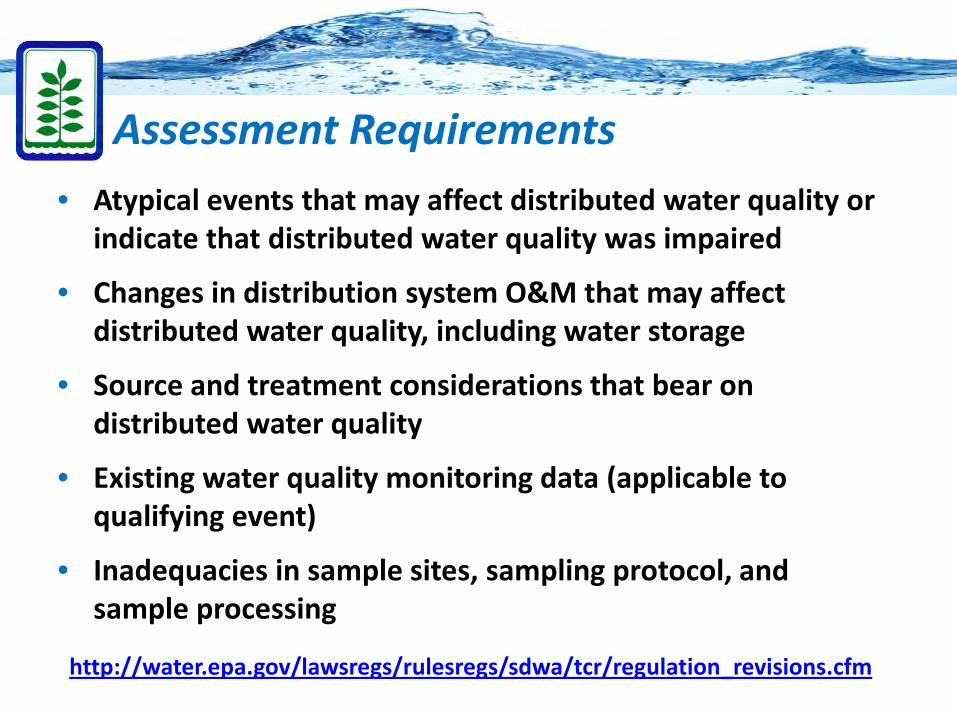
• Atypical events that may affect distributed water quality or indicate that distributed water quality was impaired
• Changes in distribution system O&M that may affect distributed water quality, including water storage
• Source and treatment considerations that bear on distributed water quality
• Existing water quality monitoring data (applicable to qualifying event)
• Inadequacies in sample sites, sampling protocol, and sample processing
http://water.epa.gov/lawsregs/rulesregs/sdwa/tcr/regulation_revisions.cfm
Assessment Requirements
• The Revised Total Coliform Rule (RTCR) State Implementation Guidance Document-Interim Final (PDF) (295 pp, 2MB) EPA 816-R-14-004, December 2014
• Revised Total Coliform Rule Assessments and Corrective Actions Guidance Manual, Interim Final(164 pp, 2MB) EPA 815-R-14-006, September 2014
• TCEQ DWAG October 28, 2015 RTCR Workshop http://www.texasadmin.com/tx/tceq/drinking_water_advisory
References
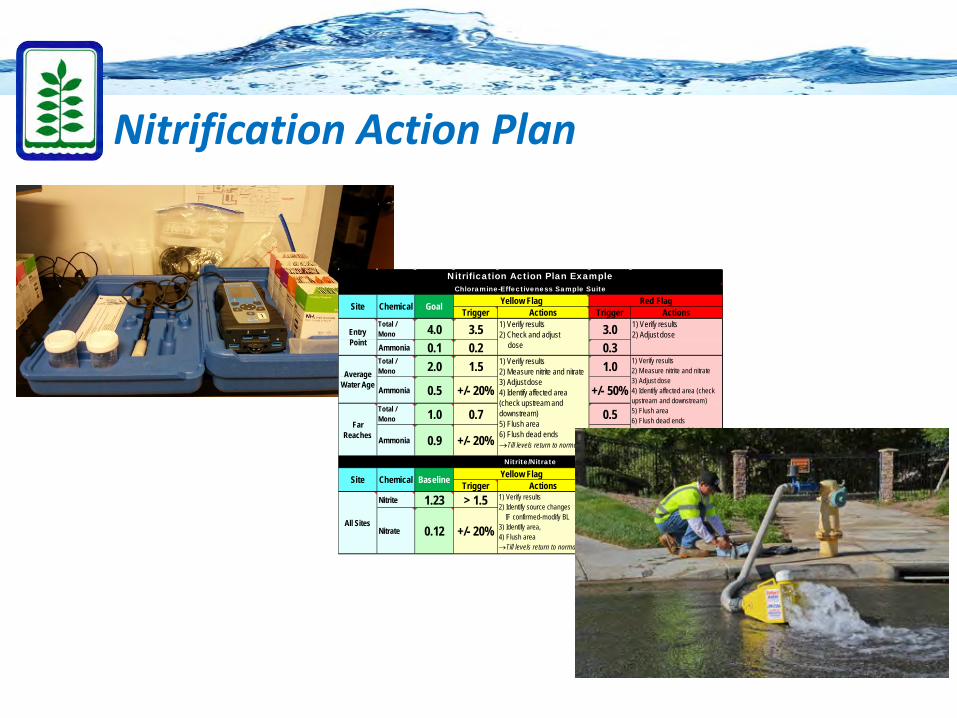
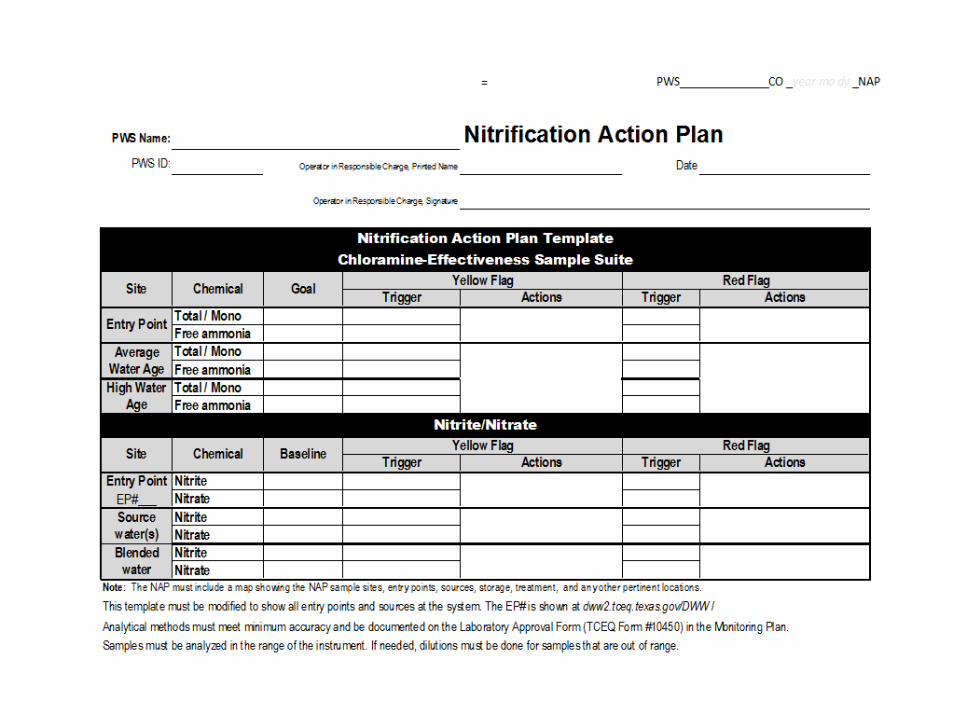
Nitrification Action Plan
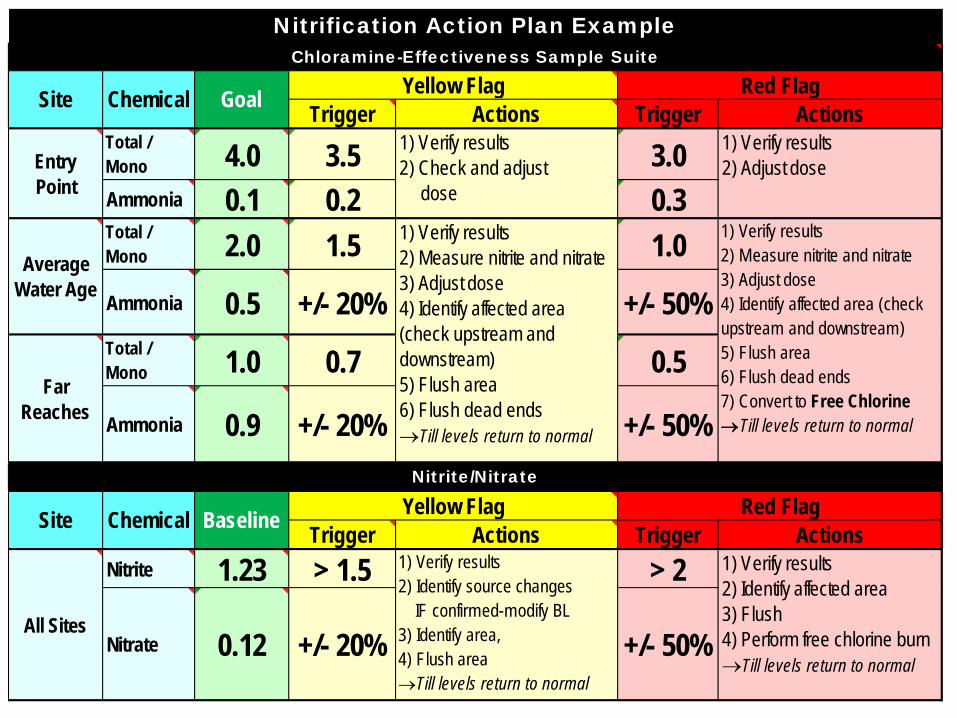
Trigger Actions Trigger ActionsTotal / Mono 4.0 3.5 3.0Ammonia 0.1 0.2 0.3Total / Mono 2.0 1.5 1.0Ammonia 0.5 +/- 20% +/- 50%Total / Mono 1.0 0.7 0.5
Ammonia 0.9 +/- 20% +/- 50%
Trigger Actions Trigger ActionsNitrite 1.23 > 1.5 > 2
Nitrate 0.12 +/- 20% +/- 50%
Entry Point
1) Verify results2) Check and adjust dose
1) Verify results2) Adjust dose
Average Water Age
All Sites
1) Verify results2) Identify source changes IF confirmed-modify BL 3) Identify area, 4) Flush area→Till levels return to normal
1) Verify results2) Identify affected area 3) Flush4) Perform free chlorine burn→Till levels return to normal
Site Chemical Baseline Yellow Flag Red Flag
1) Verify results2) Measure nitrite and nitrate3) Adjust dose4) Identify affected area (check upstream and downstream) 5) Flush area6) Flush dead ends→Till levels return to normal
1) Verify results2) Measure nitrite and nitrate3) Adjust dose4) Identify affected area (check upstream and downstream) 5) Flush area6) Flush dead ends7) Convert to Free Chlorine →Till levels return to normal
Far Reaches
Nitrite/Nitrate
Nitrification Action Plan Example
Site Chemical Goal Yellow Flag Red FlagChloramine-Effectiveness Sample Suite
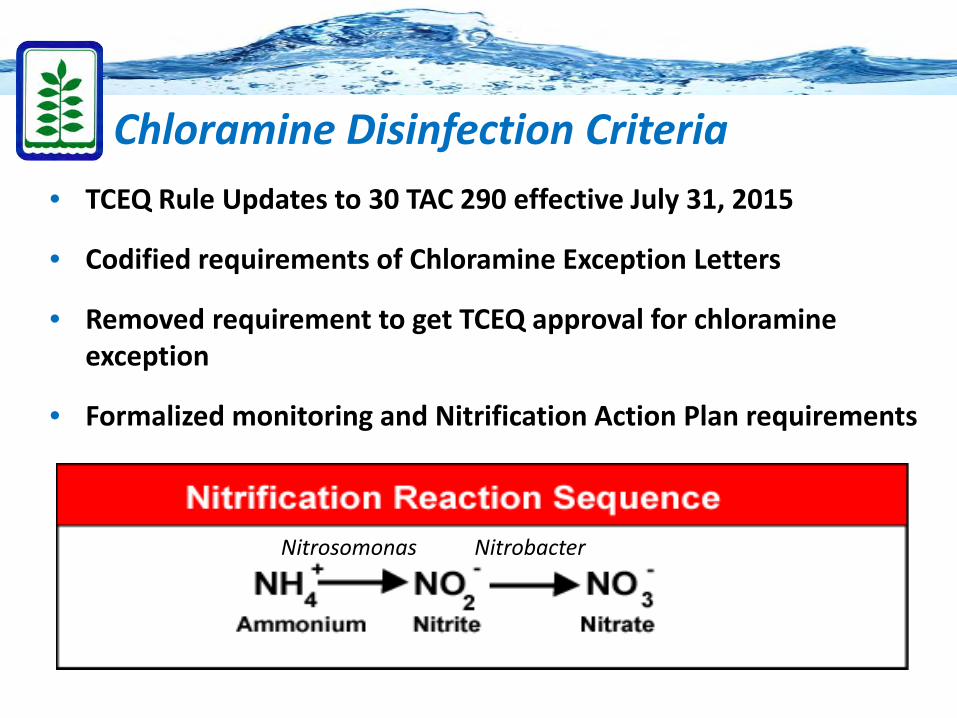
• TCEQ Rule Updates to 30 TAC 290 effective July 31, 2015
• Codified requirements of Chloramine Exception Letters
• Removed requirement to get TCEQ approval for chloramine exception
• Formalized monitoring and Nitrification Action Plan requirements
Chloramine Disinfection Criteria
Nitrosomonas Nitrobacter
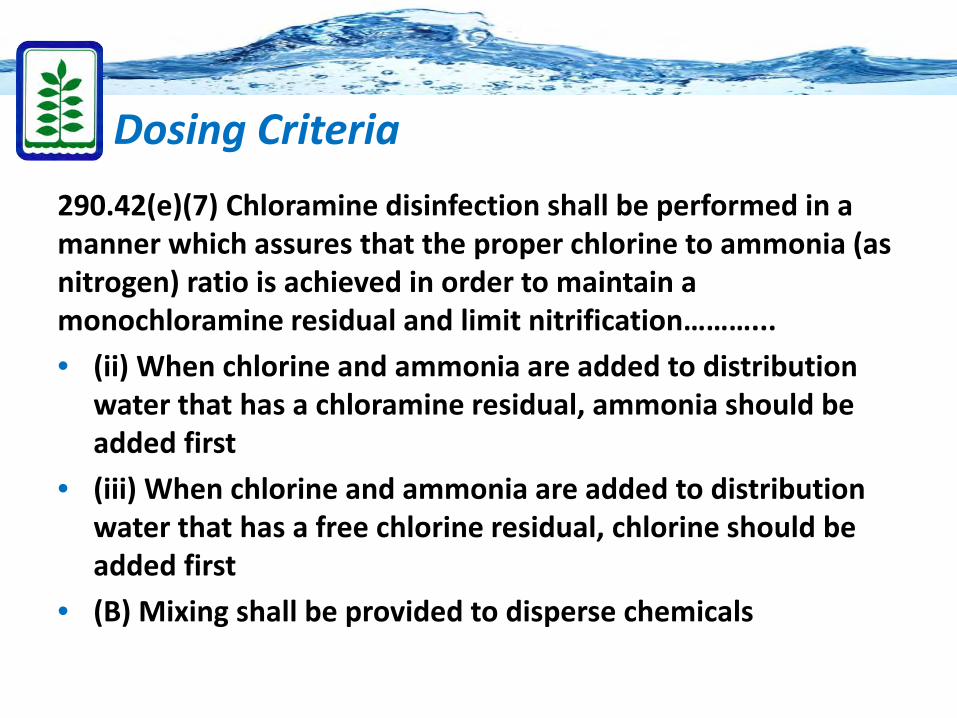
290.42(e)(7) Chloramine disinfection shall be performed in a manner which assures that the proper chlorine to ammonia (as nitrogen) ratio is achieved in order to maintain a monochloramine residual and limit nitrification………... • (ii) When chlorine and ammonia are added to distribution
water that has a chloramine residual, ammonia should be added first
• (iii) When chlorine and ammonia are added to distribution water that has a free chlorine residual, chlorine should be added first
• (B) Mixing shall be provided to disperse chemicals
Dosing Criteria
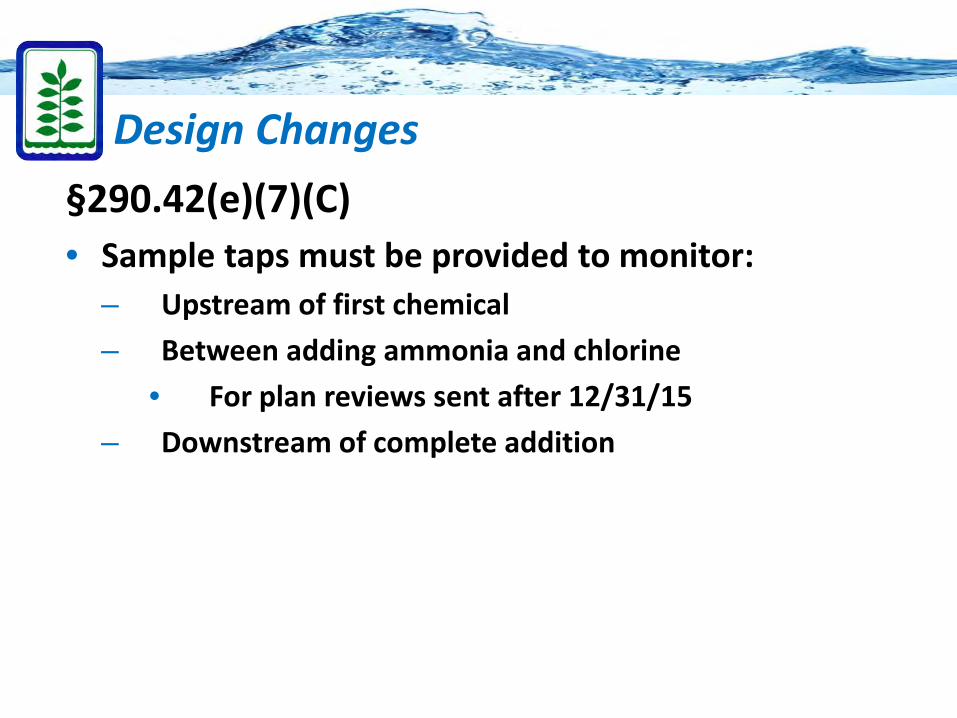
§290.42(e)(7)(C)• Sample taps must be provided to monitor:
– Upstream of first chemical– Between adding ammonia and chlorine
• For plan reviews sent after 12/31/15– Downstream of complete addition
Design Changes
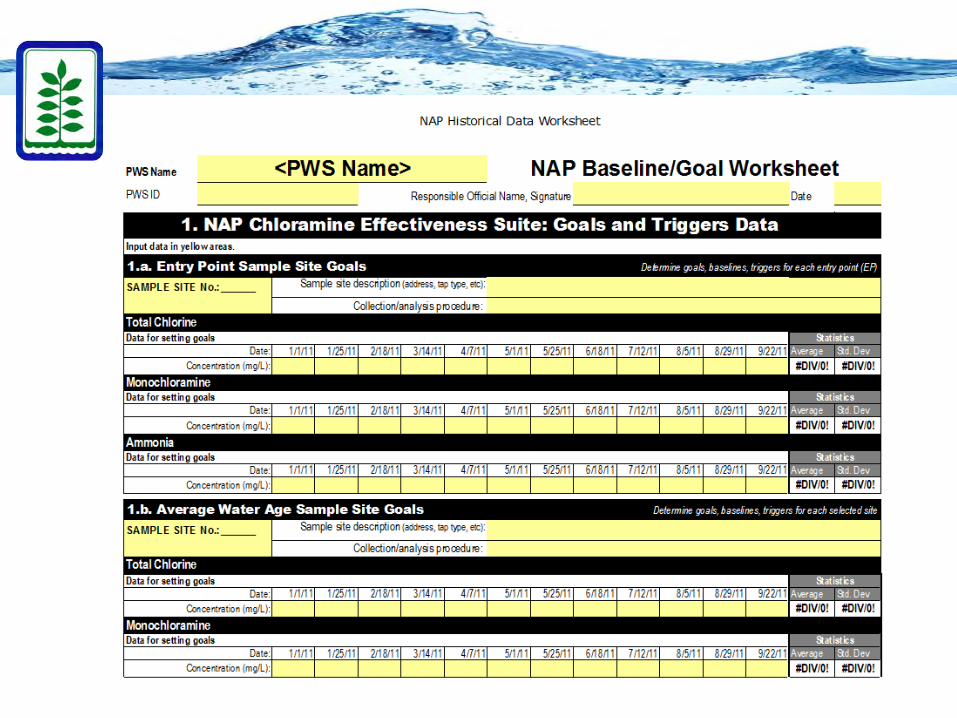
Supplement to system monitoring plan 1. A sample site map 2. Sample schedules3. Analytical methods4. Site-specific goal/baselines and trigger levels5. Actions6. Communication strategies
Nitrification Action Plan
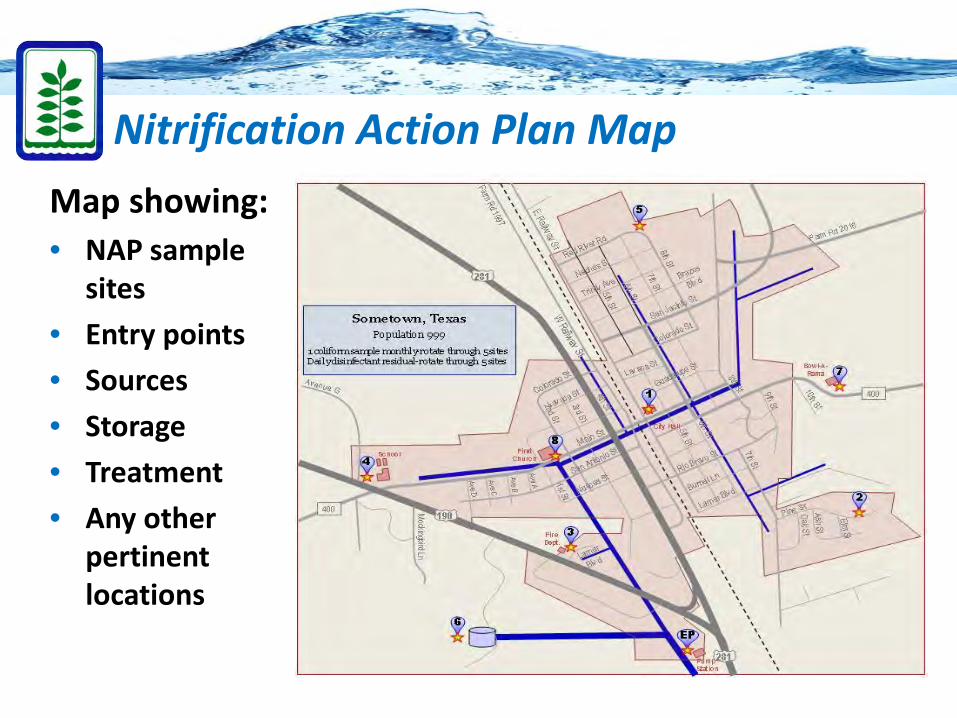
Map showing: • NAP sample
sites• Entry points• Sources• Storage • Treatment• Any other
pertinent locations
Nitrification Action Plan Map
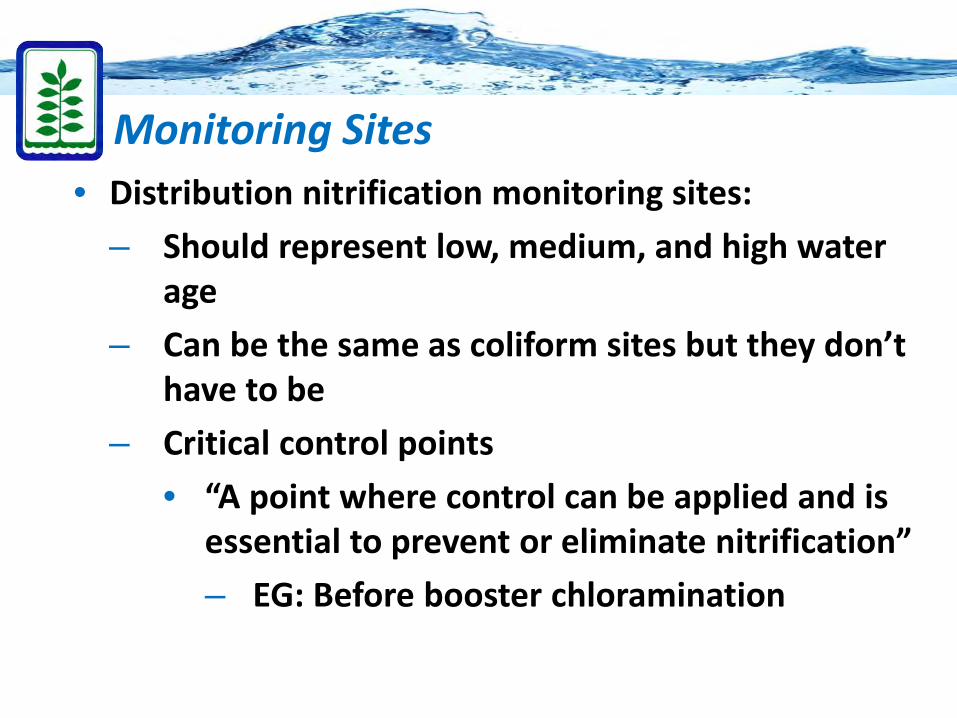
• Distribution nitrification monitoring sites:– Should represent low, medium, and high water
age– Can be the same as coliform sites but they don’t
have to be– Critical control points
• “A point where control can be applied and is essential to prevent or eliminate nitrification”– EG: Before booster chloramination
Monitoring Sites
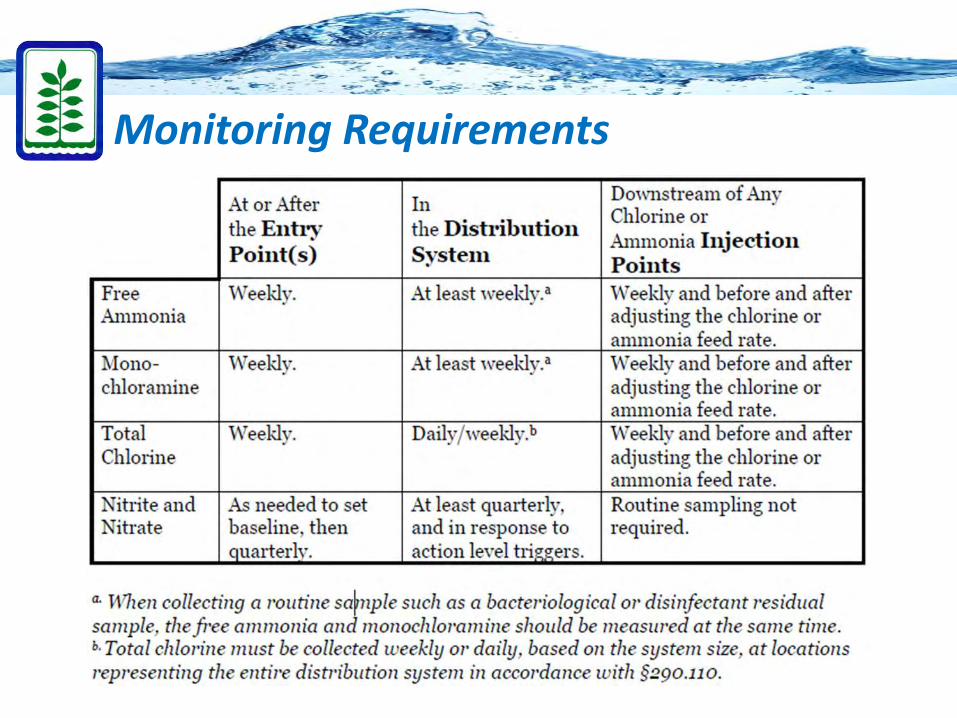
Monitoring Requirements
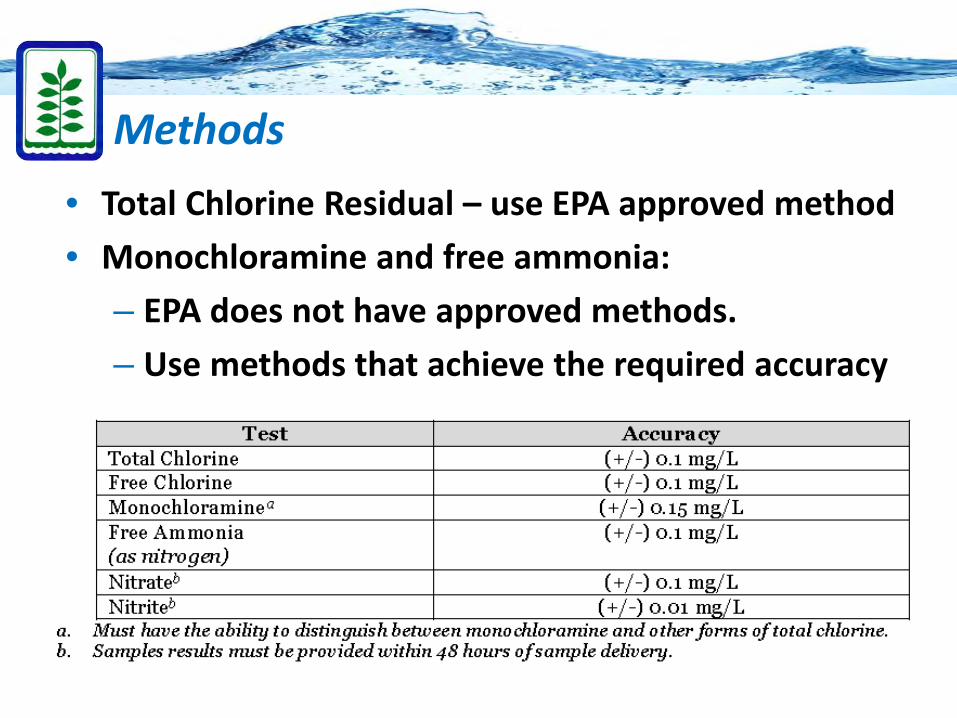
• Total Chlorine Residual – use EPA approved method• Monochloramine and free ammonia:
– EPA does not have approved methods.– Use methods that achieve the required accuracy
Methods
• Water representing the main– Not stagnant water in the sample line
• Use the calculated flush time (CFT)– Based on volume and flow– Flush just two (2) pipe-volumes– Don’t overflush
• Consider building a hydrant and tap sampler
Sample Collection Requirements
• Total Chlorine & Monochloramine: – At least the regulatory minimum for Total
PLUS a Safety Factor
• Free Ammonia:– A little bit means you are in the right ‘zone.’– When it goes away – something is eating it
• Nitrite & nitrate: – If distribution is more than baseline… Trigger!
• Also for pH, heterotrophic plate count if used
Trigger Levels Needed

44
Baseline (Green light – Go!)Parameters in normal operating range – all systems ‘go’
Alert (Yellow flag-Act.)Outside normal operating range – take precaution
Alarm! (Red flag-Act!!!)Too far outside normal operating range
– take immediate action!
45
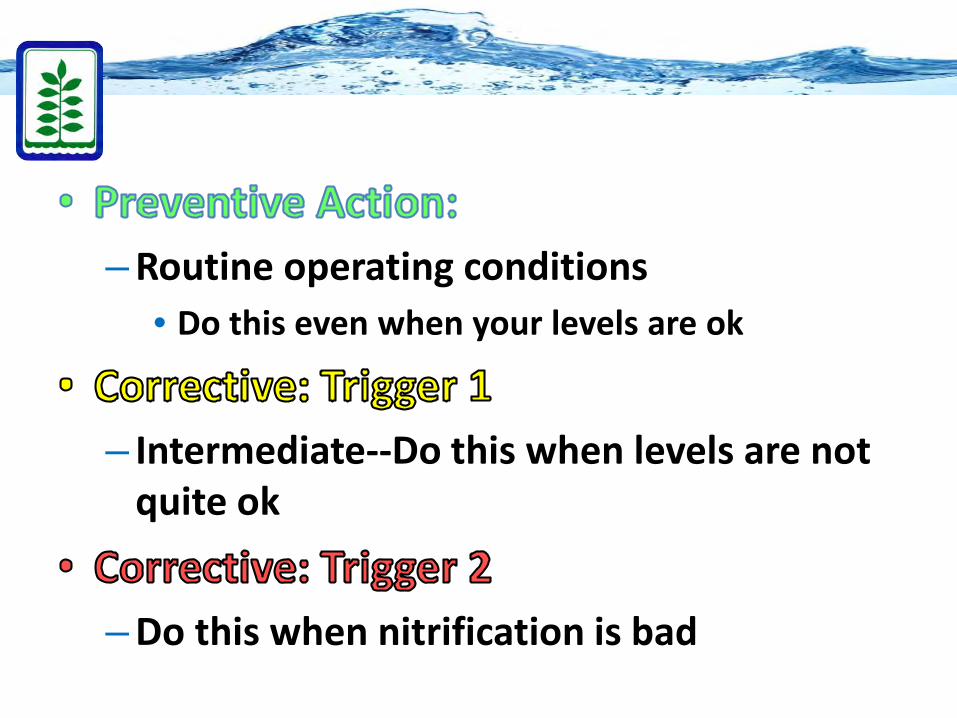
– Routine operating conditions• Do this even when your levels are ok
– Intermediate--Do this when levels are not quite ok
– Do this when nitrification is bad
Nitrification Action Plan Template
Trigger Actions Trigger ActionsTotal / Mono 4.0 3.5 3.0Ammonia 0.1 0.2 0.3Total / Mono 2.0 1.5 1.0Ammonia 0.5 +/- 20% +/- 50%Total / Mono 1.0 0.7 0.5
Ammonia 0.9 +/- 20% +/- 50%
Trigger Actions Trigger ActionsNitrite 1.23 > 1.5 > 2
Nitrate 0.12 +/- 20% +/- 50%
Entry Point
1) Verify results2) Check and adjust dose
1) Verify results2) Adjust dose
Average Water Age
All Sites
1) Verify results2) Identify source changes IF confirmed-modify BL 3) Identify area, 4) Flush area→Till levels return to normal
1) Verify results2) Identify affected area 3) Flush4) Perform free chlorine burn→Till levels return to normal
Site Chemical Baseline Yellow Flag Red Flag
1) Verify results2) Measure nitrite and nitrate3) Adjust dose4) Identify affected area (check upstream and downstream) 5) Flush area6) Flush dead ends→Till levels return to normal
1) Verify results2) Measure nitrite and nitrate3) Adjust dose4) Identify affected area (check upstream and downstream) 5) Flush area6) Flush dead ends7) Convert to Free Chlorine →Till levels return to normal
Far Reaches
Nitrite/Nitrate
Nitrification Action Plan Example
Site Chemical Goal Yellow Flag Red FlagChloramine-Effectiveness Sample Suite

• TCEQ Nitrification Action Plan• TCEQ Chloramine Fact Sheet• TCEQ Nitrification Action Plan Summary• TCEQ DWAG October 28, 2015 RTCR Workshop
http://www.texasadmin.com/tx/tceq/drinking_water_advisory
References
Water System MCC Meeting - Outline•
•
•
•
•
•
• Wylie WTP Construction Update - Joe Bernosky
• Critical Plant Shutdown Update - Joe Bernosky
•
Critical Elements: the Two Qs• For the water industry, there are two essential “Qs”:
– Quantity– Quality
• The North Texas Municipal Water District’s Capital Improvement Program (CIP) addresses these two elements.
• The CIP is a collaborative effort between:– NTMWD Engineering, Operations, Inspection, & Technical
Services Staff– Consulting Design Engineers– Contractors
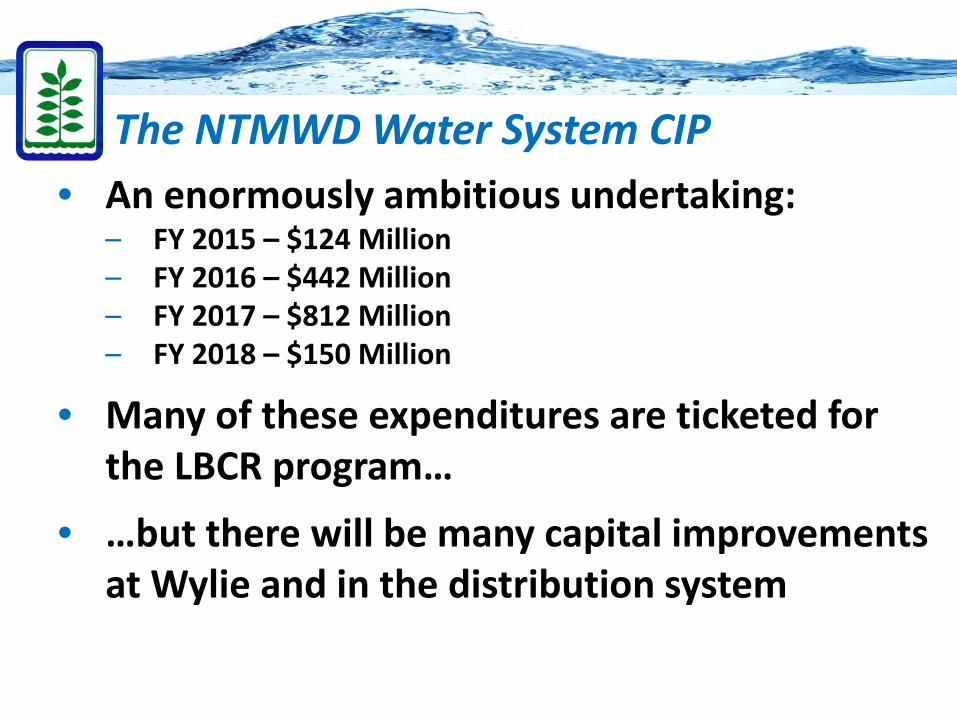
The NTMWD Water System CIP • An enormously ambitious undertaking:
– FY 2015 – $124 Million– FY 2016 – $442 Million– FY 2017 – $812 Million– FY 2018 – $150 Million
• Many of these expenditures are ticketed for the LBCR program…
• …but there will be many capital improvements at Wylie and in the distribution system

The Wylie Water Treatment Plant Complex
1 = WTPs
New Clearwells
WTP IV 70 MGD
Expansion
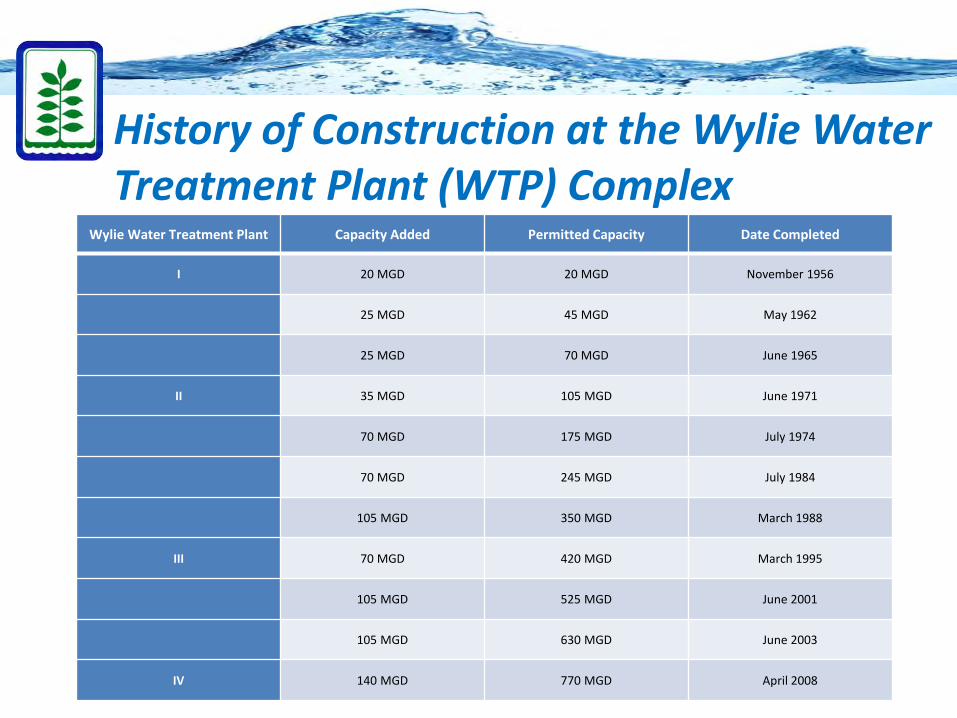
History of Construction at the Wylie Water Treatment Plant (WTP) Complex
Wylie Water Treatment Plant Capacity Added Permitted Capacity Date Completed
I 20 MGD 20 MGD November 1956
25 MGD 45 MGD May 1962
25 MGD 70 MGD June 1965
II 35 MGD 105 MGD June 1971
70 MGD 175 MGD July 1974
70 MGD 245 MGD July 1984
105 MGD 350 MGD March 1988
III 70 MGD 420 MGD March 1995
105 MGD 525 MGD June 2001
105 MGD 630 MGD June 2003
IV 140 MGD 770 MGD April 2008
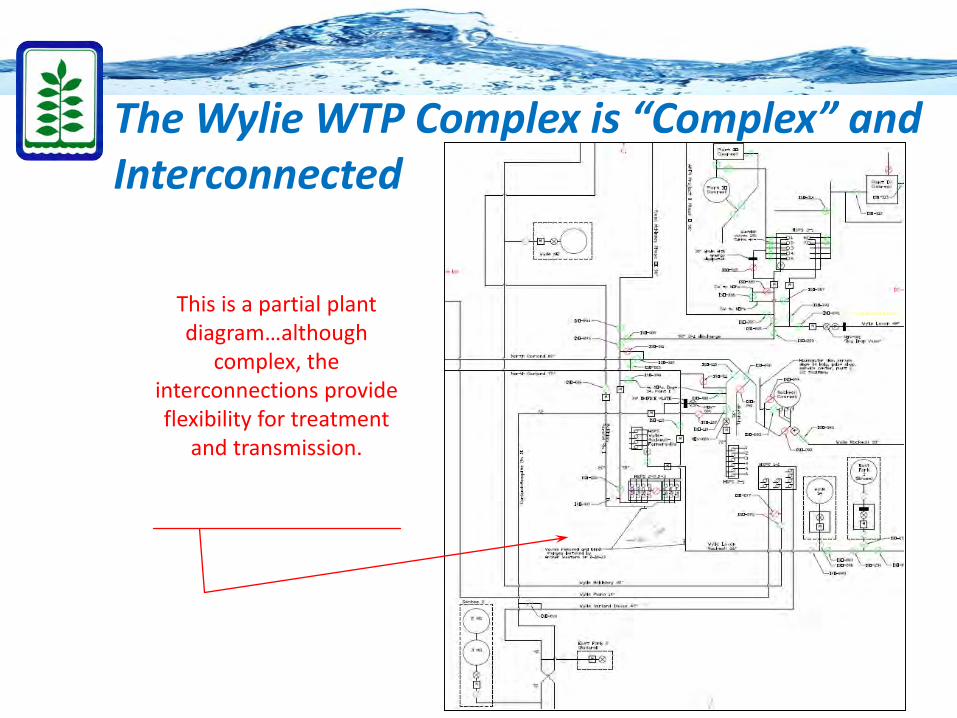
The Wylie WTP Complex is “Complex” and Interconnected
This is a partial plant diagram…although
complex, the interconnections provide flexibility for treatment
and transmission.
Projects to Improve Transmission Reliability (Quantity)
• Recently Completed– Project No. 188 – Expand HSPS 3-1 to 350 MGD
• Ongoing– Project No. 261 – High Service Pump Stations 2-2 and
2-3 Mechanical Improvements– Project No. 363 – High Service Pump Station 1-1
Mechanical Improvements
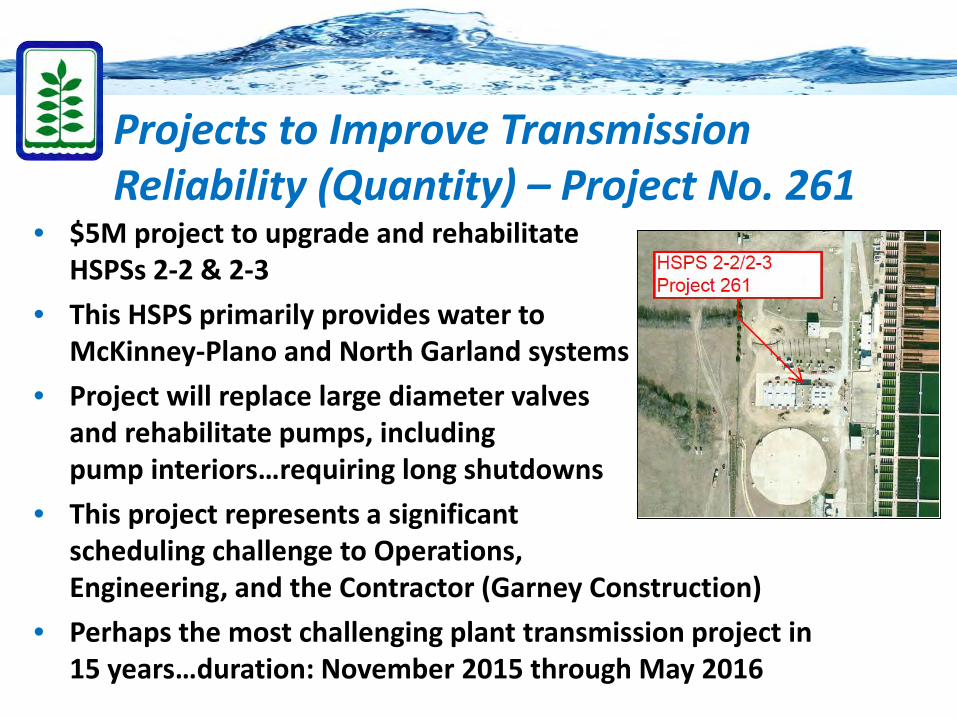
Projects to Improve Transmission Reliability (Quantity) – Project No. 261
• $5M project to upgrade and rehabilitateHSPSs 2-2 & 2-3
• This HSPS primarily provides water to McKinney-Plano and North Garland systems
• Project will replace large diameter valvesand rehabilitate pumps, includingpump interiors…requiring long shutdowns
• This project represents a significant scheduling challenge to Operations, Engineering, and the Contractor (Garney Construction)
• Perhaps the most challenging plant transmission project in 15 years…duration: November 2015 through May 2016
Projects to Improve Treatment Capacity (Quantity)
• Project No. 387 – Wylie Water Treatment Plant IV – 70 MGD Expansion– Designed by Carollo Engineers, Inc.– Construction is planned under the CMAR project delivery method
• The WTP will employ the following conventional treatment processes:– New rapid mix chambers– Flocculation and sedimentation basins (likely inclined plate
settlers)– 10 new filters and associated backwash system– New ozone facilities– Additional ancillary facilities including filter backwash and
chemical storage/feed systems• Scheduled to be online in 2018
Projects to Improve Distribution Capacity (Quantity)
• New Distribution System Reservoirs• North System
– Allen – 2 each 14.5 MG 2017/2020– Plano-McKinney – 7 MG 2018
• South System– McCree – 6 MG 2017– Shiloh – 3.1 MG 2019– Terrill – 3 MG 2021
• East System – 4.9 MG 2018
Projects to Improve Water Quality
• There are many recently completed, ongoing, and planned projects that are intended to improve finished water quality
• Many of the projects are interconnected and interrelated
• Working together they will lead to:– Improved operational stability– Reduced likelihood of nitrification– Reduced potential for taste & odor (T&O) events– More consistent finished water
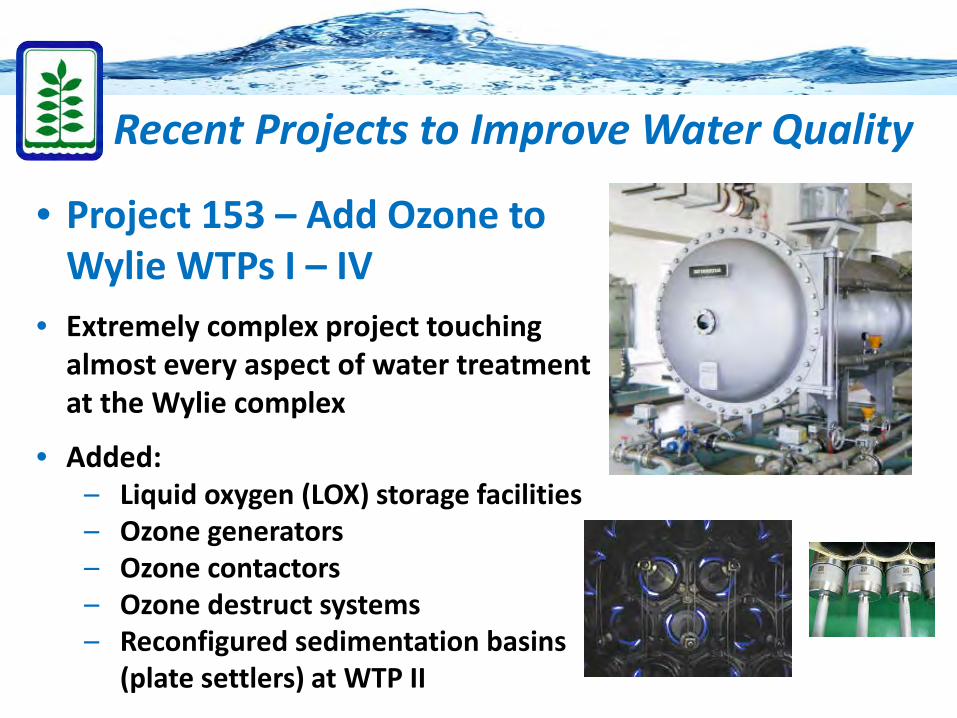
Recent Projects to Improve Water Quality
• Project 153 – Add Ozone to Wylie WTPs I – IV
• Extremely complex project touching almost every aspect of water treatment at the Wylie complex
• Added:– Liquid oxygen (LOX) storage facilities– Ozone generators– Ozone contactors– Ozone destruct systems– Reconfigured sedimentation basins
(plate settlers) at WTP II
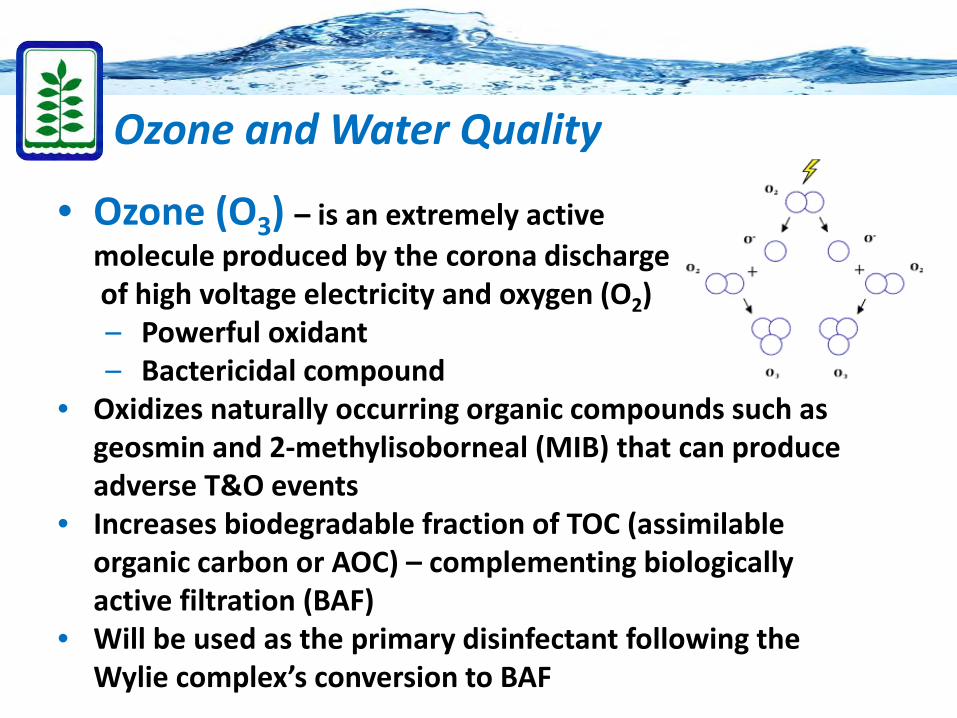
Ozone and Water Quality
• Ozone (O3) – is an extremely active molecule produced by the corona dischargeof high voltage electricity and oxygen (O2)– Powerful oxidant – Bactericidal compound
• Oxidizes naturally occurring organic compounds such as geosmin and 2-methylisoborneal (MIB) that can produce adverse T&O events
• Increases biodegradable fraction of TOC (assimilableorganic carbon or AOC) – complementing biologically active filtration (BAF)
• Will be used as the primary disinfectant following the Wylie complex’s conversion to BAF
Ongoing Projects to Improve Water Quality
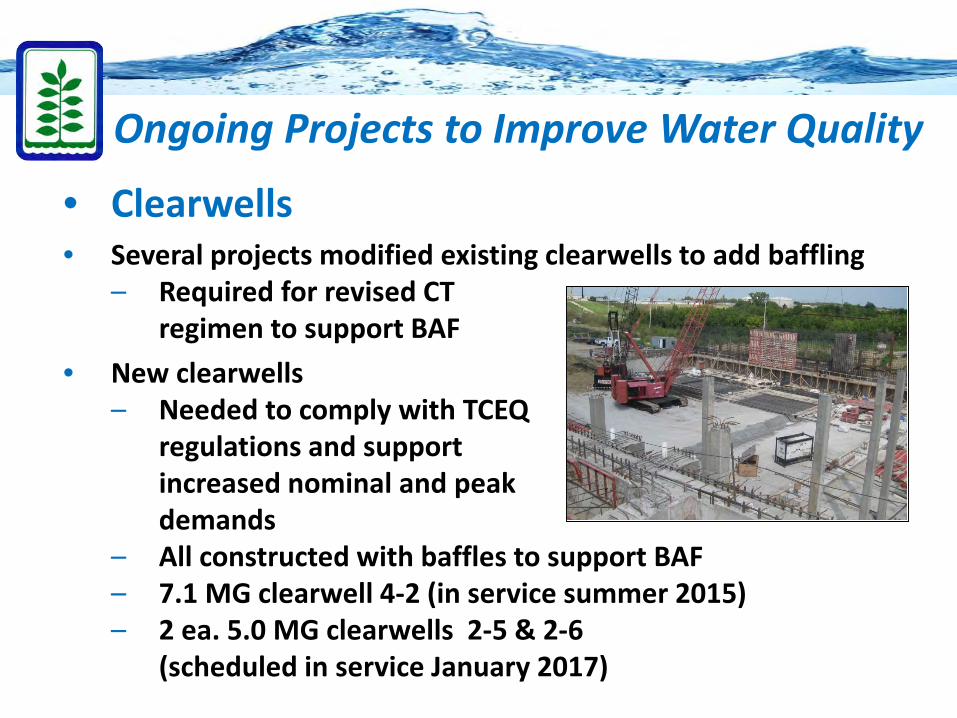
• Clearwells• Several projects modified existing clearwells to add baffling
– Required for revised CT regimen to support BAF
• New clearwells– Needed to comply with TCEQ
regulations and supportincreased nominal and peak demands
– All constructed with baffles to support BAF– 7.1 MG clearwell 4-2 (in service summer 2015)– 2 ea. 5.0 MG clearwells 2-5 & 2-6
(scheduled in service January 2017)
Ongoing Projects to Improve Water Quality
• Chemical Flow Pacing• A method of controlling chemical feeds (such as chlorine,
ammonia, coagulant, etc.) based on the flow of water– Allows more precise dosing– Allows more rapid dose adjustments due to flow
changes– Can be manually overridden if required.
• Requires modifications to chemical feeders, pumps, application points, and integrated control software
• Chemical flow pacing was initiated with Project 276 (Texoma to Wylie Raw Water Pipeline)
• Continuation project scheduled for completion in spring 2016
Ongoing Projects to Improve Water Quality
• BAF Conversion• Requires significant filter and plant structural modifications
– Deeper filter depth and removal of IMS caps– Dechlorinated backwash
• Multiple projects over many years– WTP I – Project No. 259 (completed fall 2014)– WTP IV – Project No. 251 (completed summer 2014)– WTP III – Project No. 277 (scheduled for completion spring
2016)– WTP II – Project No. 302 (two phases with final completion in
2018)• Due to the interconnected nature of the Wylie WTP complex – a
feature that provides great operational flexibility and redundancy – BAF cannot be implemented until all WTPs have been retrofitted
BAF and Water Quality• BAF is modified conventional filtration• Microbial growth attached to the filter media consumes
organic matter that would otherwise flow through the treatment plant and ultimately into the distribution system.– Contributes to a more stable water quality– Reduces potential for microbial regrowth and
nitrification in the distribution system• Works well in conjunction with ozone as the primary
disinfectant• BAF removes contaminants by three main mechanisms:
– Biodegradation of AOC– Adsorption– Filtration of suspended solids.
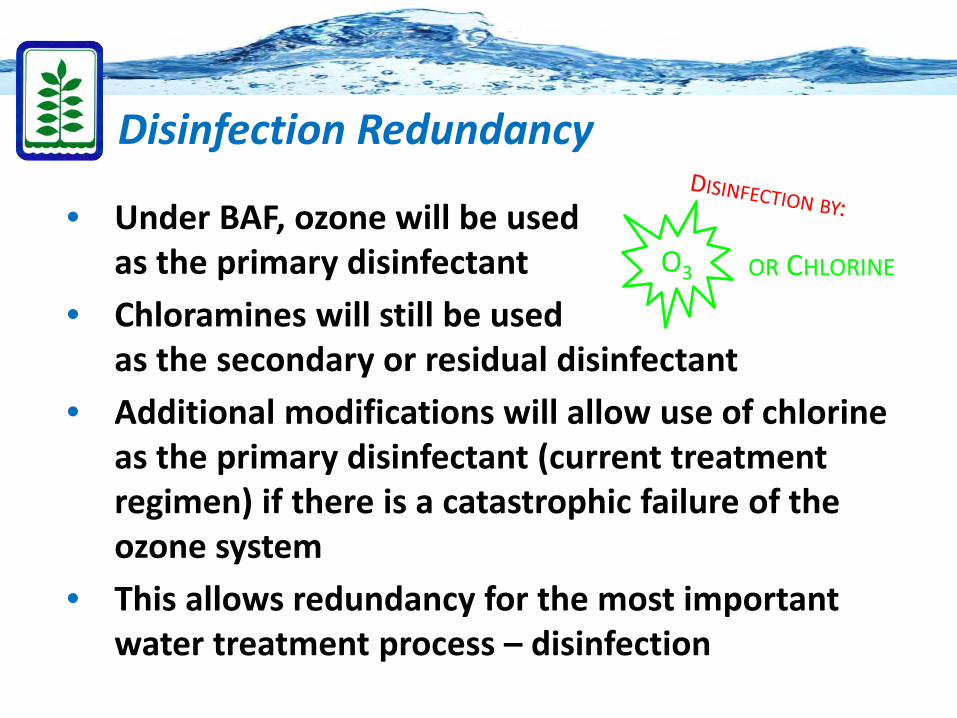
Disinfection Redundancy
• Under BAF, ozone will be usedas the primary disinfectant
• Chloramines will still be usedas the secondary or residual disinfectant
• Additional modifications will allow use of chlorine as the primary disinfectant (current treatment regimen) if there is a catastrophic failure of the ozone system
• This allows redundancy for the most important water treatment process – disinfection
O3 OR CHLORINE
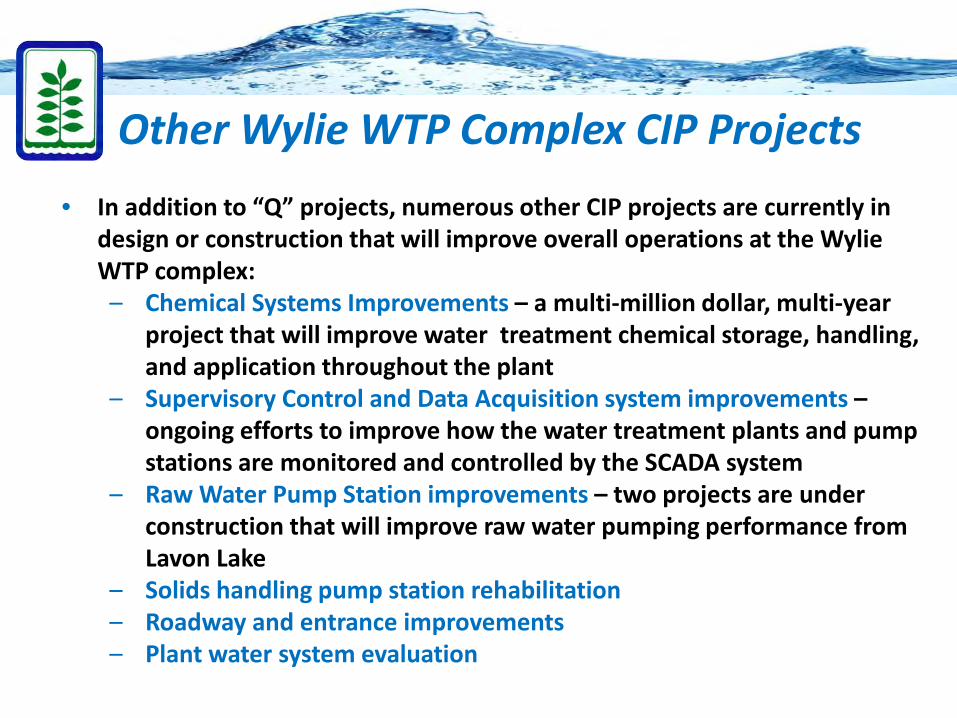
Other Wylie WTP Complex CIP Projects• In addition to “Q” projects, numerous other CIP projects are currently in
design or construction that will improve overall operations at the Wylie WTP complex:– Chemical Systems Improvements – a multi-million dollar, multi-year
project that will improve water treatment chemical storage, handling, and application throughout the plant
– Supervisory Control and Data Acquisition system improvements –ongoing efforts to improve how the water treatment plants and pump stations are monitored and controlled by the SCADA system
– Raw Water Pump Station improvements – two projects are under construction that will improve raw water pumping performance from Lavon Lake
– Solids handling pump station rehabilitation– Roadway and entrance improvements– Plant water system evaluation
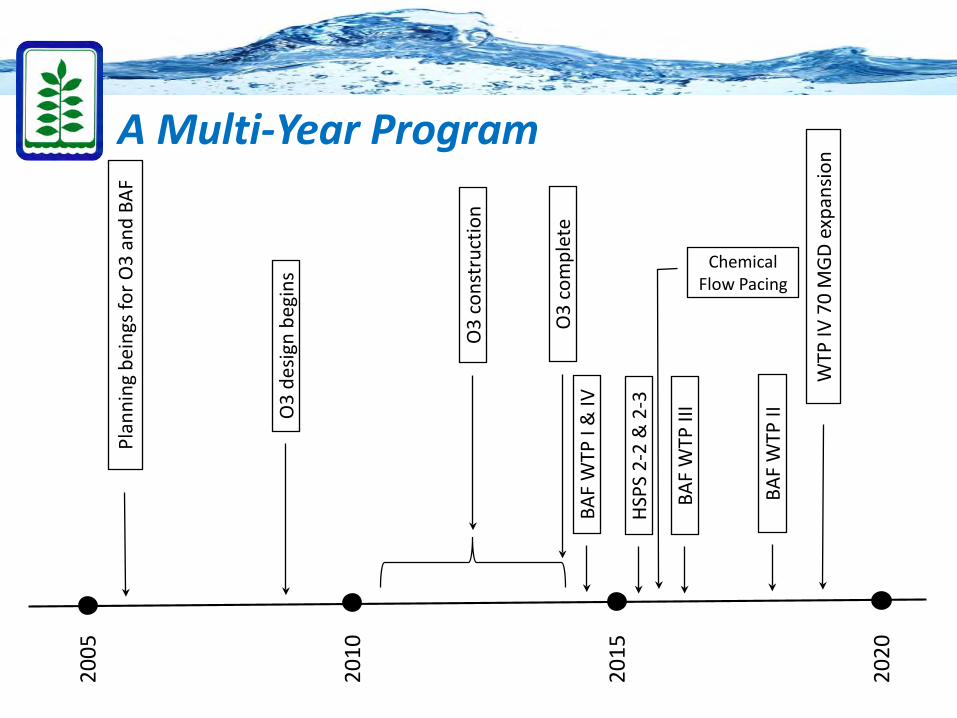
A Multi-Year Program20
05
2010
2015
2020
Plan
ning
bei
ngs f
or O
3 an
d BA
F
O3
desig
n be
gins
O3
cons
truc
tion
BAF
WTP
I &
IV
HSPS
2-2
& 2
-3
BAF
WTP
II
WTP
IV 7
0 M
GD
expa
nsio
n
O3
com
plet
e
BAF
WTP
III
Chemical Flow Pacing
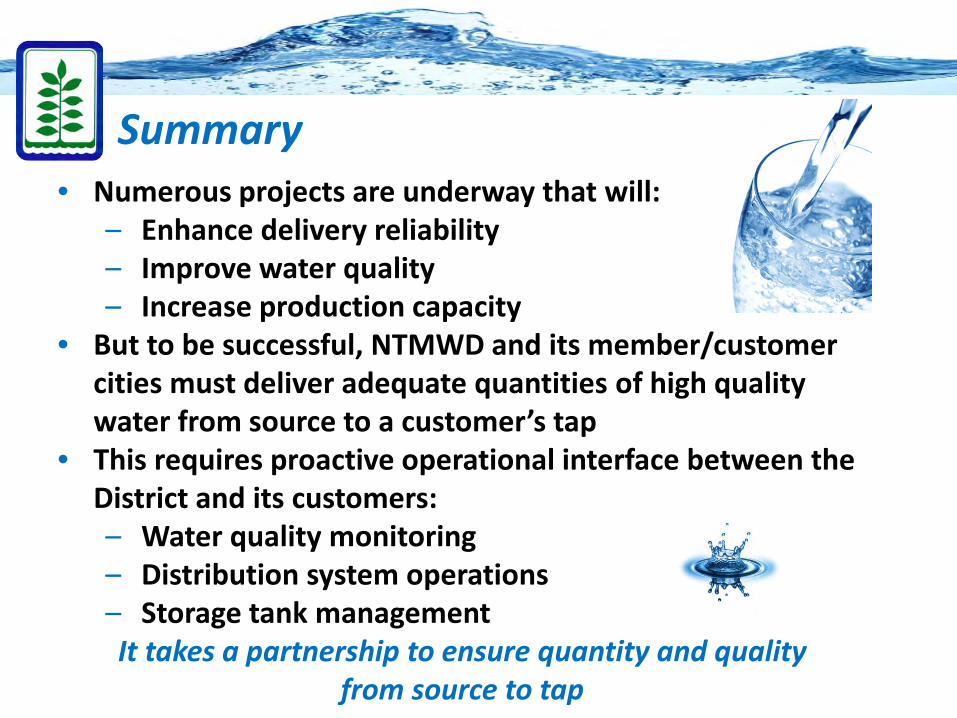
Summary• Numerous projects are underway that will:
– Enhance delivery reliability– Improve water quality– Increase production capacity
• But to be successful, NTMWD and its member/customer cities must deliver adequate quantities of high quality water from source to a customer’s tap
• This requires proactive operational interface between the District and its customers:– Water quality monitoring– Distribution system operations– Storage tank managementIt takes a partnership to ensure quantity and quality
from source to tap
Multiple Projects at WTP II
Multiple Projects at WTP II
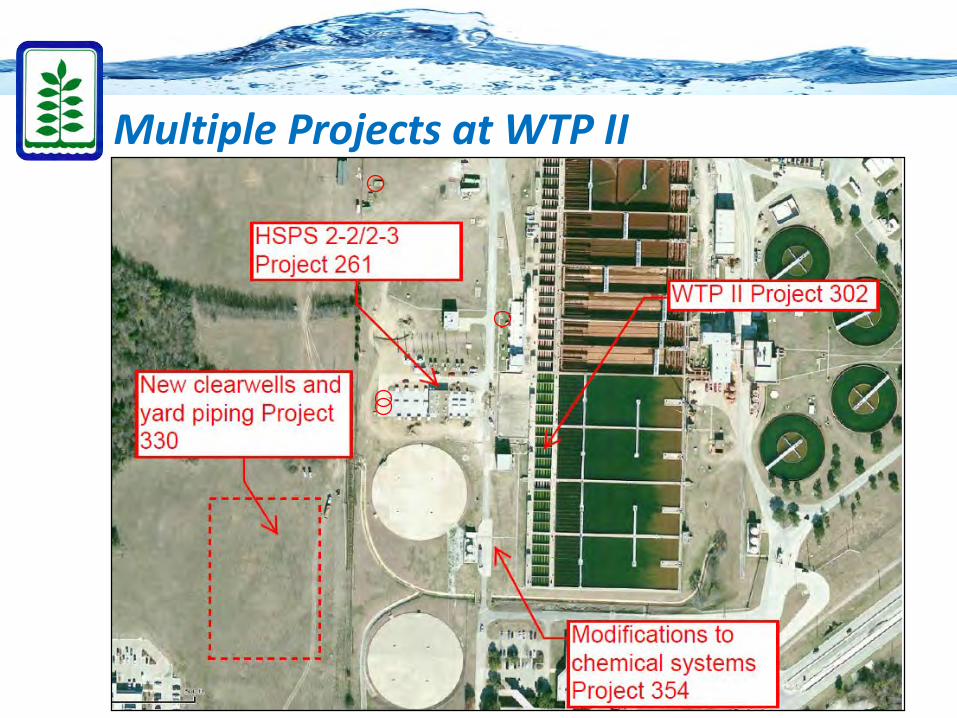
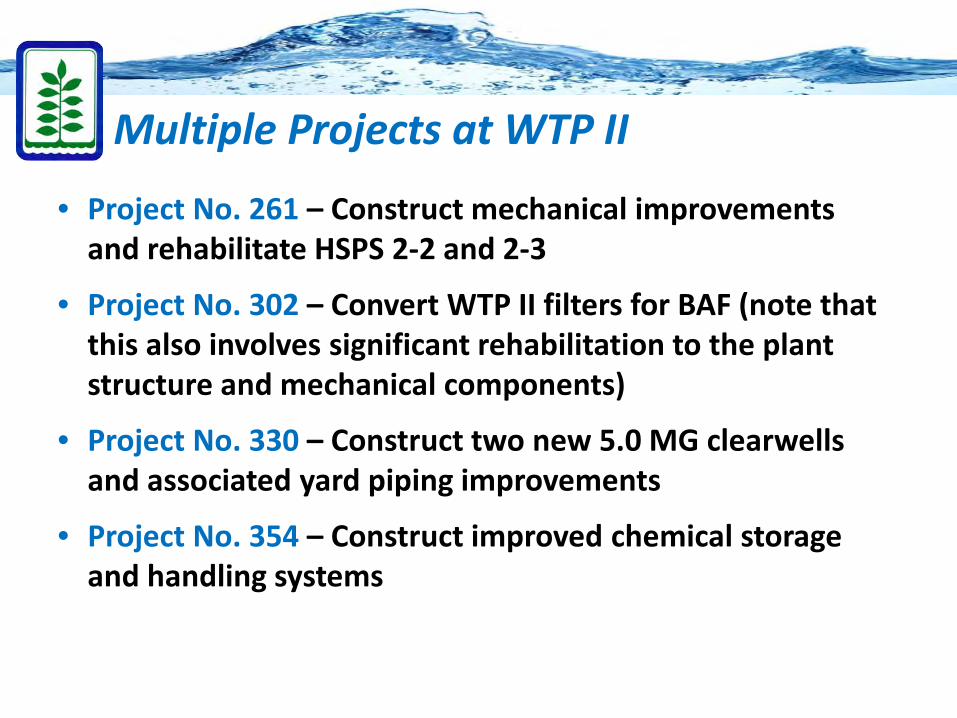
• Project No. 261 – Construct mechanical improvements and rehabilitate HSPS 2-2 and 2-3
• Project No. 302 – Convert WTP II filters for BAF (note that this also involves significant rehabilitation to the plant structure and mechanical components)
• Project No. 330 – Construct two new 5.0 MG clearwellsand associated yard piping improvements
• Project No. 354 – Construct improved chemical storage and handling systems
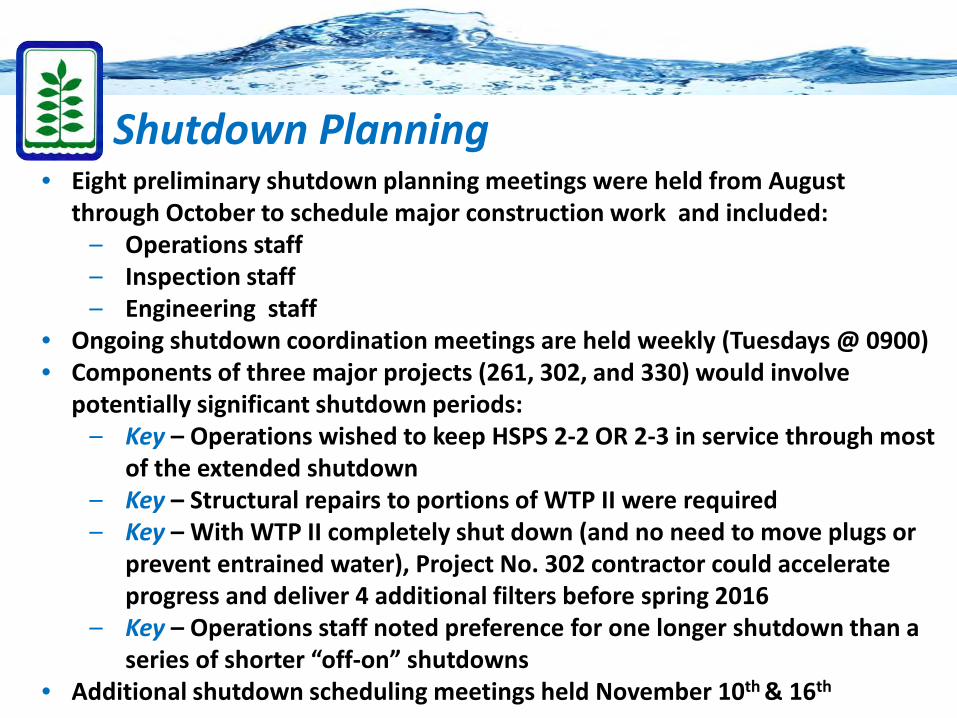
Shutdown Planning• Eight preliminary shutdown planning meetings were held from August
through October to schedule major construction work and included:– Operations staff– Inspection staff– Engineering staff
• Ongoing shutdown coordination meetings are held weekly (Tuesdays @ 0900)• Components of three major projects (261, 302, and 330) would involve
potentially significant shutdown periods:– Key – Operations wished to keep HSPS 2-2 OR 2-3 in service through most
of the extended shutdown– Key – Structural repairs to portions of WTP II were required – Key – With WTP II completely shut down (and no need to move plugs or
prevent entrained water), Project No. 302 contractor could accelerate progress and deliver 4 additional filters before spring 2016
– Key – Operations staff noted preference for one longer shutdown than a series of shorter “off-on” shutdowns
• Additional shutdown scheduling meetings held November 10th & 16th
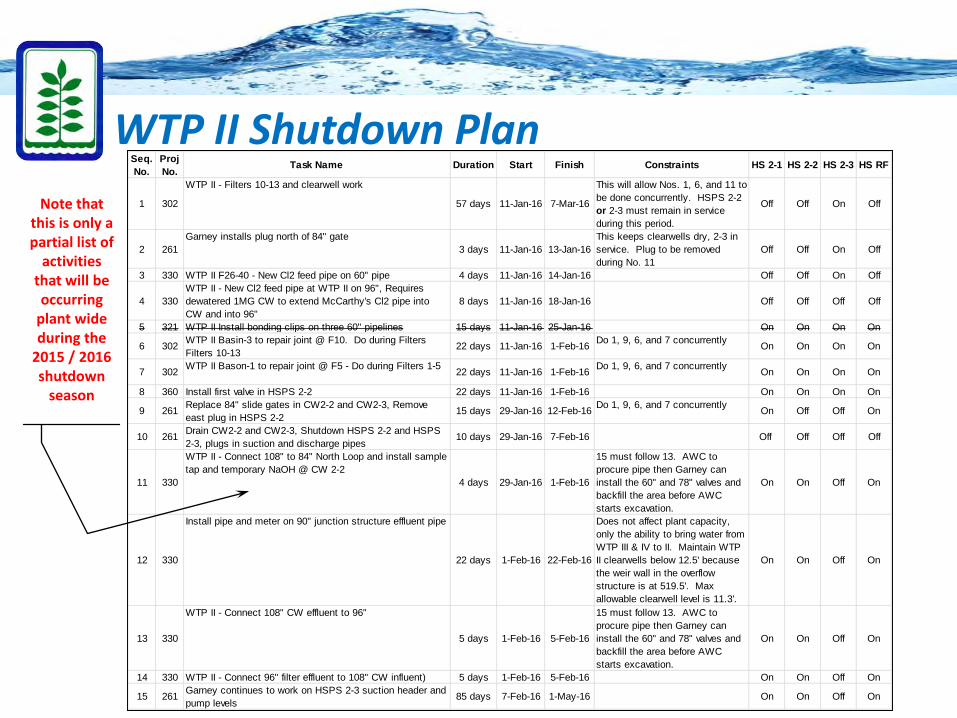
WTP II Shutdown PlanSeq. No.
Proj No. Task Name Duration Start Finish Constraints HS 2-1 HS 2-2 HS 2-3 HS RF
1 302
WTP II - Filters 10-13 and clearwell work
57 days 11-Jan-16 7-Mar-16
This will allow Nos. 1, 6, and 11 to be done concurrently. HSPS 2-2 or 2-3 must remain in service during this period.
Off Off On Off
2 261Garney installs plug north of 84" gate
3 days 11-Jan-16 13-Jan-16This keeps clearwells dry, 2-3 in service. Plug to be removed during No. 11
Off Off On Off
3 330 WTP II F26-40 - New Cl2 feed pipe on 60" pipe 4 days 11-Jan-16 14-Jan-16 Off Off On Off
4 330WTP II - New Cl2 feed pipe at WTP II on 96", Requires dewatered 1MG CW to extend McCarthy's Cl2 pipe into CW and into 96"
8 days 11-Jan-16 18-Jan-16 Off Off Off Off
5 321 WTP II Install bonding clips on three 60" pipelines 15 days 11-Jan-16 25-Jan-16 On On On On
6 302 WTP II Basin-3 to repair joint @ F10. Do during Filters Filters 10-13
22 days 11-Jan-16 1-Feb-16 Do 1, 9, 6, and 7 concurrently On On On On
7 302 WTP II Bason-1 to repair joint @ F5 - Do during Filters 1-5 22 days 11-Jan-16 1-Feb-16 Do 1, 9, 6, and 7 concurrently On On On On
8 360 Install first valve in HSPS 2-2 22 days 11-Jan-16 1-Feb-16 On On On On
9 261 Replace 84" slide gates in CW2-2 and CW2-3, Remove east plug in HSPS 2-2
15 days 29-Jan-16 12-Feb-16 Do 1, 9, 6, and 7 concurrently On Off Off On
10 261 Drain CW2-2 and CW2-3, Shutdown HSPS 2-2 and HSPS 2-3, plugs in suction and discharge pipes
10 days 29-Jan-16 7-Feb-16 Off Off Off Off
11 330
WTP II - Connect 108" to 84" North Loop and install sample tap and temporary NaOH @ CW 2-2
4 days 29-Jan-16 1-Feb-16
15 must follow 13. AWC to procure pipe then Garney can install the 60" and 78" valves and backfill the area before AWC starts excavation.
On On Off On
12 330
Install pipe and meter on 90" junction structure effluent pipe
22 days 1-Feb-16 22-Feb-16
Does not affect plant capacity, only the ability to bring water from WTP III & IV to II. Maintain WTP II clearwells below 12.5' because the weir wall in the overflow structure is at 519.5'. Max allowable clearwell level is 11.3'.
On On Off On
13 330
WTP II - Connect 108" CW effluent to 96"
5 days 1-Feb-16 5-Feb-16
15 must follow 13. AWC to procure pipe then Garney can install the 60" and 78" valves and backfill the area before AWC starts excavation.
On On Off On
14 330 WTP II - Connect 96" filter effluent to 108" CW influent) 5 days 1-Feb-16 5-Feb-16 On On Off On
15 261 Garney continues to work on HSPS 2-3 suction header and pump levels
85 days 7-Feb-16 1-May-16 On On Off On
Note that this is only a partial list of
activities that will be occurring
plant wide during the
2015 / 2016 shutdown
season
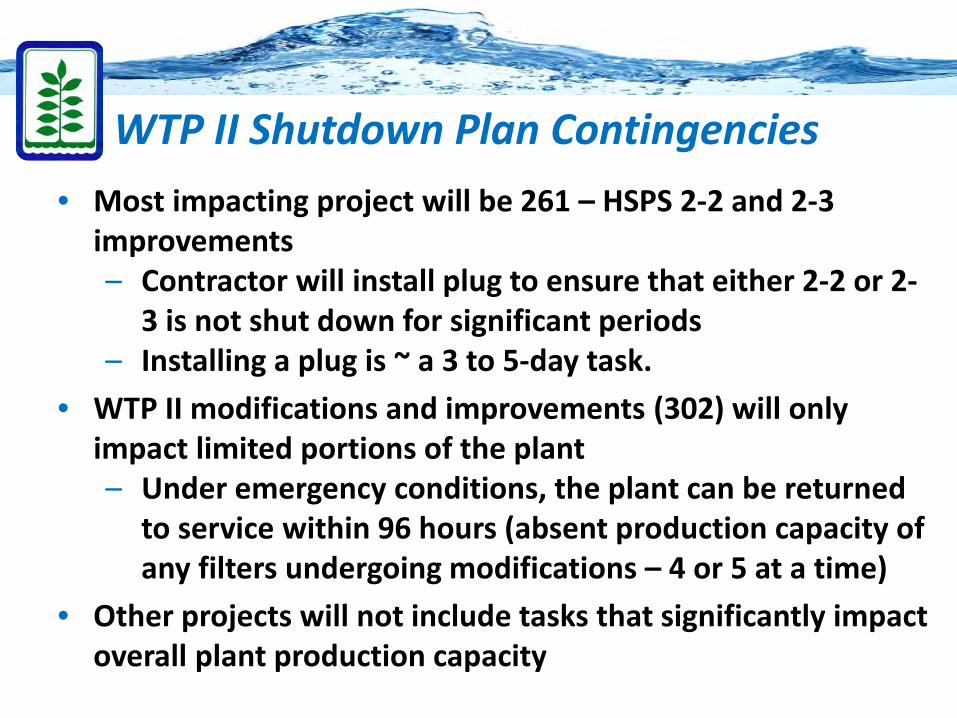
WTP II Shutdown Plan Contingencies• Most impacting project will be 261 – HSPS 2-2 and 2-3
improvements– Contractor will install plug to ensure that either 2-2 or 2-
3 is not shut down for significant periods– Installing a plug is ~ a 3 to 5-day task.
• WTP II modifications and improvements (302) will only impact limited portions of the plant– Under emergency conditions, the plant can be returned
to service within 96 hours (absent production capacity of any filters undergoing modifications – 4 or 5 at a time)
• Other projects will not include tasks that significantly impact overall plant production capacity

Project No. 261 – Initial ActivitiesA. Junction Structure Stop Logs and Plugs- Complete
• Garney installed stop logs and plugs• Plant 3 returned to service
B. Install 78” and 2 x 60” BFVs on McKinney-Plano Line- 11/12 through 11/21• After Plant 3 is back in service, take down HSPS 2-2 and 2-3• NTMWD to dechlorinate at BOVs on 60” and 78” lines (0.944 MG from the 60” and 0.214 MG from the 78”)• Garney to dewater from HSPS 2-2 and 2-3• Perform yard valve replacements (11/13 – 11/18)• NTMWD to bring back up HSPS 2-2 and 2-3; recharge McKinney-Plano line upon completion.
C. NTMWD to perform trial run shutdown of HSPSs 2-1, 2-2, 2-3 and Rockwall-Farmersville- 11/30 through 12/2• Upon completion of the above referenced yard valves, NTMWD to perform trial run shutdown of HSPSs 2-1, 2-2, 2-3 and R-F.• NTMWD to run system with the above HSPSs out of service to see how system performs.• Upon completion of trial run, bring back up HSPSs 2-1, 2-2, 2-3 and R-F.
Provided system performs adequately during trial run, proceed with next shutdown
D. Install 72” BFV on North Loop, 84” plugs in HSPS 2-2 and 84” slide gates at Clearwells 2-2 and 2-3- 12/3 through 12/8• NTMWD to shutdown Plant 2, pump down Clearwells 2-1, 2-2, 2-3 and 2-4 as much as possible.• Garney/NTMWD to dewatering remaining volume of water in Clearwells and HSPSs 2-2 and 2-3 (~3.2 MG)• Once dewatered, install 72” BFV on North Loop, 84” plugs in suction line of HSPS 2-2 and 84” slide gates in Clearwells 2-2 and
2-3.• Recharge HSPS 2-2/2-3 and bring up Plant 2.• Begin work in HSPS 2-2 upon completion of 84” plugs (~12/4 – ~2/4) Discuss completion date with Garney and effect on HSPS
2-3 shutdown/work and overall timeline.
E. Shutdown High Service Pumps (HSPs) 7 – 13 (North Garland System) for testing of pipes and install of discharge valves on HSPs 7, 8 and 9- TBD ~ 12-7 through 12/9

Water System MCC Meeting - Outline•
•
•
•
•
•
•
•
• Upcoming Meetings - Billy George
5 Major Projects
• November 18 – Hyatt (No meeting in December)• Watch for upcoming 2016 meeting schedule via email
Upcoming Meetings
RSVP through
www.NTMWD.com and follow us on:
https://twitter.com/ntmwd
https://www.facebook.com/pages/North-Texas-Municipal-Water-District/220424934701711
North Texas Municipal Water District“Regional Service Through Unity …
Meeting our Region’s Needs Today and Tomorrow”
Wastewater Partnering MeetingNovember 18, 2015
1
Agenda
2
• Meeting Purposes• General Update
• Holiday Grease Roundup• City update?
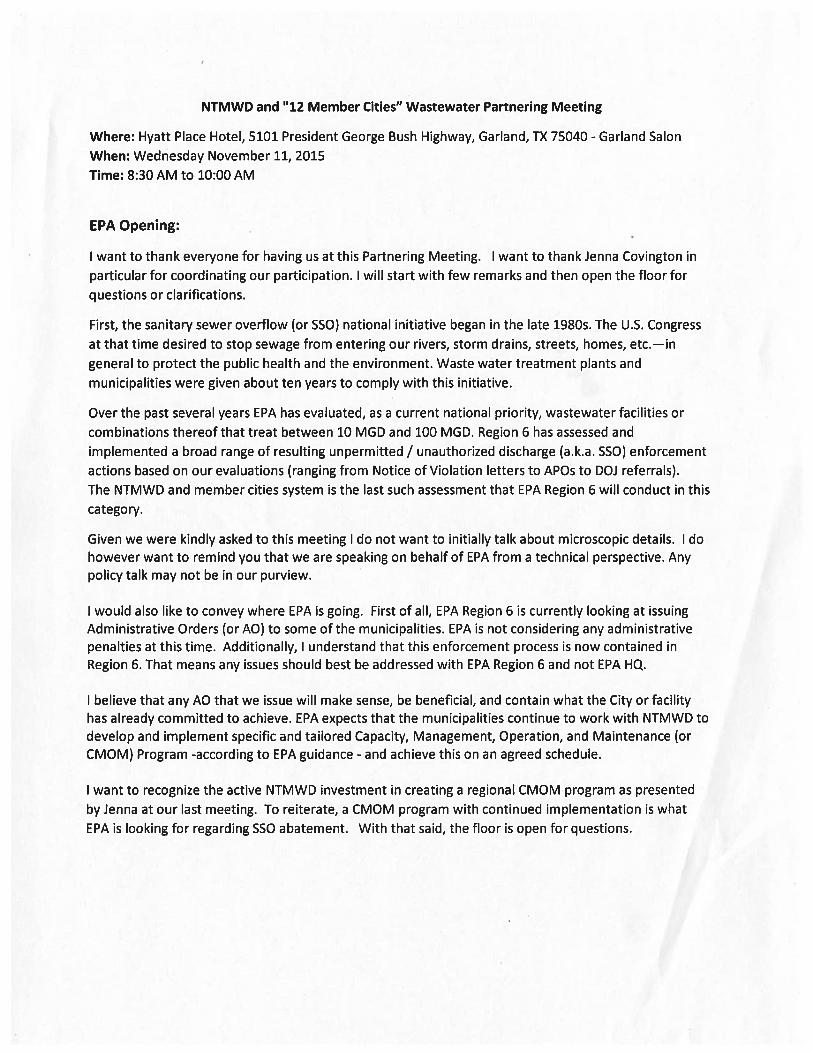
• EPA Guest Speakers• National SSO Enforcement Initiative (Damon McElroy) • EPA Region 6 Administrative Order (AO) determination process summary (Damon McElroy et. al.)
• EPA Capacity, Management, Operation, and Maintenance (CMOM) Program (Alan Vaughn)
• Recognition of the NTMWD regional CMOM program and relationship to any AOs (Alan Vaughn)
• Discussion• Wrap up
Meeting Purposes• Improve communication and relationships with cities NTMWD serves
• Share regulatory information and experiences to prepare and educate
• Establish framework for regular communication with cities served and District
• Partnering: Share best practices• Workgroup: Develop joint solutions, Regional CMOM Program
5 Major Projects
• NTMWD is a member of the NCTCOG Water and Treatment Education Roundtable (WATER) group
• Regional group dedicated to providing public education regarding fats, oils, and grease (FOG), flushables, pharmaceuticals, etc.
• NCTCOG is the sponsor of the 2015 Holiday Grease Roundup event
• Regional effort to collect used cooking oil and grease rather than disposing down the drain
• NTMWD will be participating with one drop off location• Website: www.ceasethegreasentx.com
2015 Holiday Grease RoundupEnvironmental Services
5 Major Projects
• Event Details• Drop off location:
• 201 E. Brown Street, Wylie, Texas (Environmental Services Building)• Dates/Hours:
• November 30 – December 11• Monday – Friday (9 a.m. – 3:30 p.m.)• Saturday December 5 (9 a.m. – 3:30 p.m.)
• We will collect used cooking oil and grease only• All used cooking oil and grease will be donated to the Dallas County Schools Alternative Fuels Program to be processed into biodiesel for buses
2015 Holiday Grease RoundupEnvironmental Services
General UpdateCity Updates?
6
EPA Guest SpeakersDamon McElroyAlan Vaughn
7

Wrap Up
8