Embed Size (px)
Citation preview

2014 Financial ReviewNORTHEAST UTILITIES
These materials provide updated
operating and financial information for
Northeast Utilities (NU) consolidated
and each of NU’s operating subsidiaries
and supplement the 2013 NU company
annual reports.
Thomas J. MayChairman, President and Chief Executive Officer
James J. JudgeExecutive Vice President and Chief Financial Officer
Werner J. SchweigerExecutive Vice President and Chief Operating Officer
2013 2012* 2011 2010 2009
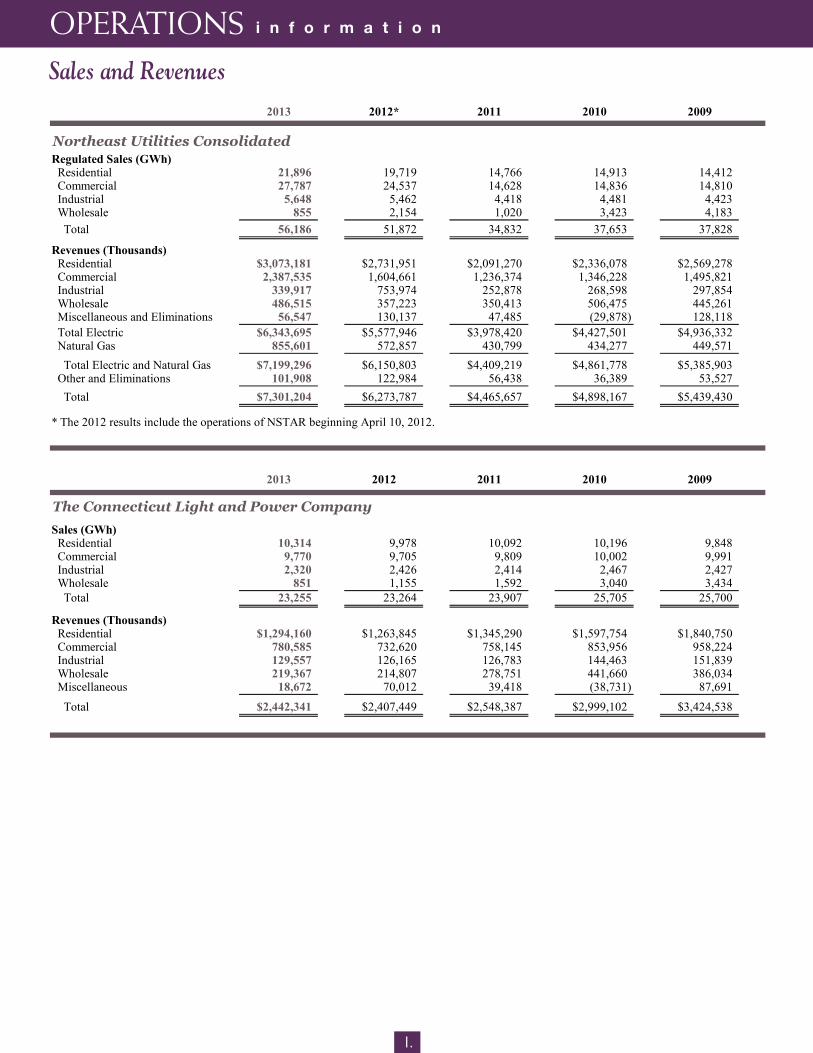
Northeast Utilities ConsolidatedRegulated Sales (GWh) Residential 21,896 19,719 14,766 14,913 14,412 Commercial 27,787 24,537 14,628 14,836 14,810 Industrial 5,648 5,462 4,418 4,481 4,423 Wholesale 855 2,154 1,020 3,423 4,183 Total 56,186 51,872 34,832 37,653 37,828
Revenues (Thousands) Residential $3,073,181 $2,731,951 $2,091,270 $2,336,078 $2,569,278 Commercial 2,387,535 1,604,661 1,236,374 1,346,228 1,495,821 Industrial 339,917 753,974 252,878 268,598 297,854 Wholesale 486,515 357,223 350,413 506,475 445,261 Miscellaneous and Eliminations 56,547 130,137 47,485 (29,878) 128,118 Total Electric $6,343,695 $5,577,946 $3,978,420 $4,427,501 $4,936,332 Natural Gas 855,601 572,857 430,799 434,277 449,571 Total Electric and Natural Gas $7,199,296 $6,150,803 $4,409,219 $4,861,778 $5,385,903 Other and Eliminations 101,908 122,984 56,438 36,389 53,527 Total $7,301,204 $6,273,787 $4,465,657 $4,898,167 $5,439,430
2013 2012 2011 2010 2009
The Connecticut Light and Power Company
Sales (GWh) Residential 10,314 9,978 10,092 10,196 9,848 Commercial 9,770 9,705 9,809 10,002 9,991 Industrial 2,320 2,426 2,414 2,467 2,427 Wholesale 851 1,155 1,592 3,040 3,434 Total 23,255 23,264 23,907 25,705 25,700
Revenues (Thousands) Residential $1,294,160 $1,263,845 $1,345,290 $1,597,754 $1,840,750 Commercial 780,585 732,620 758,145 853,956 958,224 Industrial 129,557 126,165 126,783 144,463 151,839 Wholesale 219,367 214,807 278,751 441,660 386,034 Miscellaneous 18,672 70,012 39,418 (38,731) 87,691 Total $2,442,341 $2,407,449 $2,548,387 $2,999,102 $3,424,538
* The 2012 results include the operations of NSTAR beginning April 10, 2012.
1.
Sales and Revenues
OPERATIONS i n f o r m a t i o n
2013 2012 2011 2010 2009
NSTAR Electric Company
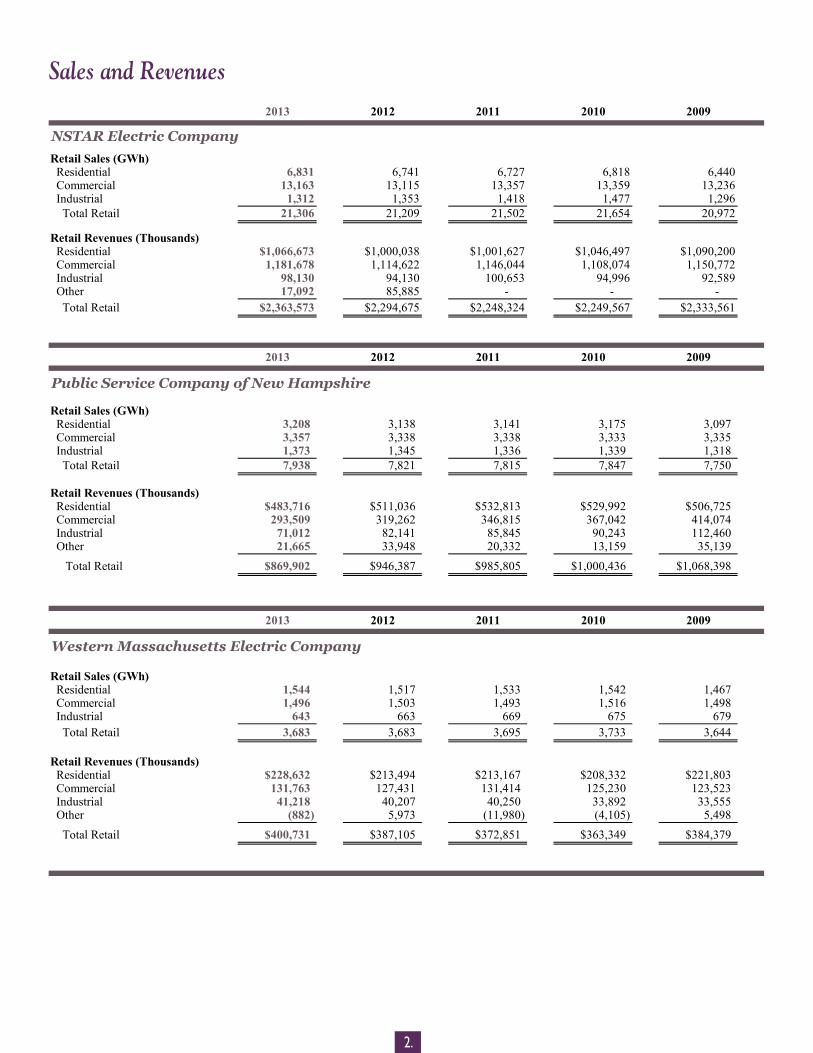
Retail Sales (GWh) Residential 6,831 6,741 6,727 6,818 6,440 Commercial 13,163 13,115 13,357 13,359 13,236 Industrial 1,312 1,353 1,418 1,477 1,296 Total Retail 21,306 21,209 21,502 21,654 20,972
Retail Revenues (Thousands) Residential $1,066,673 $1,000,038 $1,001,627 $1,046,497 $1,090,200 Commercial 1,181,678 1,114,622 1,146,044 1,108,074 1,150,772 Industrial 98,130 94,130 100,653 94,996 92,589 Other 17,092 85,885 - - - Total Retail $2,363,573 $2,294,675 $2,248,324 $2,249,567 $2,333,561
2013 2012 2011 2010 2009
Public Service Company of New Hampshire
Retail Sales (GWh) Residential 3,208 3,138 3,141 3,175 3,097 Commercial 3,357 3,338 3,338 3,333 3,335 Industrial 1,373 1,345 1,336 1,339 1,318 Total Retail 7,938 7,821 7,815 7,847 7,750
Retail Revenues (Thousands) Residential $483,716 $511,036 $532,813 $529,992 $506,725 Commercial 293,509 319,262 346,815 367,042 414,074 Industrial 71,012 82,141 85,845 90,243 112,460 Other 21,665 33,948 20,332 13,159 35,139 Total Retail $869,902 $946,387 $985,805 $1,000,436 $1,068,398
2013 2012 2011 2010 2009
Western Massachusetts Electric Company
Retail Sales (GWh) Residential 1,544 1,517 1,533 1,542 1,467 Commercial 1,496 1,503 1,493 1,516 1,498 Industrial 643 663 669 675 679 Total Retail 3,683 3,683 3,695 3,733 3,644
Retail Revenues (Thousands) Residential $228,632 $213,494 $213,167 $208,332 $221,803 Commercial 131,763 127,431 131,414 125,230 123,523 Industrial 41,218 40,207 40,250 33,892 33,555 Other (882) 5,973 (11,980) (4,105) 5,498 Total Retail $400,731 $387,105 $372,851 $363,349 $384,379
2.
Sales and Revenues
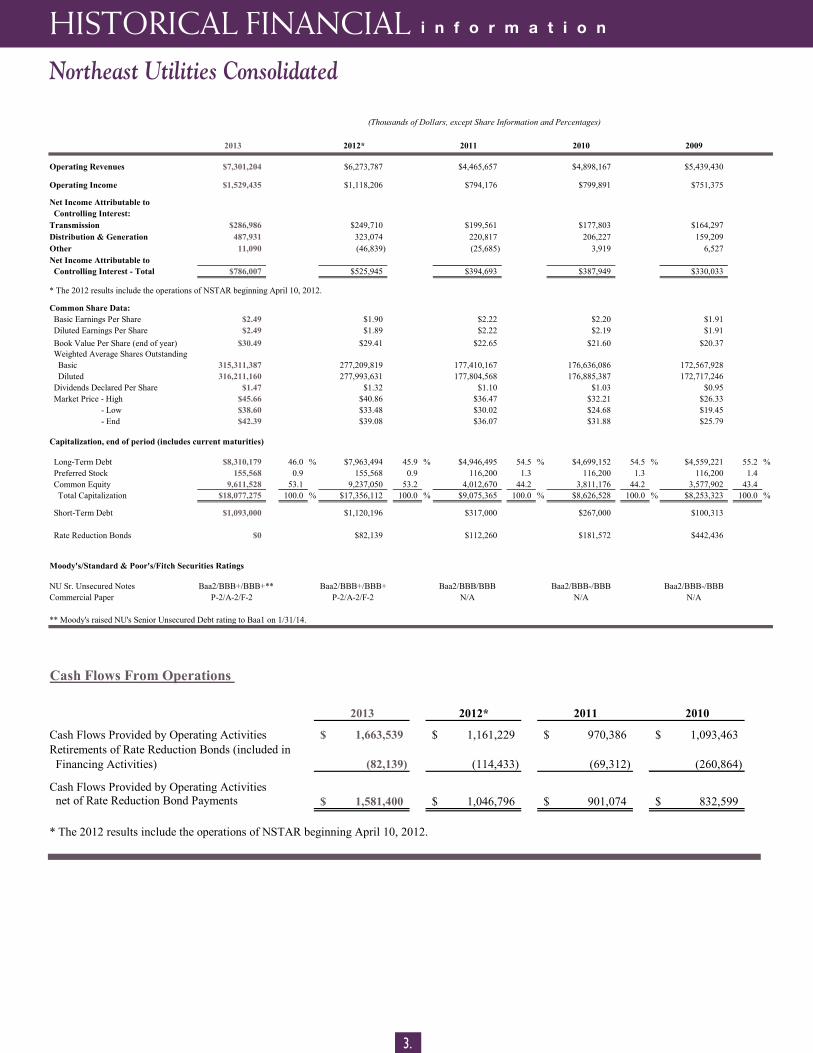
2013 2012* 2011 2010 2009
Operating Revenues $7,301,204 $6,273,787 $4,465,657 $4,898,167 $5,439,430
Operating Income $1,529,435 $1,118,206 $794,176 $799,891 $751,375
Net Income Attributable to Controlling Interest:Transmission $286,986 $249,710 $199,561 $177,803 $164,297Distribution & Generation 487,931 323,074 220,817 206,227 159,209Other 11,090 (46,839) (25,685) 3,919 6,527Net Income Attributable to Controlling Interest - Total $786,007 $525,945 $394,693 $387,949 $330,033
* The 2012 results include the operations of NSTAR beginning April 10, 2012.
Common Share Data: Basic Earnings Per Share $2.49 $1.90 $2.22 $2.20 $1.91 Diluted Earnings Per Share $2.49 $1.89 $2.22 $2.19 $1.91 Book Value Per Share (end of year) $30.49 $29.41 $22.65 $21.60 $20.37 Weighted Average Shares Outstanding Basic 315,311,387 277,209,819 177,410,167 176,636,086 172,567,928 Diluted 316,211,160 277,993,631 177,804,568 176,885,387 172,717,246 Dividends Declared Per Share $1.47 $1.32 $1.10 $1.03 $0.95 Market Price - High $45.66 $40.86 $36.47 $32.21 $26.33 - Low $38.60 $33.48 $30.02 $24.68 $19.45 - End $42.39 $39.08 $36.07 $31.88 $25.79 Capitalization, end of period (includes current maturities)
Long-Term Debt $8,310,179 46.0 % $7,963,494 45.9 % $4,946,495 54.5 % $4,699,152 54.5 % $4,559,221 55.2 % Preferred Stock 155,568 0.9 155,568 0.9 116,200 1.3 116,200 1.3 116,200 1.4 Common Equity 9,611,528 53.1 9,237,050 53.2 4,012,670 44.2 3,811,176 44.2 3,577,902 43.4 Total Capitalization $18,077,275 100.0 % $17,356,112 100.0 % $9,075,365 100.0 % $8,626,528 100.0 % $8,253,323 100.0 %
Short-Term Debt $1,093,000 $1,120,196 $317,000 $267,000 $100,313
Rate Reduction Bonds $0 $82,139 $112,260 $181,572 $442,436
Moody's/Standard & Poor's/Fitch Securities Ratings
NU Sr. Unsecured Notes Baa2/BBB/BBB Baa2/BBB-/BBB Baa2/BBB-/BBBCommercial Paper P-2/A-2/F-2 P-2/A-2/F-2 N/A N/A N/A
** Moody's raised NU's Senior Unsecured Debt rating to Baa1 on 1/31/14.
(Thousands of Dollars, except Share Information and Percentages)
Baa2/BBB+/BBB+** Baa2/BBB+/BBB+
3.
Northeast Utilities Consolidated
HISTORICAL FINANCIAL i n f o r m a t i o n
Cash Flows From Operations
2013 2012* 2011 2010
Cash Flows Provided by Operating Activities 1,663,539$ 1,161,229$ 970,386$ 1,093,463$ Retirements of Rate Reduction Bonds (included in Financing Activities) (82,139) (114,433) (69,312) (260,864)
Cash Flows Provided by Operating Activities net of Rate Reduction Bond Payments 1,581,400$ 1,046,796$ 901,074$ 832,599$
* The 2012 results include the operations of NSTAR beginning April 10, 2012.
4.
C O N N E C T I C U T
NEWMILFORD
SHER
MAN
WASHINGTON
KENT
SHARON
SALISBURY
NORTHCANAAN
CANAAN
CORNWALL GOSHEN
NORFOLK
WARRENLITCHFIELD
COLEBROOK
WINSTED
TORRINGTON
MORRIS
HARWINTON
NEWHARTFORD
BARK-HAMSTED
HART-LAND
GRANBY
CANTON
SIMSBURY
BRIDGE-WATER
ROXBURYWOODBURY
BETHLEHEMWATERTOWN
THOM-ASTON
PLYMOUTH
WOLCOTT
BRISTOL PLAIN-VILLE
SOUTHINGTON
NEWBRITAIN
MIDDLETOWN
BERLIN
MERIDENMIDDLE-
FIELD
CROMWELL
ROCKYHILL
NEW-INGTON
FARMINGTON
AVON
BURLINGTON
WESTHARTFORD
BLOOM-FIELD
WETHERS-FIELD
EASTHARTFORDHART-
FORD
SUFFIELD
EASTGRANBY WINDSOR
LOCKS
BEACONFALLS
WOOD-BRIDGE
SEYMOUR
NORTHHAVEN
HAMDEN
NORTHBRANFORD
ANSONIA
REDDINGRIDGEFIELD
DANBURY
BETHEL
NEWTOWN
MONROE
NEWFAIRFIELD
BROOK-FIELD
SOUTHBURY
GREENWICH
STAMFORD
NEWCANAAN
DARIEN
NORWALK
WILTON
WESTON
FAIRFIELD
BRIDGE-PORT
EASTON TRUMBULL
STRAT-FORD
SHELTON
MIDDLE-BURY
WATERBURY
NAUGATUCKWALLINGFORD
CHESHIRE
PROSPECT
OXFORD
MILFORD
ORANGE
NEW HAVEN
WEST-HAVEN
EAST
HAV
EN
BETHANY
BRANFORD
DURHAM
WESTPORT
DERBYMADISON
GUILFORD
EASTHADDAM
COLCHESTER
MARL-BOROUGH
HEBRON
CLINTONWEST-BROOK
OLDSAYBROOK
KILLING-WORTH
CHESTER
DEEPRIVER ESSEX
HADDAM
PORTLAND
LYME
OLDLYME
ANDOVER
SALEM
LEDYARD
EASTLYME
WATERFORDGROTON
LEBANON
PRESTON
COLUMBIAGLASTONBURY
EASTHAMPTON
MONTVILLE
STONINGTON
NORTHSTONINGTON
VOLU
NTOW
N
NORWICH
GRISWOLD
LISB
ON
STER
LING
SCOT-LAND
CANTERBURY
WINDHAMPLAINFIELD
FRANKLIN
BOZRAH
SPRAGUE
BOLTONMANCHESTER
SOMERS
ELLINGTON
VERNON
TOLLAND
COVENTRY
STAFFORD UNIONWOODSTOCK
WILLINGTON ASHFORD
EASTFORD
POMFRET
KILLINGLY
MANSFIELD CHAPLINBROOKLYN
HAMPTON
THOMPSON
PUTNAM
ENFIELD
WINDSOR
SOUTHWINDSOR
EASTWINDSOR
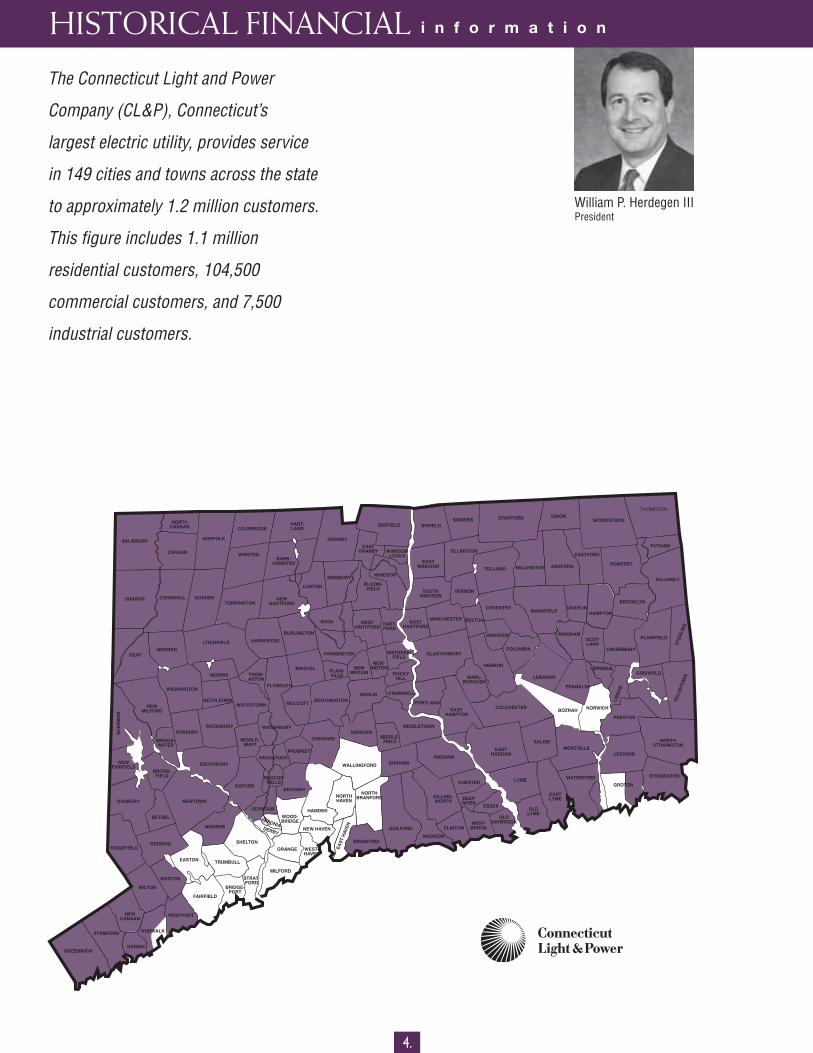
The Connecticut Light and Power
Company (CL&P), Connecticut’s
largest electric utility, provides service
in 149 cities and towns across the state
to approximately 1.2 million customers.
This figure includes 1.1 million
residential customers, 104,500
commercial customers, and 7,500
industrial customers.
William P. Herdegen IIIPresident
HISTORICAL FINANCIAL i n f o r m a t i o n
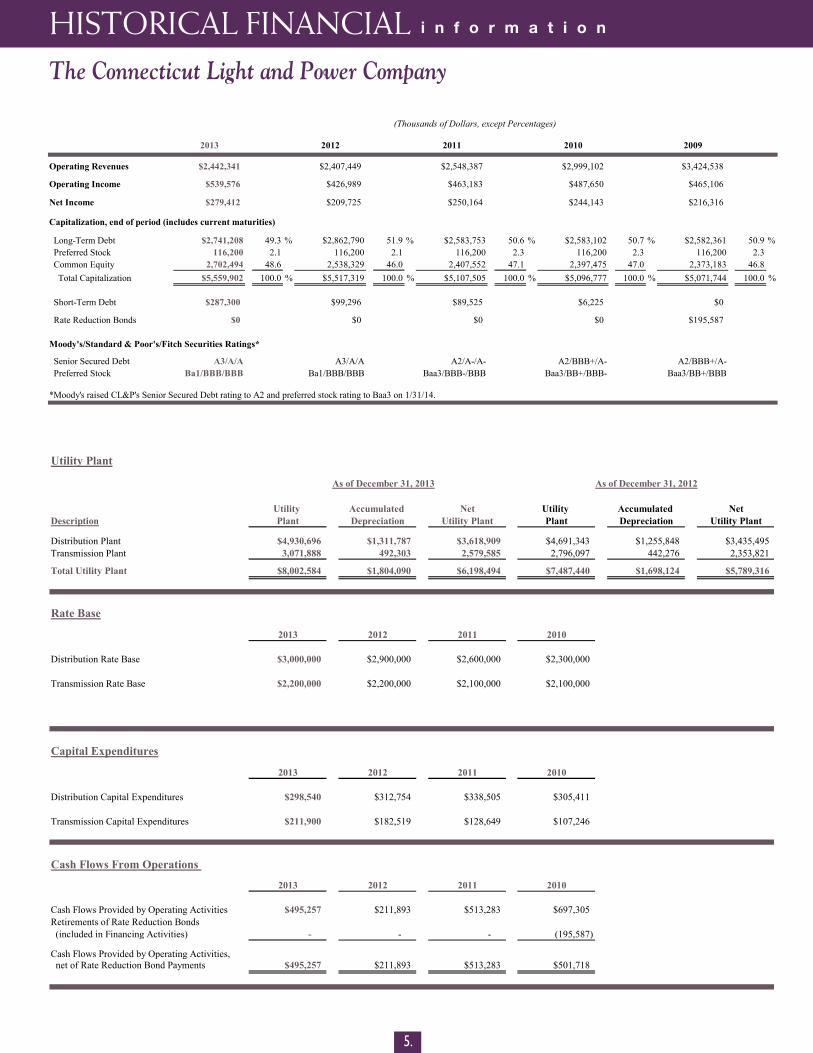
2013 2012 2011 2010 2009
Operating Revenues $2,442,341 $2,407,449 $2,548,387 $2,999,102 $3,424,538
Operating Income $539,576 $426,989 $463,183 $487,650 $465,106
Net Income $279,412 $209,725 $250,164 $244,143 $216,316
Capitalization, end of period (includes current maturities)
Long-Term Debt $2,741,208 49.3 % $2,862,790 51.9 % $2,583,753 50.6 % $2,583,102 50.7 % $2,582,361 50.9 % Preferred Stock 116,200 2.1 116,200 2.1 116,200 2.3 116,200 2.3 116,200 2.3 Common Equity 2,702,494 48.6 2,538,329 46.0 2,407,552 47.1 2,397,475 47.0 2,373,183 46.8 Total Capitalization $5,559,902 100.0 % $5,517,319 100.0 % $5,107,505 100.0 % $5,096,777 100.0 % $5,071,744 100.0 %
Short-Term Debt $287,300 $99,296 $89,525 $6,225 $0
Rate Reduction Bonds $0 $0 $0 $0 $195,587
Moody's/Standard & Poor's/Fitch Securities Ratings*
Senior Secured Debt A3/A/A A3/A/A A2/A-/A- A2/BBB+/A- A2/BBB+/A- Preferred Stock Ba1/BBB/BBB Ba1/BBB/BBB Baa3/BBB-/BBB Baa3/BB+/BBB- Baa3/BB+/BBB
*Moody's raised CL&P's Senior Secured Debt rating to A2 and preferred stock rating to Baa3 on 1/31/14.
(Thousands of Dollars, except Percentages)
The Connecticut Light and Power Company
5.
Utility Plant
As of December 31, 2013 As of December 31, 2012
Utility Accumulated Net Utility Accumulated NetDescription Plant Depreciation Utility Plant Plant Depreciation Utility Plant
Distribution Plant $4,930,696 $1,311,787 $3,618,909 $4,691,343 $1,255,848 $3,435,495Transmission Plant 3,071,888 492,303 2,579,585 2,796,097 442,276 2,353,821
Total Utility Plant $8,002,584 $1,804,090 $6,198,494 $7,487,440 $1,698,124 $5,789,316
Rate Base
2013 2012 2011 2010
Distribution Rate Base $3,000,000 $2,900,000 $2,600,000 $2,300,000
Transmission Rate Base $2,200,000 $2,200,000 $2,100,000 $2,100,000
Capital Expenditures
2013 2012 2011 2010
Distribution Capital Expenditures $298,540 $312,754 $338,505 $305,411
Transmission Capital Expenditures $211,900 $182,519 $128,649 $107,246
Cash Flows From Operations
2013 2012 2011 2010
Cash Flows Provided by Operating Activities $495,257 $211,893 $513,283 $697,305Retirements of Rate Reduction Bonds (included in Financing Activities) - - - (195,587)
Cash Flows Provided by Operating Activities, net of Rate Reduction Bond Payments $495,257 $211,893 $513,283 $501,718
HISTORICAL FINANCIAL i n f o r m a t i o n
6.
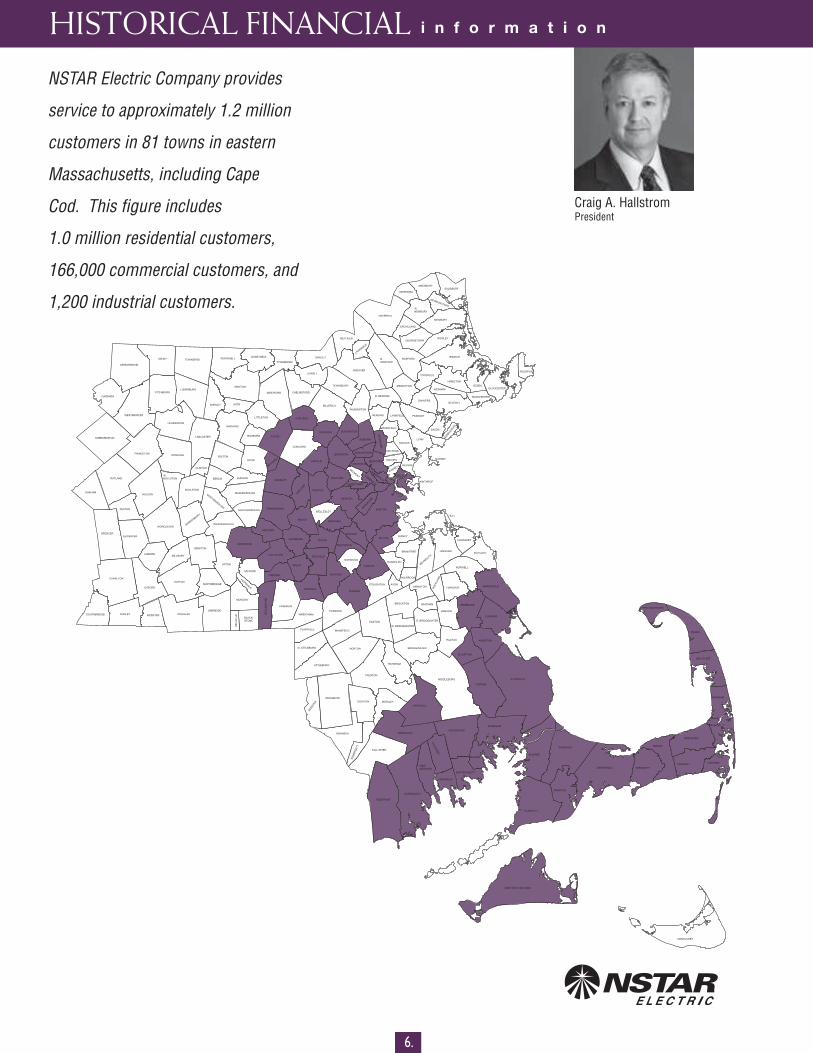
NSTAR Electric Company provides
service to approximately 1.2 million
customers in 81 towns in eastern
Massachusetts, including Cape
Cod. This figure includes
1.0 million residential customers,
166,000 commercial customers, and
1,200 industrial customers.
Craig A. HallstromPresident
HISTORICAL FINANCIAL i n f o r m a t i o n
MARSHFIELD
PEMBROKE
DUXBURY
KINGSTON
PLYMPTON
CARVER
PLYMOUTH
WAREHAM
MATTAPOISETT
WESTPORT
BOURNE
SANDWICH
FALMOUTH
MASHPEE
MARTHA’S VINEYARD
NANTUCKET
BARNSTABLE YARMOUTH
DENNIS
BREWSTER
HARWICH CHATHAM
ORLEANS
EASTHAM
WELLFLEET
TRURO
PROVINCETOWN
MARION
ROCHESTER
LAKEVILLE
FREETOWN
ACUSHNET
FAIRHAVEN
NEWBEDFORD
DARTMOUTH
BOSTON
HOPKINTON
ASHLAND
NATICK
FRAMINGHAM
MAYNARD
WAY
LAND
WESTON
LINCOLN
ACTON
CARLISLE
BEDFORD BURLINGTON
LEXINGTON
WALTHAM
WOBURN
ARLINGTON
STON
EHAM
DEDHAM
WESTWOOD
NEEDHAM
BROOKLINE
SOMERVILLE
CAMBRIDGEWATERTOWN
NEWTON
MILTON
SHARON
WALPOLE
NORFOLK
MILLIS
MEDWAY
BE
LLIN
GH
AM
MEDFIELDHOLLISTON
SHERBORN DOVER
CANTON
SUDBURY
STOWBOLTON
BERLIN
NORTHBOROUGH
BOYLSTON
SHREWSBURY
W.BOYLSTON
HOLDEN
PAXTON
LEICESTER
AUBURN
MIL
LVIL
LE
WORCESTER
MILLBURY
SUTTON
HUDSON
MARLBOROUGH
SOUTHBOROUGH
WESTBOROUGH
UPTON
MILFORD
HOPEDALE
MENDON
UXBRIDGE
NORTHBRIDGE
GRAFTON
CHELSEA
WINCHESTER
BOXBORO
LITTLETON
GROTON
DANVERS
MIDDLEBORO
BERKLEY
RAYNHAM
TAUNTON
MANSFIELD
N. ATTLEBORO
HINGHAMBRAINTREE
QUINCY
HOLBROOK
NORWOOD
WELLESLEY
CONCORD
RANDOLPHWEYMOUTH
HULL
READING
WILMINGTON
N. READING
WAKEFIELD
PEABODYLYNNFIELD
MIDDLETON
IPSWICH
ROWLEYGEORGETOWN
GROVELAND
MERRIMAC
MARBLEHEAD
STERLING
ASHBY TOWNSEND
FITCHBURGLUNENBURG
SEEK
ONK
REHOBOTH
ATTLEBORO
NORTON
PLAINVILLE
WRENTHAMFOXBORO
FRANKLIN
BLACK-STONE
DOUGLASWEBSTER
OXFORD
CLINTON
LANCASTER
LEOMINSTER
PEPPERELL
SHIRLEY AYER
HARVARD
WESTFORD
DUNSTABLE
TYNGSBORO
CHELMSFORD
BILLERICA
LOWELL
DRACUT
TEWKSBURY
ANDOVER
METHUEN
LAWRENCE
N.ANDOVER
BOXFORD
HAVERHILL
AMESBURY SALISBURY
NEWBURYPORTW.NEWBURY
NEWBURY
TOPSFIELD
HAMILTON
BEVERLY
ESSEX
MANCHESTER
GLOUCESTER
ROCKPORT
SALEM
LYNNSAUGUS
MELROSE
MALDEN
BELMONT
EVERETT
MEDFORDNAHANT
REVERE
WINTHROP
FALL RIVER
SWANSEA
DIGHTON
SOM
ERSE
TT
BRIDGEWATER
W. BRIDGEWATER
EASTON
STOUGHTON AVON
BROCKTON
ABINGTON
WHITMAN
E. BRIDGEWATER
HALIFAX
HANSON
HANOVER
NORWELL
SCITUATE
COHASSET
ROCK
LAND
PRINCETON
HUBBARDSTON
WESTMINSTER
GARDNER
SPENCER
CHARLTON
DUDLEY
RUTLAND
OAKHAM
SOUTHBRIDGE
ASHBURNHAM
WENHAM
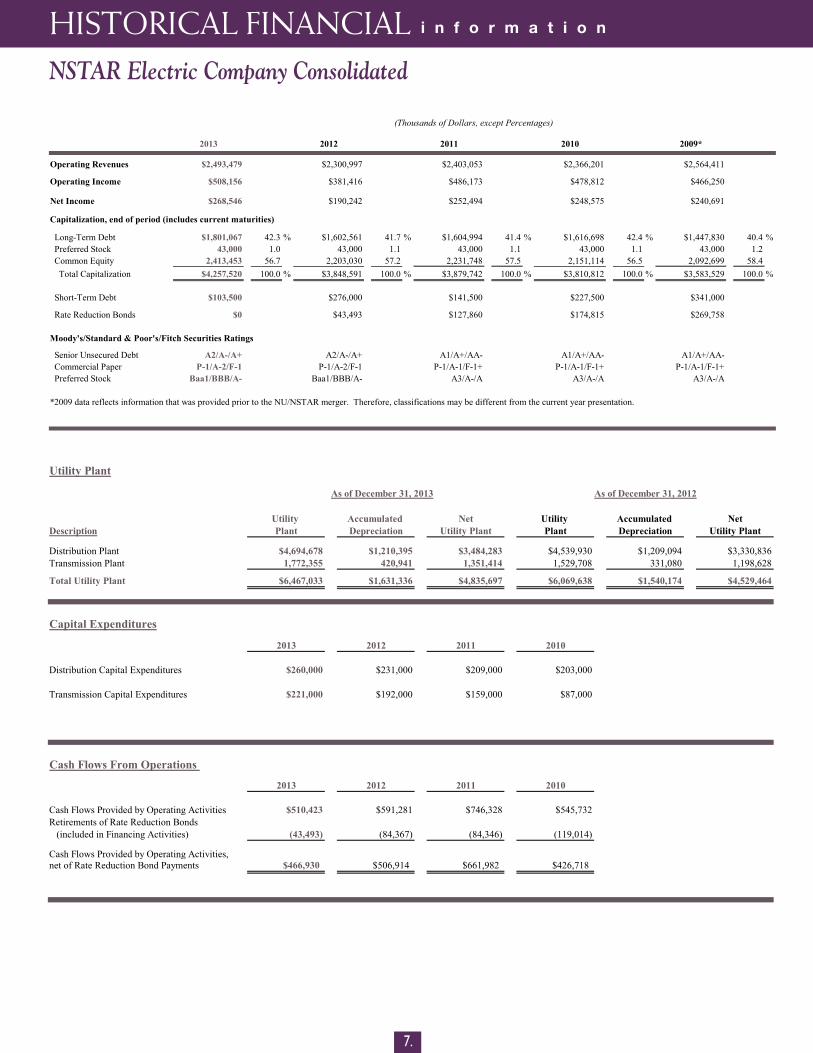
2013 2012 2011 2010 2009*
Operating Revenues $2,493,479 $2,300,997 $2,403,053 $2,366,201 $2,564,411
Operating Income $508,156 $381,416 $486,173 $478,812 $466,250
Net Income $268,546 $190,242 $252,494 $248,575 $240,691
Capitalization, end of period (includes current maturities)
Long-Term Debt $1,801,067 42.3 % $1,602,561 41.7 % $1,604,994 41.4 % $1,616,698 42.4 % $1,447,830 40.4 % Preferred Stock 43,000 1.0 43,000 1.1 43,000 1.1 43,000 1.1 43,000 1.2 Common Equity 2,413,453 56.7 2,203,030 57.2 2,231,748 57.5 2,151,114 56.5 2,092,699 58.4 Total Capitalization $4,257,520 100.0 % $3,848,591 100.0 % $3,879,742 100.0 % $3,810,812 100.0 % $3,583,529 100.0 %
Short-Term Debt $103,500 $276,000 $141,500 $227,500 $341,000
Rate Reduction Bonds $0 $43,493 $127,860 $174,815 $269,758
Moody's/Standard & Poor's/Fitch Securities Ratings
Senior Unsecured Debt A2/A-/A+ A2/A-/A+ A1/A+/AA- A1/A+/AA- A1/A+/AA- Commercial Paper P-1/A-2/F-1 P-1/A-2/F-1 P-1/A-1/F-1+ P-1/A-1/F-1+ P-1/A-1/F-1+ Preferred Stock Baa1/BBB/A- Baa1/BBB/A- A3/A-/A A3/A-/A A3/A-/A
*2009 data reflects information that was provided prior to the NU/NSTAR merger. Therefore, classifications may be different from the current year presentation.
(Thousands of Dollars, except Percentages)
NSTAR Electric Company Consolidated
7.
Utility Plant
As of December 31, 2013 As of December 31, 2012
Utility Accumulated Net Utility Accumulated NetDescription Plant Depreciation Utility Plant Plant Depreciation Utility Plant
Distribution Plant $4,694,678 $1,210,395 $3,484,283 $4,539,930 $1,209,094 $3,330,836Transmission Plant 1,772,355 420,941 1,351,414 1,529,708 331,080 1,198,628
Total Utility Plant $6,467,033 $1,631,336 $4,835,697 $6,069,638 $1,540,174 $4,529,464
Capital Expenditures
2013 2012 2011 2010
Distribution Capital Expenditures $260,000 $231,000 $209,000 $203,000
Transmission Capital Expenditures $221,000 $192,000 $159,000 $87,000
Cash Flows From Operations
2013 2012 2011 2010
Cash Flows Provided by Operating Activities $510,423 $591,281 $746,328 $545,732Retirements of Rate Reduction Bonds (included in Financing Activities) (43,493) (84,367) (84,346) (119,014)
Cash Flows Provided by Operating Activities, net of Rate Reduction Bond Payments $466,930 $506,914 $661,982 $426,718
HISTORICAL FINANCIAL i n f o r m a t i o n
8.
MOUNT
WASHINGTON
EGREMONT
SANDISFIELD
TOLLAND
ALFORD
STOCKBRIDGE
MONTEREY
TYRINGHAM
OTIS
GRANVILLE
RUSSELL
BLANDFORD
BECKET
WASHINGTON
E
MIDDLEFIELDLENOX
RICHMOND
NEW MARLBORO
SHEFFIELD
WES
TST
OCKB
RIDG
E
MONTGOMERY
GREAT BARRINGTON
CHESTER
PITTSFIELD
HINSDALE
DALT
ON
PERUWORTHINGTON
CUMMINGTON
CONWAY
WHATELYGOSHEN
WILLIAMSBURG
NORTHAMPTON
EASTHAMPTON
WES
THAM
PTON
SOUTHAMPTON
DEERFIELD
CHESTERFIELD
HUNT
INGT
ON
HANC
OCK
LANESBORO
WILLIAMSTOWN
CHESHIRE
ADAMS
NORTH ADAMS
CLARKSBURG MONROE
FLORIDA
WINDSOR
HAWLEY
CHARLEMONT
ROWE HEATH
BUCKLAND
ASHFIELD
COLRAIN
SHELBURNESAVOYNEW
ASHFORD
PLAINFIELD
WESTFIELD
LEYDEN
BERNARDSTON
AMHERSTHADLEY
HATFIELD
HOLY
OKE
SOUTHAMPTON SOUT
H HA
DLEY
CHICOPEE
GRANBY
GILLNORTHFIELD
MONTAGUE
LEVERETT
GREENFIE
LDSU
NDER
LAND
PELHAM
LUDLOW
BELCHERTOWN
PALMER
NEW SALEM
ORANGE
SHUTESBURY
WENDELL
ERVING
WARWICK
SOUTHWICK AG LONG-MEADOW
SPRINGFIELD
EASTLONG-MEADOW HAMPDEN
MONSON
WESTSPRING-
FIELDWILBRAHAMSPRINGFIELD
WARELEE
AWAM
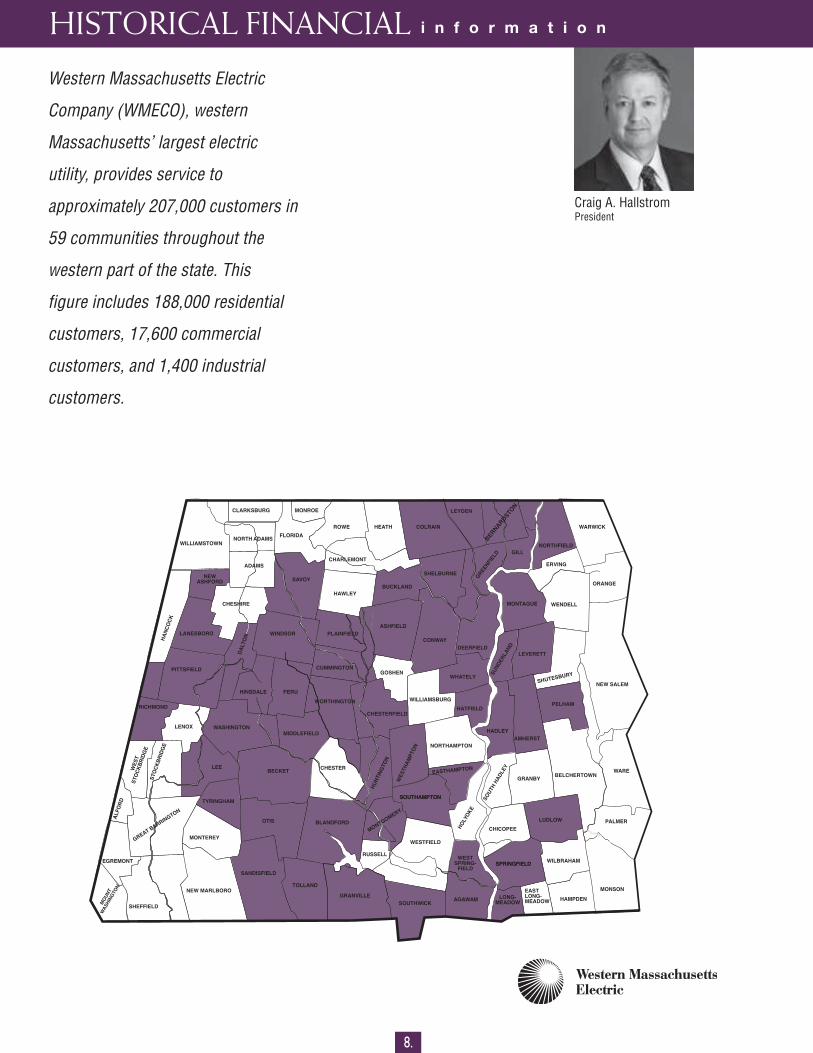
Western Massachusetts Electric
Company (WMECO), western
Massachusetts’ largest electric
utility, provides service to
approximately 207,000 customers in
59 communities throughout the
western part of the state. This
figure includes 188,000 residential
customers, 17,600 commercial
customers, and 1,400 industrial
customers.
Craig A. HallstromPresident
HISTORICAL FINANCIAL i n f o r m a t i o n
9.
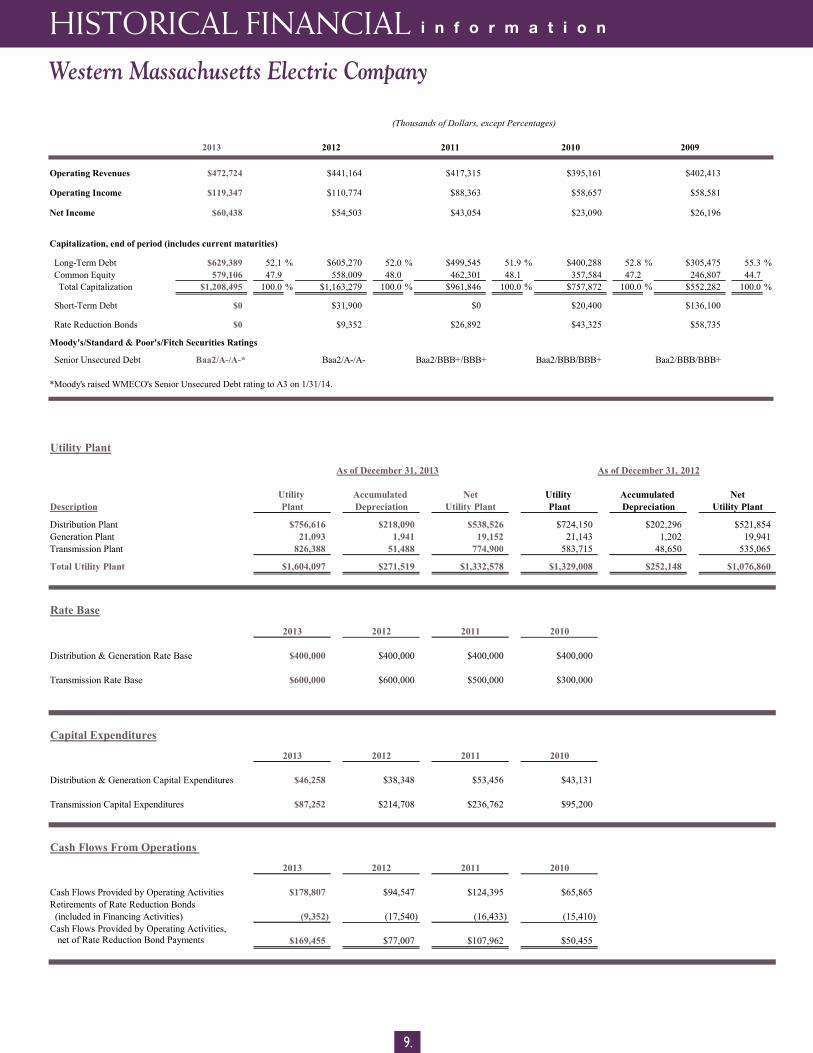
Western Massachusetts Electric Company
2013 2012 2011 2010 2009
Operating Revenues $472,724 $441,164 $417,315 $395,161 $402,413
Operating Income $119,347 $110,774 $88,363 $58,657 $58,581
Net Income $60,438 $54,503 $43,054 $23,090 $26,196
Capitalization, end of period (includes current maturities)
Long-Term Debt $629,389 52.1 % $605,270 52.0 % $499,545 51.9 % $400,288 52.8 % $305,475 55.3 % Common Equity 579,106 47.9 558,009 48.0 462,301 48.1 357,584 47.2 246,807 44.7 Total Capitalization $1,208,495 100.0 % $1,163,279 100.0 % $961,846 100.0 % $757,872 100.0 % $552,282 100.0 %
Short-Term Debt $0 $31,900 $0 $20,400 $136,100
Rate Reduction Bonds $0 $9,352 $26,892 $43,325 $58,735
Moody's/Standard & Poor's/Fitch Securities Ratings
Senior Unsecured Debt Baa2/A-/A-* Baa2/A-/A- Baa2/BBB+/BBB+ Baa2/BBB/BBB+ Baa2/BBB/BBB+
*Moody's raised WMECO's Senior Unsecured Debt rating to A3 on 1/31/14.
(Thousands of Dollars, except Percentages)
Utility Plant
As of December 31, 2013 As of December 31, 2012
Utility Accumulated Net Utility Accumulated NetDescription Plant Depreciation Utility Plant Plant Depreciation Utility Plant
Distribution Plant $756,616 $218,090 $538,526 $724,150 $202,296 $521,854Generation Plant 21,093 1,941 19,152 21,143 1,202 19,941 Transmission Plant 826,388 51,488 774,900 583,715 48,650 535,065
Total Utility Plant $1,604,097 $271,519 $1,332,578 $1,329,008 $252,148 $1,076,860
Rate Base
2013 2012 2011 2010
Distribution & Generation Rate Base $400,000 $400,000 $400,000 $400,000
Transmission Rate Base $600,000 $600,000 $500,000 $300,000
Capital Expenditures
2013 2012 2011 2010
Distribution & Generation Capital Expenditures $46,258 $38,348 $53,456 $43,131
Transmission Capital Expenditures $87,252 $214,708 $236,762 $95,200
Cash Flows From Operations
2013 2012 2011 2010
Cash Flows Provided by Operating Activities $178,807 $94,547 $124,395 $65,865Retirements of Rate Reduction Bonds (included in Financing Activities) (9,352) (17,540) (16,433) (15,410) Cash Flows Provided by Operating Activities, net of Rate Reduction Bond Payments $169,455 $77,007 $107,962 $50,455
HISTORICAL FINANCIAL i n f o r m a t i o n
10.
DIXVILLE
STEWARTSTOWN
COLEBROOK
COLUMBIAERVING'S
LOCATION
STRA
WENTWORTH'SLOCATION
ERROLMILLSFIELD
CLARKSVILLE
SECONDCOLLEGEGRANT
GILMANTON& ATKINSON
ACADEMY GRANT
ODELL
DIX'SGRANT
DUMMER
STARK
WATERVILLE ALBANY
HALE'SLOCATION
BARTLETT
HADLEY'SPURCHASE
CHATHAM
JACKSON
LINCOLN
LIVERMORE
STFORESTREG'N
THORNTON
FRANCONIA
WOODSTOCK CONWAY
TAMWORTH
CAMPTON
ELLSWORTH
RUMNEY
EASTON
BETHLEHEMCRAWFORD'S
PURCHASE
BENTON
HAVERHILL
LANDAFF
PIERMONT
WARREN
WENTWORTH
OXFORD
LYME
DORCHESTER
BERLINLANCASTER
GORHAMRANDOLPHJEFFERSON
WHITEFIELDDALTON
MONROE
BATH
LYMANLISBON SUGAR
HILL
LITTLETON
SANDWICH
EATON
SHELBURNE
BEAN'SPURCHASE
SUCCESSKILKENNY
MEREDITHNEW
HAMPTON
PLYMOUTHHOLDERNESS
ASHLAND
ALEXANDRIA
GRAFTON
ORANGE
ENFIELD
LEBANON
CANAAN
GROTONHANOVER
DANBURY
BRISTOL
BRIDGEWA
GILMANTON
TILANDOVER
NEW LONDON
CORNISHCROYDON
SUTTON
FRANKLIN
GILFORDPLAINFIELD
SUNAPEE
SPRINGFIELD
HILL
WINDSOR
ANTRIM
STODDARD
LEMSTER
WASHINGTON
BRADFORD
WARNER
HENNIKER
HOPKINTON
WEAREDEE"INGDUMBARTON
SALISBURY
WEBSTERNEWBURY
NEWPORT
UNITYGOSHEN
CONCORD CHICESTER
ALLENSTOWN
PEMBROKE
EPSOM
LOUDON
CANTERBURY
BOSCA
HILLSBOROUGH
BARNSTEADARMINGTON
ALTON
BROOKFIELD
CHARLES-TOWN
MARLOW
ACWORTH
GILSUM
SULLIVNELSON
ALSTEAD
LANGDON
WALPOLE
SURRY BENN-INGTON
NORTHFIELD
CANDIA
LACONIA
ATKINSON
NEWTON
TON INGTON
LITCH-FIELD
MERRIMACK
H U D S O N
LONDON-DERRY
NASHUA
HOLLIS
WINDHAM
VILLE
HEMP-STEADDERRY
AMHERST
BEDFORDDAN-
PELHAM
KINGSTON
EASTKINGS- KENS-
SALEM
BRENTWOODFREMONT
CHESTEREXETER NORTH
GREEN-LAND
NEWFIELDSEPPINGRAYMOND
AUBURNMANCHESTER HAMPTON
RYE
MOUTH
THAM
HAMPTON
PORTS-
PLAIS-TOW
HAMPTON
SEA-BROOK
SANDOWN
SOUTH
NEWMARKE
DURHAM
FRANCES-TOWN
PETER-BOROUGH
HANCOCK
DUBLIN
HARRISVILLE
MARLBOROUGH
ROXBURY
SWANZEY
KEENEWESTMORELAND
CHESTERFIELD BOROUGH
RICHMOND
TROY
FITZWILLIAM
JAFFNEY
RINDGE
WINCHESTER
IPSWICHVILLE
SHARON
MASON
HINSDALE
AN
GREENFIELD
L
GREEN-
YNDE-
NEW
TEMPLEWILTON
BROOK-LINE
MILFORD
MOUNTVERNON
NEW BOSTON
BOW
HOOKSETT
GOFFSTOWN
MADBURY
BARRINGTONNORTHWOOD
LEENOTTINGHAMDEERFIELD
ROCHESTERSTRAPITTSFIELD
WEN
NEW-INGTON
HAMPTONFALLS
STRA
TFORD
DOVER
DURHAM MIL
F
SOMERS-WORTH
ROLLINS-FORD
TONWILMOT
SANBORNTONGRANTHAM
NEWTON
WOLFEBORO WAKE-FIELD
MIDDLETON
LIVERMORE
HART'SLOCA
TER
TONBOROGH
OSSIPEE
FREEDOM
EFFINGHAM
TION
TUFTON-BORO
MOUL
MILAN
CAMBRIDGE
NORTH-UMBERLAND
CARROLL
TFORD
THOMPSON& MESERVE'S
PURCHASE
MARTIN'SLOCATIONGREEN'SGRANT
BEAN'SGRANTTEA
LOW & BURBANK'SGRANT
CUTT'SGRANT
SARGENT'SPURCHASE
T
MADISON
CLAREMONT
PITTSBURG
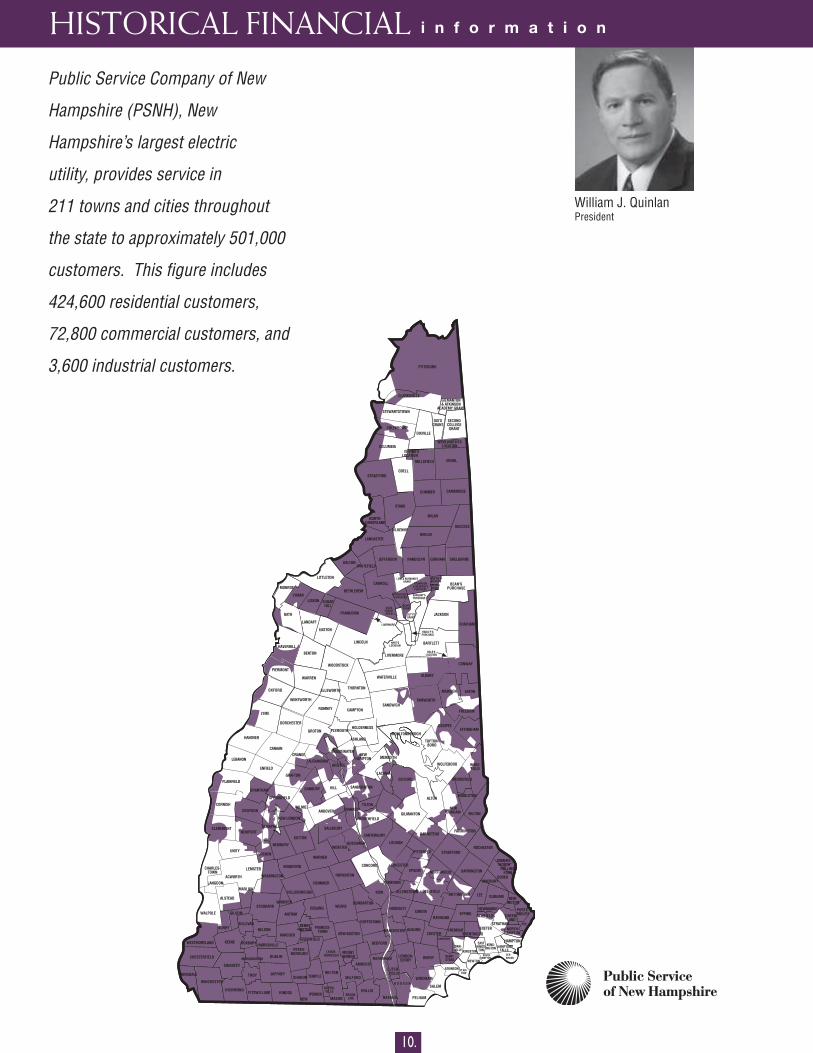
Public Service Company of New
Hampshire (PSNH), New
Hampshire’s largest electric
utility, provides service in
211 towns and cities throughout
the state to approximately 501,000
customers. This figure includes
424,600 residential customers,
72,800 commercial customers, and
3,600 industrial customers.
William J. QuinlanPresident
HISTORICAL FINANCIAL i n f o r m a t i o n
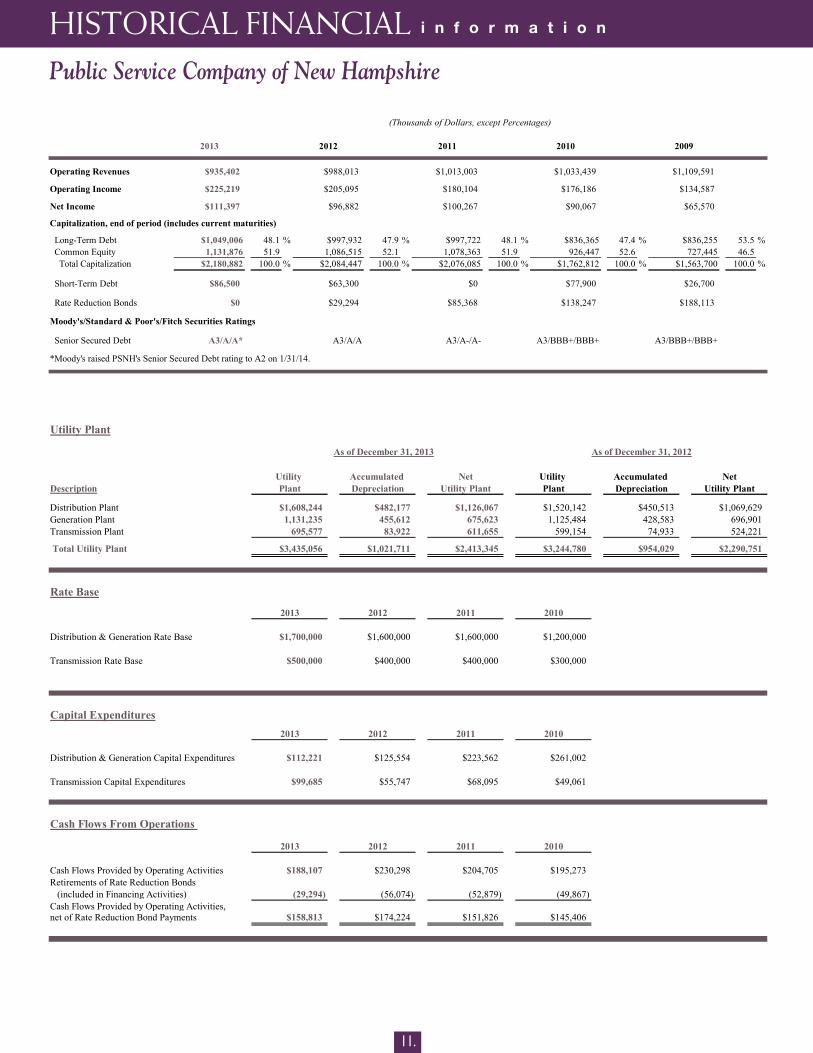
2013 2012 2011 2010 2009
Operating Revenues $935,402 $988,013 $1,013,003 $1,033,439 $1,109,591
Operating Income $225,219 $205,095 $180,104 $176,186 $134,587
Net Income $111,397 $96,882 $100,267 $90,067 $65,570
Capitalization, end of period (includes current maturities)
Long-Term Debt $1,049,006 48.1 % $997,932 47.9 % $997,722 48.1 % $836,365 47.4 % $836,255 53.5 % Common Equity 1,131,876 51.9 1,086,515 52.1 1,078,363 51.9 926,447 52.6 727,445 46.5 Total Capitalization $2,180,882 100.0 % $2,084,447 100.0 % $2,076,085 100.0 % $1,762,812 100.0 % $1,563,700 100.0 %
Short-Term Debt $86,500 $63,300 $0 $77,900 $26,700
Rate Reduction Bonds $0 $29,294 $85,368 $138,247 $188,113
Moody's/Standard & Poor's/Fitch Securities Ratings
Senior Secured Debt A3/A/A* A3/A/A A3/A-/A- A3/BBB+/BBB+ A3/BBB+/BBB+
*Moody's raised PSNH's Senior Secured Debt rating to A2 on 1/31/14.
(Thousands of Dollars, except Percentages)
Public Service Company of New Hampshire
11.
Utility Plant
As of December 31, 2013 As of December 31, 2012
Utility Accumulated Net Utility Accumulated NetDescription Plant Depreciation Utility Plant Plant Depreciation Utility Plant
Distribution Plant $1,608,244 $482,177 $1,126,067 $1,520,142 $450,513 $1,069,629Generation Plant 1,131,235 455,612 675,623 1,125,484 428,583 696,901Transmission Plant 695,577 83,922 611,655 599,154 74,933 524,221
Total Utility Plant $3,435,056 $1,021,711 $2,413,345 $3,244,780 $954,029 $2,290,751
Rate Base
2013 2012 2011 2010
Distribution & Generation Rate Base $1,700,000 $1,600,000 $1,600,000 $1,200,000
Transmission Rate Base $500,000 $400,000 $400,000 $300,000
Capital Expenditures2013 2012 2011 2010
Distribution & Generation Capital Expenditures $112,221 $125,554 $223,562 $261,002
Transmission Capital Expenditures $99,685 $55,747 $68,095 $49,061
Cash Flows From Operations
2013 2012 2011 2010
Cash Flows Provided by Operating Activities $188,107 $230,298 $204,705 $195,273Retirements of Rate Reduction Bonds (included in Financing Activities) (29,294) (56,074) (52,879) (49,867) Cash Flows Provided by Operating Activities, net of Rate Reduction Bond Payments $158,813 $174,224 $151,826 $145,406
HISTORICAL FINANCIAL i n f o r m a t i o n
12.
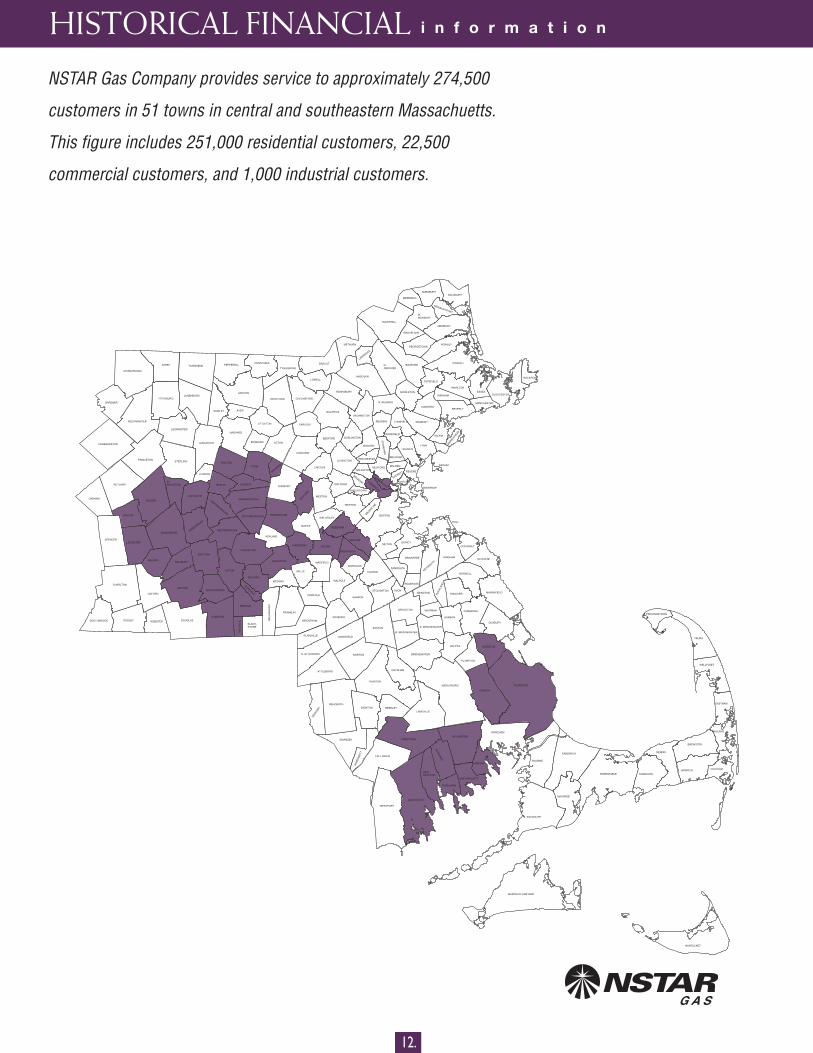
NSTAR Gas Company provides service to approximately 274,500
customers in 51 towns in central and southeastern Massachuetts.
This figure includes 251,000 residential customers, 22,500
commercial customers, and 1,000 industrial customers.
HISTORICAL FINANCIAL i n f o r m a t i o n
MARSHFIELD
PEMBROKE
DUXBURY
KINGSTON
PLYMPTON
CARVER
PLYMOUTH
WAREHAM
MATTAPOISETT
WESTPORT
BOURNE
SANDWICH
FALMOUTH
MASHPEE
MARTHA’S VINEYARD
NANTUCKET
BARNSTABLE YARMOUTH
DENNIS
BREWSTER
HARWICH CHATHAM
ORLEANS
EASTHAM
WELLFLEET
TRURO
PROVINCETOWN
MARION
ROCHESTER
LAKEVILLE
FREETOWN
ACUSHNET
FAIRHAVEN
NEWBEDFORD
DARTMOUTH
BOSTON
HOPKINTON
ASHLAND
NATICK
FRAMINGHAM
MAYNARD
WAY
LAND
WESTON
LINCOLN
ACTON
CARLISLE
BEDFORD BURLINGTON
LEXINGTON
WALTHAM
WOBURN
ARLINGTON
STON
EHAM
DEDHAM
WESTWOOD
NEEDHAM
BROOKLINE
SOMERVILLE
CAMBRIDGEWATERTOWN
NEWTON
MILTON
SHARON
WALPOLE
NORFOLK
MILLIS
MEDWAY
BE
LLIN
GH
AM
MEDFIELDHOLLISTON
SHERBORN DOVER
CANTON
SUDBURY
STOWBOLTON
BERLIN
NORTHBOROUGH
BOYLSTON
SHREWSBURY
W.BOYLSTON
HOLDEN
PAXTON
LEICESTER
AUBURN
MIL
LVIL
LE
WORCESTER
MILLBURY
SUTTON
HUDSON
MARLBOROUGH
SOUTHBOROUGH
WESTBOROUGH
UPTON
MILFORD
HOPEDALE
MENDON
UXBRIDGE
NORTHBRIDGE
GRAFTON
CHELSEA
WINCHESTER
BOXBORO
LITTLETON
GROTON
DANVERS
MIDDLEBORO
BERKLEY
RAYNHAM
TAUNTON
MANSFIELD
N. ATTLEBORO
HINGHAMBRAINTREE
QUINCY
HOLBROOK
NORWOOD
WELLESLEY
CONCORD
RANDOLPHWEYMOUTH
HULL
READING
WILMINGTON
N. READING
WAKEFIELD
PEABODYLYNNFIELD
MIDDLETON
IPSWICH
ROWLEYGEORGETOWN
GROVELAND
MERRIMAC
MARBLEHEAD
STERLING
ASHBY TOWNSEND
FITCHBURGLUNENBURG
SEEK
ONK
REHOBOTH
ATTLEBORO
NORTON
PLAINVILLE
WRENTHAMFOXBORO
FRANKLIN
BLACK-STONE
DOUGLASWEBSTER
OXFORD
CLINTON
LANCASTER
LEOMINSTER
PEPPERELL
SHIRLEY AYER
HARVARD
WESTFORD
DUNSTABLE
TYNGSBORO
CHELMSFORD
BILLERICA
LOWELL
DRACUT
TEWKSBURY
ANDOVER
METHUEN
LAWRENCE
N.ANDOVER
BOXFORD
HAVERHILL
AMESBURY SALISBURY
NEWBURYPORTW.NEWBURY
NEWBURY
TOPSFIELD
HAMILTON
BEVERLY
ESSEX
MANCHESTER
GLOUCESTER
ROCKPORT
SALEM
LYNNSAUGUS
MELROSE
MALDEN
BELMONT
EVERETT
MEDFORDNAHANT
REVERE
WINTHROP
FALL RIVER
SWANSEA
DIGHTON
SOM
ERSE
TT
BRIDGEWATER
W. BRIDGEWATER
EASTON
STOUGHTON AVON
BROCKTON
ABINGTON
WHITMAN
E. BRIDGEWATER
HALIFAX
HANSON
HANOVER
NORWELL
SCITUATE
COHASSET
ROCK
LAND
PRINCETON
HUBBARDSTON
WESTMINSTER
GARDNER
SPENCER
CHARLTON
DUDLEY
RUTLAND
OAKHAM
SOUTHBRIDGE
ASHBURNHAM
WENHAM
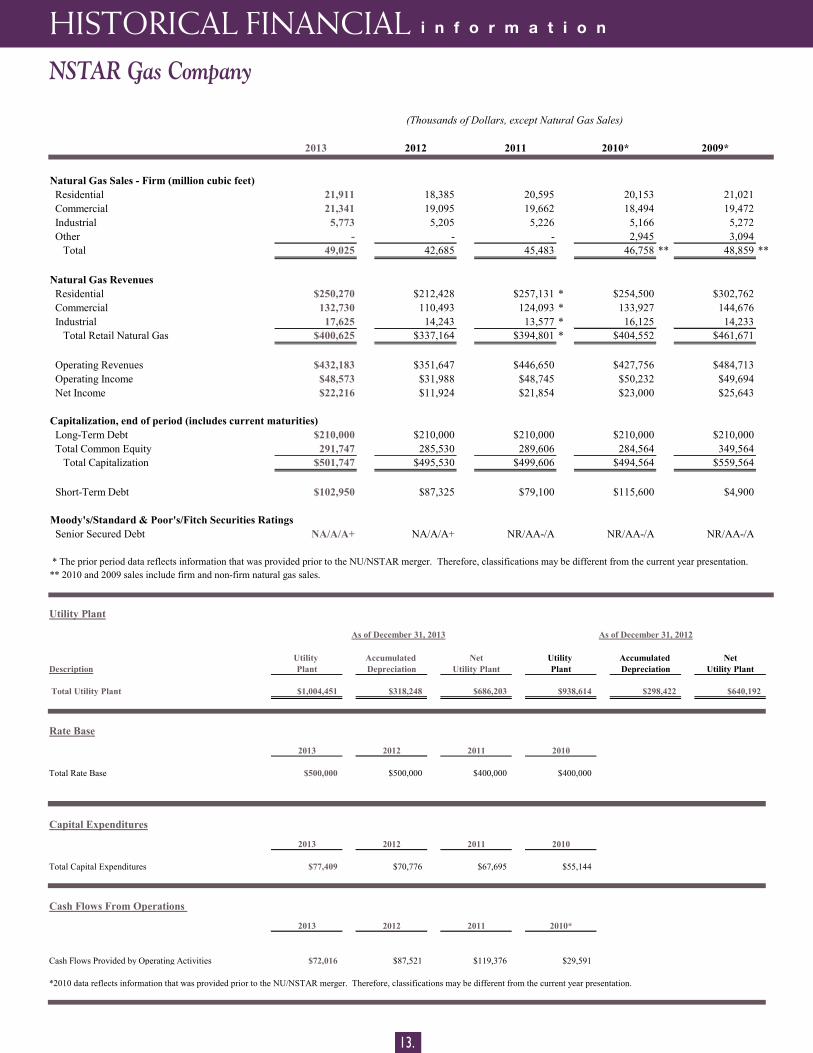
Utility Plant
As of December 31, 2013 As of December 31, 2012
Utility Accumulated Net Utility Accumulated NetDescription Plant Depreciation Utility Plant Plant Depreciation Utility Plant
Total Utility Plant $1,004,451 $318,248 $686,203 $938,614 $298,422 $640,192
Rate Base
2013 2012 2011 2010
Total Rate Base $500,000 $500,000 $400,000 $400,000
Capital Expenditures
2013 2012 2011 2010
Total Capital Expenditures $77,409 $70,776 $67,695 $55,144
Cash Flows From Operations
2013 2012 2011 2010*
Cash Flows Provided by Operating Activities $72,016 $87,521 $119,376 $29,591
*2010 data reflects information that was provided prior to the NU/NSTAR merger. Therefore, classifications may be different from the current year presentation.
2013 2012 2011 2010* 2009*
Natural Gas Sales - Firm (million cubic feet) Residential 21,911 18,385 20,595 20,153 21,021 Commercial 21,341 19,095 19,662 18,494 19,472 Industrial 5,773 5,205 5,226 5,166 5,272 Other - - - 2,945 3,094 Total 49,025 42,685 45,483 46,758 ** 48,859 **
Natural Gas Revenues Residential $250,270 $212,428 $257,131 * $254,500 $302,762 Commercial 132,730 110,493 124,093 * 133,927 144,676 Industrial 17,625 14,243 13,577 * 16,125 14,233 Total Retail Natural Gas $400,625 $337,164 $394,801 * $404,552 $461,671
Operating Revenues $432,183 $351,647 $446,650 $427,756 $484,713 Operating Income $48,573 $31,988 $48,745 $50,232 $49,694 Net Income $22,216 $11,924 $21,854 $23,000 $25,643
Capitalization, end of period (includes current maturities) Long-Term Debt $210,000 $210,000 $210,000 $210,000 $210,000 Total Common Equity 291,747 285,530 289,606 284,564 349,564 Total Capitalization $501,747 $495,530 $499,606 $494,564 $559,564
Short-Term Debt $102,950 $87,325 $79,100 $115,600 $4,900
Moody's/Standard & Poor's/Fitch Securities Ratings Senior Secured Debt NA/A/A+ NA/A/A+ NR/AA-/A NR/AA-/A NR/AA-/A
* The prior period data reflects information that was provided prior to the NU/NSTAR merger. Therefore, classifications may be different from the current year presentation.** 2010 and 2009 sales include firm and non-firm natural gas sales.
(Thousands of Dollars, except Natural Gas Sales)
NSTAR Gas Company
13.
HISTORICAL FINANCIAL i n f o r m a t i o n
14.
NEWMILFORD
SHERMAN
WASHINGTON
KENT
SHARON
SALISBURY
NORTHCANAAN
CANAAN
CORNWALL GOSHEN
NORFOLK
WARRENLITCHFIELD
COLEBROOK
WINSTED
TORRINGTON
MORRIS
HARWINTON
NEWHARTFORD
BARK-HAMSTED
HART-LAND
GRANBY
CANTONSIMSBURY
BRIDGE-WATER
ROXBURYWOODBURY
BETHLEHEMWATERTOWN
THOM-ASTON
PLYMOUTH
WOLCOTT
BRISTOL PLAIN-VILLE
SOUTHINGTON
NEWBRITAIN
MIDDLETOWN
BERLIN
MERIDENMIDDLE-
FIELD
CROMWELL
ROCKYHILL
NEW-INGTON
FARMINGTON
AVON
BURLINGTON
WESTHARTFORD
BLOOM-FIELD
WETHERS-FIELD
EASTHARTFORDHART-
FORD
SUFFIELD
EASTGRANBY WINDSOR
LOCKS
BEACONFALLS
WOOD-BRIDGE
SEYMOUR
NORTHHAVEN
HAMDEN
NORTHBRANFORD
ANSONIA
REDDINGRIDGEFIELD
DANBURY
BETHEL
NEWTOWN
MONROE
NEWFAIRFIELD
BROOK-FIELD
SOUTHBURY
GREENWICH
STAMFORD
NEWCANAAN
DARIEN
NORWALK
WILTONWESTON
FAIRFIELD
BRIDGE-PORT
EASTON TRUMBULL
STRAT-FORD
SHELTON
MIDDLE-BURY
WATERBURY
NAUGATUCKWALLINGFORD
CHESHIRE
PROSPECT
OXFORD
MILFORD
ORANGE
NEW HAVEN
WEST-HAVEN
EAST
HAV
EN
BETHANY
BRANFORD
DURHAM
WESTPORT
DERBYMADISON
GUILFORD
EASTHADDAM
COLCHESTER
MARL-BOROUGH
HEBRON
CLINTONWEST-BROOK
OLDSAYBROOK
KILLING-WORTH
CHESTER
DEEPRIVER ESSEX
HADDAM
PORTLAND
LYME
OLDLYME
ANDOVER
SALEM
LEDYARD
EASTLYME
WATERFORDGROTON
LEBANON
PRESTON
COLUMBIAGLASTONBURY
EASTHAMPTON
MONTVILLE
STONINGTON
NORTHSTONINGTON
VOLU
NTOW
N
NORWICH
GRISWOLD
LISB
ON
STER
LING
SCOT-LAND
CANTERBURY
PLAINFIELD
FRANKLIN
BOZRAH
SPRAGUE
BOLTONMANCHESTER
SOMERS
ELLINGTON
VERNON
TOLLAND
COVENTRY
STAFFORD UNIONWOODSTOCK
WILLINGTON ASHFORD
EASTFORD
POMFRET
KILLINGLY
MANSFIELD CHAPLINBROOKLYN
HAMPTON
THOMPSON
PUTNAM
ENFIELD
WINDSOR
SOUTHWINDSOR
EASTWINDSOR
WINDHAM
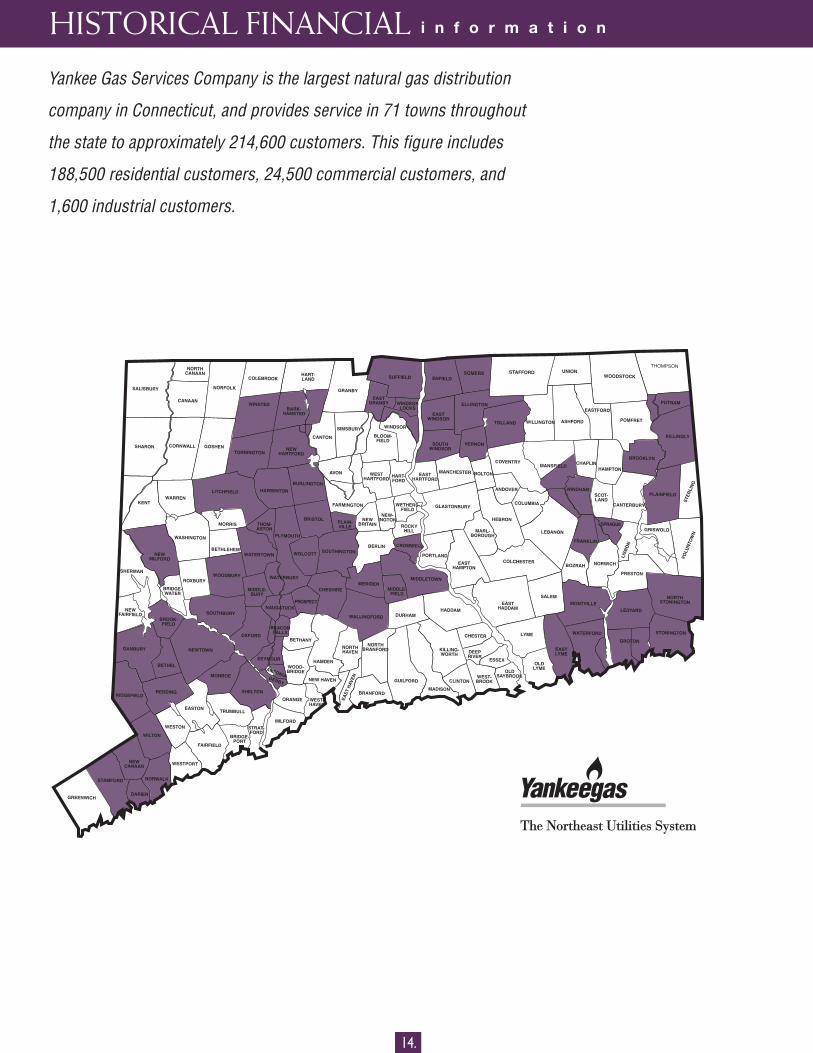
Yankee Gas Services Company is the largest natural gas distribution
company in Connecticut, and provides service in 71 towns throughout
the state to approximately 214,600 customers. This figure includes
188,500 residential customers, 24,500 commercial customers, and
1,600 industrial customers.
HISTORICAL FINANCIAL i n f o r m a t i o n

Utility Plant
As of December 31, 2013 As of December 31, 2012
Utility Accumulated Net Utility Accumulated NetDescription Plant Depreciation Utility Plant Plant Depreciation Utility Plant
Total Utility Plant $1,421,421 $359,807 $1,061,614 $1,335,623 $341,039 $994,584
Rate Base
2013 2012 2011 2010
Total Rate Base $800,000 $800,000 $800,000 $700,000
Capital Expenditures
2013 2012 2011 2010
Total Capital Expenditures $97,758 $103,342 $102,848 $94,627
Cash Flows From Operations
2013 2012 2011 2010
Cash Flows Provided by Operating Activities $73,673 $88,616 $93,365 $74,190
2013 2012 2011 2010 2009
Natural Gas Sales - Firm (million cubic feet) Residential 14,866 12,488 13,508 13,403 13,570 Commercial 18,874 16,567 17,175 16,515 16,033 Industrial 15,493 15,787 16,197 22,692 23,044 Total 49,233 44,842 46,880 52,610 * 52,647 *
Natural Gas Revenues Residential $217,843 $194,110 $214,451 $221,519 $216,634 Commercial 129,788 118,124 129,584 129,194 140,422 Industrial 57,951 61,767 72,843 70,960 81,699 Total Retail Natural Gas $405,582 $374,001 $416,878 $421,673 $438,755
Operating Revenues $423,730 $385,009 $430,799 $434,277 $449,571 Operating Income $82,727 $61,685 $69,560 $70,470 $54,686 Net Income $39,703 $26,264 $31,672 $32,662 $20,983
Capitalization, end of period (includes current maturities) Long-Term Debt $345,682 $345,805 $350,206 $354,583 $308,937 Total Common Equity 661,829 673,551 665,384 657,348 619,050 Total Capitalization $1,007,511 $1,019,356 $1,015,590 $1,011,931 $927,987
Short-Term Debt $139,700 $70,600 $42,500 $8,900 $53,000
Moody's/Standard & Poor's/Fitch Securities Ratings Senior Secured Debt A3/NA/NA** - - - -
* 2010 and 2009 sales include firm and non-firm natural gas sales.** Moody's raised Yankee Gas' Senior Secured Debt rating to A2 on 1/31/14.
(Thousands of Dollars, except Natural Gas Sales)
Yankee Gas Services Company
15.
HISTORICAL FINANCIAL i n f o r m a t i o n
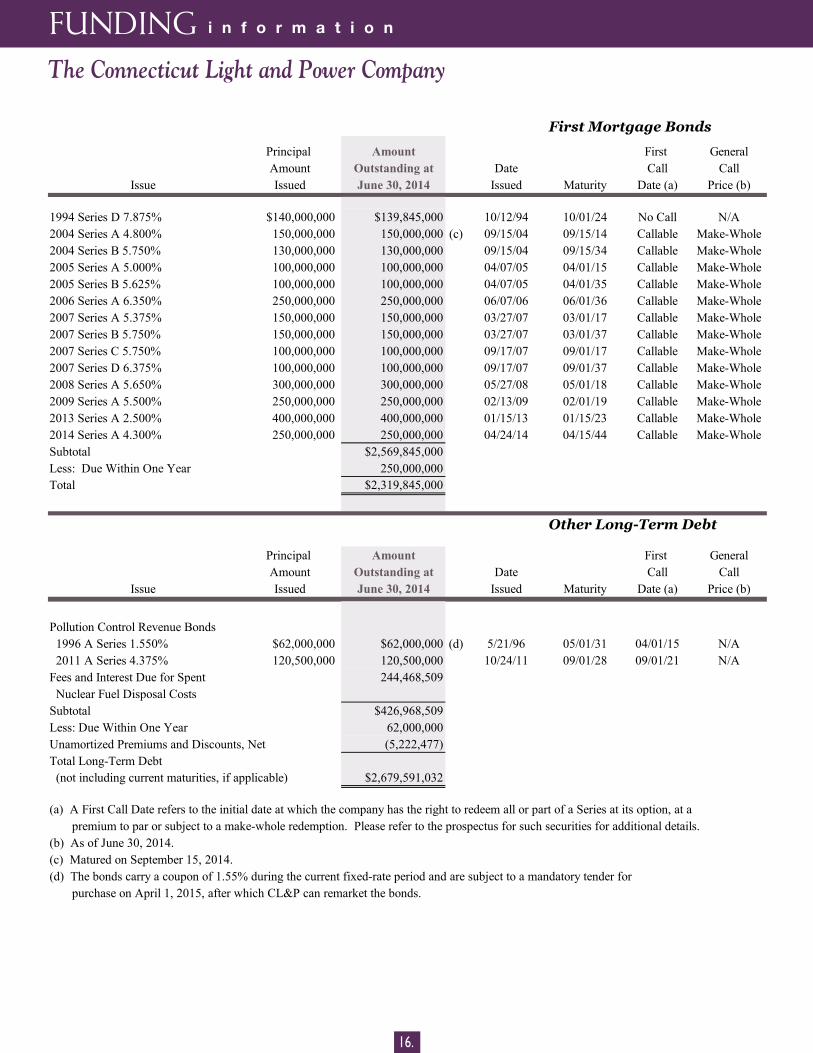
First Mortgage Bonds
Principal Amount First GeneralAmount Outstanding at Date Call Call
Issue Issued June 30, 2014 Issued Maturity Date (a) Price (b)
1994 Series D 7.875% $140,000,000 $139,845,000 10/12/94 10/01/24 No Call N/A2004 Series A 4.800% 150,000,000 150,000,000 (c) 09/15/04 09/15/14 Callable Make-Whole2004 Series B 5.750% 130,000,000 130,000,000 09/15/04 09/15/34 Callable Make-Whole2005 Series A 5.000% 100,000,000 100,000,000 04/07/05 04/01/15 Callable Make-Whole2005 Series B 5.625% 100,000,000 100,000,000 04/07/05 04/01/35 Callable Make-Whole2006 Series A 6.350% 250,000,000 250,000,000 06/07/06 06/01/36 Callable Make-Whole2007 Series A 5.375% 150,000,000 150,000,000 03/27/07 03/01/17 Callable Make-Whole2007 Series B 5.750% 150,000,000 150,000,000 03/27/07 03/01/37 Callable Make-Whole2007 Series C 5.750% 100,000,000 100,000,000 09/17/07 09/01/17 Callable Make-Whole2007 Series D 6.375% 100,000,000 100,000,000 09/17/07 09/01/37 Callable Make-Whole2008 Series A 5.650% 300,000,000 300,000,000 05/27/08 05/01/18 Callable Make-Whole2009 Series A 5.500% 250,000,000 250,000,000 02/13/09 02/01/19 Callable Make-Whole2013 Series A 2.500% 400,000,000 400,000,000 01/15/13 01/15/23 Callable Make-Whole2014 Series A 4.300% 250,000,000 250,000,000 04/24/14 04/15/44 Callable Make-WholeSubtotal $2,569,845,000Less: Due Within One Year 250,000,000Total $2,319,845,000
Other Long-Term Debt
Principal Amount First GeneralAmount Outstanding at Date Call Call
Issue Issued June 30, 2014 Issued Maturity Date (a) Price (b)
Pollution Control Revenue Bonds 1996 A Series 1.550% $62,000,000 $62,000,000 (d) 5/21/96 05/01/31 04/01/15 N/A 2011 A Series 4.375% 120,500,000 120,500,000 10/24/11 09/01/28 09/01/21 N/AFees and Interest Due for Spent 244,468,509 Nuclear Fuel Disposal CostsSubtotal $426,968,509Less: Due Within One Year 62,000,000Unamortized Premiums and Discounts, Net (5,222,477)Total Long-Term Debt (not including current maturities, if applicable) $2,679,591,032
(a) A First Call Date refers to the initial date at which the company has the right to redeem all or part of a Series at its option, at a premium to par or subject to a make-whole redemption. Please refer to the prospectus for such securities for additional details.(b) As of June 30, 2014.(c) Matured on September 15, 2014.(d) The bonds carry a coupon of 1.55% during the current fixed-rate period and are subject to a mandatory tender for purchase on April 1, 2015, after which CL&P can remarket the bonds.
The Connecticut Light and Power Company
16.
FUNDING i n f o r m a t i o n
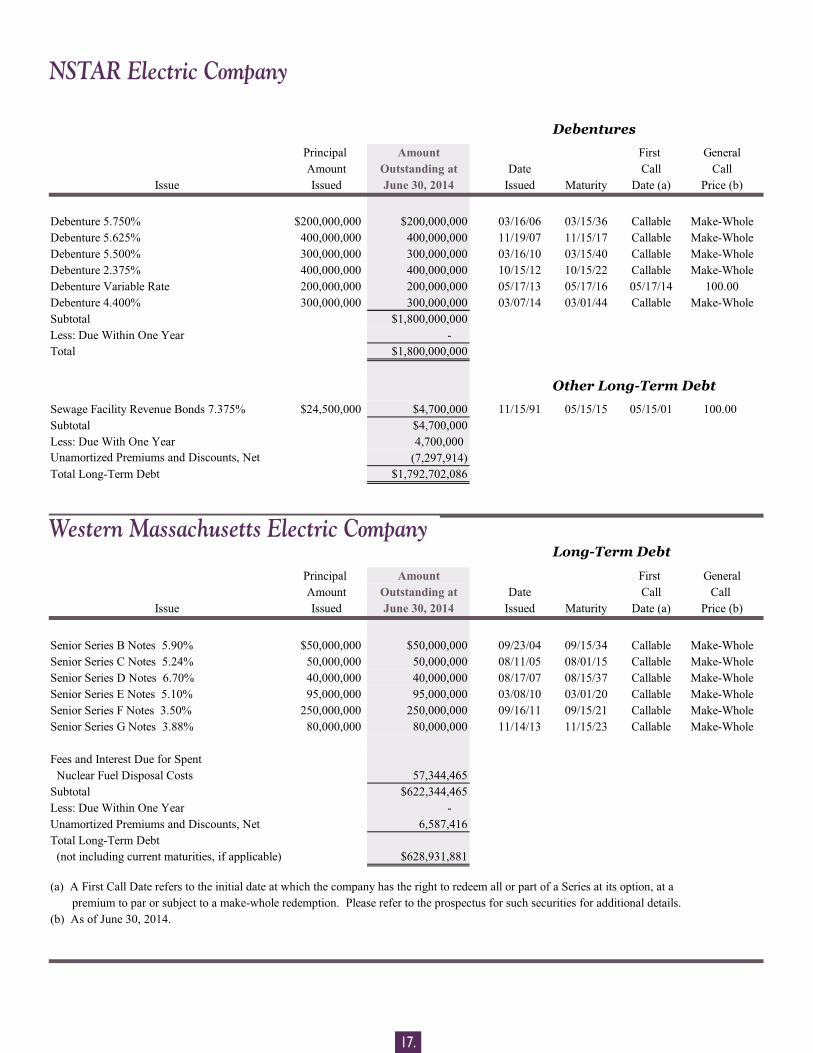
Debentures
Principal Amount First GeneralAmount Outstanding at Date Call Call
Issue Issued June 30, 2014 Issued Maturity Date (a) Price (b)
Debenture 5.750% $200,000,000 $200,000,000 03/16/06 03/15/36 Callable Make-WholeDebenture 5.625% 400,000,000 400,000,000 11/19/07 11/15/17 Callable Make-WholeDebenture 5.500% 300,000,000 300,000,000 03/16/10 03/15/40 Callable Make-WholeDebenture 2.375% 400,000,000 400,000,000 10/15/12 10/15/22 Callable Make-WholeDebenture Variable Rate 200,000,000 200,000,000 05/17/13 05/17/16 05/17/14 100.00Debenture 4.400% 300,000,000 300,000,000 03/07/14 03/01/44 Callable Make-WholeSubtotal $1,800,000,000Less: Due Within One Year - Total $1,800,000,000
Other Long-Term Debt
Sewage Facility Revenue Bonds 7.375% $24,500,000 $4,700,000 11/15/91 05/15/15 05/15/01 100.00Subtotal $4,700,000Less: Due With One Year 4,700,000 Unamortized Premiums and Discounts, Net (7,297,914)Total Long-Term Debt $1,792,702,086
Western Massachusetts Electric CompanyLong-Term Debt
Principal Amount First GeneralAmount Outstanding at Date Call Call
Issue Issued June 30, 2014 Issued Maturity Date (a) Price (b)
Senior Series B Notes 5.90% $50,000,000 $50,000,000 09/23/04 09/15/34 Callable Make-WholeSenior Series C Notes 5.24% 50,000,000 50,000,000 08/11/05 08/01/15 Callable Make-WholeSenior Series D Notes 6.70% 40,000,000 40,000,000 08/17/07 08/15/37 Callable Make-WholeSenior Series E Notes 5.10% 95,000,000 95,000,000 03/08/10 03/01/20 Callable Make-WholeSenior Series F Notes 3.50% 250,000,000 250,000,000 09/16/11 09/15/21 Callable Make-WholeSenior Series G Notes 3.88% 80,000,000 80,000,000 11/14/13 11/15/23 Callable Make-Whole
Fees and Interest Due for Spent Nuclear Fuel Disposal Costs 57,344,465Subtotal $622,344,465Less: Due Within One Year - Unamortized Premiums and Discounts, Net 6,587,416Total Long-Term Debt (not including current maturities, if applicable) $628,931,881
(a) A First Call Date refers to the initial date at which the company has the right to redeem all or part of a Series at its option, at a premium to par or subject to a make-whole redemption. Please refer to the prospectus for such securities for additional details.(b) As of June 30, 2014.
NSTAR Electric Company
17.
Western Massachusetts Electric Company
18.
FUNDING i n f o r m a t i o n
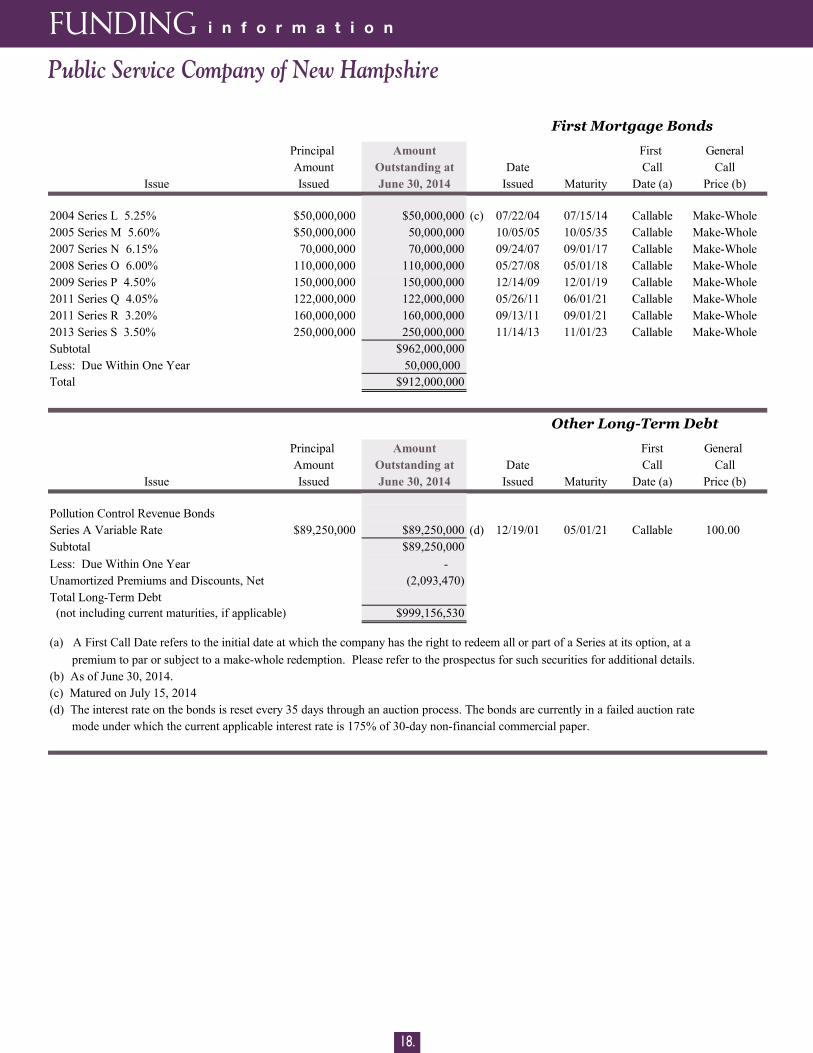
Public Service Company of New Hampshire
First Mortgage Bonds
Principal Amount First GeneralAmount Outstanding at Date Call Call
Issue Issued June 30, 2014 Issued Maturity Date (a) Price (b)
2004 Series L 5.25% $50,000,000 $50,000,000 (c) 07/22/04 07/15/14 Callable Make-Whole2005 Series M 5.60% $50,000,000 50,000,000 10/05/05 10/05/35 Callable Make-Whole2007 Series N 6.15% 70,000,000 70,000,000 09/24/07 09/01/17 Callable Make-Whole2008 Series O 6.00% 110,000,000 110,000,000 05/27/08 05/01/18 Callable Make-Whole2009 Series P 4.50% 150,000,000 150,000,000 12/14/09 12/01/19 Callable Make-Whole2011 Series Q 4.05% 122,000,000 122,000,000 05/26/11 06/01/21 Callable Make-Whole2011 Series R 3.20% 160,000,000 160,000,000 09/13/11 09/01/21 Callable Make-Whole2013 Series S 3.50% 250,000,000 250,000,000 11/14/13 11/01/23 Callable Make-WholeSubtotal $962,000,000Less: Due Within One Year 50,000,000 Total $912,000,000
Other Long-Term Debt
Principal Amount First General Amount Outstanding at Date Call Call
Issue Issued June 30, 2014 Issued Maturity Date (a) Price (b)
Pollution Control Revenue BondsSeries A Variable Rate $89,250,000 $89,250,000 (d) 12/19/01 05/01/21 Callable 100.00Subtotal $89,250,000Less: Due Within One Year - Unamortized Premiums and Discounts, Net (2,093,470)Total Long-Term Debt (not including current maturities, if applicable) $999,156,530
(a) A First Call Date refers to the initial date at which the company has the right to redeem all or part of a Series at its option, at a premium to par or subject to a make-whole redemption. Please refer to the prospectus for such securities for additional details.(b) As of June 30, 2014.(c) Matured on July 15, 2014(d) The interest rate on the bonds is reset every 35 days through an auction process. The bonds are currently in a failed auction rate mode under which the current applicable interest rate is 175% of 30-day non-financial commercial paper.
19.
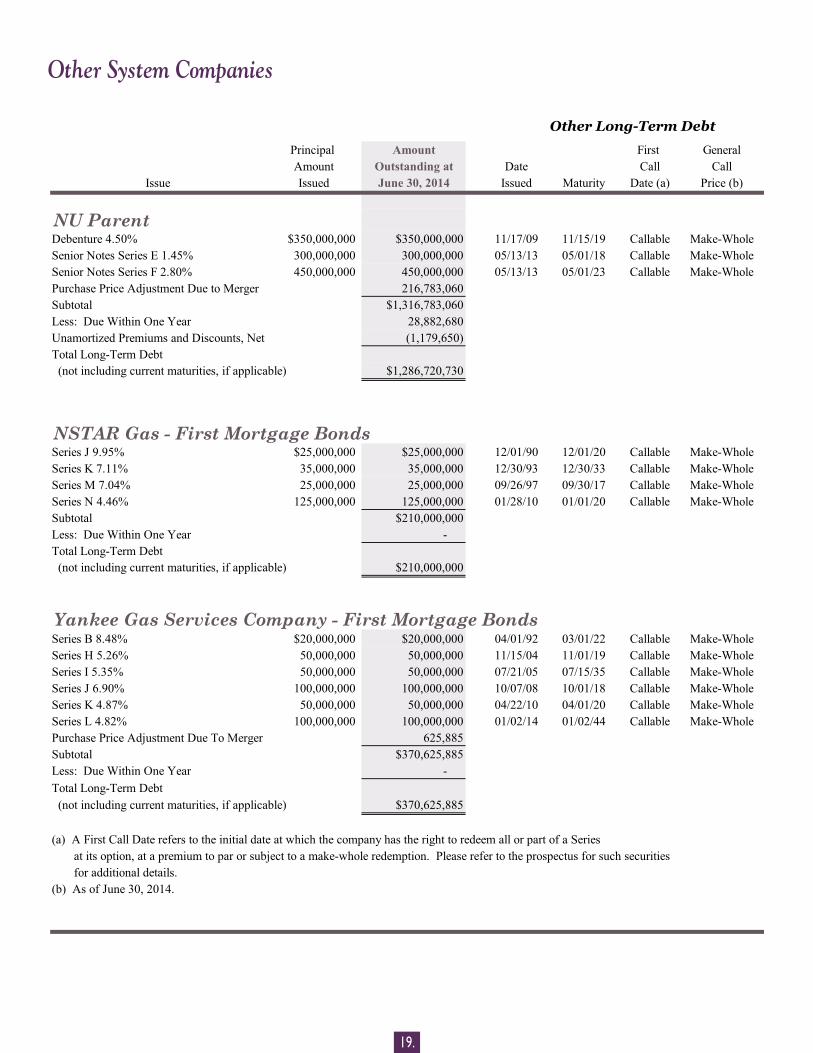
Other Long-Term Debt
Principal Amount First GeneralAmount Outstanding at Date Call Call
Issue Issued June 30, 2014 Issued Maturity Date (a) Price (b)
NU Parent Debenture 4.50% $350,000,000 $350,000,000 11/17/09 11/15/19 Callable Make-WholeSenior Notes Series E 1.45% 300,000,000 300,000,000 05/13/13 05/01/18 Callable Make-WholeSenior Notes Series F 2.80% 450,000,000 450,000,000 05/13/13 05/01/23 Callable Make-WholePurchase Price Adjustment Due to Merger 216,783,060Subtotal $1,316,783,060Less: Due Within One Year 28,882,680Unamortized Premiums and Discounts, Net (1,179,650) Total Long-Term Debt (not including current maturities, if applicable) $1,286,720,730
NSTAR Gas - First Mortgage BondsSeries J 9.95% $25,000,000 $25,000,000 12/01/90 12/01/20 Callable Make-WholeSeries K 7.11% 35,000,000 35,000,000 12/30/93 12/30/33 Callable Make-WholeSeries M 7.04% 25,000,000 25,000,000 09/26/97 09/30/17 Callable Make-WholeSeries N 4.46% 125,000,000 125,000,000 01/28/10 01/01/20 Callable Make-WholeSubtotal $210,000,000Less: Due Within One Year - Total Long-Term Debt (not including current maturities, if applicable) $210,000,000
Yankee Gas Services Company - First Mortgage BondsSeries B 8.48% $20,000,000 $20,000,000 04/01/92 03/01/22 Callable Make-WholeSeries H 5.26% 50,000,000 50,000,000 11/15/04 11/01/19 Callable Make-WholeSeries I 5.35% 50,000,000 50,000,000 07/21/05 07/15/35 Callable Make-WholeSeries J 6.90% 100,000,000 100,000,000 10/07/08 10/01/18 Callable Make-WholeSeries K 4.87% 50,000,000 50,000,000 04/22/10 04/01/20 Callable Make-WholeSeries L 4.82% 100,000,000 100,000,000 01/02/14 01/02/44 Callable Make-WholePurchase Price Adjustment Due To Merger 625,885Subtotal $370,625,885Less: Due Within One Year - Total Long-Term Debt (not including current maturities, if applicable) $370,625,885
(a) A First Call Date refers to the initial date at which the company has the right to redeem all or part of a Series at its option, at a premium to par or subject to a make-whole redemption. Please refer to the prospectus for such securities for additional details.(b) As of June 30, 2014.
Other System Companies
20.
FUNDING i n f o r m a t i o n
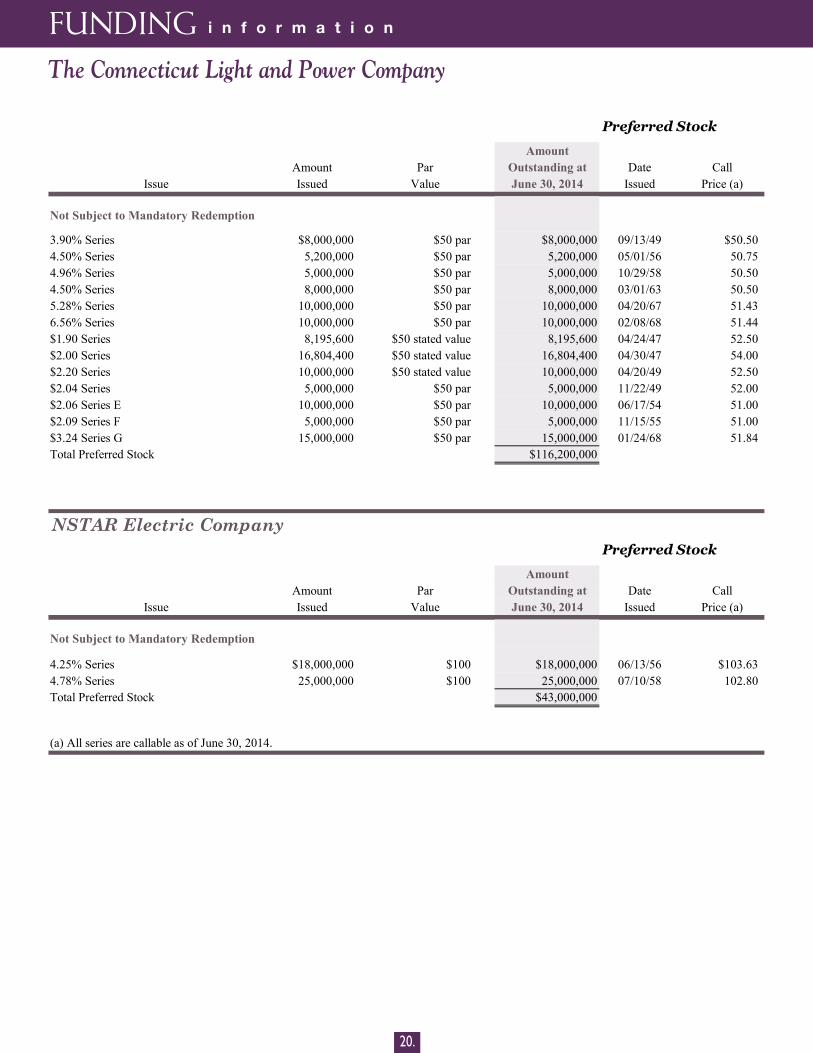
Preferred Stock
AmountAmount Par Outstanding at Date Call
Issue Issued Value June 30, 2014 Issued Price (a)
Not Subject to Mandatory Redemption
3.90% Series $8,000,000 $50 par $8,000,000 09/13/49 $50.504.50% Series 5,200,000 $50 par 5,200,000 05/01/56 50.75 4.96% Series 5,000,000 $50 par 5,000,000 10/29/58 50.50 4.50% Series 8,000,000 $50 par 8,000,000 03/01/63 50.50 5.28% Series 10,000,000 $50 par 10,000,000 04/20/67 51.43 6.56% Series 10,000,000 $50 par 10,000,000 02/08/68 51.44 $1.90 Series 8,195,600 $50 stated value 8,195,600 04/24/47 52.50 $2.00 Series 16,804,400 $50 stated value 16,804,400 04/30/47 54.00 $2.20 Series 10,000,000 $50 stated value 10,000,000 04/20/49 52.50 $2.04 Series 5,000,000 $50 par 5,000,000 11/22/49 52.00 $2.06 Series E 10,000,000 $50 par 10,000,000 06/17/54 51.00 $2.09 Series F 5,000,000 $50 par 5,000,000 11/15/55 51.00 $3.24 Series G 15,000,000 $50 par 15,000,000 01/24/68 51.84 Total Preferred Stock $116,200,000
NSTAR Electric CompanyPreferred Stock
AmountAmount Par Outstanding at Date Call
Issue Issued Value June 30, 2014 Issued Price (a)
Not Subject to Mandatory Redemption
4.25% Series $18,000,000 $100 $18,000,000 06/13/56 $103.634.78% Series 25,000,000 $100 25,000,000 07/10/58 102.80 Total Preferred Stock $43,000,000
(a) All series are callable as of June 30, 2014.
The Connecticut Light and Power Company
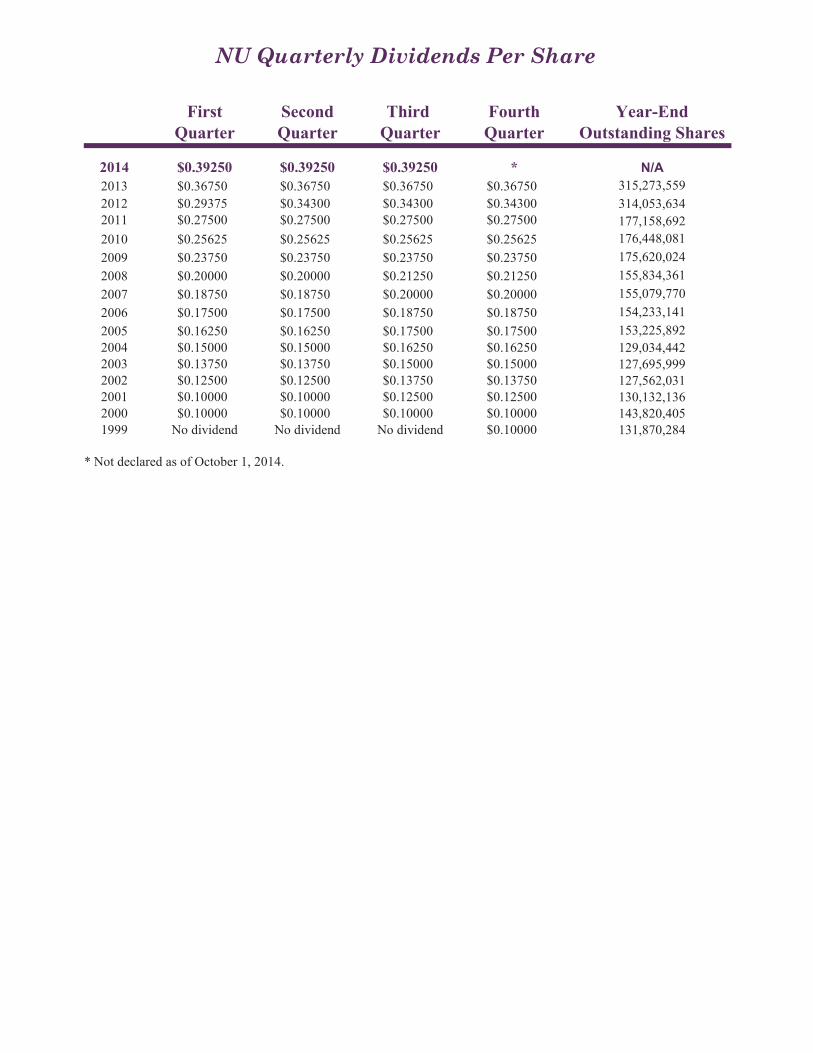
First Second Third Fourth Year-EndQuarter Quarter Quarter Quarter Outstanding Shares
2014 $0.39250 $0.39250 $0.39250 * N/A2013 $0.36750 $0.36750 $0.36750 $0.36750 315,273,5592012 $0.29375 $0.34300 $0.34300 $0.34300 314,053,6342011 $0.27500 $0.27500 $0.27500 $0.27500 177,158,6922010 $0.25625 $0.25625 $0.25625 $0.25625 176,448,0812009 $0.23750 $0.23750 $0.23750 $0.23750 175,620,0242008 $0.20000 $0.20000 $0.21250 $0.21250 155,834,3612007 $0.18750 $0.18750 $0.20000 $0.20000 155,079,7702006 $0.17500 $0.17500 $0.18750 $0.18750 154,233,1412005 $0.16250 $0.16250 $0.17500 $0.17500 153,225,8922004 $0.15000 $0.15000 $0.16250 $0.16250 129,034,4422003 $0.13750 $0.13750 $0.15000 $0.15000 127,695,9992002 $0.12500 $0.12500 $0.13750 $0.13750 127,562,0312001 $0.10000 $0.10000 $0.12500 $0.12500 130,132,1362000 $0.10000 $0.10000 $0.10000 $0.10000 143,820,4051999 No dividend No dividend No dividend $0.10000 131,870,284
* Not declared as of October 1, 2014.
NU Quarterly Dividends Per Share
James J. JudgeExecutive Vice President and Chief Financial OfficerTelephone: (617) 424-2410
Philip J. LemboVice President and TreasurerTelephone: (781) 441-8100
Jeffrey R. KotkinVice President – Investor RelationsTelephone: (860) 665-5154Fax: (860) 665-6717E-mail: [email protected]
Emilie G. O’NeilDirector, Corporate Finance & Cash ManagementTelephone: (781) 441-8127
Investor RelationsNortheast UtilitiesP.O. Box 270Hartford, CT 06141-0270
This document presents historical
information pertaining to Northeast
Utilities and subsidiaries frequently
requested by security analysts and
members of the financial community.
Some of the data contained herein
are estimates that may be subject to
significant change and are qualified
in their entirety by reference to the
Forms 10-K, 10-Q and 8-K filed by NU
and its subsidiaries. Data are provid-
ed for general information purposes
only and are not intended for use in
the solicitation of offers to buy any
securities of the NU companies.
John MoreiraDirector, Financial Forecasting & Investor Relations Telephone: (781) 441-8887E-mail: [email protected]
John F. GavinManager, Investor RelationsTelephone: (781) 441-8118E-mail: [email protected]
Barbara F. NiemanInvestor Communications SpecialistTelephone: (860) 665-3249E-mail: [email protected]
2014 Financial Review
Inquiries relating to this document should be directed to:
www.nu.com
LMHP1114