Embed Size (px)
Citation preview

Northern Alberta Institute of Technology
Alternative Energy Program
Solar Photovoltaic Reference Array Report – March 31, 2016
2 | P a g e
Goals
Provide solar energy system educators, installers and adopters with real world regional performance data.
Improve system design and economic modeling accuracy.
Methodology
Track individual module performance on as many of the most common installation angles as is possible. Roof
pitches of 3/12, 4/12, 6/12 and 12/12 as well as ground installations based on site latitude and wall mounting at
90O were chosen.
Study the impact of snow on overall performance for a term of, not less than, five years.
Make findings available to any and all interested parties.
Design
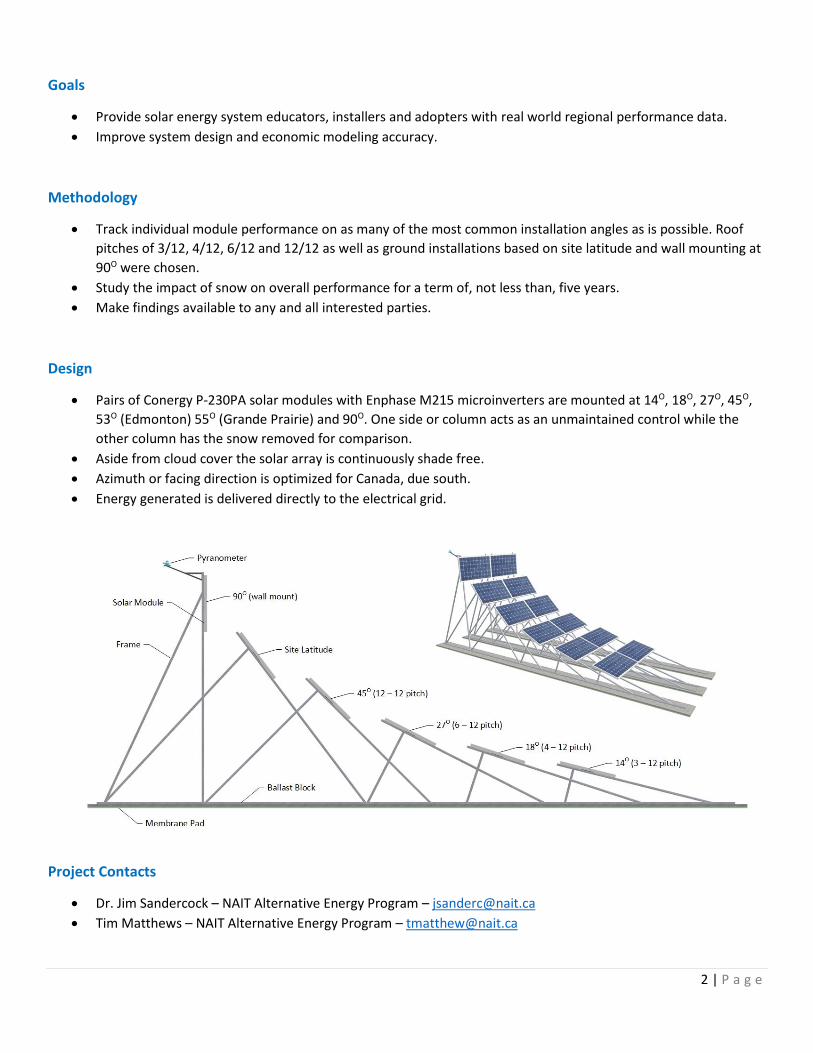
Pairs of Conergy P-230PA solar modules with Enphase M215 microinverters are mounted at 14O, 18O, 27O, 45O,
53O (Edmonton) 55O (Grande Prairie) and 90O. One side or column acts as an unmaintained control while the
other column has the snow removed for comparison.
Aside from cloud cover the solar array is continuously shade free.
Azimuth or facing direction is optimized for Canada, due south.
Energy generated is delivered directly to the electrical grid.
Project Contacts
Dr. Jim Sandercock – NAIT Alternative Energy Program – [email protected]
Tim Matthews – NAIT Alternative Energy Program – [email protected]
3 | P a g e
Installation One
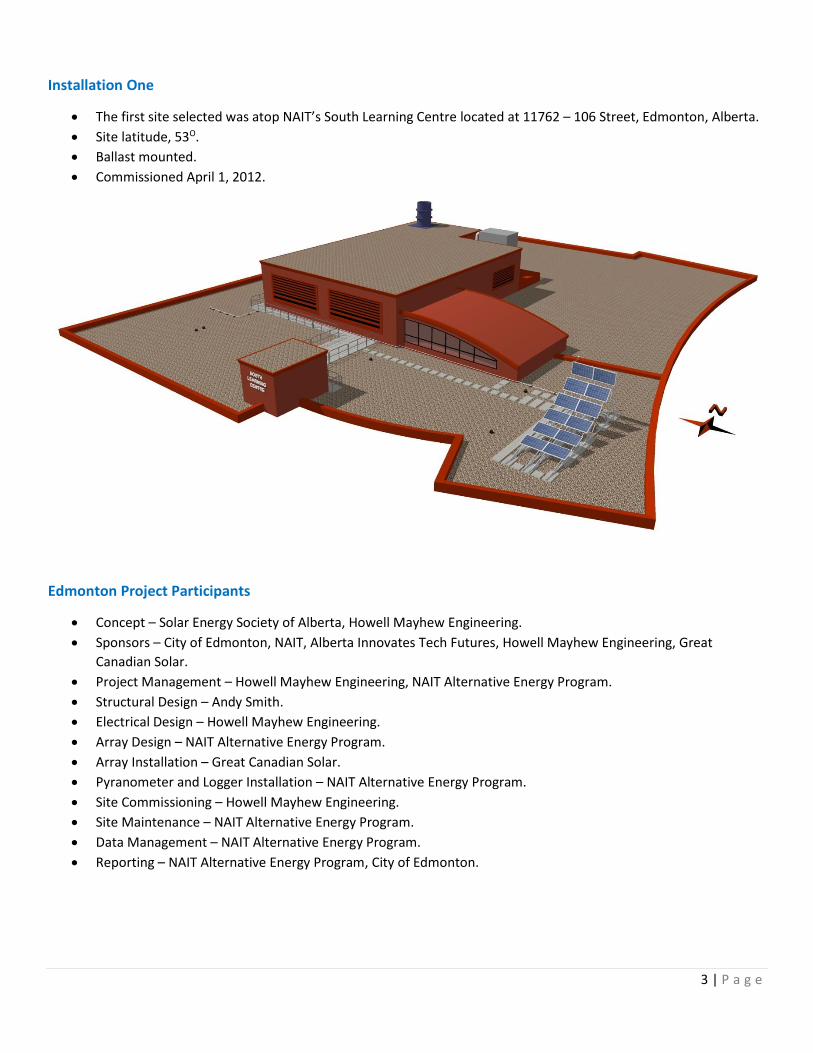
The first site selected was atop NAIT’s South Learning Centre located at 11762 – 106 Street, Edmonton, Alberta.
Site latitude, 53O.
Ballast mounted.
Commissioned April 1, 2012.
Edmonton Project Participants
Concept – Solar Energy Society of Alberta, Howell Mayhew Engineering.
Sponsors – City of Edmonton, NAIT, Alberta Innovates Tech Futures, Howell Mayhew Engineering, Great
Canadian Solar.
Project Management – Howell Mayhew Engineering, NAIT Alternative Energy Program.
Structural Design – Andy Smith.
Electrical Design – Howell Mayhew Engineering.
Array Design – NAIT Alternative Energy Program.
Array Installation – Great Canadian Solar.
Pyranometer and Logger Installation – NAIT Alternative Energy Program.
Site Commissioning – Howell Mayhew Engineering.
Site Maintenance – NAIT Alternative Energy Program.
Data Management – NAIT Alternative Energy Program.
Reporting – NAIT Alternative Energy Program, City of Edmonton.

4 | P a g e
Installation Two
The second site selected was atop City Hall located at 10205 - 98 Street, Grande Prairie, Alberta.
Site latitude, 55O.
Ballast mounted.
Commissioned May 24, 2013. Snow maintenance commenced September 1, 2015.
Grande Prairie Project Participants
Concept – Solar Energy Society of Alberta, Howell Mayhew Engineering.
Sponsors – The Alberta Real Estate Foundation, NAIT, City of Grande Prairie.
Project Management – NAIT Alternative Energy Program.
Structural Design – Andy Smith.
Electrical Design – Great Canadian Solar, NAIT Alternative Energy Program.
Array Design – NAIT Alternative Energy Program.
Array Installation – Great Canadian Solar, NAIT Alternative Energy Program.
Pyranometer and Logger Installation – Campbell Scientific.
Site Commissioning – Howell Mayhew Engineering.
Site Maintenance – Grande Prairie City Hall Staff.
Data Management – NAIT Alternative Energy Program.
Reporting – NAIT Alternative Energy Program.
5 | P a g e
Maintenance
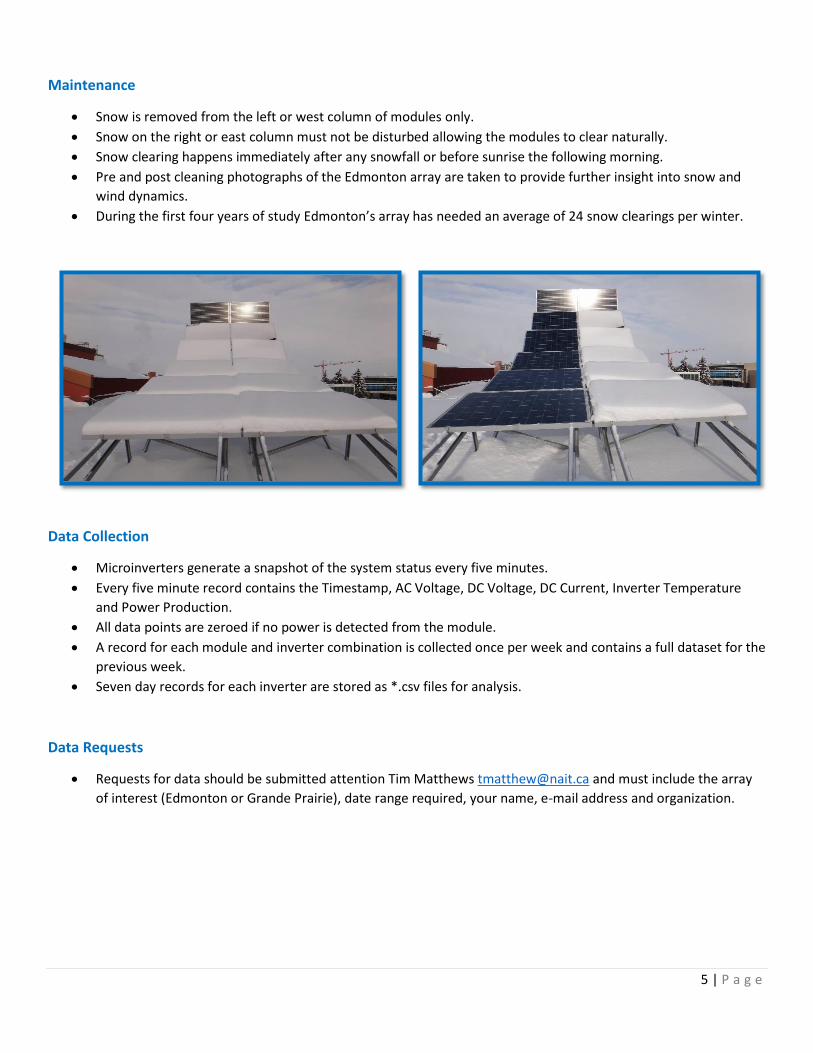
Snow is removed from the left or west column of modules only.
Snow on the right or east column must not be disturbed allowing the modules to clear naturally.
Snow clearing happens immediately after any snowfall or before sunrise the following morning.
Pre and post cleaning photographs of the Edmonton array are taken to provide further insight into snow and
wind dynamics.
During the first four years of study Edmonton’s array has needed an average of 24 snow clearings per winter.
Data Collection
Microinverters generate a snapshot of the system status every five minutes.
Every five minute record contains the Timestamp, AC Voltage, DC Voltage, DC Current, Inverter Temperature
and Power Production.
All data points are zeroed if no power is detected from the module.
A record for each module and inverter combination is collected once per week and contains a full dataset for the
previous week.
Seven day records for each inverter are stored as *.csv files for analysis.
Data Requests
Requests for data should be submitted attention Tim Matthews [email protected] and must include the array
of interest (Edmonton or Grande Prairie), date range required, your name, e-mail address and organization.
6 | P a g e
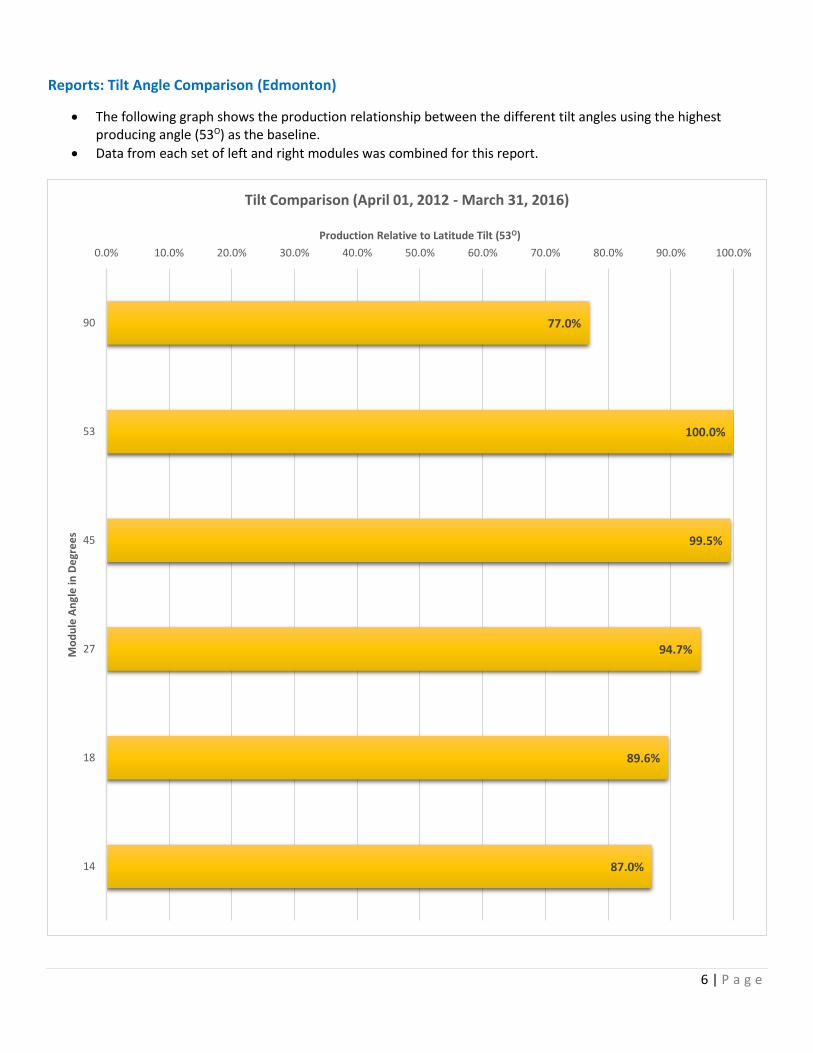
Reports: Tilt Angle Comparison (Edmonton)
The following graph shows the production relationship between the different tilt angles using the highest producing angle (53O) as the baseline.
Data from each set of left and right modules was combined for this report.
77.0%
100.0%
99.5%
94.7%
89.6%
87.0%
0.0% 10.0% 20.0% 30.0% 40.0% 50.0% 60.0% 70.0% 80.0% 90.0% 100.0%
90
53
45
27
18
14
Production Relative to Latitude Tilt (53O)
Mo
du
le A
ngl
e in
De
gre
es
Tilt Comparison (April 01, 2012 - March 31, 2016)
7 | P a g e
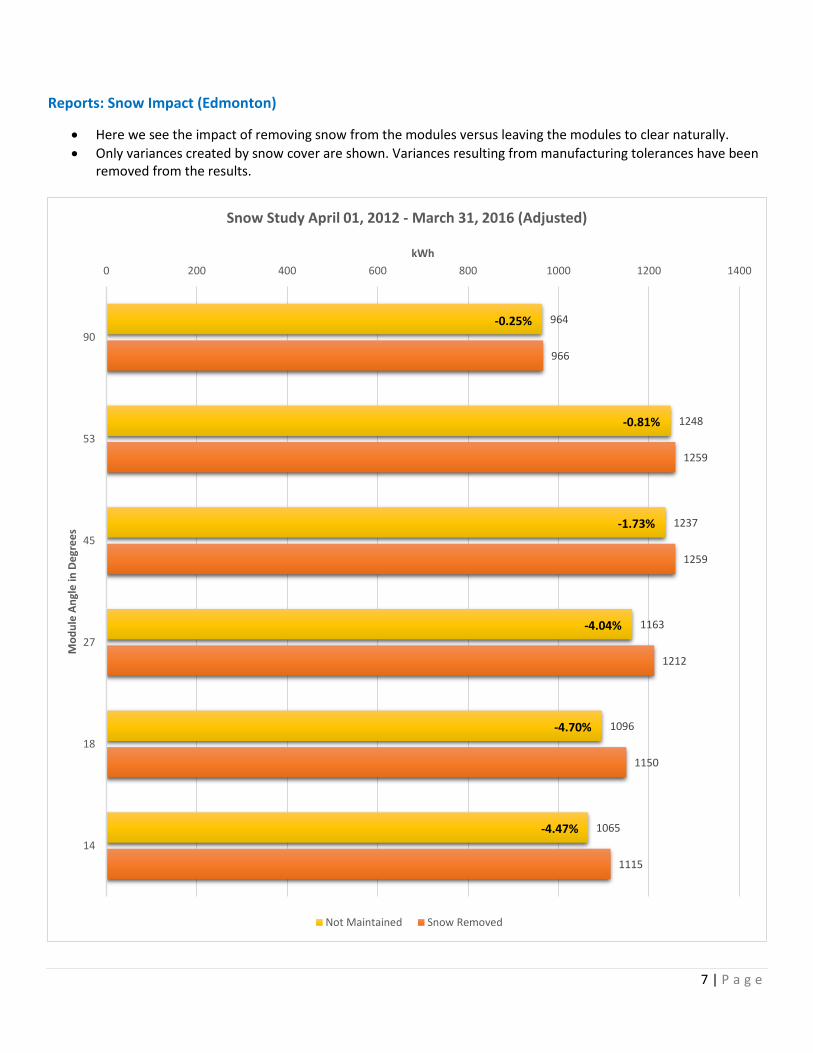
Reports: Snow Impact (Edmonton)
Here we see the impact of removing snow from the modules versus leaving the modules to clear naturally.
Only variances created by snow cover are shown. Variances resulting from manufacturing tolerances have been removed from the results.
964
1248
1237
1163
1096
1065
966
1259
1259
1212
1150
1115
0 200 400 600 800 1000 1200 1400
90
53
45
27
18
14
kWh
Mo
du
le A
ngl
e in
De
gre
es
Snow Study April 01, 2012 - March 31, 2016 (Adjusted)
Not Maintained Snow Removed
-0.25%
-0.81%
-1.73%
-4.04%
-4.70%
-4.47%
8 | P a g e
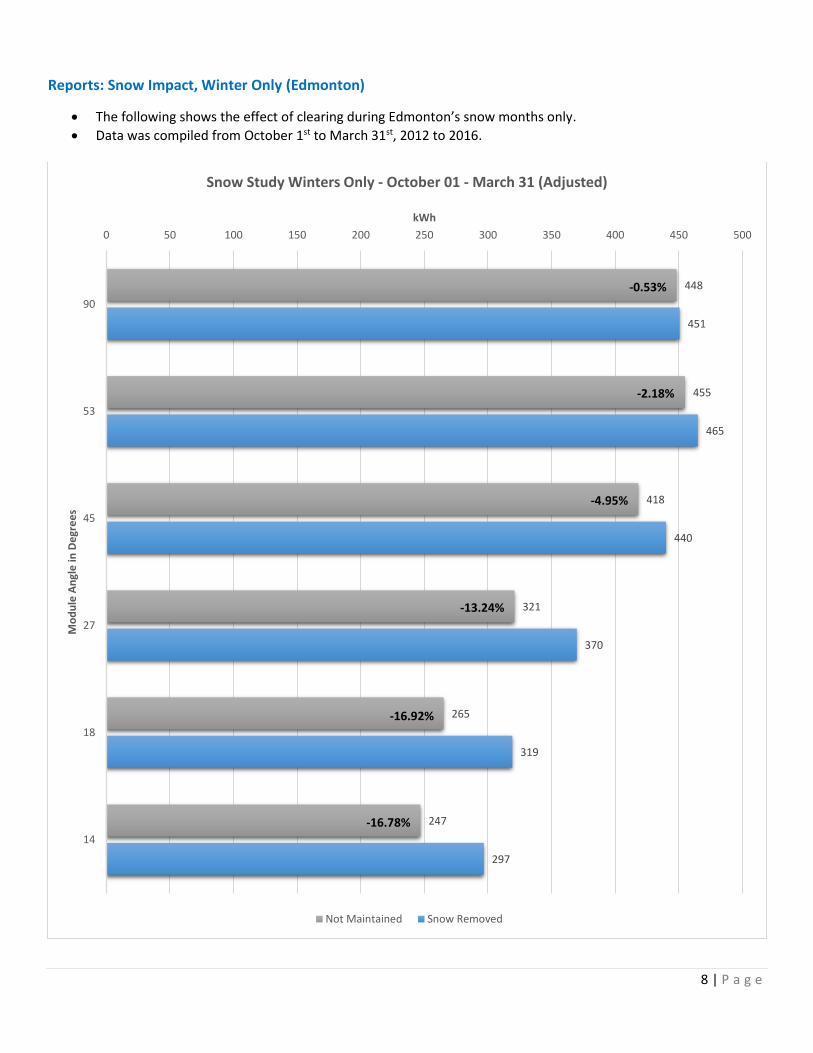
Reports: Snow Impact, Winter Only (Edmonton)
The following shows the effect of clearing during Edmonton’s snow months only.
Data was compiled from October 1st to March 31st, 2012 to 2016.
448
455
418
321
265
247
451
465
440
370
319
297
0 50 100 150 200 250 300 350 400 450 500
90
53
45
27
18
14
kWh
Mo
du
le A
ngl
e in
De
gre
es
Snow Study Winters Only - October 01 - March 31 (Adjusted)
Not Maintained Snow Removed
-0.53%
-2.18%
-16.92%
-4.95%
-13.24%
-16.78%
9 | P a g e
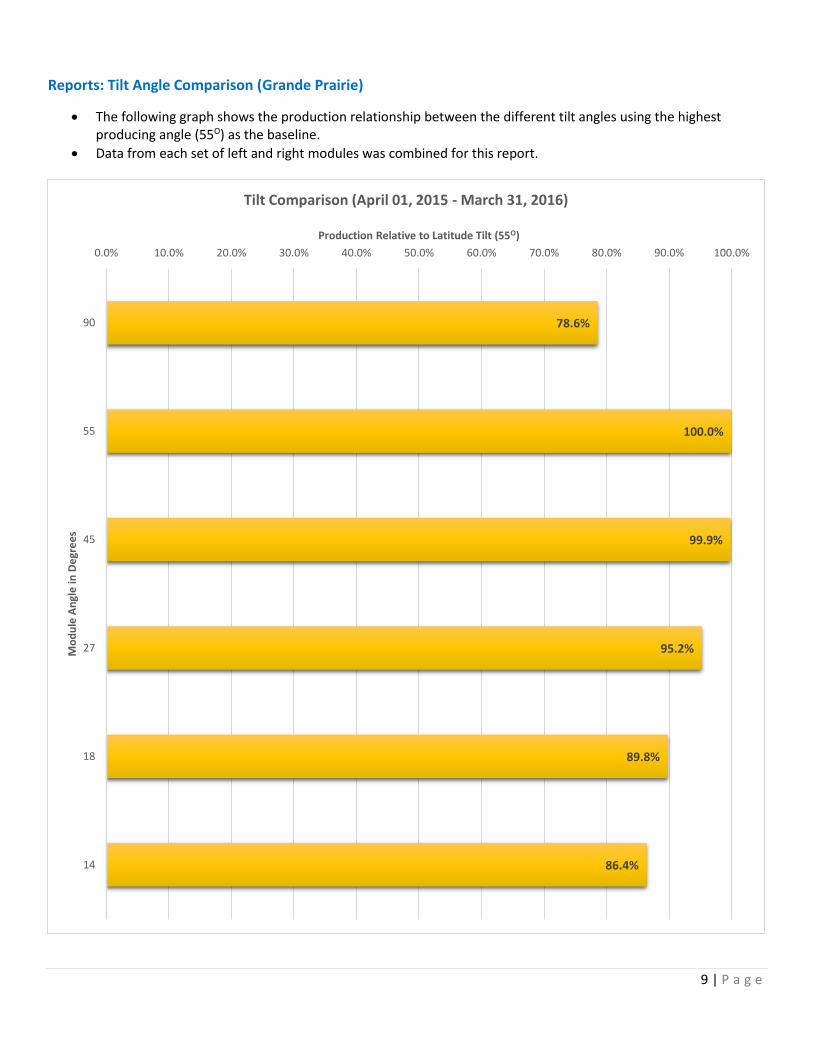
Reports: Tilt Angle Comparison (Grande Prairie)
The following graph shows the production relationship between the different tilt angles using the highest producing angle (55O) as the baseline.
Data from each set of left and right modules was combined for this report.
78.6%
100.0%
99.9%
95.2%
89.8%
86.4%
0.0% 10.0% 20.0% 30.0% 40.0% 50.0% 60.0% 70.0% 80.0% 90.0% 100.0%
90
55
45
27
18
14
Production Relative to Latitude Tilt (55O)
Mo
du
le A
ngl
e in
De
gre
es
Tilt Comparison (April 01, 2015 - March 31, 2016)
10 | P a g e
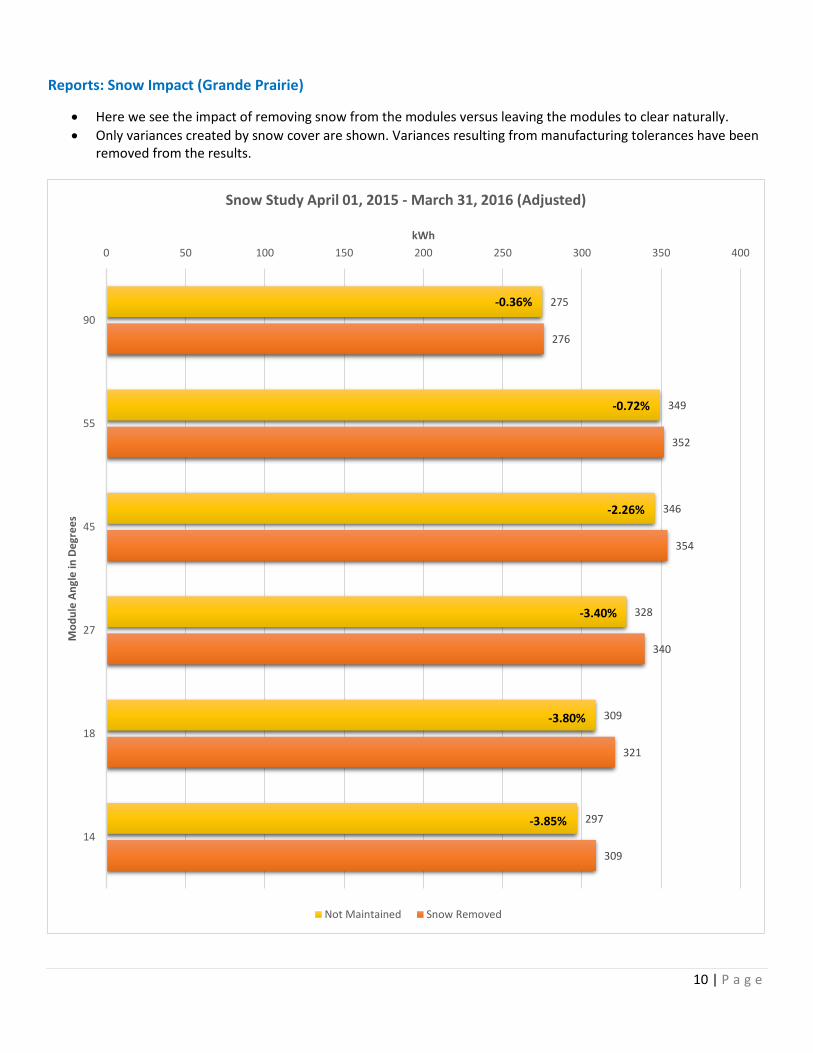
Reports: Snow Impact (Grande Prairie)
Here we see the impact of removing snow from the modules versus leaving the modules to clear naturally.
Only variances created by snow cover are shown. Variances resulting from manufacturing tolerances have been removed from the results.
275
349
346
328
309
297
276
352
354
340
321
309
0 50 100 150 200 250 300 350 400
90
55
45
27
18
14
kWh
Mo
du
le A
ngl
e in
De
gre
es
Snow Study April 01, 2015 - March 31, 2016 (Adjusted)
Not Maintained Snow Removed
-0.36%
-0.72%
-2.26%
-3.40%
-3.80%
-3.85%
11 | P a g e
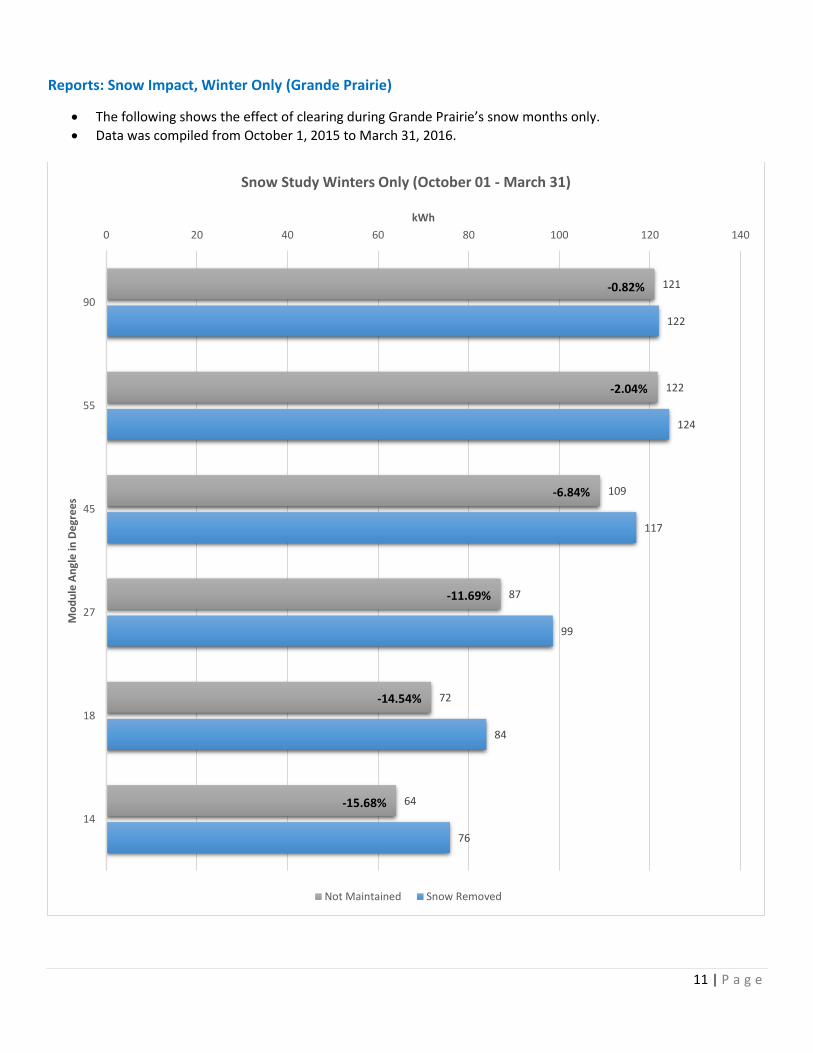
Reports: Snow Impact, Winter Only (Grande Prairie)
The following shows the effect of clearing during Grande Prairie’s snow months only.
Data was compiled from October 1, 2015 to March 31, 2016.
121
122
109
87
72
64
122
124
117
99
84
76
0 20 40 60 80 100 120 140
90
55
45
27
18
14
kWh
Mo
du
le A
ngl
e in
De
gre
es
Snow Study Winters Only (October 01 - March 31)
Not Maintained Snow Removed
-0.82%
-2.04%
-14.54%
-6.84%
-11.69%
-15.68%