Embed Size (px)
DESCRIPTION
NORTHERN CAPE EDUCATION DEPARTMENT CONDITIONAL GRANTS. EXPENDITURE AND PERFORMANCE 24 August 2010. BUDGET ALLOCATIONS FOR CONDITIONAL GRANTS FOR THE 2009/10 FINANCIAL YEAR. BUDGET AND EXPENDITURE FOR CONDITIONAL GRANTS FOR THE 2009/10 FINANCIAL YEAR (AUDITED). - PowerPoint PPT Presentation
Citation preview

NORTHERN CAPE EDUCATION DEPARTMENT
CONDITIONAL GRANTS
EXPENDITURE AND PERFORMANCE
24 August 2010
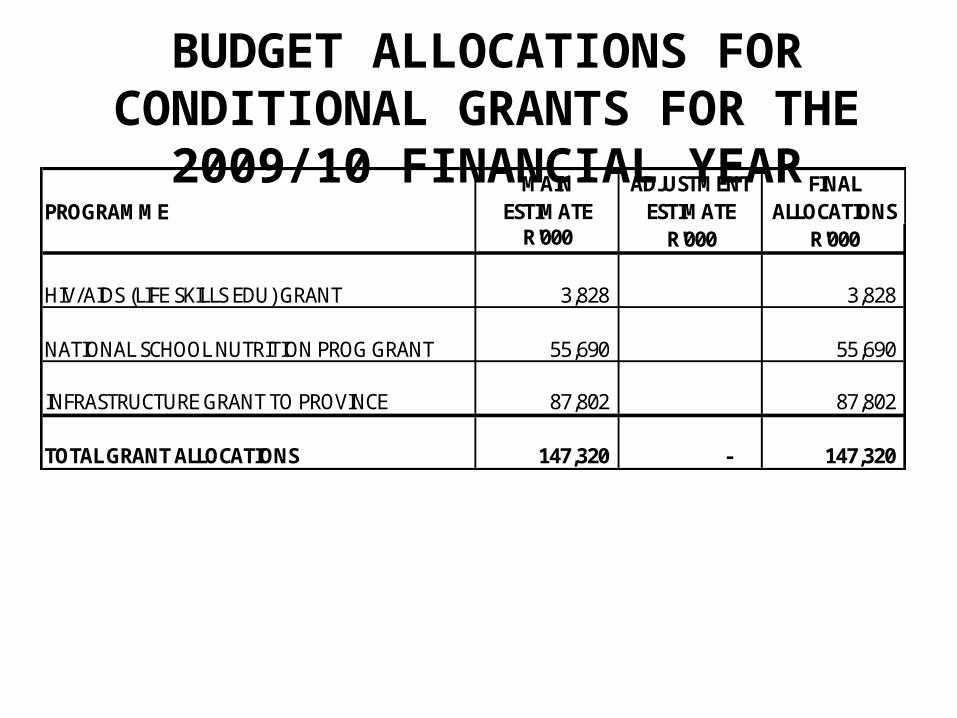
BUDGET ALLOCATIONS FOR CONDITIONAL GRANTS FOR THE 2009/10 FINANCIAL YEAR
PROGRAMMEMAIN
ESTIMATEADJUSTMENT
ESTIMATEFINAL
ALLOCATIONSR'000 R'000 R'000
HIV/AIDS (LIFE SKILLS EDU) GRANT 3,828 3,828
NATIONAL SCHOOL NUTRITION PROG GRANT 55,690 55,690
INFRASTRUCTURE GRANT TO PROVINCE 87,802 87,802
TOTAL GRANT ALLOCATIONS 147,320 - 147,320

BUDGET AND EXPENDITURE FOR CONDITIONAL GRANTS FOR THE 2009/10 FINANCIAL YEAR (AUDITED)
3
PROGRAMMEFINAL
ALLOCATIONS EXPENDITURE VARIANCE %SPENTR'000 R'000 R'000
HIV/AIDS (LIFE SKILLS EDU) GRANT 3,828 3,680 148 96.13%
NATIONAL SCHOOL NUTRITION PROG GRANT 55,690 55,690 - 100.00%
INFRASTRUCTURE GRANT TO PROVINCE 87,802 87,802 - 100.00%
TOTAL GRANT ALLOCATIONS 147,320 147,172 148 99.90%
2009/10 CONDITIONAL GRANT BUDGET ALLOCATIONS
PROGRAMME MAIN ESTIMATEADJUSTMENT
ESTIMATEFINAL
ALLOCATIONSR'000 R'000 R'000
HIV/AIDS (LIFE SKILLS EDU) GRANT 3,828 3,828
NATIONAL SCHOOL NUTRITION PROG GRANT 55,690 55,690
INFRASTRUCTURE GRANT TO PROVINCE 87,802 87,802
TOTAL GRANT ALLOCATIONS 147,320 - 147,320
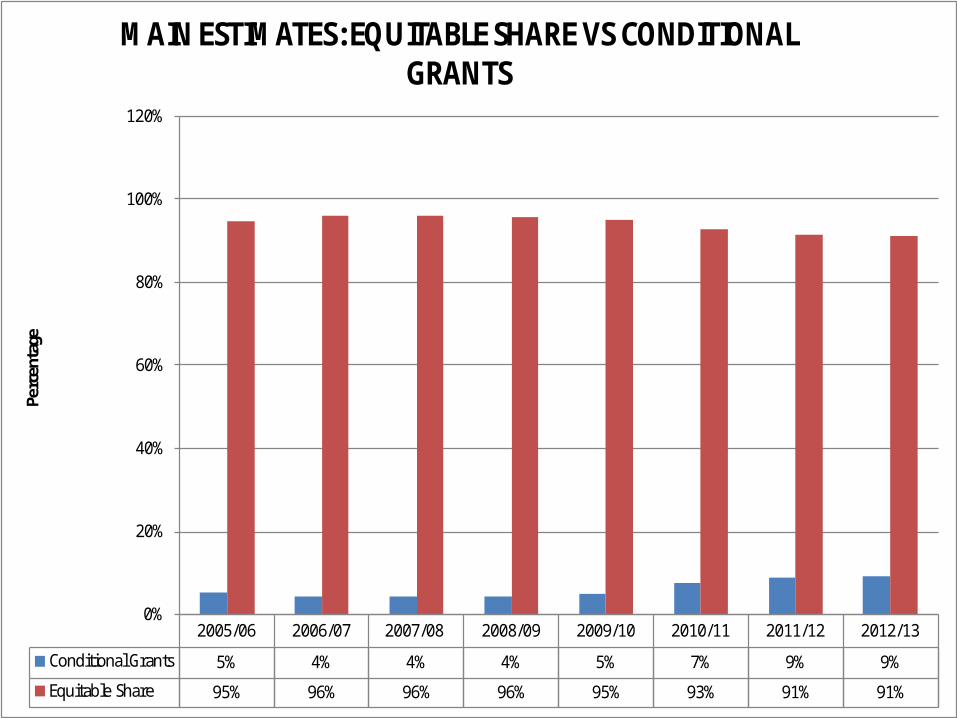
2005/06 2006/07 2007/08 2008/09 2009/10 2010/11 2011/12 2012/13
Conditional Grants 5% 4% 4% 4% 5% 7% 9% 9%
Equitable Share 95% 96% 96% 96% 95% 93% 91% 91%
0%
20%
40%
60%
80%
100%
120%
Perc
enta
ge
MAIN ESTIMATES: EQUITABLE SHARE VS CONDITIONAL GRANTS

2,75
7
29,6
47
27,8
12
3,92
2
37,1
32 48
,098
3,64
8
48,4
83
52,3
52
3,82
8
55,6
90
87,8
02
-
10,000
20,000
30,000
40,000
50,000
60,000
70,000
80,000
90,000
100,000
HIV/AIDS Food Security Infrastructure
CONDITIONAL GRANT ALLOCATIONS FROM 2006/07 - 2009/10
2006/07
2007/08
2008/09
2009/10
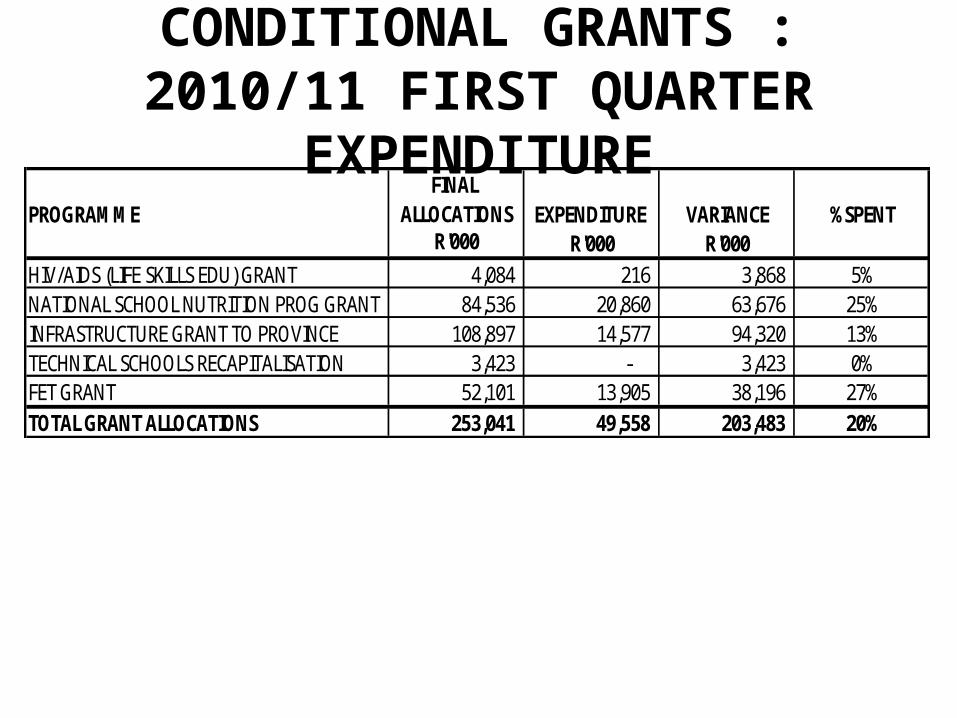
CONDITIONAL GRANTS : 2010/11 FIRST QUARTER EXPENDITURE
PROGRAMMEFINAL
ALLOCATIONS EXPENDITURE VARIANCE %SPENTR'000 R'000 R'000
HIV/AIDS (LIFE SKILLS EDU) GRANT 4,084 216 3,868 5%NATIONAL SCHOOL NUTRITION PROG GRANT 84,536 20,860 63,676 25%INFRASTRUCTURE GRANT TO PROVINCE 108,897 14,577 94,320 13%TECHNICAL SCHOOLS RECAPITALISATION 3,423 - 3,423 0%FET GRANT 52,101 13,905 38,196 27%TOTAL GRANT ALLOCATIONS 253,041 49,558 203,483 20%

HIV/AIDS
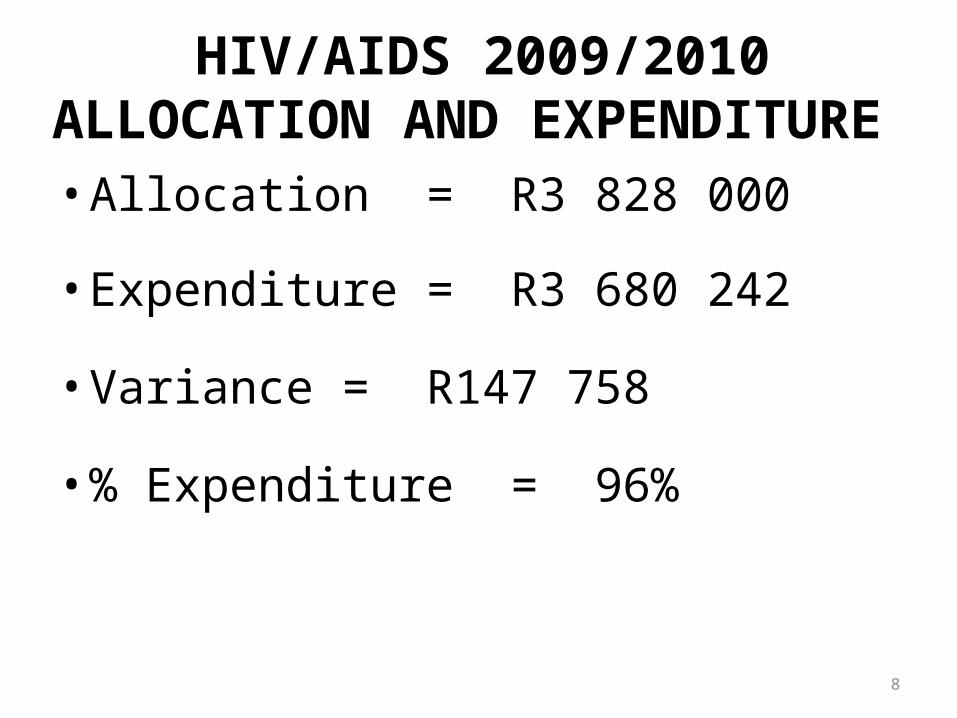
HIV/AIDS 2009/2010 ALLOCATION AND EXPENDITURE
8
• Allocation = R3 828 000
• Expenditure = R3 680 242
• Variance = R147 758
• % Expenditure = 96%
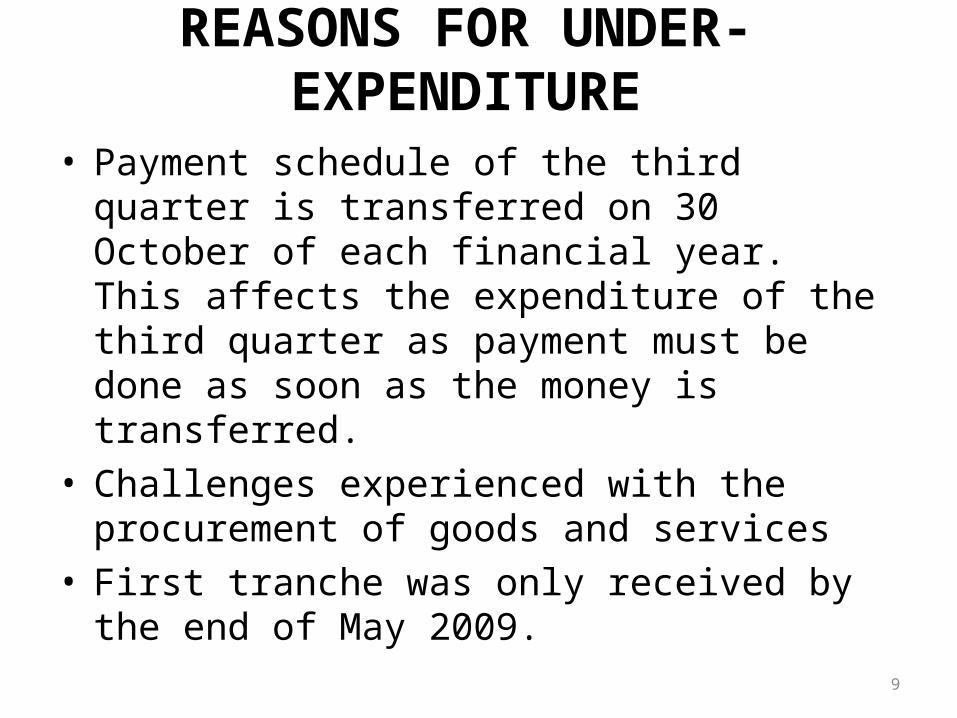
REASONS FOR UNDER-EXPENDITURE
• Payment schedule of the third quarter is transferred on 30 October of each financial year. This affects the expenditure of the third quarter as payment must be done as soon as the money is transferred.
• Challenges experienced with the procurement of goods and services
• First tranche was only received by the end of May 2009.
9
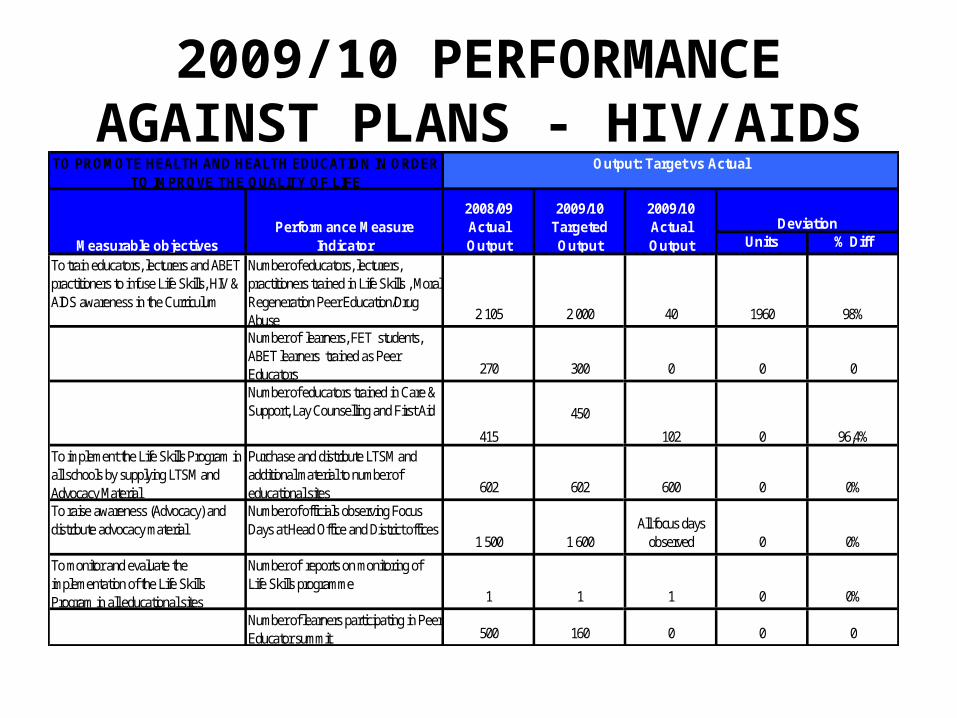
2009/10 PERFORMANCE AGAINST PLANS - HIV/AIDS
Units % Diff
To train educators, lecturers and ABET practitioners to infuse Life Skills, HIV & AIDS awareness in the Curriculum
Number of educators, lecturers, practitioners trained in Life Skills , Moral Regeneration Peer Education/Drug Abuse 2 105 2 000 40 1960 98%
Number of learners, FET students, ABET learners trained as Peer Educators 270 300 0 0 0
450
To implement the Life Skills Program in all schools by supplying LTSM and Advocacy Material
Purchase and distribute LTSM and additional material to number of educational sites 602 602 600 0 0%
To raise awareness (Advocacy) and distribute advocacy material
Number of officials observing Focus Days at Head Office and District offices
1 500 1 600All focus days
observed 0 0%
To monitor and evaluate the implementation of the Life Skills Program in all educational sites
Number of reports on monitoring of Life Skills programme
1 1 1 0 0%
Number of learners participating in Peer Educator summit 500 160 0 0 0
0 96,4%
Number of educators trained in Care & Support, Lay Counselling and First Aid
415 102
TO PROMOTE HEALTH AND HEALTH EDUCATION IN ORDER TO IMPROVE THE QUALITY OF LIFE
Output: Target vs Actual
Measurable objectivesPerformance Measure
Indicator
2008/09 Actual Output
2009/10 Targeted Output
2009/10 Actual Output
Deviation
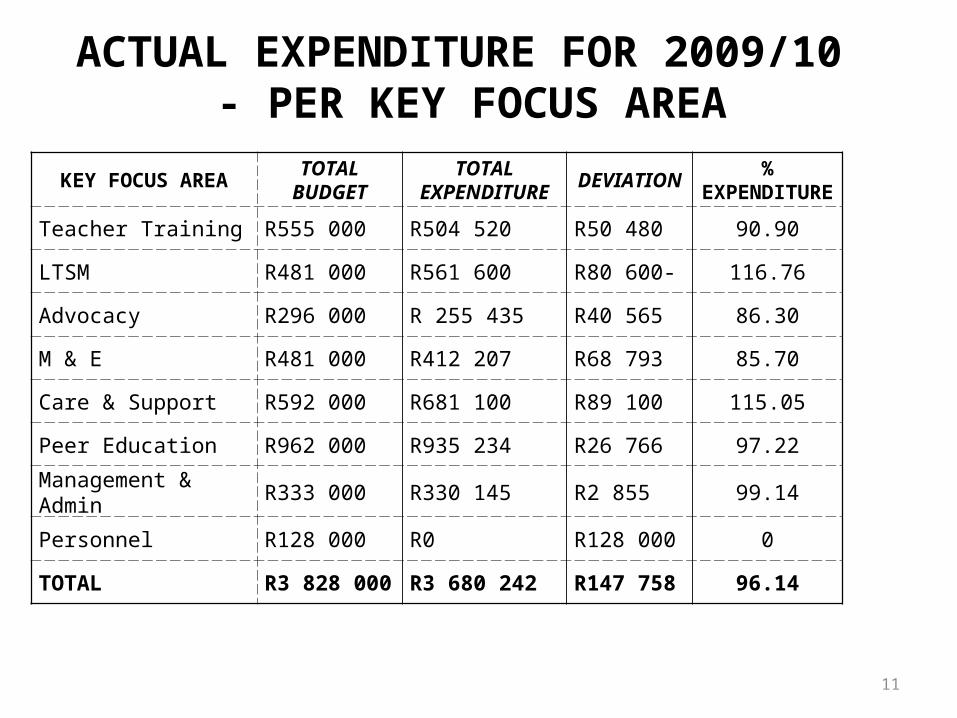
ACTUAL EXPENDITURE FOR 2009/10 - PER KEY FOCUS AREA
11
KEY FOCUS AREA TOTAL BUDGET TOTAL EXPENDITURE DEVIATION %
EXPENDITURE
Teacher Training R555 000 R504 520 R50 480 90.90
LTSM R481 000 R561 600 R80 600- 116.76
Advocacy R296 000 R 255 435 R40 565 86.30
M & E R481 000 R412 207 R68 793 85.70
Care & Support R592 000 R681 100 R89 100 115.05
Peer Education R962 000 R935 234 R26 766 97.22
Management & Admin R333 000 R330 145 R2 855 99.14
Personnel R128 000 R0 R128 000 0
TOTAL R3 828 000 R3 680 242 R147 758 96.14
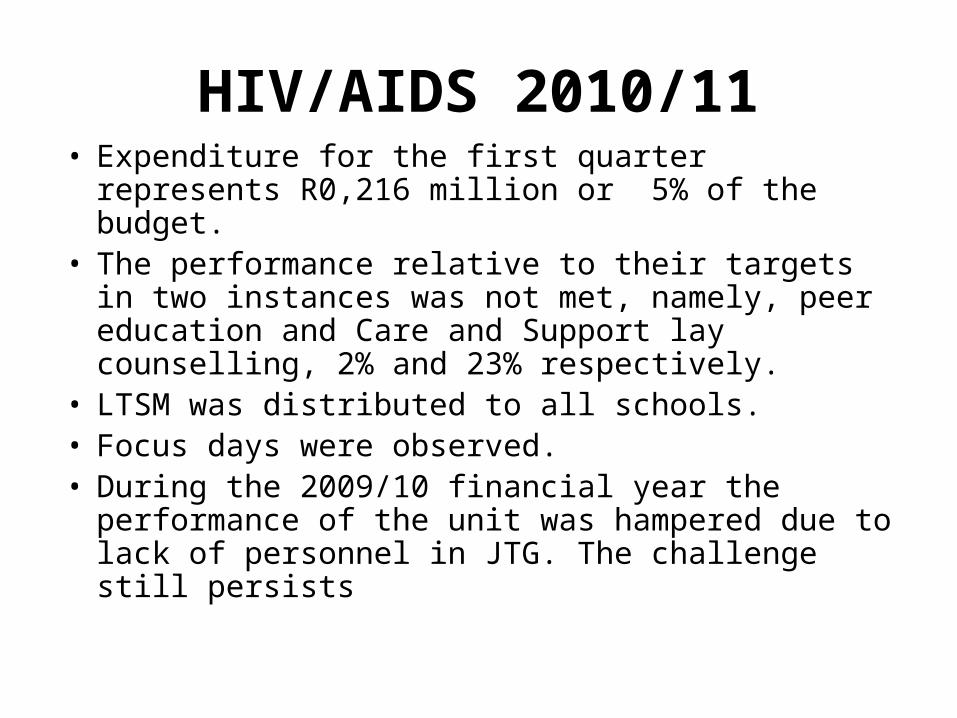
HIV/AIDS 2010/11• Expenditure for the first quarter represents R0,216
million or 5% of the budget.• The performance relative to their targets in two
instances was not met, namely, peer education and Care and Support lay counselling, 2% and 23% respectively.
• LTSM was distributed to all schools.• Focus days were observed.• During the 2009/10 financial year the performance of
the unit was hampered due to lack of personnel in JTG. The challenge still persists
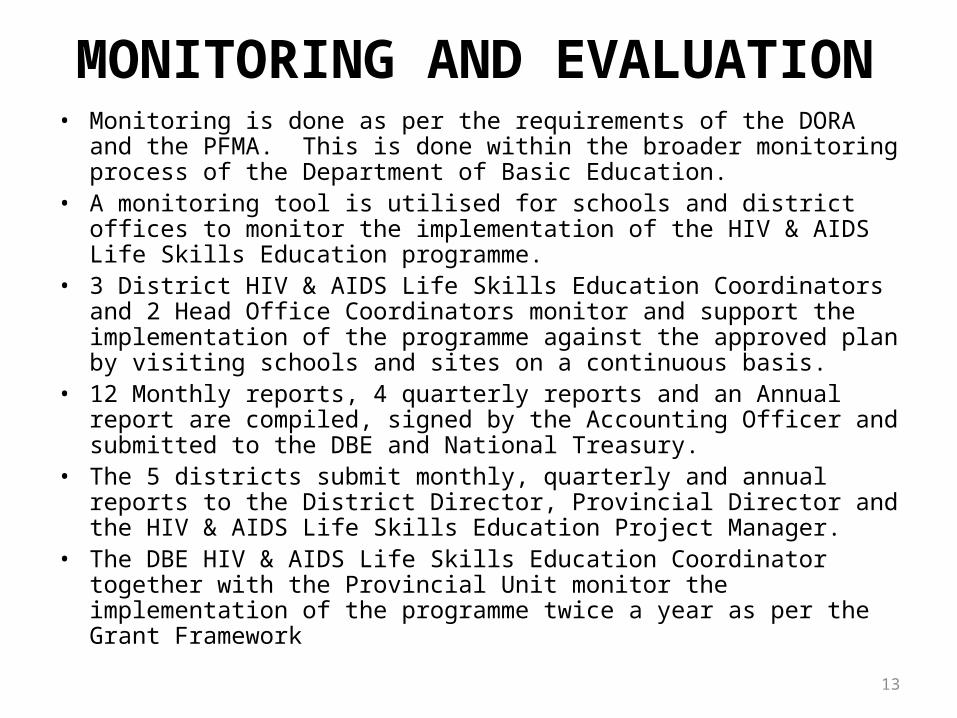
MONITORING AND EVALUATION• Monitoring is done as per the requirements of the DORA and the PFMA.
This is done within the broader monitoring process of the Department of Basic Education.
• A monitoring tool is utilised for schools and district offices to monitor the implementation of the HIV & AIDS Life Skills Education programme.
• 3 District HIV & AIDS Life Skills Education Coordinators and 2 Head Office Coordinators monitor and support the implementation of the programme against the approved plan by visiting schools and sites on a continuous basis.
• 12 Monthly reports, 4 quarterly reports and an Annual report are compiled, signed by the Accounting Officer and submitted to the DBE and National Treasury.
• The 5 districts submit monthly, quarterly and annual reports to the District Director, Provincial Director and the HIV & AIDS Life Skills Education Project Manager.
• The DBE HIV & AIDS Life Skills Education Coordinator together with the Provincial Unit monitor the implementation of the programme twice a year as per the Grant Framework
13

MONITORING AND EVALUATION• A provincial evaluation team consisting of officials responsible for the
different conditional grants conduct pre-evaluation visits to 10-20 schools before the final evaluation by the DBE before the end of each financial year.
• Evaluation reports are compiled by the provincial evaluation team before the end of each financial year.
14
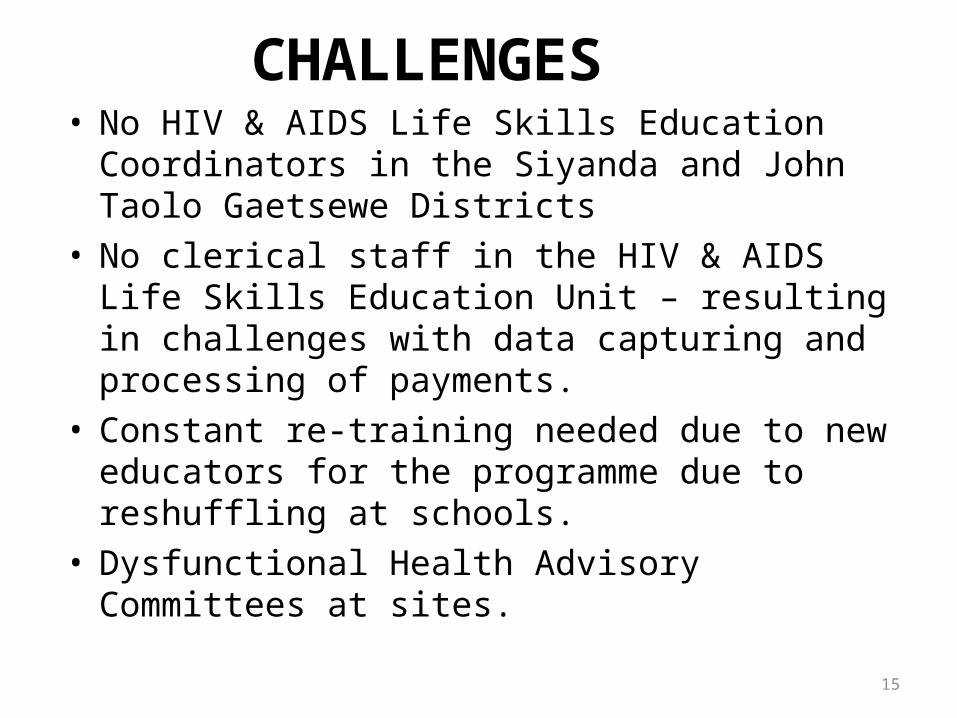
CHALLENGES• No HIV & AIDS Life Skills Education Coordinators in
the Siyanda and John Taolo Gaetsewe Districts• No clerical staff in the HIV & AIDS Life Skills
Education Unit – resulting in challenges with data capturing and processing of payments.
• Constant re-training needed due to new educators for the programme due to reshuffling at schools.
• Dysfunctional Health Advisory Committees at sites.
15

HIV/AIDS 2010/2011 FIRST QUARTER EXPENDITURE
16
• Allocation = R4,084 million
• Expenditure = R0,216 million
• Variance = R3,868 million
• % Expenditure = 5%
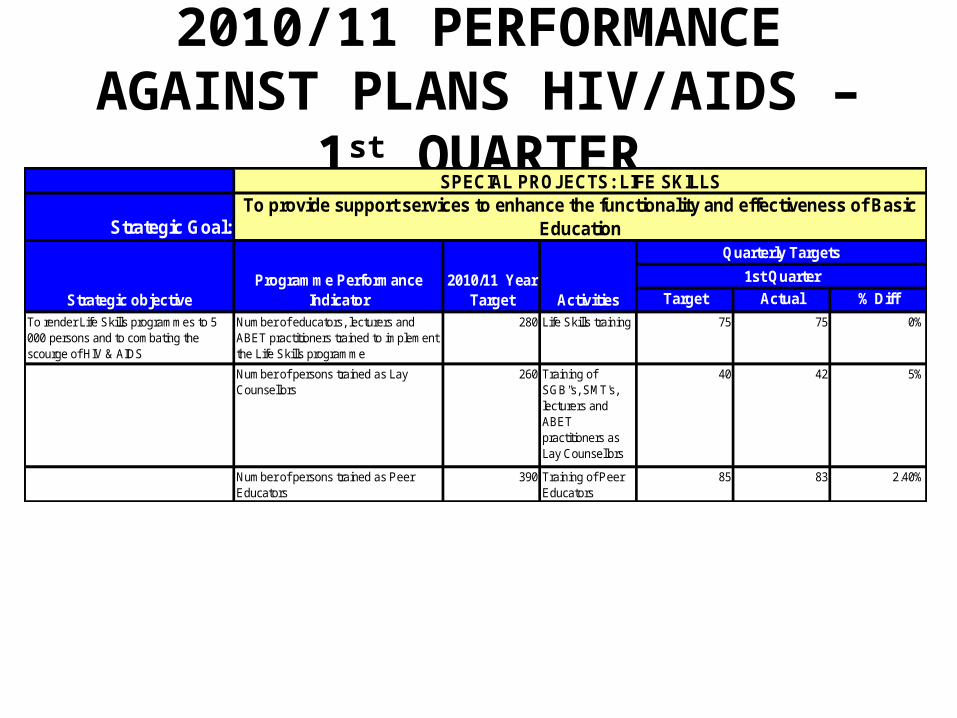
2010/11 PERFORMANCE AGAINST PLANS HIV/AIDS – 1st QUARTER
Strategic Goal:
Target Actual % Diff
To render Life Skills programmes to 5 000 persons and to combating the scourge of HIV & AIDS
Number of educators, lecturers and ABET practitioners trained to implement the Life Skills programme
280 Life Skills training 75 75 0%
Number of persons trained as Lay Counsellors
260 Training of SGB''s, SMT's, lecturers and ABET practitioners as Lay Counsellors
40 42 5%
Number of persons trained as Peer Educators
390 Training of Peer Educators
85 83 2.40%
1st Quarter
To provide support services to enhance the functionality and effectiveness of Basic Education
SPECIAL PROJECTS: LIFE SKILLS
Strategic objectiveProgramme Performance
Indicator2010/11 Year
Target Activities
Quarterly Targets

HIV/AIDS – 2010/11 FIRST QUARTER
• Programme is achieving its targets i.t.o number of persons trained as peer educators, lay counsellors and as life skills implementers

SCHOOL NUTRITION PROGRAMME
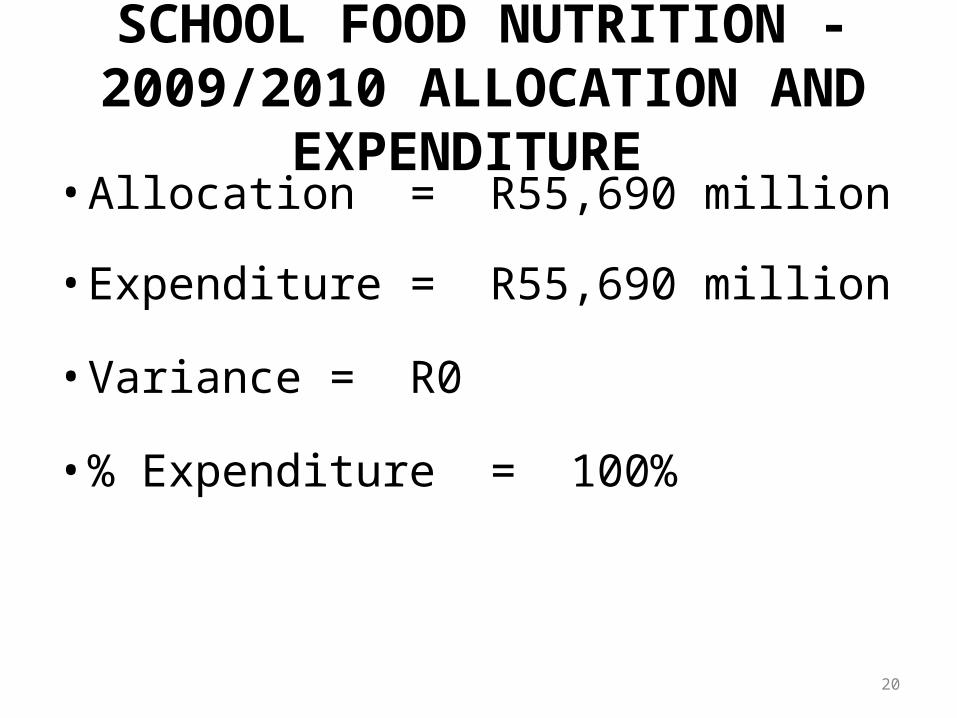
SCHOOL FOOD NUTRITION - 2009/2010 ALLOCATION AND EXPENDITURE
20
• Allocation = R55,690 million
• Expenditure = R55,690 million
• Variance = R0
• % Expenditure = 100%
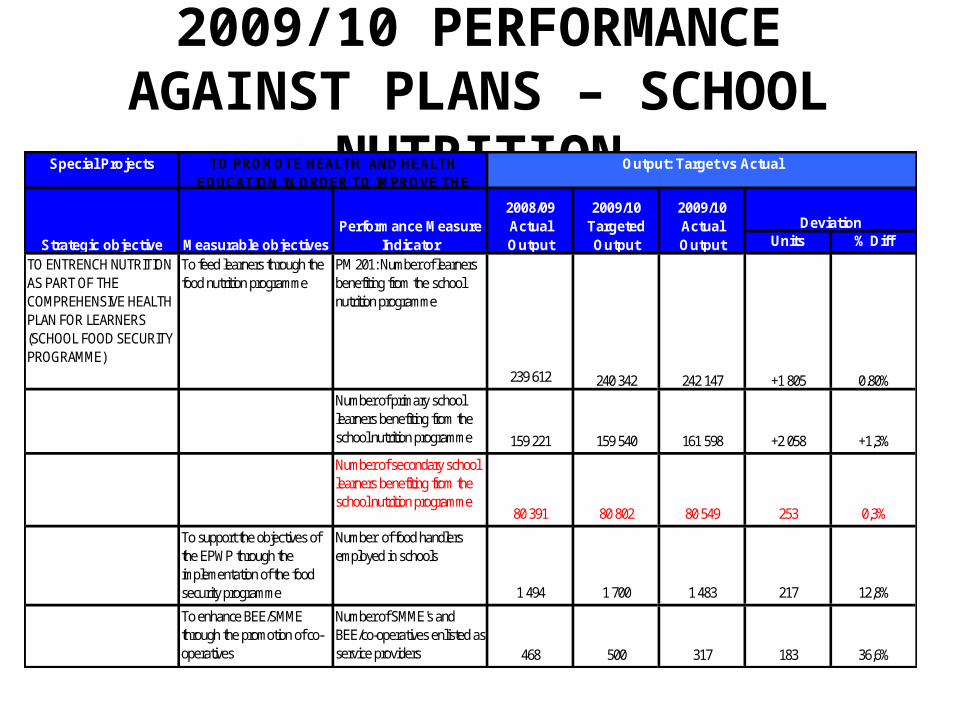
2009/10 PERFORMANCE AGAINST PLANS – SCHOOL NUTRITION
Special Projects
Units % Diff
239 612
Number of primary school learners benefiting from the school nutrition programme 159 221 159 540 161 598 +2 058 +1,3%
Number of secondary school learners benefiting from the school nutrition programme
80 391 80 802 80 549 253 0,3%
To support the objectives of the EPWP through the implementation of the food security programme
Number of food handlers employed in schools
1 494 1 700 1 483 217 12,8%
To enhance BEE/SMME through the promotion of co-operatives
Number of SMME's and BEE/co-operatives enlisted as service providers 468 500 317 183 36,6%
TO PROMOTE HEALTH AND HEALTH EDUCATION IN ORDER TO IMPROVE THE
Output: Target vs Actual
Deviation
240 342
2009/10 Actual Output
TO ENTRENCH NUTRITION AS PART OF THE COMPREHENSIVE HEALTH PLAN FOR LEARNERS (SCHOOL FOOD SECURITY PROGRAMME)
To feed learners through the food nutrition programme
PM 201: Number of learners benefiting from the school nutrition programme
242 147 +1 805 0.80%
Strategic objective Measurable objectivesPerformance Measure
Indicator
2008/09 Actual Output
2009/10 Targeted Output
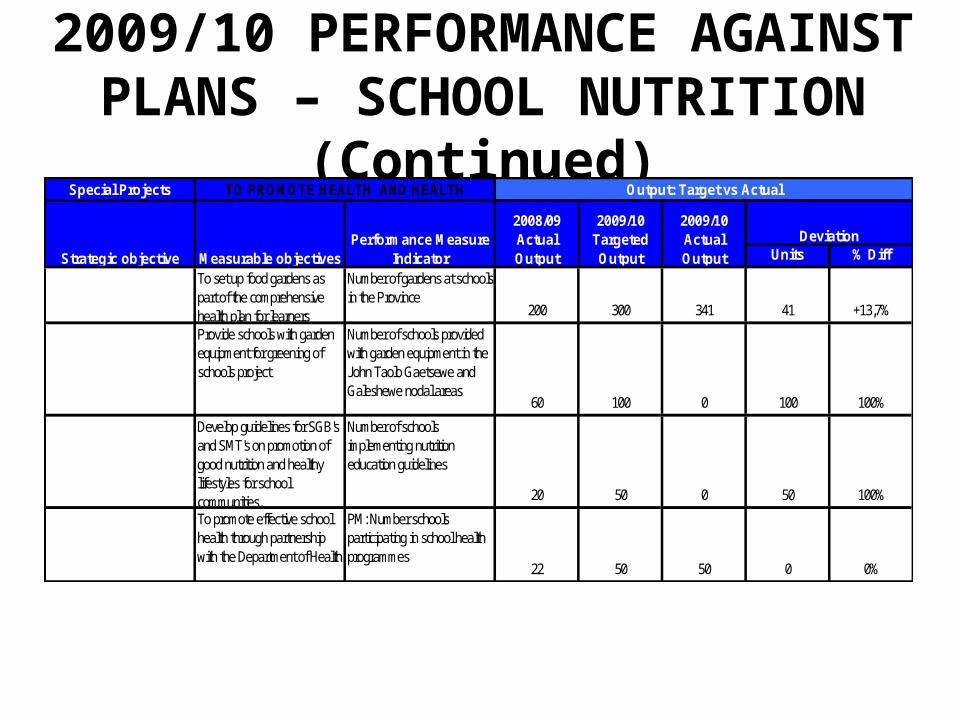
2009/10 PERFORMANCE AGAINST PLANS – SCHOOL NUTRITION
(Continued)Special Projects
Units % Diff
To set up food gardens as part of the comprehensive health plan for learners
Number of gardens at schools in the Province
200 300 341 41 +13,7%
Provide schools with garden equipment for greening of schools project
Number of schools provided with garden equipment in the John Taolo Gaetsewe and Galeshewe nodal areas
60 100 0 100 100%
Develop guidelines for SGB's and SMT's on promotion of good nutrition and healthy lifestyles for school communities.
Number of schools implementing nutrition education guidelines
20 50 0 50 100%
To promote effective school health through partnership with the Department of Health
PM: Number schools participating in school health programmes
22 50 50 0 0%
TO PROMOTE HEALTH AND HEALTH EDUCATION IN ORDER TO IMPROVE THE
Output: Target vs Actual
Strategic objective Measurable objectivesPerformance Measure
Indicator
2008/09 Actual Output
2009/10 Targeted Output
2009/10 Actual Output
Deviation
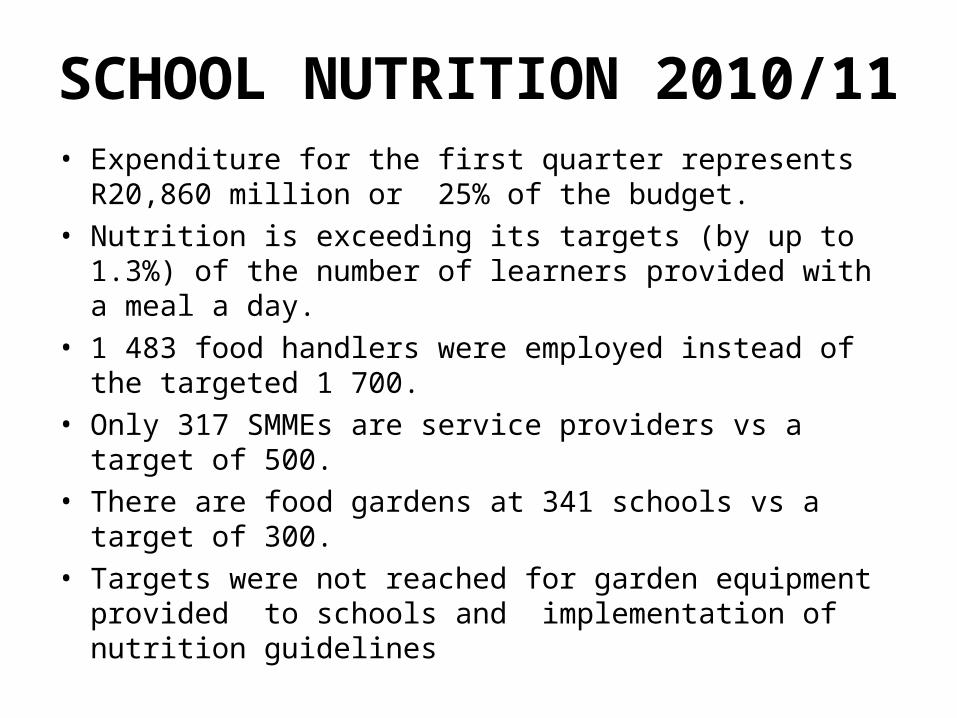
SCHOOL NUTRITION 2010/11• Expenditure for the first quarter represents R20,860 million
or 25% of the budget.• Nutrition is exceeding its targets (by up to 1.3%) of the
number of learners provided with a meal a day.• 1 483 food handlers were employed instead of the targeted 1
700.• Only 317 SMMEs are service providers vs a target of 500.• There are food gardens at 341 schools vs a target of 300.• Targets were not reached for garden equipment provided to
schools and implementation of nutrition guidelines
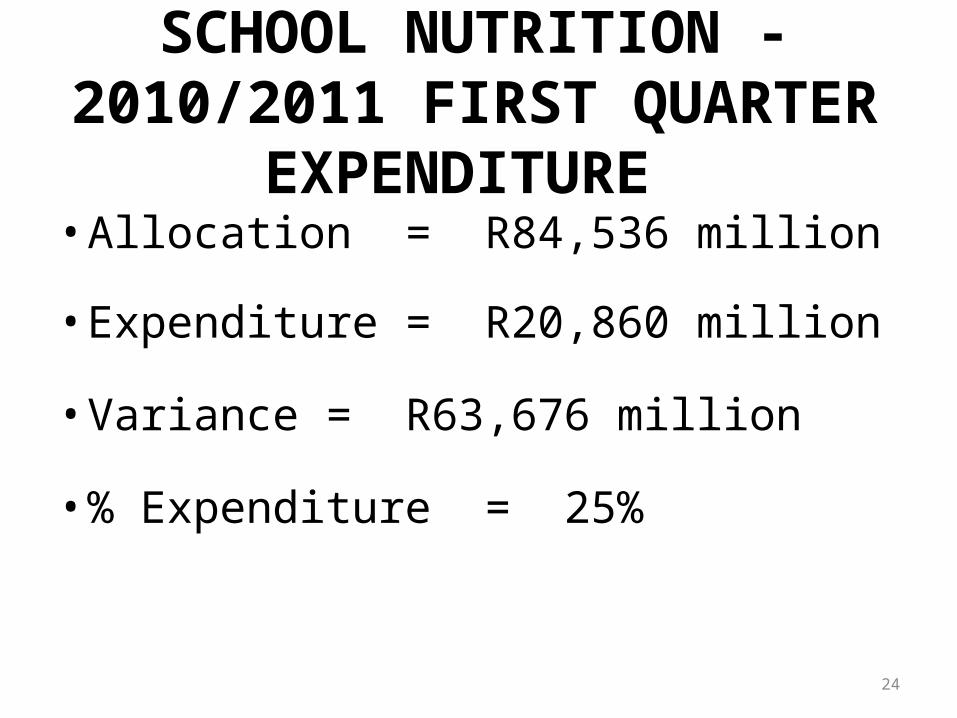
SCHOOL NUTRITION - 2010/2011 FIRST QUARTER EXPENDITURE
24
• Allocation = R84,536 million
• Expenditure = R20,860 million
• Variance = R63,676 million
• % Expenditure = 25%
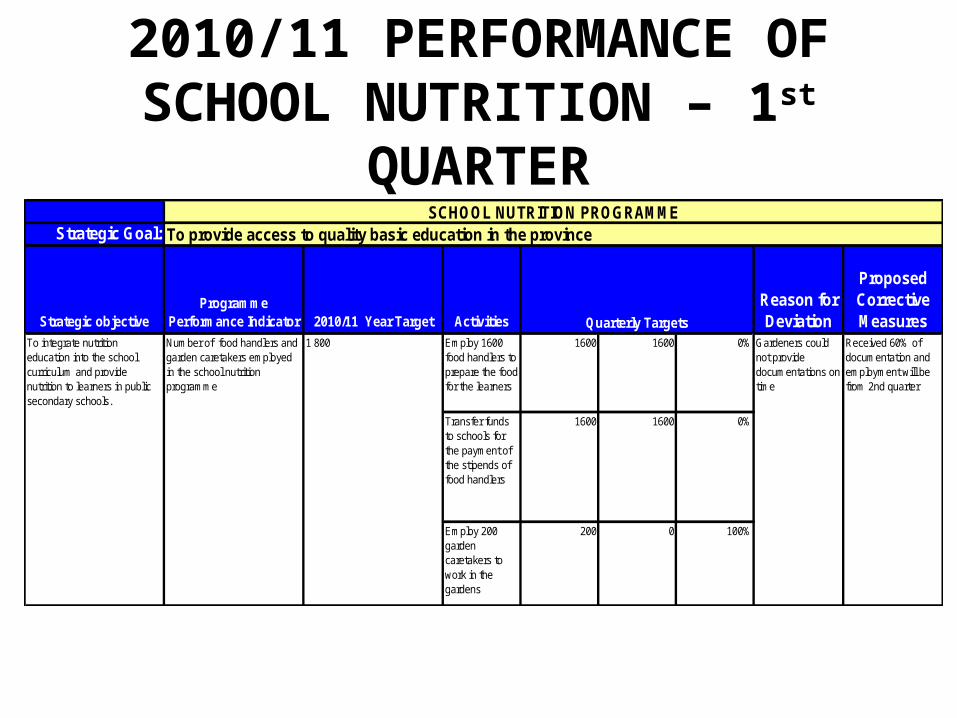
2010/11 PERFORMANCE OF SCHOOL NUTRITION – 1st QUARTER
Strategic Goal:
Strategic objectiveProgramme
Performance Indicator 2010/11 Year Target Activities
Reason for Deviation
Proposed Corrective Measures
Employ 1600 food handlers to prepare the food for the learners
1600 1600 0%
Transfer funds to schools for the payment of the stipends of food handlers
1600 1600 0%
Employ 200 garden caretakers to work in the gardens
200 0 100%
SCHOOL NUTRITION PROGRAMMETo provide access to quality basic education in the province
Quarterly TargetsTo integrate nutrition education into the school curriculum and provide nutrition to learners in public secondary schools.
Number of food handlers and garden caretakers employed in the school nutrition programme
1 800 Gardeners could not provide documentations on time
Received 60% of documentation and employment will be from 2nd quarter
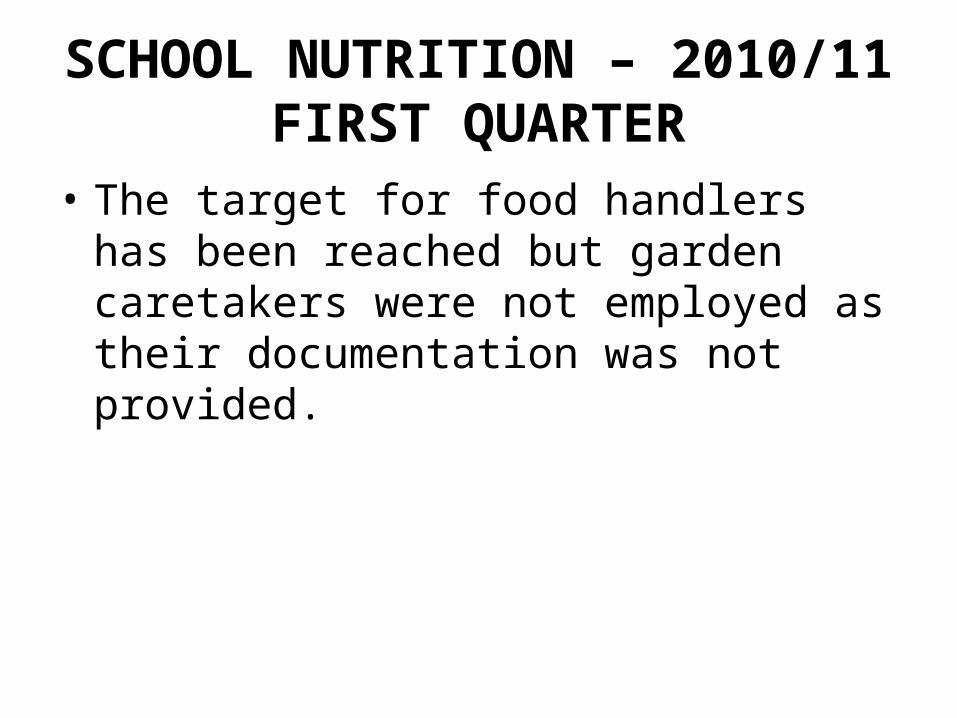
SCHOOL NUTRITION – 2010/11 FIRST QUARTER
• The target for food handlers has been reached but garden caretakers were not employed as their documentation was not provided.

INFRASTRUCTURE GRANT

INFRASTRUCTURE GRANT- 2009/2010 ALLOCATION AND EXPENDITURE
28
• Allocation = R87,802 million
• Expenditure = R87,802 million
• Variance = R0
• % Expenditure = 100%
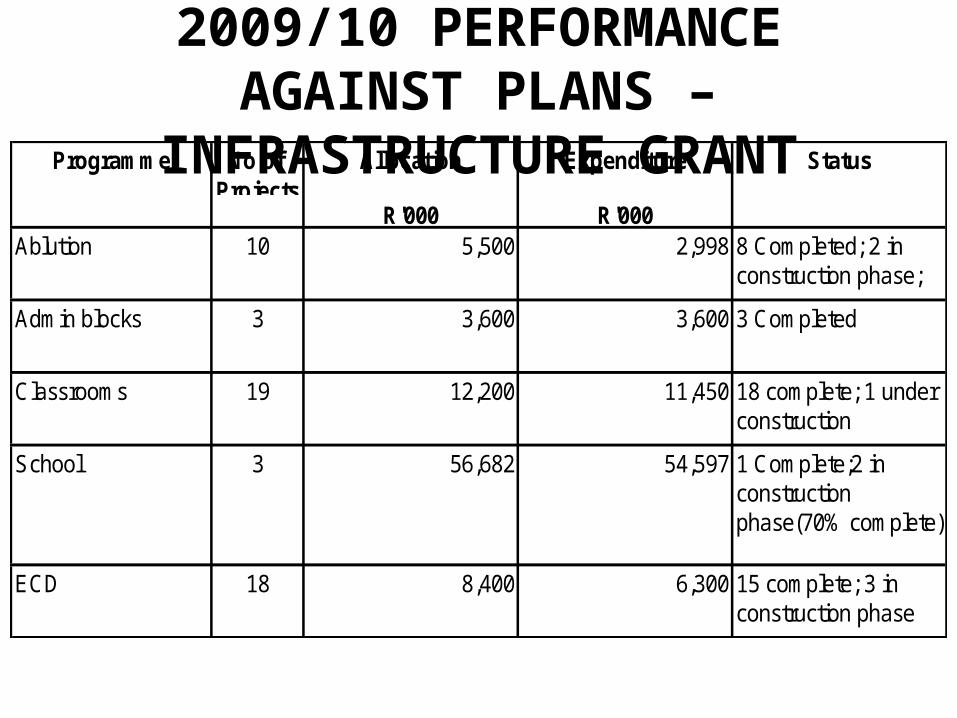
2009/10 PERFORMANCE AGAINST PLANS – INFRASTRUCTURE GRANT
Programme No of Projects
Allocation Expenditure Status
R'000 R'000Ablution 10 5,500 2,998 8 Completed; 2 in
construction phase;
Admin blocks 3 3,600 3,600 3 Completed
Classrooms 19 12,200 11,450 18 complete; 1 under construction
School 3 56,682 54,597 1 Complete;2 in construction phase(70% complete)
ECD 18 8,400 6,300 15 complete; 3 in construction phase
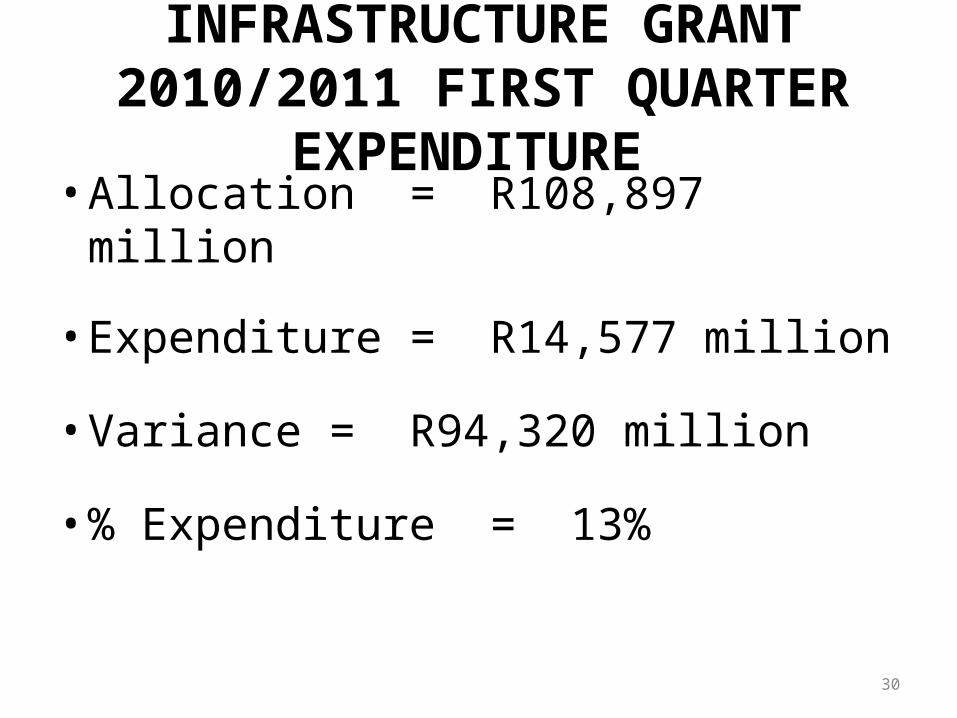
INFRASTRUCTURE GRANT 2010/2011 FIRST QUARTER EXPENDITURE
30
• Allocation = R108,897 million
• Expenditure = R14,577 million
• Variance = R94,320 million
• % Expenditure = 13%
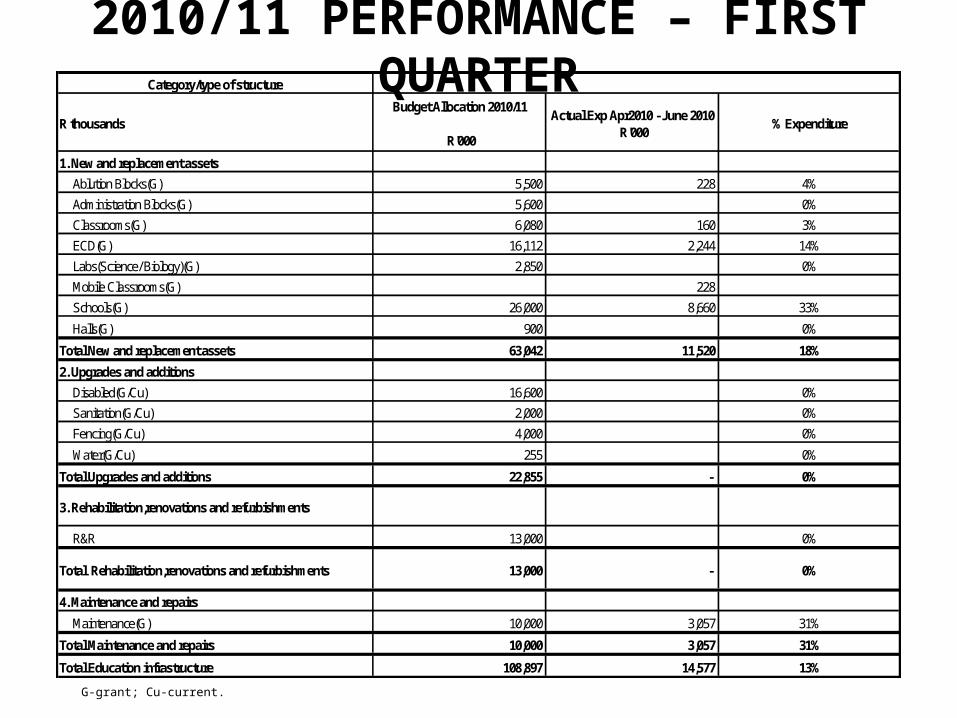
2010/11 PERFORMANCE – FIRST QUARTERCategory/type of structure
R thousandsBudget Allocation 2010/11
R'000
Actual Exp Apr2010 - June 2010 R'000
% Expenditure
1. New and replacement assets
Ablution Blocks(G) 5,500 228 4%
Administration Blocks(G) 5,600 0%
Classrooms(G) 6,080 160 3%
ECD(G) 16,112 2,244 14%
Labs(Science/ Biology)(G) 2,850 0%
Mobile Classrooms(G) 228
Schools(G) 26,000 8,660 33%
Halls(G) 900 0%
Total New and replacement assets 63,042 11,520 18%
2. Upgrades and additions
Disabled(G/Cu) 16,600 0%
Sanitation(G/Cu) 2,000 0%
Fencing(G/Cu) 4,000 0%
Water(G/Cu) 255 0%
Total Upgrades and additions 22,855 - 0%
3. Rehabilitation,renovations and refurbishments
R&R 13,000 0%
Total Rehabilitation,renovations and refurbishments 13,000 - 0%
4. Maintenance and repairs
Maintenance(G) 10,000 3,057 31%
Total Maintenance and repairs 10,000 3,057 31%
Total Education infrastructure 108,897 14,577 13%
G-grant; Cu-current.
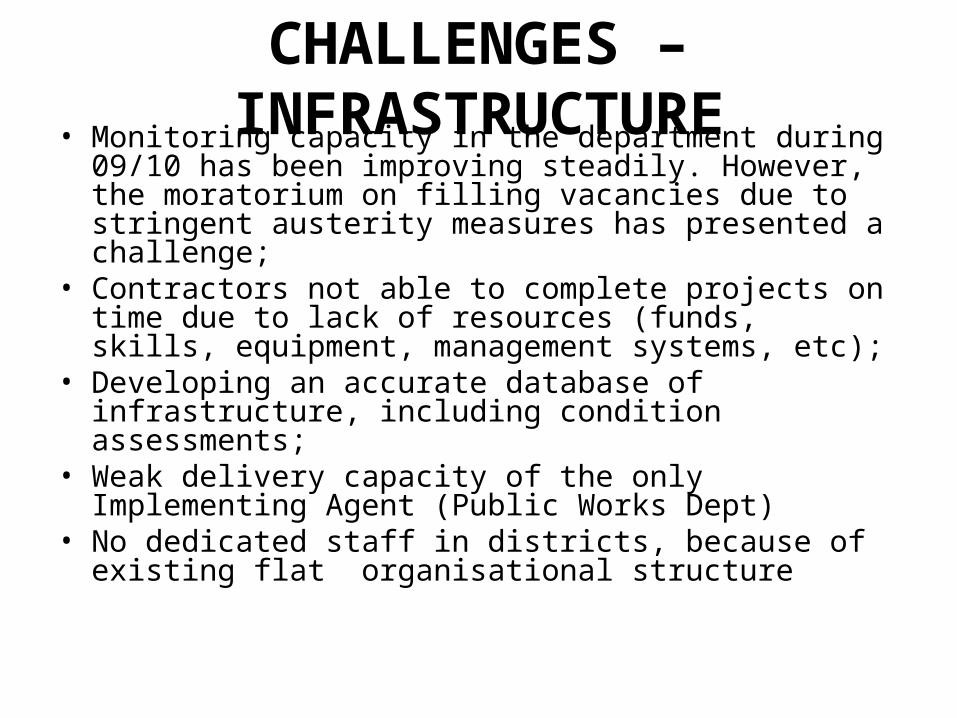
CHALLENGES – INFRASTRUCTURE• Monitoring capacity in the department during 09/10 has been
improving steadily. However, the moratorium on filling vacancies due to stringent austerity measures has presented a challenge;
• Contractors not able to complete projects on time due to lack of resources (funds, skills, equipment, management systems, etc);
• Developing an accurate database of infrastructure, including condition assessments;
• Weak delivery capacity of the only Implementing Agent (Public Works Dept)
• No dedicated staff in districts, because of existing flat organisational structure
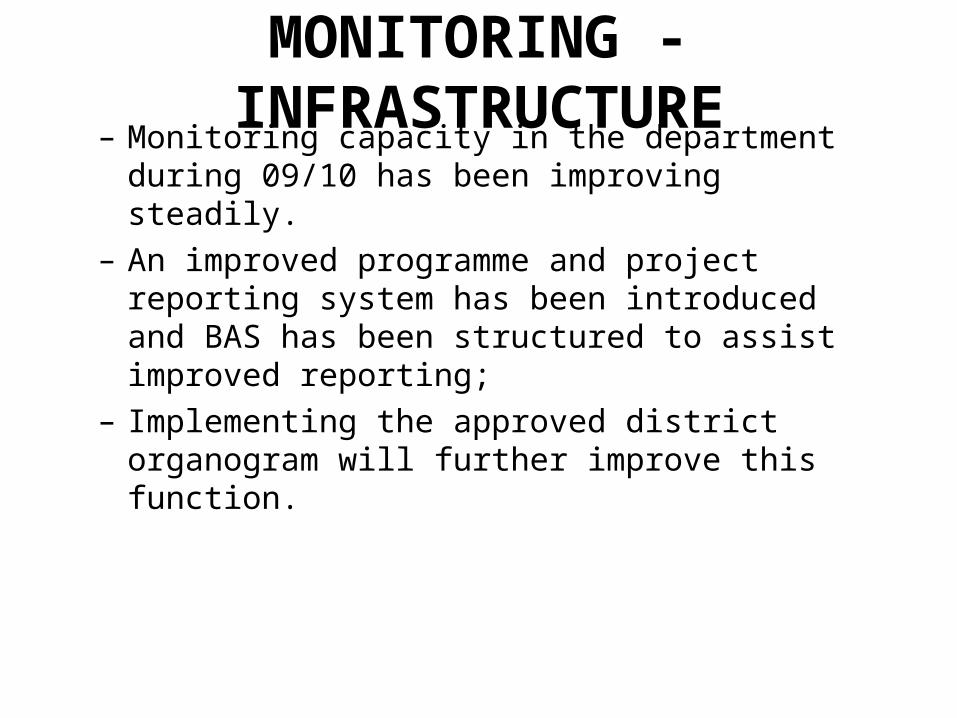
MONITORING - INFRASTRUCTURE– Monitoring capacity in the department during 09/10 has
been improving steadily. – An improved programme and project reporting system has
been introduced and BAS has been structured to assist improved reporting;
– Implementing the approved district organogram will further improve this function.

TECHNICAL SCHOOL RECAPITALISATION GRANT
TECHNICAL SCHOOL RECAPITALISATION GRANT- 2010/11
FIRST QUARTER EXPENDITURE
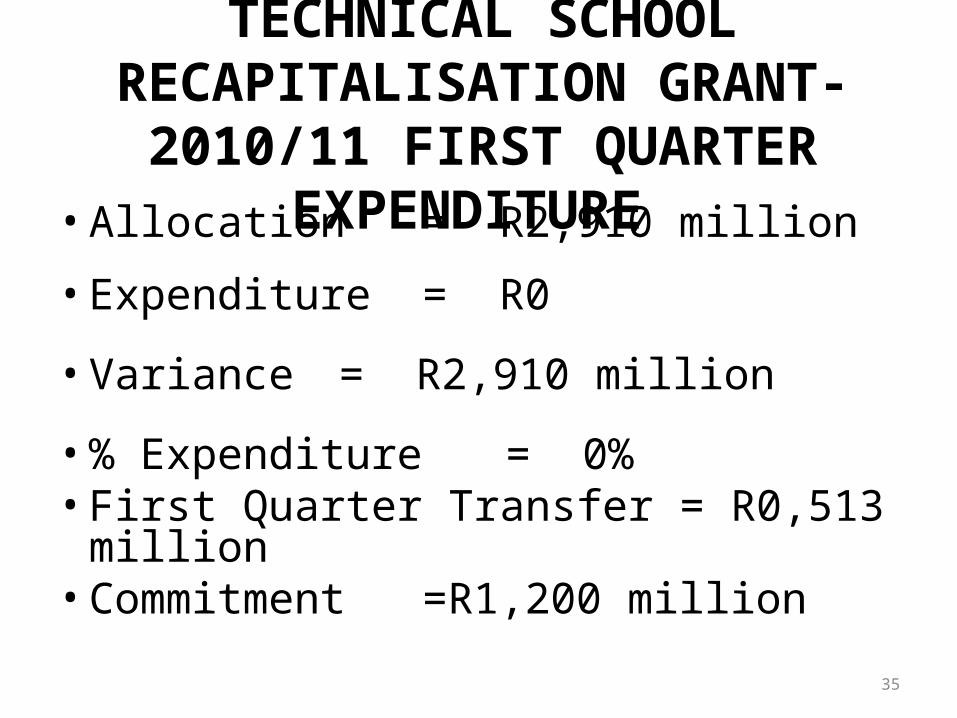
35
• Allocation = R2,910 million
• Expenditure = R0
• Variance = R2,910 million
• % Expenditure = 0%• First Quarter Transfer = R0,513 million• Commitment =R1,200 million
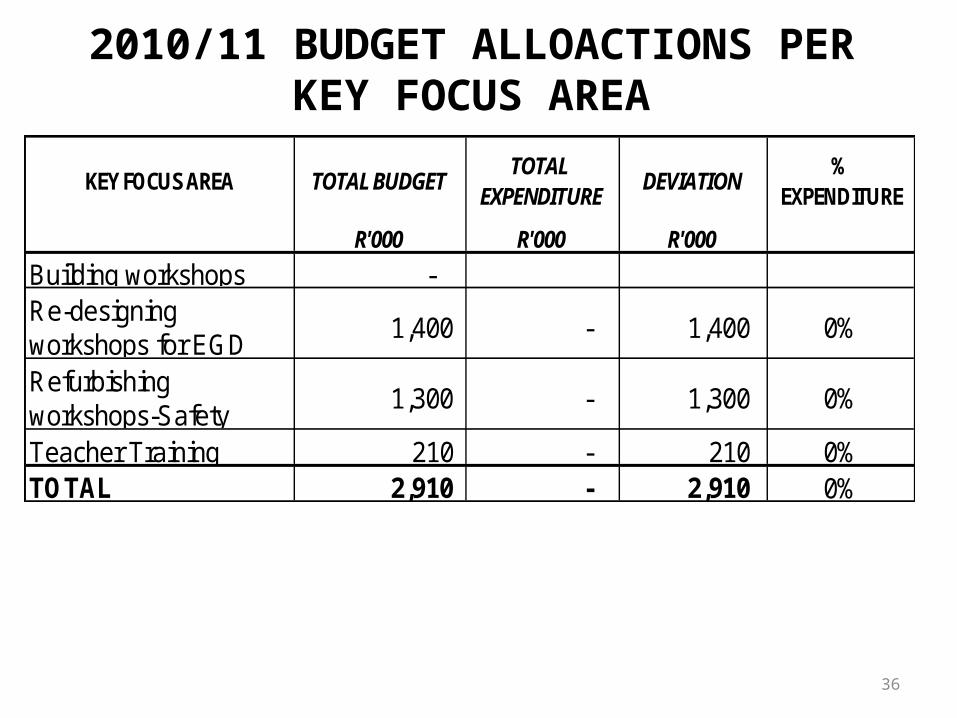
2010/11 BUDGET ALLOACTIONS PER KEY FOCUS AREA
36
KEY FOCUS AREA TOTAL BUDGET TOTAL
EXPENDITURE DEVIATION
% EXPENDITURE
R'000 R'000 R'000
Building workshops - Re-designing workshops for EGD
1,400 - 1,400 0%
Refurbishing workshops-Safety
1,300 - 1,300 0%
Teacher Training 210 - 210 0%TOTAL 2,910 - 2,910 0%
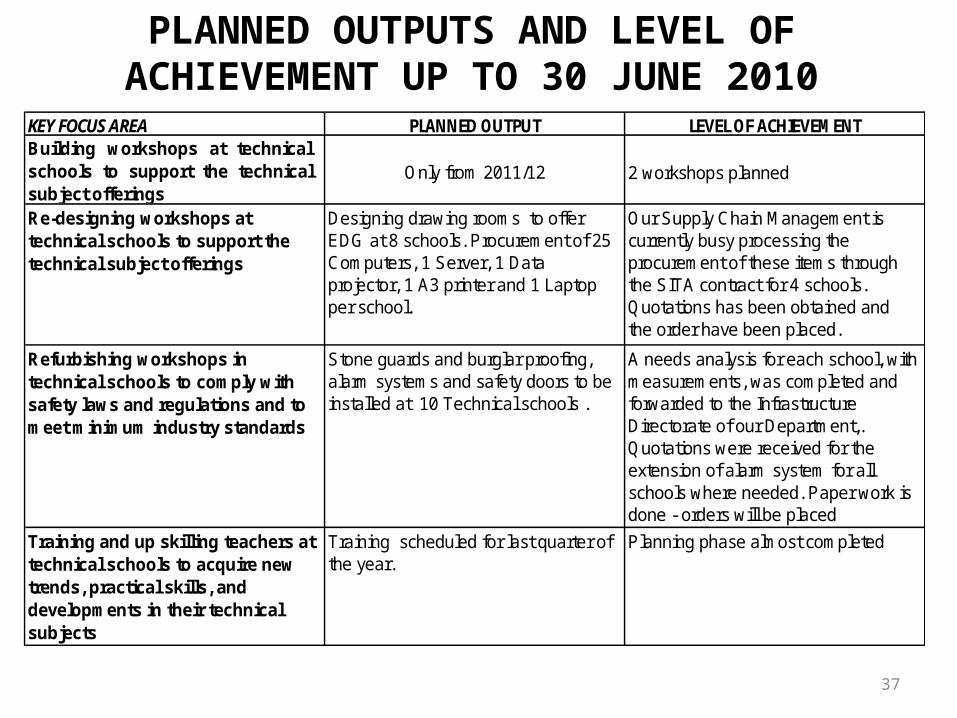
PLANNED OUTPUTS AND LEVEL OF ACHIEVEMENT UP TO 30 JUNE 2010
37
KEY FOCUS AREA PLANNED OUTPUT LEVEL OF ACHIEVEMENT Building workshops at technicalschools to support the technicalsubject offerings
Only from 2011/12 2 workshops planned
Re-designing workshops at technical schools to support the technical subject offerings
Designing drawing rooms to offer EDG at 8 schools. Procurement of 25 Computers, 1 Server, 1 Data projector, 1 A3 printer and 1 Laptop per school.
Our Supply Chain Management is currently busy processing the procurement of these items through the SITA contract for 4 schools. Quotations has been obtained and the order have been placed.
Refurbishing workshops in technical schools to comply with safety laws and regulations and to meet minimum industry standards
Stone guards and burglar proofing, alarm systems and safety doors to be installed at 10 Technical schools .
A needs analysis for each school, with measurements, was completed and forwarded to the Infrastructure Directorate of our Department,. Quotations were received for the extension of alarm system for all schools where needed. Paper work is done - orders will be placed
Training and up skilling teachers at technical schools to acquire new trends, practical skills, and developments in their technical subjects
Training scheduled for last quarter of the year.
Planning phase almost completed
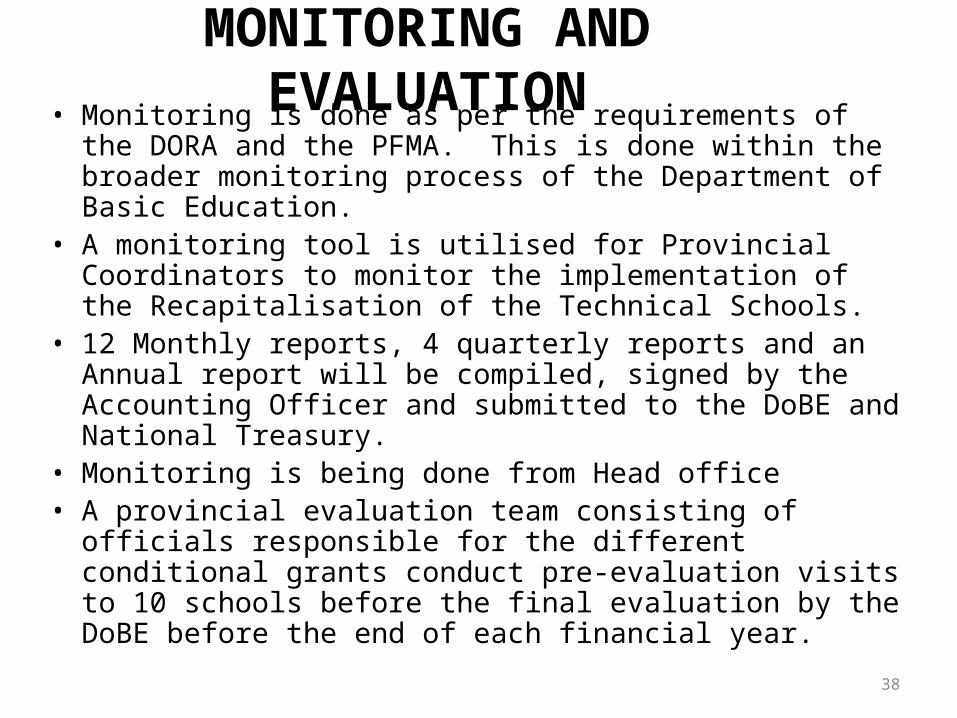
MONITORING AND EVALUATION• Monitoring is done as per the requirements of the DORA
and the PFMA. This is done within the broader monitoring process of the Department of Basic Education.
• A monitoring tool is utilised for Provincial Coordinators to monitor the implementation of the Recapitalisation of the Technical Schools.
• 12 Monthly reports, 4 quarterly reports and an Annual report will be compiled, signed by the Accounting Officer and submitted to the DoBE and National Treasury.
• Monitoring is being done from Head office• A provincial evaluation team consisting of officials
responsible for the different conditional grants conduct pre-evaluation visits to 10 schools before the final evaluation by the DoBE before the end of each financial year.
38

REASONS FOR UNDER-EXPENDITURE• Payment schedule of the first quarter is transferred on 1
April of each financial year. This affect the expenditure of the second quarter as payment must be done as soon as the money is transferred.
• Challenges experienced with the procurement of goods and services :– Procurement of items came to a amount of R 1,200,000 and we
only received R513 000.00 up to the end of June 2010.– Next payment due on the 15 July 2010 which will be R685 000.00
39

CHALLENGES• Challenges experienced with the procurement
of goods and services as referred to above.• Communication between the Curriculum
Section, Supply Chain Management and the Infrastructure Directorate will be strengthened.
40

FURTHER EDUCATION AND TRAINING GRANT
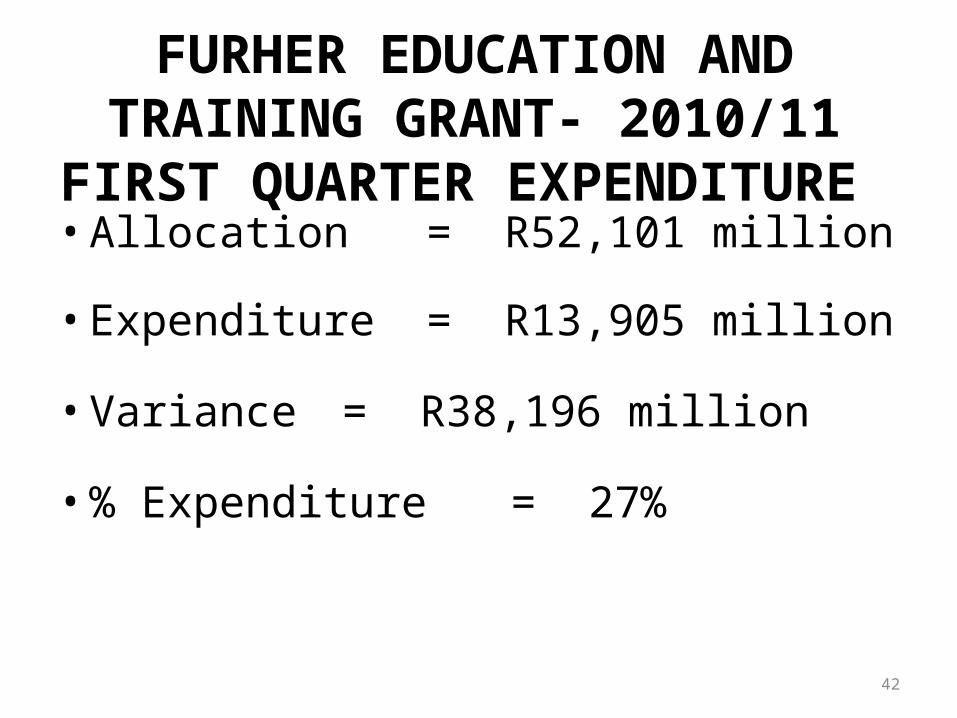
FURHER EDUCATION AND TRAINING GRANT- 2010/11 FIRST QUARTER
EXPENDITURE
42
• Allocation = R52,101 million
• Expenditure = R13,905 million
• Variance = R38,196 million
• % Expenditure = 27%

MANAGEMENT OF THE GRANT• The Grant is managed according to the
agreement with the Higher Education and Training.
• PERSAL Expenses administered on behalf of the colleges are deducted whereafter the remainder of the funding is transferred to colleges.
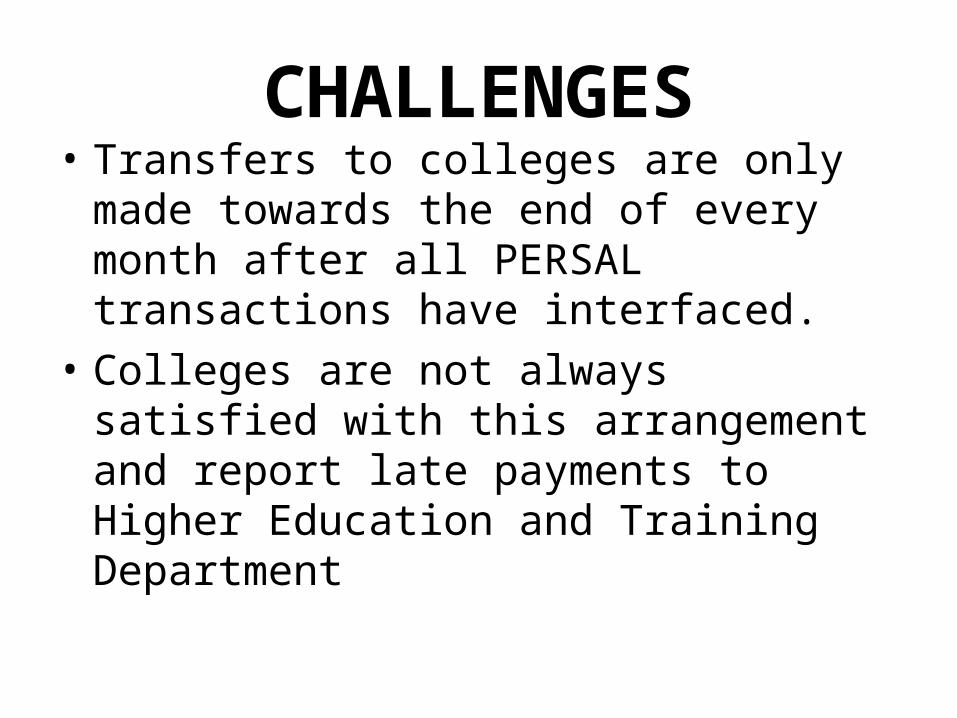
CHALLENGES• Transfers to colleges are only made towards
the end of every month after all PERSAL transactions have interfaced.
• Colleges are not always satisfied with this arrangement and report late payments to Higher Education and Training Department

THANK YOU!


![Outcome of Conditional Grants & Capital Expenditure as at 31 December 2006 [Section 32 of PFMA]](https://img.pdfslide.net/doc/110x75/56813c33550346895da5b247/outcome-of-conditional-grants-capital-expenditure-as-at-31-december-2006.jpg)


![Outcome of Conditional Grants & Capital Expenditure as at 30 June 2005 [Section 32 of PFMA]](https://img.pdfslide.net/doc/110x75/56813c33550346895da5b29d/outcome-of-conditional-grants-capital-expenditure-as-at-30-june-2005-section-568d306798e15.jpg)