Embed Size (px)
Citation preview

SU
RFA
CE
WA
TE
R A
ND
GR
OU
ND
WA
TE
R T
EC
HN
ICA
L P
AP
ER
environmental report northern expressway
surface water and groundwater technical paper


Northern Expressway
Surface and Groundwater Technical Paper
28 February 2007 Prepared by: Kellogg Brown & Root Pty Ltd 186 Greenhill Road Parkside SA 5000
Telephone: + 61 8 8301 1234 Facsimile: + 61 8 8301 1301 Email: [email protected] Prepared for: Department for Transport, Energy and Infrastructure 33-37 Warwick Street Walkerville SA 5081 PO Box 1 Walkerville SA 5081
Telephone: 1300 658 621 Facsimile: + 61 8 8343 2005 Email: [email protected]
© Kellogg Brown & Root Pty Ltd, 2007 Limitations Statement The sole purpose of this report and the associated services performed by Kellogg Brown & Root Pty Ltd (KBR) in association with consortium companies Sinclair Knight Merz Pty Ltd (SKM) and QED Pty Ltd (QED) is to document the surface water and groundwater effects associated with the Northern Expressway in accordance with the scope of services set out in the contract reference 05C152 between KBR and the Department for Transport, Energy & Infrastructure (DTEI) (‘the Client’). That scope of services was defined by the requests of the Client, by the time and budgetary constraints imposed by the Client, and by the availability of access to the site. KBR derived the data in this report primarily from site inspections, consultation and a desktop study of available literature and data as referenced in this report. The passage of time, manifestation of latent conditions or impacts of future events may require further exploration at the site and subsequent data analysis, and re-evaluation of the findings, observations and conclusions expressed in this report. In preparing this report, KBR has relied upon and presumed accurate certain information (or absence thereof) relative to the site provided by the Client and others identified herein. Except as otherwise stated in the report, KBR has not attempted to verify the accuracy or completeness of any such information. No warranty or guarantee, whether express or implied, is made with respect to the data reported or to the findings, observations and conclusions expressed in this report. Further, such data, findings, observations and conclusions are based solely upon information supplied by the Client in existence at the time of the investigation. This report has been prepared on behalf of and for the exclusive use of the Client, and is subject to and issued in connection with the provisions of the agreement between KBR and the Client. KBR accepts no liability or responsibility whatsoever for or in respect of any use of or reliance upon this report by any third party. Revision History
Signatures Revision Date Comment Originated
by Checked
by Authorised
by
0 28/2/07 AEC517.003-G-REP-006 Issue for use SEM JP MEJ

v
Table of Contents
1 Introduction 1
1.1 Project description 1 1.2 Topic explanation 2 1.3 Legislative requirements, policies and definitions 2
1.3.1 Natural Resources Management Act 2004 2 1.3.2 Water Resources Act 1997 4 1.3.3 Environment Protection Act 1993 4 1.3.4 Environment Protection (Water Quality) Policy 2003 4 1.3.5 Australian and New Zealand Guidelines for Fresh and Marine Water
Quality 2000 4
2 Existing conditions 7
2.1 Existing flooding and drainage conditions 7 2.1.1 Gawler River 7 2.1.2 Smith Creek outfall drain 10 2.1.3 Helps Road drain 11 2.1.4 Little Para River 12 2.1.5 Dry Creek 13 2.1.6 Minor drainage systems 14
2.2 Groundwater 18 2.2.1 Groundwater use 18 2.2.2 Groundwater recharge, flows and levels 19 2.2.3 Groundwater quality 20 2.2.4 Mitigation of groundwater impacts 23
2.3 Surface water quality 23 2.3.1 Existing surface water quality 24
2.4 Summary of existing conditions 33 2.4.1 Flooding and drainage 33 2.4.2 Groundwater 33 2.4.3 Surface water quality 34
3 Effects of project upon existing conditions 35
3.1 General considerations 35 3.2 Construction effects 36
3.2.1 Flooding and drainage 36 3.2.2 Groundwater 36 3.2.3 Surface water quality 36
3.3 Operational effects 38 3.3.1 Flooding and drainage 38 3.3.2 Groundwater 40 3.3.3 Surface water quality 40

vi
3.3.4 Accidental spills 42
4 Safeguards and mitigation measures 43
4.1 Principles adopted to minimise effects 43 4.2 Specific actions to minimise effects during planning and design 43
4.2.1 Flooding and drainage 44 4.2.2 Surface water quality 45 4.2.3 Groundwater 60
4.3 Specific actions to minimise effects during construction 60 4.3.1 Flooding and drainage 60 4.3.2 Surface water quality 61 4.3.3 Groundwater 62
4.4 Specific actions to minimise effects during ongoing operations 62 4.4.1 Flooding and drainage 62 4.4.2 Surface water quality 67 4.4.3 Groundwater 70
5 Conclusion 71
6 References 73

vii
List of figures
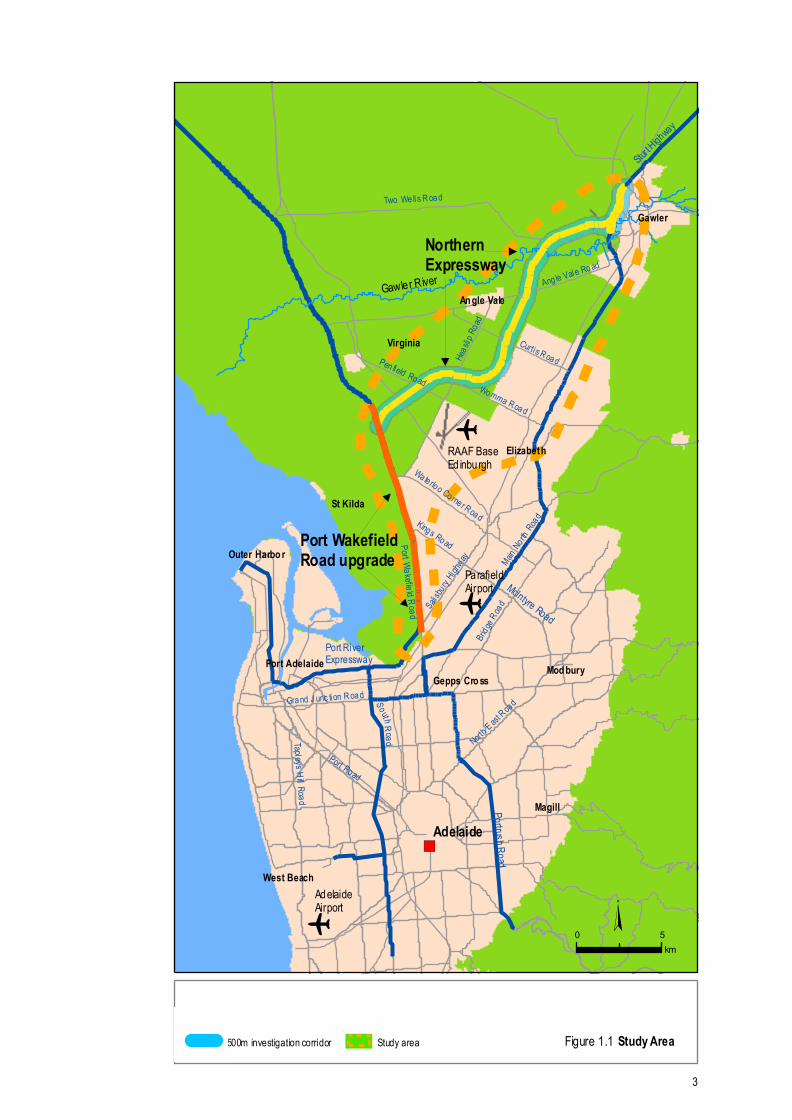
Figure 1.1 Study area 3
Figure 2.1 Surface water resources and catchments 9
Figure 2.2 Surface Water quality monitoring sites 27
Figure 4.1 Stormwater management concept plan 1 of 7 47
Figure 4.2 Stormwater management concept plan 2 of 7 49
Figure 4.3 Stormwater management concept plan 3 of 7 51
Figure 4.4 Stormwater management concept plan 4 of 7 53
Figure 4.5 Stormwater management concept plan 5 of 7 55
Figure 4.6 Stormwater management concept plan 6 of 7 57
Figure 4.7 Stormwater management concept plan 7 of 7 59

viii
List of tables
Table 2.1 Estimated Gawler River flood frequency curve 8
Table 2.2 EPA classification of groundwater quality against environmental values 20
Table 2.3 Water Quality EPP guidelines for oxidised nitrogen 20
Table 2.4 Water Quality EPP and ANZECC guidelines for total phosphorus 21
Table 2.5 Metal concentrations versus guideline limits 22
Table 2.6 Salinity guidelines 22
Table 2.8 Stebonheath lake water quality 27
Table 2.9 Stebonheath FCP inlet weir water quality 28
Table 2.10 Heavy metal concentrations in Stebonheath Lake 28
Table 2.11 Little Para River water quality downstream of reservoir 29
Table 2.12 Dry Creek water quality at Conway Crescent – nutrients and physical parameters 30
Table 2.13 Dry Creek water quality at Conway Crescent – heavy metals 30
Table 2.14 Water quality at The Paddocks wetland inlet 31
Table 2.15 Water quality in the Helps Road drain upstream of Kaurna Park 32
Table 3.1 Typical pollutant concentrations in road runoff, stormwater runoff and the Water Quality EPP Guidelines 42
Table 4.1 Design ARI for drainage along the Northern Expressway 44
Table 4.3 Predicted discharge concentrations of key pollutants (mg/L) 69

ix
List of abbreviations
AHD Australian Height Datum
ANZECC Australian and New Zealand Environment and Conservation Council
ARI average recurrence interval
ARMCANZ Agriculture and Resource Management Council of Australia and New Zealand
ASR aquifer storage and recovery
AUSRIVAS Australian Rivers Assessment System
AWQC Australian Water Quality Centre
BOD biochemical oxygen demand
CEMP construction environmental management plan
DEH Department of Environment and Heritage (SA)
DO dissolved oxygen
DTEI Department for Transport, Energy and Infrastructure
DWLBC Department of Water, Land and Biodiversity Conservation
EC electrical conductivity
EPA Environment Protection Authority
FCP Flow Control Park
GRFMA Gawler River Flood Management Authority
NABCWMB Northern Adelaide and Barossa Catchment Water Management Board
NABW Northern Adelaide and Barossa Waterwatch
NHMRC National Health and Medical Research Centre
No3 nitrate
NO2- nitrite
NOx oxidised nitrogen
NRM Act 2004 Natural Resources Management Act 2004 (SA)
NTU nephelometric turbidity units
m3/s cubic metres per second
mg/L Milligrams per litre
x
SEDMP soil erosion and drainage management plan
Sol P soluble phosphorus
SD standard deviation
TDS total dissolved solids
TSS total suspended solids
TN total nitrogen
TP total phosphorus
Water Quality EPP South Australian Environment Protection (Water Quality) Policy 2003
WSUD water sensitive urban design
µs/cm Micro-seimens per centimetre

xi
Glossary
Aerobic presence of free oxygen
Afflux rise in water level immediately upstream of, and due to, an obstruction
Anaerobic absence of free oxygen
Aquifer storage and recovery (ASR)
process of recharging water into an aquifer for the purpose of storage and subsequent withdrawal; injection of recycled water into aquifers for storage, which may be recovered later to meet water demands
Attenuation reduction of flood peak due to storage effects of the floodplain or a basin
Average recurrence interval (ARI)
a means of defining the probability/size of a flood event by assigning the average period (usually in years) between exceedances of a given flood magnitude
Biochemical oxygen demand (BOD)
amount of oxygen required by the aerobic micro-organisms (and processes) present in the water sample to oxidise any organic matter present to a stable inorganic form
Catchment a topographically defined area, drained by a stream such that outflow is directed to a single point
Concentration strength or amount of a substance in a known volume or mass
Dissolved oxygen (DO) amount of oxygen dissolved in solution
Electrical conductivity (EC) measure of a solution’s ability to conduct electricity; EC units are used to express salinity levels in soil and water – when salt is dissolved in water the conductivity increases, so the more salt, the higher the EC value
Floodplain portion of a river valley, adjacent to the river channel, covered with water when the river overflows during floods
Gross pollutant trap a structure used to trap large pieces of debris (>5 mm) transported through the stormwater system
Heavy metals a subset of ‘trace elements’ which may include copper, zinc, lead, cadmium and mercury
Nephelometric turbidity units (NTU)
units of turbidity
Nitrate the most abundant oxidised form of nitrogen (NO3)
Nitrite an oxidised form of nitrogen (NO2)
Nitrogen an essential nutrient for all organisms forming a component of amino acids, proteins and genetic material
Nutrients essential elements required by an organism for growth
xii
Oxidised nitrogen fraction of nitrogen in the water that is soluble; mainly in the form of nitrate and nitrite ions, which are collectively called oxidised nitrogen
Phosphorus an essential nutrient for all organisms
Runoff that portion of rainfall not immediately absorbed into or retained by the soil, e.g. overland flow
Salinity salt content of water, expressed in parts per thousand
Surfactants surface-active agents which are soluble and form oriented mono-layers at the surface of a liquid; have detergency, foaming, wetting, emulsifying and dispersing properties
Suspended sediment particles in suspension in flowing or static water
Swale a vegetated open channel, designed to intercept and convey surface runoff to a drainage network inlet
Total dissolved solids concentration of dissolved organic and inorganic chemicals in water
Total nitrogen total concentration of all nitrogen species present in solution (oxidised, organic and ammonia)
Total phosphorus total concentration of all phosphorus species present in solution (particulate and dissolved)
Total suspended solids total concentration of filterable solids present in suspension
Turbidity a measure (in nephelometric turbidity units (NTU)) of the ability of light to pass through water

1
1 Introduction
The proposed Northern Expressway project including the Port Wakefield Road Upgrade was developed from a planning and concept design process that considered a number of options. The final configuration of the Northern Expressway proposal, its construction method, and its environmental management during construction and operation may vary from the project described, however the project constraints, design principles and standards described in the Environmental Report would remain largely the same.
1.1 Project description The proposed Northern Expressway, and the Port Wakefield Road upgrade, will form part of the AusLink National Network, replacing the increasingly congested Main North Road thereby providing road safety and amenity benefits. The Port Wakefield Road component involves the upgrade of the existing National Highway that connects the Northern Expressway and the Port River Expressway.
The proposed Northern Expressway between Gawler to Port Wakefield Road will provide significant State and regional benefits. It is primarily aimed at improving access to Adelaide for freight transport via the Sturt Highway, including freight for export from key areas such as the Barossa Valley wine producing area and the Riverland wine and citrus producing area. Together with the Port River Expressway, it will provide a high standard link between the Sturt Highway at Gawler and the Port of Adelaide, South Australia’s main shipping port.
It will maximise the opportunity for freight transport to gain access to producers, transport hubs, freight gateways and markets, achieve better delivery times and increase cost efficiency to gain a competitive edge, while improving safety significantly. It will also improve the transport link to the regions north of Adelaide, such as Gawler and the Barossa, fringe rural communities will be more accessible to business, industry, tourists and commuters.
The Northern Expressway corridor crosses the Northern Adelaide Plains on the north west edge of the Adelaide metropolitan area. The expressway links with the Gawler Bypass, south of Redbanks Road in the north, to Port Wakefield Road, approximately 500 m north of Taylors Road in the south. Port Wakefield Road would be upgraded between this southern terminal junction with the expressway and the Salisbury Highway/Port River Expressway intersection.
The route passes through mainly rural and horticultural land, bypassing the township of Angle Vale on its eastern side and passing north of the Royal Australian Air Force Base Edinburgh and the land with potential for an intermodal facility at Waterloo Corner.
The proposed Expressway is about 23 km long and upgrades to Port Wakefield Road extend over 12 km.
The Expressway will be constructed to rural freeway standard in a new road corridor, providing dual carriageways, grade separation of access/connecting roads and restricted road access. The horizontal alignment of the new road has been designed for a posted speed limit of 110 km/h. The road would have a wide corridor, typically about 70 m, but may vary at some locations.
Interchanges are proposed at the Gawler Bypass (partial), Curtis Road (partial), Heaslip/Womma roads and at Port Wakefield Road (signalised junction).

2
The Expressway will have hard shoulders along both sides for emergency vehicles and breakdowns, space for services and drainage, and a 15m wide median.
The Port Wakefield Road works would involve upgrading of the existing divided road at a number of intersections along the project length, including at Waterloo Corner Road, Bolivar Road, Ryans Road, Martins Road and the Salisbury Highway, as well as changes to service roads, traffic controls and access to properties at other locations. In most locations, Port Wakefield Road will be widened along the outside edge of the road. It is proposed that the posted speed limit on Port Wakefield Road will be typically 90 kph, but may vary at certain times to better manage safe traffic operations.
Landscaping treatment and potential noise management measures will be developed where required following detailed design development.
The proposed route of the Expressway and upgrade of Port Wakefield Road are shown on Figure 1.1.
1.2 Topic explanation This Technical Paper describes existing flooding and drainage conditions within the catchment and detail on surface and groundwater resources from a quality perspective.
Water resources, whether surface or subsurface, are precious within the Northern Adelaide Plains, an area which places a high importance on the quality and quantity of water. Much of the region relies on the horticultural value of the land and the availability of suitable water to survive, and therefore impacts on flooding and drainage and impacts on the quality of water resources affect the sustainability of the region, as well as the environment in general.
Limited investigations during the assessment process mean that much of the information in this paper is based on previous investigations and desktop analyses. Anticipated effects are discussed along with the basic management principles to be adopted and expanded upon during the detailed design phase.
1.3 Legislative requirements, policies and definitions The management of South Australia’s water resources falls under the auspices of various Acts, policies and guidelines – the key documents are expanded on below. The Water Resources Act 1997 which set a State-wide approach to policy development, now sits under the umbrella of the Natural Resources Management Act 2004 (NRM Act); natural resources management boards are now responsible for developing water allocation plans for all prescribed resources. The newly formed Adelaide and Mount Lofty Ranges Natural Resources Management Board will be responsible for the review and implementation of a new water allocation plan for the Northern Adelaide Plains.
1.3.1 Natural Resources Management Act 2004 The NRM Act defines the legislative framework for managing South Australia’s natural resources, including the planning and management of the water resources under Chapter 7 of the Act (the former Water Resources Act 1997). Water resources are managed through the definition of responsible bodies, the delegation of water allocation, regulation and licensing powers, and the inclusion of conservation measures and avenues of policy development and review. The State Water Plan 2000, which is to be reviewed under the NRM Act, sets out the South Australian Government’s strategic
")Adelaide
o
ParafieldAirport
Gawler River
Northern Expressway
RAAF BaseEd inburgh
McIntyre Road
Stur t Highway
Port WakefieldRoad upgrade
Port RiverExpressway
o
o
AdelaideAirport
Portrush Road
Virginia
St Kilda
An gle Vale
Magill
Mod buryPort Adelaide
West Beach
Outer Harbo r
Elizabeth
Gawler
Gepps Cro ss
Main No r
th Road
Ang le Vale Road
Port Wakefie ld Road
Gra nd J unc tion R oa d
Two We ll s R oa d
Heaslip
Road
North E ast R
oad
Tapleys H ill Road
Salisbu
ry Highw
ayBrid
ge Road
Kings Road
Port Road
Wa te rloo Co rne r Road
Womma Road
Pen field Road
S out h R oad
Curti s Road
500m investigation corridor Study area
§
Figure 1.1 Study Area
0 5km
3

4
directions for sustainable water use and management. Specifically, this plan must include the conditions, values and pressures on State water resources, and the techniques required to management them effectively.
1.3.2 Water Resources Act 1997 Chapter 7 of the NRM Act (the former Water Resources Act) provides the State-wide approach to water policy development, including the State Water Plan (see Section 1.3.1). Institutional arrangements designed to protect and preserve the environmental values of water, in addition to social and economic values, are critical to the functioning of this Act. They include prescribed water resources, water protection areas, catchment water management plans, water allocation plans and local water management plans.
1.3.3 Environment Protection Act 1993 The Environment Protection Act 1993 provides for the protection of air, land, water and ecosystem values from pollution by defining standards of care for industry and the community, promoting the principles of ecologically sustainable development, and providing a legislative framework to enable the licensing and regulation of polluting activities.
The Act specifically protects water quality through regulating waste discharge to streams, rivers, coastal waters, and groundwater. It also requires periodic State of the Environment reporting on the state, pressures and response of our water resources, thus enabling continual review of management options to ensure optimised results.
1.3.4 Environment Protection (Water Quality) Policy 2003 The main objective of the Environment Protection (Water Quality) Policy (Water Quality EPP) is to:
…achieve the sustainable management of waters, by protecting or enhancing water quality while allowing economic and social development.
The Water Quality EPP was introduced in 2003 to bring South Australia into line with the national strategic push for sustainable use of water resources (the National Water Quality Management Strategy). The policy defines key environmental values and associated water quality targets for all surface water and groundwater resources. Industry and community obligations are defined with respect to preventing or minimising different water polluting activities. The policy bans a set of polluting activities that are commonly responsible for declines in water quality (e.g. permitting washing oils, grease or engine coolant to enter a stormwater drain; allowing dirt from a building site to enter the stormwater system).
The Water Quality EPP also provides avenues of licensing and regulation, including the issuing of environmental protection orders, fines or prosecution.
1.3.5 Australian and New Zealand Guidelines for Fresh and Marine Water Quality 2000 The ANZECC Guidelines for Fresh and Marine Water Quality 2000, depict contaminant limits below which there is a reasonable expectation of maintaining identified environmental values. The guidelines

5
provide a detailed overview of the principles and objectives of sustainable water use, the environmental values supported by water that shape permissible contaminant limits, and the framework for applying these across the varied environments of Australia and New Zealand. The document also provides guidance on water quality monitoring and assessment programs required to enable a sustainable, adaptive approach.

6

7
2 Existing conditions
This section describes existing flooding and drainage, groundwater and surface water quality conditions throughout the study area.
2.1 Existing flooding and drainage conditions The study area covers the catchments of several major watercourses: Gawler River, Smith Creek outfall, Little Para River, Dry Creek and the Helps Road drain. Of these, the Gawler River, Little Para River and Dry Creek are natural watercourses; the other two watercourses are constructed drains to the west of Main North Road.
The Gawler River and the Little Para River to the south are both perched above the surrounding plains, which forms a distinct, natural drainage basin extending from the top of the Hills Face escarpment in the east to the Gulf St Vincent in the west (BC Tonkin and Associates 1999). The basin is bounded to the north by the Gawler River and the south by the Little Para River. Before European settlement floodwaters would have covered the plains in shallow, slow moving sheets of water flowing generally in a south-westerly direction (BC Tonkin and Associates 1999). The flat grades would have seen significant storage and attenuation of flows with little, if any, runoff discharging to Gulf St Vincent (BC Tonkin and Associates 1999).
The artificial drainage network, constructed in response to development of the area, has altered the natural drainage pattern. It was constructed in the 1970s to protect development from flooding and to dispose of stormwater runoff. It now divides the area into two major catchments, the Smith Creek outfall catchment to the north and the Helps Road catchment to the south.
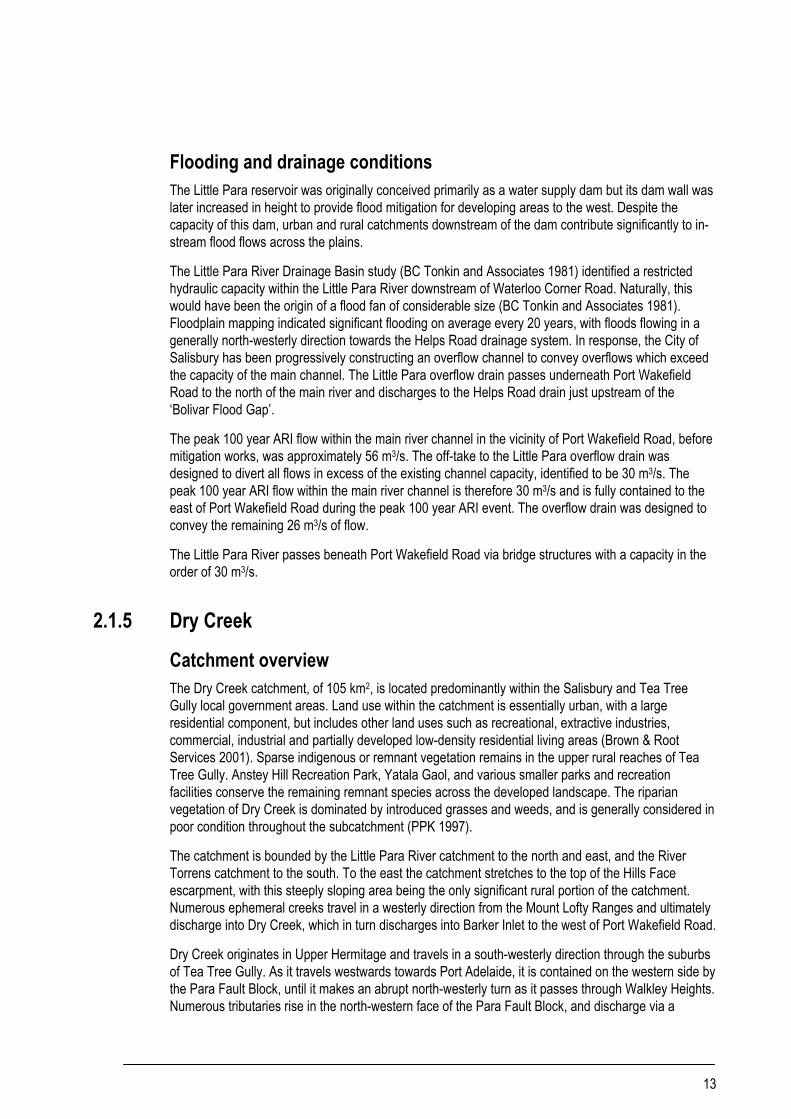
The location of the proposed alignment with respect to these catchments is shown on Figure 2.1. The Northern Expressway and Port Wakefield Road Upgrade will also cross numerous smaller local drainage systems.
Flooding and drainage conditions throughout the study area are discussed below.
2.1.1 Gawler River
Catchment overview The Gawler River is an ephemeral river system consisting of three main rivers and their associated tributaries. These include the Gawler River, North Para River, which flows through the Barossa Valley wine district; and South Para River, which forms part of Adelaide’s water supply via the South Para and Warren reservoirs.
The Gawler River is only 30 km in length; it meanders from the township of Gawler west along the edge of the City of Playford, Light Regional Council and the District Council of Mallala, and into Gulf St Vincent via the Buckland Park estuarine wetland complex (NABCWMB 2000). The plains over which it flows are dominated by horticulture, agriculture and rural residential living.
The total catchment covers an area in excess of 1,050 km2 – 340 km2 for the South Para, 710 km2 for the North Para, plus the relatively narrow Gawler River zone over the Northern Adelaide Plains to the
8
coast. The catchment has been extensively cleared and developed for primary production, with some tracts of native remnant vegetation retained in the upper reaches of the South Para River (GRFMA 2003). Exotic trees and woody weeds are common along the lower reaches, driving a removal and rehabilitation program as part of the Gawler River Flood Mitigation Scheme.
Gawler River flooding conditions The Gawler River subcatchment is extensive, the highest point lying several kilometres to the east of Williamstown at the Wirra Wirra Peaks at an elevation of 592 m above sea level. Rainfall varies across the catchment with the wettest areas located along the Barossa Ranges. Annual rainfall ranges from 770 mm per year at Pewsey Vale down to 400 mm per year on the Adelaide Plains. The catchment generally experiences mild wet winters and hot dry summers. The wettest months are June, July and August, during which time rainfall tends to be less intense, but of longer duration.
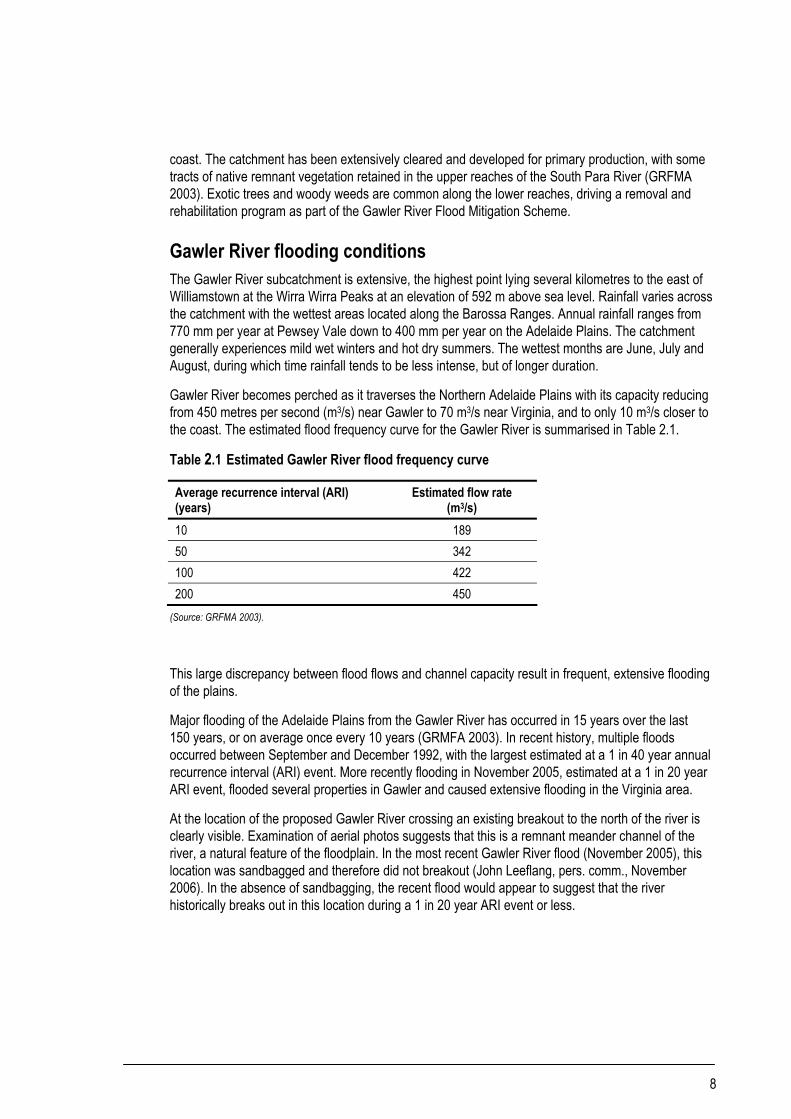
Gawler River becomes perched as it traverses the Northern Adelaide Plains with its capacity reducing from 450 metres per second (m3/s) near Gawler to 70 m3/s near Virginia, and to only 10 m3/s closer to the coast. The estimated flood frequency curve for the Gawler River is summarised in Table 2.1.
Table 2.1 Estimated Gawler River flood frequency curve
Average recurrence interval (ARI) (years)
Estimated flow rate (m3/s)
10 189 50 342 100 422 200 450
(Source: GRFMA 2003).
This large discrepancy between flood flows and channel capacity result in frequent, extensive flooding of the plains.
Major flooding of the Adelaide Plains from the Gawler River has occurred in 15 years over the last 150 years, or on average once every 10 years (GRMFA 2003). In recent history, multiple floods occurred between September and December 1992, with the largest estimated at a 1 in 40 year annual recurrence interval (ARI) event. More recently flooding in November 2005, estimated at a 1 in 20 year ARI event, flooded several properties in Gawler and caused extensive flooding in the Virginia area.
At the location of the proposed Gawler River crossing an existing breakout to the north of the river is clearly visible. Examination of aerial photos suggests that this is a remnant meander channel of the river, a natural feature of the floodplain. In the most recent Gawler River flood (November 2005), this location was sandbagged and therefore did not breakout (John Leeflang, pers. comm., November 2006). In the absence of sandbagging, the recent flood would appear to suggest that the river historically breaks out in this location during a 1 in 20 year ARI event or less.

!(
!(!(
!(
!(
!(
!(
!(
!(
!(
!(
!( !(!(
!(!(
!(
!(
!(
o
ParafieldAirport
o
RAAF BaseEd inburgh Elizabeth
Gawler
Angle Vale
Virginia
Modbury
St Kilda
Greenf ieldsSub-Catchment
Whites RoadSub-CatchmentLit tle ParaOver FlowSub-Catchment
Helps RoadCatchment
Main N or th
Road
Angle Vale Road
Port Wakefield Road
Two Wells Road
Salisbu
ry Highw
ay
Bridge
Road
Womma Road
Penfield RoadSmith CreekOutfall
Helps
Road
Drain
Gawler River
Little Para River
Dry Creek
Cur tis Road
Adelaide PlainsCatchment
Gawler RiverCatchment
Smith CreekCatchment
Lit tle Para RiverCatchment
Dry CreekCatchment
Greenf ields andConnector Wetlands
Lazurko's DrainSub-Catchment
StebonheathFlow Control Park
Lit tle ParaReservoir
Kaurna ParkWetland
Surface water resources and catchments
±0 2
km
Figure 2.1!( Constructed wetlandsWatercourseCatchment boundary
9

10
Gawler River flood mitigation scheme In response to the frequent and extensive flooding of the Gawler River, the Gawler River Flood Mitigation Scheme was developed specifically to address flooding issues in the catchment through a combination of flood warning, physical works and planning measures. The key physical works include:
enhancing flood attenuation within the South Para Reservoir building a new flood control dam on the North Para River at Turretfield undertaking sensitive, capacity improvement measures for the lower reaches of the Gawler
River. The combined effect of these works will substantially reduce the peak 1 in 100 year ARI flow at Gawler and increase flood protection to downstream properties by reducing the frequency of breakout flows from the river.
Works on the North Para River flood control dam have begun, and are due for completion in 2007. Spillway modification works on the South Para Reservoir are due to begin in 2008. It is anticipated that flood mitigation works will be completed before construction begins on the Northern Expressway across the Gawler River floodplain.
Flood levels and extents in the 1 in 100 year ARI event following completion of the flood mitigation works will need to be confirmed during the detailed design phase.
2.1.2 Smith Creek outfall drain
Catchment overview The headwaters of the Smith Creek outfall catchment lie on the Hills Face escarpment to the east of Main North Road. The natural watercourses in this area, including Smith Creek, Kudla Creek and Evanston Creek, generally become ill defined to the west of Main North Road due to the flat grades of the plains.
The Smith Creek outfall catchment, of approximately 174 km2, extends from the top of the Hills Face escarpment above Smithfield in the east to the salt evaporation lagoons along Gulf St Vincent in the west. The northern boundary is defined by a ridge line running parallel to the Gawler River, along the general alignment of Angle Vale Road. It is bounded to the south by the Helps Road catchment. The catchment covers a section of Mount Lofty Ranges escarpment to the east before passing through the highly urbanised areas of Smithfield, Craigmore, Blakeview and Andrews Farm, and finally through the predominantly horticultural regions of Virginia and Waterloo Corner.
Smith Creek and its artificial extension (Smith Creek outfall but also known as ‘Munno Para outfall’) form the major stormwater outfalls to the area. The creek is maintained in a natural condition within a drainage reserve to Uley Road (just upstream of Main North Road), downstream of this point the watercourse is artificial. Some distance downstream of Main North Road, Smith Creek enters the Stebonheath Flow Control Park (FCP), which, among other uses, provides detention for the 100 year ARI flow.
The drain downstream of Stebonheath FCP, and the drain over which the proposed Northern Expressway passes, was constructed in the mid-1970s. It was excavated with 1V:1H side slopes, and 30 years’ later has eroded to near vertical sides and is in a poor hydraulic and visual condition. The

11
drain runs in a westerly direction across the Northern Adelaide Plains discharging to Thompson Creek near the coast (BC Tonkin and Associates 1999).
Flooding and drainage conditions A number of hydrological studies have been undertaken within the Smith Creek outfall catchment, with the most recent in 1999. These studies generally precede the significant recent development which is continuing with the Playford North and Peachy Belt urban renewal projects. Studies since this time have tended to focus on specific areas, in particular the upgrade of small sections of the drainage system, predominantly upstream of the Stebonheath FCP within the more urbanised areas. The City of Playford has advised that the peak 100 year ARI discharge from the Stebonheath FCP, taking into account the planned upstream development, will be 61 m3/s.
The 1999 study concluded that the section of drain between the Stebonheath FCP and Heaslip Road does not have 100 year ARI capacity, and that laying back of banks and culvert upgrading is required to increase the design capacity. It was recommended that batters needed laying back to 1V:4H to increase its design standard to the 100 year ARI. The report also identifies the need for a flow control park at the intersection of Heaslip Road and Womma Road to mitigate flows downstream of Womma Road. Construction of this detention facility would reduce the extent of upgrading required on the main outfall drain.
Due to the rural nature of the land over which the outfall drain passes downstream of Stebonheath Road, there is little information available on the frequency and severity of flooding caused by the Smith Creek outfall drain between Stebonheath Road and Heaslip Road.
2.1.3 Helps Road drain
Catchment overview The Helps Road drain is an artificially constructed channel, approximately 15 km in length, with a greater catchment area of 74 km2 stretching across the Cities of Salisbury and Playford (BC Tonkin and Associates 1999). The catchment extends from the top of the Hills Face escarpment above Elizabeth in the east to Port Wakefield Road to the west. The southern boundary runs parallel to and just north of the Little Para River.
The main tributary of the Helps Road drain is Adams Creek, arising in the Hills Face escarpment above Elizabeth. Upstream of Midway Road an open channel joins the main creek which intercepts a number of Hills Face creeks above Elizabeth East and collects runoff from the residential areas of Hillbank.
Flows from the greater catchment are intercepted by a series of artificial drains, with the Helps Road drain transporting waters west across the plains, underneath Port Wakefield Road and out into Barker Inlet. The catchment has a high degree of urbanisation, and is primarily residential with pockets of industrial and commercial in parts of Elizabeth and across the Edinburgh Defence Precinct (BC Tonkin and Associates 1999). Remnant and indigenous vegetation is mostly likely sparse across the urbanised plains, and where present in the upper rural reaches, is almost certainly modified by existing agricultural practices.

12
Flooding and drainage conditions In the highly urbanised catchment, a number of flood detention facilities have been constructed within the drainage network to provide flood protection for significant infrastructure.
At the base of the escarpment, two flood mitigation dams have recently been constructed on Adams Creek, as have two significant storages downstream within the Edinburgh Parks Industrial Precinct. It is anticipated that these facilities, along with channel works between Edinburgh Parks and Kaurna Park completed by the City of Salisbury, will ultimately provide a 100 year ARI standard of protection along the drain between Edinburgh Parks and the Kaurna Park wetland complex located on Waterloo Corner Road, adjacent to Helps Road.
The Kaurna Park Wetland complex provides 100 year ARI flood mitigation to the area downstream of Waterloo Corner Road, with the outfall channel designed to carry the peak discharge from the wetland in the 100 year ARI event. While development in the area to the south of Edinburgh Parks and the Kaurna Park wetland continues, it is anticipated that any increases in peak flows will be detained locally and not contribute to increased flows within the outfall channel.
From Kaurna Park, the outfall channel passes through the Burton Road development and its associated wetlands, and then flows underneath Port Wakefield Road to the west of Burton Road, and out to Barker Inlet. The drain is an open earth channel in a poor state of repair and is visually unattractive, but nevertheless has a 100 year ARI standard of protection due to the significant upstream flood control facilities.
The overall effect of these facilities is a 100 year ARI standard of protection along much of the drain.
The peak 100 year ARI flow within the Helps Road drain at the Port Wakefield Road crossing is 26 m3/s for the 24 hour, critical duration event. The Port Wakefield Road culvert is a box culvert which is estimated to have capacity in excess of the peak flows, and therefore it is not expected that the existing road will flood in the 100 year ARI event.
2.1.4 Little Para River The Little Para River, located between Dry Creek and the Gawler River, has a catchment area of 124 km2. It originates in the Mount Lofty Ranges, passing near Paracombe, and flows in a generally northerly direction for 21 km to the Little Para Reservoir. From the reservoir the river flows due west 5 km to Main North Road and a further 17 km in a westerly direction across the Adelaide Plains, discharging to the gulf immediately south of Bolivar (PPK 1997).
The river reach between Salisbury and Main North Road lies within a valley that naturally contains flows. Downstream of Salisbury, the river is semi-perched with extensive meanders, typical of other rivers in the area. Flows exceeding the channel capacity are expected to break out on to the adjacent plains and are unlikely to return to the river.
The little indigenous or remnant vegetation remaining in the Little Para River catchment is mostly located within the rural parts of the City of Playford and Gumeracha. The catchment is highly modified by agricultural practices. Small pockets of remnant vegetation are found in recreation parks across the plains, and where open channels are present, the understorey is dominated by introduced grasses with little in-stream vegetation.
13
Flooding and drainage conditions The Little Para reservoir was originally conceived primarily as a water supply dam but its dam wall was later increased in height to provide flood mitigation for developing areas to the west. Despite the capacity of this dam, urban and rural catchments downstream of the dam contribute significantly to in-stream flood flows across the plains.
The Little Para River Drainage Basin study (BC Tonkin and Associates 1981) identified a restricted hydraulic capacity within the Little Para River downstream of Waterloo Corner Road. Naturally, this would have been the origin of a flood fan of considerable size (BC Tonkin and Associates 1981). Floodplain mapping indicated significant flooding on average every 20 years, with floods flowing in a generally north-westerly direction towards the Helps Road drainage system. In response, the City of Salisbury has been progressively constructing an overflow channel to convey overflows which exceed the capacity of the main channel. The Little Para overflow drain passes underneath Port Wakefield Road to the north of the main river and discharges to the Helps Road drain just upstream of the ‘Bolivar Flood Gap’.
The peak 100 year ARI flow within the main river channel in the vicinity of Port Wakefield Road, before mitigation works, was approximately 56 m3/s. The off-take to the Little Para overflow drain was designed to divert all flows in excess of the existing channel capacity, identified to be 30 m3/s. The peak 100 year ARI flow within the main river channel is therefore 30 m3/s and is fully contained to the east of Port Wakefield Road during the peak 100 year ARI event. The overflow drain was designed to convey the remaining 26 m3/s of flow.
The Little Para River passes beneath Port Wakefield Road via bridge structures with a capacity in the order of 30 m3/s.
2.1.5 Dry Creek
Catchment overview The Dry Creek catchment, of 105 km2, is located predominantly within the Salisbury and Tea Tree Gully local government areas. Land use within the catchment is essentially urban, with a large residential component, but includes other land uses such as recreational, extractive industries, commercial, industrial and partially developed low-density residential living areas (Brown & Root Services 2001). Sparse indigenous or remnant vegetation remains in the upper rural reaches of Tea Tree Gully. Anstey Hill Recreation Park, Yatala Gaol, and various smaller parks and recreation facilities conserve the remaining remnant species across the developed landscape. The riparian vegetation of Dry Creek is dominated by introduced grasses and weeds, and is generally considered in poor condition throughout the subcatchment (PPK 1997).
The catchment is bounded by the Little Para River catchment to the north and east, and the River Torrens catchment to the south. To the east the catchment stretches to the top of the Hills Face escarpment, with this steeply sloping area being the only significant rural portion of the catchment. Numerous ephemeral creeks travel in a westerly direction from the Mount Lofty Ranges and ultimately discharge into Dry Creek, which in turn discharges into Barker Inlet to the west of Port Wakefield Road.
Dry Creek originates in Upper Hermitage and travels in a south-westerly direction through the suburbs of Tea Tree Gully. As it travels westwards towards Port Adelaide, it is contained on the western side by the Para Fault Block, until it makes an abrupt north-westerly turn as it passes through Walkley Heights. Numerous tributaries rise in the north-western face of the Para Fault Block, and discharge via a

14
network of artificial drains into Dry Creek in the vicinity of the Adelaide–Port Augusta rail line intersection. The major drainage systems include Bennett Road drain, Main North Road diversion drain, Cross Keys Road drain, Warrendi Road drain and Parafield Airport drain. From the rail line onwards, Dry Creek is an artificial channel until it reaches its tidal outlet at Swan Alley Creek.
Flooding and drainage conditions Of the numerous studies on the Dry Creek over the years, the one most relevant to this proposal is the Dry Creek hydrology review by Brown & Root Services (2001). It comprehensively reviewed previous hydrological studies of the catchment (BC Tonkin and Associates 1981), and predicted design flows throughout the creek system based on an agreed hydrological design model.
Substantial works have been undertaken on Dry Creek to prevent flooding of adjacent developments, particularly through the Mawson Lakes development east of Port Wakefield Road. The floodplain of the Dry Creek catchment to Port Wakefield Road is currently being mapped for the City of Salisbury but the results are not yet available.
The peak 100 year ARI flow within Dry Creek at the Port Wakefield Road crossing is 205 m3/s for the 3 hour, critical duration event. The Port Wakefield Road crossing of Dry Creek is a bridge spanning the full width of the main channel, which has 100 year ARI capacity.
2.1.6 Minor drainage systems The proposed Northern Expressway and the Port Wakefield Road Upgrade will cross several local minor drains, predominantly within the City of Playford and City of Salisbury local government areas. Across the plains, in the vicinity of the Northern Expressway, the minor drainage systems are generally ill-defined and a number of existing local flooding problems are known. Along Port Wakefield Road the larger existing drainage crossings have generally been designed and constructed to a 100 year ARI standard, or at least to a standard that ensures the road and adjacent properties are not affected during the 100 year ARI event. Minor drainage has been assumed to be to 5 year ARI standard, consistent with DTEI design guidelines (Transport SA undated).
In both cases the existing drainage infrastructure consists of a combination of swales, collector pits and small pipes draining into the larger subcatchment drains indicated on Figure 2.1. The very flat nature of the area means that the drainage is in many areas inefficient. While known problem areas exist within the City of Playford, few have been reported along Port Wakefield Road.
The existing flooding and drainage characteristics for the local/minor catchments crossed by the Northern Expressway, as well as those along the Port Wakefield Road Upgrade, are discussed below under those separate headings.
The discussion of the drainage systems is based on information gained through discussions with councils, limited survey information and site inspections. The authors cannot guarantee the accuracy of this information.
Northern Expressway
Gawler Bypass Existing drainage along the relevant section of the Gawler Bypass consists of predominantly swales along both sides of the road and within the median. On the western side the swale is overgrown and
15
not well maintained. Swales in the centre and on the eastern side are grassed and appear to be mown periodically. Stormwater is collected via headwalls or grated inlets and transferred into a pipe system discharging to the Gawler River.
Gawler Soaring Club to Gawler River In this area the general fall of the land and hence drainage relief is to the west; the Northern Expressway will intercept the migration of stormwater runoff. There is no known formal drainage in this area.
Gawler River to Angle Vale Road Through this section stormwater is collected in a defined swale along Hillier Road which flows west and discharges to the Gawler River in the vicinity of River Banks Road.
Informal drainage exists along Angle Vale Road but some drainage problems have been reported along this road, with frequent nuisance flooding reported.
Angle Vale Road to Curtis Road Between Angle Vale Road and Curtis Road the general fall is to the south-west. The Expressway will intercept existing drainage systems at Fradd Road and Curtis Road. The new road will run approximately parallel to and between Andrews Road and Frisby Road, both of which have existing swale drainage systems. There is expected to be minimal impact on drainage through this area.
Curtis Road to Smith Creek outfall, near Macdonald Park This section generally falls to the west and south-west South of Curtis Road. The Expressway corridor travels parallel to and west of Andrews Road. Existing drainage systems along Andrews Road and Curtis Road east of Andrews Road discharge to the Stebonheath FCP and Smith Creek outfall drain. Drainage problems are known to exist along Curtis Road between Andrews Road and Petherton Road.
A small ridge line between the Expressway and Andrews Road physically separates Expressway drainage from the Stebonheath FCP. At the southern end of Macdonald Park drainage along Petherton Road drains both east back to Smith Creek outfall via Andrews Road, and west to Smith Creek outfall via Argent Road. The Expressway intersects Petherton Road approximately at the catchment divide.
Drainage characteristics of the Smith Creek outfall drain have been discussed in Section 2.1.2.
Smith Creek outfall drain to Womma Road At Womma Road a relatively large swale conveys stormwater in a north-westerly direction towards the Smith Creek outfall drain, picking up drainage at Short Road.
Womma Road to rail line Through this section the terrain generally falls parallel to the road corridor. The Northern Expressway corridor crosses the rail line in the vicinity of the Taylor Road–Pellew Road intersection.
Drainage along Taylor Road falls south-west towards the rail line, picking up existing drainage within Pellew Road and Nash Road. The rail line forms a physical barrier to stormwater flows to the south-

16
west, but small culverts at Taylor Road allow at least minor flows to pass underneath the embankment. Additional culverts run under the rail line at intervals along the track.
Rail line to Port Wakefield Road Drainage continues along Taylor Road towards Port Wakefield Road. Drains along Brown Road (north of the Expressway intersection with Port Wakefield Road), and Symes Road (south of the Expressway intersection) appear to convey stormwater west towards the gulf.
Port Wakefield Road
Taylor Road to Caltex service station The Taylor Road intersection is currently drained by a pit and pipe system discharging to a swale on the western side of Port Wakefield Road. This swale terminates in an area of informal detention in the north-western corner of the Symes Road intersection. South of Symes Road, as far as St Kilda Road, no formal drainage exists on either side of Pt Wakefield Road. Likewise runoff from the Anjanto Road intersection has no defined collection system.
Runoff from the St Kilda Road intersection is transferred by a system of pits and pipes to a drain running westerly down St Kilda Road. South of St Kilda Road, runoff from Port Wakefield Road is channelled back to the St Kilda Road drain.
North of the Waterloo Corner Road intersection, runoff from Port Wakefield Road is conveyed by informal swales in the centre, eastern and western sides of the road to a pit and pipe system at the intersection itself. This system discharges into an area of informal detention in the south-eastern corner of the intersection. South of the Waterloo Corner Road intersection, informal swales in the centre, eastern and western sides of Port Wakefield Road convey runoff back towards the informal Waterloo Corner detention area.
The intersection of Undo Road and Port Wakefield Road is drained by a system of pits and pipes, discharging to a trunk main running adjacent to Angle Vale Crescent. The Burton Road intersection is similarly drained, again feeding into the trunk main. South of Burton Road, the trunk main crosses Port Wakefield Road via a 1500 mm diameter pipe before discharging into Lazurko drain. Informal swales in the centre and western side of Port Wakefield Road to the north of this drain also discharge here.
South of Lazurko drain, informal swales in the centre, eastern and western sides of Port Wakefield Road convey runoff to the Helps Road drain.
Between the Helps Road drain and the intersection of Deuter Road and Port Wakefield Road, informal swales channel flow into Bolivar Gardens. Similarly, the Deuter Road intersection is drained by a system of pits and pipes discharging to Bolivar Gardens.
South of Deuter Road to the Caltex service station, the western side of Port Wakefield Road drains directly into Bolivar Gardens, while the eastern side is channelled into a wetland system opposite Bolivar Gardens. This wetland system discharges into Bolivar Gardens via culverts under Port Wakefield Road.
The main minor drainage system in this section is the Lazurko drain. The greater Lazurko drain catchment has an area of 0.8 km2, predominantly upstream of Port Wakefield Road. The ultimate peak 100 year ARI flow generated from the catchment is 5.5 m3/s for the 60 minute event. The 1500 mm diameter pipe crossing of the road has been designed for the 5 year ARI ultimate development flow
17
and possible connection of the Waterloo Corner Road drainage, although presently this water does not reach the outfall because there is no connection between Angle Vale Crescent and Waterloo Corner Road.
Caltex service station to Little Para River Areas north of Henry Street drain via open swales in the centre, eastern and western sides of Port Wakefield Road, to the Little Para overflow drain.
South of Henry Street as far as Bolivar Road, an open channel conveys water along the western side of Port Wakefield Road to an area of detention in the south-western corner of the Henry Street intersection. This water then enters a piped drainage system under the Highway 1 Caravan and Tourist Park. Water from the centre and western sides of Port Wakefield Road drains via open swales to the Little Para overflow drain.
The Little Para overflow drain has a small local catchment of 3.8 km2, but the majority of flows are diverted from the main Little Para River. The peak flow arriving at Port Wakefield Road is 23.6 m3/s for the 100 year ARI event. The drain crosses Port Wakefield Road via 5/3000 × 750 mm box culverts.
The Bolivar Road intersection is drained by a network of kerb and gutter, feeding into a pit and pipe system, discharging to an unnamed drain opposite Bolivar Road.
South of Bolivar Road, informal swales convey surface runoff towards Hodgson Road. The Hodgson Road intersection is drained by a network of kerb and gutter, feeding into a pit and pipe system. This system discharges to a swale on the western side of Port Wakefield Road, which further receives flows from central and eastern swales south of the Hodgson Road intersection. This swale eventually conveys flows to the Little Para River.
Little Para River to Salisbury Highway South of the Little Para River, water from the centre and western side of Port Wakefield Road is conveyed via pits and pipes to a large defined swale running along the eastern side of the road.
The Victoria Drive intersection is drained by a network of kerb and gutter, feeding into a pit and pipe system. This system discharges to the same defined swale and detention storage area on the eastern side of Port Wakefield Road, eventually crossing the road and discharging into the Whites Road drain.
The greater Whites Road catchment has an area of 3.6 km2. The peak 100 year ARI flow arriving at Port Wakefield Road is 23.8 m3/s. Twin 1500 mm diameter pipes cross Port Wakefield Road with a capacity of 12.75 m3/s, with excess flows heading south along Port Wakefield Road towards Ryans Road. Two-dimensional modelling for council as part of a separate project indicated that the road is not overtopped (KBR 2004). Downstream of Port Wakefield Road the drain joins the Little Para River.
South of Whites Road, informal swales run down the centre, eastern and western sides of Port Wakefield Road. A defined swale drains the eastern paved service road, terminating at an informal detention area in the north-eastern corner of the Ryans Road (east) intersection. This intersection is drained by a network of kerb and gutter, feeding into a pit and pipe system, which discharges to a defined swale on the eastern side of Port Wakefield Road running south to a detention basin in the north-eastern corner of Martins Road. Conceptual design of a stormwater system to drain this intersection to a planned formal detention basin adjacent Ryans Road (east of Port Wakefield Road), and eventually to the Martins Road Drain, has been carried out for the City of Salisbury (KBR 2004).
18
No formal drainage exists at the Ryans Road (west) intersection. South of this, a defined grass swale separates Port Wakefield Road and the unpaved service road on the western side. This swale crosses Daniel Avenue through a pipe and headwall system, continuing south towards Martins Road. Surface runoff from the Martins Road intersection, as well as overflow from the Martins Road detention basin crosses Port Wakefield Road via a pipe and headwall system and outlets into this swale. The swale continues along the western side of Port Wakefield Road to Globe Derby Drive where it crosses via a pipe and headwall system and discharges into Dry Creek.
South of Dry Creek, a defined swale runs along the western side of Port Wakefield Road finally connecting to the Greenfields Connector Wetland. Runoff from the eastern side of Port Wakefield Road drains directly into the Greenfields North Wetland.
A study commissioned by the City of Salisbury is currently underway to determine the flooding conditions within the Greenfields wetlands and upstream catchment. Water is currently transferred across Port Wakefield Road from Green Fields South to the connector wetlands. Overflows from the wetlands are directed to Dry Creek, while baseflows are harvested via an aquifer storage and recovery (ASR) system.
The City of Salisbury has reported an existing flooding problem on the south-eastern corner of Salisbury Highway intersection. This is planned to be investigated as part of the current Green Fields study being commissioned by the council.
2.2 Groundwater
2.2.1 Groundwater use Groundwater resources within the area of interest are considered in the context of the Northern Adelaide Plains region, which is managed by a specific water allocation plan under the NRM Act. The Northern Adelaide Plains is a prescribed wells area, meaning that all groundwater taken for irrigation and other commercial purposes must be licensed.
The area contains relatively fertile soils underlain by a series of water bearing beds of sand, gravels and limestone aquifers which have been heavily utilised by irrigators in the horticultural sectors of Virginia, Waterloo Corner and Angle Vale since the 1950s. Despite licensing water use within this region, the 2003 SA State of the Environment report indicated that groundwater was still being used beyond estimated sustainable limits in this region (Government of South Australia 2003).
Groundwater in the area consists of a series of shallow Quaternary aquifers, beneath which lie the two relatively deep Tertiary aquifers (limestone and sediment based) from which the majority of the region’s groundwater is harvested (NABCWMB 1998). The shallow aquifers, consisting of sand and gravel layers within alluvial silt and clay, are variable in depth and quality. The shallowest lie at a depth of 3–10 m, although groundwater was not intercepted during any of the geotechnical investigations undertaken for this study. The upper tertiary aquifer (‘T1’ aquifer) generally occurs at a depth of around 60–100 m.
19
2.2.2 Groundwater recharge, flows and levels
Groundwater recharge and flows ‘Groundwater recharge’ is the term used to describe the replenishment of the watertable. The deeper tertiary aquifers are recharged from rainfall in the Mount Lofty Ranges, which feeds water into a fractured rock system, which then filters towards the coast recharging the complex aquifer systems of the plains.
In addition to recharge in the Mount Lofty Ranges, the shallow quaternary aquifers are also recharged to a lesser extent by rainfall and infiltration across the plains. Shallow groundwater can be expected in the river alluvium of the main drainage channels for some time after flows. The gravel and sand beds in the Gawler River alluvium are known to be linked to the shallow Quaternary aquifers.
The tertiary aquifers are confined, thus limiting contamination pathways to leaky wells and pollutants in general introduced through established wells (EPA 2006a). Cones of depression brought about through over-extraction are of concern though, as they encourage vertical leakage and horizontal inflow of more saline groundwater from overlying aquifers and thus decline in water quality. The effect of over-demand on groundwater quality is the primary reason for prescription of this region under the old Water Resources Act.
While rainfall is the primary source of recharge of the aquifers of the Northern Adelaide Plains, average annual demand currently outstrips the average recharge rate (NABCWMB 1998). Recognising this imbalance, the Department of Water, Land and Biodiversity Conservation (DWLBC) implemented a quarterly monitoring program to record the height (and salinity) of groundwater tables through surface water observation bore networks (DWLBC 2004, 2006).
Quaternary aquifers A total of 78 wells are monitored in the Northern Adelaide Plains Prescribed Wells Area. During 2001–2003, most Q1 quaternary aquifer wells showed a decline in water level (average 0.31–0.14 m/y), while only minimal declines (average 0.02–0.01 m/y) were recorded in three of the eight Q4 aquifers (DWLBC 2004). Within the same time period, Q2 and Q3 aquifers averaged declines of 0.36–0.18 m/y.
Tertiary aquifers The DWLBC monitored 30 T1 and 51 T2 observation wells during 2001–2003, highlighting a marked trend in water level decline. Potentiometric mapping of the first T1 aquifer revealed two distinct cones of depression during summer 2002, centred on Waterloo Corner and Penrice (DWLBC 2004). Spring 2002 mapping indicated a maximum water level decline of around 5 m in the permanent Penrice depression, and approximately 2 m in the seasonally present Waterloo Corner depression. The T2 aquifer underwent similar potentiometric mapping using data from 51 observation wells throughout the region, and like the T1 aquifer, also displayed marked trends in water level decline (DWLBC 2004). Two cones of depression are evident; the Virginia–Angle Vale and Kangaroo Flat areas are both prone to summer depressions which more or less recover during the winter season. Data from March 2002–2003 indicated a decline of 3–7 m in groundwater level over most of T2 aquifer (DWLBC 2004).

20
2.2.3 Groundwater quality Groundwater quality is monitored throughout the region by the Environment Protection Authority (EPA) and DWLBC. The EPA collects samples from eight bores annually to monitor nutrient (nitrogen, phosphorus) and pesticide concentration. Results are compared against the water quality limits defined by schedule 2 of the Water Quality EPP, and guided by the preservation of environmental values deemed critical to the region. These environmental values include ecosystem function, potable quality, irrigation and livestock consumption. Table 2.2 summarises the EPA quality classification of groundwater resources against environmental values for the 2005 calendar year (EPA 2006a). Each indicator is then discussed in detail following the summary.
Table 2.2 EPA classification of groundwater quality against environmental values
Environmental values Indicator Ecosystem Drinking
water Irrigation Livestock
Oxidised nitrogen Good Good N/A N/A Total nitrogen Good N/A Good N/A Total phosphorus Good N/A Good N/A Metals Good Poor Poor Good Salinity N/A Moderate N/A Good
* N/A not applicable.
Oxidised nitrogen Oxidised nitrogen primarily includes soluble nitrate (NO3) and nitrite (NO2-) that are readily available for plant uptake. Table 2.3 summarises maximum allowable limits set by the Water Quality EPP for freshwater resources.
Table 2.3 Water Quality EPP guidelines for oxidised nitrogen
Indicator Ecosystem Drinking water
Irrigation Livestock
Oxidised nitrogen as nitrogen (mg/L) 0.5 – – – Nitrate NO3 as nitrogen (mg/L) – 10 – 30 Nitrite NO2- as nitrogen (mg/L) – 1 – 10
* Water Quality EPP maximum values based on ANZECC 2000 guidelines.
Nitrite is more toxic than nitrate, with the two forms readily interchangeable in a soluble state via nitrate reducing bacteria. Of the 11 EPA samples taken during 2005 across the Northern Adelaide Plains, 10 results showed less than 0.005 mg/L oxidised nitrogen, with the final result an outlier at 0.195 mg/L oxidised nitrogen. Oxidised nitrogen values were well within the guideline limits, confirming the EPA’s overall assessment of good quality to ensure the protection of environmental values.
Over the last decade, oxidised nitrogen values have occasionally ranged close to 0.5 mg/L, the most sensitive limit set by ecosystem values (EPA 2006a). Slight breaches of this limit occurred in 1997 and 1998, but not since with a trend towards decreasing concentrations since early 2003.
21
Total nitrogen Total nitrogen is a cumulative measure of all organic nitrogen forms (i.e. oxidised nitrogen and ammonia/ammonium). The Water Quality EPP defines a maximum value of 5 mg/L as suitable to maintain freshwater aquatic ecosystem function, in comparison to only 1 mg/L set by the ANZECC 2000 guidelines, which also set a 5 mg/L total nitrogen limit for irrigation values, but equivalent limits for drinking water and stock use are not further elaborated by either document.
Total nitrogen results averaged at 0.11 mg/L (±0.11 mg/L) during the 2005 calendar year (EPA 2006a), which is still far below maximum limits set by either guideline for the protection of aquatic ecosystem and irrigation functions. Total nitrogen results have been consistently within maximum guidelines over the past decade, and add value to the good quality ranking assigned to this indicator in 2005 (EPA 2006a).
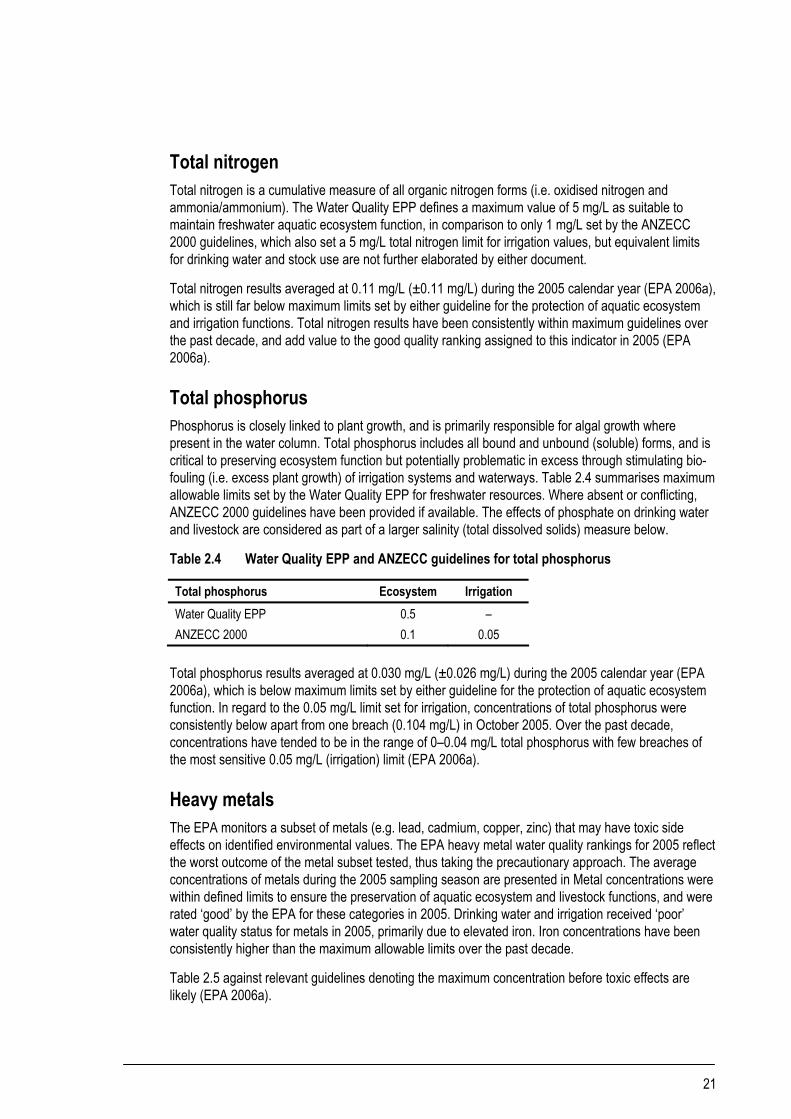
Total phosphorus Phosphorus is closely linked to plant growth, and is primarily responsible for algal growth where present in the water column. Total phosphorus includes all bound and unbound (soluble) forms, and is critical to preserving ecosystem function but potentially problematic in excess through stimulating bio-fouling (i.e. excess plant growth) of irrigation systems and waterways. Table 2.4 summarises maximum allowable limits set by the Water Quality EPP for freshwater resources. Where absent or conflicting, ANZECC 2000 guidelines have been provided if available. The effects of phosphate on drinking water and livestock are considered as part of a larger salinity (total dissolved solids) measure below.
Table 2.4 Water Quality EPP and ANZECC guidelines for total phosphorus
Total phosphorus Ecosystem Irrigation Water Quality EPP 0.5 – ANZECC 2000 0.1 0.05
Total phosphorus results averaged at 0.030 mg/L (±0.026 mg/L) during the 2005 calendar year (EPA 2006a), which is below maximum limits set by either guideline for the protection of aquatic ecosystem function. In regard to the 0.05 mg/L limit set for irrigation, concentrations of total phosphorus were consistently below apart from one breach (0.104 mg/L) in October 2005. Over the past decade, concentrations have tended to be in the range of 0–0.04 mg/L total phosphorus with few breaches of the most sensitive 0.05 mg/L (irrigation) limit (EPA 2006a).
Heavy metals The EPA monitors a subset of metals (e.g. lead, cadmium, copper, zinc) that may have toxic side effects on identified environmental values. The EPA heavy metal water quality rankings for 2005 reflect the worst outcome of the metal subset tested, thus taking the precautionary approach. The average concentrations of metals during the 2005 sampling season are presented in Metal concentrations were within defined limits to ensure the preservation of aquatic ecosystem and livestock functions, and were rated ‘good’ by the EPA for these categories in 2005. Drinking water and irrigation received ‘poor’ water quality status for metals in 2005, primarily due to elevated iron. Iron concentrations have been consistently higher than the maximum allowable limits over the past decade.
Table 2.5 against relevant guidelines denoting the maximum concentration before toxic effects are likely (EPA 2006a).

22
Metal concentrations were within defined limits to ensure the preservation of aquatic ecosystem and livestock functions, and were rated ‘good’ by the EPA for these categories in 2005. Drinking water and irrigation received ‘poor’ water quality status for metals in 2005, primarily due to elevated iron. Iron concentrations have been consistently higher than the maximum allowable limits over the past decade.
Table 2.5 Metal concentrations versus guideline limits
Guideline limits* Metals Average SD Ecosystem Drinking Irrigation Livestock Lead 0.001 0.002 0.005 0.01 0.2 0.1 Iron 0.728 0.457 1.0 0.3 (taste) 1.0 N/A Copper 0.001 0.001 0.01 2.0 0.2 0.5 Zinc 0.008 0.009 0.05 3 (taste) 2.0 20 Aluminium 0.056 0.052 0.1 N/A 1.0 5.0
* Limits as defined by Water Quality EPP, or where absent, NHMRC & ARMCANZ 1996 (light grey shading), or ANZECC 2000 (dark grey shading).
N/A indicates no limit as not sufficiently toxic. For notes on the parameters and acronyms included in the table please refer to the glossary and abbreviations.
Salinity Salinity or total dissolved solids (TDS) is a measure of the concentrations of all inorganic salts. Surface waters salinity can vary dramatically with rainfall and flow, as can groundwater resources depending on resultant recharge. The salinity of ground and surface waters guides potential application, but must be considered in the context of other confounding factors including ion composition of waters (e.g. bicarbonate versus sodium), soil attributes (e.g. clay versus sand), crop selection (e.g. beans versus barley), livestock type (e.g. poultry versus sheep), and ecosystem requirements (e.g. brackish versus freshwater). Table 2.6 summarises TDS water quality guidelines (where available) from the Water Quality EPP, ANZECC (2000) or NHMRC & ARMCANZ (1996).
Table 2.6 Salinity guidelines
Guideline limits TDS (salinity) Ecosystem Drinking
water Irrigation Livestock
Water Quality EPP 10% variation – – – ANZECC 2000 – – Dependent on
multiple factors 2000 mg/L
(poultry – most sensitive) NHMRC & ARMCANZ 1996
– 500 mg/L – –
TDS results averaged at 1140 mg/L (±500 mg/L) during the 2005 calendar year (EPA 2006a). TDS frequently varied by more than 10%, affecting ecosystem values, and was never below the 500 mg/L threshold for drinking water quality explaining the 2005 EPA ranking of ‘moderate’ for this value. Irrigation values were potentially impacted, but dependent on multiple factors. The horticultural sectors of the Northern Adelaide Plains are primarily situated on sandy clays, with crops ranging from bean and carrot to cucumber and zucchini. Areas with high clay content and sensitive crop selections are most at risk of TDS related impacts. Livestock was not affected thus attaining a ‘good’ EPA water

23
quality ranking, with TDS remaining below the most sensitive threshold set for poultry. High salinity levels were the main reason for prescription, with leaky wells and overuse contributing to increases in TDS.
Pesticides The EPA conducts an annual monitoring program for 30 different herbicides, fungicides and insecticides in major aquifers of the greater metropolitan area. The detection of these contaminants is significant, and would spur further assessment and or management to limit potential impacts. The monitoring program has been running since 1996, during which time pesticides have not been detected.
2.2.4 Mitigation of groundwater impacts Negative groundwater impacts have been identified in the Northern Adelaide Plains region, and are being addressed through a variety of long term projects and policy. The Northern Adelaide Plains Prescribed Wells Area was introduced in 1976 under the Water Resources Act, in response to cones of depression that formed after intensive pumping in the 1960s. Capped extraction through licensing is, however, yet to improve significantly the health and condition of underground aquifers – the State of the Environment report indicated that groundwater was still being used beyond estimated sustainable limits (Government of South Australia 2003).
The control and improvement of groundwater quality is also being tackled through the use of alternative, recycled waters and the DWLBC Leaky Wells project which compiled and audited a list of licensed wells in the Northern Adelaide Plains, thereby identifying old and abandoned wells that may act as contamination points. Old, unused and poorly constructed wells were backfilled to prevent direct pollution of production aquifers. Licensed wells were checked for salinity, and examined for integrity, with leaky wells targeted for repair. The use of alternative water resources for primary production is another way to reduce the demand and thus strain on groundwater reserves (EPA 2006a). The Virginia Irrigation Scheme and various ASR programs are helping to reduce demands on tertiary aquifers.
In addition to declining aquifer volumes and quality, the Northern Adelaide Plains also has rising shallow watertables near Virginia, attributed to excessive leaching of water beneath irrigation areas (CSIRO 2002). A working group gathered the information required to help manage this issue, including detailed water use patterns, leaching losses beneath irrigated crops with and without management systems, and a better understanding of the inter-aquifer flows between near-surface and Tertiary and Quaternary aquifers. The working group proposed development of an integrated land and water management plan for the region, as well as intensive education and awareness campaigns for residents (CSIRO 2002).
2.3 Surface water quality Investigations of surface water quality have focused on determining existing conditions by reviewing existing water quality data. No additional sampling has been done to establish baseline conditions, primarily due to time constraints. The current drought conditions in South Australia also mean there is a lack of significant flows in the watercourses of the Northern Adelaide Plains.

24
2.3.1 Existing surface water quality Surface water quality is monitored across the Northern Adelaide Plains by community, local, state and Australian government run programs. The AUS RIVer Assessment System (AUSRIVAS) program was an Australian Government initiative that provided a rapid assessment of the biological health of Australian rivers. AUSRIVAS assessed macro-invertebrate diversity and recorded basic stream attributes to determine overall biological health, in a once-off initiative running 2000–2004.
The EPA and DWLBC run ongoing surface water monitoring programs with State funding. The EPA program measures various water quality indicators (e.g. phosphorus, nitrogen, and salinity), macro-invertebrates, and or seagrass cover depending on the location. The DWLBC runs a separate yet symbiotic program tracking stream flow volumes and rates, which in conjunction with local climate data, provides some explanation to seasonal and storm induced fluctuations in water quality. Surface water quality data are available for most major streams within the study area, and where there are other tributaries of interest, local government and community often supplement this information through volunteer-based or locally funded monitoring programs such as the Waterwatch program. Monitoring frequency varies, from continuous data loggers recording stream flow to quarterly or bi-annual water chemistry assessments.
Several existing ASR schemes within the project are also required to monitor water quality for EPA licensing purposes. These data are generally collected and maintained by the individual councils, with testing carried out at the Australian Water Quality Centre (AWQC).
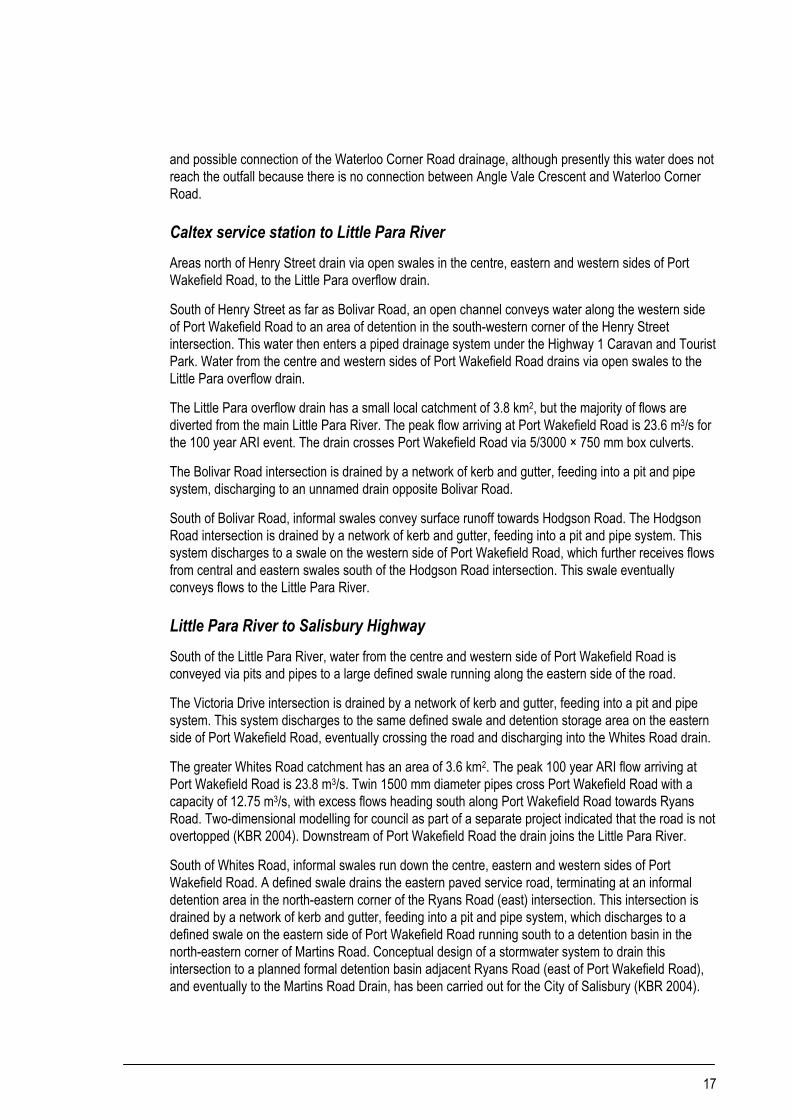
Surface water quality monitoring stations throughout the study area are shown in Figure 2.2.
Surface water quality guidelines The creeks and drains across the Northern Adelaide Plains generally consist of rural upper catchments, with highly urbanised, or horticultural catchments in the lower reaches. All waterways eventually discharge to the Gulf St Vincent.
The watercourses provide some recreational amenity, but more importantly habitat for plants, fish, birds and mammals – particularly at the final discharge location.
In accordance with this environmental value, the Australian and New Zealand Guidelines for Fresh and Marine Water Quality (ANZECC 2000) apply to these waterways, as well as the Water Quality EPP.
The environmental value of aquatic ecosystems includes their ecological integrity and the associated native flora and fauna. Preserving these features involves protecting the ability of the water to support and maintain a balanced community of organisms comparable with that of a natural habitat (EPA 2003).
Throughout this chapter, baseline surface water quality is compared to the guideline values provided in Schedule 2 of the Water Quality EPP or where absent the ANZECC 2000 guidelines.

!(!(")!(!(
")
#*!(")!(
!(!(")
!(
")!(
") !(!(!(
")
")
!(
WX
WX
WX
WX
WX
WX
o
ParafieldAirport
o
RAAF BaseEd inburgh Elizabeth
Gawler
Angle Vale
Virginia
Modbury
St Kilda
Main N or th
Road
Angle Vale Road
Port Wakefield Road
Two Wells Road
Salisbu
ry Highw
ay
Bridge
Road
Womma Road
Penfield RoadSmith CreekOutfall
Helps
Road
Drain
Gawler River
Little Para River
Dry Creek
Greenf ields wetlandsPaddockswetlands
Kaurna Park wetlands
StebonheathFlow Control Park
Lit tle ParaReservoir
Turretfield(off map)
Valley view (of f map)
Water qualitymonitoring sites
±0 2
km
Figure 2.2 Watercourse!( AUSRIVAS monitoring site#* EPA monitor ing site
") Water Watch monitor ing s ite
WX Other monitor ing sites (Council etc)Catchment boundary
27
26
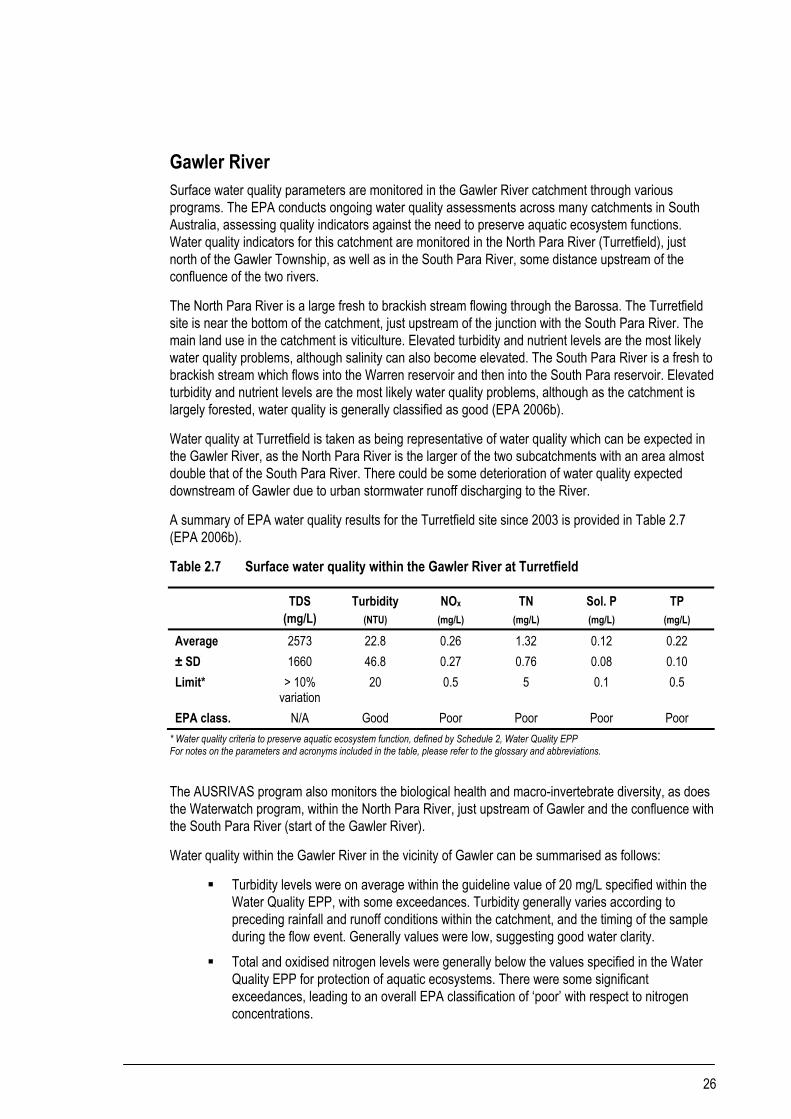
Gawler River Surface water quality parameters are monitored in the Gawler River catchment through various programs. The EPA conducts ongoing water quality assessments across many catchments in South Australia, assessing quality indicators against the need to preserve aquatic ecosystem functions. Water quality indicators for this catchment are monitored in the North Para River (Turretfield), just north of the Gawler Township, as well as in the South Para River, some distance upstream of the confluence of the two rivers.
The North Para River is a large fresh to brackish stream flowing through the Barossa. The Turretfield site is near the bottom of the catchment, just upstream of the junction with the South Para River. The main land use in the catchment is viticulture. Elevated turbidity and nutrient levels are the most likely water quality problems, although salinity can also become elevated. The South Para River is a fresh to brackish stream which flows into the Warren reservoir and then into the South Para reservoir. Elevated turbidity and nutrient levels are the most likely water quality problems, although as the catchment is largely forested, water quality is generally classified as good (EPA 2006b).
Water quality at Turretfield is taken as being representative of water quality which can be expected in the Gawler River, as the North Para River is the larger of the two subcatchments with an area almost double that of the South Para River. There could be some deterioration of water quality expected downstream of Gawler due to urban stormwater runoff discharging to the River.
A summary of EPA water quality results for the Turretfield site since 2003 is provided in Table 2.7 (EPA 2006b).
Table 2.7 Surface water quality within the Gawler River at Turretfield
TDS (mg/L)
Turbidity (NTU)
NOx (mg/L)
TN (mg/L)
Sol. P (mg/L)
TP (mg/L)
Average 2573 22.8 0.26 1.32 0.12 0.22 ± SD 1660 46.8 0.27 0.76 0.08 0.10 Limit* > 10%
variation 20 0.5 5 0.1 0.5
EPA class. N/A Good Poor Poor Poor Poor * Water quality criteria to preserve aquatic ecosystem function, defined by Schedule 2, Water Quality EPP For notes on the parameters and acronyms included in the table, please refer to the glossary and abbreviations.
The AUSRIVAS program also monitors the biological health and macro-invertebrate diversity, as does the Waterwatch program, within the North Para River, just upstream of Gawler and the confluence with the South Para River (start of the Gawler River).
Water quality within the Gawler River in the vicinity of Gawler can be summarised as follows:
Turbidity levels were on average within the guideline value of 20 mg/L specified within the Water Quality EPP, with some exceedances. Turbidity generally varies according to preceding rainfall and runoff conditions within the catchment, and the timing of the sample during the flow event. Generally values were low, suggesting good water clarity.
Total and oxidised nitrogen levels were generally below the values specified in the Water Quality EPP for protection of aquatic ecosystems. There were some significant exceedances, leading to an overall EPA classification of ‘poor’ with respect to nitrogen concentrations.
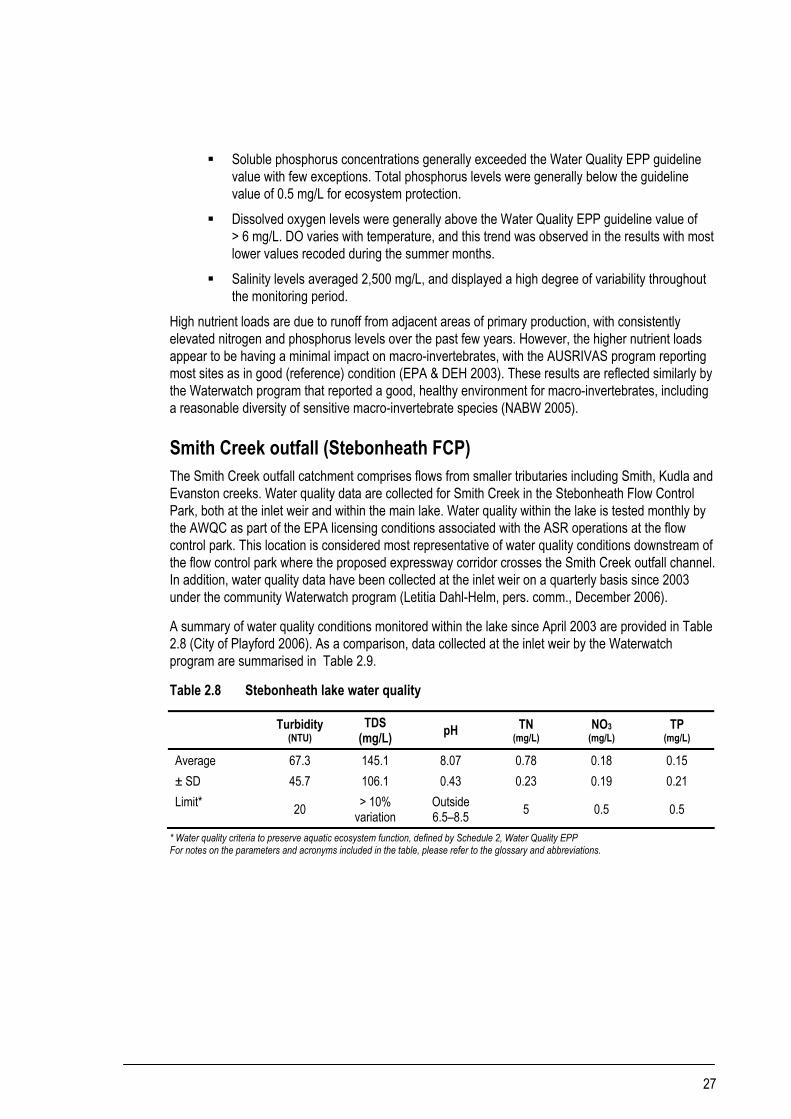
27
Soluble phosphorus concentrations generally exceeded the Water Quality EPP guideline value with few exceptions. Total phosphorus levels were generally below the guideline value of 0.5 mg/L for ecosystem protection.
Dissolved oxygen levels were generally above the Water Quality EPP guideline value of > 6 mg/L. DO varies with temperature, and this trend was observed in the results with most lower values recoded during the summer months.
Salinity levels averaged 2,500 mg/L, and displayed a high degree of variability throughout the monitoring period.
High nutrient loads are due to runoff from adjacent areas of primary production, with consistently elevated nitrogen and phosphorus levels over the past few years. However, the higher nutrient loads appear to be having a minimal impact on macro-invertebrates, with the AUSRIVAS program reporting most sites as in good (reference) condition (EPA & DEH 2003). These results are reflected similarly by the Waterwatch program that reported a good, healthy environment for macro-invertebrates, including a reasonable diversity of sensitive macro-invertebrate species (NABW 2005).
Smith Creek outfall (Stebonheath FCP) The Smith Creek outfall catchment comprises flows from smaller tributaries including Smith, Kudla and Evanston creeks. Water quality data are collected for Smith Creek in the Stebonheath Flow Control Park, both at the inlet weir and within the main lake. Water quality within the lake is tested monthly by the AWQC as part of the EPA licensing conditions associated with the ASR operations at the flow control park. This location is considered most representative of water quality conditions downstream of the flow control park where the proposed expressway corridor crosses the Smith Creek outfall channel. In addition, water quality data have been collected at the inlet weir on a quarterly basis since 2003 under the community Waterwatch program (Letitia Dahl-Helm, pers. comm., December 2006).
A summary of water quality conditions monitored within the lake since April 2003 are provided in Table 2.8 (City of Playford 2006). As a comparison, data collected at the inlet weir by the Waterwatch program are summarised in Table 2.9.
Table 2.8 Stebonheath lake water quality
Turbidity (NTU)
TDS (mg/L) pH TN
(mg/L) NO3
(mg/L) TP
(mg/L)
Average 67.3 145.1 8.07 0.78 0.18 0.15 ± SD 45.7 106.1 0.43 0.23 0.19 0.21 Limit* 20 > 10%
variation Outside 6.5–8.5 5 0.5 0.5
* Water quality criteria to preserve aquatic ecosystem function, defined by Schedule 2, Water Quality EPP For notes on the parameters and acronyms included in the table, please refer to the glossary and abbreviations.

28
Table 2.9 Stebonheath FCP inlet weir water quality
Turbidity (NTU)
DO (mg/L) pH NO3-
(mg/L) TP
(mg/L) Average 57.12 6.10 7.09 0.14 0.1 ± SD 58.88 0.7 0.49 0.25 0.11 Limit* 20 > 6 Outside
6.5–8.5 N/A 0.5
* Water quality criteria to preserve aquatic ecosystem function, defined by Schedule 2, Water Quality EPP For notes on the parameters and acronyms included in the table, please refer to the glossary and abbreviations.
In addition to the parameters given in Table 2.8, Council also monitor heavy metal concentrations within the lake. Recorded concentrations for metals commonly found in stormwater runoff are summarised in Table 2.10.
Table 2.10 Heavy metal concentrations in Stebonheath Lake
Copper (mg/L)
Lead (mg/L) Zinc (mg/L) Mercury
(mg/L) Cadmium
(mg/L) Nickel (mg/L)
Average 0.005 0.003 0.018 BLD** BLD** 0.0076 ± SD 0.003 0.002 0.015 – – 0.007 Limit* 0.01 0.005 0.05 0.0001 0.002 0.15
* Water quality criteria to preserve aquatic ecosystem function, defined by Schedule 2, Water Quality EPP ** BLD indicates samples were consistently below the limits of detection for those parameters.
Water quality within the Smith Creek outfall, within the Stebonheath Lake can be summarised as follows:
Turbidity generally exceeds the limit of 20 mg/L set by the Water Quality EPP. This is typical of an urbanised catchment and indicative of the development occurring in the upstream catchment.
Total nitrogen and total phosphorus are both well within the limits set by the Water Quality EPP
Heavy metal concentrations were generally all within the limits specified for the protection of aquatic ecosystems, with the exception of iron which consistently exceeded the 1 mg/L guideline level.
pH levels were typically neutral or slightly above, and within the guideline values. Dissolved oxygen levels measured at the inlet weir range around the limit of 6 mg/L below
which ecosystem functions become compromised. Water quality within the Smith Creek outfall channel is typical of an urbanised catchment, with elevated turbidity and low dissolved oxygen levels indicating a high organic content and sediment influx from the surrounding urbanised catchment. Nutrient and metal concentrations are generally within the limits of the Water Quality EPP guidelines.
Water quality data presented is tested within the Stebonheath flow control park in which it is likely that water quality treatment takes place. There is the possibility that there is some deterioration in water quality downstream of the facility due to additional stormwater discharges from urban areas and re-suspension of material within unvegetated earthen channels.
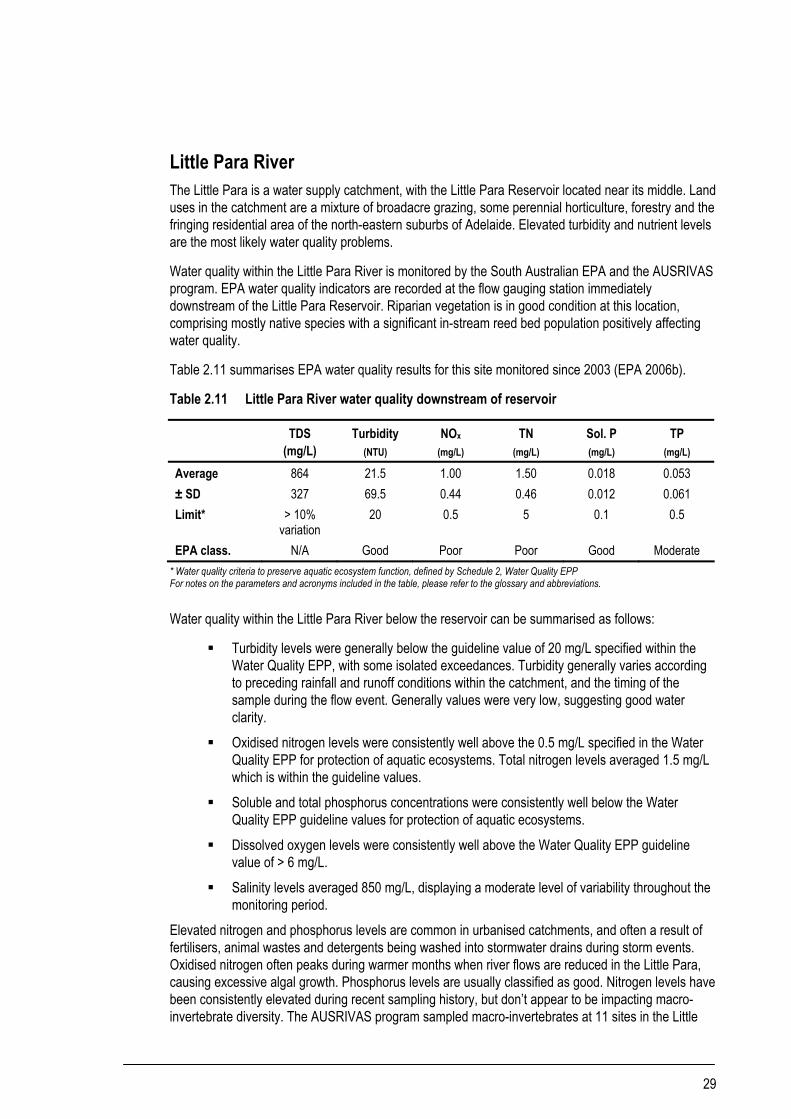
29
Little Para River The Little Para is a water supply catchment, with the Little Para Reservoir located near its middle. Land uses in the catchment are a mixture of broadacre grazing, some perennial horticulture, forestry and the fringing residential area of the north-eastern suburbs of Adelaide. Elevated turbidity and nutrient levels are the most likely water quality problems.
Water quality within the Little Para River is monitored by the South Australian EPA and the AUSRIVAS program. EPA water quality indicators are recorded at the flow gauging station immediately downstream of the Little Para Reservoir. Riparian vegetation is in good condition at this location, comprising mostly native species with a significant in-stream reed bed population positively affecting water quality.
Table 2.11 summarises EPA water quality results for this site monitored since 2003 (EPA 2006b).
Table 2.11 Little Para River water quality downstream of reservoir
TDS (mg/L)
Turbidity (NTU)
NOx (mg/L)
TN (mg/L)
Sol. P (mg/L)
TP (mg/L)
Average 864 21.5 1.00 1.50 0.018 0.053 ± SD 327 69.5 0.44 0.46 0.012 0.061 Limit* > 10%
variation 20 0.5 5 0.1 0.5
EPA class. N/A Good Poor Poor Good Moderate * Water quality criteria to preserve aquatic ecosystem function, defined by Schedule 2, Water Quality EPP For notes on the parameters and acronyms included in the table, please refer to the glossary and abbreviations.
Water quality within the Little Para River below the reservoir can be summarised as follows:
Turbidity levels were generally below the guideline value of 20 mg/L specified within the Water Quality EPP, with some isolated exceedances. Turbidity generally varies according to preceding rainfall and runoff conditions within the catchment, and the timing of the sample during the flow event. Generally values were very low, suggesting good water clarity.
Oxidised nitrogen levels were consistently well above the 0.5 mg/L specified in the Water Quality EPP for protection of aquatic ecosystems. Total nitrogen levels averaged 1.5 mg/L which is within the guideline values.
Soluble and total phosphorus concentrations were consistently well below the Water Quality EPP guideline values for protection of aquatic ecosystems.
Dissolved oxygen levels were consistently well above the Water Quality EPP guideline value of > 6 mg/L.
Salinity levels averaged 850 mg/L, displaying a moderate level of variability throughout the monitoring period.
Elevated nitrogen and phosphorus levels are common in urbanised catchments, and often a result of fertilisers, animal wastes and detergents being washed into stormwater drains during storm events. Oxidised nitrogen often peaks during warmer months when river flows are reduced in the Little Para, causing excessive algal growth. Phosphorus levels are usually classified as good. Nitrogen levels have been consistently elevated during recent sampling history, but don’t appear to be impacting macro-invertebrate diversity. The AUSRIVAS program sampled macro-invertebrates at 11 sites in the Little
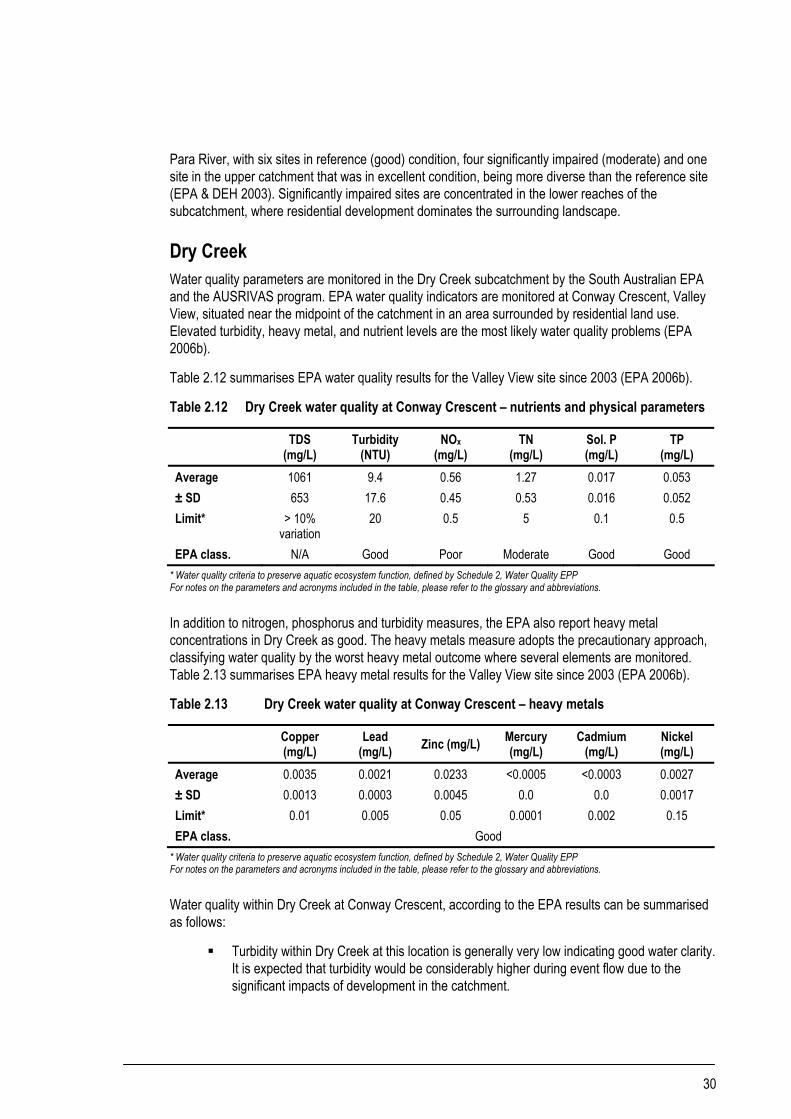
30
Para River, with six sites in reference (good) condition, four significantly impaired (moderate) and one site in the upper catchment that was in excellent condition, being more diverse than the reference site (EPA & DEH 2003). Significantly impaired sites are concentrated in the lower reaches of the subcatchment, where residential development dominates the surrounding landscape.
Dry Creek Water quality parameters are monitored in the Dry Creek subcatchment by the South Australian EPA and the AUSRIVAS program. EPA water quality indicators are monitored at Conway Crescent, Valley View, situated near the midpoint of the catchment in an area surrounded by residential land use. Elevated turbidity, heavy metal, and nutrient levels are the most likely water quality problems (EPA 2006b).
Table 2.12 summarises EPA water quality results for the Valley View site since 2003 (EPA 2006b).
Table 2.12 Dry Creek water quality at Conway Crescent – nutrients and physical parameters
TDS (mg/L)
Turbidity (NTU)
NOx (mg/L)
TN (mg/L)
Sol. P (mg/L)
TP (mg/L)
Average 1061 9.4 0.56 1.27 0.017 0.053 ± SD 653 17.6 0.45 0.53 0.016 0.052 Limit* > 10%
variation 20 0.5 5 0.1 0.5
EPA class. N/A Good Poor Moderate Good Good * Water quality criteria to preserve aquatic ecosystem function, defined by Schedule 2, Water Quality EPP For notes on the parameters and acronyms included in the table, please refer to the glossary and abbreviations.
In addition to nitrogen, phosphorus and turbidity measures, the EPA also report heavy metal concentrations in Dry Creek as good. The heavy metals measure adopts the precautionary approach, classifying water quality by the worst heavy metal outcome where several elements are monitored. Table 2.13 summarises EPA heavy metal results for the Valley View site since 2003 (EPA 2006b).
Table 2.13 Dry Creek water quality at Conway Crescent – heavy metals
Copper (mg/L)
Lead (mg/L) Zinc (mg/L) Mercury
(mg/L) Cadmium
(mg/L) Nickel (mg/L)
Average 0.0035 0.0021 0.0233 <0.0005 <0.0003 0.0027 ± SD 0.0013 0.0003 0.0045 0.0 0.0 0.0017 Limit* 0.01 0.005 0.05 0.0001 0.002 0.15 EPA class. Good
* Water quality criteria to preserve aquatic ecosystem function, defined by Schedule 2, Water Quality EPP For notes on the parameters and acronyms included in the table, please refer to the glossary and abbreviations.
Water quality within Dry Creek at Conway Crescent, according to the EPA results can be summarised as follows:
Turbidity within Dry Creek at this location is generally very low indicating good water clarity. It is expected that turbidity would be considerably higher during event flow due to the significant impacts of development in the catchment.
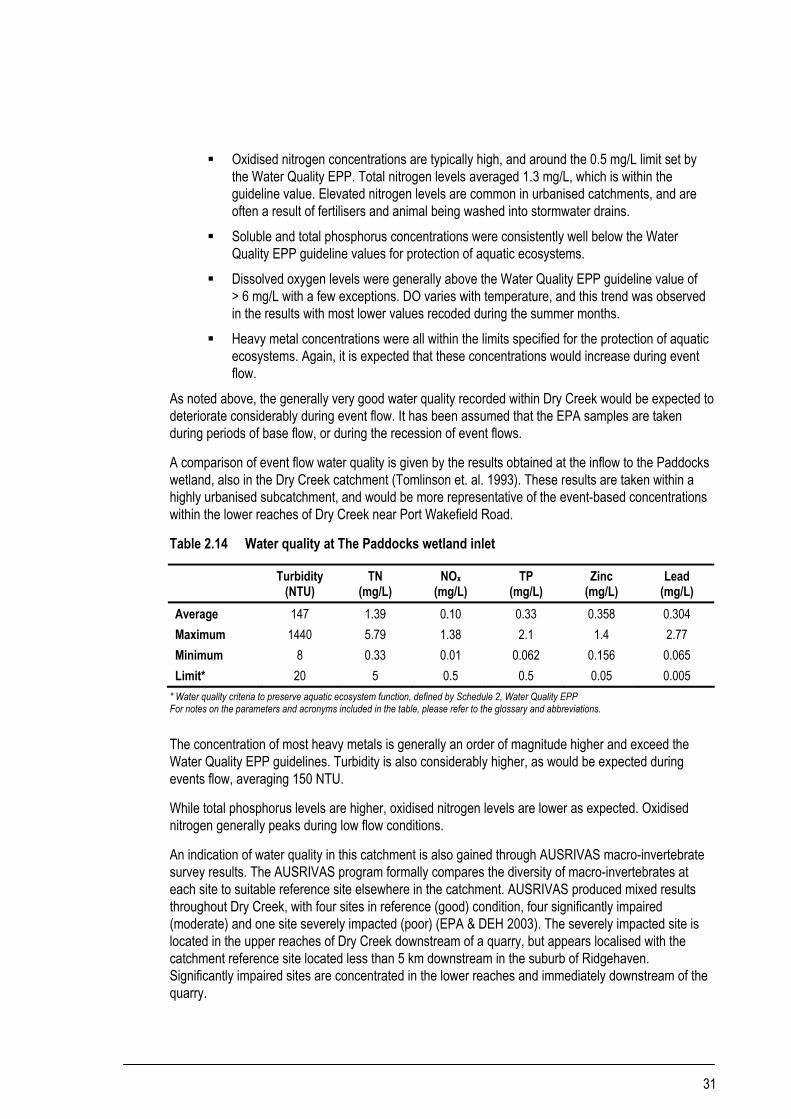
31
Oxidised nitrogen concentrations are typically high, and around the 0.5 mg/L limit set by the Water Quality EPP. Total nitrogen levels averaged 1.3 mg/L, which is within the guideline value. Elevated nitrogen levels are common in urbanised catchments, and are often a result of fertilisers and animal being washed into stormwater drains.
Soluble and total phosphorus concentrations were consistently well below the Water Quality EPP guideline values for protection of aquatic ecosystems.
Dissolved oxygen levels were generally above the Water Quality EPP guideline value of > 6 mg/L with a few exceptions. DO varies with temperature, and this trend was observed in the results with most lower values recoded during the summer months.
Heavy metal concentrations were all within the limits specified for the protection of aquatic ecosystems. Again, it is expected that these concentrations would increase during event flow.
As noted above, the generally very good water quality recorded within Dry Creek would be expected to deteriorate considerably during event flow. It has been assumed that the EPA samples are taken during periods of base flow, or during the recession of event flows.
A comparison of event flow water quality is given by the results obtained at the inflow to the Paddocks wetland, also in the Dry Creek catchment (Tomlinson et. al. 1993). These results are taken within a highly urbanised subcatchment, and would be more representative of the event-based concentrations within the lower reaches of Dry Creek near Port Wakefield Road.
Table 2.14 Water quality at The Paddocks wetland inlet
Turbidity (NTU)
TN (mg/L)
NOx (mg/L)
TP (mg/L)
Zinc (mg/L)
Lead (mg/L)
Average 147 1.39 0.10 0.33 0.358 0.304 Maximum 1440 5.79 1.38 2.1 1.4 2.77 Minimum 8 0.33 0.01 0.062 0.156 0.065 Limit* 20 5 0.5 0.5 0.05 0.005
* Water quality criteria to preserve aquatic ecosystem function, defined by Schedule 2, Water Quality EPP For notes on the parameters and acronyms included in the table, please refer to the glossary and abbreviations.
The concentration of most heavy metals is generally an order of magnitude higher and exceed the Water Quality EPP guidelines. Turbidity is also considerably higher, as would be expected during events flow, averaging 150 NTU.
While total phosphorus levels are higher, oxidised nitrogen levels are lower as expected. Oxidised nitrogen generally peaks during low flow conditions.
An indication of water quality in this catchment is also gained through AUSRIVAS macro-invertebrate survey results. The AUSRIVAS program formally compares the diversity of macro-invertebrates at each site to suitable reference site elsewhere in the catchment. AUSRIVAS produced mixed results throughout Dry Creek, with four sites in reference (good) condition, four significantly impaired (moderate) and one site severely impacted (poor) (EPA & DEH 2003). The severely impacted site is located in the upper reaches of Dry Creek downstream of a quarry, but appears localised with the catchment reference site located less than 5 km downstream in the suburb of Ridgehaven. Significantly impaired sites are concentrated in the lower reaches and immediately downstream of the quarry.

32
Helps Road drain Water quality parameters are collected by the Waterwatch program, including nitrate, phosphate, pH, turbidity and salinity, and macro-invertebrate data through the snapshot program.
Table 2.15 summarises water quality at the inlet dam wall of the Kaurna Park Wetland, measured biannually since 2003 (Letitia Dahl-Helm, pers. comm., December 2006).
Table 2.15 Water quality in the Helps Road drain upstream of Kaurna Park
pH EC (µS/cm)
Turbidity (NTU)
Nitrate (mg/L)
TP (mg/L)
Average 6.67 260 72.50 0.18 0.23 ± SD 0.52 114.02 112.86 0.30 0.19 Limit* Outside
6.5–8.5 > 10%
variation 20 N/A 0.5
* Water quality criteria to preserve aquatic ecosystem function, defined by Schedule 2, Water Quality EPP For notes on the parameters and acronyms included in the table, please refer to the glossary and abbreviations.
Water quality within the Helps Road drain upstream of Kaurna Park can be summarised as follows:
Turbidity within the Helps Road drain averaged 72 NTU, exceeding the guideline value in the Water Quality EPP for protection of aquatic ecosystems.
Nitrate concentrations averaged 0.1 mg/L. While no guideline value is specified for nitrate alone (only oxidised nitrogen, which also includes nitrite), it is expected that the NOx concentration would be within the guideline value.
Total phosphorus concentrations were consistently below the Water Quality EPP guideline values for protection of aquatic ecosystems.
Salinity, measured in this case as electrical conductivity (EC), is low but often varies by more than 10% thus placing the aquatic environment under significant stress.
The variable water quality conditions are typical of an urbanised catchment. A trash rack operating in the downstream reaches of Kaurna Park limits gross pollutant entry into the Barker Inlet.
Water quality can also be inferred from periodic Waterwatch snapshot results collected by Burton Primary School. In spring 2005, 13 different species were identified in the Kaurna Park Wetlands, Helps Road drain, indicating a ‘fairly healthy environment’ (NABW 2005).
Event based water quality is also monitored at two sites upstream and downstream of the Edinburgh Parks industrial precinct, as well as within the Kaurna Park wetland complex as part of the EPA licensing conditions associated with the ASR operations within the wetlands. Results from these monitoring programs were not available at the time of preparation of this report.
33
2.4 Summary of existing conditions
2.4.1 Flooding and drainage Drainage conditions between Gawler and Port Wakefield Road are characterised by the Gawler River to the north, the man made Smith Creek outfall, and a series of smaller, often informal and ineffective local drainage systems. The extremely flat topography of the area and the rural nature of much of the catchment over which the proposed expressway passes make drainage in some areas extremely difficult, which has resulted in a number of existing localised flooding areas.
The Gawler River, although historically prone to serious flooding, will flood with much less frequency following flood mitigation works due for completion in 2008–2009. The extent of the 100 year ARI floodplain at the proposed expressway crossing will be confirmed during the detailed design phase.
Little information is available on flooding conditions within the Smith Creek outfall, although preliminary calculations indicate that the existing channel does not have sufficient capacity for the estimated 100 year ARI discharge from the Stebonheath Flow Control Park.
Drainage conditions along Port Wakefield Road between Taylor Road and Salisbury Highway are characterised by Dry Creek and Little Para River to the South, the man made Helps Road Drain to the north, and a series of smaller, local drainage systems, some of which discharge to the major drainage systems to the west of Port Wakefield Road and some of which have separate outfalls.
All of the major drainage systems are currently of 100 year ARI capacity in the vicinity of Port Wakefield Road, either through channel improvement or diversion works, construction of upstream flood mitigation facilities or the use of levee banks. Crossings of Port Wakefield Road are also to 100 year ARI standard and do not result in flooding of the road during flow events. Some smaller drainage catchments have crossings of a lower standard, with overflows contained or redirected to prevent inundation of the road and/or private property.
2.4.2 Groundwater The project area lies within the area known as the Northern Adelaide Plains Prescribed Wells Area. The area contains relatively fertile soils underlain by a series of water bearing beds of sand, gravels and limestone aquifers which have been heavily used by irrigators in the horticultural sectors of Virginia, Waterloo Corner and Angle Vale since the 1950s.
Over-extraction of the tertiary aquifers (T1 and T2) of the plains has lead to the creation of pronounced cones of depression centred around Waterloo Corner and Virginia. These are of concern as they encourage vertical leakage and horizontal inflow of more saline groundwater from overlying Quaternary aquifers and thus decline in water quality. With the potential for ingress of water from shallow aquifers, this also creates a risk of contamination by other means.
Salinity of groundwater within the study area is currently considered fair, but is at risk of becoming unacceptable with increased over extraction. The quality of groundwater meets the EPA guidelines for all other environmental values, with the exception of iron concentrations, which exceed guideline values for irrigation and drinking water.

34
2.4.3 Surface water quality The surface watercourses along the Gawler to Port Wakefield Road section of the proposal are of variable quality. The Gawler River was classified poor for total nitrogen, total phosphorus and soluble phosphorus in 2006, but still maintained a good healthy diversity of macro-invertebrates. Smith Creek on the other hand was well within range for total nitrogen and total phosphorus, but had reduced dissolved oxygen at the inlet to the Stebonheath Flow Control Park and had a higher turbidity. High nutrient and sediment mobilisation are characteristic of a landscape dominated by horticultural and agricultural practices. The construction and operation phases of the development may contribute additional nutrients or sediment if inappropriately managed, and it will be important to ensure that measures are taken to limit additional contamination. The presence of sensitive macro-invertebrates in the Gawler River indicates this is an ecosystem requiring protection.
The surface watercourses along Port Wakefield Road are of variable quality. A number of water quality improvement facilities, such as Greenfields Wetlands, the Paddocks Wetland, Kaurna Park Wetlands and numerous other small stormwater wetlands have been constructed throughout the catchment in an effort to reduce the load of stormwater pollutants reaching Barker Inlet. Little information is available for the water resources immediately adjacent Port Wakefield Road, however water quality in other locations throughout the catchment gives an indication of the overall waterway health and load transported during runoff events. The generally variable nature of water quality is typical of the urban catchments at the downstream end of the watercourses, as are the high turbidity levels and elevated nutrient and heavy metal concentrations recorded in some locations.
The proximity of Port Wakefield Road to the marine receiving environment (Barker Inlet) means that efforts should focus on preventing any increased stormwater pollution leaving the corridor. This will be particularly important during construction.

35
3 Effects of project upon existing conditions
3.1 General considerations The Northern Expressway Project will construct a new high speed transport route from the Gawler Bypass to Port Wakefield Road (exiting north of Taylor Road), and make minor upgrades to the existing Port Wakefield Road (addition of extra carriageways) from Taylor Road to Salisbury Highway. The northern section will intersect two major waterways, the Gawler River and Smith Creek, and will theoretically increase runoff from new impermeable roadways that could impact local water resources. The southern section, as a minor upgrade, will theoretically also increase local runoff to a lesser extent, and will necessitate minor alterations to the existing stormwater drainage infrastructure.
Roadway construction and associated vehicle use can affect water quality and aquatic ecosystems in a variety of ways. Potential impacts can be characterised in three main areas (Transport SA 2002):
hydrological – altering the volume, timing and direction of surface and subsurface flows physical – altering landforms, creek lines and ambient water temperature pollution – during construction and operation phases from vehicles, machinery and
materials. The proposed development has the potential to affect water resources during two distinct phases; construction and operation.
Construction effects will centre on earth works and vegetation loss, and receiving water quality may be adversely affected as a result of erosion and sedimentation. Sediment laden stormwater runoff has the potential to be transported from exposed construction areas to the receiving waters by existing stormwater infrastructure.
During the operational phase, stormwater runoff from the impervious road surface would have elevated pollutant concentrations, particularly around interchanges and merging lanes where braking and acceleration is common and the associated deposition of pollutants onto the road surface is likely to be greatest. The potential for spills and leaks of toxic substances as a result of traffic accidents also exists, with these substances transported to receiving waters via existing infrastructure, or seeping into groundwater.
Stormwater management is critical for the Northern Expressway, and is considered in a separate KBR (2006) research report that guided the design and route selection phase. The Port Wakefield Road Upgrade is less likely to create new impacts on local water quality, given the existence of current infrastructure. Existing crossings over the Helps Road drain, Little Para River and Dry Creek will not be affected, but any careless discharges to these and other existing waterways may have serious effects on the downstream marine environment.
This section considers all possible impacts on the quantity and quality of local waters during the two phases of disturbance, while Section 4 proposes actions to prevent or mitigate identified effects.

36
3.2 Construction effects
3.2.1 Flooding and drainage Given the flat nature of the Northern Adelaide Plains, even minimal modification to topography has the potential to cause the localised pooling of stormwater in undesirable locations. Waterlogged soils are more susceptible to damage by construction vehicles, and would necessitate treatment.
Some minor existing road drainage will be affected during construction as a result of the abandonment and/or relocation of some existing drainage infrastructure. Unless properly managed during construction, this has the potential to cause localised flooding during the construction phase.
Construction of the Gawler River and Smith Creek crossings will need to ensure drainage continuity is provided at all times.
3.2.2 Groundwater Potential impacts on groundwater resulting from general road construction are considered to be negligible, due to the depth of groundwater and lack of excavation at significant depth along the new road alignment. No changes to groundwater levels are expected. All other effects will be minimised by ensuring site practices follow the requirements of the construction environmental management plan (CEMP), described in the Geology, Soils and Site Contamination Technical Paper.
Shallow groundwater can be expected along some portions of the Port Wakefield Road Upgrade, and therefore precautions to avoid accidental spills during construction will be required.
3.2.3 Surface water quality The most serious potential risk to surface water quality in the watercourses and receiving environment would be during the construction phase, and will be related to the following:
export of sediment and associated pollutants such as heavy metals and nutrients via wind and water erosion, as a result of site disturbance, movement of construction vehicles and poor erosion and sediment control
litter accumulation from construction packaging and waste material hydrocarbon and toxicant contamination from spills, leakages, and the road building
process itself. While the majority of impacts are likely to be confined to the construction zone immediately adjacent the watercourses, there is also the potential for some impacts outside the immediate watercourse area due to the movement of construction vehicles.
The upgrade works proposed along Port Wakefield Road are relatively minor; however, the existing drainage systems and the proximity of the road to their outfalls mean that the risk of pollutants discharging to the Gulf St Vincent is relatively high during the construction phase unless effectively managed. The existing drainage systems have the potential to act as ready made conveyance paths to Gulf St Vincent, with the impacts on the marine environment potentially significant.

37
A soil erosion and drainage management plan (SEDMP) will be prepared as part of the contractor’s environmental management plan, before construction begins. The plan will detail measures for reducing the incidence of sediment, litter or chemical pollution reaching receiving waters during the construction phase.
Suspended solids and turbidity Suspended solids can be either organic or inorganic in nature. The organic component originates mostly from leaves and other organic litter, and contributes to the biochemical oxygen demand (BOD) in receiving waterways. The inorganic sediment fraction is of particular concern due to the array of sediment bound contaminants transported with the suspended sediment.
Erosion and sediment control is a primary concern of all construction sites, and includes soil movement by wind, water and site activities (Transport SA 2002). Local soils are disturbed by major earth works, vehicle movement and through the removal of vegetation, leaving the site vulnerable to erosion. Stockpiles will likewise be sensitive to erosion via wind and water, while the transportation of soils, deliberate (e.g. to site for road base) or otherwise (e.g. on tyres of construction vehicles), may enhance air and water borne solids.
High turbidity is problematic in aquatic ecosystems as it hinders light penetration, can disrupt life sustaining processes (e.g. feeding, respiration), may smother physical structures that provide habitat complexity, or even scour the aquatic organisms living on these structures (Transport SA 2002). Indirect impacts of sediment can occur due to the long-term accumulation and desorption of attached pollutants such as nutrients and heavy metals.
Sedimentation often occurs downstream; away from the construction site, increasing clean-up and remediation costs. Sedimentation by polluted outfall has been attributed to the loss of seagrass beds and critical fish breeding habitat off the Adelaide metropolitan coast (Westphalen et al. 2004). The Stormwater Pollution Prevention Code of Practice for the Building and Construction Industry (EPA 1999) specifically addresses erosion and sedimentation management on-site, but is only a voluntary guideline providing a best practice approach.
Accidental spills of toxic substances Various liquid materials will be required during the construction phase of development to manage vegetation (e.g. herbicides, pesticides), prepare the road base for surfacing and as part of the surfacing process itself (Transport SA undated). Other liquids associated with construction equipment (e.g. fuels, lubricants, coolants) may be stored on site, and represent both a pollution and fire risk. Some of these liquids are listed under the Environment Protection Act 1993, and thus required a licence to transport, store and use them on-site. Licensing conditions will define acceptable methods of storage, including the use of bunding and location away from sensitive areas such as creeks or access points.
Accidental spills may occur in many situations, including the servicing and maintenance of equipment, transport of materials on site and through vehicle accidents or break-downs. Standard operating procedures and on-site risk management will be critical to preventing spills on site, and to ensuring that correct clean-up measures are followed in the event of a spill. The response time will determine the extent of water resources affected, with both surface and groundwater resources at risk.
Contaminated and or acid sulphate soils will be problematic if they exist along the proposed route and are exposed during earthworks. The risks associated with this are discussed in detail in the Geology, Soils and Site Contamination Technical Paper.

38
3.3 Operational effects
3.3.1 Flooding and drainage
Gawler River
Impacts on peak flood levels and inundation periods The construction of significant flood mitigation works on the Gawler River system upstream of the proposal as part of the Gawler River Flood Mitigation Scheme will result in a significantly reduced extent of flooding outside the main river channel upstream of the rail line near Virginia during the peak 100 year ARI event. These most significant of these works, on the North Para River, are anticipated to be completed in 2007, with the remainder due for completion in 2008–2009.
The current proposal includes a bridge crossing of the Gawler River which will span the full width of the main river channel. Additional culvert openings either side of the main river channel will allow the migration of infrequent flood flows through the embankment in larger events. This being the case, there is not likely to be any affect on peak flood levels across the existing floodplain. Detailed modelling will be used to confirm this during the detailed design.
Impacts on the time that flood prone land is inundated during Gawler River flood events would also be negligible due to the negligible effect of the proposal on the general flooding behaviour of the river system.
Impacts on floodwater distribution and velocity There are not likely to be any significant impacts on the distribution or velocity of floodwaters within the Gawler River system as the River will be spanned by a bridge, and upstream flood mitigation works will significantly reduce or eliminate floodplain flows for the 100 year ARI event at the crossing location.
Smith Creek outfall The proposal includes the realignment of a section of the Smith Creek outfall. The realigned section will be designed to cater for the ultimate 100 year ARI peak flow downstream of Stebonheath Road. A series of culvert crossings associated with the Heaslip Road interchange will be designed to ensure limited afflux in the peak 100 year ARI event.
The impacts of the proposal on local flood levels within Smith Creek will be examined in detail during the design phase.
Impacts on peak flood levels and inundation periods While the effects are yet to be quantified in detail, the design of the Smith Creek realignment, and culvert crossings will be such that there is minimal effects on flood levels upstream. Additional culvert openings either side of the channel will allow the migration of infrequent flood flows through the embankment in larger events.
There is not anticipated to be any significant change to the time that flood prone land is inundated due to the negligible impact the proposal is expected to have on flooding behaviour in general.

39
Impacts on floodwater distribution and velocity There are not expected to be any significant impacts on the distribution of floodwaters in the Smith Creek catchment. There may be localised increases in velocities at new culvert crossing locations, but these will be managed with dissipators and erosion control structures where necessary.
It should be noted that the Northern Metropolitan Regional Stormwater Management Strategy (BC Tonkin and Associates 1999) recommended the construction of a flow control park adjacent the intersection of Womma Road and Heaslip Road. The Northern Expressway will pass through this land parcel. The purpose of this detention facility was to reduce peak flows within the Smith Creek outfall, and reduce the need for channel upgrades downstream. During consultation with the City of Playford , Council indicated that they have no current plans to construct this facility (Daniel Zmau, Ashley Curtis, pers.comm., November 2006).
Northern Adelaide Plains The construction of the proposed embankment will intercept a number of minor drainage systems and interrupt the general migration of surface water, which flows in a south-westerly direction across the plains. This will require the incorporation of waterway openings to maintain the natural overland flow path during events which exceed the design capacity of the formal drainage system.
The channelling of excess surface water flows through embankment openings has the secondary effect of increasing local velocities, and the potential for scouring and erosion. While this is a potential issue, it is an issue that will be readily managed through the use of appropriate design and erosion protection measures.
Local stormwater flows generated from the new carriageway itself will be managed through the stormwater drainage system, described in more detail in Section 4.4. Again, effects will include additional stormwater flows, concentrated stormwater discharges and an increased potential for erosion at discharge locations which will be appropriately managed.
Port Wakefield Road No works are proposed at the crossing of Dry Creek, the Little Para River or the Helps Road Drain. There will therefore not be any impacts on peak flows, flood levels or inundation periods within these water courses. All three major water courses currently have capacity for the 100 year ARI event, including the Port Wakefield Road Crossings.
Minor drains and water courses within the Port Wakefield Road section of the study area include the Whites Road drain, Lazurko drain, Little Para Overflow drain and the Greenfields wetland system. There are not anticipated to be any impacts on these existing drainage systems as any additional impervious catchment resulting from the upgrade works will be small compared to the overall catchment size.
Where necessary, any existing pipes/culverts will be extended to accommodate any road widening.
Long term impacts due to the road construction are expected to be minimal due to the negligible additional flows generated by the works. Where significant additional pavement widths are proposed within minor catchments, the stormwater design will ensure that any minor additional flows can be accommodated and potential scour in individual subcatchments prevented.
Existing drainage infrastructure will be retained and utilised wherever possible.

40
3.3.2 Groundwater Road runoff can contain pollutants resulting from normal use of the road, as well as from leaks, spills, and accidents. Pollutants can include hydrocarbons (petrol, diesel, oils), metals, nutrients and other compounds. The risks of groundwater contamination via these sources are considered low due to the depth of groundwater beneath the plains, nevertheless, these risks will need to be managed during both the construction and operational phases, in conjunction with the management of surface water quality.
Particularly sensitive areas will include the Gawler River, its floodplain and any other areas of regionally high groundwater or existing wells.
Pork Wakefield Road has been in operation for many years, and therefore the risks of groundwater contamination along this road are existing. There is not expected to be any significant increase to the risks of groundwater contamination due to the minor nature of the upgrade works.
3.3.3 Surface water quality During normal operation, the Northern Expressway has the potential to adversely affect the quality of receiving waters by introducing additional pollutants associated with the use of the road. These include:
stormwater related pollutants – suspended solids from the road surface, embankments and open channel drains
– pollutants such as heavy metals attached to sediment particles washed off the road surface (such as zinc, cadmium, and to a lesser extent lead)
– oil, grease and other hydrocarbon products
– gross pollutants and litter
– organic material (e.g. grass clippings, leaves), and other pollutants creating a biochemical oxygen demand
accidental spillage of contaminants such as petrol, oil or other toxic compounds as a result of a collision or some other incident.
The sources and potential effect of each of the identified pollutants from road runoff are discussed below.
Suspended solids and turbidity Sediment accumulates on road surfaces during dry periods as a result of vehicle movements and atmospheric deposition and is mobilised by stormwater runoff. Suspended solids may directly affect the receiving environment in the following ways:
smothering aquatic plants, reducing light penetration and consequently limiting aquatic growth
reducing food availability for aquatic grazers fouling invertebrate and fish gills

41
reducing visibility, affecting aquatic predatory species changing stream habitat, for example, through sedimentation of riffles.
This applies to both the waterways throughout the Adelaide Plains, as well as the ultimate receiving environment being Gulf St Vincent. Suspended solids are also typically a source of nutrients and act as a site for the attachment of heavy metals.
Biochemical oxygen demand The BOD of water is a measure of the amount of oxygen required by micro-organisms to facilitate the breakdown of organic matter (Baird 1997). BOD becomes critical in an oxygen limited environment like a water body, where the oxygen consumed in decomposition then becomes unavailable to other aquatic organisms. If BOD is persistently high, organisms that are tolerant of low dissolved oxygen will proliferate, replacing the more sensitive species and leading to a dramatic shift in biodiversity.
When an excessive BOD leads to reduced dissolved oxygen conditions, other pollutants such as nutrients and heavy metals can become bio available due to the anaerobic conditions.
Heavy metals, toxic organics, oils and surfactants A range of metals are found in stormwater with toxic effects expected once concentrations reach a threshold level. Heavy metals are a major source of toxicity in urban runoff.
Key metals found in stormwater runoff from road infrastructure include cadmium, copper, chromium, lead, zinc and nickel. It should be noted however, that leaded petrol, a major source of lead in stormwater, was phased out in 2002 (Engineers Australia 2006, Transport SA 2002).
Metals are usually present in both dissolved and particulate form, though most metals transported in stormwater runoff are attached to suspended solids, with concentrations in stormwater generally varying with traffic volume.
Toxic organics, oils and surfactants These substances are found in road runoff due to vehicle emissions, leaks, poor maintenance and general vehicle activities. The impacts include toxic effects, reduced visual amenity and increased oxygen demand.
Typical pollutant concentrations Information on typical pollutant concentrations in road runoff is given in Engineers Australia (2006), and summarised in Table 3.1. The data presented in Engineers Australia (2006) was modified from an original summary of data from a substantial body of information collected in Australia and elsewhere in the world.
When compared to the Water Quality EPP guideline values (or ANZECC 2000), it can be seen that in most cases guideline values are exceeded, with the exception of nutrients. Pollutant concentrations exceeding guideline values have been shaded.

42
Table 3.1 Typical pollutant concentrations in road runoff, stormwater runoff and the Water Quality EPP Guidelines
Pollutant Road runoff mean range (mg/L)
Water Quality EPP guidelines* (mg/L)
Total nitrogen 1–4.5 5 Total phosphorus 0.08–0.8 0.5 Oil grease 2.5–100 ND Copper 0.03–0.25 0.01 Zinc 0.2–1.0 0.05 Lead 0.06–0.9 0.005 Total suspended solids 90–800 20 (turbidity)
* Water quality criteria to preserve aquatic ecosystem function, defined by Schedule 2, Water Quality EPP For notes on the parameters and acronyms included in the table, please refer to the glossary and abbreviations.
3.3.4 Accidental spills The incidence of accidental spills will increase during the operational phase as the proposed heavy transport route will enable the passage of trucks carrying a variety of liquid chemicals. The risk exists for spillage of any toxic substance transported by road, but is particularly significant for the anticipated large volumes of petrol and other fuels transported by tankers.
Due to the proximity of Barker Inlet and Gulf St Vincent in general, any spillage of chemicals on the Expressway, and particularly Port Wakefield Road, has the potential to enter the receiving waters through the existing stormwater drainage network.
The sensitive nature and proximity of the receiving environment means that the consequences of any chemical spill may be significant, potentially resulting in wide spread death of plant and animal species.
Provision for the capture of chemical spills will therefore be included in the design of the expressway drainage system. This is discussed further in Section 4.

43
4 Safeguards and mitigation measures
4.1 Principles adopted to minimise effects The management of flooding and drainage impacts, surface water quality and groundwater resources are in this case integrally linked. Through appropriate and sensitive management of stormwater within the study area, water quality impacts will be minimised both from a surface water and groundwater perspective. At the same time the necessary drainage relief will be provided. Potential surface water management measures will be considered in the design phase and incorporated into the project’s civil design and landscape works.
The principle of water sensitive urban design is about managing the urban water cycle in a more sustainable way. Water sensitive urban design (WSUD) has multiple environmental benefits including improving the urban landscape, reducing pollutant export, retarding stormwater flows and in some cases reducing irrigation requirements (Melbourne Water 2005). By including WSUD elements into the drainage and landscaping design of the Northern Expressway, multiple objectives will be fulfilled including the provision of attractive landscaping along the corridor, providing necessary drainage elements, and addressing water quality impacts.
From a water quality perspective, it will be important to treat stormwater runoff where drainage is directed to natural waterways, urban drainage systems, floodplains or environmentally significant areas. In addition, areas considered at a high risk in terms of spill potential should be considered for spill containment.
4.2 Specific actions to minimise effects during planning and design Transport SA (2002) recommends evaluating the impact on water quality within the receiving environment, and incorporating findings into the planning and design phase. This technical paper represents an overview of the receiving environment, and attempts to predict likely impact and elements requiring additional concession at the planning and design stage. As suggested by Transport SA (2002), this paper has also assessed potential impacts during construction and operation phases, and will identify likely mitigation measures at each stage to minimise resultant impacts. Key to the planning and design phase is the consideration of WSUD elements to assist in achieving best possible management of stormwater.
Due to the difference in the approach to stormwater management between the Northern Expressway and Port Wakefield Road Upgrade, the two sections are discussed separately below.
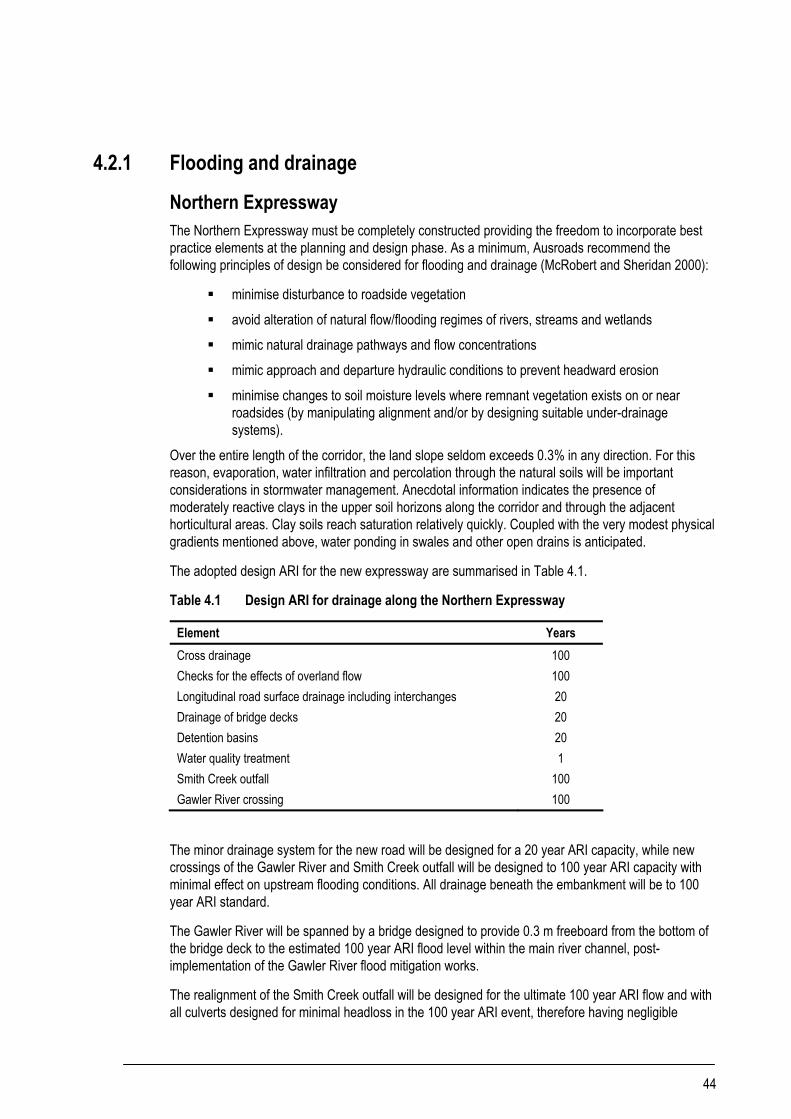
44
4.2.1 Flooding and drainage
Northern Expressway The Northern Expressway must be completely constructed providing the freedom to incorporate best practice elements at the planning and design phase. As a minimum, Ausroads recommend the following principles of design be considered for flooding and drainage (McRobert and Sheridan 2000):
minimise disturbance to roadside vegetation avoid alteration of natural flow/flooding regimes of rivers, streams and wetlands mimic natural drainage pathways and flow concentrations mimic approach and departure hydraulic conditions to prevent headward erosion minimise changes to soil moisture levels where remnant vegetation exists on or near
roadsides (by manipulating alignment and/or by designing suitable under-drainage systems).
Over the entire length of the corridor, the land slope seldom exceeds 0.3% in any direction. For this reason, evaporation, water infiltration and percolation through the natural soils will be important considerations in stormwater management. Anecdotal information indicates the presence of moderately reactive clays in the upper soil horizons along the corridor and through the adjacent horticultural areas. Clay soils reach saturation relatively quickly. Coupled with the very modest physical gradients mentioned above, water ponding in swales and other open drains is anticipated.
The adopted design ARI for the new expressway are summarised in Table 4.1.
Table 4.1 Design ARI for drainage along the Northern Expressway
Element Years Cross drainage 100 Checks for the effects of overland flow 100 Longitudinal road surface drainage including interchanges 20 Drainage of bridge decks 20 Detention basins 20 Water quality treatment 1 Smith Creek outfall 100 Gawler River crossing 100
The minor drainage system for the new road will be designed for a 20 year ARI capacity, while new crossings of the Gawler River and Smith Creek outfall will be designed to 100 year ARI capacity with minimal effect on upstream flooding conditions. All drainage beneath the embankment will be to 100 year ARI standard.
The Gawler River will be spanned by a bridge designed to provide 0.3 m freeboard from the bottom of the bridge deck to the estimated 100 year ARI flood level within the main river channel, post-implementation of the Gawler River flood mitigation works.
The realignment of the Smith Creek outfall will be designed for the ultimate 100 year ARI flow and with all culverts designed for minimal headloss in the 100 year ARI event, therefore having negligible

45
impacts on upstream flood levels. The channel cross section will be designed with flatter batter slopes than the existing channel (maximum 1V:4H), thereby reducing future erosion potential.
The existing natural surface water migration across the plains, including minor drainage systems, will be maintained through waterway openings in the embankment at necessary locations. Scour protection downstream of culverts will be included in the design to reduce erosion and sediment transport.
Any drainage system will need to be consistent with flood plain management strategies and any local and regional stormwater management plans. These management strategies have been discussed with the relevant authorities since the public release of the project.
Detention basins will be placed along the alignment at strategic locations to assist in the drainage function by limiting downstream flows, the size of downstream infrastructure and ensuring any existing drainage problems are not made worse. Locations of these basins are provided in Figures 4.1–4.7. These will have a dual function, also providing water quality treatment and spill containment.
The proposed flooding and drainage strategy is described in more detail in Section 4.4. All stormwater design will be undertaken in accordance with recommended principles in Australian Rainfall and Runoff: A Guide Flood Estimation (Pilgrim 1987) and consistent with DTEI standards.
Port Wakefield Road Upgrade Most existing stormwater drainage along Port Wakefield road is swale drainage within the median and each side of the carriage way (KBR 2006). This simple and effective method of managing stormwater, also provides water quality benefits through filtration and infiltration. To the knowledge of KBR and DTEI (stormwater services), there are no significant existing problem areas or areas susceptible to nuisance flooding along this section of the development. As a minor upgrade, the Port Wakefield Road section of the project is not likely to result in measurable increases in stormwater flows.
It is noted that there are a couple of new service roads proposed for the Port Wakefield Road Upgrade requiring minor alterations to some intersections. During the detailed planning and design phase, new road geometries will be examined in detail to determine the stormwater infrastructure requirements. It is likely that any additional infrastructure required will be limited to side entry or grated inlet pits, small pipes and discharge headwalls to existing swales. The total increase in impervious area is expected to be minimal, although subcatchments will be checked for system capacity during the design phase.
The minor drainage system for the road upgrade will be designed for a 5 year ARI capacity, consistent with the existing design standard. No upgrading of existing major waterway crossings is proposed.
The proposed flooding and drainage strategy is described in further detail in Section 4.4. All stormwater design will be undertaken in accordance with recommended principles in Australian Rainfall and Runoff: A Guide Flood Estimation (Pilgrim 1987) and consistent with DTEI standards.
4.2.2 Surface water quality The Protecting Waterways manual (Transport SA 2002) suggests conducting a risk assessment to gauge the likelihood and consequence of changes in water quality. The risk assessment process encompasses the following main steps:
Establish context: Legislative compliance requirements, water quality objectives for the catchment, environmental concerns of stakeholders, criteria for acceptance of risk.
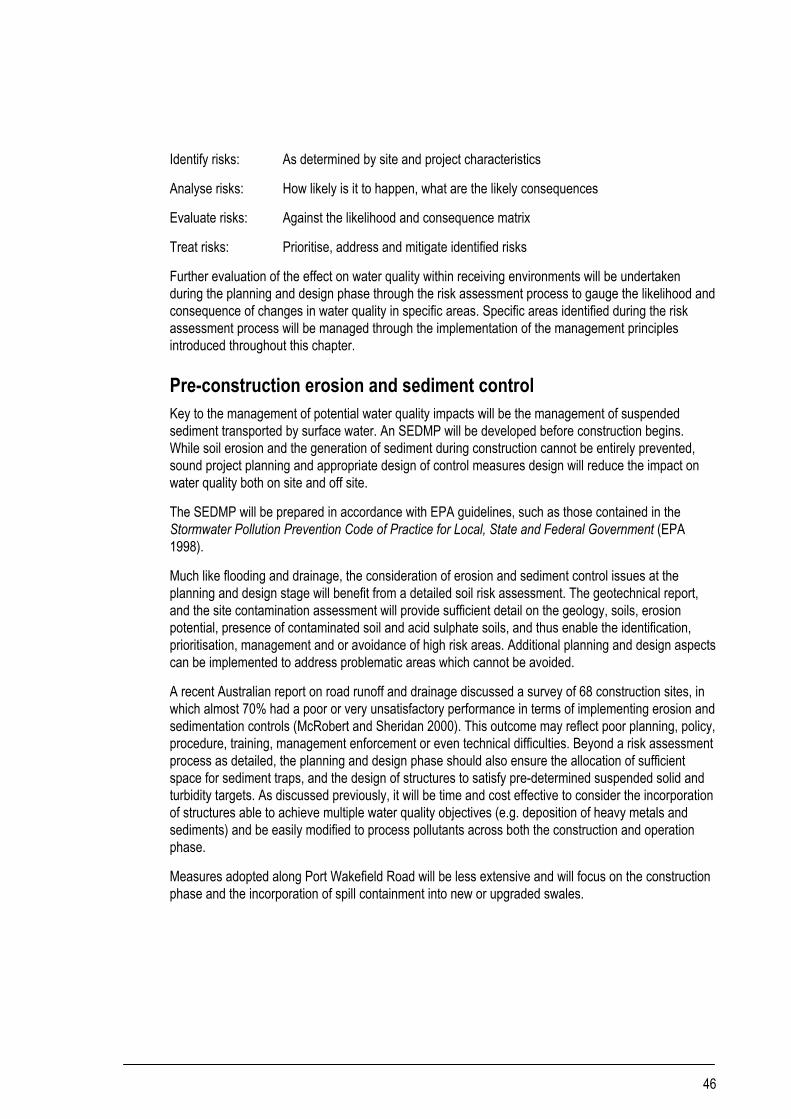
46
Identify risks: As determined by site and project characteristics
Analyse risks: How likely is it to happen, what are the likely consequences
Evaluate risks: Against the likelihood and consequence matrix
Treat risks: Prioritise, address and mitigate identified risks
Further evaluation of the effect on water quality within receiving environments will be undertaken during the planning and design phase through the risk assessment process to gauge the likelihood and consequence of changes in water quality in specific areas. Specific areas identified during the risk assessment process will be managed through the implementation of the management principles introduced throughout this chapter.
Pre-construction erosion and sediment control Key to the management of potential water quality impacts will be the management of suspended sediment transported by surface water. An SEDMP will be developed before construction begins. While soil erosion and the generation of sediment during construction cannot be entirely prevented, sound project planning and appropriate design of control measures design will reduce the impact on water quality both on site and off site.
The SEDMP will be prepared in accordance with EPA guidelines, such as those contained in the Stormwater Pollution Prevention Code of Practice for Local, State and Federal Government (EPA 1998).
Much like flooding and drainage, the consideration of erosion and sediment control issues at the planning and design stage will benefit from a detailed soil risk assessment. The geotechnical report, and the site contamination assessment will provide sufficient detail on the geology, soils, erosion potential, presence of contaminated soil and acid sulphate soils, and thus enable the identification, prioritisation, management and or avoidance of high risk areas. Additional planning and design aspects can be implemented to address problematic areas which cannot be avoided.
A recent Australian report on road runoff and drainage discussed a survey of 68 construction sites, in which almost 70% had a poor or very unsatisfactory performance in terms of implementing erosion and sedimentation controls (McRobert and Sheridan 2000). This outcome may reflect poor planning, policy, procedure, training, management enforcement or even technical difficulties. Beyond a risk assessment process as detailed, the planning and design phase should also ensure the allocation of sufficient space for sediment traps, and the design of structures to satisfy pre-determined suspended solid and turbidity targets. As discussed previously, it will be time and cost effective to consider the incorporation of structures able to achieve multiple water quality objectives (e.g. deposition of heavy metals and sediments) and be easily modified to process pollutants across both the construction and operation phase.
Measures adopted along Port Wakefield Road will be less extensive and will focus on the construction phase and the incorporation of spill containment into new or upgraded swales.
,,
,
,
,
,
,
,
,
,
,
,,
,
,
,
,
,
,
,
,
,
,
,
,,
,
,Gawler Bypass drainage to matchinto exis ting system
Ward B
elt Roa
d
Whitelaw Road
Kentish Road
±
Stormwater management concept plan 1 of 7AEC517.003-G-GIS-088_B.mxd
1:20,000
Figure 4.1
0 500m
, new stormwater drainage
47

48

ú
ú
ú
ú
ú
ú
úAngle Vale
Hill ier Road
Wingate Road
Hill ier R
oad
Wingate Road
Two Wells Road
Angle V
ale Ro
ad
±
Stormwater managementconcept plan 2 of 7
1:20,000
Figure 4.2
0 500m
, new stormwater drainage
, existing stormwater drainagenew basin / wetland
low pointLhigh pointHnew culvertú
The size an d loca tion o f ba sins / wet lands is indicat iv e only.
49

50

ú
ú
ú
ú
úú
,
,
,
,
,
,
,
,
,
,
,
,
,
,
,
,
,
,
,
,
,
,
,
,
,
,,
,
,
,
,
,
,
,
,
,
,
,, ,
,,
,,
,
,
,
,
,
,
,,
,
,
,
,
,
,,
,
,
,
,
,
,
,
,
,
,
,
,
,
,
,
,
,
,
,
,
,
,
,
,
,
,
,
,
Fradd Road
Curtis Road
Andrews Road
Heaslip Road
Stebonheath Road
Petherton Road
Andrews Road
±
Stormwater managementconcept plan 3 of 7
1:20,000
Figure 4.3
0 500m
, new stormwater drainage
, existing stormwater drainagenew basin / wetland
ú new culvert
The size an d loca tion o f ba sins / wet lands is indicat iv e only.
51

52
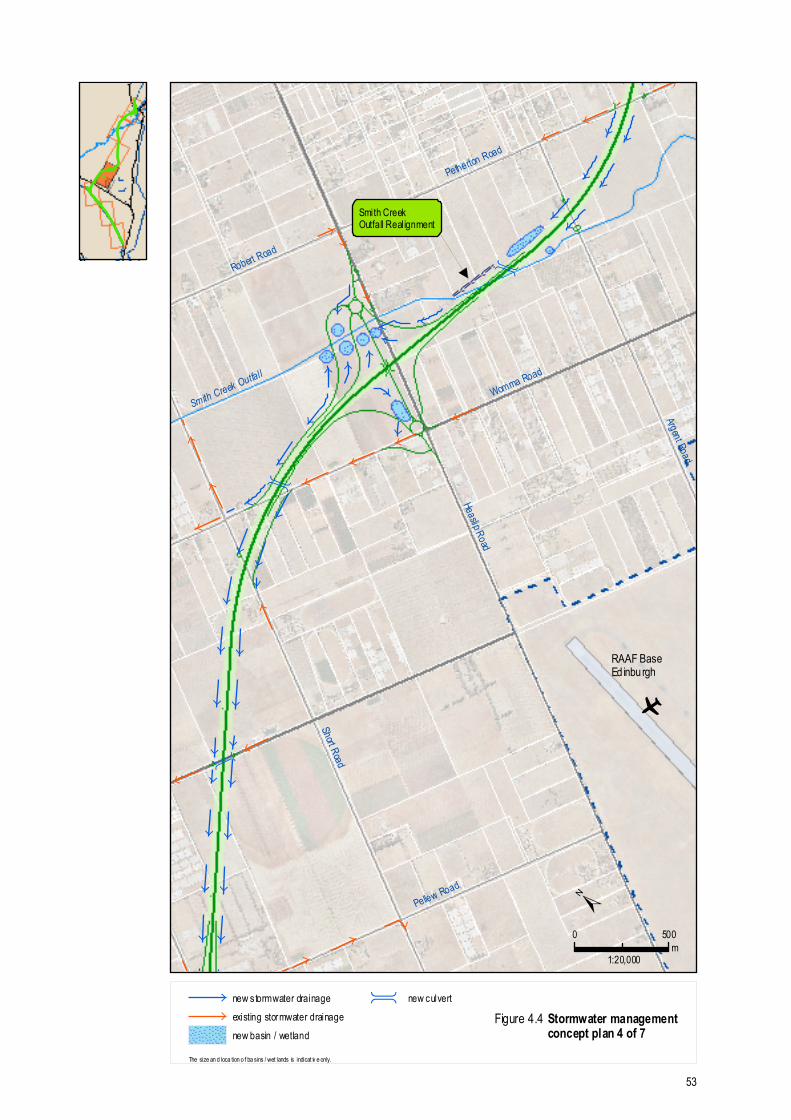
ú
ú
ú
ú ú
ú
,
,
,
,
,, ,
,,
,,
,
,
,
,
,
,
,,,
,
,
,
,
,,
,
,
,
,
,
,
,
,,
,,
,,
,,
,,
,,
,,
,
,,
,
,
,
,
,
,
,
,
,
,
,
,
,
,
,
,
,
,
,
,
,
,
,
o
RAAF BaseEd inburgh
Smith CreekOutfall Realignment
VirginiaSmith Creek Outfall
Heaslip Road
Short Road
Womma Road
Argent Road
Pellew Road
Petherton Road
Robert Road
±
Stormwater managementconcept plan 4 of 7
1:20,000
Figure 4.4
0 500m
ú new culvert
new basin / wetland
, existing stormwater drainage
, new stormwater drainage
The size an d loca tion o f ba sins / wet lands is indicat iv e only.
53

54
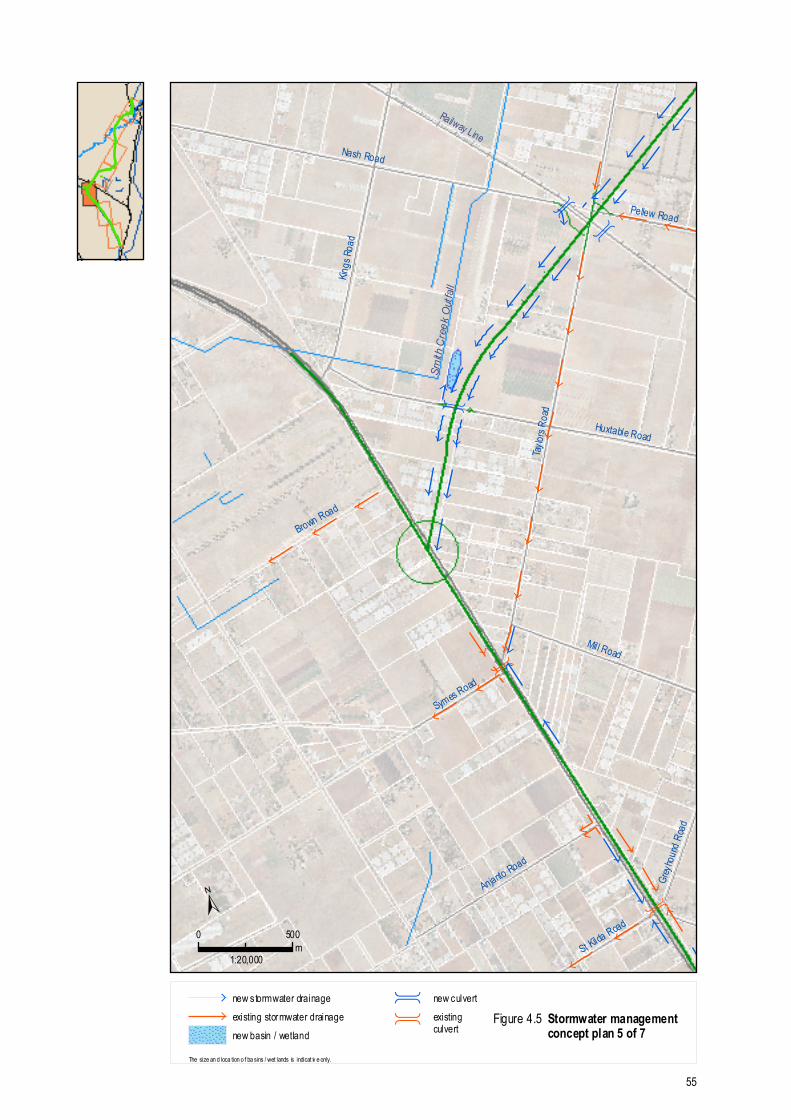
úú
ú
ú
ú
,
,
,
,
,
,
,
,
,
,
,
,
,
,
,
,
,
,
,
,,
,,
,
,
,
,
,
,
,
,
,
,
,
,
,, ,
,
,
,,
,,
,,
,,
,
,
,
,
,
,
,,
,
,
,
,
,
,
Brown Road
Smith
Cree
k Outf
all
Railway Line
Waterloo Corner Road
Taylors
Road
Nash Road
Kings
Road
Huxtable Road
Mill Road
Anjanto Road
Pellew Road
St Kilda Road
Symes RoadGre
yhound
Road
±
Stormwater managementconcept plan 5 of 7
1:20,000
Figure 4.5
0 500m
ú new culvert
new basin / wetland
, existing stormwater drainage
, new stormwater drainageexistingculvertú
The size an d loca tion o f ba sins / wet lands is indicat iv e only.
55

56

ú
ú
ú
ú
ú
ú
ú
ú
Helps Road Drain
Little Para Overflow Drain
Lazurko Drain
Waterloo Corner Road
Bolivar
RoadSummer Road
Helps
Road
Burton Road
Mumford Road
Undo Road
Kings Road
Heaslip
Road
Deuter
Road
Hodgson Road
Jobson
Road
Burton Road
±
Stormwater managementconcept plan 6 of 7
1:20,000
Figure 4.6
0 500m
, new stormwater drainage
, existing stormwater drainageexistingculvertú
existing wetland / detention area
The size an d loca tion o f ba sins / wet lands is indicat iv e only.
57

58

ú
ú
ú
ú,,
,
,
,
,
,
,
,
,
,
,,
,
,
,
,
,
,,
,
,
,
,,
Little Para River
Dry Creek
GreenfieldsWetlands
ConnectorWetlands
Martins Road Drain
Whites
Road
Drain
Martin
s Road
Shepherdson Road
Ryans Road
Ryans Road
Salisb
ury Hi
ghway
±
Stormwater managementconcept plan 7 of 7
1:20,000
Figure 4.7
0 500m
,new stormwater drainage
,existing stormwater drainageexisting wetland /detention area
new basin / wetland
existingculvertú
The size an d loca tion o f ba sins / wet lands is indicat iv e only.
59

60
4.2.3 Groundwater The consideration of groundwater issues at the planning and design stage of this project are critical in a region where industry and agriculture depend heavily on the quality of groundwater, and where historic issues have necessitated its prescription under state legislation. Sufficient information must be collected to characterise subsurface conditions, and to determine the complex interplay between maintaining biological, social and economic values. This includes:
location, quality, size, and pressures on local aquifers (provided by this report) detailed mapping of shallow aquifers to be considered in the design phase (i.e. the location
of spill and other pollutant traps away from shallow aquifers) risk assessment to determine likelihood of design affecting recharge/discharge locations,
quality, and subsurface flow direction The Port Wakefield Road upgrade will have little additional impact on local groundwater resources, thus limiting its consideration in the planning and design phase. As a precaution, this stage should consider the location of recharge / discharge areas and shallow aquifers, and thus determine the additional design elements required to preserve these sensitive systems.
4.3 Specific actions to minimise effects during construction Provided appropriate environmental planning has been undertaken in the initial design phase, the construction phase should simply represent the implementation of this plan. The following activities should be implemented during the construction phase to ensure the best possible protection of local water resources (McRobert and Sheridan 2000):
training and education construction of permanent and temporary containment structures (e.g. swales, detention
basins, buffer strips) monitoring of predicted impacts on local water resources auditing (i.e. structure performance, compliance with plans/licences) feedback and reporting to satisfy management plan/licence requirements
An adaptive approach is recommended, enabling the incorporation of additional measures if and when necessary.
4.3.1 Flooding and drainage Key to managing flooding and drainage issues during construction will be the maintenance of an adequate standard of drainage for the duration of construction works.
The existing drainage capacity of the Gawler River, Smith Creek outfall and all local minor drainage systems across the plains will be maintained during construction with care taken to ensure natural flow paths are not blocked by the placement of temporary structures, such as dams, bunds or stockpiles, or the new embankment itself.
The Port Wakefield Road Upgrade works are relatively minor and are not expected to affect on flow capacity within the existing drainage systems discharging west of Port Wakefield Road.

61
Some minor drainage systems may be affected during the construction, with abandonment and relocation of some existing drainage infrastructure. Temporary drainage outfalls will be constructed where necessary, and care taken to ensure flow paths are not blocked by the placement of temporary structures, such as dams, bunds or stockpiles. Drainage function will be maintained at all times.
4.3.2 Surface water quality The potential impacts of surface water pollutants have been described in Section 3 of this technical paper. The primary stormwater pollutant of concern during the construction phase is suspended sediment and associated attached pollutants. The main mitigation strategy to address the potential effects of suspended sediment would be through the implementation of the SEDMP as part of the CEMP.
Construction erosion and sediment control Erosion controls will be used wherever possible in preference to sediment controls. All runoff from disturbed areas will be directed through sediment controls before discharging into waterways and existing stormwater drainage systems. Measures to mitigate water quality impacts during construction will include:
ongoing education of site personnel of this responsibilities with respect to erosion and sediment control
installation of hay bales and silt fences downstream of disturbed areas construction of temporary bunds upstream of disturbed areas to direct surface runoff
around the construction zone construction of catch drains downstream of disturbed areas to direct runoff from the
construction zone to sedimentation basins Construction of sedimentation basins at the downstream end of catch drains to capture
sediment prior to the release of site runoff into waterways. The majority of these sedimentation basins will be retained as basins of wetlands during ongoing operations.
native vegetation left wherever possible, and topsoil removed and stockpiled for rehabilitation and landscaping purposes
dust control by watering or other measures such as paper mulch or hydro-seeding to prevent wind blown sediment generation
regular monitoring of water quality impacts during construction routine inspection and cleaning of sediment control devices.
Measures may also be required to limit sediment tracking from the construction site onto adjacent roads, particularly in the near vicinity of townships (e.g. Gawler) and in close proximity to sensitive areas and watercourses. Treatments such as shaker ranks, wash down bays or street sweeping will be implemented as required in accordance with appropriate guidelines.
Along Port Wakefield Road the disturbance will not be as significant and mitigation measures will be simplified accordingly.
Efforts will focus on containment of sediment within existing swales through the use of hay bales and silt fences. These will be cleaned and sediment removed following completion of the works.

62
Management of spills and toxic substances Pollution of ground and surface waters with toxic organics, oils, surfactants and heavy metals is easier to isolate and manage on a closed construction site. Basic site management should include:
use of herbicides and pesticides sparingly, selecting a low toxicity compound suitable for aquatic environments (e.g. herbicide: aquatic variant of glyphosate)
isolation of vehicle maintenance and re-fuelling to a designated area away from drainage lines, shallow aquifers and other sensitive features
storage of all liquids and solids away from sensitive areas, on a sealed, bunded surface, with associated containment structure to accommodate and isolate potential spills
minimisation of on-site storage/use of chemicals A rapid response plan developed for spills and accidents will ensure minimal pollution risk away from centralised storage and maintenance sites.
4.3.3 Groundwater With recharge of Adelaide Plains aquifers occurring primarily in the Mount Lofty Ranges, groundwater resources will be most vulnerable to contamination where shallow aquifers or natural recharge and/or leakage points exist such as in and adjacent the Gawler River. Key to limiting potential impacts will be the containment and treatment of all site water and the diversion of natural surface flows away from the construction site. Where containment/treatment structures cannot be sited away from sensitive areas, alternative offsite locations or the use of impervious linings and isolation valves should be considered.
The greatest threat to groundwater quality is likely posed by spills and accidents, where there is the potential for large quantities of liquids to seep into subsurface systems once spilt on an unsealed surface. As discussed, spill containment and isolation structures should be installed in high risk locations, adjacent central storage and servicing locations, and coupled with site risk management and induction for all construction workers. The implementation of a spill plan will be critical to facilitating a faster response and thus limiting potential impacts.
4.4 Specific actions to minimise effects during ongoing operations The long-term management of water resources across the study area will be managed by implementing measures designed during the planning and design phase. A detailed description of the proposed drainage strategy and proposed stormwater quality management strategy is given below.
4.4.1 Flooding and drainage
Northern Expressway The conceptual design of infrastructure for the management and treatment of stormwater generated from the new expressway will ensure that all runoff is managed and receives appropriate treatment before release. Treatment will vary depending on the individual sites and results of the risk assessment, with the proposed strategy discussed later in this document.
63
To be consistent with local flood plain management strategies and any local and regional stormwater management plans, surface water runoff will be managed in geographically distinct sections along the alignment. Further detail on the proposed drainage strategy is provided below, and shown graphically in Figures 4.1–4.7.
The Gawler Bypass It is expected that existing underground and open drains will accommodate additional stormwater flows, due to the small additional road pavement contributing the drainage system. A swale located between the new expressway ramp and the Gawler Bypass will be used to convey flows and direct them into the existing drainage system to the Gawler River.
The Gawler Soaring Club to Two Wells Road This area falls generally west and surface flow is intercepted by the proposed expressway. Stormwater in this section will be channelled in table drains along the Expressway corridor towards Two Wells Road.
A basin will be located on the north-eastern corner of the Two Wells interchange (south side of Expressway; refer Figure 4.2) to attenuate flows before they continue towards the Gawler River. On the northern side of the Expressway flows will pass directly beneath Two Wells Road and continue in a south-westerly direction towards the Gawler River.
Two Wells Road to the Gawler River Stormwater through this section will be channelled in table drains along the Expressway corridor to vegetated basins before discharging to the Gawler River through its northern banks. The basins, or small constructed wetlands, will cleanse the stormwater before discharge and provide spill containment should an accident occur along this section of Expressway.
Gawler River to Angle Vale Road Stormwater through this section will be channelled in table drains in a south-south-westerly direction along the Expressway corridor. A transfer culvert will pass under the Expressway at Hillier Road and direct flows along the existing Hillier Road drain to the Gawler River. A small amount of regrading of the Hillier Road drain may be required to provide an adequate drainage function. This will be investigated in more detail during the design phase, and in consultation with relevant authorities.
From Hillier Road, the Expressway drainage on the eastern side of the embankment travels south along the alignment to a low point approximately 300 m south of Hillier Road. A culvert will pass underneath the expressway to transfer flows east to west. On the western side of the embankment, a drain will be constructed against the fall of the land in a northerly direction back towards the Hillier Road drain. This conveys stormwater from a high point approximately 500 m north of Angle Vale Road in a northerly direction, under the expressway at the low point and into the Hillier Road Drain.
Discharge from the Hillier Road drain to the Gawler River will terminate at a headwall with pipe discharge to the Gawler River to provide spill containment in case of emergency. Some planting of vegetation should be undertaken to facilitate stormwater treatment.
From the high point, stormwater is conveyed south along the expressway to Angle Vale Road.

64
Angle Vale Road interchange
Basins will be constructed on both the eastern and western sides of the Expressway, on the northern side of Angle Vale Road. A culvert beneath the Expressway embankment will equalise flows between these basins, although the flow will generally be from east to west. The basins will be designed to provide flow attenuation such that 20 year ARI ‘post-development’ flows are limited to the ‘pre-development’ flows for the equivalent event. The western basin will discharge to the Angle Vale road drain. The basins will ensure that no additional flows are being added to this drainage system.
Angle Vale Road to Curtis Road This section generally falls to the south-west from Angle Vale Road to Curtis Road. Stormwater drainage will be conveyed along the Expressway from Angle Vale Road to Curtis Road, picking up any small flows which may be intercepted at Fradd Road.
Curtis Road interchange
At the Curtis Road Interchange, a culvert beneath the Expressway embankment will transfer flows from east to west before discharging to a basin in the south-western corner of the Curtis Road interchange via a culvert under the Curtis Road ramp. A second, much smaller detention area will collect local runoff in the south-eastern corner of the interchange in the area between the access ramps.
Curtis Road to Womma Road This section generally falls to the west and south-west from Curtis Road. Stormwater will flow along the Expressway corridor in a south-south-westerly direction towards Petherton Road and Smith Creek outfall drain.
A basin on the northern side of the Expressway near Argent Road will satisfy water quality requirements and ensure outflows do not coincide with peak flows within Smith Creek. A second, smaller, basin will be located on the southern side of Smith Creek, designed primarily for water quality control.
A short section of the Smith Creek outfall drain will require realigning to enable a more efficient culvert crossing beneath the Expressway. The realignment will be designed to ultimate 100 year ARI standard.
Heaslip Road/Womma Road Interchange
On the northern side of the Expressway a series of small basins (depression areas) will be constructed to ensure that stormwater is not discharged to Smith Creek untreated. The location of these basins is shown on Figure 4.4.
On the southern side of the expressway a basin located in the south-western corner of the Interchange will attenuate flows before discharge to the Womma Road drain. This basin will be designed to limit discharge to the ‘pre-development’ 20 year ARI discharge.
At Womma Road, a culvert will transfer Womma Road flows from south to north such that they can continue along the well-formed Womma Road drain.
65
Heaslip Road–Womma Road interchange Stormwater management at the interchange will involve utilising existing drains in Womma Road while at the same time utilising the nearby Smith Creek. Further investigation will occur to determine how the subcatchments will be managed at this location and will involve liaison with the City of Playford.
Womma Road to the rail line Typically the terrain gently falls parallel to the road corridor. The proposed corridor thus does not appear to create a barrier to the general migration of surface flows to the south-west, and the road carriageway is essentially the only surface where stormwater requires interception in this section. Stormwater flow rates within the proposed table drains are expected to be relatively low after losses from infiltration and evaporation.
Culverts under the rail line are proposed to transfer stormwater along the road corridor to the south towards Port Wakefield Road.
The rail line to Port Wakefield Road From the rail line, stormwater continues south, passing through culverts under Taylor Road and the realigned Nash Road.
A culvert under the Expressway at Huxtable Road transfers flows from east to west and directs them to a soakage basin to be located on vacant land adjacent the expressway. As this basin has no outlet it should be located a sufficient distance from the road embankment so moisture conditions do not impact on the road pavement.
South of Huxtable Road drainage will continue south and join the Port Wakefield Road system.
Port Wakefield Road Upgrade The specific details of the proposed stormwater management strategy along Port Wakefield road are discussed below in the three defined sections previously described.
Taylor Road to Caltex service station South of Taylor Road, a new swale will convey runoff in a northerly direction to the Taylor Road intersection with Port Wakefield Road. A new pipe under Taylor Road will connect this to an existing pit and pipe system discharging to a swale on the western side of Port Wakefield Road.
South of Symes Road as far as Anjanto Road, no changes will be made to the existing drainage scheme. With the removal of the turning lane into Anjanto Road, the centre median will be reinstated to match the existing profile.
North of St Kilda Road, a new swale will convey runoff along Port Wakefield Road to the St Kilda Road intersection where it will pass under St Kilda Road, discharging into the St Kilda Road Drain. South of St Kilda Road, a new swale will convey runoff from the western side of Port Wakefield Road north to the St Kilda Road Drain.
North of the Waterloo Corner Road intersection, a new swale on the eastern side of Port Wakefield Road will convey runoff south to an existing pit and pipe system at the intersection itself, discharging into an area of informal detention in the south-eastern corner of the intersection. South of the Waterloo
66
Corner Road intersection, a new swale on the eastern side of Port Wakefield Road will convey runoff north towards the Waterloo Corner detention area.
With the removal of the turning lane into Undo Road, the centre median will be reinstated to match the existing profile. South of Undo Road, a new swale on the western side of Port Wakefield Road will channel surface runoff towards Lazurko Drain. The existing pit and pipe system at the Burton Road intersection will be retained with minor upgrades to centre median drainage upon removal of the turning lane.
South of Lazurko drain, informal swales in the centre, and western sides of Port Wakefield Road will be formalised to convey runoff to the Helps Road drain. South of Helps Road drain, new swales will be constructed on the eastern and western sides of Port Wakefield Road to channel runoff into the Helps Road drain. The western swale will extend as far as Summer Road, draining the northern half of the new road.
North of Deuter Road, a new swale will be constructed on the eastern side of Port Wakefield Road connecting to the existing system of pits and pipes that drains the intersection. South of Deuter Road, a new swale will connect to the existing wetland opposite Bolivar Gardens.
The new extension of Jobson Road will be drained by new swales on either side of the road, draining directly into Bolivar Gardens. Similarly, the southern side of Summer Road will be drained by a new swale running along the western side of Port Wakefield Road into Bolivar Gardens.
Caltex service station to Little Para River No major changes to the stormwater drainage system are proposed between the Caltex service station and Bolivar Road.
New swales on either side of Bolivar Road will feed into the existing pit and pipe system at the intersection of Bolivar Road with Port Wakefield Road. This system discharges to a drain opposite Bolivar Road.
South of Bolivar Road, new swales on both sides of Port Wakefield Road will convey surface runoff towards Hodgson Road. Runoff from the eastern side of Port Wakefield Road will outlet to existing wetlands adjacent to the road. A new pipe under Hodgson Road will connect runoff from the western side of Port Wakefield Road with the existing pit and pipe system draining the intersection. This system discharges to a swale on the western side of Port Wakefield Road, which further receives flows from central and eastern swales south of the Hodgson Road intersection. This swale eventually conveys flows to the Little Para River.
Little Para River to Salisbury Highway Between the Little Para River and Whites Road, no significant changes will be made to the existing stormwater drainage. Removal of two breaks in the centre median will require some minor re-shaping of the median to match the existing profile and removal or some headwalls and pipes near the Victoria Drive intersection.
South of Whites Road, a new swale on the eastern side of Port Wakefield Road will connect into an existing swale draining the eastern paved service road. On the western side of Port Wakefield Road, a new swale will be constructed between the existing road and the new service road draining in a southerly direction. Kerb and gutter along with pits and pipes will be used to direct surface runoff into this new swale along the length of the new service road.

67
New swales on either side of Ryans Road (east) will connect into an existing pit and pipe system draining the intersection with Port Wakefield Road. This system discharges to a defined swale on the eastern side of Port Wakefield Road running south to an informal detention basin in the north-eastern corner of Martins Road.
A new system of pits and pipes will drain the intersection of Ryans Road (west) with the new service road. This system will outlet to the swale running between the service road and Port Wakefield Road.
At the intersection of Daniel Avenue and Port Wakefield Road, a new detention basin will attenuate flows from the swale (and provide spill containment), before an existing pipe and headwall system passes flows under Daniel Avenue. The new swale will continue along the western side of Port Wakefield Road south towards Martins Road where it will match into an existing swale. Surface runoff from the Martins Road intersection, as well as overflow from the Martins Road detention basin crosses Port Wakefield Road via an existing pipe and headwall system and also discharges to this swale. The swale then continues along the western side of Port Wakefield Road to Globe Derby Drive where it crosses via an existing pipe and headwall system. A new detention basin will attenuate the flow, provide spill containment and improve water quality before the water is discharged into Dry Creek.
No significant changes to the stormwater system are proposed south of Dry Creek, other than minor extensions to several existing pipes, and relocation of existing headwalls.
Ongoing maintenance It will be important to ensure that drainage features are periodically monitored and maintained. This would include cleaning and mowing of swales and buffer strips, desilting of sedimentation facilities and replacement of damaged erosion protection.
4.4.2 Surface water quality Stormwater discharges during the operational phase will be directed to existing watercourses, ultimately discharging to the Gulf St Vincent. The environmental risks associated with these discharges vary according to the proximity of the road, the contributing catchment size and the value of the receiving environment. The stormwater treatment measures required along the proposed route must therefore be considered individually, and are discussed in the following sections.
Northern Expressway – Gawler River and Smith Creek outfall The two main watercourses over which the Northern Expressway will pass are the Gawler River and the Smith Creek outfall drain.
The Smith Creek outfall is an artificial drain providing little or no ecological value. The Gawler River on the other hand supports a wide range of native flora and fauna species likely to be sensitive to adverse water quality impacts.
Despite Smith Creek outfall being an artificial channel, it has been decided to treat stormwater discharges to this waterway in the same manner as the Gawler River, as ultimately they both end up in Gulf St Vincent.
The following points were considered in the selection of preliminary water treatment measures across the plans, prior to discharge to the Gawler River or Smith Creek outfall:

68
the concentration of key pollutants (TSS, heavy metals, hydrocarbons) must be reduced to acceptable limits consistent with the Water Quality EPP and ANZECC 2000 guidelines
the proximity to Gulf St Vincent and prescription of groundwater resources across the plains justifies the incorporation of spill containment devices in the drainage network.
Ideally, water quality treatment devices should also provide spill containment.
The proposed treatment system will consist of vegetated roadside swales and buffer strips directed to wetlands and sedimentation basins fitted with trash racks at the inlet.
Vegetated swales are long shallow channels used to convey stormwater in lieu of pipes and aid in the removal of coarse and medium sediment in the stormwater. Buffer strips are gently sloping, vegetated areas over which the runoff passes before reaching its discharge point. Aside from the physical filtering provided, swales also act to temporarily store and infiltrate runoff.
Constructed wetlands are vegetated basins, which through vegetation and other ecosystem features developed over time, treat stormwater via a complex array of physical, chemical and biological processes.
It is recognised that swales and wetlands can also efficiently reduce the export of hydrocarbons and litter. While this may be the case, regular maintenance would be required to remove any collected litter. A small gross pollutant trap or trash rack will be provided at the inlet of all basins to capture the litter load.
Expected removal efficiencies within difference treatment devices for a range of pollutants are summarised in Table 4.2.
Table 4.2 Pollutant removal ranges for selected treatment techniques
Pollutant Constructed wetland
Vegetated swale
Gross pollutant trap
TSS 70–90% 60–80% 10–50% TN 25–50% 25–40% 0–10% TP 50–75% 30–50% 0–10% Heavy metals 60–90% 20–60% ND Litter 50–90% 50–90% 50–90%
For notes on the parameters and acronyms included in the table, please refer to the glossary and abbreviations. Sources: Engineers Australia 2005, Murphy 1999, NSW EPA 1997, Melbourne Water 2005.
These removal efficiencies were applied to the typical arterial road runoff concentrations given in Table 3.1 in order to estimate the likely discharge concentrations from the swales and constructed wetlands to the Gawler River and Smith Creek outfall. The predictions are summarised in Table 4.3, and compared to the Water Quality EPP guidelines. For the purpose of predictions, the average of the removal efficiencies in Table 4.2 was used.

69
Table 4.3 Predicted discharge concentrations of key pollutants (mg/L)
Pollutant Mean road runoff concentration
Predicted discharge conc. post treatment
Water Quality EPP Guideline
TSS 90–800 5.5–48 20 (turbidity) TN 1–4.5 0.42–1.9 5 TP 0.08–0.8 0.018–0.18 0.5 Copper 0.03–0.25 0.005–0.038 0.01 Zinc 0.2–1.0 0.015–0.15 0.05 Lead 0.0–0.9 0.009–0.135 0.005
For notes on the parameters and acronyms included in the table, please refer to the glossary and abbreviations.
From the information above it can be seen that pollutant concentrations following treatment in vegetated swales and constructed wetlands mostly fall within the Water Quality EPP guidelines. It should be noted that the Water Quality EPP guidelines and the ANZECC 2000 guidelines relate to receiving water quality rather than discharge water quality. The comparison of expected discharge water quality to the guideline values is therefore a conservative approach.
Port Wakefield Road–Gulf St Vincent Additional impacts on water quality as a result of the Port Wakefield Road upgrade are expected to be minimal. It could be argued that treatment should be provided due to the proximity to the gulf, but space limits what can be done. Two sites have been identified as possible water quality treatment devices, as shown on Figure 4.7. The only additional water quality treatment proposed will be to provide for spill containment in new swales, or existing swales to be modified significantly.
Some degree of treatment is already provided within the existing grassed swales along Port Wakefield Road.
Accidental spill containment The proposed expressway will act as a heavy vehicle transport route, which will enable the high-speed passage of trucks carrying a variety of hazardous substances. The high safety standard adopted in the road design will reduce the risk of collision or accident, however due to the large traffic volumes expected the risk of accidental spillage of hazardous materials will always remain.
Stormwater drainage swales along the road corridor will be designed to allow the use of temporary bunding, and containment of runoff to mitigate potential impacts of accidental spills. Likewise, stormwater detention basins and constructed wetlands will be fitted with isolation valves that can be shut off in case of a spill. In areas at high risk of groundwater contamination, the use of impermeable liners within basins will be considered. All swales discharging to watercourses will terminate with discharge via a headwall and pipe rather than overland flow.
A quick response to spills will be facilitated by a spill response plan (i.e. modified from the construction stage) identifying isolation points, vulnerabilities and an efficient chain of events to enable clean up.
The preliminary location of basins and wetlands is shown on Figures 4.1–4.7.
70
4.4.3 Groundwater Groundwater across the Adelaide Plains is monitored extensively to satisfy prescription requirements under state legislation. A regular appraisal of these results will enable the early identification of impacts, but with an exhaustive planning and design phase, these are expected to be minimal.
71
5 Conclusion
Drainage conditions within the study area are characterised by the Gawler River, Little Para River and Dry Creek, as well as the artificial Smith Creek and Helps Road drains. In addition to these major drainage outfalls a series of smaller local drainage systems exist draining into major drainage systems, or via separate outfalls to the Gulf St Vincent. The extremely flat topography of the area and the rural nature of much of the catchment over which the proposed expressway passes make drainage in some areas extremely difficult, which has resulted in a number of existing localised flooding areas.
The surface water resources within the study area are of variable quality. The generally variable nature of water quality is typical of the urban catchments at the downstream end of the watercourses, as are the high turbidity levels and elevated nutrient and heavy metal concentrations recorded in some locations.
The proposed development has the potential to affect water resources during two distinct phases; construction and operation.
Construction impacts will centre on earth works and vegetation loss, and receiving water quality may be adversely affected as a result of erosion and sedimentation. Sediment laden stormwater runoff has the potential to be transported from exposed construction areas to the receiving waters by existing stormwater infrastructure.
During the operational phase, stormwater runoff from the impervious road surface would have elevated pollutant concentrations, particularly around interchanges and merging lanes where braking and acceleration is common and the associated deposition of pollutants onto the road surface is likely to be greatest. The potential for spills and leaks of toxic substances as a result of traffic accidents also exists, with these substances transported to receiving waters via existing infrastructure, or seeping into groundwater.
Stormwater management is critical for the northern section of roadway, while the Port Wakefield Road upgrade is less likely to create new impacts on local water quality, given the existence of current infrastructure. Existing crossings over the Helps Road drain, Little Para River and Dry Creek will not be affected, but any careless discharges to these and other existing waterways may have serious effects on the downstream marine environment.
With appropriate management, the construction and operation phases of the development are not anticipated to contribute significant amounts of additional pollutants to receiving waters. Through appropriate and sensitive management of stormwater within the study area, water quality impacts will be minimised both from a surface water and groundwater perspective. At the same time the necessary drainage relief will be provided. Potential surface water management measures will be considered in the design phase and incorporated into the project’s civil design and landscape works.
A soil erosion and drainage management plan, forming part of the construction environmental management plan will be the key to water management during construction, while the incorporation of water sensitive urban design elements, such as vegetated swales and constructed wetlands into the drainage design, will be the key to the long term management of stormwater from both a quality and quantity perspective.

72

73
6 References
ANZECC. 2000. Australian and New Zealand Guidelines for fresh and marine water quality. Australian and New Zealand Conservation Council and Agriculture and Resource Management Council of Australia and New Zealand.
Baird C. 1997. Environmental chemistry (3rd ed). WH Freeman and Company, USA.
BC Tonkin & Associates. 1981. Hydrology: Little Para River Drainage Basin, prepared for the Corporations of the Cities of Salisbury, Tea Tree Gully, Elizabeth, the District Councils of Munno Para, Gumeracha. B.C. Tonkin & Associates, Adelaide.
BC Tonkin & Associates. 1999. Northern metropolitan regional stormwater management study; volume 2 accompanying report. B.C. Tonkin & Associates, Adelaide.
Brown & Root Services Pty Ltd. 2001. Dry Creek Hydrology Review: Final Report. Prepared for the Dry Creek Drainage Authority, Adelaide.
City of Playford. 2006. Stebonheath Flow Control Park water quality monitoring results. Provided by Adrian Swiatnik, City of Playford.
CSIRO. 2002. Groundwater on the Northern Adelaide Plains; prioritising research and related communication requirements. Proceedings of the Waite Campus Workshop, 28 November 2000, Adelaide
DWLBC. 2004. Northern Adelaide Plains prescribed wells area groundwater monitoring status 2003. Department of Water Land and Biodiversity Conservation, Adelaide
DWLBC. 2006. Northern Adelaide Plains groundwater monitoring network upgrade; 2001/02 drilling activity. Department of Water Land and Biodiversity Conservation, Adelaide
Drapper D, Bell A and Tomlinson R. 1997. Analysing Runoff from Road Surfaces; Formulating a Baseline for the Queensland Department of Main Roads. In Stormwater and Erosion Control, Proceedings Day 3, Future Directions for Australian Soil and Water Management. Brisbane, September 9–12.
Engineers Australia. 2006. Australian Runoff Quality—A Guide to Water Sensitive Urban Design. Engineers Media, NSW.
EPA. 1998. Stormwater pollution prevention; code of practice for local, state and federal government. Environment Protection Authority, Adelaide
EPA. 1999. Code of practice for the building and construction industry. Environment Protection Authority, Adelaide.
EPA. 2003. Environment Protection (Water Quality) Policy and Explanatory Report. Government of South Australia, Adelaide.
EPA. 2006a. Groundwater quality in Northern Adelaide Plains. Environment Protection Authority. Viewed November 2006 <www.denr.sa.gov.au/epa/nap.html>
EPA. 2006b. Water quality; Adelaide rivers and streams. Environment Protection Authority. Viewed November 2006. <www.epa.sa.gov.au/nrm_map_rs.html>

74
EPA & DEH. 2003. River health in the Mount Lofty Ranges. Environment Protection Authority and Department of Environment and Heritage. Viewed November 2006 <www.deh.gov.au/water/rivers/nrhp/health/mt-lofty-ranges.html>
GRFMA. 2003. Gawler River flood mitigation scheme. Gawler River Floodplain Management Authority. Viewed November 2006 <fredpedler.com/repositories/files/GRFMA%20Booklet%20c%20310703.pdf>
Government of South Australia. 2003. State of the environment report 2003. Viewed November 2006. <www.environment.sa.gov.au/soe2003/report.html>
KBR. 2004. Ryans Road Detention Basin Stormwater Management Plan – Summary Report. Kellogg Brown & Root Pty Ltd, Adelaide.
KBR. 2006. Northern expressway south: stormwater research report. Kellogg Brown & Root Pty Ltd, Adelaide.
Kinhill Pty Ltd. 1997. Leach Highway – Booragoon Lake Road Runoff Study. Main Roads, Western Australia, Environmental Strategy Section.
McRobert J and Sheridan G. 2000. Road runoff and drainage: environmental impacts and management options. Austroads Inc, Sydney
Melbourne Water. 2005. WSUD engineering procedures: stormwater. CSIRO Publishing, Melbourne.
Murphy SE. 1999. An Investigation into the Treatment Efficiency of a Primary Pond in the barker Inlet Wetland System, South Australia. A thesis submitted to the University of Adelaide for the Degree of Master of Engineering Science.
NSW EPA. 1997. Managing Urban Stormwater – Treatment Techniques. New South Wales Environment Protection Authority.
NHMRC & ARMCANZ. 1996. Australian Drinking Water Guidelines 1996. National Health and Medical Research Council, and Agriculture and Resource Management Council of Australia and New Zealand.
NABCWMB. 1998. Catchment water management plan. Northern Adelaide & Barossa Catchment Water Management Board, Adelaide.
NABCWMB. 2000. Determination of environmental flow requirements for the Gawler River system. Northern Adelaide & Barossa Catchment Water Management Board, Adelaide.
NABW. 2005. Spring aquatic snapshot results 2005: Northern Adelaide & Barossa Region. Northern Adelaide & Barossa Waterwatch. Viewed November 2006 <cweb.salisbury.sa.gov.au/manifest/servlet/binaries?img=4168&stypen=html>
Pilgrim DH (ed). 1987. Australian Rainfall and Runoff: A Guide to Flood Estimation. Institution of Engineers Australia, Barton ACT.
PPK Environment & Infrastructure Pty Ltd. 1997. Dry Creek and Little Para Catchments integrated catchment water management plan. PPK, Adelaide.
Transport SA. 2002. Protecting waterways manual. A Welsh and D Kemp editors. TSA, Government of South Australia, Adelaide.
Transport SA. Undated. Road Design Standards and Guidelines. DD 300 Urban Drainage.

75
Tomlinson GW, Fisher AG and Clark RDS. 1993. Stormwater – A community resource: The Paddocks. EWS Report No. 93/11. Engineering and Water Supply Department, Adelaide.
Westphalen G, Collings G, Wear R, Fernandes M, Bryars S and Cheshire A. 2004. A review of seagrass loss on the Adelaide metropolitan coastline. Adelaide Coastal Waters Study (report to EPA). Adelaide.

76