Embed Size (px)
Citation preview
8/14/2019 Northern Ireland Irish hare survey 2005
http://slidepdf.com/reader/full/northern-ireland-irish-hare-survey-2005 1/12
Northern Ireland Irish Hare Survey 2005
Environment & Heritage Series
Quercus Project QU05-02
8/14/2019 Northern Ireland Irish hare survey 2005
http://slidepdf.com/reader/full/northern-ireland-irish-hare-survey-2005 2/12
Northern Ireland Irish Hare Survey 2005
Prepared for
Environment & Heritage Service
by
David Tosh, Tiago A. Marques*, Susie Brown, Jane Preston, Neil Reid
Ian Montgomery, David L. Borchers*, Stephen T. Buckland* & Robbie McDonald
Quercus, Queen’s University Belfast
*CREEM, University of St. Andrews
Quercus is a partnership betweenEnvironment & Heritage Service, Northern Ireland and
Queen’s University, Belfast
www.quercus.ac.uk
8/14/2019 Northern Ireland Irish hare survey 2005
http://slidepdf.com/reader/full/northern-ireland-irish-hare-survey-2005 3/12
Executive Summary
1. A survey of Irish hares in Northern Ireland was undertaken in spring 2005 and compared to a similar survey
undertaken in spring 2004. The survey was based on observations of hares made at night using a spotlight
while driving 8 transects along roads. Data from the 2004 and 2005 surveys were analysed using improved
methods of Distance Sampling, leading to improved estimates of hare densities and revisions to the 2004
survey findings.
2. The density of Irish hares was estimated to be 3.10 hares per km² in spring 2005 (and with 95% confidence
was between the limits 2.49–3.87). The estimated density in 2004 was revised to 5.11 hares per km² (95%
CL 4.23–6.16). Using these density estimates multiplied by land area, the Irish hare population in Northern
Ireland was estimated to be 43,700 in 2005 (95% CL 35,000–54,400) and was revised to 72,000 in 2004 (95%
CL 59,700-86,900).
3. The confidence intervals of these estimates do not overlap and we conclude that the hare population
decreased between 2004 and 2005, but remains higher than the 2002 population.
4. We make the same four recommendations for action made in our 2004 report:
a. Continue with regular surveys of Irish hare numbers. Until the extent and pattern of fluctuations is well
established, these should be conducted annually.
b. Improvement of the application of Distance Sampling techniques to Irish hare surveys forms part of this
report but is ongoing. Future refinement of survey and analytical methodology will result in more reliable
determination of population change and improved accuracy and precision of population estimates,
possibly leading to further revisions of earlier estimates.c. Conduct research on the population biology of Irish hares. There is insufficient information on the most
basic aspects of demography, such as survival and productivity, their relationship with intrinsic and
extrinsic factors and the spatial scale at which these factors effect population change.
d. Investigate the impact of agricultural practices on hare survival and recruitment.

8/14/2019 Northern Ireland Irish hare survey 2005
http://slidepdf.com/reader/full/northern-ireland-irish-hare-survey-2005 4/12
Contents
Executive Summary 2Introduction 6
Methods 8
Results 11
Discussion 12
Acknowledgements 13
References 14
8/14/2019 Northern Ireland Irish hare survey 2005
http://slidepdf.com/reader/full/northern-ireland-irish-hare-survey-2005 5/12
Introduction
The Irish hare Lepus timidus hibernicus is the only lagomorph that is native to Ireland and is commonly recognizedas an endemic sub-species of the mountain hare Lepus timidus (Fairley 2001; Hamill 2001). It is a priority species
for conservation action in Northern Ireland.
During the 1990s, research undertaken by Queen’s University Belfast (QUB) indicated that the Irish hare
population in Northern Ireland was between 8250–21,000 hares and that there was evidence of a decline from
historical levels (Dingerkus 1997; Dingerkus & Montgomery 2002). These findings prompted the Environment
and Heritage Service (EHS) to create a Species Action Plan for the Irish hare that contained a series of measures
and targets aimed at maintaining and enhancing the status of the Irish hare in Northern Ireland (EHS 2000). A
series of hare surveys have since been commissioned by EHS with the aim of evaluating the Plan’s success.
In 2002, QUB undertook a survey using line transect spotlight surveys conducted while driving along roads at
night. Distance Sampling techniques were applied to determine hare densities. The population was estimated
to have been 7,000–25,200 hares, indicating that hare numbers had not changed significantly since the previous
estimate during the 1990s (Preston et al 2002).
Quercus was commissioned by EHS to conduct a further survey in spring 2004. A modified field protocol was
adopted for health and safety reasons. Observations were made with a spotlight at a series of point transects
distributed along the previously adopted line transects. Estimates of hare densities increased markedly between
surveys, suggesting that the population had undergone a marked increase between 2002 and 2004 (Tosh et al2004). In the report of this survey, it was recommended that hare surveys be continued until the extent of annual
fluctuations is well known and that survey methodologies should be improved to enhance the ability of surveys
to detect population trends (Tosh et al 2004).
In response to these recommendations, EHS commissioned a further survey from Quercus in 2005. In order to
develop the application of Distance Sampling to Irish hare surveys, this survey was conducted in conjunction
with the developers of the technique at the Research Unit for Wildlife Population Assessment (RUWPA) , part of
the Centre for Research into Ecological and Environmental Modelling (CREEM) at the University of St. Andrews.
The objectives of the 2005 survey were to:
• Establish the abundance and distribution of Irish hares in Northern Ireland in 2005
• Ascertain change in distribution and abundance since 2004
• Make recommendations for future work on Irish hares
8/14/2019 Northern Ireland Irish hare survey 2005
http://slidepdf.com/reader/full/northern-ireland-irish-hare-survey-2005 6/12
Methods
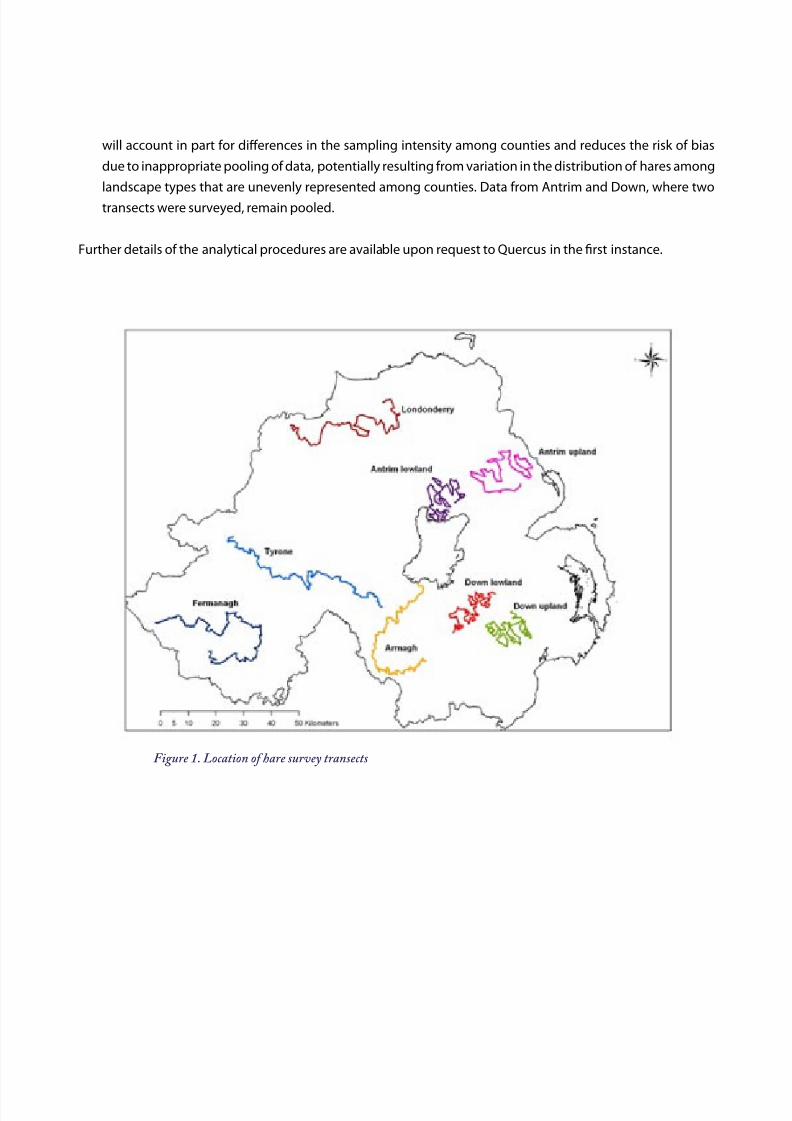
Fieldwork was conducted from January to May 2005 and was undertaken along the eight transects used in the2002 and 2004 surveys. These routes were approximately 100 km in length and were located such that they
encompassed a typical sample of landscape types as characterized by the land classification system (Murray,
McCann & Cooper 1992). The transects were located in all six counties of Northern Ireland (Figure 1).
A Nissan pick-up truck was driven along a transect, stopping at approximately 200 m intervals. Hares were
searched for by a single observer standing on a platform mounted on the rear of the truck using a 2 million
candlepower handheld spotlight. The same single observer (Tosh) conducted all counts during both the 2004
and 2005 surveys. The observer systematically swept the spotlight 180 degrees on one side working from the
area closest to the vehicle towards the horizon. Two sweeps were carried out on each side of the vehicle. The
sector of view over which the view was not obscured, e.g. by tall hedges, was noted in degrees and used as a
measure of survey effort at each point. In common with the 2004 survey, if spotlighting was not effective at
points because the view was largely obscured, the nearest gap in the roadside vegetation was sought. This was
repeated along the length of a transect until it was completed.
The presence or absence of hares was noted at each point. Where hares were detected, the number of animals
seen, the distance from the observer in metres measured using a laser range finder (Leica LRF 900 scan), bearing
and position in the field were noted. At each point, the distance travelled (kilometres) and position to the nearest
10 m were recorded using a Global Positioning System (GPS). Transects were surveyed from sunset for 5–7 hours
a night. Between 20–25 km of a transect was surveyed each night and each transect required 4–5 nights surveyeffort.
Hare densities were estimated using DISTANCE 5 version Beta 4 (Thomas et al 2005) and customized scripts in
R (R Development Core Team 2004). Sightings of more than one hare were entered as clusters. Model selection
procedures based on Akaike’s Information Criterion (AIC) value were the same throughout.
The analytical approach differed from that applied in 2004 in several respects:
• No left truncation of the data was made but right truncation of 10% of the largest distances was applied. This
is not likely to have greatly affected density estimates, since few hares were seen within this left-truncated
zone.
• The distances to hares were not rounded or grouped into bins as they had been in the 2004 analysis, rather
the exact distance derived from the laser rangefinder was used. Using more precise distances reduces the
risk of overestimation of density by underestimating distances, and vice versa.
• Variation in visibility at survey points, which equated to sampling effort for point transects, was accounted
for in the 2005 survey but not in the 2004 survey. Accounting for obscured or reduced arcs of visibility
reduces the risk of underestimating density.
• The whole sample of both surveys was stratified by county by fitting separate models to each. An overall
estimate of density was therefore a composite of the county strata weighted by county area. Although
sample sizes are small in some counties, and this leads to reduced goodness of model fit in some cases, this
8/14/2019 Northern Ireland Irish hare survey 2005
http://slidepdf.com/reader/full/northern-ireland-irish-hare-survey-2005 7/12
will account in part for differences in the sampling intensity among counties and reduces the risk of bias
due to inappropriate pooling of data, potentially resulting from variation in the distribution of hares among
landscape types that are unevenly represented among counties. Data from Antrim and Down, where two
transects were surveyed, remain pooled.
Further details of the analytical procedures are available upon request to Quercus in the first instance.
Figure 1. Location of hare survey transects
8/14/2019 Northern Ireland Irish hare survey 2005
http://slidepdf.com/reader/full/northern-ireland-irish-hare-survey-2005 8/12
Results
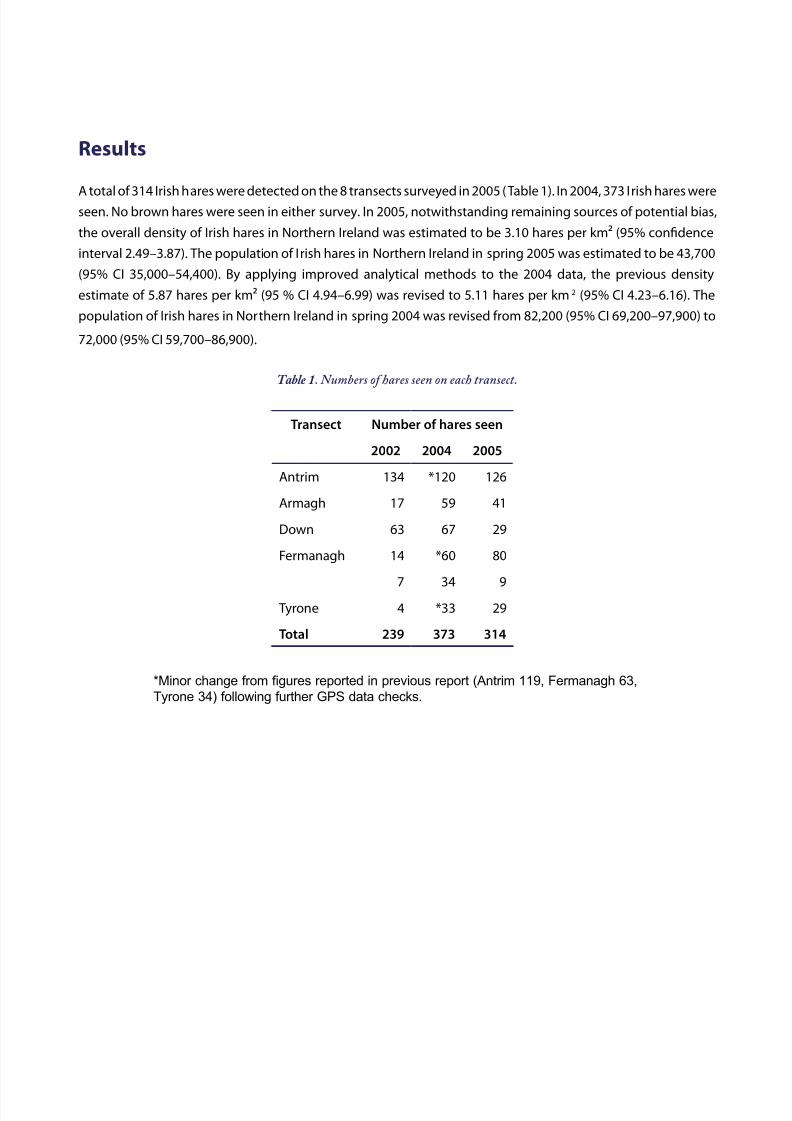
A total of 314 Irish hares were detected on the 8 transects surveyed in 2005 (Table 1). In 2004, 373 Irish hares wereseen. No brown hares were seen in either survey. In 2005, notwithstanding remaining sources of potential bias,
the overall density of Irish hares in Northern Ireland was estimated to be 3.10 hares per km² (95% confidence
interval 2.49–3.87). The population of Irish hares in Northern Ireland in spring 2005 was estimated to be 43,700
(95% CI 35,000–54,400). By applying improved analytical methods to the 2004 data, the previous density
estimate of 5.87 hares per km² (95 % CI 4.94–6.99) was revised to 5.11 hares per km 2 (95% CI 4.23–6.16). The
population of Irish hares in Northern Ireland in spring 2004 was revised from 82,200 (95% CI 69,200–97,900) to
72,000 (95% CI 59,700–86,900).
Table 1. Numbers of hares seen on each transect.
*Minor change from figures reported in previous report (Antrim 119, Fermanagh 63,
Tyrone 34) following further GPS data checks.
Transect Number of hares seen
2002 2004 2005
Antrim 134 *120 126
Armagh 17 59 41
Down 63 67 29
Fermanagh 14 *60 80
7 34 9Tyrone 4 *33 29
Total 239 373 314
8/14/2019 Northern Ireland Irish hare survey 2005
http://slidepdf.com/reader/full/northern-ireland-irish-hare-survey-2005 9/12
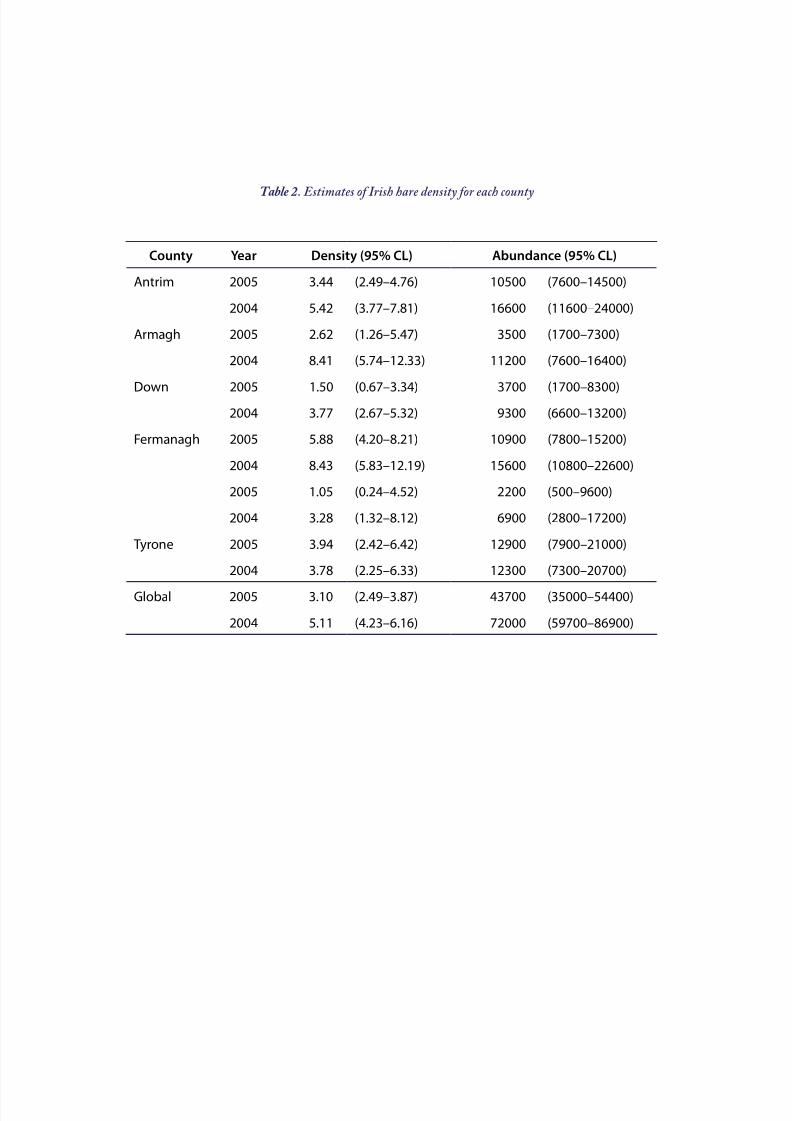
Table 2. Estimates of Irish hare density for each county
County Year Density (95% CL) Abundance (95% CL)
Antrim 2005 3.44 (2.49–4.76) 10500 (7600–14500)
2004 5.42 (3.77–7.81) 16600 (11600–24000)
Armagh 2005 2.62 (1.26–5.47) 3500 (1700–7300)
2004 8.41 (5.74–12.33) 11200 (7600–16400)
Down 2005 1.50 (0.67–3.34) 3700 (1700–8300)2004 3.77 (2.67–5.32) 9300 (6600–13200)
Fermanagh 2005 5.88 (4.20–8.21) 10900 (7800–15200)
2004 8.43 (5.83–12.19) 15600 (10800–22600)
2005 1.05 (0.24–4.52) 2200 (500–9600)
2004 3.28 (1.32–8.12) 6900 (2800–17200)
Tyrone 2005 3.94 (2.42–6.42) 12900 (7900–21000)
2004 3.78 (2.25–6.33) 12300 (7300–20700)
Global 2005 3.10 (2.49–3.87) 43700 (35000–54400)
2004 5.11 (4.23–6.16) 72000 (59700–86900)

8/14/2019 Northern Ireland Irish hare survey 2005
http://slidepdf.com/reader/full/northern-ireland-irish-hare-survey-2005 10/12
Acknowledgements
This project was funded by the Environment & Heritage Service and Queen’s University Belfast through the
Quercus partnership. We are grateful to Stuart Jennings, Alex Portig and John Kelly for advice and assistance
with fieldwork.
8/14/2019 Northern Ireland Irish hare survey 2005
http://slidepdf.com/reader/full/northern-ireland-irish-hare-survey-2005 11/12
References
Corbet, G.B. & Harris, S. (1991) The Handbook of British Mammals. 3rd
edition. Blackwell Publishing, London.Dingerkus, S.K. (1997) The distribution and ecology of the Irish hare L. t. hibernicus in Northern Ireland.
Unpublished PhD Thesis. The Queen’s University of Belfast, Belfast, UK.
Dingerkus, S.K. & Montgomery, W.I. (2002) A review of the status and decline in abundance of the Irish Hare
(Lepus timidus hibernicus) in Northern Ireland. Mammal Review, 32, 1-11.
Environment & Heritage Service (2000) Biodiversity in Northern Ireland. Northern Ireland Species Action Plan.
Irish Hare, Chough and Curlew. The Stationery Office, Belfast.
Fairley, J. (2001) A Basket of Weasels. Privately Published, Belfast.
Hamill, R. (2001) A study of the genetic structure and phylogeography of Lepus timidus L. subspecies in Europe
using microsatellite DNA and mtDNA. Unpublished PhD thesis, University College Dublin.
Murray, R., McCann, T. & Cooper, A. (1992) A land classification and landscape ecological study of Northern
Ireland. University of Ulster, Coleraine.
Preston, J., Prodöhl, P., Portig, A. & Montgomery, I. (2002) The Northern Ireland Hare Lepus timidus hibernicus
Survey 2002. Queen’s University Belfast.
R Development Core Team (2004). R: A language and environment for statistical computing. R Foundation for
Statistical Computing, Vienna, Austria.
http://www.R-project.org
Thomas, L., Laake, J.L., Strindberg, S., Marques, F.F.C., Buckland, S.T., Borchers, D.L., Anderson, D. R., Burnham, K.P.,
Hedley, S.L., Pollard, J.H., Bishop, J.R.B. & Marques, T.A., (2005). Distance 5.0. beta 4. Research Unit for Wildlife
Population Assessment, University of St. Andrews, UK.http://www.ruwpa.st-and.ac.uk/distance/
Tosh, D., Towers, R., Preston, J., Portig, A., McDonald, R. & Montgomery, I. (2004). Northern Ireland Irish hare
survey 2004. Report to the Environment & Heritage Service, Quercus, Belfast.
8/14/2019 Northern Ireland Irish hare survey 2005
http://slidepdf.com/reader/full/northern-ireland-irish-hare-survey-2005 12/12
Our aim is to protect and conserve the
natural and built environment and to promote its appreciation for the benefit of
present and future generations.
Environment & Heritage ServiceCommonwealth House35 Castle StreetBelfast BT1 1GUTel: (028) 9054 6565Email: [email protected]
www.ehsni.gov.uk ISBN No. 1-905127-26-x