Embed Size (px)
Citation preview
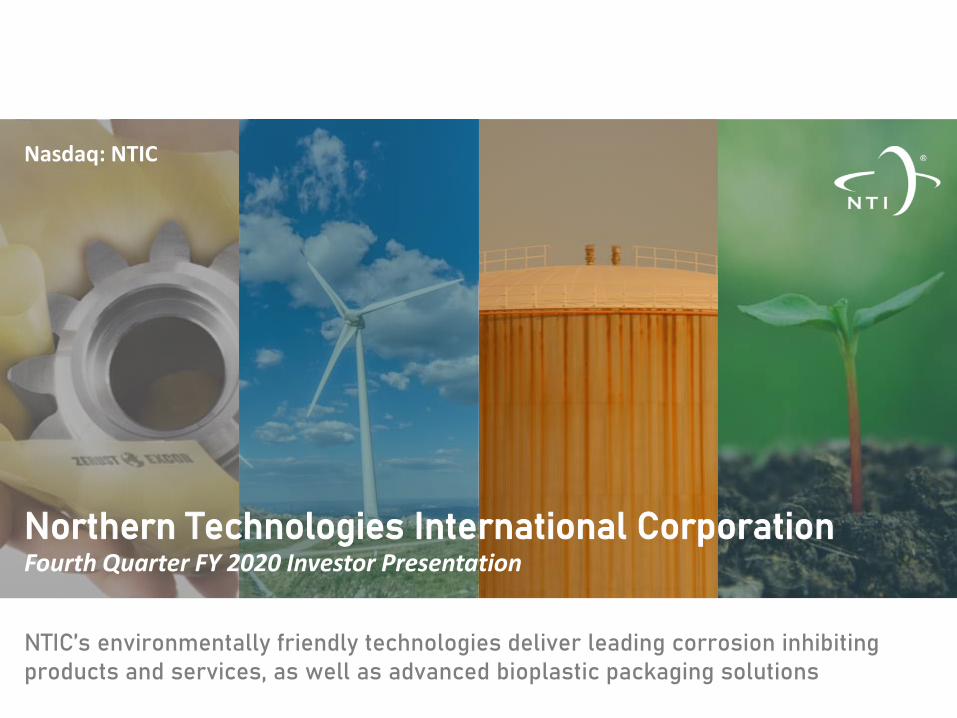
Northern Technologies International Corporation Fourth Quarter FY 2020 Investor Presentation
NTIC’s environmentally friendly technologies deliver leading corrosion inhibiting products and services, as well as advanced bioplastic packaging solutions
Nasdaq: NTIC
Disclaimers
Forward-Looking StatementsStatements contained in this presentation that are not historical information are forward-looking statements within the meaning of the Private Securities Litigation Reform Act of 1995. Suchstatements include NTIC’s belief that third quarter sales and operating expenses will decrease due to the COVID-19 pandemic, NTIC’s ability to continue to provide uninterrupted orderfulfillment, while also safeguarding and supporting both its employees and customers, NTIC’s belief that it will successfully navigate the COVID-19 pandemic; and other statements that can beidentified by words such as “believes,” “continues,” “expects,” “anticipates,” “intends,” “potential,” “outlook,” “will,” “may,” “would,” “should,” “guidance” or words of similar meaning, the useof future dates and any other statements that are not historical facts. Such forward-looking statements are based upon the current beliefs and expectations of NTIC’s management and areinherently subject to risks and uncertainties that could cause actual results to differ materially from those projected or implied. Such potential risks and uncertainties include, but are not limitedto, in no particular order: the effects of the COVID-19 pandemic on NTIC’s business and operating results; the ability of NTIC to continue to pay dividends; the effect of economic uncertainty andtrade disputes; NTIC’s dependence on the success of its joint ventures and fees and dividend distributions that NTIC receives from them; NTIC’s relationships with its joint ventures and its abilityto maintain those relationships; NTIC’s dependence on its joint venture in Germany in particular due to its significance and the effect of a termination of this or its other joint ventures on NTIC’sbusiness and operating results; the ability of NTIC China to achieve significant sales; costs and expenses incurred by NTIC in connection with its ongoing litigation against its former Chinese jointventure partner; the effect of the United Kingdom’s proposed exit from the European Union, economic slowdown and political unrest; risks associated with NTIC’s international operations;exposure to fluctuations in foreign currency exchange rates and tariffs, including in particular the Euro compared to the U.S. dollar; the health of the U.S. and worldwide economies, including inparticular the U.S. automotive industry; the level of growth in NTIC’s markets; NTIC’s investments in research and development efforts; acceptance of existing and new products; timing ofNTIC’s receipt of purchase orders under supply contracts; variability in sales to customers in the oil and gas industry and the effect on NTIC’s quarterly financial results; increased competition;the costs and effects of complying with changes in tax, fiscal, government and other regulatory policies, including the new tax reform law, which could result in a write-down of our deferred taxassets, and rules relating to environmental, health and safety matters; pending and potential litigation; and NTIC’s reliance on its intellectual property rights and the absence of infringement ofthe intellectual property rights of others. More detailed information on these and additional factors which could affect NTIC’s operating and financial results is described in the company’s filingswith the Securities and Exchange Commission, including its most recent annual report on Form 10-K for the fiscal year ended August 31, 2019 and subsequent quarterly reports on Form 10-Q.NTIC urges all interested parties to read these reports to gain a better understanding of the many business and other risks that the company faces. Additionally, NTIC undertakes no obligationto publicly release the results of any revisions to these forward-looking statements, which may be made to reflect events or circumstances occurring after the date hereof or to reflect theoccurrence of unanticipated events.
Non-GAAP Financial MeasuresIn addition to financial measures prepared in accordance with U.S. generally accepted accounting principles (GAAP), NTIC uses certain non-GAAP financial measures in this presentation. NTICuses non-GAAP financial measures as supplemental measures of performance and believes these measures facilitate operating performance comparisons from period to period and company tocompany by factoring out potential differences caused by non-recurring, unusual or infrequent charges not related to NTIC’s regular, ongoing business, variations in capital structure, taxpositions, depreciation, non-cash charges and certain large and unpredictable charges. NTIC believes that the presentation of certain non-GAAP financial measures provides useful informationto investors in evaluating its operations, period over period. Non-GAAP measures have limitations as analytical tools, and should not be considered in isolation, or as a substitute for analysis ofNTIC’s results as reported under GAAP. When analyzing NTIC’s operating performance, investors should not consider NTIC’s net income, as adjusted, for example, as a substitute for NTIC’s netincome prepared in accordance with GAAP or any other non-GAAP financial measure as a substitute for the comparable GAAP financial measure. Investors should note that any non-GAAPfinancial measures used by NTIC may not be the same non-GAAP financial measures, and may not be calculated in the same manner, as that of other companies. Whenever NTIC uses non-GAAPfinancial measures, it provides a reconciliation of the non-GAAP financial measure to the most closely applicable GAAP financial measure. Investors are encouraged to review the related GAAPfinancial measures and the reconciliation of these non-GAAP financial measures to their most directly comparable GAAP financial measure.
Industry InformationInformation regarding market and industry statistics contained in this presentation is based on information available to NTIC that NTIC believes is accurate. It is generally based on publicationsthat are not produced for these purposes or economic analysis.
2
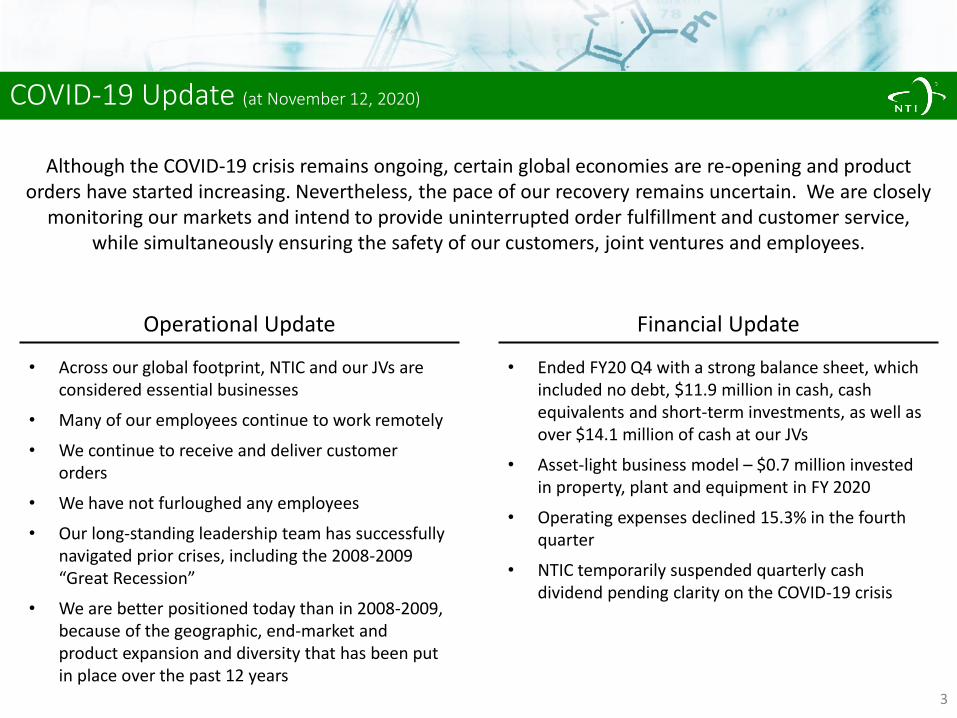
COVID-19 Update (at November 12, 2020)
• Across our global footprint, NTIC and our JVs are considered essential businesses
• Many of our employees continue to work remotely
• We continue to receive and deliver customer orders
• We have not furloughed any employees
• Our long-standing leadership team has successfully navigated prior crises, including the 2008-2009 “Great Recession”
• We are better positioned today than in 2008-2009, because of the geographic, end-market and product expansion and diversity that has been put in place over the past 12 years
3
Operational Update Financial Update
Although the COVID-19 crisis remains ongoing, certain global economies are re-opening and product orders have started increasing. Nevertheless, the pace of our recovery remains uncertain. We are closely
monitoring our markets and intend to provide uninterrupted order fulfillment and customer service, while simultaneously ensuring the safety of our customers, joint ventures and employees.
• Ended FY20 Q4 with a strong balance sheet, which included no debt, $11.9 million in cash, cash equivalents and short-term investments, as well as over $14.1 million of cash at our JVs
• Asset-light business model – $0.7 million invested in property, plant and equipment in FY 2020
• Operating expenses declined 15.3% in the fourth quarter
• NTIC temporarily suspended quarterly cash dividend pending clarity on the COVID-19 crisis
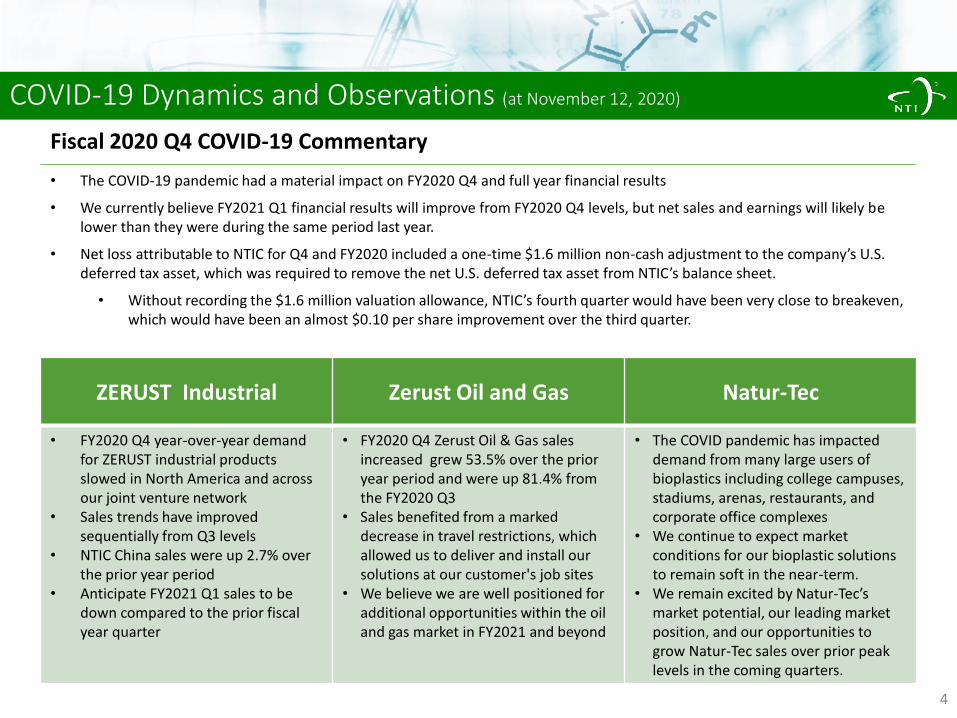
COVID-19 Dynamics and Observations (at November 12, 2020)
Fiscal 2020 Q4 COVID-19 Commentary
ZERUST Industrial Zerust Oil and Gas Natur-Tec
• FY2020 Q4 year-over-year demand for ZERUST industrial products slowed in North America and across our joint venture network
• Sales trends have improved sequentially from Q3 levels
• NTIC China sales were up 2.7% over the prior year period
• Anticipate FY2021 Q1 sales to be down compared to the prior fiscal year quarter
• FY2020 Q4 Zerust Oil & Gas sales increased grew 53.5% over the prior year period and were up 81.4% from the FY2020 Q3
• Sales benefited from a marked decrease in travel restrictions, which allowed us to deliver and install our solutions at our customer's job sites
• We believe we are well positioned for additional opportunities within the oil and gas market in FY2021 and beyond
• The COVID pandemic has impacted demand from many large users of bioplastics including college campuses, stadiums, arenas, restaurants, and corporate office complexes
• We continue to expect market conditions for our bioplastic solutions to remain soft in the near-term.
• We remain excited by Natur-Tec’s market potential, our leading market position, and our opportunities to grow Natur-Tec sales over prior peak levels in the coming quarters.
4
• The COVID-19 pandemic had a material impact on FY2020 Q4 and full year financial results
• We currently believe FY2021 Q1 financial results will improve from FY2020 Q4 levels, but net sales and earnings will likely be lower than they were during the same period last year.
• Net loss attributable to NTIC for Q4 and FY2020 included a one-time $1.6 million non-cash adjustment to the company’s U.S. deferred tax asset, which was required to remove the net U.S. deferred tax asset from NTIC’s balance sheet.
• Without recording the $1.6 million valuation allowance, NTIC’s fourth quarter would have been very close to breakeven, which would have been an almost $0.10 per share improvement over the third quarter.
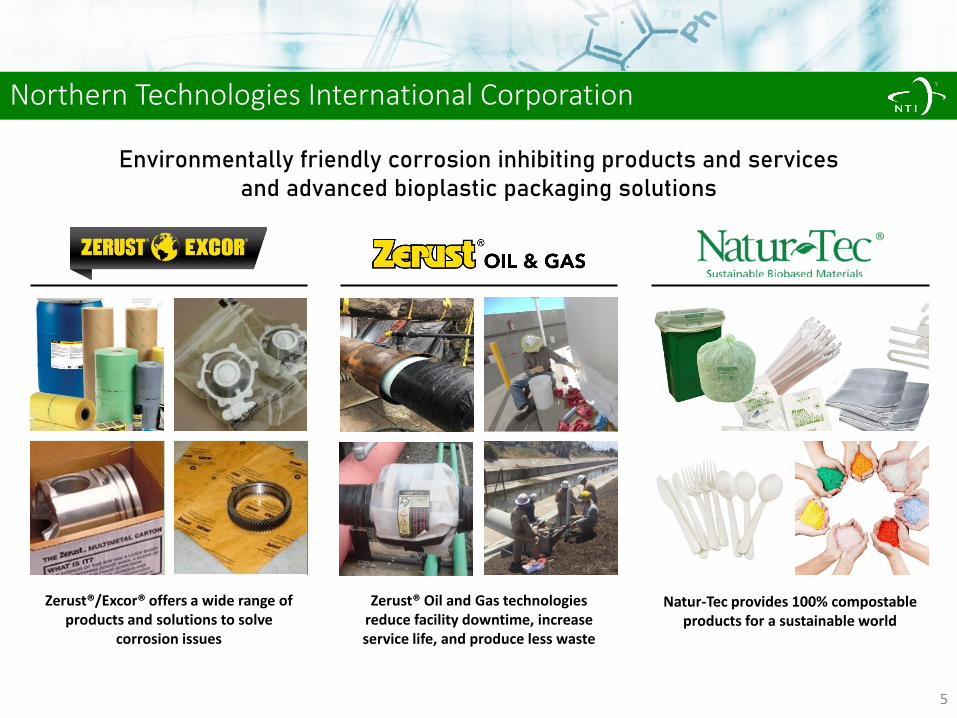
Northern Technologies International Corporation
5
Zerust®/Excor® offers a wide range of products and solutions to solve
corrosion issues
Environmentally friendly corrosion inhibiting products and services and advanced bioplastic packaging solutions
Natur-Tec provides 100% compostable products for a sustainable world
Zerust® Oil and Gas technologies reduce facility downtime, increase service life, and produce less waste
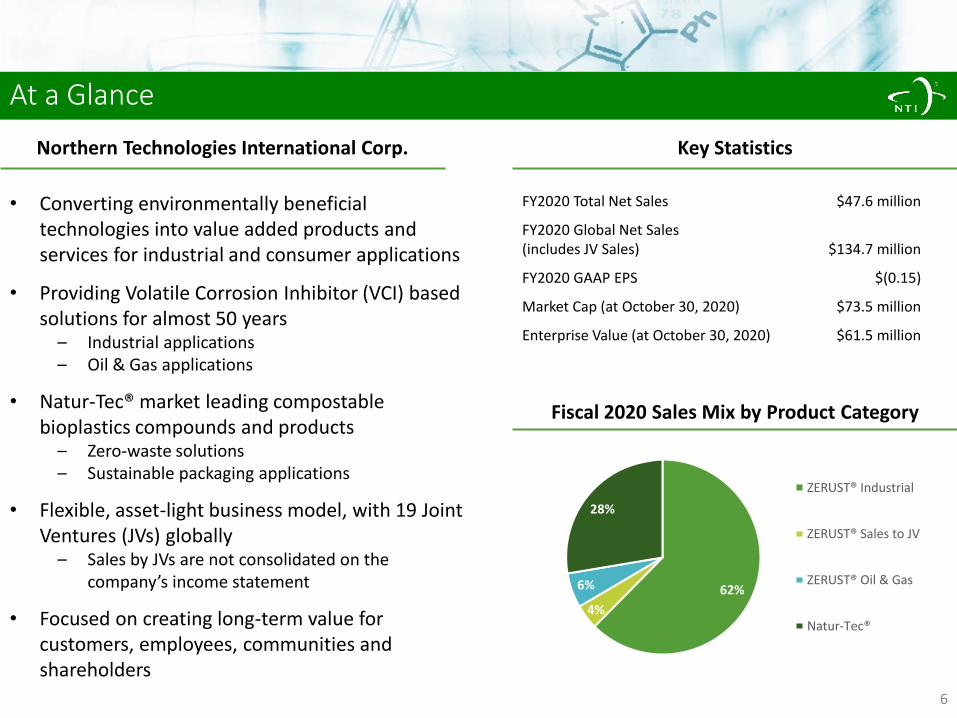
At a Glance
Northern Technologies International Corp.
• Converting environmentally beneficial technologies into value added products and services for industrial and consumer applications
• Providing Volatile Corrosion Inhibitor (VCI) based solutions for almost 50 years
– Industrial applications– Oil & Gas applications
• Natur-Tec® market leading compostable bioplastics compounds and products
– Zero-waste solutions– Sustainable packaging applications
• Flexible, asset-light business model, with 19 Joint Ventures (JVs) globally
– Sales by JVs are not consolidated on the company’s income statement
• Focused on creating long-term value for customers, employees, communities and shareholders
Key Statistics
Fiscal 2020 Sales Mix by Product Category
FY2020 Total Net Sales $47.6 million
FY2020 Global Net Sales(includes JV Sales) $134.7 million
FY2020 GAAP EPS $(0.15)
Market Cap (at October 30, 2020) $73.5 million
Enterprise Value (at October 30, 2020) $61.5 million
62%
4%
6%
28%
ZERUST® Industrial
ZERUST® Sales to JV
ZERUST® Oil & Gas
Natur-Tec®
6
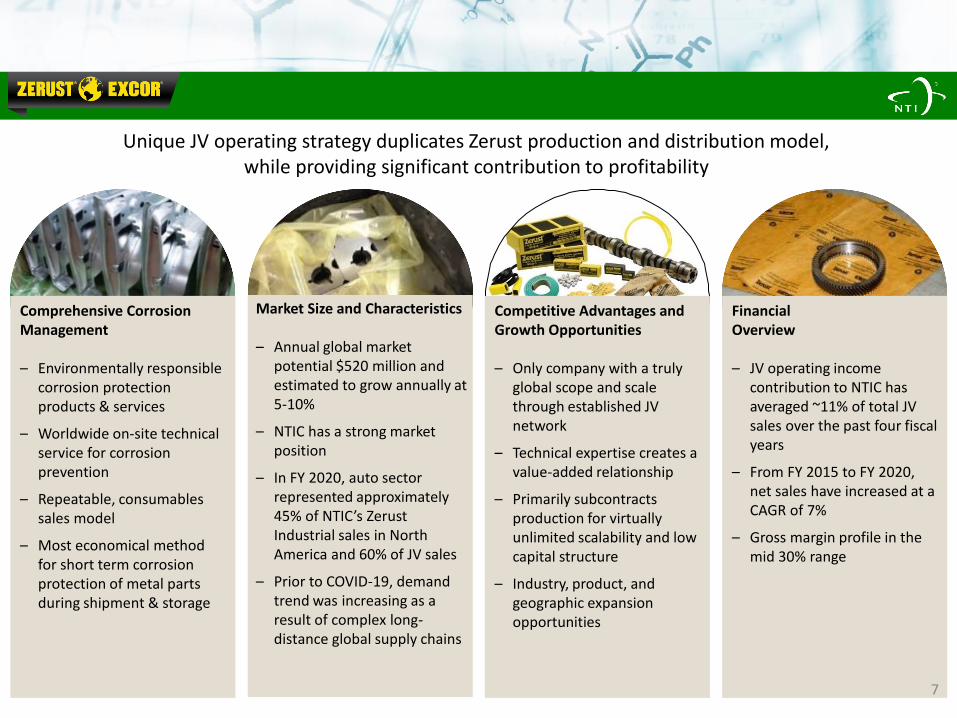
Comprehensive Corrosion Management
– Environmentally responsible corrosion protection products & services
– Worldwide on-site technical service for corrosion prevention
– Repeatable, consumables sales model
– Most economical method for short term corrosion protection of metal parts during shipment & storage
Market Size and Characteristics
– Annual global market potential $520 million and estimated to grow annually at 5-10%
– NTIC has a strong market position
– In FY 2020, auto sector represented approximately 45% of NTIC’s Zerust Industrial sales in North America and 60% of JV sales
– Prior to COVID-19, demand trend was increasing as a result of complex long-distance global supply chains
Financial Overview
– JV operating income contribution to NTIC has averaged ~11% of total JV sales over the past four fiscal years
– From FY 2015 to FY 2020, net sales have increased at a CAGR of 7%
– Gross margin profile in the mid 30% range
Competitive Advantages and Growth Opportunities
– Only company with a truly global scope and scale through established JV network
– Technical expertise creates a value-added relationship
– Primarily subcontracts production for virtually unlimited scalability and low capital structure
– Industry, product, and geographic expansion opportunities
Unique JV operating strategy duplicates Zerust production and distribution model, while providing significant contribution to profitability
7
8
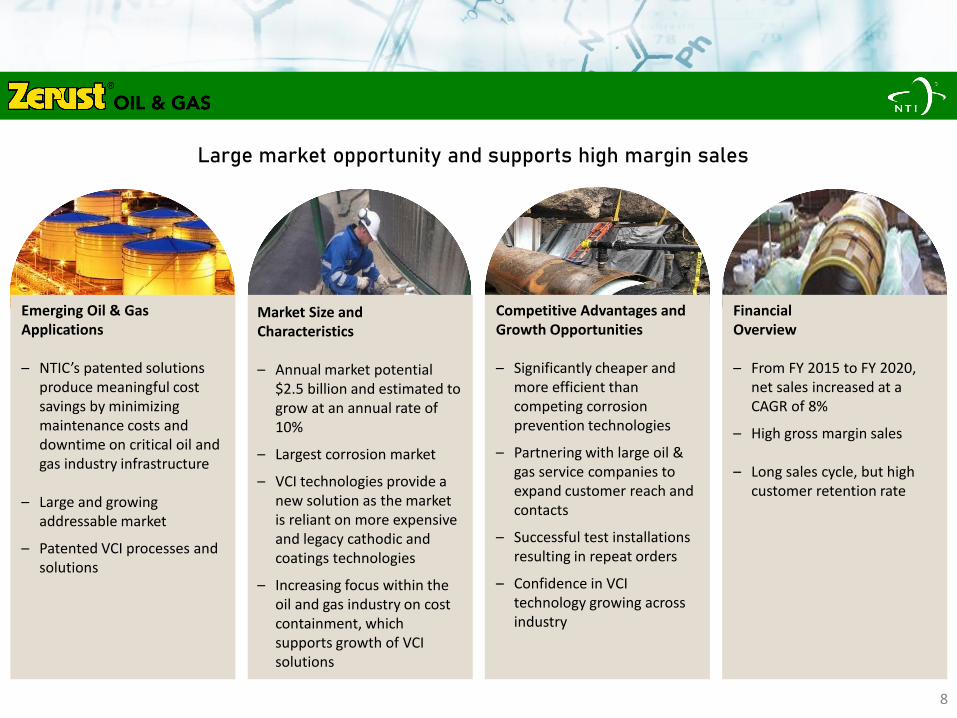
Emerging Oil & Gas Applications
– NTIC’s patented solutions produce meaningful cost savings by minimizing maintenance costs and downtime on critical oil and gas industry infrastructure
– Large and growing addressable market
– Patented VCI processes and solutions
Market Size and Characteristics
– Annual market potential$2.5 billion and estimated to grow at an annual rate of 10%
– Largest corrosion market
– VCI technologies provide a new solution as the market is reliant on more expensive and legacy cathodic and coatings technologies
– Increasing focus within the oil and gas industry on cost containment, which supports growth of VCIsolutions
Competitive Advantages and Growth Opportunities
– Significantly cheaper and more efficient than competing corrosion prevention technologies
– Partnering with large oil & gas service companies to expand customer reach and contacts
– Successful test installations resulting in repeat orders
– Confidence in VCItechnology growing across industry
Financial Overview
– From FY 2015 to FY 2020, net sales increased at a CAGR of 8%
– High gross margin sales
– Long sales cycle, but high customer retention rate
Large market opportunity and supports high margin sales
9
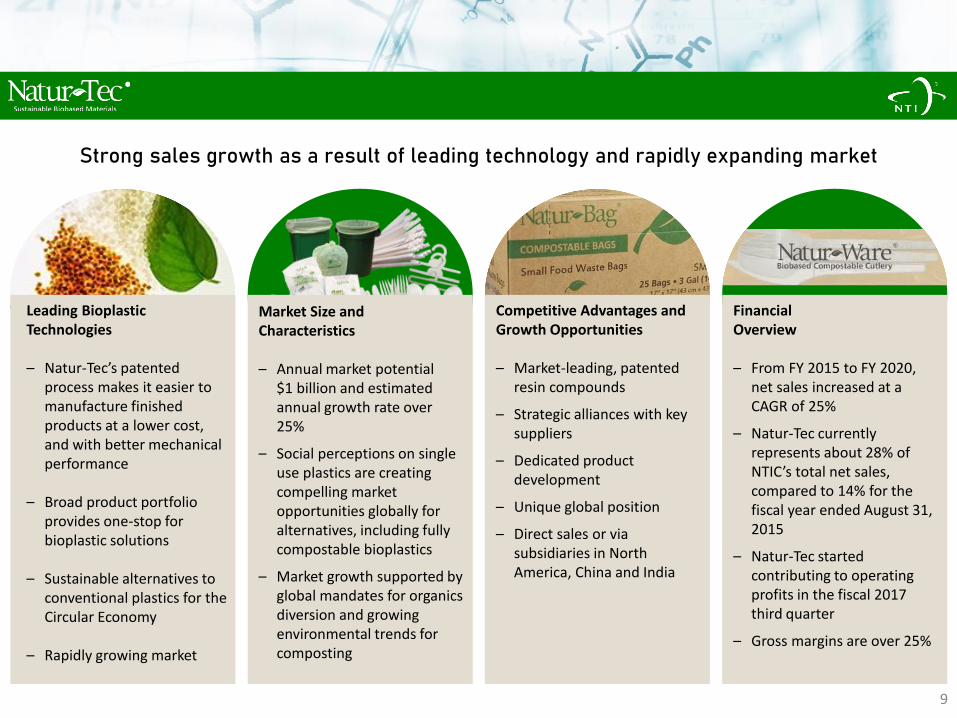
Leading Bioplastic Technologies
– Natur-Tec’s patented process makes it easier to manufacture finished products at a lower cost, and with better mechanical performance
– Broad product portfolio provides one-stop for bioplastic solutions
– Sustainable alternatives to conventional plastics for the Circular Economy
– Rapidly growing market
Market Size and Characteristics
– Annual market potential $1 billion and estimated annual growth rate over 25%
– Social perceptions on single use plastics are creating compelling market opportunities globally for alternatives, including fully compostable bioplastics
– Market growth supported by global mandates for organics diversion and growing environmental trends for composting
Competitive Advantages and Growth Opportunities
– Market-leading, patented resin compounds
– Strategic alliances with key suppliers
– Dedicated product development
– Unique global position
– Direct sales or via subsidiaries in North America, China and India
Financial Overview
– From FY 2015 to FY 2020, net sales increased at a CAGR of 25%
– Natur-Tec currently represents about 28% of NTIC’s total net sales, compared to 14% for the fiscal year ended August 31, 2015
– Natur-Tec started contributing to operating profits in the fiscal 2017 third quarter
– Gross margins are over 25%
Strong sales growth as a result of leading technology and rapidly expanding market
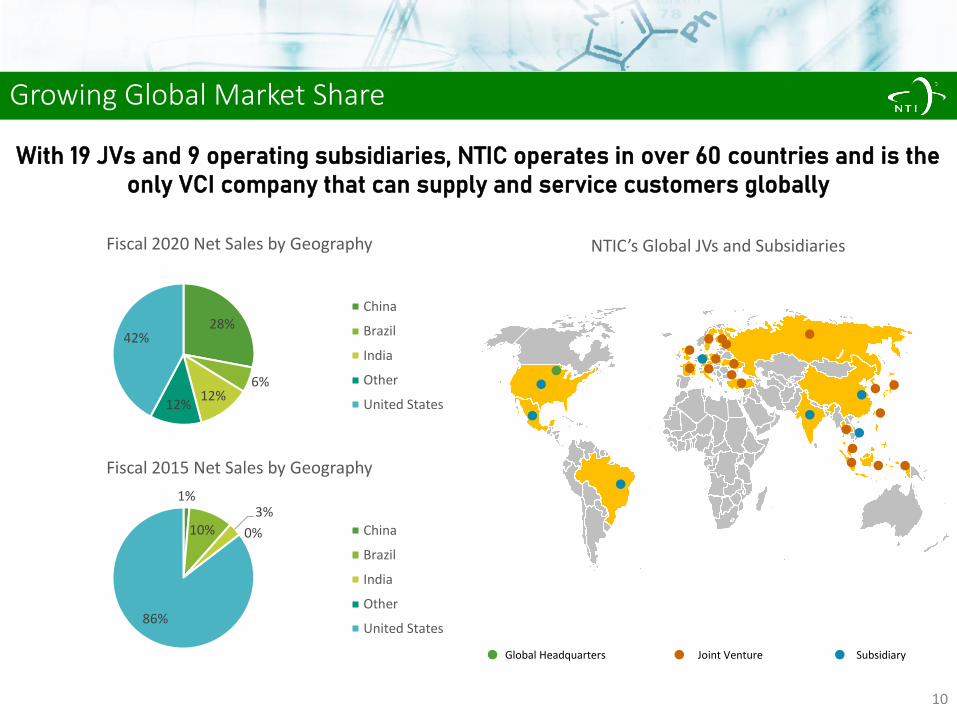
Growing Global Market Share
With 19 JVs and 9 operating subsidiaries, NTIC operates in over 60 countries and is the only VCI company that can supply and service customers globally
28%
6%12%
12%
42%
Fiscal 2020 Net Sales by Geography
China
Brazil
India
Other
United States
1%
10%3%
0%
86%
Fiscal 2015 Net Sales by Geography
China
Brazil
India
Other
United States
NTIC’s Global JVs and Subsidiaries
10
Global Headquarters SubsidiaryJoint Venture
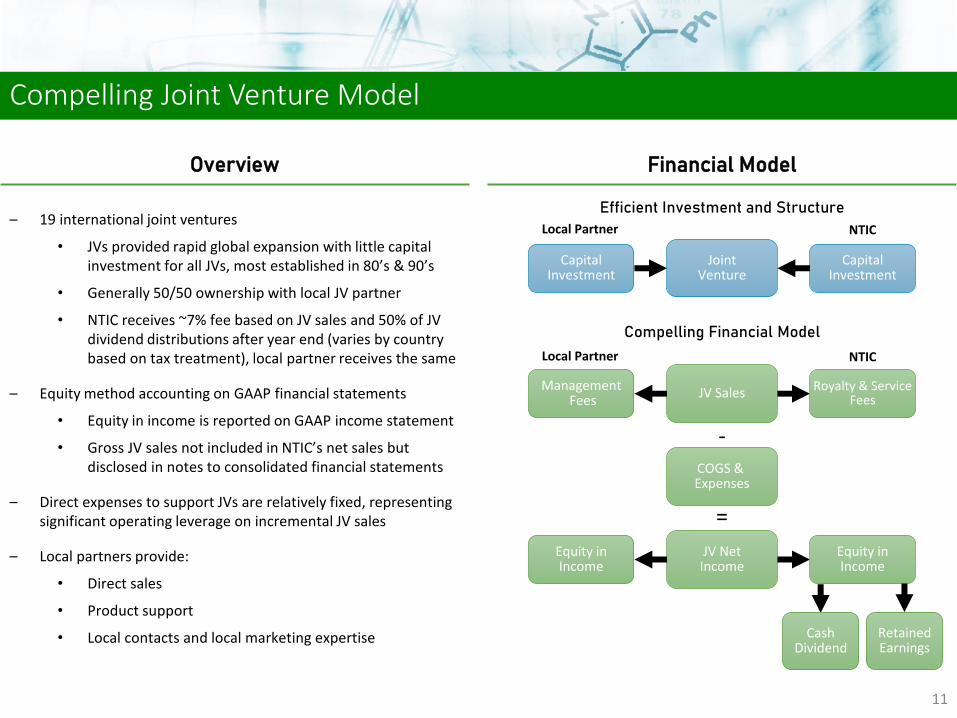
Compelling Joint Venture Model
Overview Financial Model
– 19 international joint ventures
• JVs provided rapid global expansion with little capital investment for all JVs, most established in 80’s & 90’s
• Generally 50/50 ownership with local JV partner
• NTIC receives ~7% fee based on JV sales and 50% of JV dividend distributions after year end (varies by country based on tax treatment), local partner receives the same
– Equity method accounting on GAAP financial statements
• Equity in income is reported on GAAP income statement
• Gross JV sales not included in NTIC’s net sales but disclosed in notes to consolidated financial statements
– Direct expenses to support JVs are relatively fixed, representing significant operating leverage on incremental JV sales
– Local partners provide:
• Direct sales
• Product support
• Local contacts and local marketing expertise
CapitalInvestment
CapitalInvestment
JointVenture
Efficient Investment and Structure
Compelling Financial Model
JV Sales
COGS & Expenses
JV NetIncome
-
=
ManagementFees
Equity inIncome
Royalty & ServiceFees
Equity inIncome
CashDividend
RetainedEarnings
Local Partner NTIC
Local Partner NTIC
11
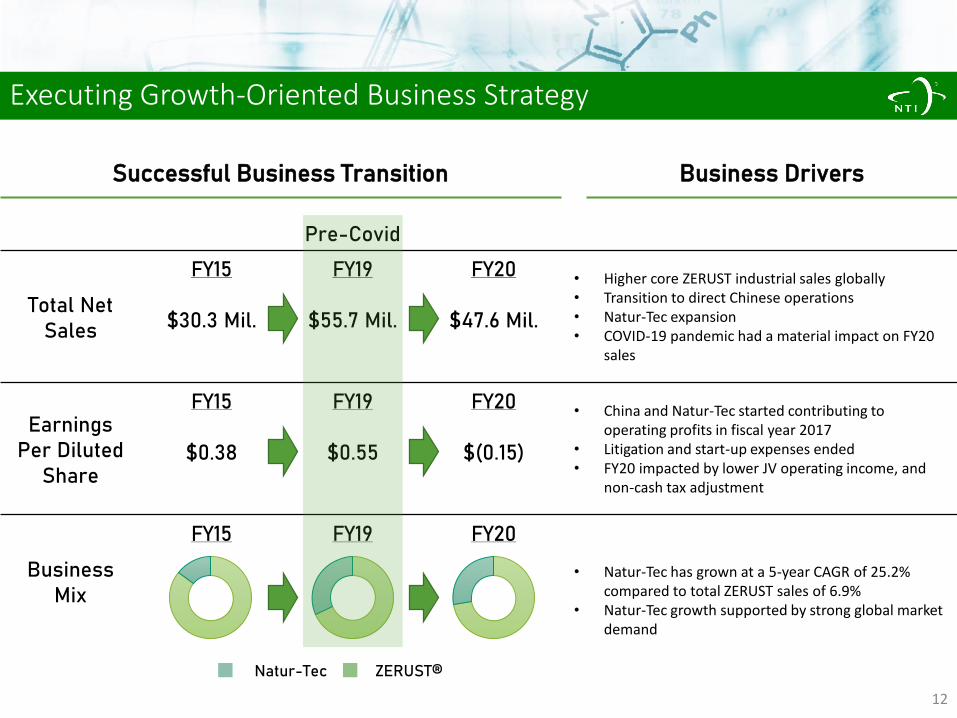
Pre-Covid
Total Net Sales
FY15
$30.3 Mil.
FY19
$55.7 Mil.
FY20
$47.6 Mil.
• Higher core ZERUST industrial sales globally• Transition to direct Chinese operations• Natur-Tec expansion• COVID-19 pandemic had a material impact on FY20
sales
Earnings Per Diluted
Share
FY15
$0.38
FY19
$0.55
FY20
$(0.15)
• China and Natur-Tec started contributing to operating profits in fiscal year 2017
• Litigation and start-up expenses ended• FY20 impacted by lower JV operating income, and
non-cash tax adjustment
Business Mix
FY15 FY19 FY20
• Natur-Tec has grown at a 5-year CAGR of 25.2% compared to total ZERUST sales of 6.9%
• Natur-Tec growth supported by strong global market demand
Successful Business Transition Business Drivers
Executing Growth-Oriented Business Strategy
Natur-Tec ZERUST®
12
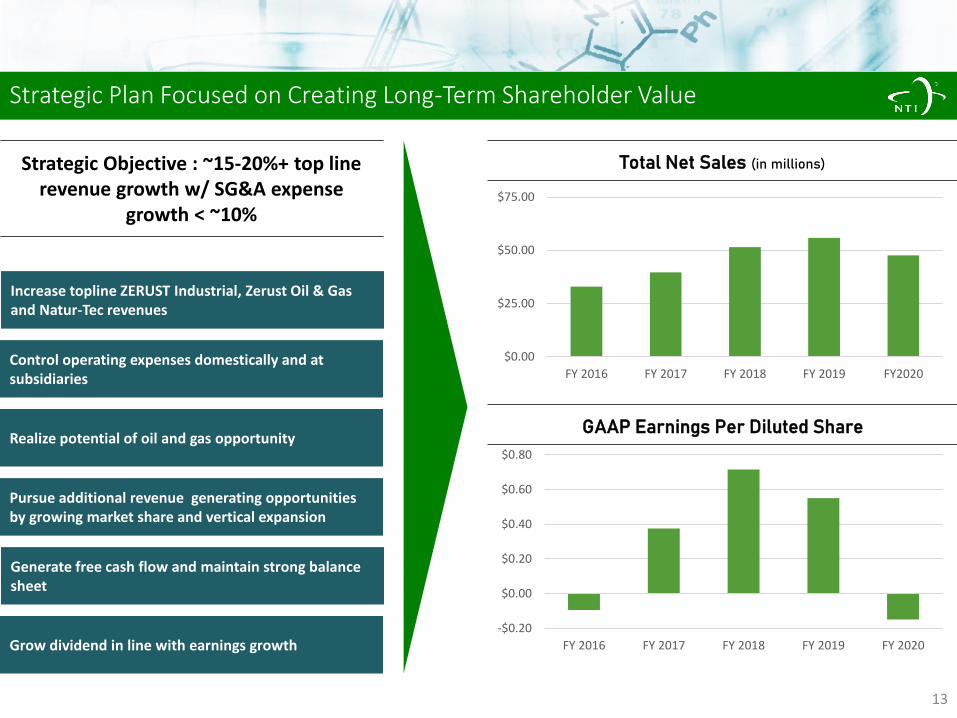
Strategic Plan Focused on Creating Long-Term Shareholder Value
13
Strategic Objective : ~15-20%+ top line revenue growth w/ SG&A expense
growth < ~10%
Total Net Sales (in millions)
GAAP Earnings Per Diluted Share
Control operating expenses domestically and at subsidiaries
Realize potential of oil and gas opportunity
Pursue additional revenue generating opportunities by growing market share and vertical expansion
Grow dividend in line with earnings growth
Increase topline ZERUST Industrial, Zerust Oil & Gas and Natur-Tec revenues
Generate free cash flow and maintain strong balance sheet
$0.00
$25.00
$50.00
$75.00
FY 2016 FY 2017 FY 2018 FY 2019 FY2020
-$0.20
$0.00
$0.20
$0.40
$0.60
$0.80
FY 2016 FY 2017 FY 2018 FY 2019 FY 2020
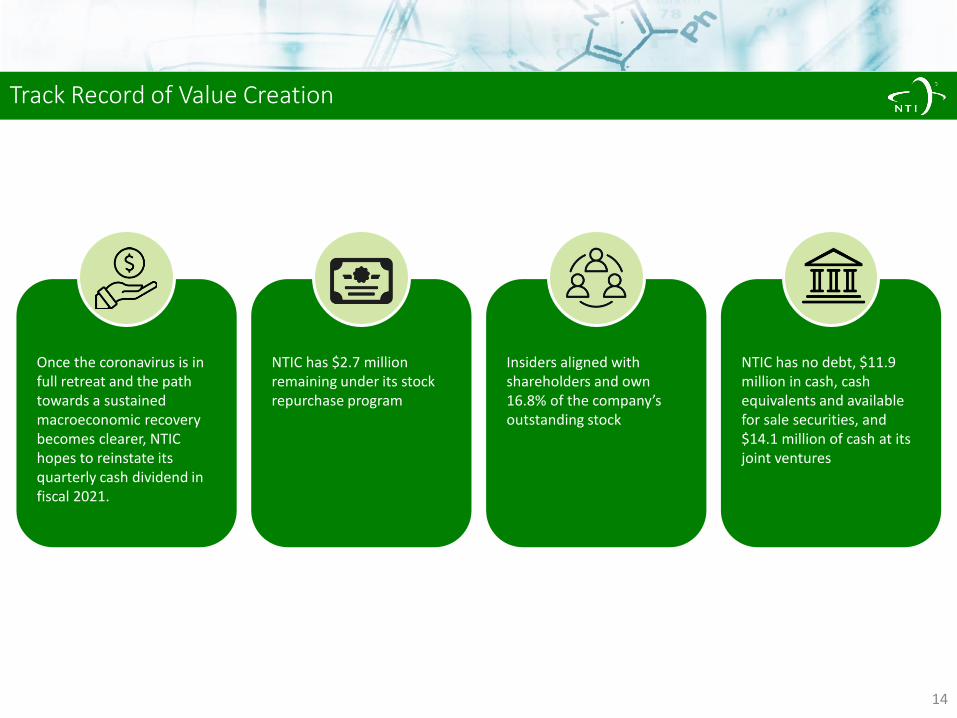
Track Record of Value Creation
14
Once the coronavirus is in full retreat and the path towards a sustained macroeconomic recovery becomes clearer, NTIC hopes to reinstate its quarterly cash dividend in fiscal 2021.
NTIC has $2.7 million remaining under its stock repurchase program
Insiders aligned with shareholders and own 16.8% of the company’s outstanding stock
NTIC has no debt, $11.9 million in cash, cash equivalents and available for sale securities, and $14.1 million of cash at its joint ventures
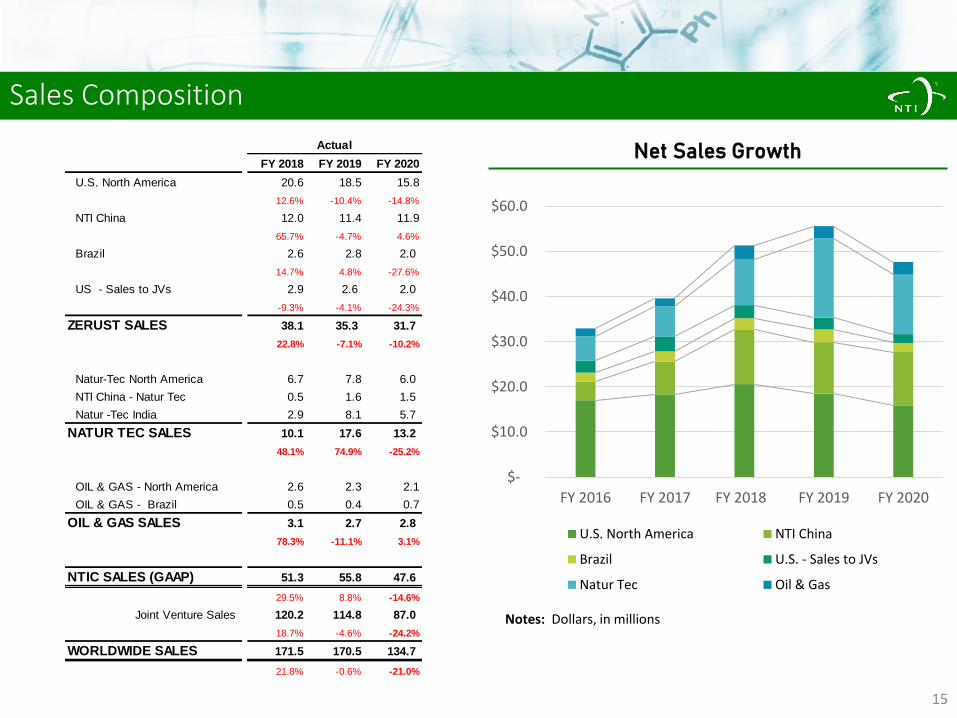
Sales Composition
15
Notes: Dollars, in millions
$-
$10.0
$20.0
$30.0
$40.0
$50.0
$60.0
FY 2016 FY 2017 FY 2018 FY 2019 FY 2020
U.S. North America NTI China
Brazil U.S. - Sales to JVs
Natur Tec Oil & Gas
Net Sales GrowthFY 2018 FY 2019 FY 2020
U.S. North America 20.6 18.5 15.8
12.6% -10.4% -14.8%
NTI China 12.0 11.4 11.9
65.7% -4.7% 4.6%
Brazil 2.6 2.8 2.0
14.7% 4.8% -27.6%
US - Sales to JVs 2.9 2.6 2.0
-9.3% -4.1% -24.3%
ZERUST SALES 38.1 35.3 31.7
22.8% -7.1% -10.2%
Natur-Tec North America 6.7 7.8 6.0
NTI China - Natur Tec 0.5 1.6 1.5
Natur -Tec India 2.9 8.1 5.7
NATUR TEC SALES 10.1 17.6 13.2
48.1% 74.9% -25.2%
OIL & GAS - North America 2.6 2.3 2.1
OIL & GAS - Brazil 0.5 0.4 0.7
OIL & GAS SALES 3.1 2.7 2.8
78.3% -11.1% 3.1%
NTIC SALES (GAAP) 51.3 55.8 47.6
29.5% 8.8% -14.6%
Joint Venture Sales 120.2 114.8 87.0
18.7% -4.6% -24.2%
WORLDWIDE SALES 171.5 170.5 134.7
21.8% -0.6% -21.0%
Actual
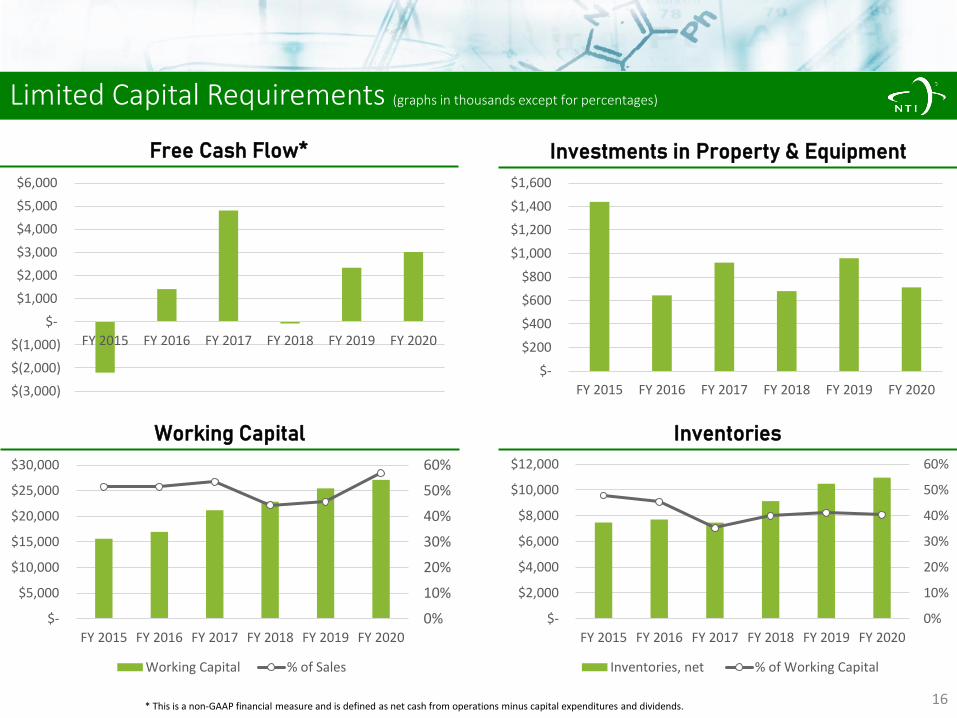
Limited Capital Requirements (graphs in thousands except for percentages)
16
$(3,000)
$(2,000)
$(1,000)
$-
$1,000
$2,000
$3,000
$4,000
$5,000
$6,000
FY 2015 FY 2016 FY 2017 FY 2018 FY 2019 FY 2020
$-
$200
$400
$600
$800
$1,000
$1,200
$1,400
$1,600
FY 2015 FY 2016 FY 2017 FY 2018 FY 2019 FY 2020
0%
10%
20%
30%
40%
50%
60%
$-
$2,000
$4,000
$6,000
$8,000
$10,000
$12,000
FY 2015 FY 2016 FY 2017 FY 2018 FY 2019 FY 2020
Inventories, net % of Working Capital
0%
10%
20%
30%
40%
50%
60%
$-
$5,000
$10,000
$15,000
$20,000
$25,000
$30,000
FY 2015 FY 2016 FY 2017 FY 2018 FY 2019 FY 2020
Working Capital % of Sales
Working Capital Inventories
Free Cash Flow* Investments in Property & Equipment
* This is a non-GAAP financial measure and is defined as net cash from operations minus capital expenditures and dividends.
Why NTIC
• Creating a diverse portfolio of environmentally beneficial materials
• Operating in large, dynamic, and global markets, with favorable long-term trends
• Global footprint and service focus, as well as 12 patents and 50 trademarks create competitive advantages and barriers to entry
• Commitment to creating long-term shareholder value– Compelling organic growth opportunities – Significant improvement in earnings– Disciplined capital management– History of returning capital to shareholders
• Strong, experienced, and motivated management team – Management aligned with shareholders and insiders own almost 17% of the total outstanding shares