Embed Size (px)
Citation preview
Best low-cost airline in Europe 2013-2015 World’s best Long Haul low-cost airline 2015
Norwegian Air Shuttle ASA Q2 2015 Presentation
Photo: Bo Mathiesen
Europe’s best low-cost airline 2013,2014 & 2015
• New routes launched
– domestic Spain
– London-Boston
– Caribbean (Puerto Rico + winter routes)
• SkyTrax awards 2015
– Best Low-Cost airline in Europe (3 years in a row)
– World’s best Long Haul Low-Cost airline
• Three new aircraft to the fleet in Q2
– 2 new 737-800’s (four new in first half)
– 1 new 787-8 Dreamliner (to a fleet of eight)
• Strong progress for long-haul
• EBT improved to NOK 456 million from a
loss of NOK 137 million last year
Q2 2015 Highlights
2
Europe’s best low-cost airline 2013,2014 & 2015
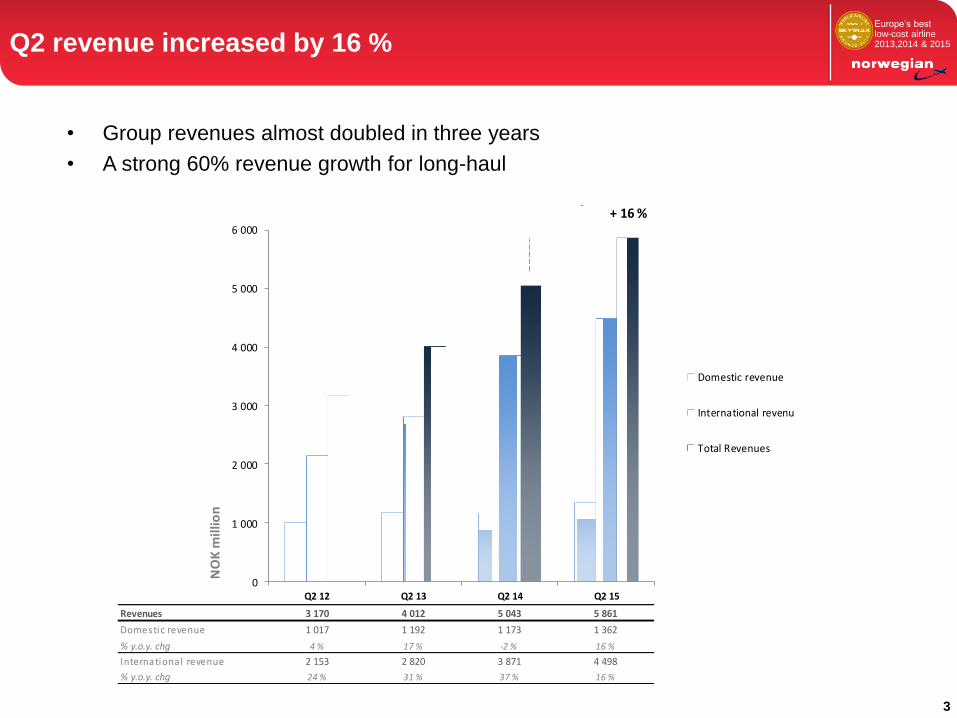
• Group revenues almost doubled in three years
• A strong 60% revenue growth for long-haul
Q2 revenue increased by 16 %
Revenues 3 170 4 012 5 043 5 861
Domestic revenue 1 017 1 192 1 173 1 362
% y.o.y. chg 4 % 17 % -2 % 16 %
International revenue 2 153 2 820 3 871 4 498
% y.o.y. chg 24 % 31 % 37 % 16 %
0
1 000
2 000
3 000
4 000
5 000
6 000
Q2 12 Q2 13 Q2 14 Q2 15
NO
K m
illi
on
Domestic revenue
International revenue
Total Revenues
+ 16 %
3
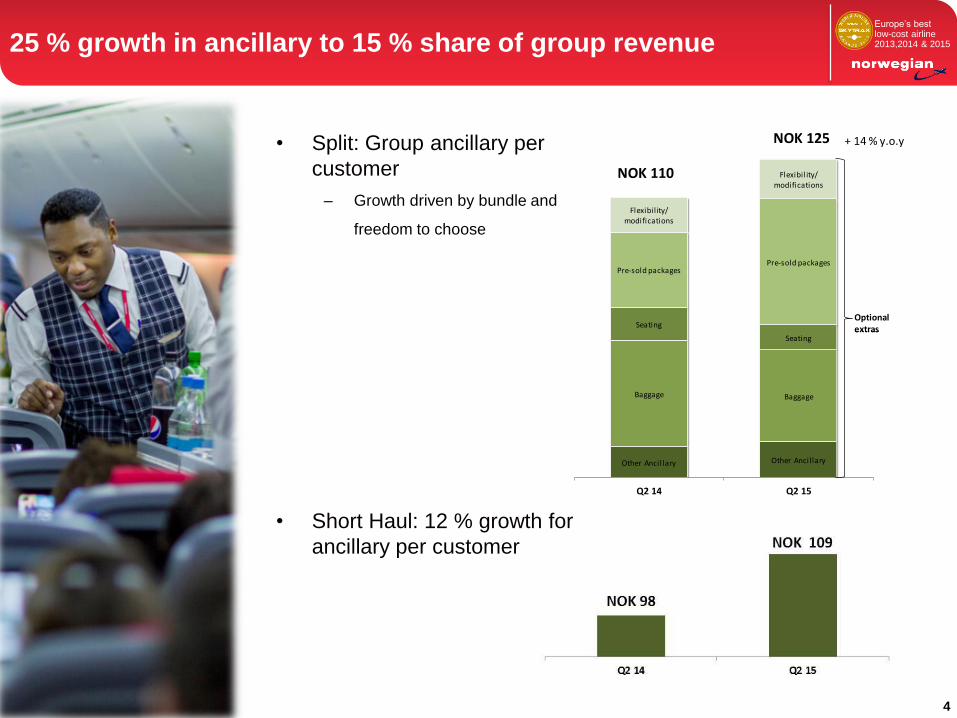
Europe’s best low-cost airline 2013,2014 & 2015 25 % growth in ancillary to 15 % share of group revenue
4
• Split: Group ancillary per
customer
– Growth driven by bundle and
freedom to choose
• Short Haul: 12 % growth for
ancillary per customer
Other Ancillary Other Ancillary
Baggage Baggage
Seating
Seating
Pre-sold packagesPre-sold packages
Flexibility/ modifications
Flexibility/ modifications
Q2 14 Q2 15
Optional extras
NOK 125
Optional extras
+ 14 % y.o.y
NOK 110
Europe’s best low-cost airline 2013,2014 & 2015 EBT improved by NOK 593 million on higher load
Q2 12 Q2 13 Q2 14 Q2 15 Q2 12 Q2 13 Q2 14 Q2 15
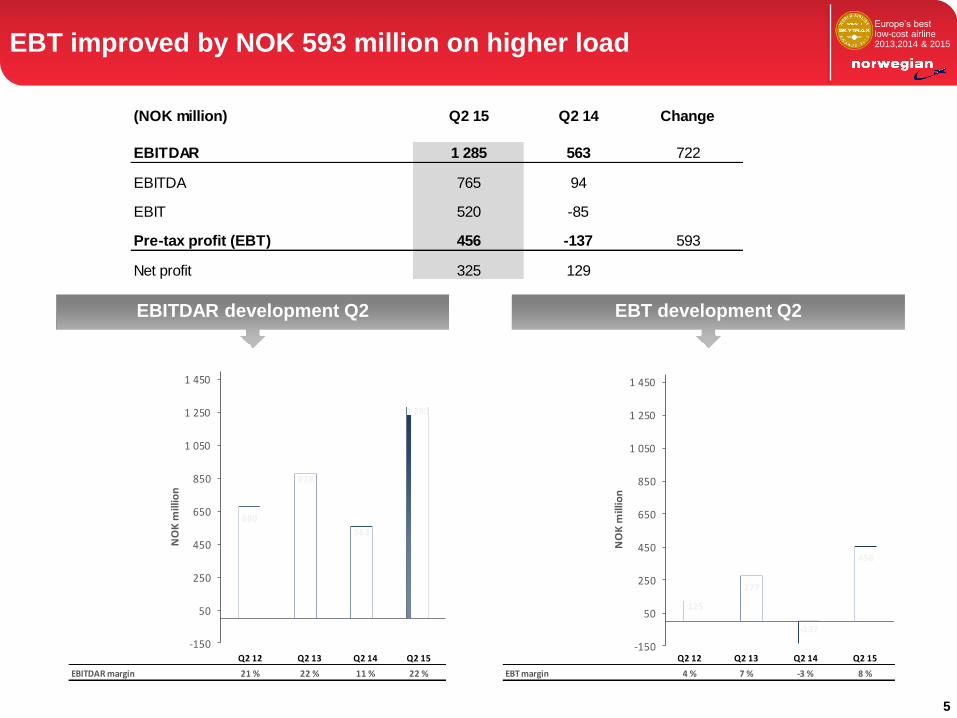
EBITDAR margin 21 % 22 % 11 % 22 % EBT margin 4 % 7 % -3 % 8 %
680
878
563
1 285
-150
50
250
450
650
850
1 050
1 250
1 450
NO
K m
illio
n
125
277
-137
456
-150
50
250
450
650
850
1 050
1 250
1 450
NO
K m
illio
n
EBT development Q2 EBITDAR development Q2
5
(NOK million) Q2 15 Q2 14 Change
EBITDAR 1 285 563 722
EBITDA 765 94
EBIT 520 -85
Pre-tax profit (EBT) 456 -137 593
Net profit 325 129
Europe’s best low-cost airline 2013,2014 & 2015
• USD/NOK has strengthened by 29 % y.o.y
• Spot fuel price down by 39 % (-20 % in NOK)
• Saved NOK 572 million on lower fuel cost (-18 % per ASK)
– NOK 826 million reduction due to lower spot price
– NOK 42 million saved on lower fuel consumption due to new aircraft
– NOK 296 million negative impact of currency (USD/NOK)
• Other opex: NOK 311 million negative impact from currency
– Related to leasing, maintenance, airport charges, handling, etc.
• One-offs included in EBT
– NOK 84 million extra cost related to engine maintenance
– NOK 10 million Wetlease
– NOK 100 million gain on hedging
Tailwind from fuel offset by currency
6
Europe’s best low-cost airline 2013,2014 & 2015
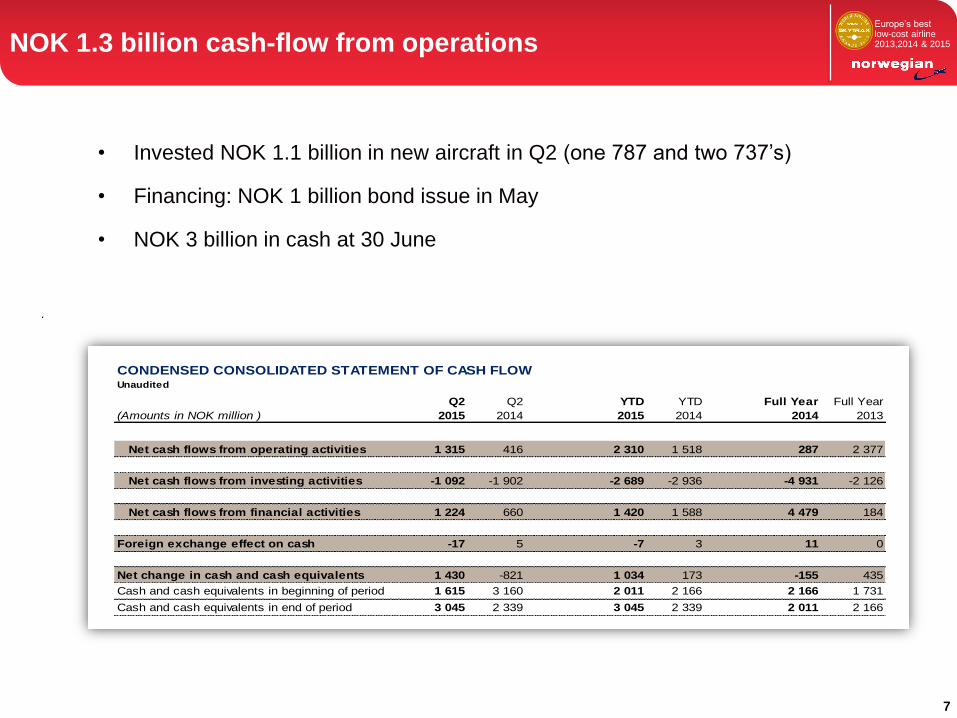
CONDENSED CONSOLIDATED STATEMENT OF CASH FLOWUnaudited
Q2 Q2 YTD YTD Full Year Full Year
(Amounts in NOK million ) 2015 2014 2015 2014 2014 2013
Net cash flows from operating activities 1 315 416 2 310 1 518 287 2 377
Net cash flows from investing activities -1 092 -1 902 -2 689 -2 936 -4 931 -2 126
Net cash flows from financial activities 1 224 660 1 420 1 588 4 479 184
Foreign exchange effect on cash -17 5 -7 3 11 0
Net change in cash and cash equivalents 1 430 -821 1 034 173 -155 435
Cash and cash equivalents in beginning of period 1 615 3 160 2 011 2 166 2 166 1 731
Cash and cash equivalents in end of period 3 045 2 339 3 045 2 339 2 011 2 166
NOK 1.3 billion cash-flow from operations
7
• Invested NOK 1.1 billion in new aircraft in Q2 (one 787 and two 737’s)
• Financing: NOK 1 billion bond issue in May
• NOK 3 billion in cash at 30 June
Europe’s best low-cost airline 2013,2014 & 2015 Balance sheet boost by currency and new aircraft
8
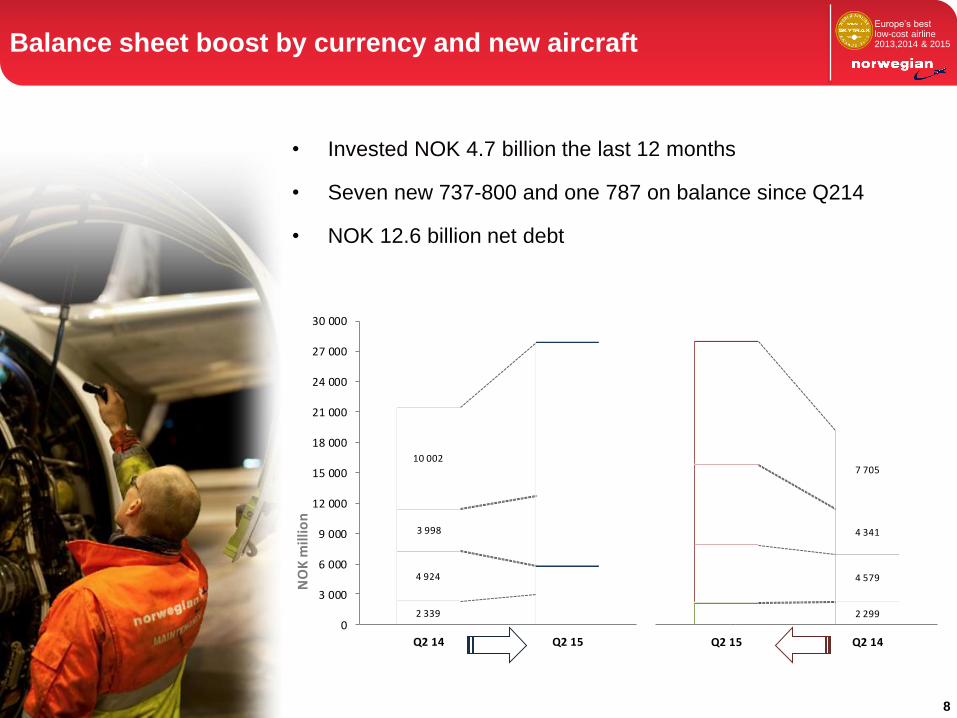
• Invested NOK 4.7 billion the last 12 months
• Seven new 737-800 and one 787 on balance since Q214
• NOK 12.6 billion net debt
2 339Cash3 045
4 924 Receivables2 801
3 998
Aircraft PDP / other assets
6 783
10 002
Aircraft15 140
0
3 000
6 000
9 000
12 000
15 000
18 000
21 000
24 000
27 000
30 000
Q2 14 Q2 15
NO
K m
illi
on
Equity2 163
2 299
Pre-sold tickets5 605
4 579
Otherliabilities
7 910
4 341
Aircraft Financing
12 092
7 705
Q2 15 Q2 14
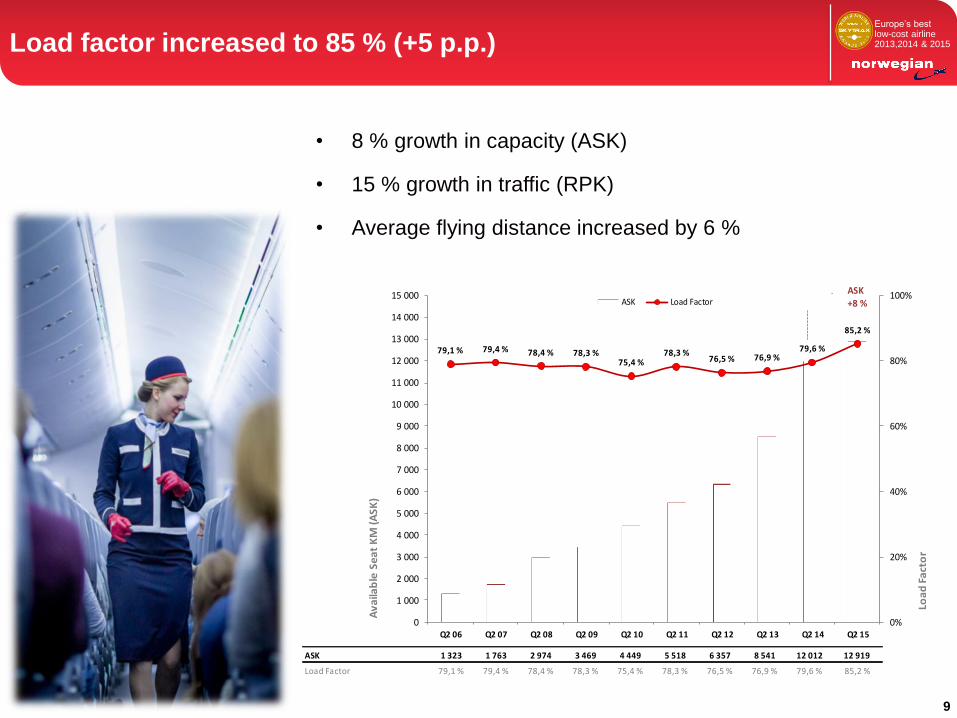
Europe’s best low-cost airline 2013,2014 & 2015 Load factor increased to 85 % (+5 p.p.)
• 8 % growth in capacity (ASK)
• 15 % growth in traffic (RPK)
• Average flying distance increased by 6 %
ASK 1 323 1 763 2 974 3 469 4 449 5 518 6 357 8 541 12 012 12 919
Load Factor 79,1 % 79,4 % 78,4 % 78,3 % 75,4 % 78,3 % 76,5 % 76,9 % 79,6 % 85,2 %
79,1 % 79,4 % 78,4 % 78,3 %75,4 %
78,3 %76,5 % 76,9 %
79,6 %
85,2 %
0%
20%
40%
60%
80%
100%
0
1 000
2 000
3 000
4 000
5 000
6 000
7 000
8 000
9 000
10 000
11 000
12 000
13 000
14 000
15 000
Q2 06 Q2 07 Q2 08 Q2 09 Q2 10 Q2 11 Q2 12 Q2 13 Q2 14 Q2 15
Loa
d F
act
or
Av
aila
ble
Se
at
KM
(A
SK
)
ASK Load FactorASK +8 %
9
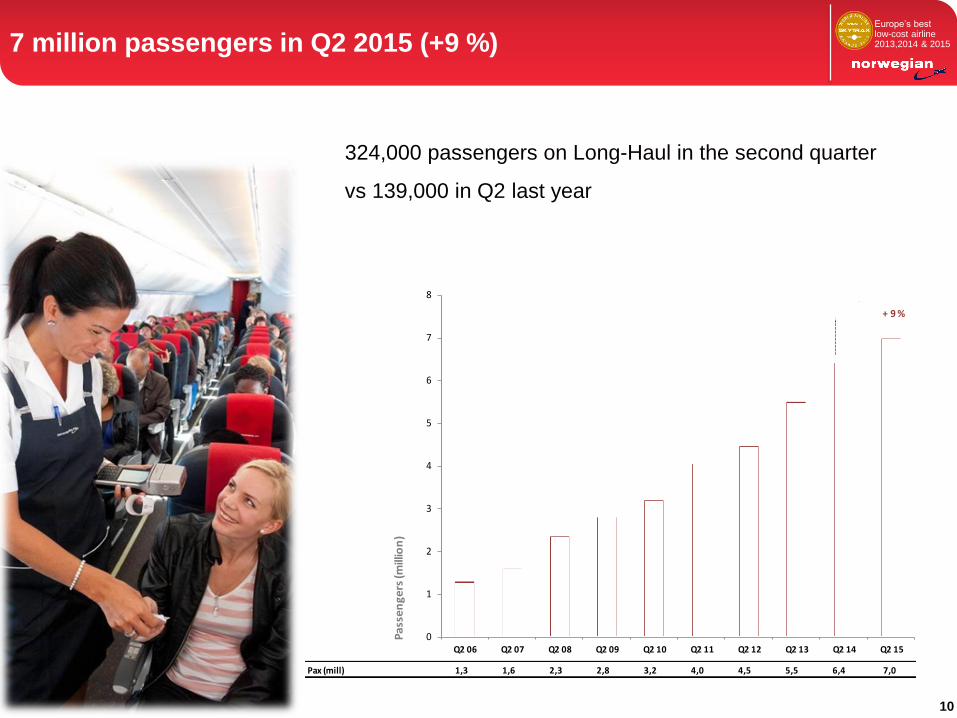
Europe’s best low-cost airline 2013,2014 & 2015 7 million passengers in Q2 2015 (+9 %)
324,000 passengers on Long-Haul in the second quarter
vs 139,000 in Q2 last year
Pax (mill) 1,3 1,6 2,3 2,8 3,2 4,0 4,5 5,5 6,4 7,0
0
1
2
3
4
5
6
7
8
Q2 06 Q2 07 Q2 08 Q2 09 Q2 10 Q2 11 Q2 12 Q2 13 Q2 14 Q2 15
Pa
sse
ng
ers
(mill
ion
)
+ 9 %
10
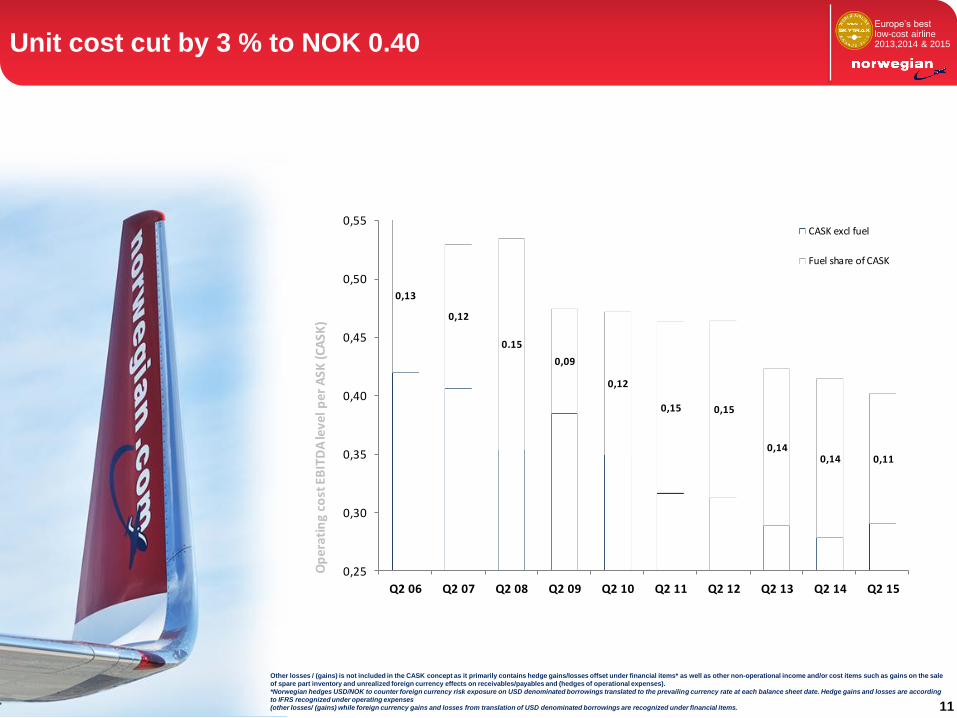
Europe’s best low-cost airline 2013,2014 & 2015 Unit cost cut by 3 % to NOK 0.40
Other losses / (gains) is not included in the CASK concept as it primarily contains hedge gains/losses offset under financial items* as well as other non-operational income and/or cost items such as gains on the sale
of spare part inventory and unrealized foreign currency effects on receivables/payables and (hedges of operational expenses).
*Norwegian hedges USD/NOK to counter foreign currency risk exposure on USD denominated borrowings translated to the prevailing currency rate at each balance sheet date. Hedge gains and losses are according
to IFRS recognized under operating expenses
(other losses/ (gains) while foreign currency gains and losses from translation of USD denominated borrowings are recognized under financial items.
11
0,42
0,41
0,35
0,38
0,35
0,32 0,31
0,290,28
0,29
0,13
0,12
0.15
0,09
0,12
0,15 0,15
0,14 0,14 0,11
0,25
0,30
0,35
0,40
0,45
0,50
0,55
Q2 06 Q2 07 Q2 08 Q2 09 Q2 10 Q2 11 Q2 12 Q2 13 Q2 14 Q2 15
Op
era
tin
g co
st E
BIT
DA
leve
l pe
r A
SK (
CA
SK)
CASK excl fuel
Fuel share of CASK
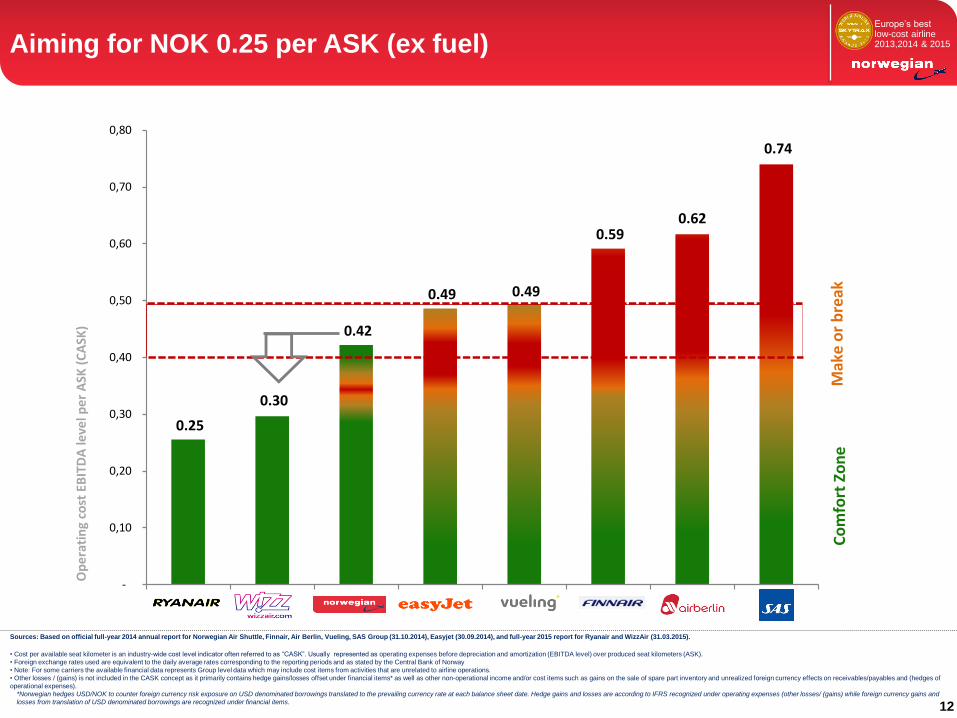
Europe’s best low-cost airline 2013,2014 & 2015 Aiming for NOK 0.25 per ASK (ex fuel)
• Cost per available seat kilometer is an industry-wide cost level indicator often referred to as “CASK”. Usually represented as operating expenses before depreciation and amortization (EBITDA level) over produced seat kilometers (ASK).
• Foreign exchange rates used are equivalent to the daily average rates corresponding to the reporting periods and as stated by the Central Bank of Norway
• Note: For some carriers the available financial data represents Group level data which may include cost items from activities that are unrelated to airline operations.
• Other losses / (gains) is not included in the CASK concept as it primarily contains hedge gains/losses offset under financial items* as well as other non-operational income and/or cost items such as gains on the sale of spare part inventory and unrealized foreign currency effects on receivables/payables and (hedges of
operational expenses).
*Norwegian hedges USD/NOK to counter foreign currency risk exposure on USD denominated borrowings translated to the prevailing currency rate at each balance sheet date. Hedge gains and losses are according to IFRS recognized under operating expenses (other losses/ (gains) while foreign currency gains and
losses from translation of USD denominated borrowings are recognized under financial items.
Sources: Based on official full-year 2014 annual report for Norwegian Air Shuttle, Finnair, Air Berlin, Vueling, SAS Group (31.10.2014), Easyjet (30.09.2014), and full-year 2015 report for Ryanair and WizzAir (31.03.2015).
12
0.25
0.30
0.42
0.49 0.49
0.59 0.62
0.74
-
0,10
0,20
0,30
0,40
0,50
0,60
0,70
0,80
Op
era
tin
g co
st E
BIT
DA
leve
l pe
r A
SK (
CA
SK)
Co
mfo
rt Z
on
eM
ake
or
bre
ak
Europe’s best low-cost airline 2013,2014 & 2015
8 58 11 1320
2223
23 22
115 5
2
2 5
5 5
5
5 5
5
7 16 21
23
2529
29
2720
16
2
810
13
13
13
1313
2
7 1523
30 4151 68
83
5
4
12
2
55
9
12
1
23
3
3
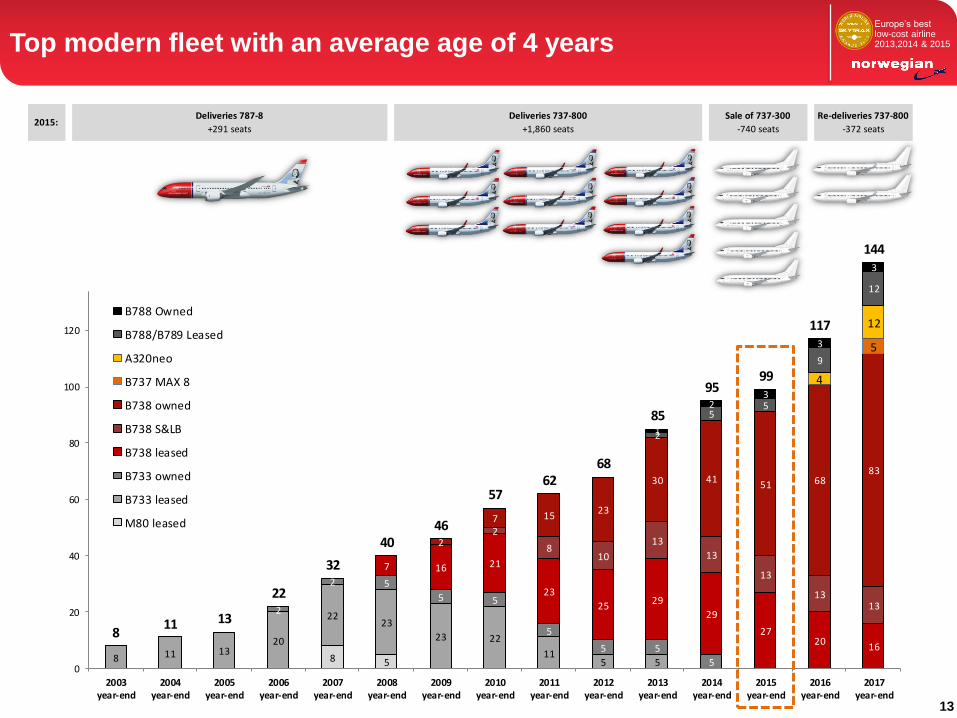
811 13
22
32
4046
5762
68
85
9599
117
144
0
20
40
60
80
100
120
140
2003year-end
2004year-end
2005year-end
2006year-end
2007year-end
2008year-end
2009year-end
2010year-end
2011year-end
2012year-end
2013year-end
2014year-end
2015year-end
2016year-end
2017year-end
B788 Owned
B788/B789 Leased
A320neo
B737 MAX 8
B738 owned
B738 S&LB
B738 leased
B733 owned
B733 leased
M80 leased
Top modern fleet with an average age of 4 years
13
2015:Sale of 737-300
-740 seats
Re-deliveries 737-800
-372 seats
Deliveries 737-800
+1,860 seats
Deliveries 787-8
+291 seats
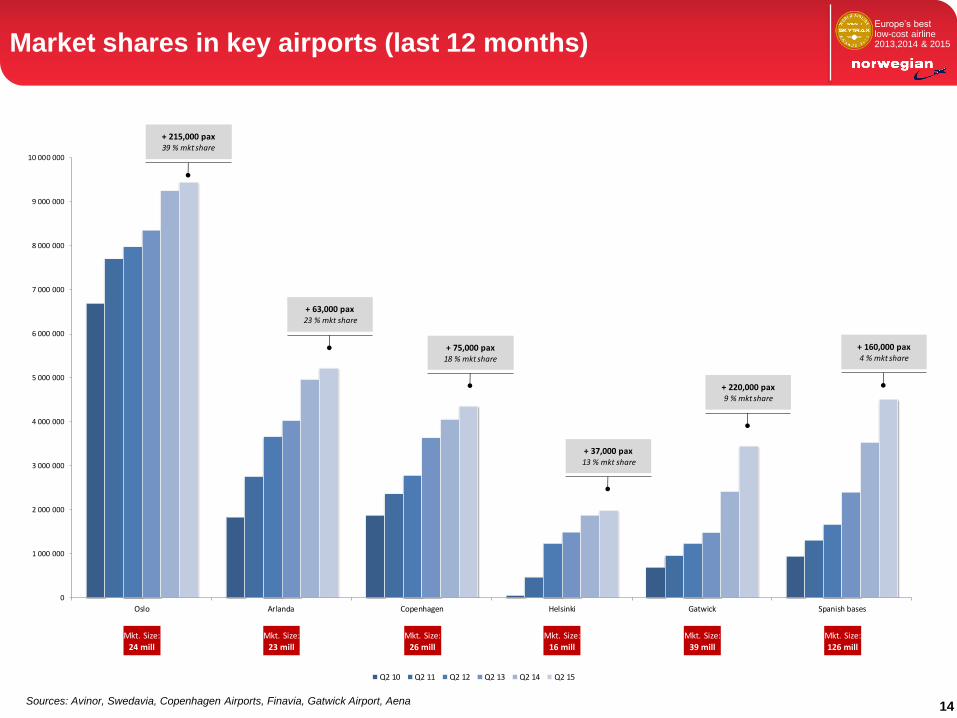
Europe’s best low-cost airline 2013,2014 & 2015 Market shares in key airports (last 12 months)
14
0
1 000 000
2 000 000
3 000 000
4 000 000
5 000 000
6 000 000
7 000 000
8 000 000
9 000 000
10 000 000
Oslo Arlanda Copenhagen Helsinki Gatwick Spanish bases
Q2 10 Q2 11 Q2 12 Q2 13 Q2 14 Q2 15
+ 215,000 pax 39 % mkt share
+ 63,000 pax23 % mkt share
+ 75,000 pax18 % mkt share
+ 37,000 pax13 % mkt share
+ 220,000 pax9 % mkt share
+ 160,000 pax4 % mkt share
Mkt. Size:24 mill
Mkt. Size:23 mill
Mkt. Size:126 mill
Mkt. Size:39 mill
Mkt. Size:16 mill
Mkt. Size:26 mill
Sources: Avinor, Swedavia, Copenhagen Airports, Finavia, Gatwick Airport, Aena
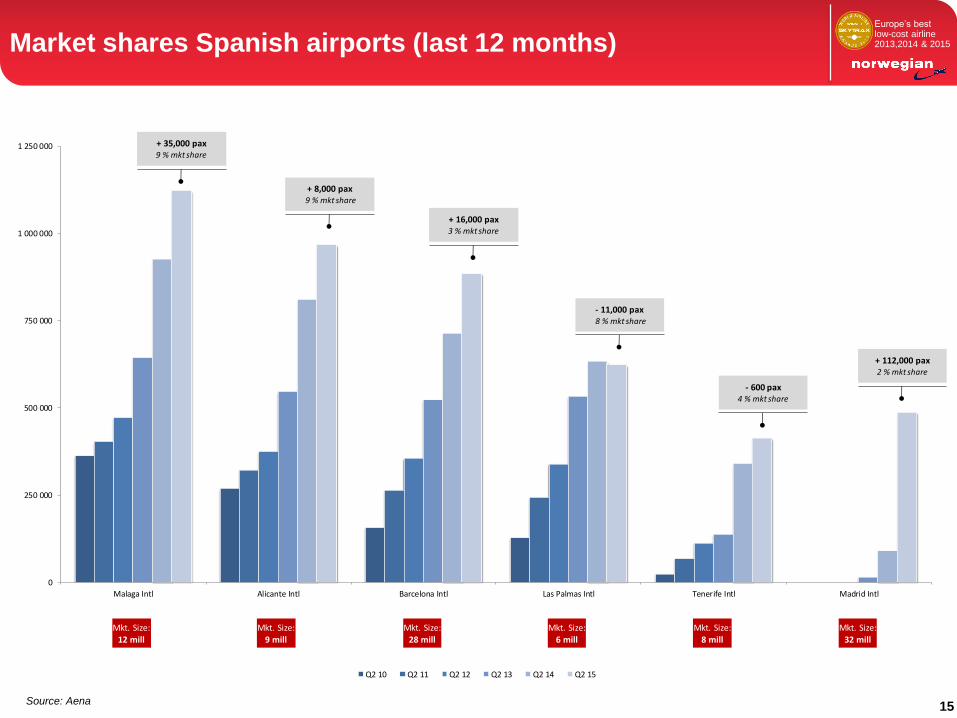
Europe’s best low-cost airline 2013,2014 & 2015 Market shares Spanish airports (last 12 months)
15
0
250 000
500 000
750 000
1 000 000
1 250 000
Malaga Intl Alicante Intl Barcelona Intl Las Palmas Intl Tenerife Intl Madrid Intl
Q2 10 Q2 11 Q2 12 Q2 13 Q2 14 Q2 15
+ 35,000 pax 9 % mkt share
+ 8,000 pax9 % mkt share
+ 16,000 pax3 % mkt share
- 11,000 pax8 % mkt share
- 600 pax4 % mkt share
+ 112,000 pax2 % mkt share
Mkt. Size:
12 mill
Mkt. Size:
9 mill
Mkt. Size:
32 mill
Mkt. Size:
8 mill
Mkt. Size:
6 mill
Mkt. Size:
28 mill
Source: Aena
Europe’s best low-cost airline 2013,2014 & 2015
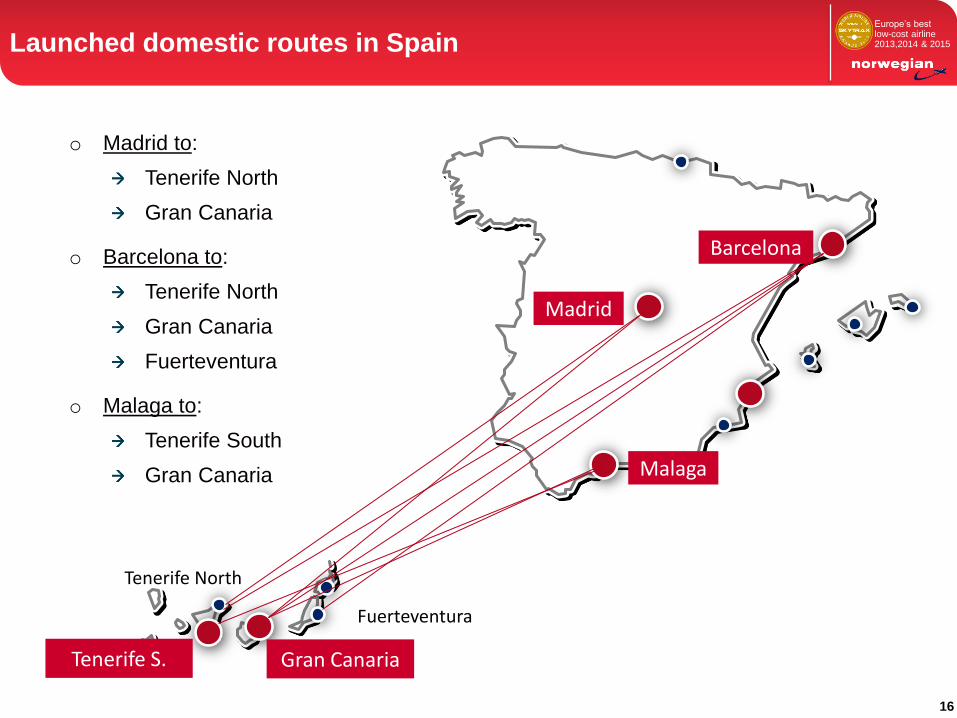
Madrid
Barcelona
Malaga
Fuerteventura
Gran Canaria Tenerife S.
Tenerife North
o Madrid to:
Tenerife North
Gran Canaria
o Barcelona to:
Tenerife North
Gran Canaria
Fuerteventura
o Malaga to:
Tenerife South
Gran Canaria
16
Launched domestic routes in Spain
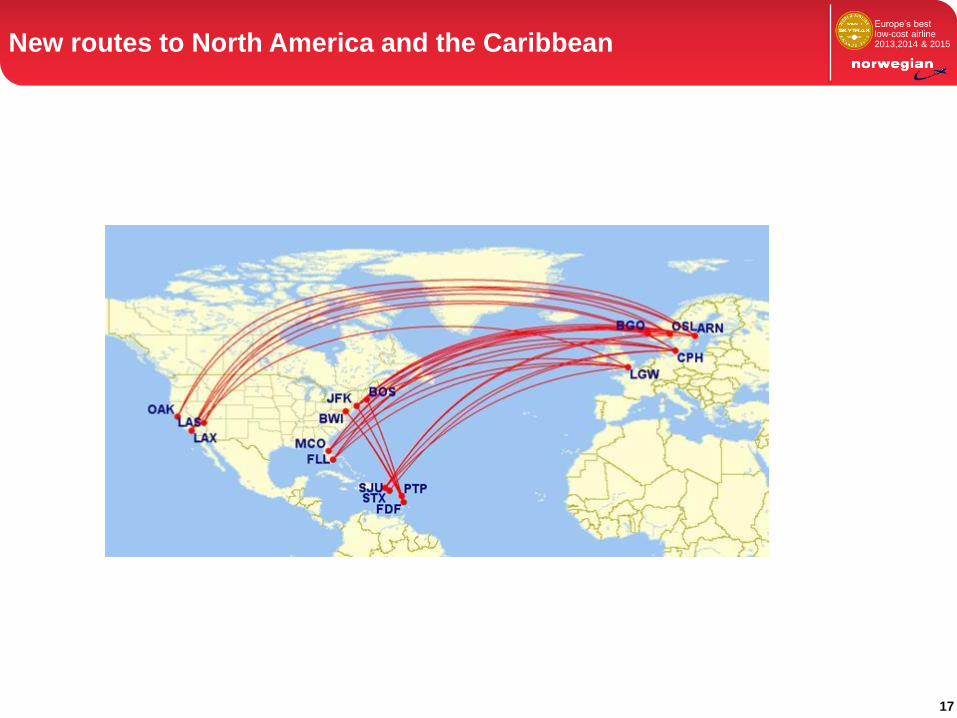
Europe’s best low-cost airline 2013,2014 & 2015 New routes to North America and the Caribbean
17
Europe’s best low-cost airline 2013,2014 & 2015
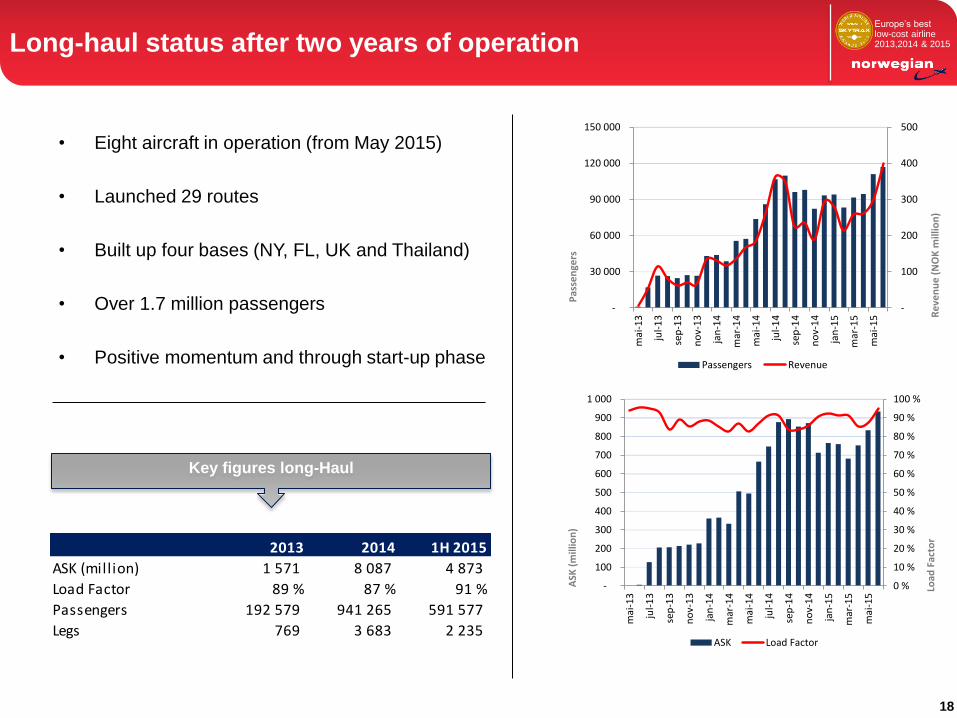
• Eight aircraft in operation (from May 2015)
• Launched 29 routes
• Built up four bases (NY, FL, UK and Thailand)
• Over 1.7 million passengers
• Positive momentum and through start-up phase
Long-haul status after two years of operation
Key figures long-Haul
-
100
200
300
400
500
-
30 000
60 000
90 000
120 000
150 000
mai
-13
jul-
13
sep
-13
no
v-1
3
jan
-14
mar
-14
mai
-14
jul-
14
sep
-14
no
v-1
4
jan
-15
mar
-15
mai
-15 R
eve
nu
e (
NO
K m
illio
n)
Pas
sen
gers
Passengers Revenue
0 %
10 %
20 %
30 %
40 %
50 %
60 %
70 %
80 %
90 %
100 %
-
100
200
300
400
500
600
700
800
900
1 000
mai
-13
jul-
13
sep
-13
no
v-1
3
jan
-14
mar
-14
mai
-14
jul-
14
sep
-14
no
v-1
4
jan
-15
mar
-15
mai
-15
Load
Fac
tor
ASK
(m
illio
n)
ASK Load Factor
18
2013 2014 1H 2015
ASK (million) 1 571 8 087 4 873
Load Factor 89 % 87 % 91 %
Passengers 192 579 941 265 591 577
Legs 769 3 683 2 235
Europe’s best low-cost airline 2013,2014 & 2015
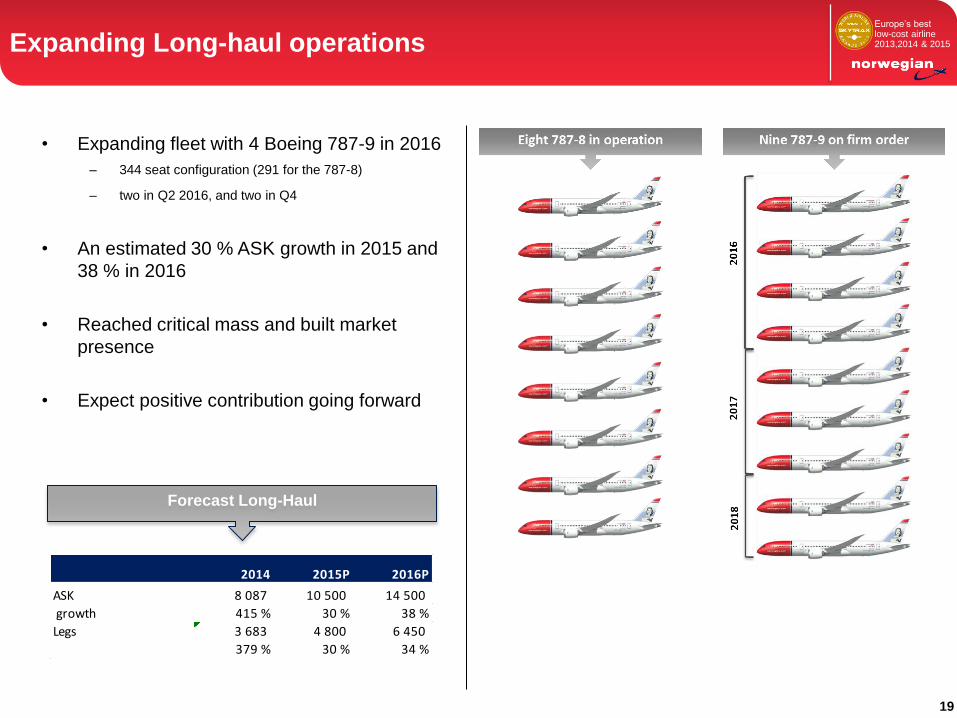
• Expanding fleet with 4 Boeing 787-9 in 2016
– 344 seat configuration (291 for the 787-8)
– two in Q2 2016, and two in Q4
• An estimated 30 % ASK growth in 2015 and
38 % in 2016
• Reached critical mass and built market
presence
• Expect positive contribution going forward
Expanding Long-haul operations
Forecast Long-Haul
2014 2015P 2016P
ASK 8 087 10 500 14 500
growth 415 % 30 % 38 %
Legs 3 683 4 800 6 450
379 % 30 % 34 %
19
Europe’s best low-cost airline 2013,2014 & 2015
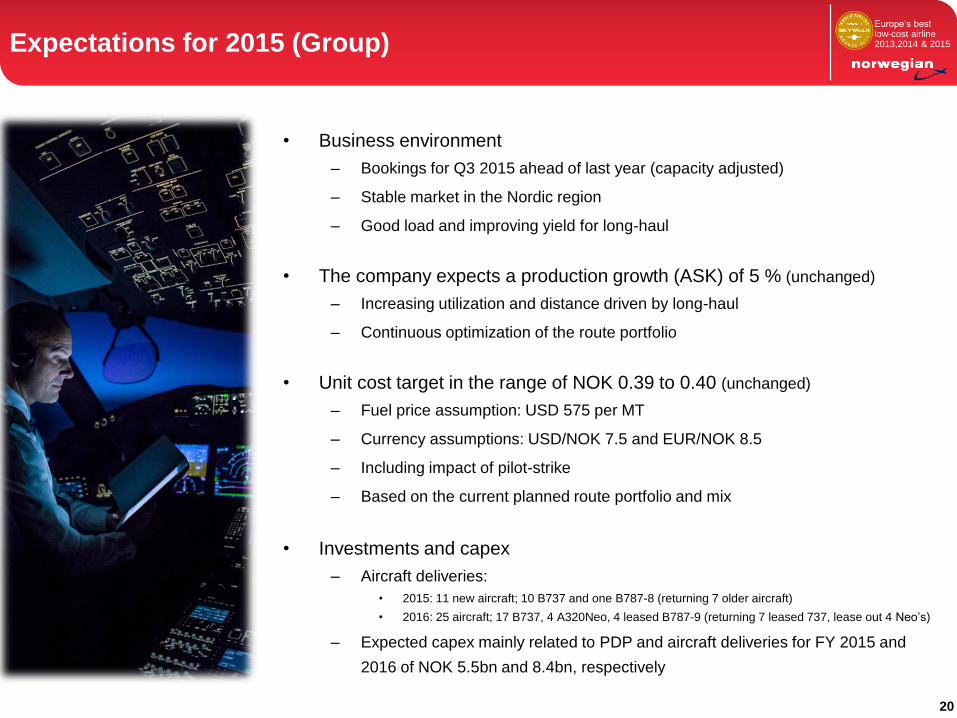
• Business environment
– Bookings for Q3 2015 ahead of last year (capacity adjusted)
– Stable market in the Nordic region
– Good load and improving yield for long-haul
• The company expects a production growth (ASK) of 5 % (unchanged)
– Increasing utilization and distance driven by long-haul
– Continuous optimization of the route portfolio
• Unit cost target in the range of NOK 0.39 to 0.40 (unchanged)
– Fuel price assumption: USD 575 per MT
– Currency assumptions: USD/NOK 7.5 and EUR/NOK 8.5
– Including impact of pilot-strike
– Based on the current planned route portfolio and mix
• Investments and capex
– Aircraft deliveries:
• 2015: 11 new aircraft; 10 B737 and one B787-8 (returning 7 older aircraft)
• 2016: 25 aircraft; 17 B737, 4 A320Neo, 4 leased B787-9 (returning 7 leased 737, lease out 4 Neo’s)
– Expected capex mainly related to PDP and aircraft deliveries for FY 2015 and
2016 of NOK 5.5bn and 8.4bn, respectively
Expectations for 2015 (Group)
20
Europe’s best low-cost airline 2013,2014 & 2015
• Awarded Europe’s Best Low-Cost Carrier
2015 and Global Best Low-Cost Long-
Haul Carrier 2015 by SkyTrax
• Bookings for Q3 2015 ahead of last year
• An estimated NOK 2 billion lower fuel
cost for 2015
• Expect positive contribution from Long-
Haul going forward
• Aiming for further unit cost reductions
• Successful placing of NOK 1 billion bond
Summary
21
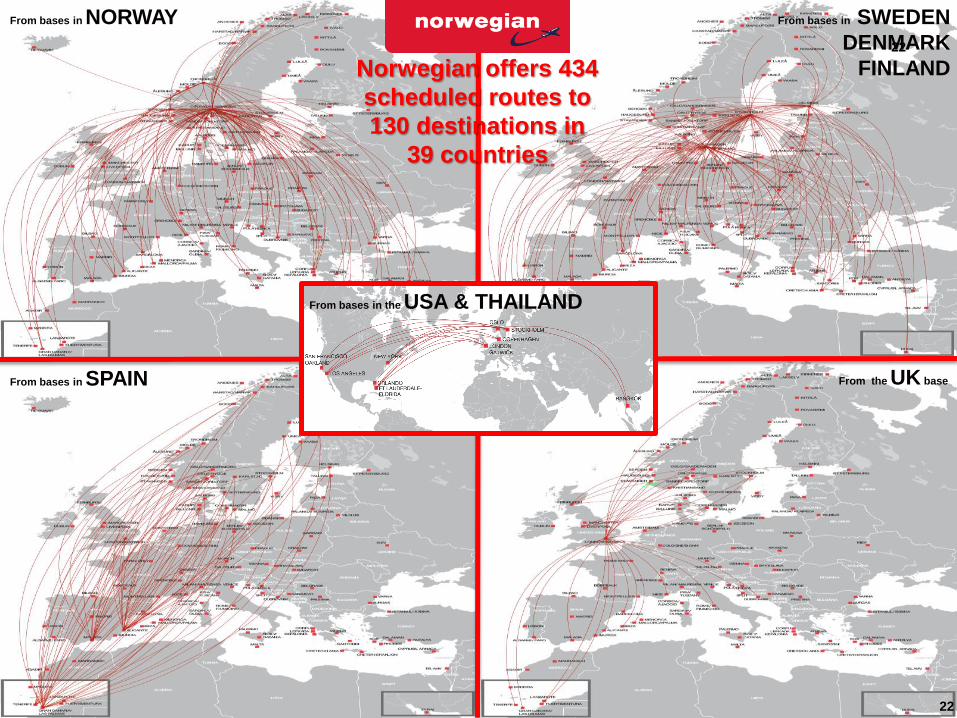
From bases in NORWAY From bases in SWEDEN
DENMARK
FINLAND
From the UK base From bases in SPAIN
From bases in the USA & THAILAND
Norwegian offers 434
scheduled routes to
130 destinations in
39 countries
22
22