Embed Size (px)
Citation preview

Norwegian Air Shuttle ASAQ1 2016 Presentation 21 April 2016

Highlights Q1 2016
Launched new routes to/from Paris and the USA (LAX, NYC and FLL) and a short haul base in Rome, Italy
Norwegian Reward reached 4 million members
Tentative approval of NAI by the US Department of Transportation (DoT)
Added five new 737-800 aircraft and one 787-9 Dreamliner to the fleet
Clean EBITDA improved by NOK 400 million
2
5.8 million passengers in Q1 2016 (+18 %)
3Pax (mill) 1,3 2,0 2,1 2,7 3,1 3,6 3,9 4,9 4,9 5,8
0
1
2
3
4
5
6
7
Q1 07 Q1 08 Q1 09 Q1 10 Q1 11 Q1 12 Q1 13 Q1 14 Q1 15 Q1 16
Pass
enge
rs (m
illio
n)
+ 18 %

Q1 load factor up to 85 % (+2 p.p.)
4
ASK 1 342 2 183 2 674 3 507 4 498 5 266 6 378 9 421 10 056 11 803
Load Factor 74,8 % 77,2 % 74,8 % 75,1 % 74,3 % 77,2 % 76,1 % 77,3 % 83,0 % 85,1 %
74,8 %77,2 %
74,8 % 75,1 % 74,3 %77,2 % 76,1 % 77,3 %
83,0 %85,1 %
0%
10%
20%
30%
40%
50%
60%
70%
80%
90%
100%
0
1 000
2 000
3 000
4 000
5 000
6 000
7 000
8 000
9 000
10 000
11 000
12 000
13 000
14 000
15 000
16 000
17 000
18 000
Q1 07 Q1 08 Q1 09 Q1 10 Q1 11 Q1 12 Q1 13 Q1 14 Q1 15 Q1 16
Load
Fact
or
Avai
labl
e Se
at K
M (A
SK)
ASK Load Factor Load+2 p.p.
17 % growth in capacity (ASK)
21 % growth in traffic (RPK)
Average flying distance increased by 4 %
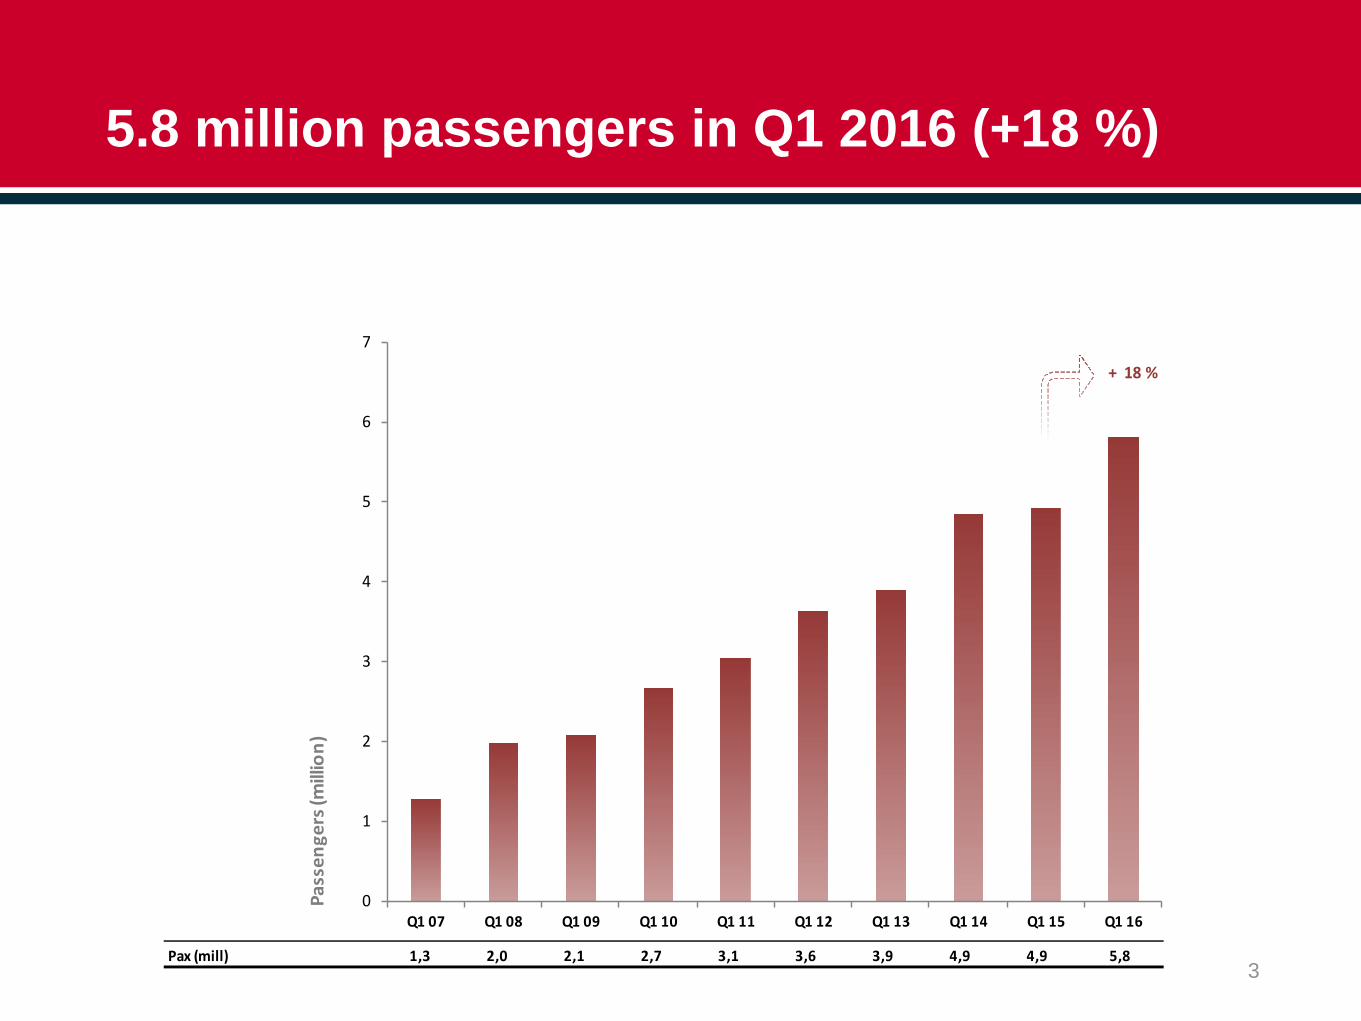
Holding or growing market shares in all key airports (last 12 months)
5
0
2 000 000
4 000 000
6 000 000
8 000 000
10 000 000
Oslo Arlanda Copenhagen Helsinki Gatwick Spanish bases
Q1 11 Q1 12 Q1 13 Q1 14 Q1 15 Q1 16
+ 1,034,000 pax 41 % mkt share
+ 715,000 pax22 % mkt share
+ 398,000 pax17 % mkt share
+ 171,000 pax13 % mkt share
+ 566,000 pax10 % mkt share
+ 680,000 pax4 % mkt share
Mkt. Size:25 mill
Mkt. Size:21 mill
Mkt. Size:135 mill
Mkt. Size:40 mill
Mkt. Size:17 mill
Mkt. Size:27 mill
Sources: Avinor, Swedavia, Copenhagen Airports, Finavia, Gatwick Airport, Aena
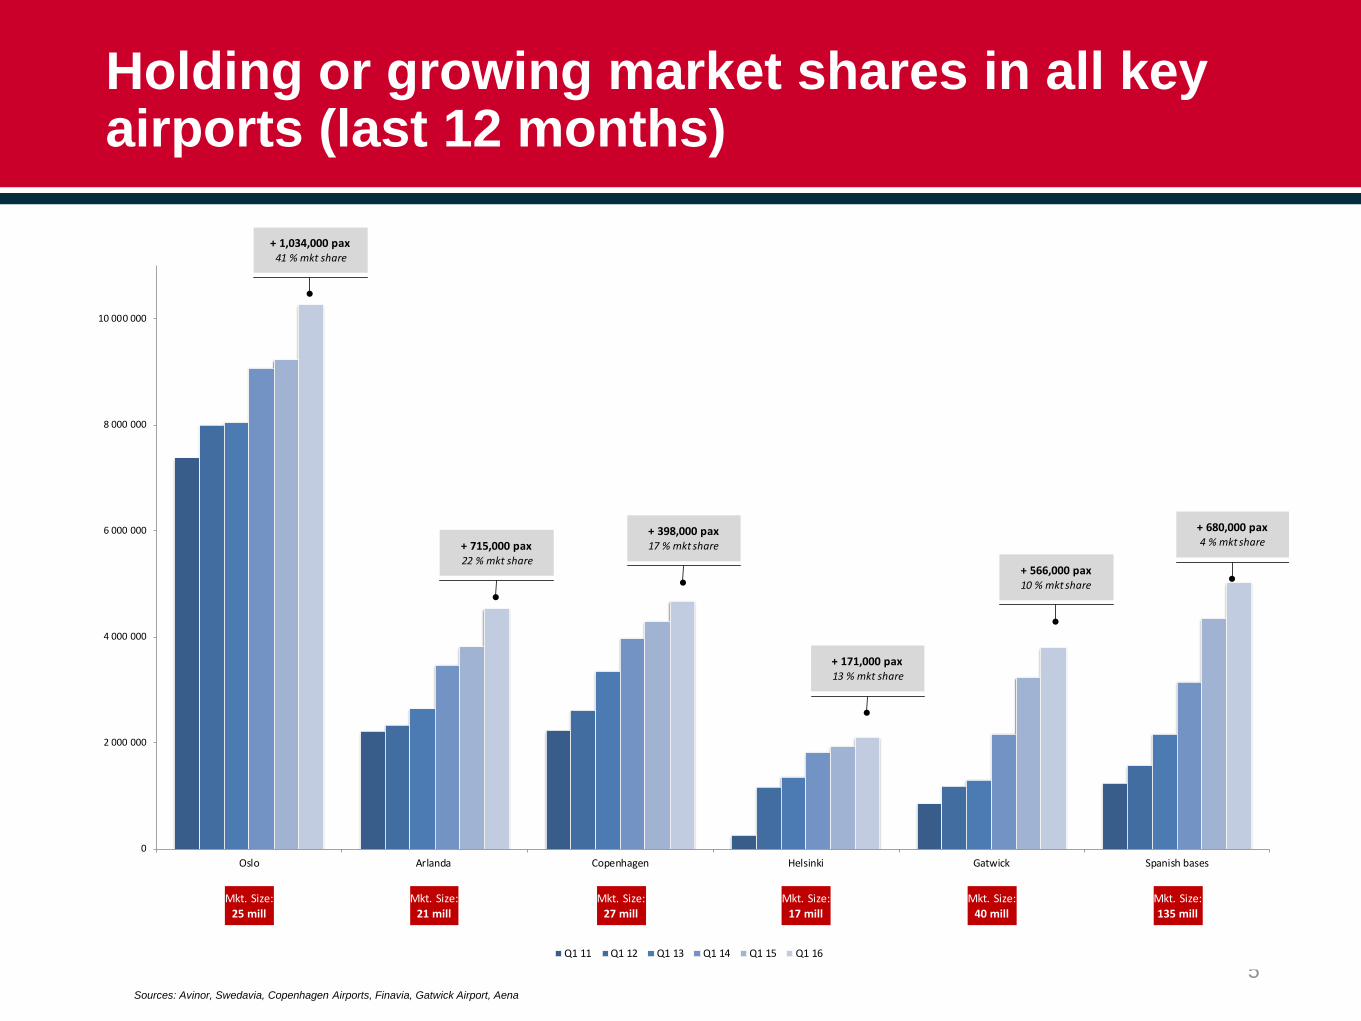
23 % revenue growth in Q1
6
Revenues 2 904 3 551 4 034 4 961Domestic revenue 1 043 1 032 981 1 130% y.o.y. chg 20 % -1 % -5 % 15 %International revenue 1 861 2 519 3 053 3 831% y.o.y. chg 25 % 35 % 21 % 25 %
0
1 000
2 000
3 000
4 000
5 000
6 000
Q1 13 Q1 14 Q1 15 Q1 16
NO
K m
illio
n
Domestic revenue
International revenue
Total Revenues
+ 23 %
25 % growth in international revenue, + 15 % for domestic Scandinavia
Unit revenue up by 5 % driven by yield (+2 %) and load (+2 p.p) offset by increased stage length

19 % growth in ancillary revenue in Q1
7
16 % share of Group revenue
1 % growth per passenger
Other Ancillary Other Ancillary
BaggageBaggage
SeatingSeating
Pre-sold packages(bundle)
Pre-sold packages (bundle)
Flexibility/ modifications
Flexibility/ modifications
Q1 15 Q1 16
NOK 138
Optional extras
NOK 136

Growing share of revenue in USD, GBP and Euro Norway now reduced to 35 % of group passengersOver 40% of passengers booking from outside Scandinavia
Strongest growth in USA and Spain
8
0% 10% 20% 30% 40% 50% 60%
Finland
Denmark
Italy
Norway
UK
Sweden
France
Hungary
Spain
USA
Norway
SwedenSpain
Denmark
UK
Finland
USAGermany
Poland
FranceItaly
Hungary Other
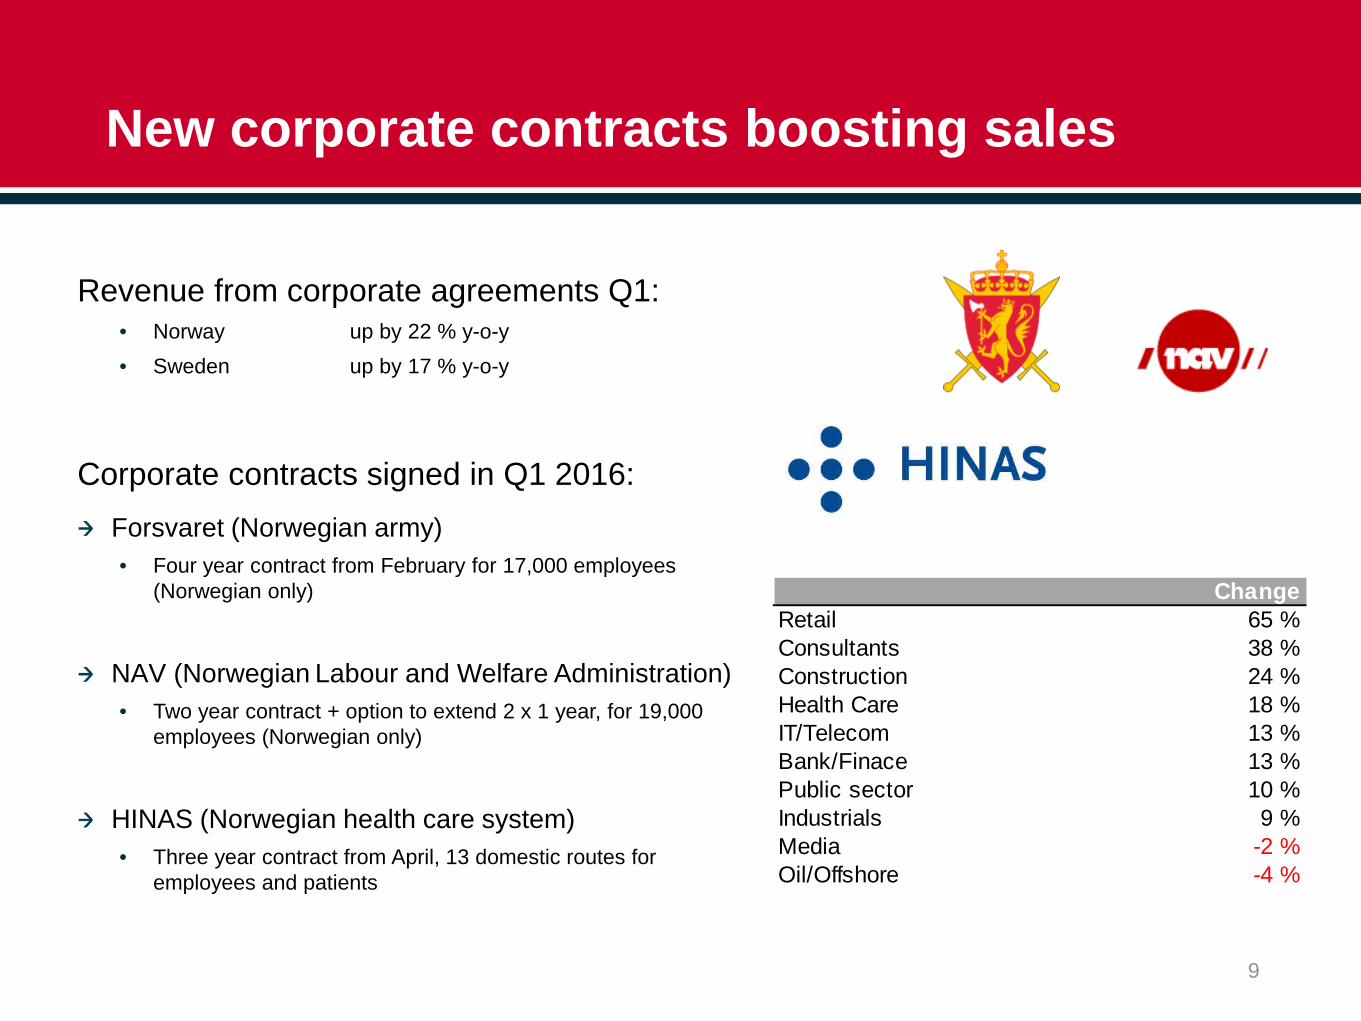
New corporate contracts boosting sales
Revenue from corporate agreements Q1:• Norway up by 22 % y-o-y• Sweden up by 17 % y-o-y
Corporate contracts signed in Q1 2016:Forsvaret (Norwegian army) • Four year contract from February for 17,000 employees
(Norwegian only)
NAV (Norwegian Labour and Welfare Administration) • Two year contract + option to extend 2 x 1 year, for 19,000
employees (Norwegian only)
HINAS (Norwegian health care system)• Three year contract from April, 13 domestic routes for
employees and patients
9
ChangeRetail 65 %Consultants 38 %Construction 24 %Health Care 18 %IT/Telecom 13 %Bank/Finace 13 %Public sector 10 %Industrials 9 %Media -2 %Oil/Offshore -4 %

Reported earnings: lower fuel offset by currency
10
Q1 13 Q1 14 Q1 15 Q1 16 Q1 13 Q1 14 Q1 15 Q1 16EBITDAR margin 15 % -6 % 2 % 1 % EBT margin -6 % -23 % -19 % -20 %
438
-215
69 63
-300
-200
-100
0
100
200
300
400
500
NO
K m
illio
n
-160
-813 -776
-992
-1 300
-1 050
-800
-550
-300
-50
200
NO
K m
illio
n
EBT development Q1EBITDAR development Q1
(NOK million) Q1 15 Q1 16 Change
Revenue 4 034 4 961
EBITDAR 69 63 -6
EBITDA -502 -606 -104
Pre-tax profit (EBT) -776 -992 -216
Net profit -538 -800
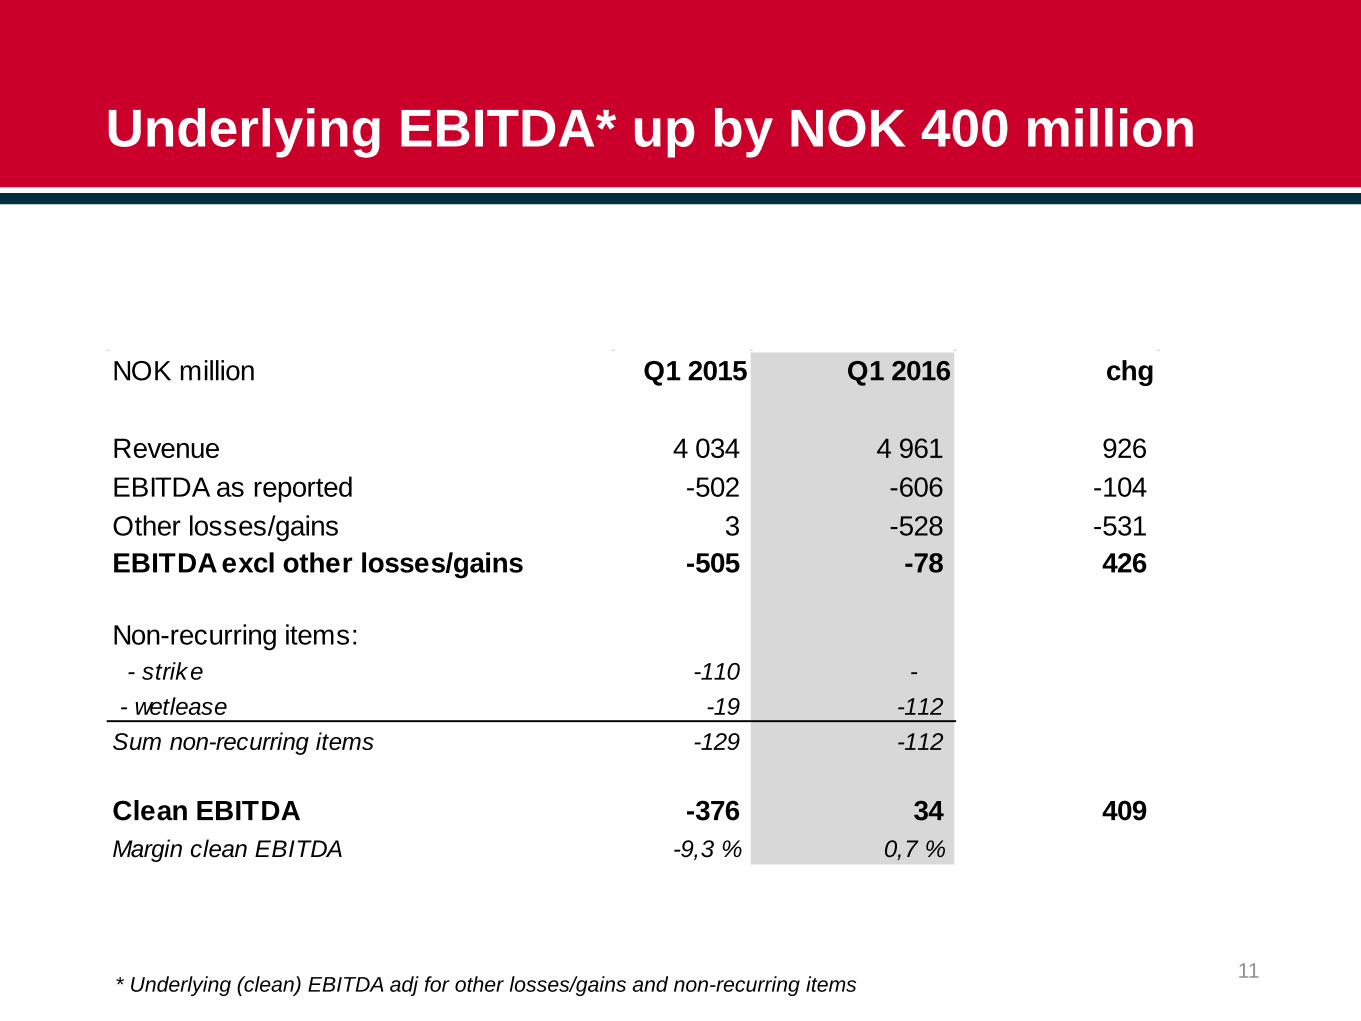
Underlying EBITDA* up by NOK 400 million
11* Underlying (clean) EBITDA adj for other losses/gains and non-recurring items
NOK million Q1 2015 Q1 2016 chg
Revenue 4 034 4 961 926 EBITDA as reported -502 -606 -104 Other losses/gains 3 -528 -531 EBITDA excl other losses/gains -505 -78 426
Non-recurring items: - strike -110 - - wetlease -19 -112 Sum non-recurring items -129 -112
Clean EBITDA -376 34 409 Margin clean EBITDA -9,3 % 0,7 %

Unit cost cut by 5 %
CASK ex fuel +1 % to NOK 0.35 on currency
12
0,44
0,46 0,450,40
0,37 0,360,33 0,32
0,35 0,35
0,11
0,16
0.15
0,11 0,12 0,15
0,13 0,14
0,10 0,07
0,00
0,05
0,10
0,15
0,20
0,25
0,30
0,35
0,40
0,45
0,50
0,55
Q1 07 Q1 08 Q1 09 Q1 10 Q1 11 Q1 12 Q1 13 Q1 14 Q1 15 Q1 16
Ope
ratin
g co
st E
BITD
A le
vel p
er A
SK (C
ASK)
CASK excl fuel
Fuel share of CASK
Other losses / (gains) is not included in the CASK concept as it primarily contains hedge gains/losses offset under financial items* as well as other non-operational income and/or cost items such as gains on the sale of spare part inventory and unrealized foreign currency effects on receivables/payables and (hedges of operational expenses).*Norwegian hedges USD/NOK to counter foreign currency risk exposure on USD denominated borrowings translated to the prevailing currency rate at each balance sheet date. Hedge gains and losses are according to IFRS recognized under operating expenses (other losses/ (gains) while foreign currency gains and losses from translation of USD denominated borrowings are recognized under financial items.

Fuel share of opex reduced to 15 % (23% in Q115)
7 % negative impact of currency
Fuel hedging: • 50 % of 2016• 27 % of 2017
13
0,00
0,02
0,04
0,06
0,08
0,10
0,12
0,14
0,16
Q1 11 Q1 12 Q1 13 Q1 14 Q1 15 Q1 16
12 mths rolling 12 mths rolling 12 mths rolling 12 mths rolling 12 mths rolling 12 mths rolling
Personnel
Other
Technical
Airport/ATC
Leasing
Depreciation
Sales & Distribution
Handling
Fuel
Fuel15 %
Personnel16 %
Airport & ATC12 %
Handling10 %
Leasing12 %
Technical7 %
Gen. and adm. exp.
5 %
Other Flight ops. exp.
4 %
Depr.4 %
Sales/ distrib.
2 %

NOK 1 bn higher cash-flow from operations
14
Invested NOK 1.7 bn in new B737-800 aircraft
NOK 3.2 billion in cash at the end of Q1
Q1 Q1NOK million 2015 2016 Change
Profit before tax -777 -992 -215Depreciation 220 288 68Air traffic settlement liabilities 2 497 2 954 457Change working capital -945 -243 702Net cash flows from operating activities 996 2 007 1 012Net cash flows from investing activities -1 597 -1 666 -69Net cash flows from financial activities 196 375 179Foreign exchange effect on cash 10 20 10Net change in cash and cash equivalents -396 736 1 132Cash and cash equivalents, end of period 1 615 3 190 1 574

Net debt reduced by NOK 1 bn in the quarter
15
Added five new 737-800 on balance + PDP’s
NOK 16 bn net debt (reduced from NOK 17bn at the end of 2015)
Equity ratio of 6 % (11 % incl. market value of Bank Norwegian)
1 615Cash3 190
2 998
Receivables3 180
5 134 Other assets
2 139
4 103 Aircraft PDP 5 939
12 512
Aircraft18 536
0
3 000
6 000
9 000
12 000
15 000
18 000
21 000
24 000
27 000
30 000
33 000
Q1 15 Q1 16
NO
K m
illio
n
Equity1 986 1 876
Pre-sold tickets6 969 5 462
Otherliabilities
4 9314 311
PDP and bonds6 104
4 684
Aircraft Financing
12 994
10 028
Q1 16 Q1 15

Aircraft financing on track
Expected capex (all aircraft incl. PDP)USD 1.1 bn for 2016 (unchanged)USD 2 bn for 2017USD 2 bn for 2018
PDP financingPDP financing with backstop lease B 737 800 (in 1H 2016)PDP Financing for 50 A320 Neo’s in placeNegotiating PDP financing for Boeing deliveries
Long-term financingCommercial financing of 6 B 737 800 Ex-Im and ECAEETC
16

Top modern fleet with an average age of 3.6 years
17
8 58 11 1320
22 2323 22
115 5
2
2 55 5
55 5
5
7 16 21
2325 29
2927 23 19
28
1013
13
1313
13
2
7 15 23
30 41 5168
85
6
4
12
2
55
9
14
1
23
3
7
8 11 1322
3240
46
5762
68
85
9599
120
156
0
20
40
60
80
100
120
140
160
2003year-end
2004year-end
2005year-end
2006year-end
2007year-end
2008year-end
2009year-end
2010year-end
2011year-end
2012year-end
2013year-end
2014year-end
2015year-end
2016year-end
2017year-end
B788/B789 Owned
B788/B789 Leased
A320neo owned
B737 MAX 8 owned
B738 owned
B738 S&LB
B738 leased
B733 owned
B733 leased
M80 leased
Re-deliveries 737-800-744 seats
2016:Deliveries 737-800
+3,162 seatsDeliveries 787-9
+1376 seats
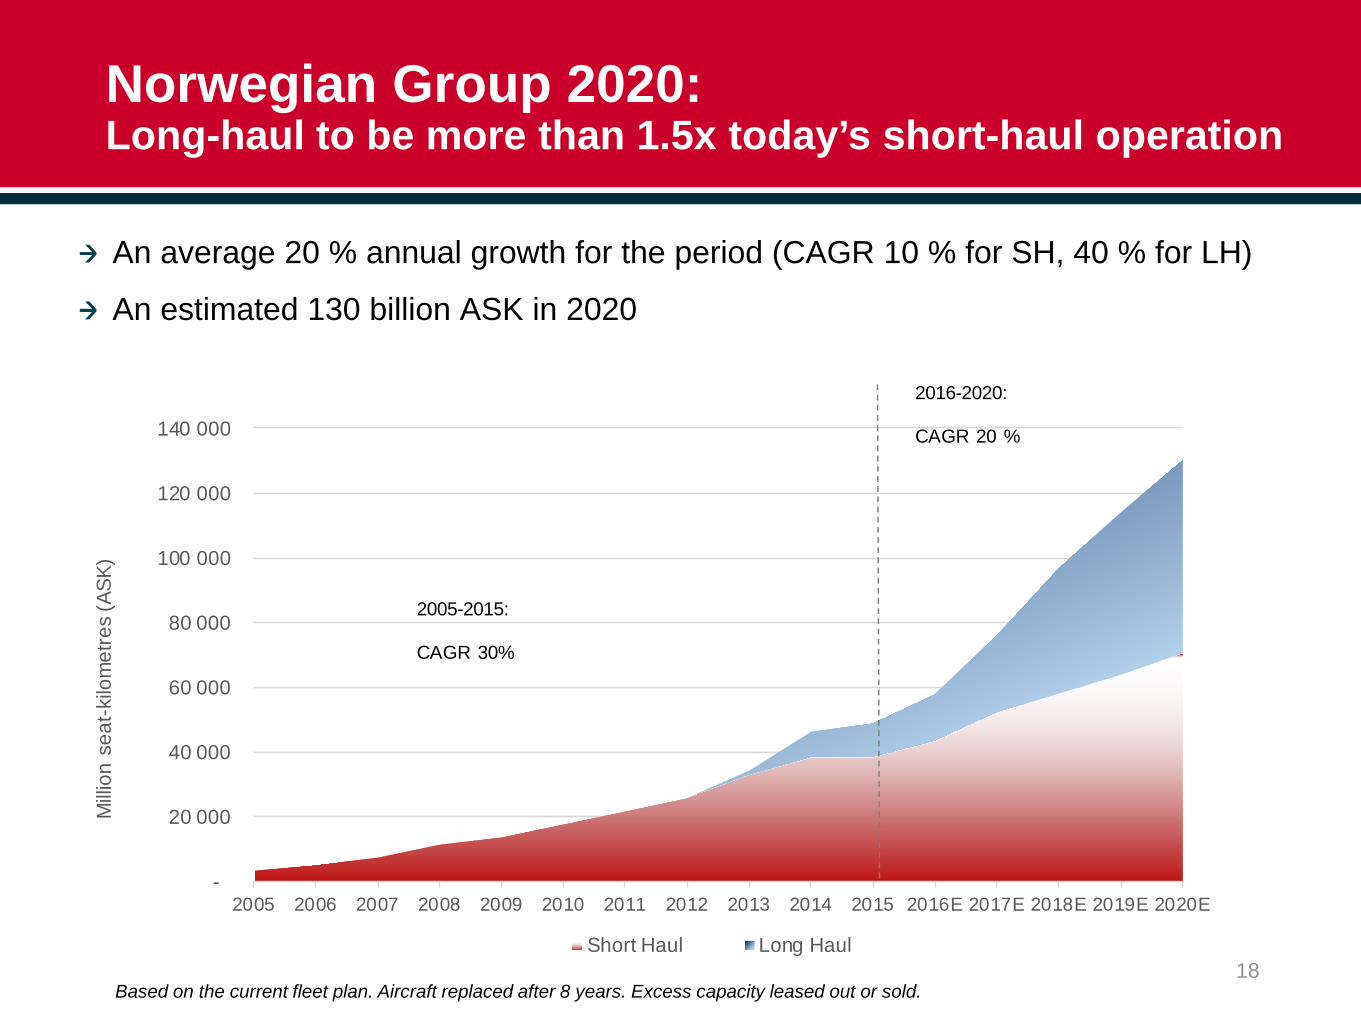
Norwegian Group 2020: Long-haul to be more than 1.5x today’s short-haul operation
An average 20 % annual growth for the period (CAGR 10 % for SH, 40 % for LH)
An estimated 130 billion ASK in 2020
18
-
20 000
40 000
60 000
80 000
100 000
120 000
140 000
2005 2006 2007 2008 2009 2010 2011 2012 2013 2014 2015 2016E 2017E 2018E 2019E 2020E
Milli
on s
eat-k
ilom
etre
s (A
SK)
Short Haul Long Haul
2016-2020:
CAGR 20 %
2005-2015:
CAGR 30%
Based on the current fleet plan. Aircraft replaced after 8 years. Excess capacity leased out or sold.
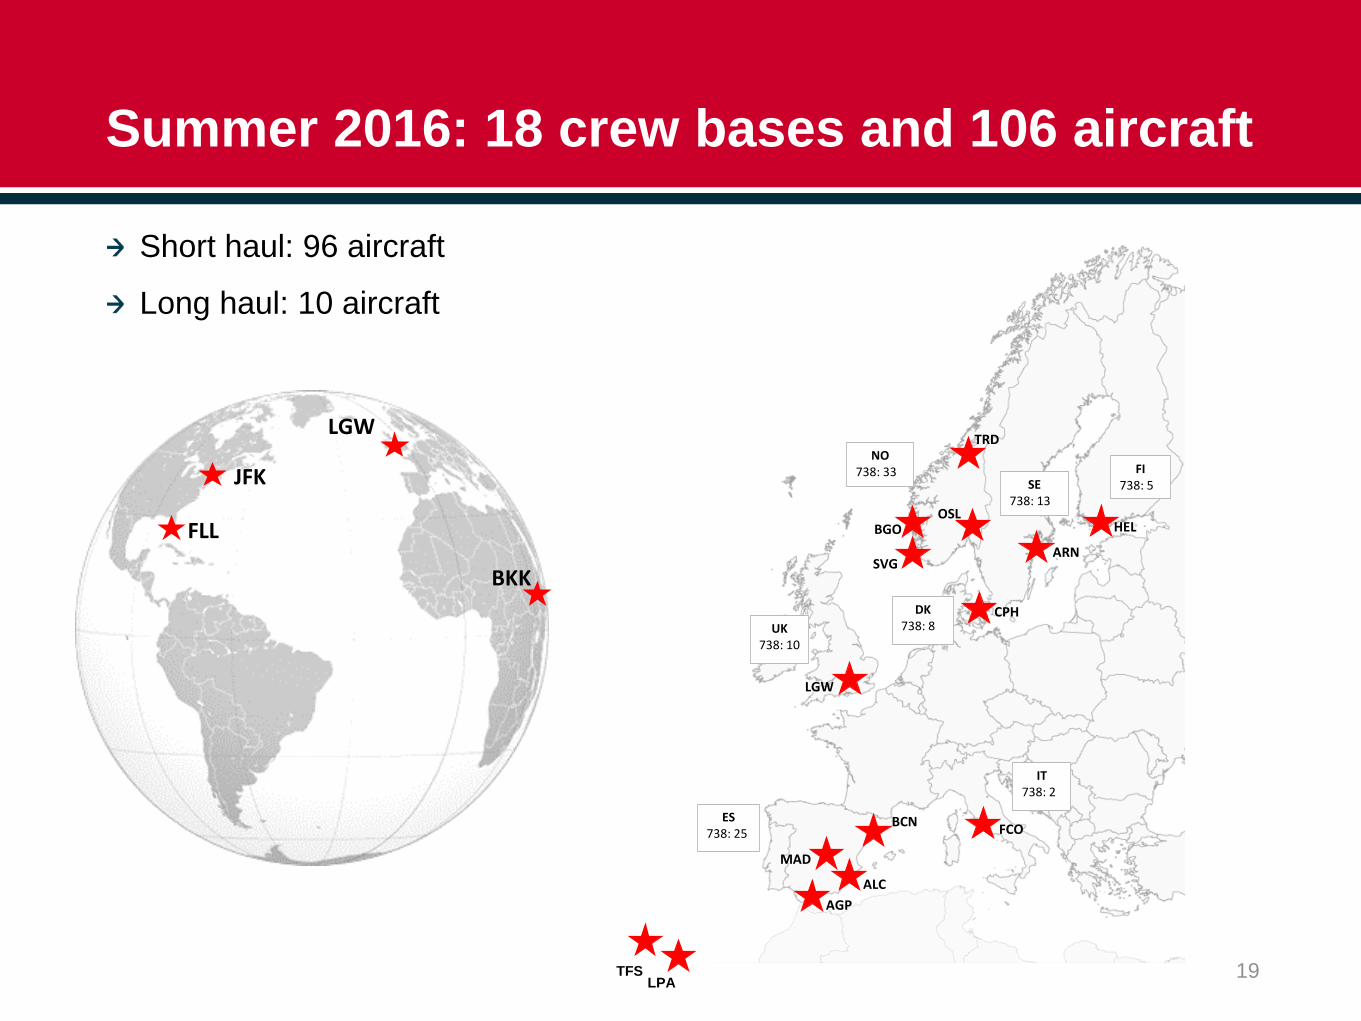
Summer 2016: 18 crew bases and 106 aircraft
19
BGO
BCN
OSLHEL
ARN
LGW
ALCAGP
MAD
CPH
TRD
SVG
UK738: 10
ES738: 25
NO738: 33
SE738: 13
FI738: 5
DK738: 8
FCO
IT738: 2
LGW
BKK
JFK
FLL
Short haul: 96 aircraft
Long haul: 10 aircraft
LPATFS
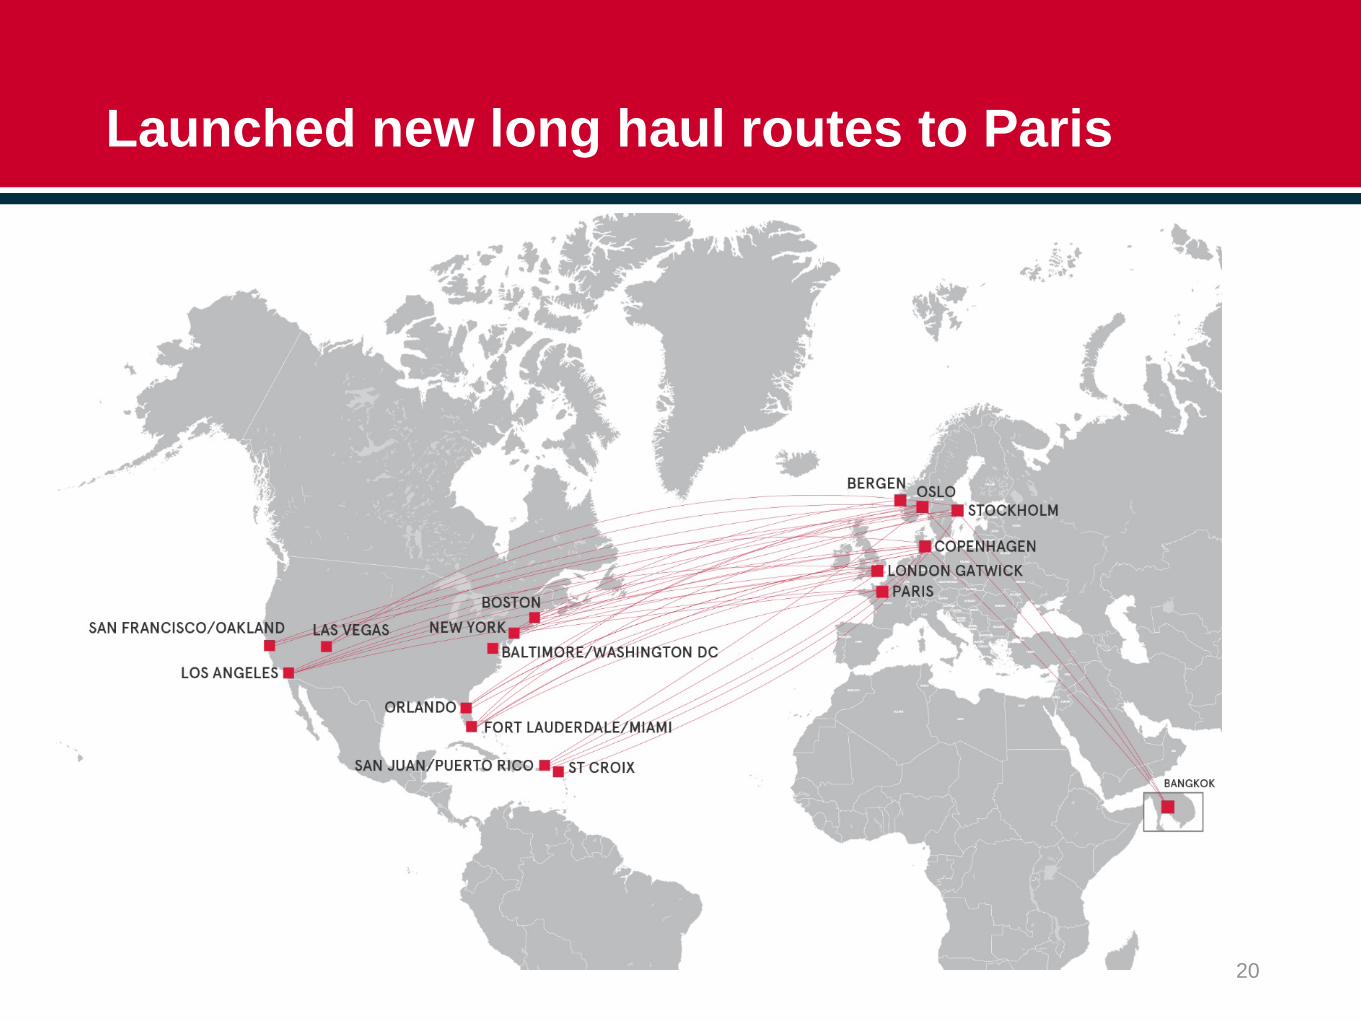
Launched new long haul routes to Paris
20
Outlook for 2016
Markets and business Soft macro and passenger tax to be introduced in Norway, strong competition in DenmarkStable in other key marketsPositive momentum for long-haulGroup bookings ahead of last year, capacity adjusted
An estimated production growth (ASK) of 18 % (unchanged)Short-haul + 12 %, Long-haul + 40 %Increasing distance driven by mix (long-haul)
Unit cost in the area of NOK 0.37 (unchanged)Assumptions: Fuel price of USD 350 per metric ton, USD/NOK 8.25, EUR/NOK 9.00 Based on the current route portfolio and planned production
25 aircraft scheduled for delivery in 2016 Seventeen direct buy B737-800 (returning four leased 737-800)Four leased B787-9 DreamlinersFour direct buy A320Neo (to be leased out)
21

Summary
Won several corporate agreements as businesses want to reduce travel expenses
NAI has received tentative approval from DoT
Bookings ahead of last year
Financing on-track
Unchanged guidance for 2016 on production and unit cost
Bank Norwegian to be listed on OSE
22
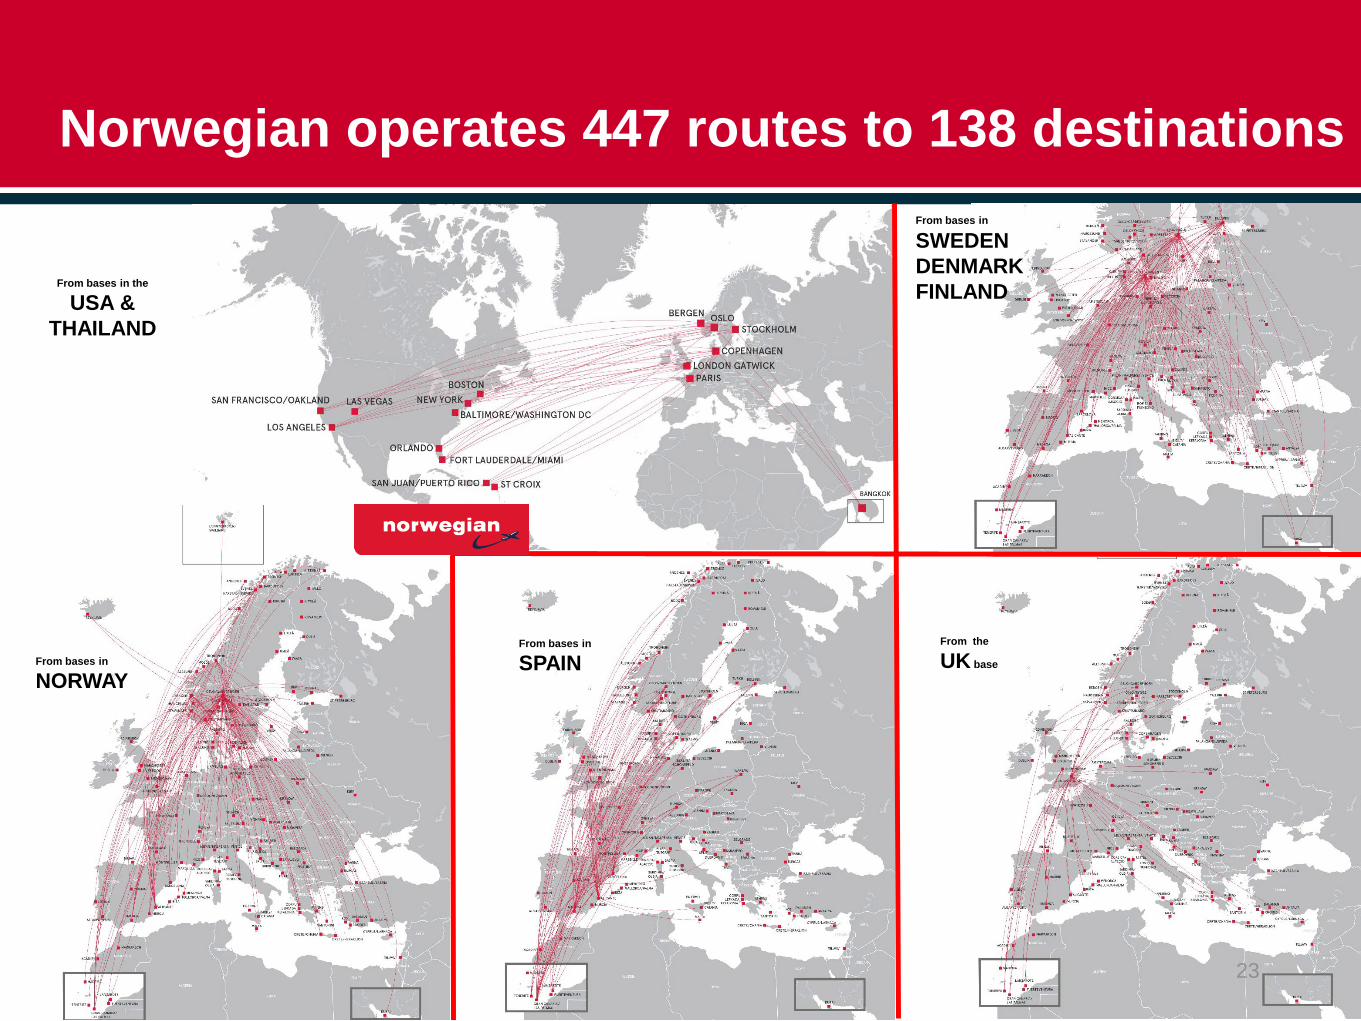
Norwegian operates 447 routes to 138 destinations
23
From bases in
SWEDEN DENMARK FINLAND
From the
UK base
From bases in
SPAIN
From bases in the
USA & THAILAND
From bases in
NORWAY
![$ EDUCATIONAL FACILITIES REVENUE [AND REVENUE REFUNDING… · EDUCATIONAL FACILITIES REVENUE [AND REVENUE REFUNDING] ... Educational Facilities Revenue [and Revenue ... Aeronautical](https://img.pdfslide.net/doc/110x75/5b16e1207f8b9a686d8e7aa7/-educational-facilities-revenue-and-revenue-refunding-educational-facilities.jpg)