Embed Size (px)
Citation preview
maritimecleantech.no
Norwegian future value chains for liquid hydrogen
1
Table of content 1. Summary ........................................................................................................................................................ 4
2. Introduction ................................................................................................................................................... 5
3. Hydrogen today ............................................................................................................................................. 6
3.1 Future demand .............................................................................................................................................. 7
3.2 Liquid hydrogen ........................................................................................................................................... 9
3.3 Properties of hydrogen and other fuels ....................................................................................................... 10
3.4 Green hydrogen .......................................................................................................................................... 12
3.5 Current and future price of hydrogen ......................................................................................................... 13
4. Value chain liquid hydrogen (LH2) ............................................................................................................. 16
4.1 Production processes .................................................................................................................................. 17
4.2 Liquefaction ................................................................................................................................................ 21
4.3 Storage ........................................................................................................................................................ 26
4.4 Distribution ................................................................................................................................................. 27
4.5 Bunkering ................................................................................................................................................... 29
4.6 End users .................................................................................................................................................... 32
4.7 Energy efficiency throughout the value chain ............................................................................................ 35
5. Regulations, standards and codes for liquid hydrogen ................................................................................. 38
6. Marine bunkering today ............................................................................................................................... 42
6.1 Alternative zero-emission fuels to LH2 ...................................................................................................... 46
6.2 Price comparison between fuels ................................................................................................................. 49
6.3 Price development for liquid hydrogen ...................................................................................................... 50
7. Future demand for liquid hydrogen ............................................................................................................. 53
7.1 Car ferries ................................................................................................................................................... 54
7.2 High speed crafts ........................................................................................................................................ 54
7.3 Platform Supply Vessels ............................................................................................................................. 56
7.4 Summary – Demand of LH2 ...................................................................................................................... 58
7.5 Energy need – natural gas and electricity ................................................................................................... 64
8. Case studies ................................................................................................................................................. 66
8.1 Car ferry Halhjem-Sandvikvåg ................................................................................................................... 66
8.2 High-speed craft Bergen-Nordfjord ............................................................................................................ 69
8.3 PSV from Mongstad to Statfjord ................................................................................................................ 72
9. Summary: Barriers for a liquid hydrogen value chain ................................................................................. 75
10. Literature and references .......................................................................................................................... 77
11. Appendix .................................................................................................................................................. 87
2
NCE MARITIME CLEANTECHNorwegian future value chains for liquid hydrogen
2
Acronyms and abbreviations Abbreviation Meaning ADR European Agreement concerning the International
Carriage of Dangerous Goods by Road ATR Auto Thermal Reforming CCS Carbon Capture Storage C3H8 Propane CH3OH Methanol CH4 Methane CO2 Carbon Dioxide CO2eq Carbon Dioxide Equivalent FCH-JU Fuel Cell and Hydrogen 2 Joint Undertaking GHG Green House Gas Emissions GoO Guarantee of Origin HSC High-Speed Craft HVO Hydro Treated Vegetable Oils IEA International Energy Agency IEAGHG International Energy Agency Greenhouse Gas IRaS Integrated Refrigeration and Storage IRENA The International Renewable Energy Agency ISO International Organization for Standardization K Kelvin LH2 Liquefied Hydrogen LNG Liquid Natural Gas LPG Liquefied Petroleum Gas MGO Marine Gas Oil NASA The National Aeronautics and Space Administration NCE Norwegian Centres of Expertise NH3 Ammonia Nm3 Normal cubic meter
PCU Personal Car Unit PEM Proton Exchange Membrane PSV Platform Supply Vessel SMR Steam Methane Reforming SOFC Solide Oxide Fuel Cells USD United States Dollar VAT Value Added Tax
3
Units 1 EJ = 278 TWh
1 MJ = 3,6 kWh
1 MPa = 10 bar
1 Ton = 1000 kg
1 TWh = 1000 GWh
3
Units 1 EJ = 278 TWh
1 MJ = 3,6 kWh
1 MPa = 10 bar
1 Ton = 1000 kg
1 TWh = 1000 GWh
3
Units 1 EJ = 278 TWh
1 MJ = 3,6 kWh
1 MPa = 10 bar
1 Ton = 1000 kg
1 TWh = 1000 GWh
3
NCE MARITIME CLEANTECHNorwegian future value chains for liquid hydrogen
4
1. Summary The purpose of the report has been to investigate barriers for a future Norwegian value chain on liquid hydrogen for maritime use, with a special focus on the volumes of LH2 for car ferries, high-speed crafts and platform supply vessels in the region from Rogaland to Trøndelag. The most obvious barrier is the lack of access to liquid hydrogen produced in Norway. In addition to transportation costs, the current liquefaction capacity in Europe of 20 tons per day is far from the volumes needed. If just 25 percent of the energy consumption from the three vessel types is converted to hydrogen it would require 72 tons per day, and several crossings would require a daily transportation of volumes up to four tons, making the value chain prone for logistical problems. A complete transformation from fossil fuels to LH2 for car ferries, high-speed crafts and PSVs would have a daily demand of about 275 tons of hydrogen. This is a volume that Norway has the energy resources to produce both through electrolysis using renewable energy and gas reformation using natural gas. Hydrogen production from natural gas needs CCS to achieve a CO2e/kg LH2-level low enough to be labelled as blue hydrogen. In terms of storage and distribution by truck several suppliers have extensive experience with cryogenic tanks, making this the most mature component of the value chain. Today trailers can transport about 4000 kg of liquid hydrogen, while the largest on-site storage tanks developed for space industry has a volume of 3800 m3. However, for an effective distribution of larger volumes, bunkering vessels and/or tankers must be developed for operation along the coastline. For bunkering two different solutions, pressure-fill utilizing different pressure between the offloading and receiving tank, or assisted by a LH2-pump, can be used. Studies show that a flow rate of 1000 kg per 20-40 minutes is achievable by pressure-fill, while submerged LH2 pumps can increase the flowrate up to 600 m3/hour. However, there are no commercially available bunkering station available for maritime use. Throughout the value chain, further work on regulations, standards and codes developed specifically for the maritime use of liquid hydrogen is needed. From a price perspective LH2 today is not competitive with other fuels. Liquid hydrogen transported from Europe to Southern Norway has a retail price of about 15 Euro/kg, making the cost of delivered kWh to the propeller more than eight times higher than for marine gas oil. But through technology development and establishment of large production and liquefaction facilities in Norway a cost in the range of 3,5-7,5 Euro/kg, making the cost per kWh competitive with bio-diesel is realistic.
4
NCE MARITIME CLEANTECHNorwegian future value chains for liquid hydrogen
5
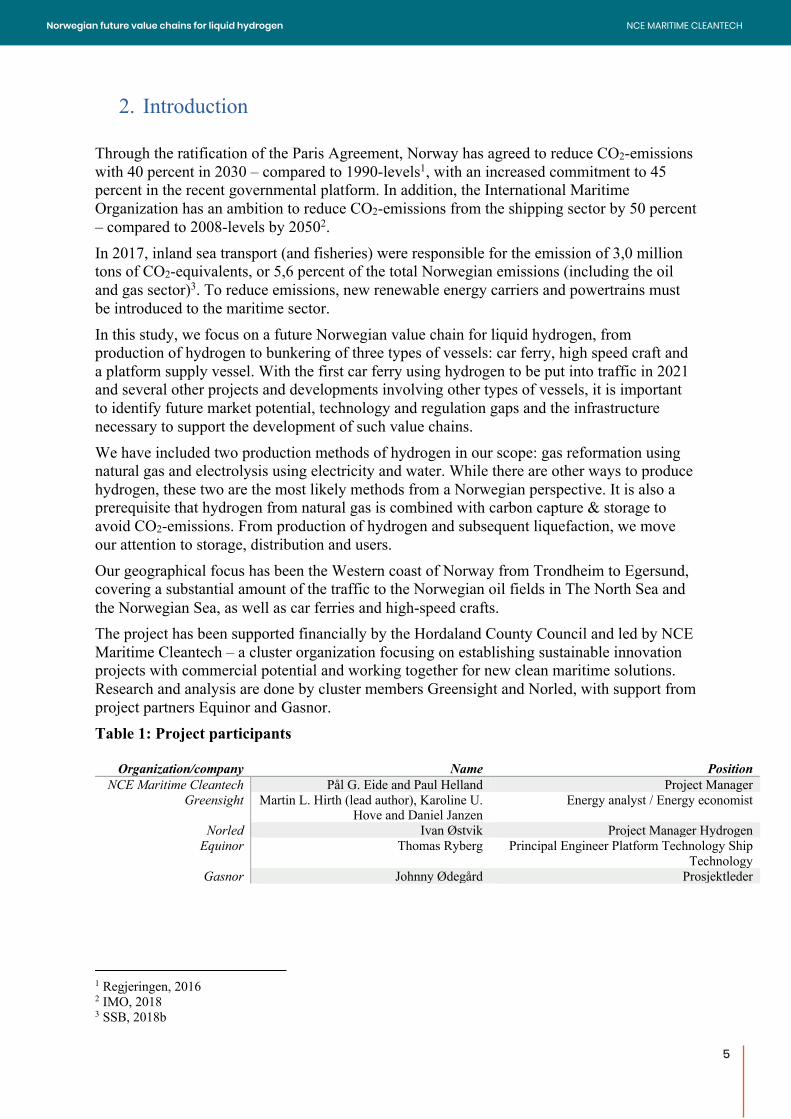
2. Introduction Through the ratification of the Paris Agreement, Norway has agreed to reduce CO2-emissions with 40 percent in 2030 – compared to 1990-levels1, with an increased commitment to 45 percent in the recent governmental platform. In addition, the International Maritime Organization has an ambition to reduce CO2-emissions from the shipping sector by 50 percent – compared to 2008-levels by 20502. In 2017, inland sea transport (and fisheries) were responsible for the emission of 3,0 million tons of CO2-equivalents, or 5,6 percent of the total Norwegian emissions (including the oil and gas sector)3. To reduce emissions, new renewable energy carriers and powertrains must be introduced to the maritime sector. In this study, we focus on a future Norwegian value chain for liquid hydrogen, from production of hydrogen to bunkering of three types of vessels: car ferry, high speed craft and a platform supply vessel. With the first car ferry using hydrogen to be put into traffic in 2021 and several other projects and developments involving other types of vessels, it is important to identify future market potential, technology and regulation gaps and the infrastructure necessary to support the development of such value chains. We have included two production methods of hydrogen in our scope: gas reformation using natural gas and electrolysis using electricity and water. While there are other ways to produce hydrogen, these two are the most likely methods from a Norwegian perspective. It is also a prerequisite that hydrogen from natural gas is combined with carbon capture & storage to avoid CO2-emissions. From production of hydrogen and subsequent liquefaction, we move our attention to storage, distribution and users. Our geographical focus has been the Western coast of Norway from Trondheim to Egersund, covering a substantial amount of the traffic to the Norwegian oil fields in The North Sea and the Norwegian Sea, as well as car ferries and high-speed crafts. The project has been supported financially by the Hordaland County Council and led by NCE Maritime Cleantech – a cluster organization focusing on establishing sustainable innovation projects with commercial potential and working together for new clean maritime solutions. Research and analysis are done by cluster members Greensight and Norled, with support from project partners Equinor and Gasnor. Table 1: Project participants
Organization/company Name Position NCE Maritime Cleantech Pål G. Eide and Paul Helland Project Manager
Greensight Martin L. Hirth (lead author), Karoline U. Hove and Daniel Janzen
Energy analyst / Energy economist
Norled Ivan Østvik Project Manager Hydrogen Equinor Thomas Ryberg Principal Engineer Platform Technology Ship
Technology Gasnor Johnny Ødegård Prosjektleder
1 Regjeringen, 2016 2 IMO, 2018 3 SSB, 2018b
5
NCE MARITIME CLEANTECHNorwegian future value chains for liquid hydrogen
6
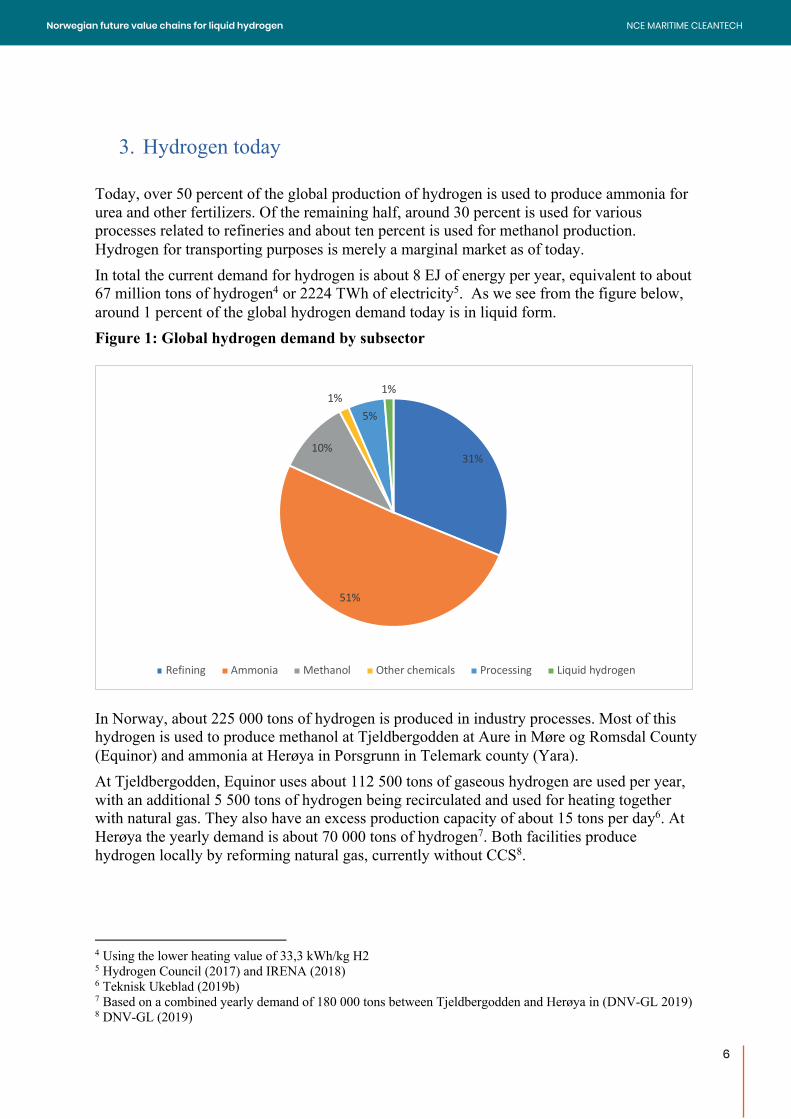
3. Hydrogen today Today, over 50 percent of the global production of hydrogen is used to produce ammonia for urea and other fertilizers. Of the remaining half, around 30 percent is used for various processes related to refineries and about ten percent is used for methanol production. Hydrogen for transporting purposes is merely a marginal market as of today. In total the current demand for hydrogen is about 8 EJ of energy per year, equivalent to about 67 million tons of hydrogen4 or 2224 TWh of electricity5. As we see from the figure below, around 1 percent of the global hydrogen demand today is in liquid form. Figure 1: Global hydrogen demand by subsector
In Norway, about 225 000 tons of hydrogen is produced in industry processes. Most of this hydrogen is used to produce methanol at Tjeldbergodden at Aure in Møre og Romsdal County (Equinor) and ammonia at Herøya in Porsgrunn in Telemark county (Yara). At Tjeldbergodden, Equinor uses about 112 500 tons of gaseous hydrogen are used per year, with an additional 5 500 tons of hydrogen being recirculated and used for heating together with natural gas. They also have an excess production capacity of about 15 tons per day6. At Herøya the yearly demand is about 70 000 tons of hydrogen7. Both facilities produce hydrogen locally by reforming natural gas, currently without CCS8.
4 Using the lower heating value of 33,3 kWh/kg H2 5 Hydrogen Council (2017) and IRENA (2018) 6 Teknisk Ukeblad (2019b) 7 Based on a combined yearly demand of 180 000 tons between Tjeldbergodden and Herøya in (DNV-GL 2019) 8 DNV-GL (2019)
31%
51%
10%
1%
5%
1%
Refining Ammonia Methanol Other chemicals Processing Liquid hydrogen
6
NCE MARITIME CLEANTECHNorwegian future value chains for liquid hydrogen
7
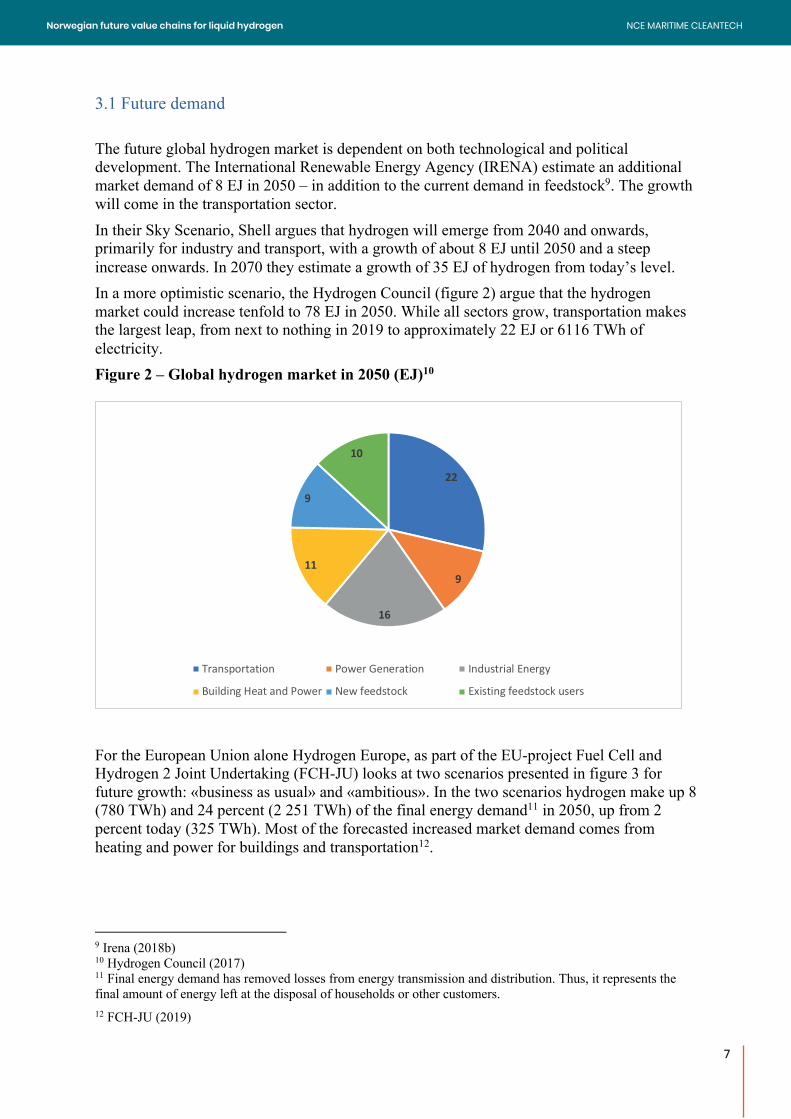
3.1 Future demand The future global hydrogen market is dependent on both technological and political development. The International Renewable Energy Agency (IRENA) estimate an additional market demand of 8 EJ in 2050 – in addition to the current demand in feedstock9. The growth will come in the transportation sector. In their Sky Scenario, Shell argues that hydrogen will emerge from 2040 and onwards, primarily for industry and transport, with a growth of about 8 EJ until 2050 and a steep increase onwards. In 2070 they estimate a growth of 35 EJ of hydrogen from today’s level. In a more optimistic scenario, the Hydrogen Council (figure 2) argue that the hydrogen market could increase tenfold to 78 EJ in 2050. While all sectors grow, transportation makes the largest leap, from next to nothing in 2019 to approximately 22 EJ or 6116 TWh of electricity. Figure 2 – Global hydrogen market in 2050 (EJ)10
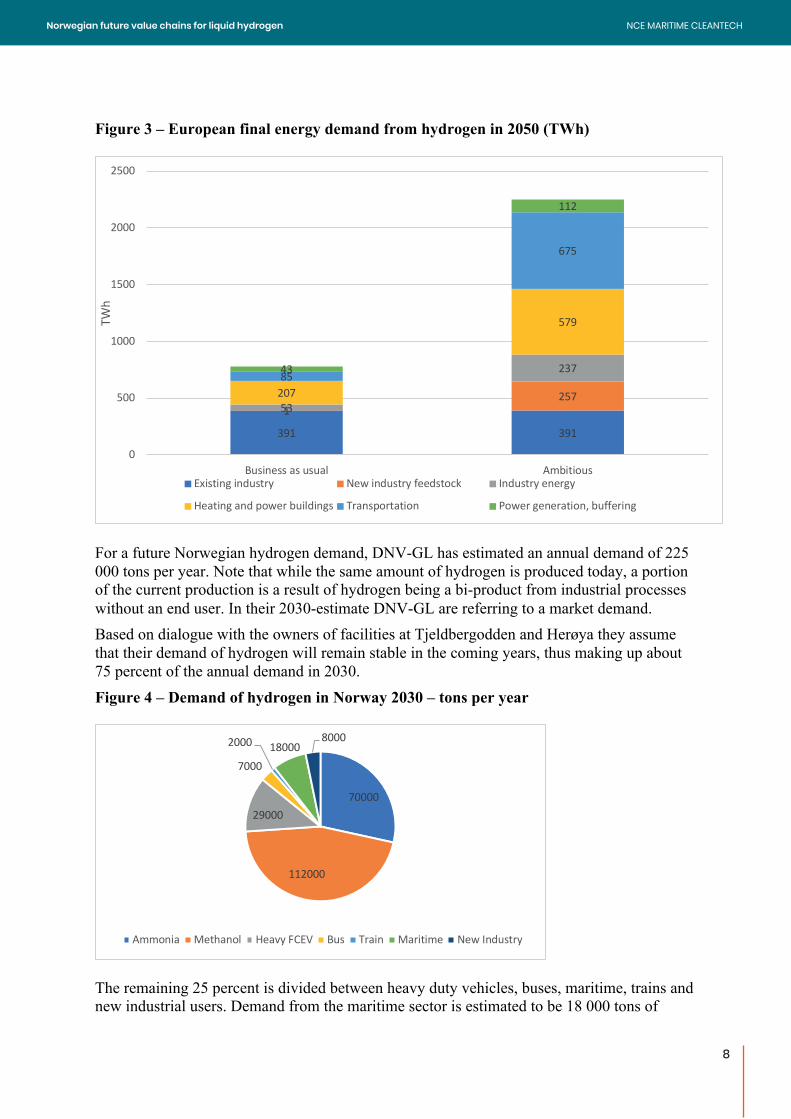
For the European Union alone Hydrogen Europe, as part of the EU-project Fuel Cell and Hydrogen 2 Joint Undertaking (FCH-JU) looks at two scenarios presented in figure 3 for future growth: «business as usual» and «ambitious». In the two scenarios hydrogen make up 8 (780 TWh) and 24 percent (2 251 TWh) of the final energy demand11 in 2050, up from 2 percent today (325 TWh). Most of the forecasted increased market demand comes from heating and power for buildings and transportation12.
9 Irena (2018b) 10 Hydrogen Council (2017) 11 Final energy demand has removed losses from energy transmission and distribution. Thus, it represents the final amount of energy left at the disposal of households or other customers. 12 FCH-JU (2019)
22
9
16
11
9
10
Transportation Power Generation Industrial Energy
Building Heat and Power New feedstock Existing feedstock users
7
NCE MARITIME CLEANTECHNorwegian future value chains for liquid hydrogen
8
Figure 3 – European final energy demand from hydrogen in 2050 (TWh)
For a future Norwegian hydrogen demand, DNV-GL has estimated an annual demand of 225 000 tons per year. Note that while the same amount of hydrogen is produced today, a portion of the current production is a result of hydrogen being a bi-product from industrial processes without an end user. In their 2030-estimate DNV-GL are referring to a market demand. Based on dialogue with the owners of facilities at Tjeldbergodden and Herøya they assume that their demand of hydrogen will remain stable in the coming years, thus making up about 75 percent of the annual demand in 2030. Figure 4 – Demand of hydrogen in Norway 2030 – tons per year
The remaining 25 percent is divided between heavy duty vehicles, buses, maritime, trains and new industrial users. Demand from the maritime sector is estimated to be 18 000 tons of
391 391
1257
53
237
207
579
85
675
43
112
0
500
1000
1500
2000
2500
Business as usual Ambitious
TWh
Existing industry New industry feedstock Industry energy
Heating and power buildings Transportation Power generation, buffering
70000
112000
29000
7000
2000 180008000
Ammonia Methanol Heavy FCEV Bus Train Maritime New Industry
8
NCE MARITIME CLEANTECHNorwegian future value chains for liquid hydrogen
9
hydrogen per year, calculated from a list of 186 vessels that hails from the five largest ports in terms of marine refuelling today13. While there seems to be an agreement in different scenarios on the expansion of hydrogen, especially in the transportation sector, the literature study also shows a great variety in the estimated demand, with a high degree of uncertainty. Table 2 – Summary of scenarios for future demand – TWh and EJ14
Source Geography Year TWh EJ DNV-GL (2019) Norway 2030 8,34 0,03
FCH-JU (2019)15 Europe (final energy demand) 2030 481/665 1,7/2,4 FCH-JU (2019) Europe (final energy demand) 2050 780/2251 2,8/8,1 Shell Sky (2018) Global 2050 4 726 17
Irena (2018) Global 2050 4 448 16 Hydrogen Council (2017) Global 2050 21 684 78
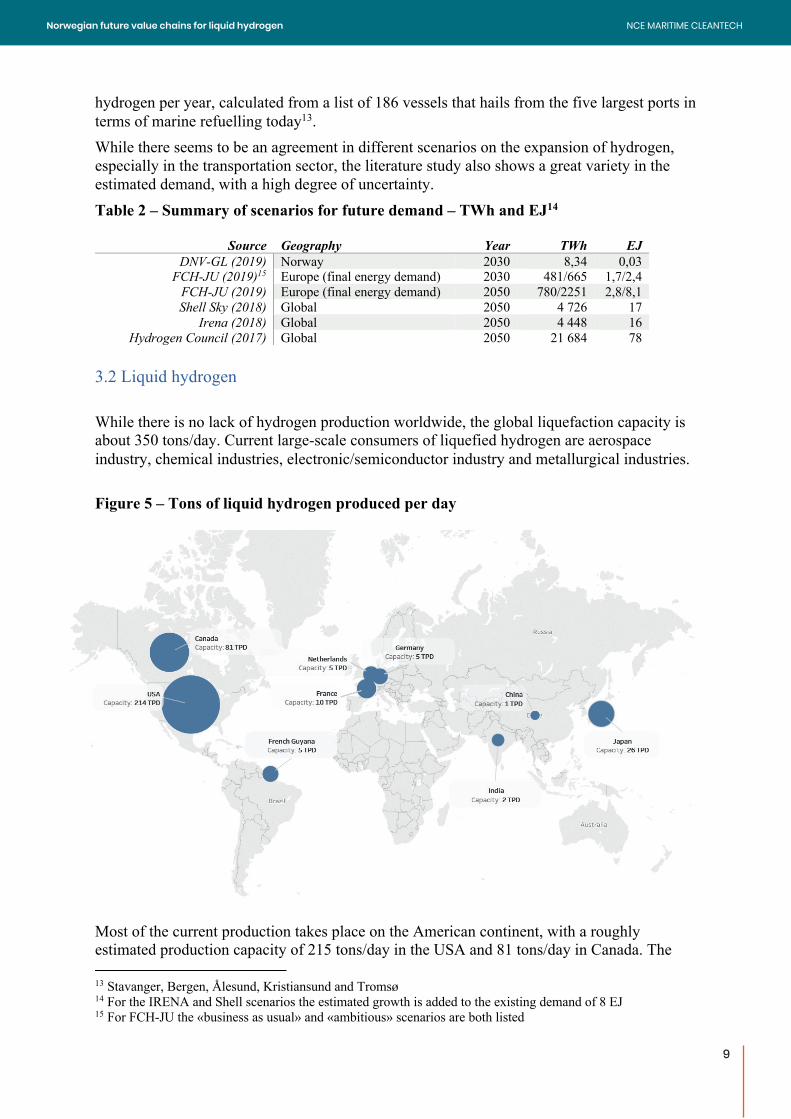
3.2 Liquid hydrogen While there is no lack of hydrogen production worldwide, the global liquefaction capacity is about 350 tons/day. Current large-scale consumers of liquefied hydrogen are aerospace industry, chemical industries, electronic/semiconductor industry and metallurgical industries. Figure 5 – Tons of liquid hydrogen produced per day
Most of the current production takes place on the American continent, with a roughly estimated production capacity of 215 tons/day in the USA and 81 tons/day in Canada. The 13 Stavanger, Bergen, Ålesund, Kristiansund and Tromsø 14 For the IRENA and Shell scenarios the estimated growth is added to the existing demand of 8 EJ 15 For FCH-JU the «business as usual» and «ambitious» scenarios are both listed
9
NCE MARITIME CLEANTECHNorwegian future value chains for liquid hydrogen
10
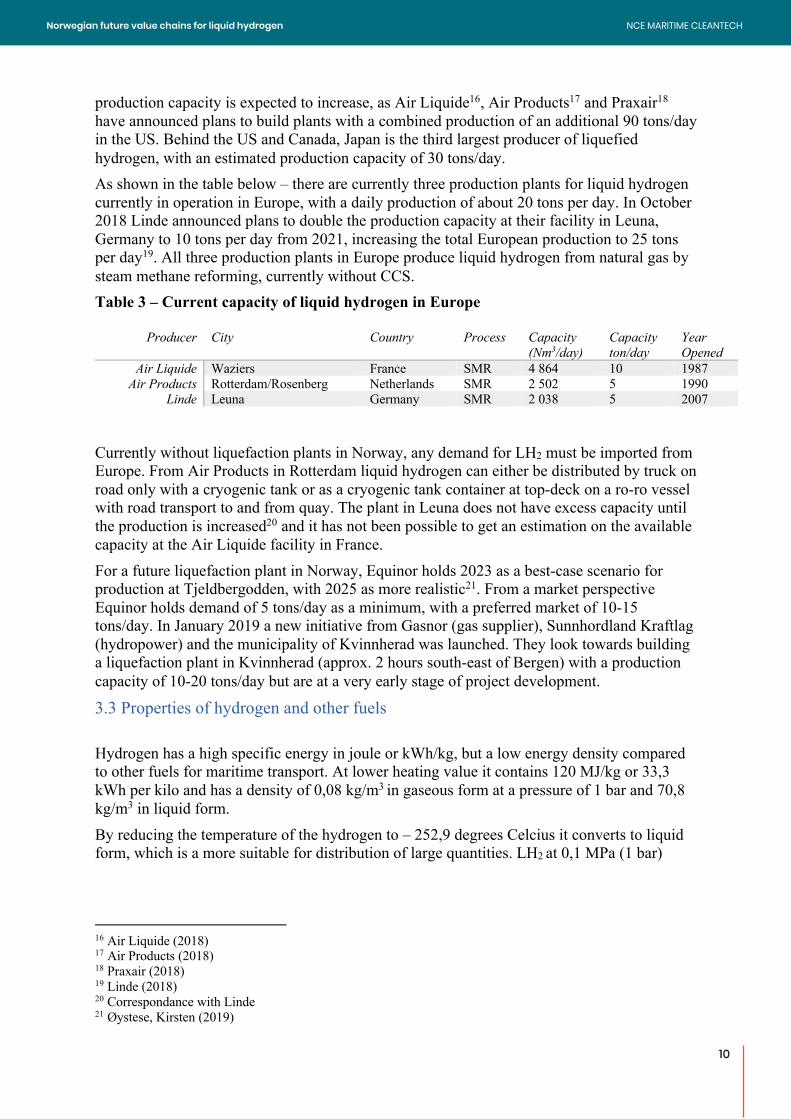
production capacity is expected to increase, as Air Liquide16, Air Products17 and Praxair18 have announced plans to build plants with a combined production of an additional 90 tons/day in the US. Behind the US and Canada, Japan is the third largest producer of liquefied hydrogen, with an estimated production capacity of 30 tons/day. As shown in the table below – there are currently three production plants for liquid hydrogen currently in operation in Europe, with a daily production of about 20 tons per day. In October 2018 Linde announced plans to double the production capacity at their facility in Leuna, Germany to 10 tons per day from 2021, increasing the total European production to 25 tons per day19. All three production plants in Europe produce liquid hydrogen from natural gas by steam methane reforming, currently without CCS. Table 3 – Current capacity of liquid hydrogen in Europe
Producer City Country Process Capacity (Nm3/day)
Capacity ton/day
Year Opened
Air Liquide Waziers France SMR 4 864 10 1987 Air Products Rotterdam/Rosenberg Netherlands SMR 2 502 5 1990
Linde Leuna Germany SMR 2 038 5 2007 Currently without liquefaction plants in Norway, any demand for LH2 must be imported from Europe. From Air Products in Rotterdam liquid hydrogen can either be distributed by truck on road only with a cryogenic tank or as a cryogenic tank container at top-deck on a ro-ro vessel with road transport to and from quay. The plant in Leuna does not have excess capacity until the production is increased20 and it has not been possible to get an estimation on the available capacity at the Air Liquide facility in France. For a future liquefaction plant in Norway, Equinor holds 2023 as a best-case scenario for production at Tjeldbergodden, with 2025 as more realistic21. From a market perspective Equinor holds demand of 5 tons/day as a minimum, with a preferred market of 10-15 tons/day. In January 2019 a new initiative from Gasnor (gas supplier), Sunnhordland Kraftlag (hydropower) and the municipality of Kvinnherad was launched. They look towards building a liquefaction plant in Kvinnherad (approx. 2 hours south-east of Bergen) with a production capacity of 10-20 tons/day but are at a very early stage of project development.
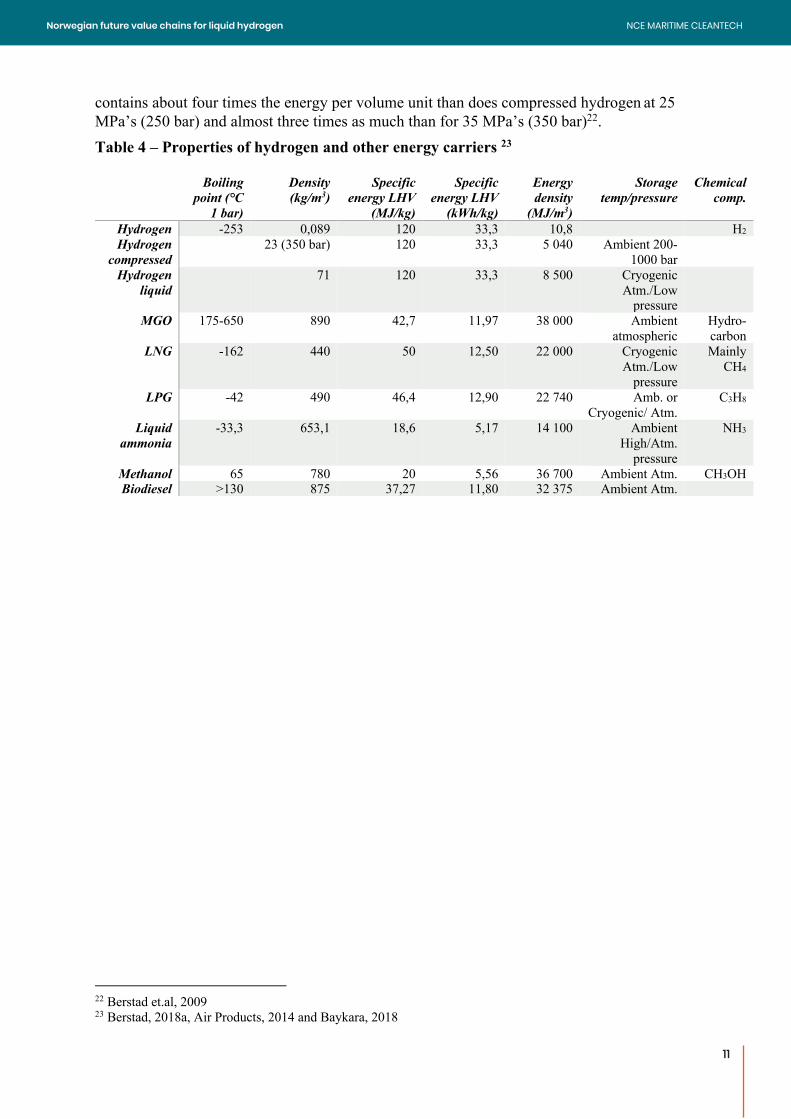
3.3 Properties of hydrogen and other fuels Hydrogen has a high specific energy in joule or kWh/kg, but a low energy density compared to other fuels for maritime transport. At lower heating value it contains 120 MJ/kg or 33,3 kWh per kilo and has a density of 0,08 kg/m3 in gaseous form at a pressure of 1 bar and 70,8 kg/m3 in liquid form. By reducing the temperature of the hydrogen to – 252,9 degrees Celcius it converts to liquid form, which is a more suitable for distribution of large quantities. LH2 at 0,1 MPa (1 bar)
16 Air Liquide (2018) 17 Air Products (2018) 18 Praxair (2018) 19 Linde (2018) 20 Correspondance with Linde 21 Øystese, Kirsten (2019)
10
NCE MARITIME CLEANTECHNorwegian future value chains for liquid hydrogen
11
contains about four times the energy per volume unit than does compressed hydrogen at 25 MPa’s (250 bar) and almost three times as much than for 35 MPa’s (350 bar)22. Table 4 – Properties of hydrogen and other energy carriers 23
Boiling point (°C
1 bar)
Density (kg/m3)
Specific energy LHV
(MJ/kg)
Specific energy LHV
(kWh/kg)
Energy density
(MJ/m3)
Storage temp/pressure
Chemical comp.
Hydrogen -253 0,089 120 33,3 10,8 H2
Hydrogen compressed
23 (350 bar) 120 33,3 5 040 Ambient 200-1000 bar
Hydrogen liquid
71 120 33,3 8 500 Cryogenic Atm./Low
pressure
MGO 175-650 890 42,7 11,97 38 000 Ambient atmospheric
Hydro-carbon
LNG -162 440 50 12,50 22 000 Cryogenic Atm./Low
pressure
Mainly CH4
LPG -42 490 46,4 12,90 22 740 Amb. or Cryogenic/ Atm.
C3H8
Liquid ammonia
-33,3 653,1 18,6 5,17 14 100 Ambient High/Atm.
pressure
NH3
Methanol 65 780 20 5,56 36 700 Ambient Atm. CH3OH Biodiesel >130 875 37,27 11,80 32 375 Ambient Atm.
22 Berstad et.al, 2009 23 Berstad, 2018a, Air Products, 2014 and Baykara, 2018
11
NCE MARITIME CLEANTECHNorwegian future value chains for liquid hydrogen
12
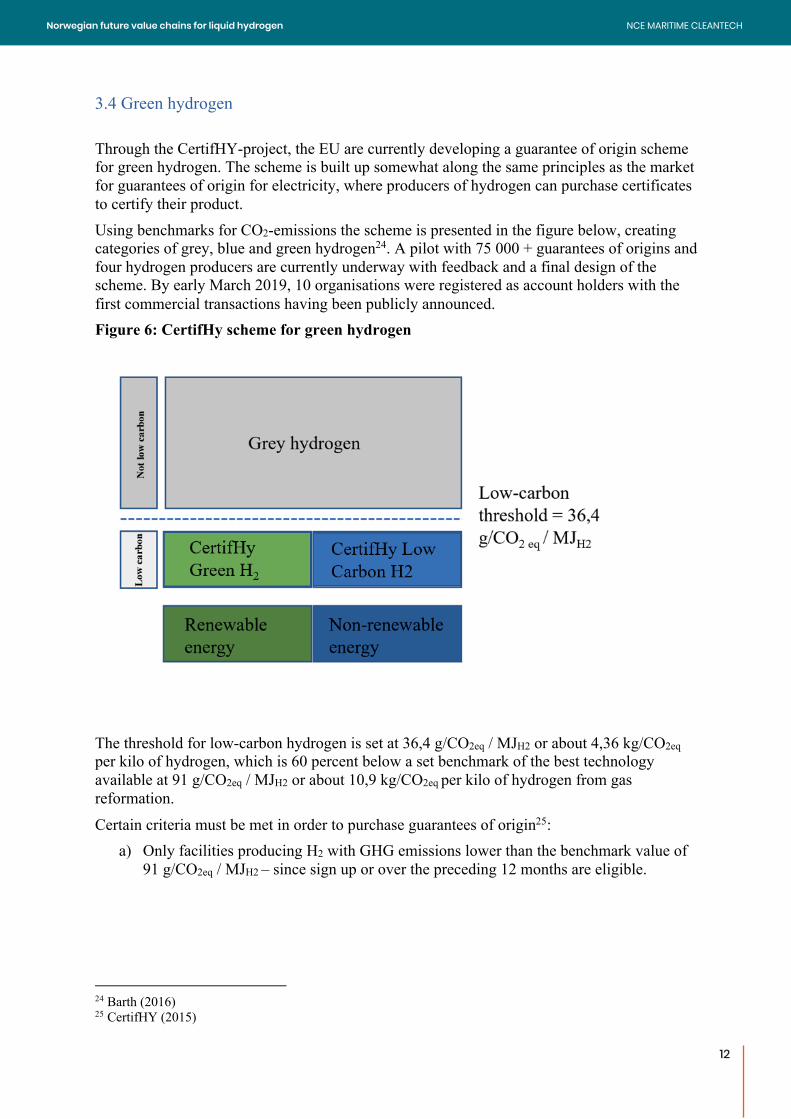
3.4 Green hydrogen Through the CertifHY-project, the EU are currently developing a guarantee of origin scheme for green hydrogen. The scheme is built up somewhat along the same principles as the market for guarantees of origin for electricity, where producers of hydrogen can purchase certificates to certify their product. Using benchmarks for CO2-emissions the scheme is presented in the figure below, creating categories of grey, blue and green hydrogen24. A pilot with 75 000 + guarantees of origins and four hydrogen producers are currently underway with feedback and a final design of the scheme. By early March 2019, 10 organisations were registered as account holders with the first commercial transactions having been publicly announced. Figure 6: CertifHy scheme for green hydrogen
The threshold for low-carbon hydrogen is set at 36,4 g/CO2eq / MJH2 or about 4,36 kg/CO2eq per kilo of hydrogen, which is 60 percent below a set benchmark of the best technology available at 91 g/CO2eq / MJH2 or about 10,9 kg/CO2eq per kilo of hydrogen from gas reformation.
Certain criteria must be met in order to purchase guarantees of origin25: a) Only facilities producing H2 with GHG emissions lower than the benchmark value of
91 g/CO2eq / MJH2 – since sign up or over the preceding 12 months are eligible. 24 Barth (2016) 25 CertifHY (2015)
12
NCE MARITIME CLEANTECHNorwegian future value chains for liquid hydrogen
13
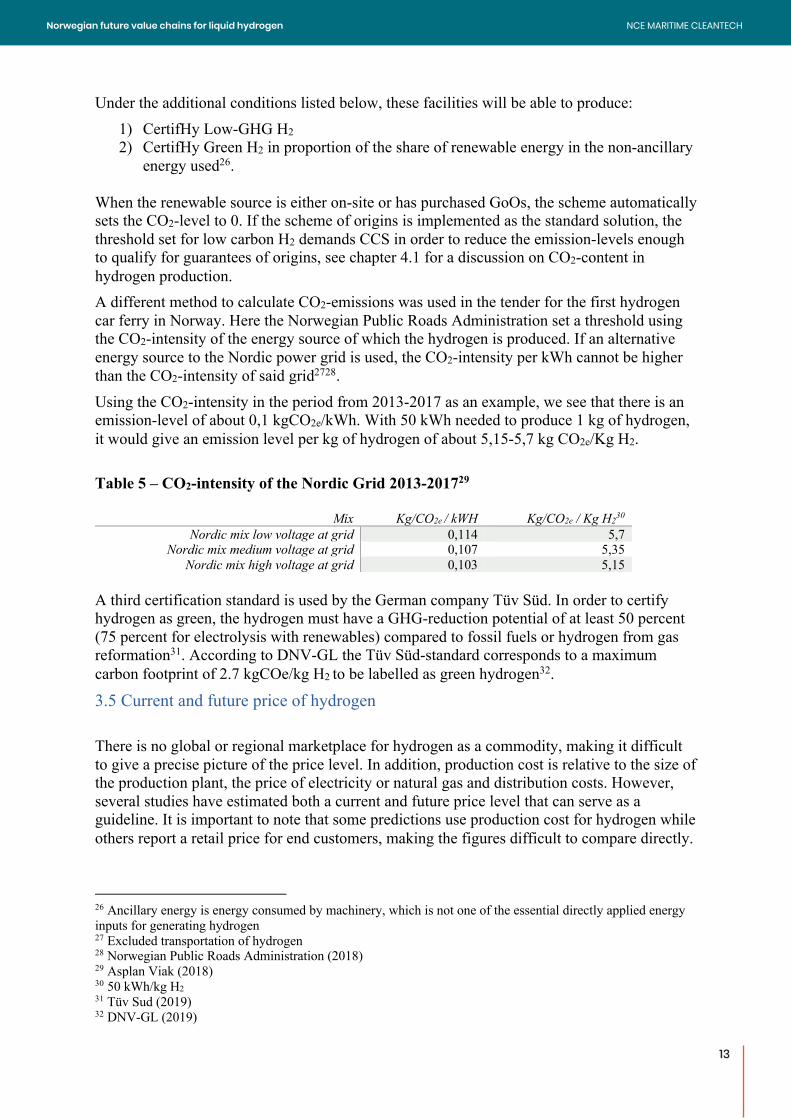
Under the additional conditions listed below, these facilities will be able to produce: 1) CertifHy Low-GHG H2 2) CertifHy Green H2 in proportion of the share of renewable energy in the non-ancillary
energy used26. When the renewable source is either on-site or has purchased GoOs, the scheme automatically sets the CO2-level to 0. If the scheme of origins is implemented as the standard solution, the threshold set for low carbon H2 demands CCS in order to reduce the emission-levels enough to qualify for guarantees of origins, see chapter 4.1 for a discussion on CO2-content in hydrogen production. A different method to calculate CO2-emissions was used in the tender for the first hydrogen car ferry in Norway. Here the Norwegian Public Roads Administration set a threshold using the CO2-intensity of the energy source of which the hydrogen is produced. If an alternative energy source to the Nordic power grid is used, the CO2-intensity per kWh cannot be higher than the CO2-intensity of said grid2728. Using the CO2-intensity in the period from 2013-2017 as an example, we see that there is an emission-level of about 0,1 kgCO2e/kWh. With 50 kWh needed to produce 1 kg of hydrogen, it would give an emission level per kg of hydrogen of about 5,15-5,7 kg CO2e/Kg H2. Table 5 – CO2-intensity of the Nordic Grid 2013-201729
Mix Kg/CO2e / kWH Kg/CO2e / Kg H230
Nordic mix low voltage at grid 0,114 5,7 Nordic mix medium voltage at grid 0,107 5,35
Nordic mix high voltage at grid 0,103 5,15 A third certification standard is used by the German company Tüv Süd. In order to certify hydrogen as green, the hydrogen must have a GHG-reduction potential of at least 50 percent (75 percent for electrolysis with renewables) compared to fossil fuels or hydrogen from gas reformation31. According to DNV-GL the Tüv Süd-standard corresponds to a maximum carbon footprint of 2.7 kgCOe/kg H2 to be labelled as green hydrogen32.
3.5 Current and future price of hydrogen There is no global or regional marketplace for hydrogen as a commodity, making it difficult to give a precise picture of the price level. In addition, production cost is relative to the size of the production plant, the price of electricity or natural gas and distribution costs. However, several studies have estimated both a current and future price level that can serve as a guideline. It is important to note that some predictions use production cost for hydrogen while others report a retail price for end customers, making the figures difficult to compare directly.
26 Ancillary energy is energy consumed by machinery, which is not one of the essential directly applied energy inputs for generating hydrogen 27 Excluded transportation of hydrogen 28 Norwegian Public Roads Administration (2018) 29 Asplan Viak (2018) 30 50 kWh/kg H2 31 Tüv Sud (2019) 32 DNV-GL (2019)
13
NCE MARITIME CLEANTECHNorwegian future value chains for liquid hydrogen
14
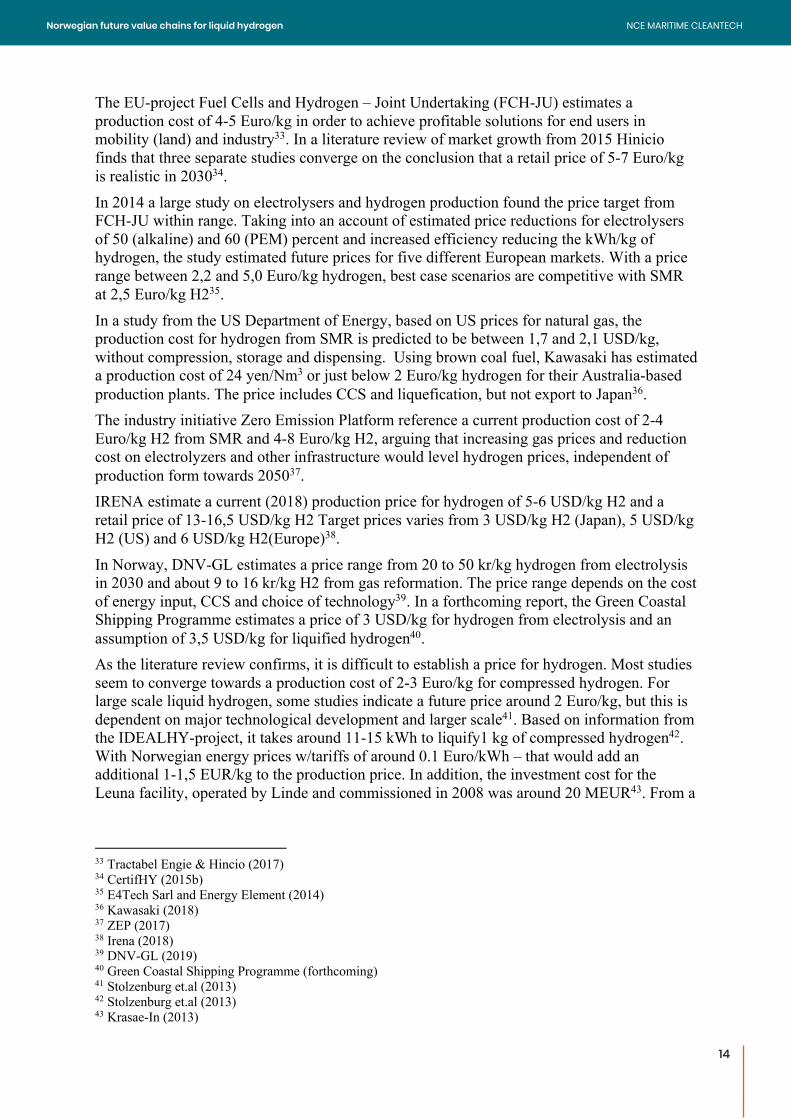
The EU-project Fuel Cells and Hydrogen – Joint Undertaking (FCH-JU) estimates a production cost of 4-5 Euro/kg in order to achieve profitable solutions for end users in mobility (land) and industry33. In a literature review of market growth from 2015 Hinicio finds that three separate studies converge on the conclusion that a retail price of 5-7 Euro/kg is realistic in 203034. In 2014 a large study on electrolysers and hydrogen production found the price target from FCH-JU within range. Taking into an account of estimated price reductions for electrolysers of 50 (alkaline) and 60 (PEM) percent and increased efficiency reducing the kWh/kg of hydrogen, the study estimated future prices for five different European markets. With a price range between 2,2 and 5,0 Euro/kg hydrogen, best case scenarios are competitive with SMR at 2,5 Euro/kg H235. In a study from the US Department of Energy, based on US prices for natural gas, the production cost for hydrogen from SMR is predicted to be between 1,7 and 2,1 USD/kg, without compression, storage and dispensing. Using brown coal fuel, Kawasaki has estimated a production cost of 24 yen/Nm3 or just below 2 Euro/kg hydrogen for their Australia-based production plants. The price includes CCS and liquefication, but not export to Japan36. The industry initiative Zero Emission Platform reference a current production cost of 2-4 Euro/kg H2 from SMR and 4-8 Euro/kg H2, arguing that increasing gas prices and reduction cost on electrolyzers and other infrastructure would level hydrogen prices, independent of production form towards 205037. IRENA estimate a current (2018) production price for hydrogen of 5-6 USD/kg H2 and a retail price of 13-16,5 USD/kg H2 Target prices varies from 3 USD/kg H2 (Japan), 5 USD/kg H2 (US) and 6 USD/kg H2(Europe)38. In Norway, DNV-GL estimates a price range from 20 to 50 kr/kg hydrogen from electrolysis in 2030 and about 9 to 16 kr/kg H2 from gas reformation. The price range depends on the cost of energy input, CCS and choice of technology39. In a forthcoming report, the Green Coastal Shipping Programme estimates a price of 3 USD/kg for hydrogen from electrolysis and an assumption of 3,5 USD/kg for liquified hydrogen40. As the literature review confirms, it is difficult to establish a price for hydrogen. Most studies seem to converge towards a production cost of 2-3 Euro/kg for compressed hydrogen. For large scale liquid hydrogen, some studies indicate a future price around 2 Euro/kg, but this is dependent on major technological development and larger scale41. Based on information from the IDEALHY-project, it takes around 11-15 kWh to liquify1 kg of compressed hydrogen42. With Norwegian energy prices w/tariffs of around 0.1 Euro/kWh – that would add an additional 1-1,5 EUR/kg to the production price. In addition, the investment cost for the Leuna facility, operated by Linde and commissioned in 2008 was around 20 MEUR43. From a
33 Tractabel Engie & Hincio (2017) 34 CertifHY (2015b) 35 E4Tech Sarl and Energy Element (2014) 36 Kawasaki (2018) 37 ZEP (2017) 38 Irena (2018) 39 DNV-GL (2019) 40 Green Coastal Shipping Programme (forthcoming) 41 Stolzenburg et.al (2013) 42 Stolzenburg et.al (2013) 43 Krasae-In (2013)
14
NCE MARITIME CLEANTECHNorwegian future value chains for liquid hydrogen
15
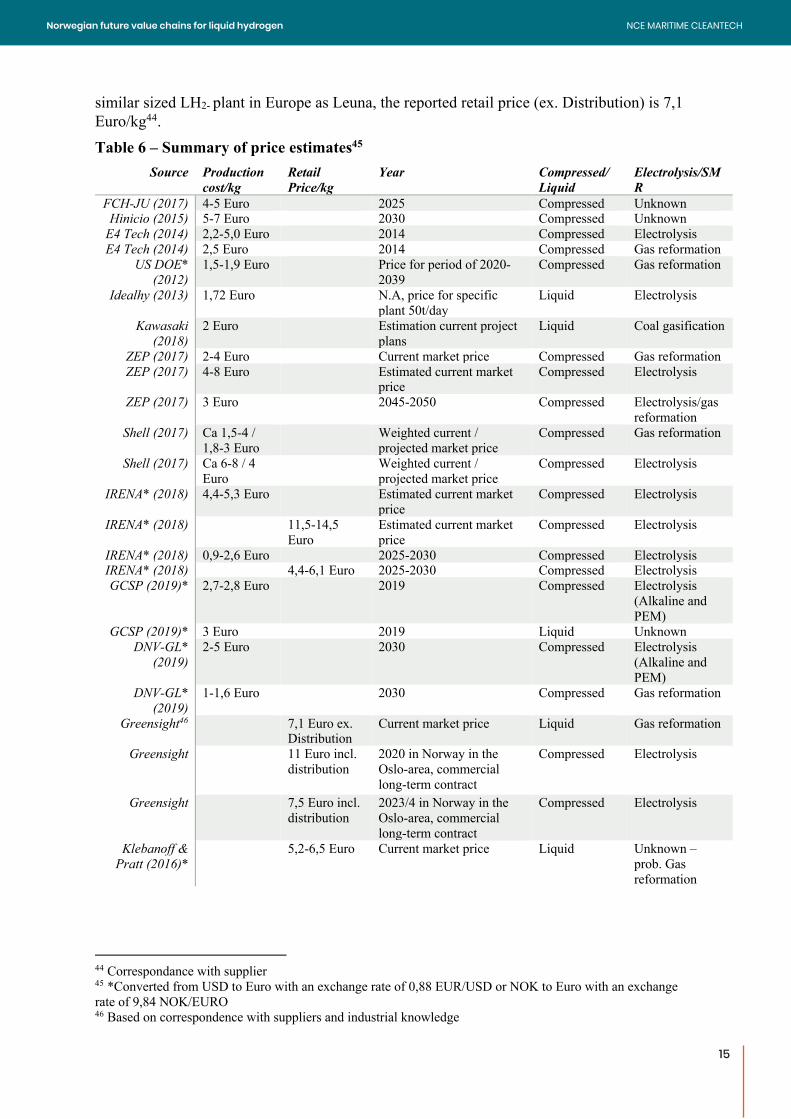
similar sized LH2- plant in Europe as Leuna, the reported retail price (ex. Distribution) is 7,1 Euro/kg44. Table 6 – Summary of price estimates45
Source Production cost/kg
Retail Price/kg
Year Compressed/ Liquid
Electrolysis/SMR
FCH-JU (2017) 4-5 Euro 2025 Compressed Unknown Hinicio (2015) 5-7 Euro 2030 Compressed Unknown
E4 Tech (2014) 2,2-5,0 Euro 2014 Compressed Electrolysis E4 Tech (2014) 2,5 Euro 2014 Compressed Gas reformation
US DOE* (2012)
1,5-1,9 Euro Price for period of 2020-2039
Compressed Gas reformation
Idealhy (2013) 1,72 Euro N.A, price for specific plant 50t/day
Liquid Electrolysis
Kawasaki (2018)
2 Euro Estimation current project plans
Liquid Coal gasification
ZEP (2017) 2-4 Euro Current market price Compressed Gas reformation ZEP (2017) 4-8 Euro Estimated current market
price Compressed Electrolysis
ZEP (2017) 3 Euro 2045-2050 Compressed Electrolysis/gas reformation
Shell (2017) Ca 1,5-4 / 1,8-3 Euro
Weighted current / projected market price
Compressed Gas reformation
Shell (2017) Ca 6-8 / 4 Euro
Weighted current / projected market price
Compressed Electrolysis
IRENA* (2018) 4,4-5,3 Euro Estimated current market price
Compressed Electrolysis
IRENA* (2018) 11,5-14,5 Euro
Estimated current market price
Compressed Electrolysis
IRENA* (2018) 0,9-2,6 Euro 2025-2030 Compressed Electrolysis IRENA* (2018) 4,4-6,1 Euro 2025-2030 Compressed Electrolysis GCSP (2019)* 2,7-2,8 Euro 2019 Compressed Electrolysis
(Alkaline and PEM)
GCSP (2019)* 3 Euro 2019 Liquid Unknown DNV-GL*
(2019) 2-5 Euro 2030 Compressed Electrolysis
(Alkaline and PEM)
DNV-GL* (2019)
1-1,6 Euro 2030 Compressed Gas reformation
Greensight46 7,1 Euro ex. Distribution
Current market price Liquid Gas reformation
Greensight 11 Euro incl. distribution
2020 in Norway in the Oslo-area, commercial long-term contract
Compressed Electrolysis
Greensight 7,5 Euro incl. distribution
2023/4 in Norway in the Oslo-area, commercial long-term contract
Compressed Electrolysis
Klebanoff & Pratt (2016)*
5,2-6,5 Euro Current market price Liquid Unknown – prob. Gas reformation
44 Correspondance with supplier 45 *Converted from USD to Euro with an exchange rate of 0,88 EUR/USD or NOK to Euro with an exchange rate of 9,84 NOK/EURO 46 Based on correspondence with suppliers and industrial knowledge
15
NCE MARITIME CLEANTECHNorwegian future value chains for liquid hydrogen
16
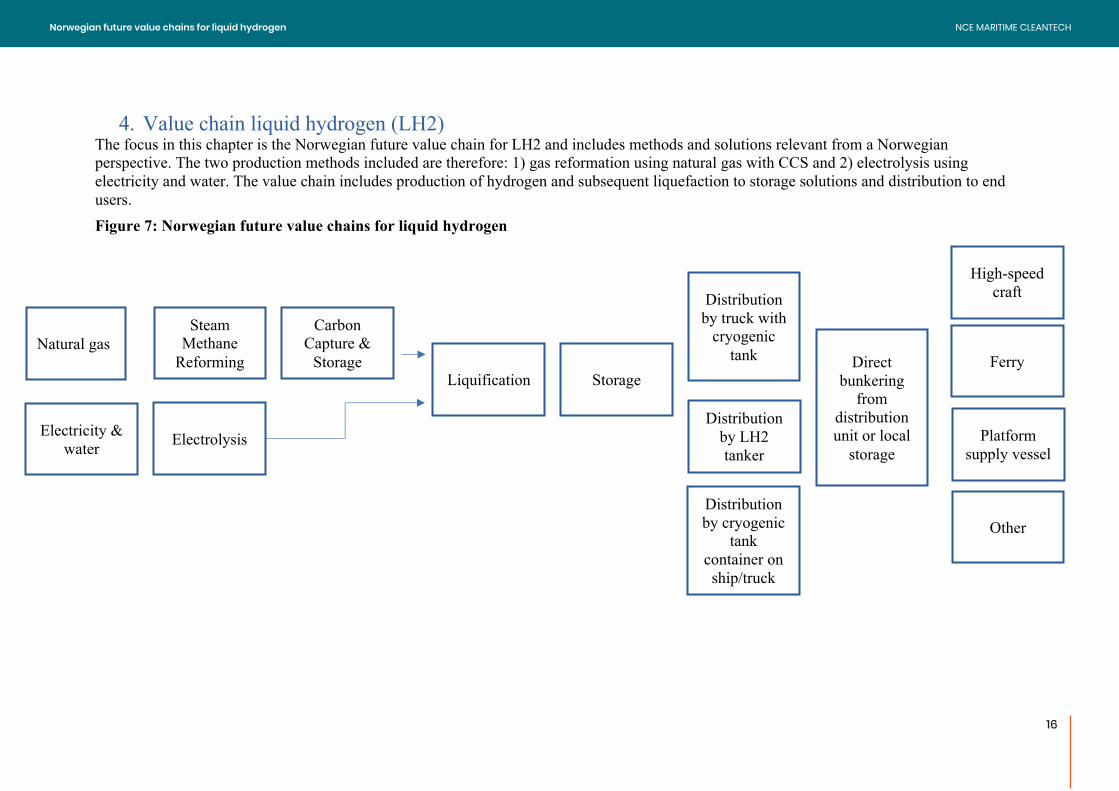
4. Value chain liquid hydrogen (LH2) The focus in this chapter is the Norwegian future value chain for LH2 and includes methods and solutions relevant from a Norwegian perspective. The two production methods included are therefore: 1) gas reformation using natural gas with CCS and 2) electrolysis using electricity and water. The value chain includes production of hydrogen and subsequent liquefaction to storage solutions and distribution to end users. Figure 7: Norwegian future value chains for liquid hydrogen
Natural gas Steam
Methane Reforming
Electricity & water Electrolysis
Carbon Capture &
Storage Liquification Storage
Distribution by truck with
cryogenic tank
Distribution by LH2 tanker
Ferry
High-speed craft
Platform supply vessel
Direct bunkering
from distribution unit or local
storage
Other Distribution by cryogenic
tank container on ship/truck
NCE MARITIME CLEANTECHNorwegian future value chains for liquid hydrogen
16
17
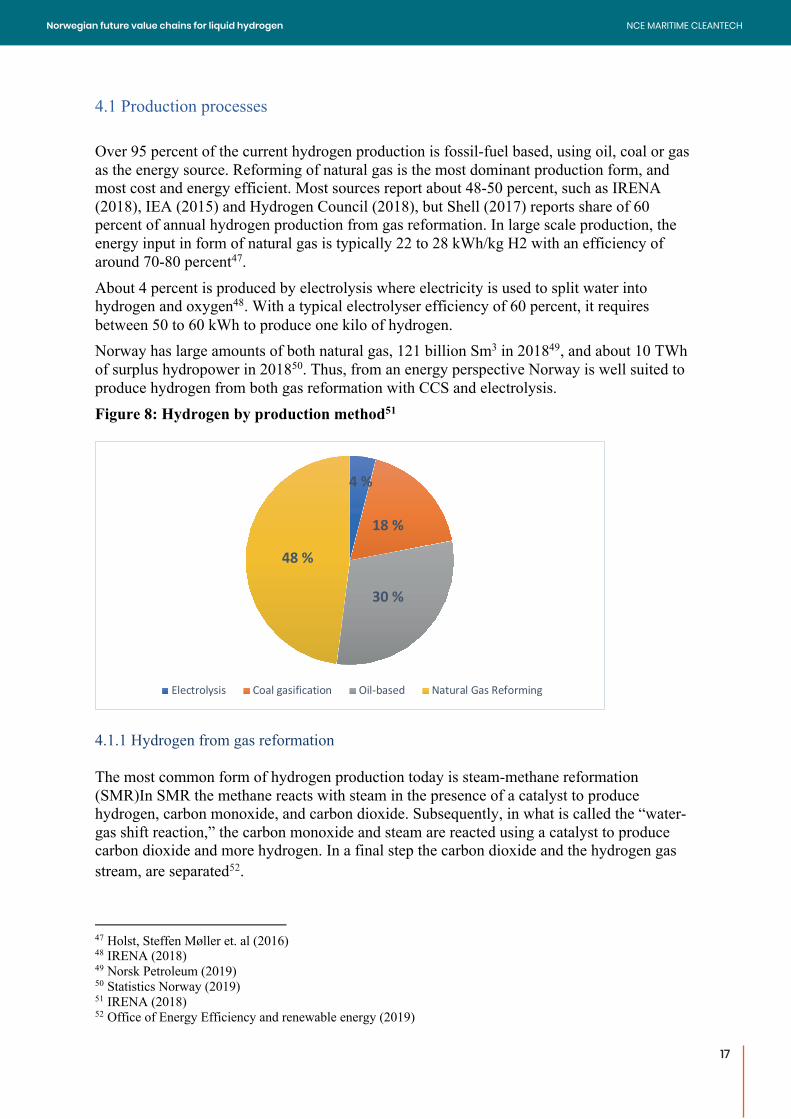
4.1 Production processes Over 95 percent of the current hydrogen production is fossil-fuel based, using oil, coal or gas as the energy source. Reforming of natural gas is the most dominant production form, and most cost and energy efficient. Most sources report about 48-50 percent, such as IRENA (2018), IEA (2015) and Hydrogen Council (2018), but Shell (2017) reports share of 60 percent of annual hydrogen production from gas reformation. In large scale production, the energy input in form of natural gas is typically 22 to 28 kWh/kg H2 with an efficiency of around 70-80 percent47. About 4 percent is produced by electrolysis where electricity is used to split water into hydrogen and oxygen48. With a typical electrolyser efficiency of 60 percent, it requires between 50 to 60 kWh to produce one kilo of hydrogen. Norway has large amounts of both natural gas, 121 billion Sm3 in 201849, and about 10 TWh of surplus hydropower in 201850. Thus, from an energy perspective Norway is well suited to produce hydrogen from both gas reformation with CCS and electrolysis. Figure 8: Hydrogen by production method51
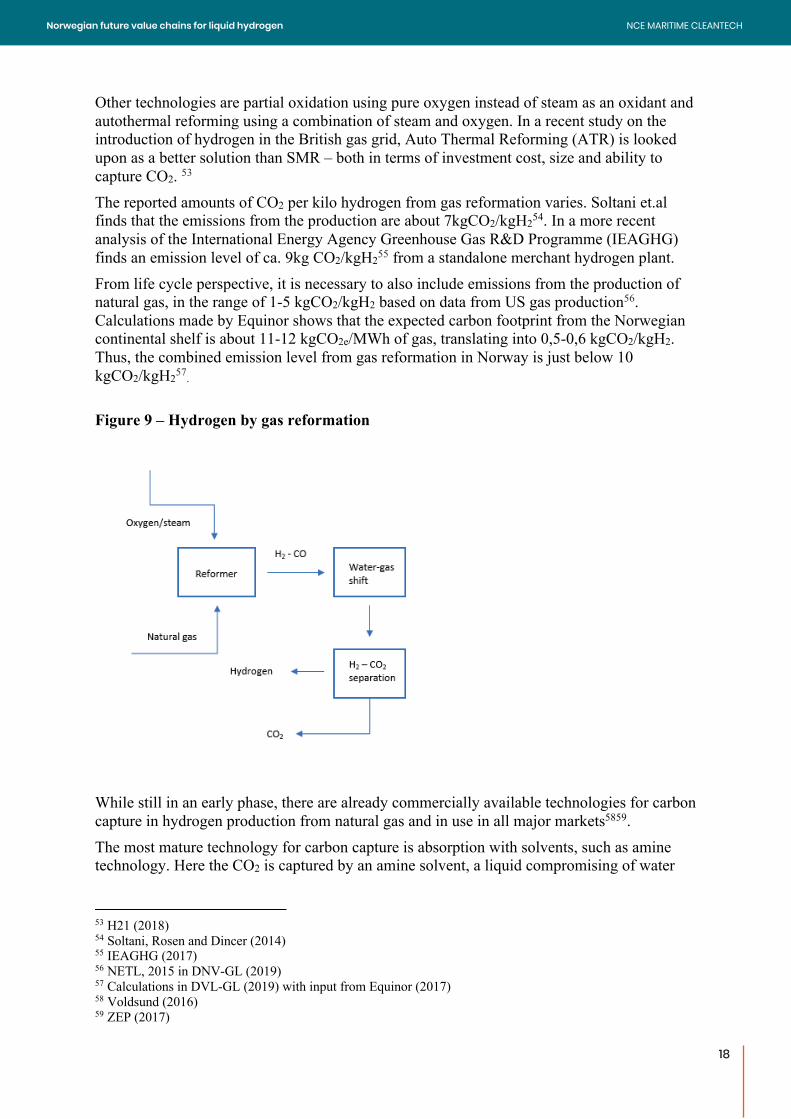
4.1.1 Hydrogen from gas reformation The most common form of hydrogen production today is steam-methane reformation (SMR)In SMR the methane reacts with steam in the presence of a catalyst to produce hydrogen, carbon monoxide, and carbon dioxide. Subsequently, in what is called the “water-gas shift reaction,” the carbon monoxide and steam are reacted using a catalyst to produce carbon dioxide and more hydrogen. In a final step the carbon dioxide and the hydrogen gas stream, are separated52.
47 Holst, Steffen Møller et. al (2016) 48 IRENA (2018) 49 Norsk Petroleum (2019) 50 Statistics Norway (2019) 51 IRENA (2018) 52 Office of Energy Efficiency and renewable energy (2019)
4 %
18 %
30 %
48 %
Electrolysis Coal gasification Oil-based Natural Gas Reforming
17
NCE MARITIME CLEANTECHNorwegian future value chains for liquid hydrogen
18
Other technologies are partial oxidation using pure oxygen instead of steam as an oxidant and autothermal reforming using a combination of steam and oxygen. In a recent study on the introduction of hydrogen in the British gas grid, Auto Thermal Reforming (ATR) is looked upon as a better solution than SMR – both in terms of investment cost, size and ability to capture CO2. 53 The reported amounts of CO2 per kilo hydrogen from gas reformation varies. Soltani et.al finds that the emissions from the production are about 7kgCO2/kgH254. In a more recent analysis of the International Energy Agency Greenhouse Gas R&D Programme (IEAGHG) finds an emission level of ca. 9kg CO2/kgH255 from a standalone merchant hydrogen plant. From life cycle perspective, it is necessary to also include emissions from the production of natural gas, in the range of 1-5 kgCO2/kgH2 based on data from US gas production56. Calculations made by Equinor shows that the expected carbon footprint from the Norwegian continental shelf is about 11-12 kgCO2e/MWh of gas, translating into 0,5-0,6 kgCO2/kgH2. Thus, the combined emission level from gas reformation in Norway is just below 10 kgCO2/kgH257. Figure 9 – Hydrogen by gas reformation
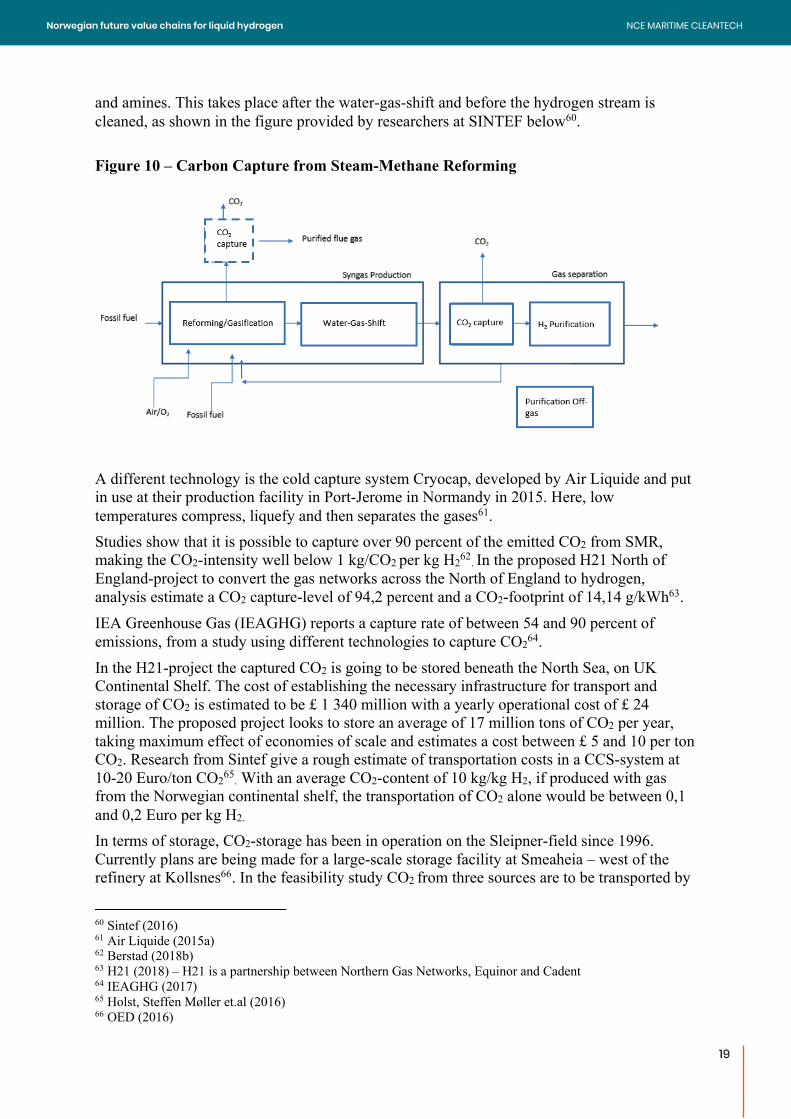
While still in an early phase, there are already commercially available technologies for carbon capture in hydrogen production from natural gas and in use in all major markets5859. The most mature technology for carbon capture is absorption with solvents, such as amine technology. Here the CO2 is captured by an amine solvent, a liquid compromising of water
53 H21 (2018) 54 Soltani, Rosen and Dincer (2014) 55 IEAGHG (2017) 56 NETL, 2015 in DNV-GL (2019) 57 Calculations in DVL-GL (2019) with input from Equinor (2017) 58 Voldsund (2016) 59 ZEP (2017)
18
NCE MARITIME CLEANTECHNorwegian future value chains for liquid hydrogen
19
and amines. This takes place after the water-gas-shift and before the hydrogen stream is cleaned, as shown in the figure provided by researchers at SINTEF below60. Figure 10 – Carbon Capture from Steam-Methane Reforming
A different technology is the cold capture system Cryocap, developed by Air Liquide and put in use at their production facility in Port-Jerome in Normandy in 2015. Here, low temperatures compress, liquefy and then separates the gases61. Studies show that it is possible to capture over 90 percent of the emitted CO2 from SMR, making the CO2-intensity well below 1 kg/CO2 per kg H262. In the proposed H21 North of England-project to convert the gas networks across the North of England to hydrogen, analysis estimate a CO2 capture-level of 94,2 percent and a CO2-footprint of 14,14 g/kWh63. IEA Greenhouse Gas (IEAGHG) reports a capture rate of between 54 and 90 percent of emissions, from a study using different technologies to capture CO264. In the H21-project the captured CO2 is going to be stored beneath the North Sea, on UK Continental Shelf. The cost of establishing the necessary infrastructure for transport and storage of CO2 is estimated to be £ 1 340 million with a yearly operational cost of £ 24 million. The proposed project looks to store an average of 17 million tons of CO2 per year, taking maximum effect of economies of scale and estimates a cost between £ 5 and 10 per ton CO2. Research from Sintef give a rough estimate of transportation costs in a CCS-system at 10-20 Euro/ton CO265. With an average CO2-content of 10 kg/kg H2, if produced with gas from the Norwegian continental shelf, the transportation of CO2 alone would be between 0,1 and 0,2 Euro per kg H2. In terms of storage, CO2-storage has been in operation on the Sleipner-field since 1996. Currently plans are being made for a large-scale storage facility at Smeaheia – west of the refinery at Kollsnes66. In the feasibility study CO2 from three sources are to be transported by
60 Sintef (2016) 61 Air Liquide (2015a) 62 Berstad (2018b) 63 H21 (2018) – H21 is a partnership between Northern Gas Networks, Equinor and Cadent 64 IEAGHG (2017) 65 Holst, Steffen Møller et.al (2016) 66 OED (2016)
19
NCE MARITIME CLEANTECHNorwegian future value chains for liquid hydrogen
20
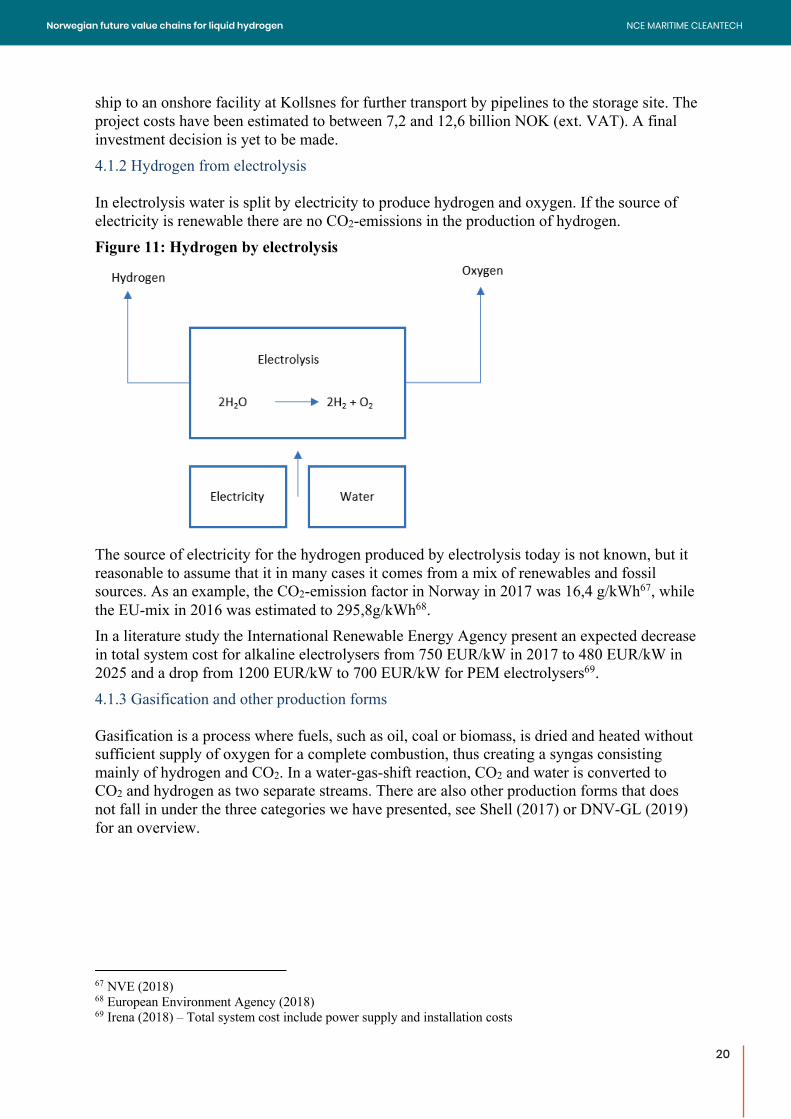
ship to an onshore facility at Kollsnes for further transport by pipelines to the storage site. The project costs have been estimated to between 7,2 and 12,6 billion NOK (ext. VAT). A final investment decision is yet to be made. 4.1.2 Hydrogen from electrolysis In electrolysis water is split by electricity to produce hydrogen and oxygen. If the source of electricity is renewable there are no CO2-emissions in the production of hydrogen. Figure 11: Hydrogen by electrolysis
The source of electricity for the hydrogen produced by electrolysis today is not known, but it reasonable to assume that it in many cases it comes from a mix of renewables and fossil sources. As an example, the CO2-emission factor in Norway in 2017 was 16,4 g/kWh67, while the EU-mix in 2016 was estimated to 295,8g/kWh68. In a literature study the International Renewable Energy Agency present an expected decrease in total system cost for alkaline electrolysers from 750 EUR/kW in 2017 to 480 EUR/kW in 2025 and a drop from 1200 EUR/kW to 700 EUR/kW for PEM electrolysers69. 4.1.3 Gasification and other production forms Gasification is a process where fuels, such as oil, coal or biomass, is dried and heated without sufficient supply of oxygen for a complete combustion, thus creating a syngas consisting mainly of hydrogen and CO2. In a water-gas-shift reaction, CO2 and water is converted to CO2 and hydrogen as two separate streams. There are also other production forms that does not fall in under the three categories we have presented, see Shell (2017) or DNV-GL (2019) for an overview.
67 NVE (2018) 68 European Environment Agency (2018) 69 Irena (2018) – Total system cost include power supply and installation costs
20
NCE MARITIME CLEANTECHNorwegian future value chains for liquid hydrogen
21
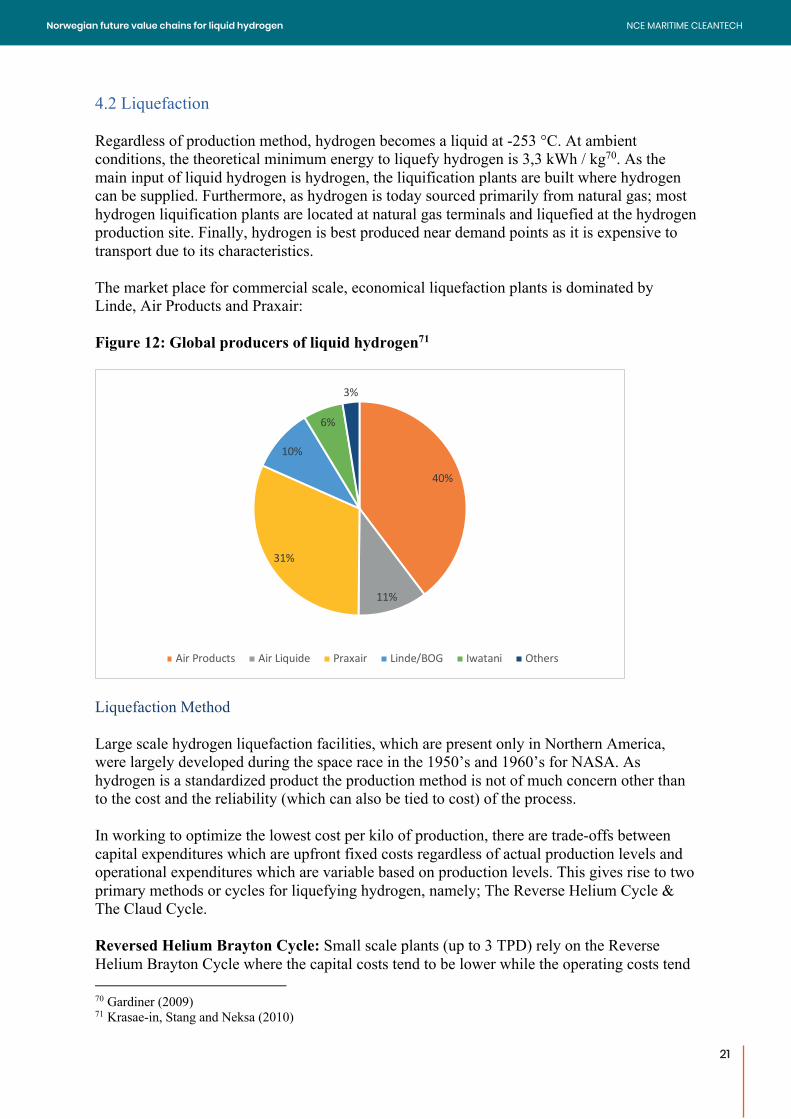
4.2 Liquefaction Regardless of production method, hydrogen becomes a liquid at -253 °C. At ambient conditions, the theoretical minimum energy to liquefy hydrogen is 3,3 kWh / kg70. As the main input of liquid hydrogen is hydrogen, the liquification plants are built where hydrogen can be supplied. Furthermore, as hydrogen is today sourced primarily from natural gas; most hydrogen liquification plants are located at natural gas terminals and liquefied at the hydrogen production site. Finally, hydrogen is best produced near demand points as it is expensive to transport due to its characteristics. The market place for commercial scale, economical liquefaction plants is dominated by Linde, Air Products and Praxair: Figure 12: Global producers of liquid hydrogen71
Liquefaction Method Large scale hydrogen liquefaction facilities, which are present only in Northern America, were largely developed during the space race in the 1950’s and 1960’s for NASA. As hydrogen is a standardized product the production method is not of much concern other than to the cost and the reliability (which can also be tied to cost) of the process. In working to optimize the lowest cost per kilo of production, there are trade-offs between capital expenditures which are upfront fixed costs regardless of actual production levels and operational expenditures which are variable based on production levels. This gives rise to two primary methods or cycles for liquefying hydrogen, namely; The Reverse Helium Cycle & The Claud Cycle. Reversed Helium Brayton Cycle: Small scale plants (up to 3 TPD) rely on the Reverse Helium Brayton Cycle where the capital costs tend to be lower while the operating costs tend
70 Gardiner (2009) 71 Krasae-in, Stang and Neksa (2010)
40%
11%
31%
10%
6%
3%
Air Products Air Liquide Praxair Linde/BOG Iwatani Others
21
NCE MARITIME CLEANTECHNorwegian future value chains for liquid hydrogen
22
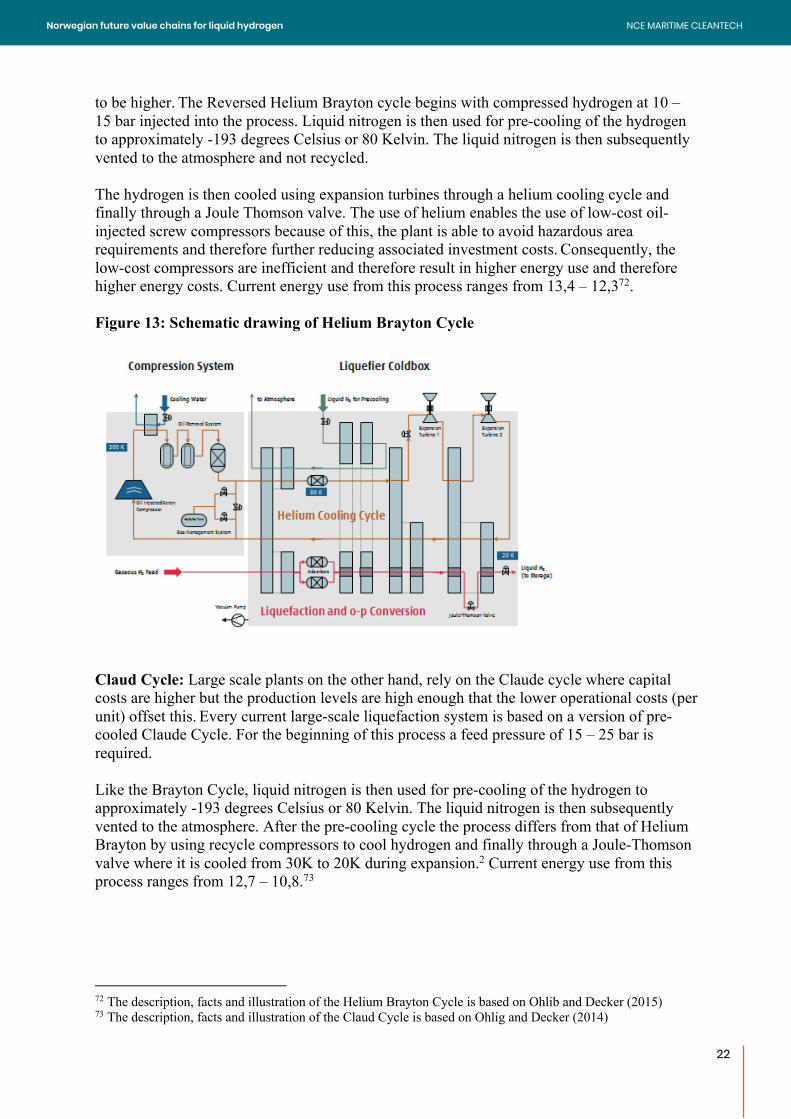
to be higher. The Reversed Helium Brayton cycle begins with compressed hydrogen at 10 – 15 bar injected into the process. Liquid nitrogen is then used for pre-cooling of the hydrogen to approximately -193 degrees Celsius or 80 Kelvin. The liquid nitrogen is then subsequently vented to the atmosphere and not recycled. The hydrogen is then cooled using expansion turbines through a helium cooling cycle and finally through a Joule Thomson valve. The use of helium enables the use of low-cost oil-injected screw compressors because of this, the plant is able to avoid hazardous area requirements and therefore further reducing associated investment costs. Consequently, the low-cost compressors are inefficient and therefore result in higher energy use and therefore higher energy costs. Current energy use from this process ranges from 13,4 – 12,372. Figure 13: Schematic drawing of Helium Brayton Cycle
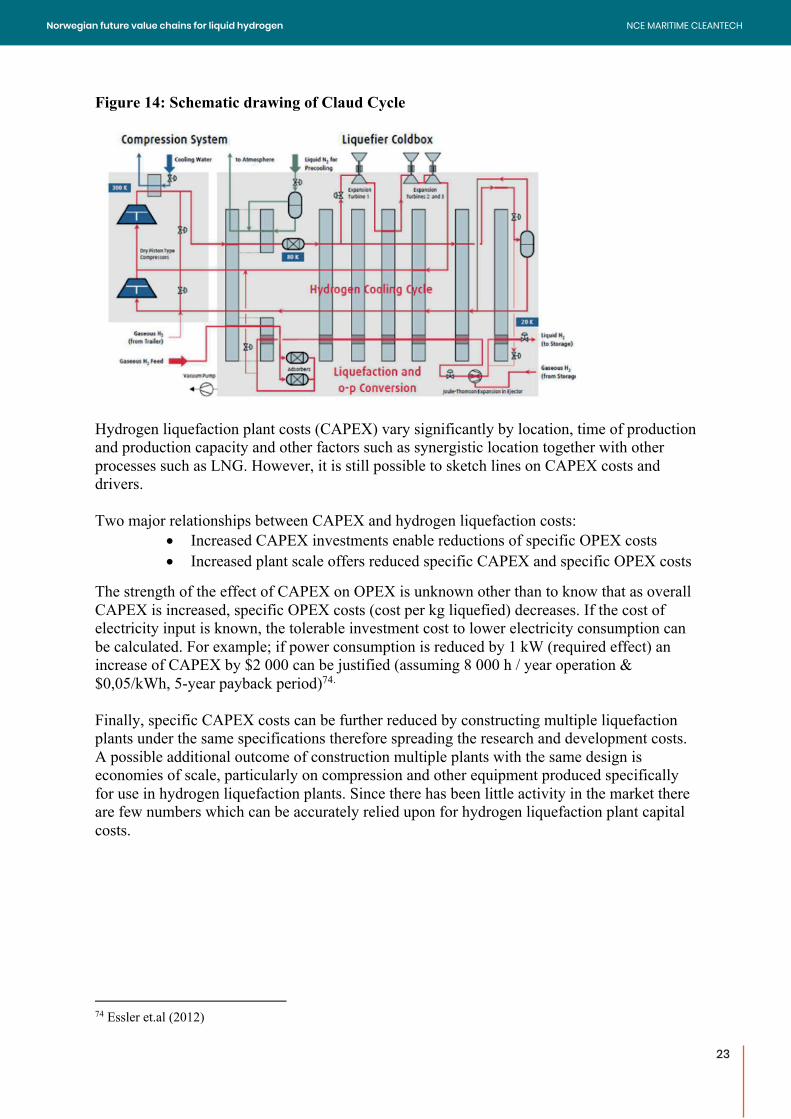
Claud Cycle: Large scale plants on the other hand, rely on the Claude cycle where capital costs are higher but the production levels are high enough that the lower operational costs (per unit) offset this. Every current large-scale liquefaction system is based on a version of pre-cooled Claude Cycle. For the beginning of this process a feed pressure of 15 – 25 bar is required. Like the Brayton Cycle, liquid nitrogen is then used for pre-cooling of the hydrogen to approximately -193 degrees Celsius or 80 Kelvin. The liquid nitrogen is then subsequently vented to the atmosphere. After the pre-cooling cycle the process differs from that of Helium Brayton by using recycle compressors to cool hydrogen and finally through a Joule-Thomson valve where it is cooled from 30K to 20K during expansion.2 Current energy use from this process ranges from 12,7 – 10,8.73
72 The description, facts and illustration of the Helium Brayton Cycle is based on Ohlib and Decker (2015) 73 The description, facts and illustration of the Claud Cycle is based on Ohlig and Decker (2014)
22
NCE MARITIME CLEANTECHNorwegian future value chains for liquid hydrogen
23
Figure 14: Schematic drawing of Claud Cycle
Hydrogen liquefaction plant costs (CAPEX) vary significantly by location, time of production and production capacity and other factors such as synergistic location together with other processes such as LNG. However, it is still possible to sketch lines on CAPEX costs and drivers. Two major relationships between CAPEX and hydrogen liquefaction costs:
• Increased CAPEX investments enable reductions of specific OPEX costs • Increased plant scale offers reduced specific CAPEX and specific OPEX costs
The strength of the effect of CAPEX on OPEX is unknown other than to know that as overall CAPEX is increased, specific OPEX costs (cost per kg liquefied) decreases. If the cost of electricity input is known, the tolerable investment cost to lower electricity consumption can be calculated. For example; if power consumption is reduced by 1 kW (required effect) an increase of CAPEX by $2 000 can be justified (assuming 8 000 h / year operation & $0,05/kWh, 5-year payback period)74. Finally, specific CAPEX costs can be further reduced by constructing multiple liquefaction plants under the same specifications therefore spreading the research and development costs. A possible additional outcome of construction multiple plants with the same design is economies of scale, particularly on compression and other equipment produced specifically for use in hydrogen liquefaction plants. Since there has been little activity in the market there are few numbers which can be accurately relied upon for hydrogen liquefaction plant capital costs.
74 Essler et.al (2012)
23
NCE MARITIME CLEANTECHNorwegian future value chains for liquid hydrogen
24
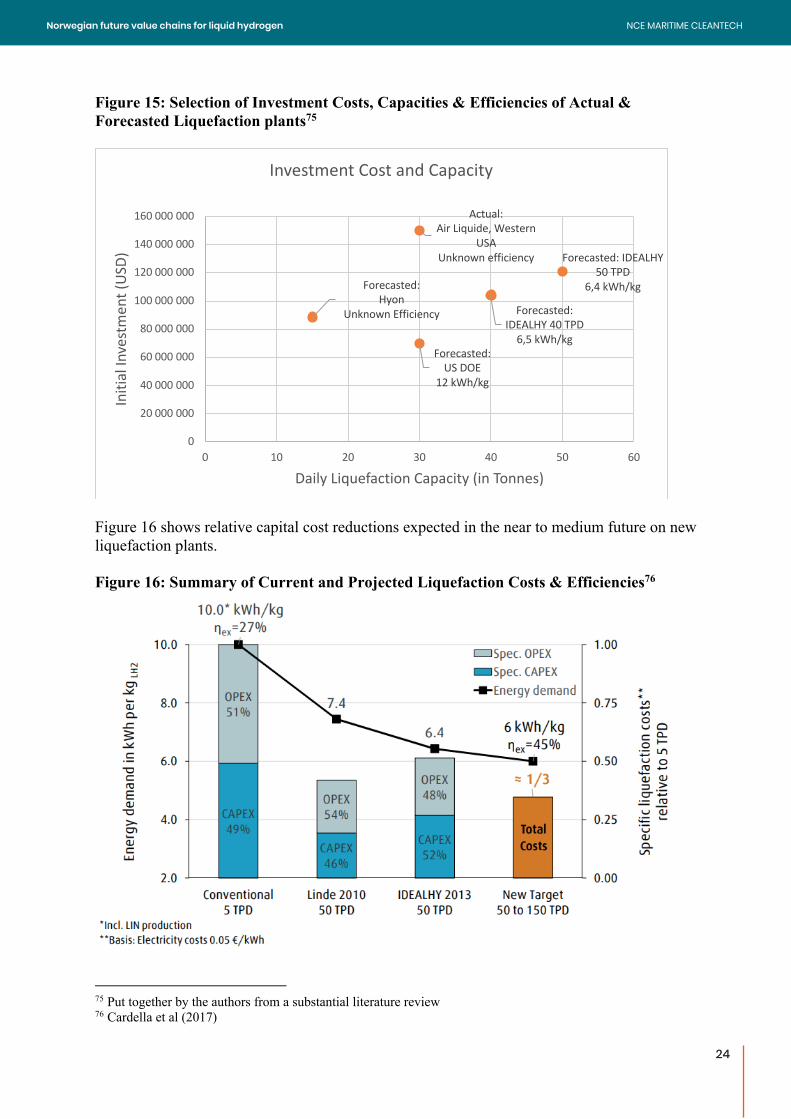
Figure 15: Selection of Investment Costs, Capacities & Efficiencies of Actual & Forecasted Liquefaction plants75
Figure 16 shows relative capital cost reductions expected in the near to medium future on new liquefaction plants. Figure 16: Summary of Current and Projected Liquefaction Costs & Efficiencies76
75 Put together by the authors from a substantial literature review 76 Cardella et al (2017)
Actual:
Air Liquide, Western
USA
Unknown efficiency Forecasted: IDEALHY
50 TPD
6,4 kWh/kg
Forecasted:
IDEALHY 40 TPD
6,5 kWh/kg
Forecasted:
US DOE
12 kWh/kg
Forecasted:
Hyon
Unknown Efficiency
0
20 000 000
40 000 000
60 000 000
80 000 000
100 000 000
120 000 000
140 000 000
160 000 000
0 10 20 30 40 50 60
Init
ial
Inve
stm
en
t (
US
D)
Daily Liquefaction Capacity (in Tonnes)
Investment Cost and Capacity
24
NCE MARITIME CLEANTECHNorwegian future value chains for liquid hydrogen
25
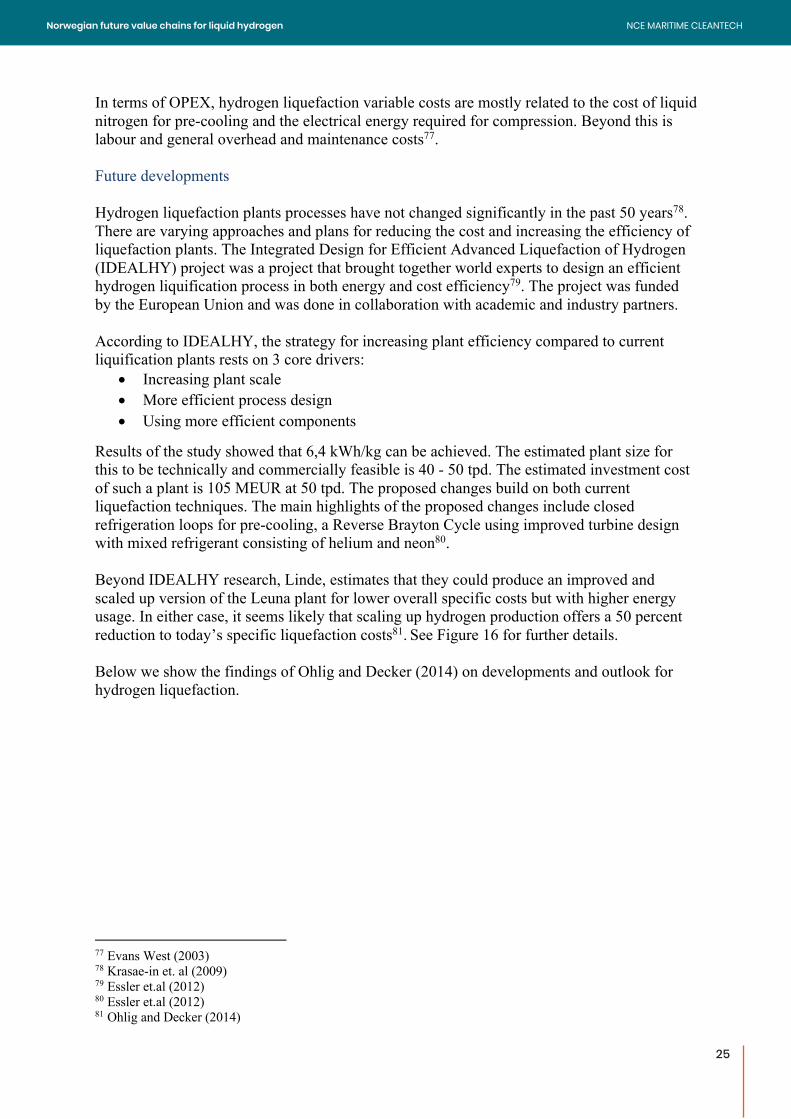
In terms of OPEX, hydrogen liquefaction variable costs are mostly related to the cost of liquid nitrogen for pre-cooling and the electrical energy required for compression. Beyond this is labour and general overhead and maintenance costs77.
Future developments Hydrogen liquefaction plants processes have not changed significantly in the past 50 years78. There are varying approaches and plans for reducing the cost and increasing the efficiency of liquefaction plants. The Integrated Design for Efficient Advanced Liquefaction of Hydrogen (IDEALHY) project was a project that brought together world experts to design an efficient hydrogen liquification process in both energy and cost efficiency79. The project was funded by the European Union and was done in collaboration with academic and industry partners. According to IDEALHY, the strategy for increasing plant efficiency compared to current liquification plants rests on 3 core drivers:
• Increasing plant scale • More efficient process design • Using more efficient components
Results of the study showed that 6,4 kWh/kg can be achieved. The estimated plant size for this to be technically and commercially feasible is 40 - 50 tpd. The estimated investment cost of such a plant is 105 MEUR at 50 tpd. The proposed changes build on both current liquefaction techniques. The main highlights of the proposed changes include closed refrigeration loops for pre-cooling, a Reverse Brayton Cycle using improved turbine design with mixed refrigerant consisting of helium and neon80. Beyond IDEALHY research, Linde, estimates that they could produce an improved and scaled up version of the Leuna plant for lower overall specific costs but with higher energy usage. In either case, it seems likely that scaling up hydrogen production offers a 50 percent reduction to today’s specific liquefaction costs81. See Figure 16 for further details. Below we show the findings of Ohlig and Decker (2014) on developments and outlook for hydrogen liquefaction.
77 Evans West (2003) 78 Krasae-in et. al (2009) 79 Essler et.al (2012) 80 Essler et.al (2012) 81 Ohlig and Decker (2014)
25
NCE MARITIME CLEANTECHNorwegian future value chains for liquid hydrogen
26
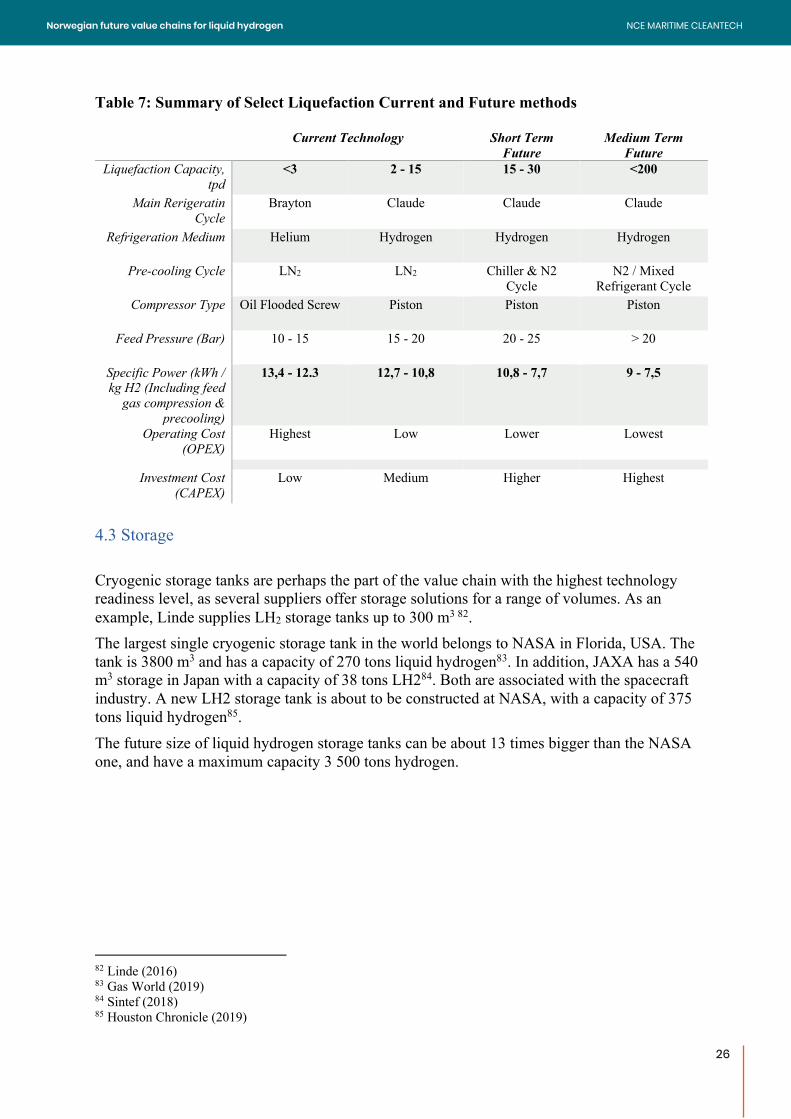
Table 7: Summary of Select Liquefaction Current and Future methods
Current Technology Short Term Future
Medium Term Future
Liquefaction Capacity, tpd
<3 2 - 15 15 - 30 <200
Main Rerigeratin Cycle
Brayton Claude Claude Claude
Refrigeration Medium Helium Hydrogen Hydrogen Hydrogen
Pre-cooling Cycle LN2 LN2 Chiller & N2 Cycle
N2 / Mixed Refrigerant Cycle
Compressor Type Oil Flooded Screw Piston Piston Piston
Feed Pressure (Bar) 10 - 15 15 - 20 20 - 25 > 20
Specific Power (kWh / kg H2 (Including feed
gas compression & precooling)
13,4 - 12.3 12,7 - 10,8 10,8 - 7,7 9 - 7,5
Operating Cost (OPEX)
Highest Low Lower Lowest
Investment Cost (CAPEX)
Low Medium Higher Highest
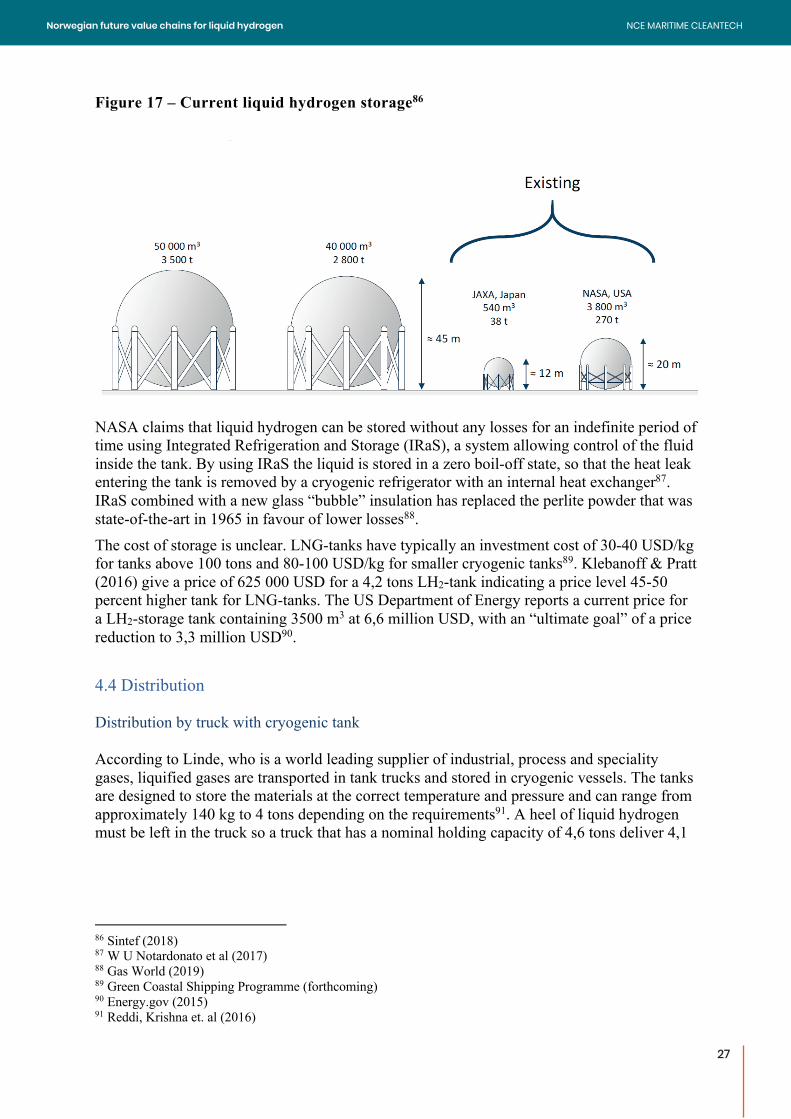
4.3 Storage Cryogenic storage tanks are perhaps the part of the value chain with the highest technology readiness level, as several suppliers offer storage solutions for a range of volumes. As an example, Linde supplies LH2 storage tanks up to 300 m3 82. The largest single cryogenic storage tank in the world belongs to NASA in Florida, USA. The tank is 3800 m3 and has a capacity of 270 tons liquid hydrogen83. In addition, JAXA has a 540 m3 storage in Japan with a capacity of 38 tons LH284. Both are associated with the spacecraft industry. A new LH2 storage tank is about to be constructed at NASA, with a capacity of 375 tons liquid hydrogen85. The future size of liquid hydrogen storage tanks can be about 13 times bigger than the NASA one, and have a maximum capacity 3 500 tons hydrogen.
82 Linde (2016) 83 Gas World (2019) 84 Sintef (2018) 85 Houston Chronicle (2019)
26
NCE MARITIME CLEANTECHNorwegian future value chains for liquid hydrogen
27
Figure 17 – Current liquid hydrogen storage86
NASA claims that liquid hydrogen can be stored without any losses for an indefinite period of time using Integrated Refrigeration and Storage (IRaS), a system allowing control of the fluid inside the tank. By using IRaS the liquid is stored in a zero boil-off state, so that the heat leak entering the tank is removed by a cryogenic refrigerator with an internal heat exchanger87. IRaS combined with a new glass “bubble” insulation has replaced the perlite powder that was state-of-the-art in 1965 in favour of lower losses88. The cost of storage is unclear. LNG-tanks have typically an investment cost of 30-40 USD/kg for tanks above 100 tons and 80-100 USD/kg for smaller cryogenic tanks89. Klebanoff & Pratt (2016) give a price of 625 000 USD for a 4,2 tons LH2-tank indicating a price level 45-50 percent higher tank for LNG-tanks. The US Department of Energy reports a current price for a LH2-storage tank containing 3500 m3 at 6,6 million USD, with an “ultimate goal” of a price reduction to 3,3 million USD90. 4.4 Distribution Distribution by truck with cryogenic tank According to Linde, who is a world leading supplier of industrial, process and speciality gases, liquified gases are transported in tank trucks and stored in cryogenic vessels. The tanks are designed to store the materials at the correct temperature and pressure and can range from approximately 140 kg to 4 tons depending on the requirements91. A heel of liquid hydrogen must be left in the truck so a truck that has a nominal holding capacity of 4,6 tons deliver 4,1
86 Sintef (2018) 87 W U Notardonato et al (2017) 88 Gas World (2019) 89 Green Coastal Shipping Programme (forthcoming) 90 Energy.gov (2015) 91 Reddi, Krishna et. al (2016)
27
NCE MARITIME CLEANTECHNorwegian future value chains for liquid hydrogen
28
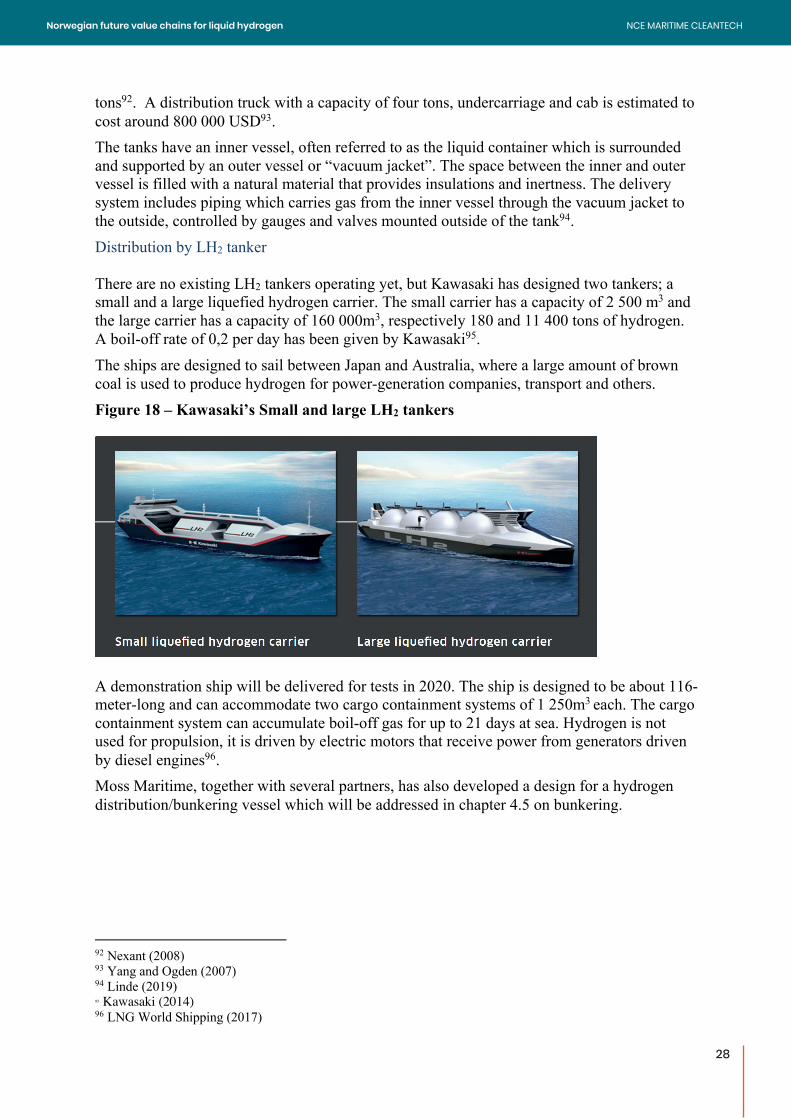
tons92. A distribution truck with a capacity of four tons, undercarriage and cab is estimated to cost around 800 000 USD93. The tanks have an inner vessel, often referred to as the liquid container which is surrounded and supported by an outer vessel or “vacuum jacket”. The space between the inner and outer vessel is filled with a natural material that provides insulations and inertness. The delivery system includes piping which carries gas from the inner vessel through the vacuum jacket to the outside, controlled by gauges and valves mounted outside of the tank94. Distribution by LH2 tanker There are no existing LH2 tankers operating yet, but Kawasaki has designed two tankers; a small and a large liquefied hydrogen carrier. The small carrier has a capacity of 2 500 m3 and the large carrier has a capacity of 160 000m3, respectively 180 and 11 400 tons of hydrogen. A boil-off rate of 0,2 per day has been given by Kawasaki95. The ships are designed to sail between Japan and Australia, where a large amount of brown coal is used to produce hydrogen for power-generation companies, transport and others. Figure 18 – Kawasaki’s Small and large LH2 tankers
A demonstration ship will be delivered for tests in 2020. The ship is designed to be about 116-meter-long and can accommodate two cargo containment systems of 1 250m3 each. The cargo containment system can accumulate boil-off gas for up to 21 days at sea. Hydrogen is not used for propulsion, it is driven by electric motors that receive power from generators driven by diesel engines96. Moss Maritime, together with several partners, has also developed a design for a hydrogen distribution/bunkering vessel which will be addressed in chapter 4.5 on bunkering.
92 Nexant (2008) 93 Yang and Ogden (2007) 94 Linde (2019) 95 Kawasaki (2014) 96 LNG World Shipping (2017)
28
NCE MARITIME CLEANTECHNorwegian future value chains for liquid hydrogen
29
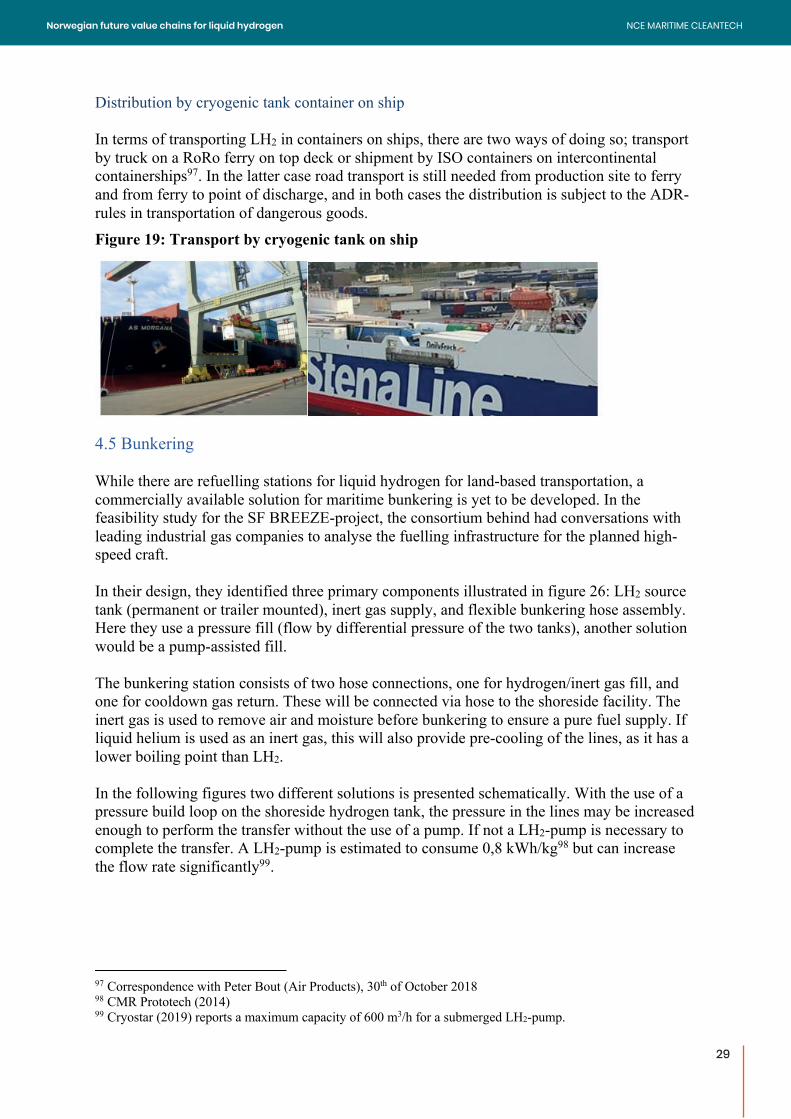
Distribution by cryogenic tank container on ship In terms of transporting LH2 in containers on ships, there are two ways of doing so; transport by truck on a RoRo ferry on top deck or shipment by ISO containers on intercontinental containerships97. In the latter case road transport is still needed from production site to ferry and from ferry to point of discharge, and in both cases the distribution is subject to the ADR-rules in transportation of dangerous goods. Figure 19: Transport by cryogenic tank on ship
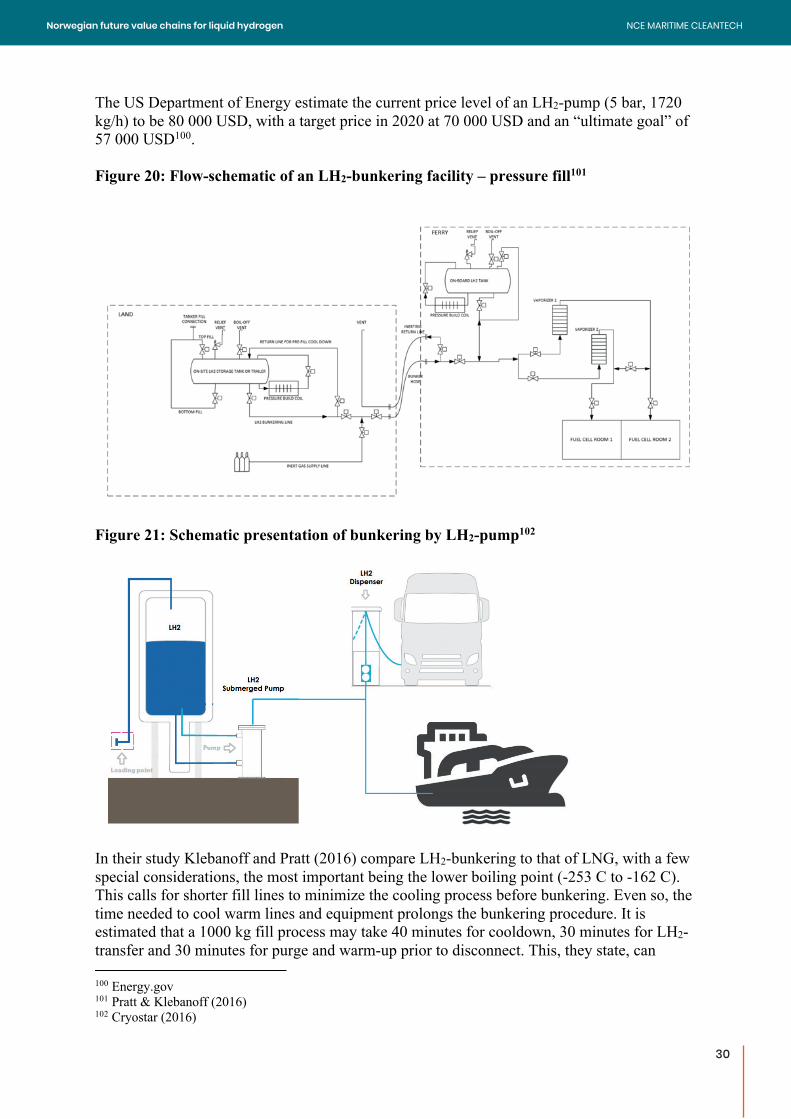
4.5 Bunkering While there are refuelling stations for liquid hydrogen for land-based transportation, a commercially available solution for maritime bunkering is yet to be developed. In the feasibility study for the SF BREEZE-project, the consortium behind had conversations with leading industrial gas companies to analyse the fuelling infrastructure for the planned high-speed craft. In their design, they identified three primary components illustrated in figure 26: LH2 source tank (permanent or trailer mounted), inert gas supply, and flexible bunkering hose assembly. Here they use a pressure fill (flow by differential pressure of the two tanks), another solution would be a pump-assisted fill. The bunkering station consists of two hose connections, one for hydrogen/inert gas fill, and one for cooldown gas return. These will be connected via hose to the shoreside facility. The inert gas is used to remove air and moisture before bunkering to ensure a pure fuel supply. If liquid helium is used as an inert gas, this will also provide pre-cooling of the lines, as it has a lower boiling point than LH2. In the following figures two different solutions is presented schematically. With the use of a pressure build loop on the shoreside hydrogen tank, the pressure in the lines may be increased enough to perform the transfer without the use of a pump. If not a LH2-pump is necessary to complete the transfer. A LH2-pump is estimated to consume 0,8 kWh/kg98 but can increase the flow rate significantly99.
97 Correspondence with Peter Bout (Air Products), 30th of October 2018 98 CMR Prototech (2014) 99 Cryostar (2019) reports a maximum capacity of 600 m3/h for a submerged LH2-pump.
29
NCE MARITIME CLEANTECHNorwegian future value chains for liquid hydrogen
30
The US Department of Energy estimate the current price level of an LH2-pump (5 bar, 1720 kg/h) to be 80 000 USD, with a target price in 2020 at 70 000 USD and an “ultimate goal” of 57 000 USD100. Figure 20: Flow-schematic of an LH2-bunkering facility – pressure fill101
Figure 21: Schematic presentation of bunkering by LH2-pump102
In their study Klebanoff and Pratt (2016) compare LH2-bunkering to that of LNG, with a few special considerations, the most important being the lower boiling point (-253 C to -162 C). This calls for shorter fill lines to minimize the cooling process before bunkering. Even so, the time needed to cool warm lines and equipment prolongs the bunkering procedure. It is estimated that a 1000 kg fill process may take 40 minutes for cooldown, 30 minutes for LH2-transfer and 30 minutes for purge and warm-up prior to disconnect. This, they state, can
100 Energy.gov 101 Pratt & Klebanoff (2016) 102 Cryostar (2016)
30
NCE MARITIME CLEANTECHNorwegian future value chains for liquid hydrogen
31
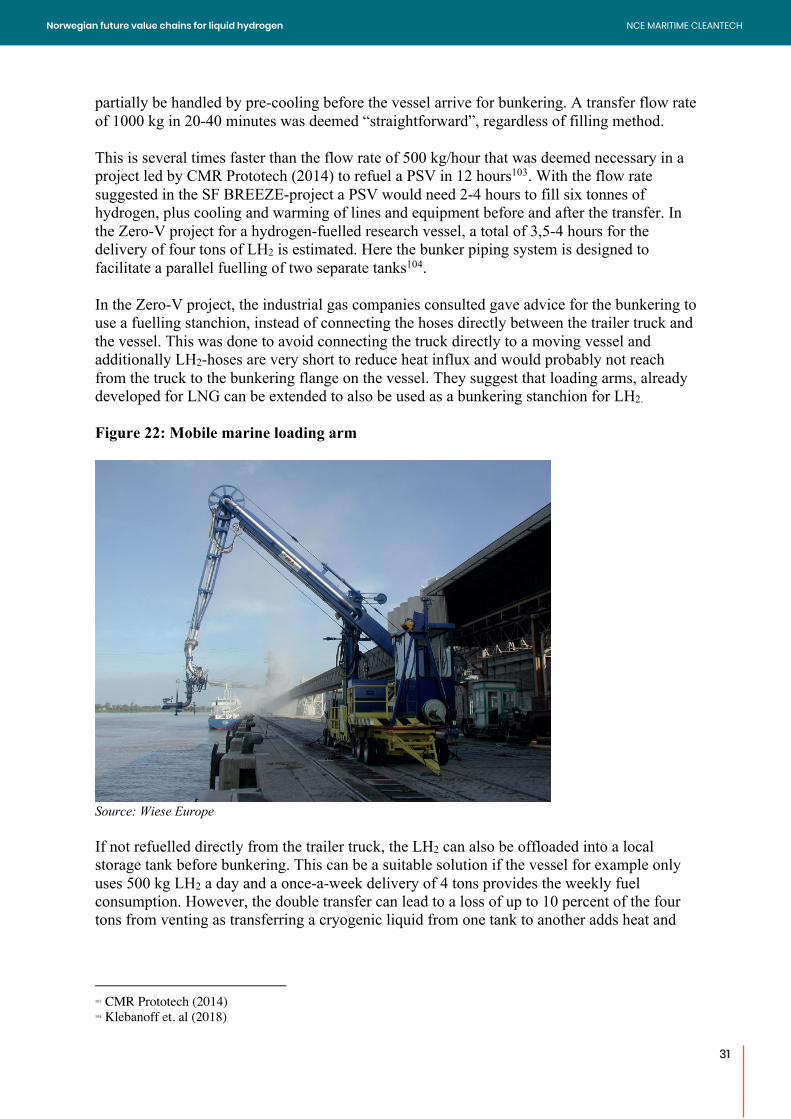
partially be handled by pre-cooling before the vessel arrive for bunkering. A transfer flow rate of 1000 kg in 20-40 minutes was deemed “straightforward”, regardless of filling method. This is several times faster than the flow rate of 500 kg/hour that was deemed necessary in a project led by CMR Prototech (2014) to refuel a PSV in 12 hours103. With the flow rate suggested in the SF BREEZE-project a PSV would need 2-4 hours to fill six tonnes of hydrogen, plus cooling and warming of lines and equipment before and after the transfer. In the Zero-V project for a hydrogen-fuelled research vessel, a total of 3,5-4 hours for the delivery of four tons of LH2 is estimated. Here the bunker piping system is designed to facilitate a parallel fuelling of two separate tanks104. In the Zero-V project, the industrial gas companies consulted gave advice for the bunkering to use a fuelling stanchion, instead of connecting the hoses directly between the trailer truck and the vessel. This was done to avoid connecting the truck directly to a moving vessel and additionally LH2-hoses are very short to reduce heat influx and would probably not reach from the truck to the bunkering flange on the vessel. They suggest that loading arms, already developed for LNG can be extended to also be used as a bunkering stanchion for LH2. Figure 22: Mobile marine loading arm
Source: Wiese Europe If not refuelled directly from the trailer truck, the LH2 can also be offloaded into a local storage tank before bunkering. This can be a suitable solution if the vessel for example only uses 500 kg LH2 a day and a once-a-week delivery of 4 tons provides the weekly fuel consumption. However, the double transfer can lead to a loss of up to 10 percent of the four tons from venting as transferring a cryogenic liquid from one tank to another adds heat and
103 CMR Prototech (2014) 104 Klebanoff et. al (2018)
31
NCE MARITIME CLEANTECHNorwegian future value chains for liquid hydrogen
32
causes vaporization105. In the table below Klebanoff and Pratt (2016) have estimated infrastructure cost for the two alternatives. Table 8: Estimated cost for bunkering solution using pressure fill
Solution Piping and manifold
Permits and License fees
On-site storage tank (4,2 tons/LH2)
Total
Truck-to-vessel 770 000 USD 200 000 USD 970 000 USD Tank-to-vessel 770 000 USD 200 000 USD 625 000 USD 1 595 000 USD
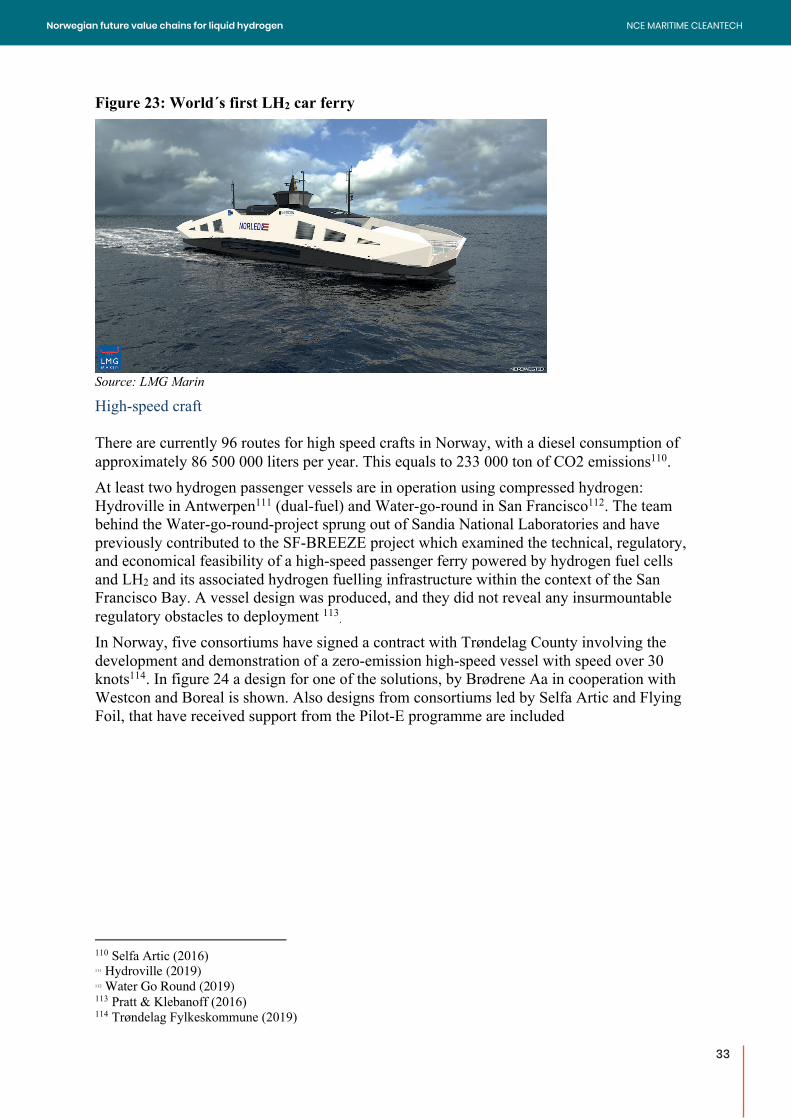
Bunkering is also possible with a ship-to-ship solution. Moss Maritime, in cooperation with Equinor, Wilhelmsen, Viking Cruises and DNV-GL, has developed a design for LH2 bunker vessel. According to Moss Maritime, the vessel has a cargo capacity of 9 000 m3, 640 tons, and will provide LH2 bunkering services to merchant ships, in addition to open sea transport106. The total LH2 storage onboard the vessel shall enable delivery of minimum 500 tons of LH2 after laden voyage of maximum 25 days107. The cargo containment system shall consist of two 4 500 m3 tanks. The LH2 bunker vessel will be loaded at a liquefication terminal, with the vessel berthed at a jetty. Offloading will take place in side-by-side mode to receiving vessels, or at a jetty if delivering to onshore receiving terminals. In their technical evaluation they find that for all critical equipment, with the exception of compressors and blowers for tank warming, potential vendors/manufacturers have confirmed that “existing equipment for LNG may be modified and adapted for LH2 after further engineering and testing”. 4.6 End users The sections below highlight state-of-the-art projects with LH2 among our three groups of vessels as well as some relevant vessels using compressed hydrogen and on-going projects. Car ferry Norway has 128 operating ferry routes, with most of them located in Hordaland, Møre & Romsdal and Nordland. The world´s first car ferry running on LH2, will be put into operation between Hjelmeland and Nesvik on April 15th of 2021. The ferry will get a minimum of 50 percent of the energy supplied by LH2 while the remaining energy need is provided by batteries.108. The plan is to refuel the ferry with 4 tons of LH2 every other week. The ferry is operated and built by Norled, with LMG Marin, Westcon Power and Automation, Prototech, Ballard Power Systems and Linde Engineering as important partners. It not yet decided which shipyard will build the ferry which can hold 299 passengers and 80 cars109.
105 Pratt & Klebanoff (2016) 106 Wilhelmsen (2019) 107 Moss Maritime (2018) 108 NCE Maritime CleanTech (2018) 109 Norled (2018) and (2019)
32
NCE MARITIME CLEANTECHNorwegian future value chains for liquid hydrogen
33
Figure 23: World´s first LH2 car ferry
Source: LMG Marin
High-speed craft There are currently 96 routes for high speed crafts in Norway, with a diesel consumption of approximately 86 500 000 liters per year. This equals to 233 000 ton of CO2 emissions110. At least two hydrogen passenger vessels are in operation using compressed hydrogen: Hydroville in Antwerpen111 (dual-fuel) and Water-go-round in San Francisco112. The team behind the Water-go-round-project sprung out of Sandia National Laboratories and have previously contributed to the SF-BREEZE project which examined the technical, regulatory, and economical feasibility of a high-speed passenger ferry powered by hydrogen fuel cells and LH2 and its associated hydrogen fuelling infrastructure within the context of the San Francisco Bay. A vessel design was produced, and they did not reveal any insurmountable regulatory obstacles to deployment 113.
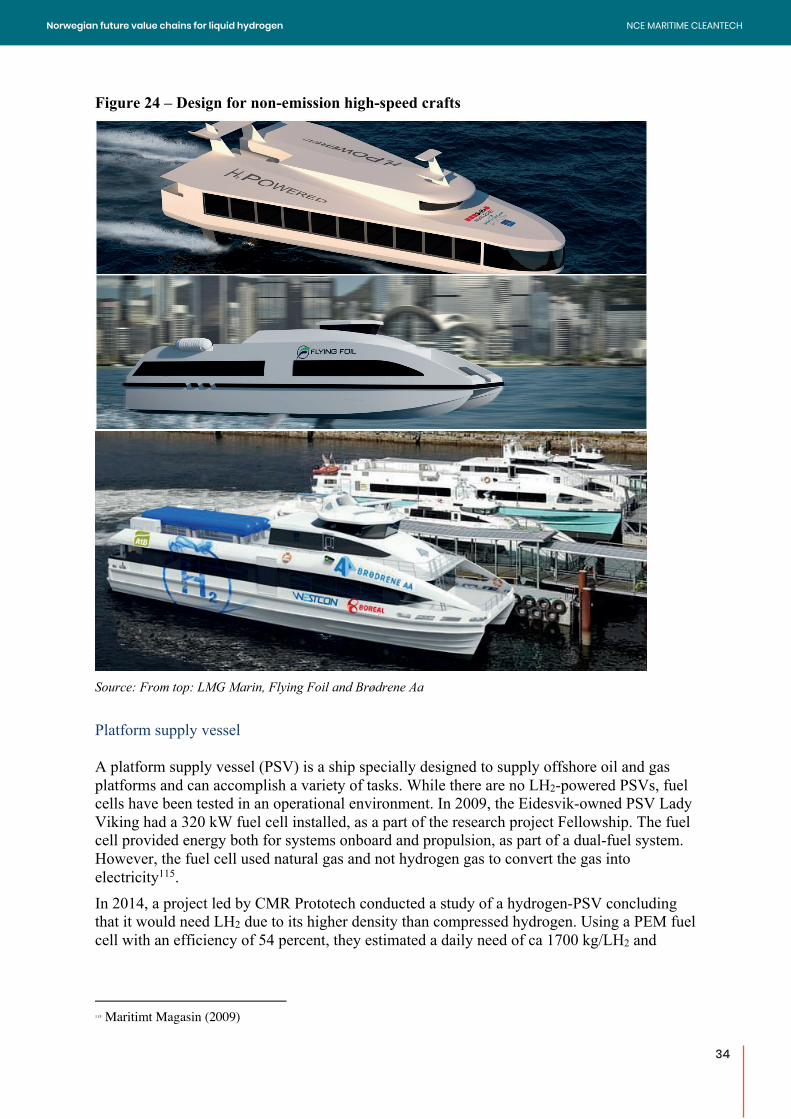
In Norway, five consortiums have signed a contract with Trøndelag County involving the development and demonstration of a zero-emission high-speed vessel with speed over 30 knots114. In figure 24 a design for one of the solutions, by Brødrene Aa in cooperation with Westcon and Boreal is shown. Also designs from consortiums led by Selfa Artic and Flying Foil, that have received support from the Pilot-E programme are included
110 Selfa Artic (2016) 111 Hydroville (2019) 112 Water Go Round (2019) 113 Pratt & Klebanoff (2016) 114 Trøndelag Fylkeskommune (2019)
33
NCE MARITIME CLEANTECHNorwegian future value chains for liquid hydrogen
34
Figure 24 – Design for non-emission high-speed crafts
Source: From top: LMG Marin, Flying Foil and Brødrene Aa Platform supply vessel A platform supply vessel (PSV) is a ship specially designed to supply offshore oil and gas platforms and can accomplish a variety of tasks. While there are no LH2-powered PSVs, fuel cells have been tested in an operational environment. In 2009, the Eidesvik-owned PSV Lady Viking had a 320 kW fuel cell installed, as a part of the research project Fellowship. The fuel cell provided energy both for systems onboard and propulsion, as part of a dual-fuel system. However, the fuel cell used natural gas and not hydrogen gas to convert the gas into electricity115. In 2014, a project led by CMR Prototech conducted a study of a hydrogen-PSV concluding that it would need LH2 due to its higher density than compressed hydrogen. Using a PEM fuel cell with an efficiency of 54 percent, they estimated a daily need of ca 1700 kg/LH2 and
115 Maritimt Magasin (2009)
34
NCE MARITIME CLEANTECHNorwegian future value chains for liquid hydrogen
35
suggested either refuelling of 12 tons once a week or 6 tons twice a week, with a corresponding onboard storage need of 192 or 108 m3116. Currently a cluster project by NCE Maritime Cleantech, Equinor and Wärtsila Ship Design is developing a concept for a hydrogen driven platform supply vessel that can serve the oil & gas industry in the North Sea. The energy system will be based on a combination of batteries and hydrogen fuel cells117. Other Viking Cruises, a Norwegian shipping company, is working on a project for what could become the world’s first cruise ship with zero emission technology. The ship will be around 230 meters long and fuelled by liquid hydrogen. It has a capacity to accommodate more than 900 passengers and a crew of 500. According to the Norwegian Maritime Authority, Viking Cruises has been in dialog with Equinor on delivery of hydrogen118. Royal Caribbean Cruises Lines has previously presented the energy consumption for a large cruise ship and what it would need of hydrogen supply. They estimate about 240 MWh for hotel and 240 MWh for propulsion per day – a combined 480 MWh of energy per day. According to their calculations a battery solution would have a weight of at least 6200 tons and a size of 10 000 m3. If the same energy consumption is covered by hydrogen, they estimate about 30 tons of hydrogen per day and a need for 6000 m3 of storage for two weeks of fuel autonomy. With a density of 71 kg LH2/m3 that gives a total hydrogen need of 426 tons for a two week stretch119. Another example is the work done by the Norwegian shipowner Havila for preparing their new ships operating the coastal route (Kystruten) from Bergen to Kirkenes. They have recently received over 100 million NOK to further research a fuel cell solution that can enable the vessels to operate in non-emission zones, such as World Heritage Areas120. In the US, a design for a hydrogen-driven research vessel was presented in 2018. The Zero-V has 10 900 kg of consumable LH2 stored in two tanks, for parallel refuelling, and a range of 2400 nautical miles121. The Norwegian support scheme Pilot-E has also supported a smaller containership called Seashuttle that will use compressed hydrogen122.
4.7 Energy efficiency throughout the value chain The hydrogen value chain has energy losses from energy input in the production phase to the efficiency of the powertrain onboard the end user. Through a literature review we have estimated the energy efficiency from production to propeller for both electrolysis and gas reformation with carbon capture. According to IRENAs latest report an alkaline electrolyser today has an energy use of 51 kWh/kg gaseous hydrogen, giving it an efficiency of 65 percent. A liquefaction plant like Lindes Leuna facility with an energy use of 11,9 kWh/kg LH2 has an efficiency of about 74
116 CMR Prototech (2014) 117 NCE Maritime CleanTech (2019) 118 Norwegian Maritime Authority (2017) 119 Royal Caribbean Cruises (2018) 120 Sintef (2018b) 121 Klebanoff et. al (2018) 122 Teknisk Ukeblad (2019a)
35
NCE MARITIME CLEANTECHNorwegian future value chains for liquid hydrogen
36
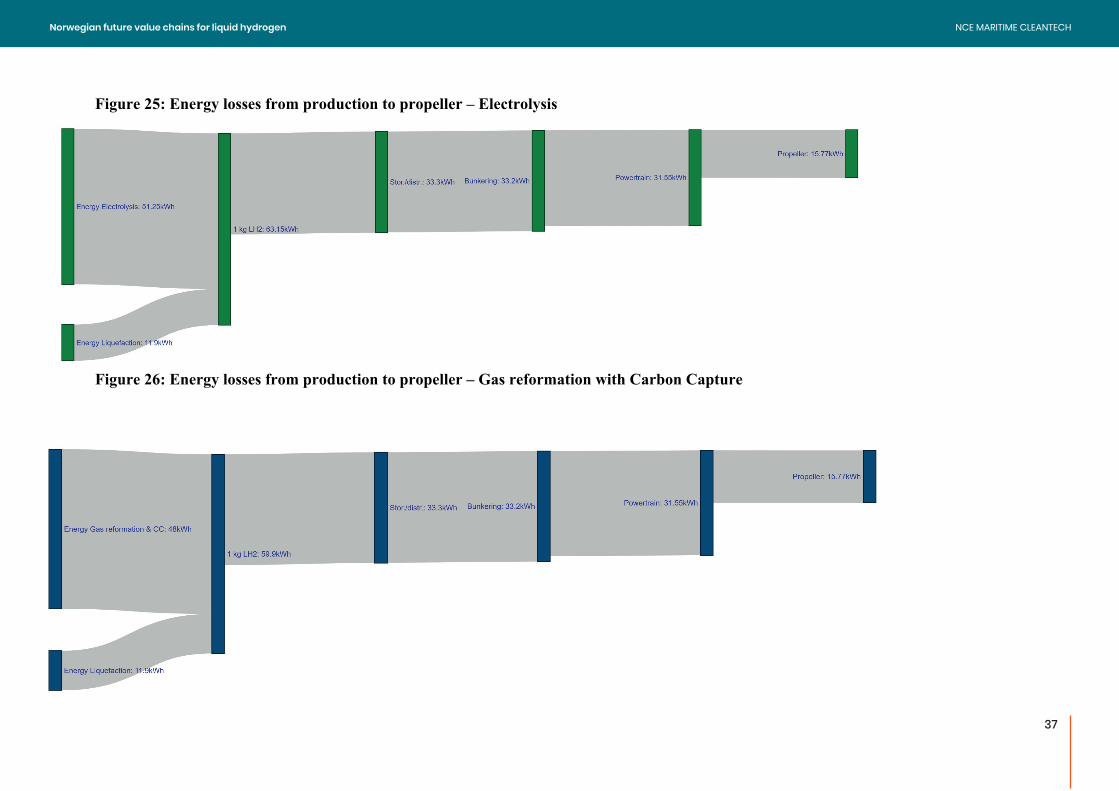
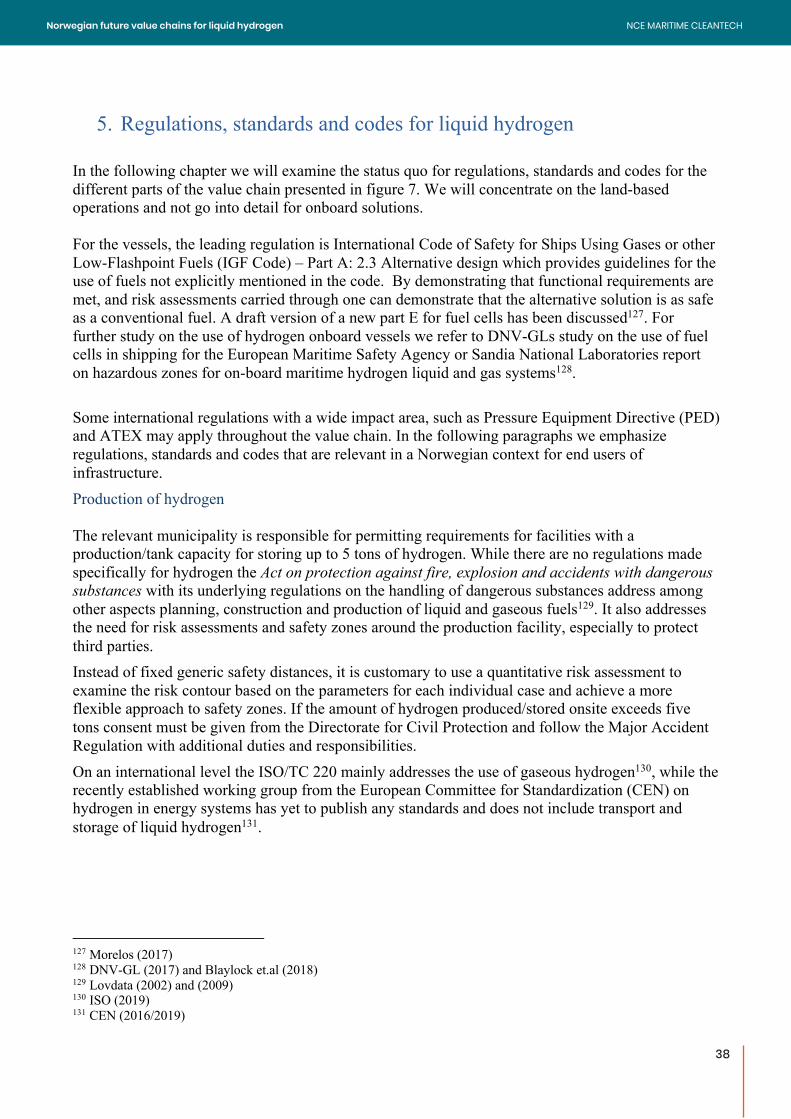
percent123. With a total energy input of 63 kWh/LH2 and a lower heating value of 33,3 kWh/kg LH2, the energy efficiency to produce 1 kg LH2 is 52 percent. When produced through gas reformation the estimated energy needed to produce 1 kg of gaseous hydrogen with carbon capture is 48 kWh/kg, with 11,9 kWh/kg for liquefaction. Thus, the energy efficiency of the production phase is 55,5 percent, slightly better than by electrolysis. During storage and distribution multiple sources estimate a boil-off between 0,2 and 0,5 percent per day. IEA report a boil-off stream of 0,3 percent for liquid tankers for hydrogen delivery, while US Drive estimate 0,5 percent for liquid distribution tankers and a very low evaporation rate for large storage. The NASA LH2 tank at Cape Carnaval has a reported evaporation loss of 0,03 percent per day for storage over multiple years. US Drive also report a loss of up to five percent when unloading the LH2 to vessel/local storage124. This is higher than what has been reported by developers/suppliers during the work of this report, which indicate that bunkering with a minimum of losses, towards 1 percent is plausible. As a conservative measure, we have used the 0,3 percent loss for storage/distribution and 5 percent in the bunkering phase. Boil-off during storage on board the vessel is also a potential loss, but according to Air Liquide there are several options to permanently re-use boil of gas and thus eliminate the loss125 or technology that increase the maximum holding time without boil-off126. Lastly, with an estimated efficiency of 50 percent for the fuel cell about 16 kWh of the input energy reach the propeller – thus the complete energy efficiency of the value chain is around 25 percent when produced by electrolysis and 26,5 percent when produced by gas reformation and carbon capture, see appendix for calculations. The energy losses in kWh are visualized in the next figures.
123 Efficiency = LH2 LHV / (LH2 LHV + Liquefaction Energy) 124 IEA (2015), US Drive (2013) 125 Air Liquide (2015b) 126 Linde (2014)
36
NCE MARITIME CLEANTECHNorwegian future value chains for liquid hydrogen
37
Figure 25: Energy losses from production to propeller – Electrolysis
Figure 26: Energy losses from production to propeller – Gas reformation with Carbon Capture
NCE MARITIME CLEANTECHNorwegian future value chains for liquid hydrogen
37
38
5. Regulations, standards and codes for liquid hydrogen In the following chapter we will examine the status quo for regulations, standards and codes for the different parts of the value chain presented in figure 7. We will concentrate on the land-based operations and not go into detail for onboard solutions. For the vessels, the leading regulation is International Code of Safety for Ships Using Gases or other Low-Flashpoint Fuels (IGF Code) – Part A: 2.3 Alternative design which provides guidelines for the use of fuels not explicitly mentioned in the code. By demonstrating that functional requirements are met, and risk assessments carried through one can demonstrate that the alternative solution is as safe as a conventional fuel. A draft version of a new part E for fuel cells has been discussed127. For further study on the use of hydrogen onboard vessels we refer to DNV-GLs study on the use of fuel cells in shipping for the European Maritime Safety Agency or Sandia National Laboratories report on hazardous zones for on-board maritime hydrogen liquid and gas systems128. Some international regulations with a wide impact area, such as Pressure Equipment Directive (PED) and ATEX may apply throughout the value chain. In the following paragraphs we emphasize regulations, standards and codes that are relevant in a Norwegian context for end users of infrastructure. Production of hydrogen The relevant municipality is responsible for permitting requirements for facilities with a production/tank capacity for storing up to 5 tons of hydrogen. While there are no regulations made specifically for hydrogen the Act on protection against fire, explosion and accidents with dangerous substances with its underlying regulations on the handling of dangerous substances address among other aspects planning, construction and production of liquid and gaseous fuels129. It also addresses the need for risk assessments and safety zones around the production facility, especially to protect third parties. Instead of fixed generic safety distances, it is customary to use a quantitative risk assessment to examine the risk contour based on the parameters for each individual case and achieve a more flexible approach to safety zones. If the amount of hydrogen produced/stored onsite exceeds five tons consent must be given from the Directorate for Civil Protection and follow the Major Accident Regulation with additional duties and responsibilities. On an international level the ISO/TC 220 mainly addresses the use of gaseous hydrogen130, while the recently established working group from the European Committee for Standardization (CEN) on hydrogen in energy systems has yet to publish any standards and does not include transport and storage of liquid hydrogen131.
127 Morelos (2017) 128 DNV-GL (2017) and Blaylock et.al (2018) 129 Lovdata (2002) and (2009) 130 ISO (2019) 131 CEN (2016/2019)
38
NCE MARITIME CLEANTECHNorwegian future value chains for liquid hydrogen
39
Storage of hydrogen The Norwegian acts and regulations described in the previous subchapter also applies for storage of hydrogen, even if storage is at a different location than production, for example through centralized production and local storage at the quay. Installations harbouring more than 5 tons of hydrogen must apply for special consent from the Directorate for Civil Protection. Internationally, storage is perhaps the part of the value chain that is best covered, as both the European Industrial Gases Association (EIGA), ISO and CEN have published on the use of cryogenic tanks/vessels as a mean of storage. The EIGA document 06/19 for example give principles on layout and location of installations, access to site, testing and commissioning and general advice on safety distances132. The guideline from the Directorate for Civil Protection on facilities for use of liquid and gaseous fuels133 defines safety distances for LNG tanks which has been communicated could serve as an indication, but the exact distance and zones requiring special consideration is determined through a risk analysis on a case-to-case basis. Distribution by ship Distribution by ship can be done in two different ways, either in dedicated LH2-transporters such as the examples highlighted from Moss Maritime and Kawasaki, or in containers with cryogenic tanks on ro-ro-ferries, like Air Products transport LH2 from their facility in Rotterdam. The Norwegian Maritime Authority point to the International Maritime Organization (IMO) for regulations134. The IGC code covers the construction and equipment of ships carrying liquefied gases in bulk while the IMDG covers the carriage of dangerous goods in packaged form. Here, the requirements for both compressed and refrigerated liquid hydrogen are comparable to those for natural gas. However, the International Gas Carrier Code (IGC Code) lacks specific requirements for hydrogen. Thus, the HyLaw-project, an EU-project gathering cross-national data on hydrogen regulations and standards, highlights maritime transport as an area where “adjustment of legal framework is needed, in order to provide clear and predictable conditions for technology and market development”135. To address this regulatory gap, IMO adopted a set of interim recommendations for carriage of liquefied hydrogen in bulk (resolution MSC.420(97) under in November 2016. According to HyLaw, under the IGF Code it is anticipated that initial restrictions regarding storage quantities and locations will be put in place for hydrogen (e.g. storage on top deck). As of now the national regulation on maritime transport of dangerous goods sets a limit to the number of ADR-units on the same vessel. The maximum number of ADR-regulated units is four on an open ro-ro deck and two on a closed ro-ro deck. However, flammable gases are not allowed on closed ro-ro decks, making open deck vessels the only option for hydrogen transport 136. Distribution by truck The ADR directive provides regulation for transport by truck in addition to regulations related to the container systems. Currently the most common transport method in Norway is compressed hydrogen at 200 bars, with an upper limit for composite cylinders at 520 bar. In terms of hydrogen amount, 132 EIGA (2019) 133 DSB (2015) 134 Conversation with the NMA 21.nov 2018 135 HyLaw (2018) 136 Lovdata (2010)
39
NCE MARITIME CLEANTECHNorwegian future value chains for liquid hydrogen
40
there is no upper limit in Norway, but the weight of a truck with trailer cannot exceed 50 tons and a length of 19,5 meters137. In accordance with ADR tank transport of hydrogen is forbidden in tunnels of category B,C,D end E. In Norway this applies to the subsea tunnel between Ellingsøy and Valderøy, near Ålesund between 0600-2400 and Hvalertunnelen where transport of dangerous goods needs permission from the Road Traffic Central138. Bunkering While there are protocols and codes for hydrogen refuelling stations, there is a regulatory gap for maritime bunkering of liquid hydrogen. In the guidelines to the Regulation on handling of dangerous substances it states that hydrogen to a large extent is comparable to LPG and CNG and that hydrogen fuelling stations shall be designed and constructed according to ISO/TS 20100 Gaseous hydrogen – Fuelling stations (later replaved by ISO/TS 19880-1:2016)139. Perhaps as a better comparison for LH2, the guideline also includes a chapter on on maritime bunkering of LNG, which serves as a useful comparison for LH2, and defines important parameters such as necessary risk assessments, safety zones, bunkering procedure, coupling solutions/break away and layout on the quay. For fuelling of a passenger vessel, a special consent – “samtykke” is needed from the Directorate of Civil Protection. For these instances a quantitative risk assessment is required to set safety zones around the bunkering facility140. 137 Correspondance with Arne Lærdal, Directorate for Civil Protection, April 2019 and Lovdata (2014) 138 HyLaw (2018) 139 DSB (2018) 140 Correspondence with DSB
40
NCE MARITIME CLEANTECHNorwegian future value chains for liquid hydrogen
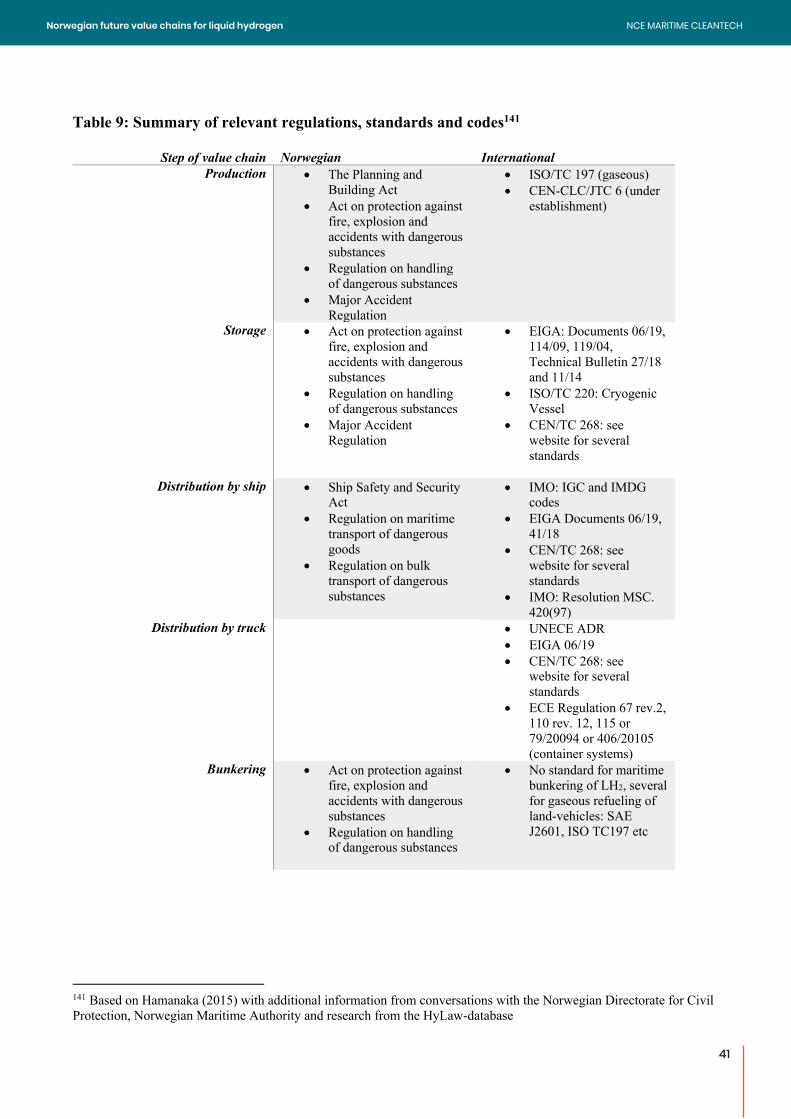
41
Table 9: Summary of relevant regulations, standards and codes141
Step of value chain Norwegian International Production • The Planning and
Building Act • Act on protection against
fire, explosion and accidents with dangerous substances
• Regulation on handling of dangerous substances
• Major Accident Regulation
• ISO/TC 197 (gaseous) • CEN-CLC/JTC 6 (under
establishment)
Storage • Act on protection against fire, explosion and accidents with dangerous substances
• Regulation on handling of dangerous substances
• Major Accident Regulation
• EIGA: Documents 06/19, 114/09, 119/04, Technical Bulletin 27/18 and 11/14
• ISO/TC 220: Cryogenic Vessel
• CEN/TC 268: see website for several standards
Distribution by ship • Ship Safety and Security
Act • Regulation on maritime
transport of dangerous goods
• Regulation on bulk transport of dangerous substances
• IMO: IGC and IMDG codes
• EIGA Documents 06/19, 41/18
• CEN/TC 268: see website for several standards
• IMO: Resolution MSC. 420(97)
Distribution by truck • UNECE ADR • EIGA 06/19 • CEN/TC 268: see
website for several standards
• ECE Regulation 67 rev.2, 110 rev. 12, 115 or 79/20094 or 406/20105 (container systems)
Bunkering • Act on protection against fire, explosion and accidents with dangerous substances
• Regulation on handling of dangerous substances
• No standard for maritime bunkering of LH2, several for gaseous refueling of land-vehicles: SAE J2601, ISO TC197 etc
141 Based on Hamanaka (2015) with additional information from conversations with the Norwegian Directorate for Civil Protection, Norwegian Maritime Authority and research from the HyLaw-database
41
NCE MARITIME CLEANTECHNorwegian future value chains for liquid hydrogen
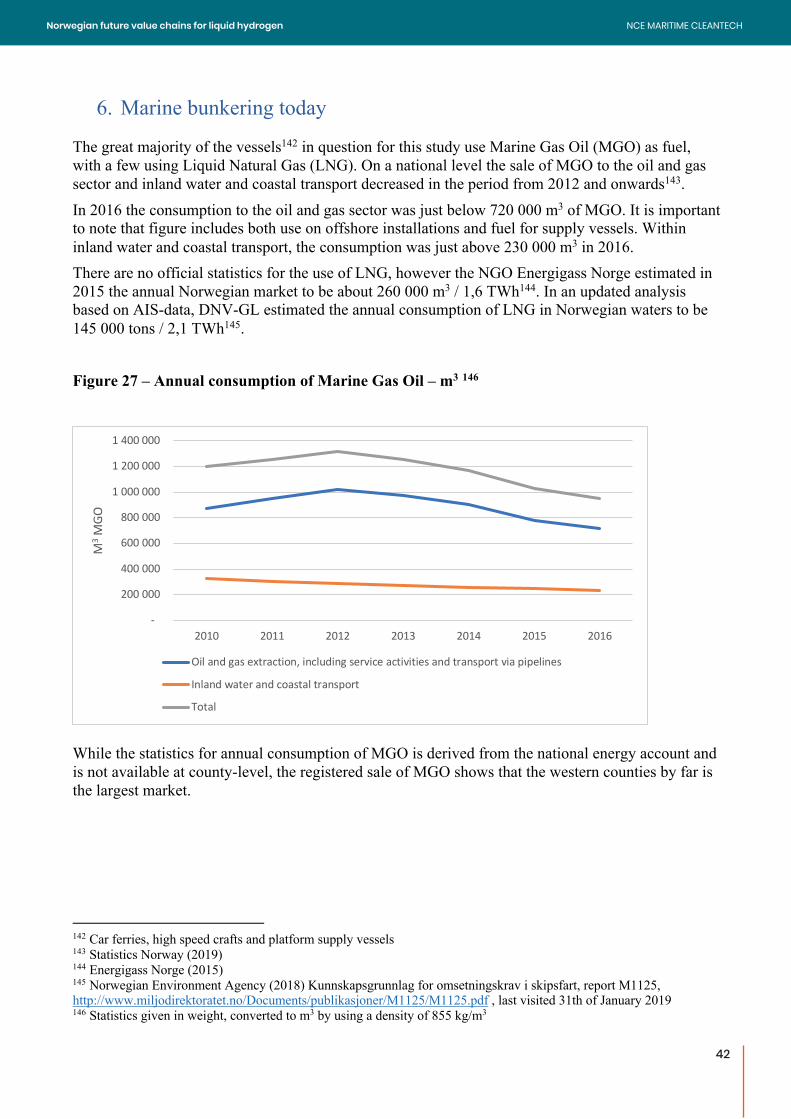
42
6. Marine bunkering today The great majority of the vessels142 in question for this study use Marine Gas Oil (MGO) as fuel, with a few using Liquid Natural Gas (LNG). On a national level the sale of MGO to the oil and gas sector and inland water and coastal transport decreased in the period from 2012 and onwards143. In 2016 the consumption to the oil and gas sector was just below 720 000 m3 of MGO. It is important to note that figure includes both use on offshore installations and fuel for supply vessels. Within inland water and coastal transport, the consumption was just above 230 000 m3 in 2016. There are no official statistics for the use of LNG, however the NGO Energigass Norge estimated in 2015 the annual Norwegian market to be about 260 000 m3 / 1,6 TWh144. In an updated analysis based on AIS-data, DNV-GL estimated the annual consumption of LNG in Norwegian waters to be 145 000 tons / 2,1 TWh145. Figure 27 – Annual consumption of Marine Gas Oil – m3 146
While the statistics for annual consumption of MGO is derived from the national energy account and is not available at county-level, the registered sale of MGO shows that the western counties by far is the largest market.
142 Car ferries, high speed crafts and platform supply vessels 143 Statistics Norway (2019) 144 Energigass Norge (2015) 145 Norwegian Environment Agency (2018) Kunnskapsgrunnlag for omsetningskrav i skipsfart, report M1125, http://www.miljodirektoratet.no/Documents/publikasjoner/M1125/M1125.pdf , last visited 31th of January 2019 146 Statistics given in weight, converted to m3 by using a density of 855 kg/m3
-
200 000
400 000
600 000
800 000
1 000 000
1 200 000
1 400 000
2010 2011 2012 2013 2014 2015 2016
M3
MGO
Oil and gas extraction, including service activities and transport via pipelines
Inland water and coastal transport
Total
42
NCE MARITIME CLEANTECHNorwegian future value chains for liquid hydrogen
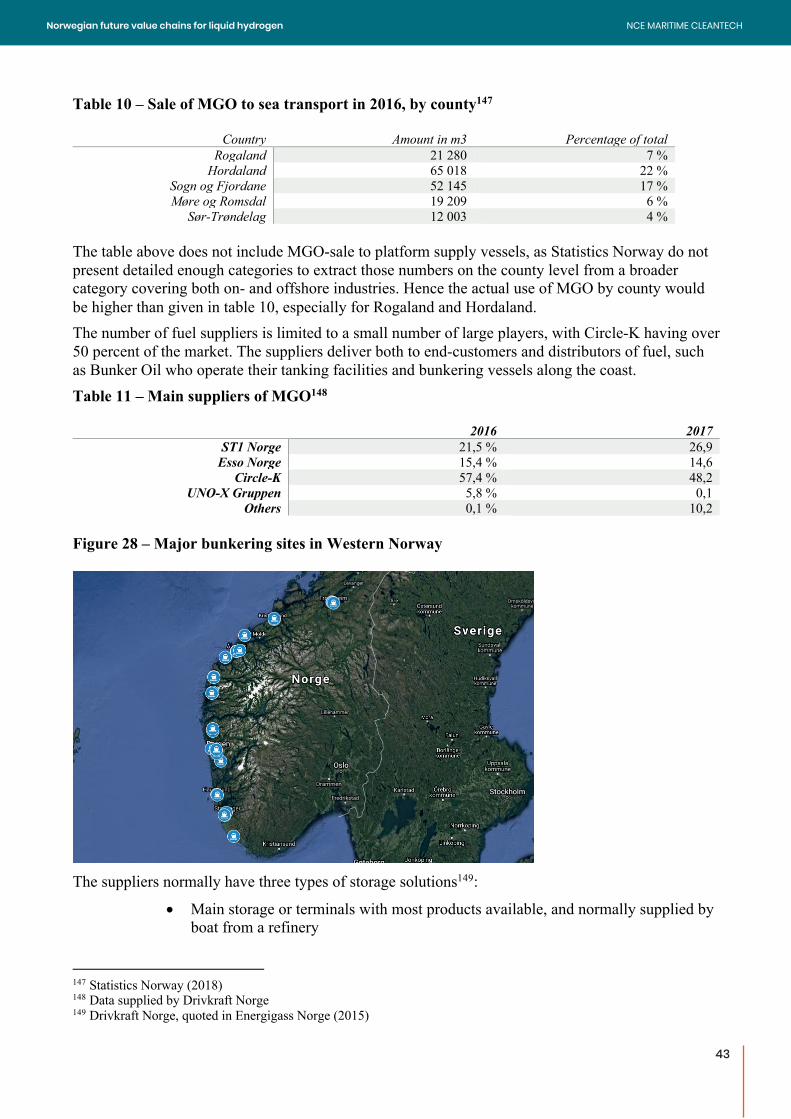
43
Table 10 – Sale of MGO to sea transport in 2016, by county147
Country Amount in m3 Percentage of total Rogaland 21 280 7 %
Hordaland 65 018 22 % Sogn og Fjordane 52 145 17 % Møre og Romsdal 19 209 6 %
Sør-Trøndelag 12 003 4 % The table above does not include MGO-sale to platform supply vessels, as Statistics Norway do not present detailed enough categories to extract those numbers on the county level from a broader category covering both on- and offshore industries. Hence the actual use of MGO by county would be higher than given in table 10, especially for Rogaland and Hordaland. The number of fuel suppliers is limited to a small number of large players, with Circle-K having over 50 percent of the market. The suppliers deliver both to end-customers and distributors of fuel, such as Bunker Oil who operate their tanking facilities and bunkering vessels along the coast. Table 11 – Main suppliers of MGO148
2016 2017 ST1 Norge 21,5 % 26,9
Esso Norge 15,4 % 14,6 Circle-K 57,4 % 48,2
UNO-X Gruppen 5,8 % 0,1 Others 0,1 % 10,2
Figure 28 – Major bunkering sites in Western Norway
The suppliers normally have three types of storage solutions149:
• Main storage or terminals with most products available, and normally supplied by boat from a refinery
147 Statistics Norway (2018) 148 Data supplied by Drivkraft Norge 149 Drivkraft Norge, quoted in Energigass Norge (2015)
43
NCE MARITIME CLEANTECHNorwegian future value chains for liquid hydrogen
44
• Distribution storage, supplied by boat from a refinery or from a main storage facility
• Coastal storage facility – often run by independent operators In addition, you also have larger storage solutions at services- and logistics ports for the oil and gas industry. The refuelling of vessels is normally done from permanent fuelling facilities or delivered to the ship by a bunkering vessel or truck, depending on the vessel type and current route. The table below is a non-exhaustive list of bunkering sites along the coastline but shows the storage capacity of MGO and LNG and location for the largest facilities. In addition, we have estimated the necessary volume if the same energy amount represented by MGO and LNG is to be replaced by liquid hydrogen. Due to the higher energy density in MGO and LNG, as shown in table 4, the volume storage needed is significantly larger with LH2. Table 12: A selection of marine bunkering sites Marine Gas Oil (MGO) and Liquified Natural Gas (LNG)150
Location Operator Used by Storage capacity (m3) Storage capacity needed if LH2
(m3)151 MGO LNG LH2
Egersund H.E. Seglem & Sønner Bunker Oil 3 500 15 600 Stavanger Norsea AS Circle-K 7000 31 300 Stavanger Norsea AS Circle-K / Esso /
Shell 7000 31 300
Risavika Skangas Skangas 0 30 000 77 600 Haugesund L Storesund & Sønner Circle-K / Bunker Oil 11 000 49 200 Haugesund Shell Shell / Esso 10 700 47 900
Ågotnes CCB Circle-K / Gasnor 9 900 500 45 600 Mongstad Mongstadbase Circkle-K / Gasnor 9 000 1 000 42 800
Bergen Esso Shell / Esso/Bunkeroil
16 000 71 500
Halhjem Gasnor Gasnor 0 1 000 2 600 Sløvåg Bunker Oil Bunker Oil 15 000 67 100 Florø Sundfjord Drift / Saga
Fjordbase Circle-K / Gasnor 7 000 500 32 600
Florø Florø Bil og Havneservice
Bunker Oil 1 500 6 700
Måløy Brødrene Tennebø Circle-K / Bunker Oil 3 800 17 000 Måløy MH24 6 700 30 000
Ålesund MH24 5 500 24 600 Ålesund Shell Circle-K / Esso /
Shell 6 000 26 800
Ålesund Bunker Oil Bunker Oil 0 21 560 28 700 Kristiansund Norsea AS, Vestbase Circle-K / Gasnor /
Uno-X 13 000 400 59 200
Kristiansund Atlantic Bunkers Bunker Oil 500 2 200 Fosnavåg MH24 400 1 800
Trondheim Esso Shell / Esso 11385152 50 900 Trondheim Statoil Circle-K 500 2 200
150 Based on input from Energigass Norge (2014) and input from the various operators and fuel companies 151 Storage capacity found by using the following energy densities (MJ/m3): MGO 38000 MJ/m3, LNG 22000 MJ/m3 and LH2 8500 MJ/m3 152 Gas oil, but used for maritime fuel
44
NCE MARITIME CLEANTECHNorwegian future value chains for liquid hydrogen
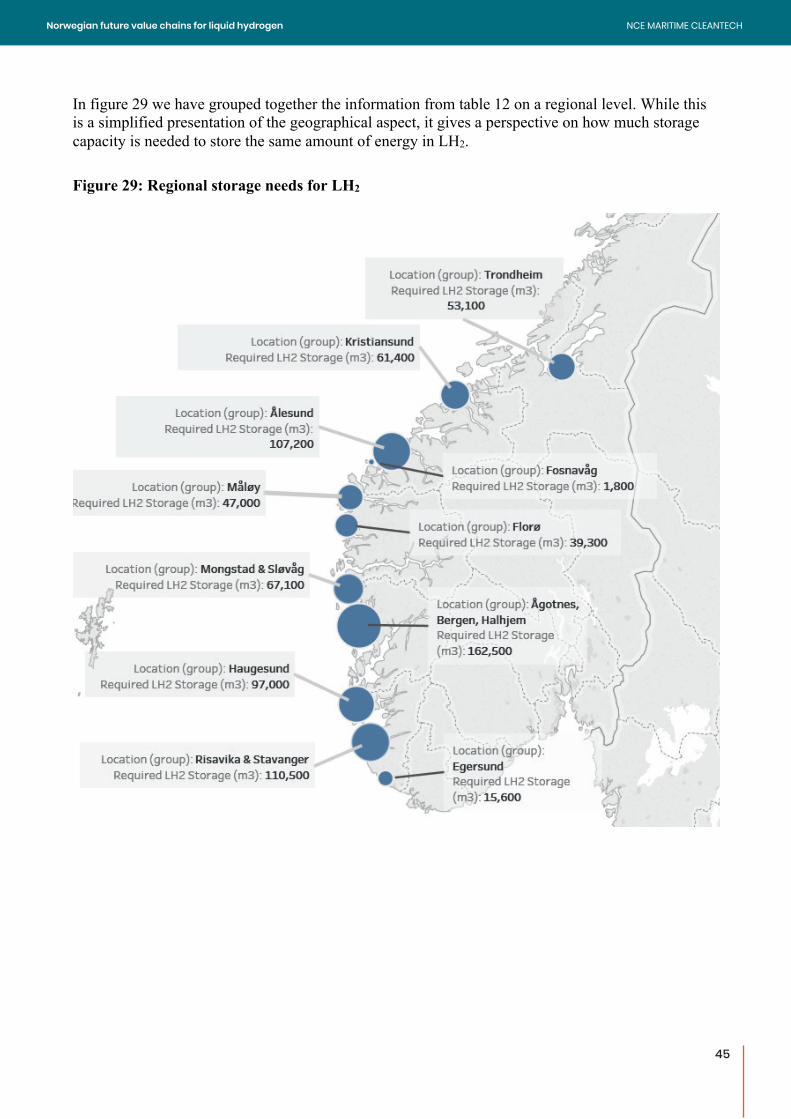
45
In figure 29 we have grouped together the information from table 12 on a regional level. While this is a simplified presentation of the geographical aspect, it gives a perspective on how much storage capacity is needed to store the same amount of energy in LH2. Figure 29: Regional storage needs for LH2
45
NCE MARITIME CLEANTECHNorwegian future value chains for liquid hydrogen
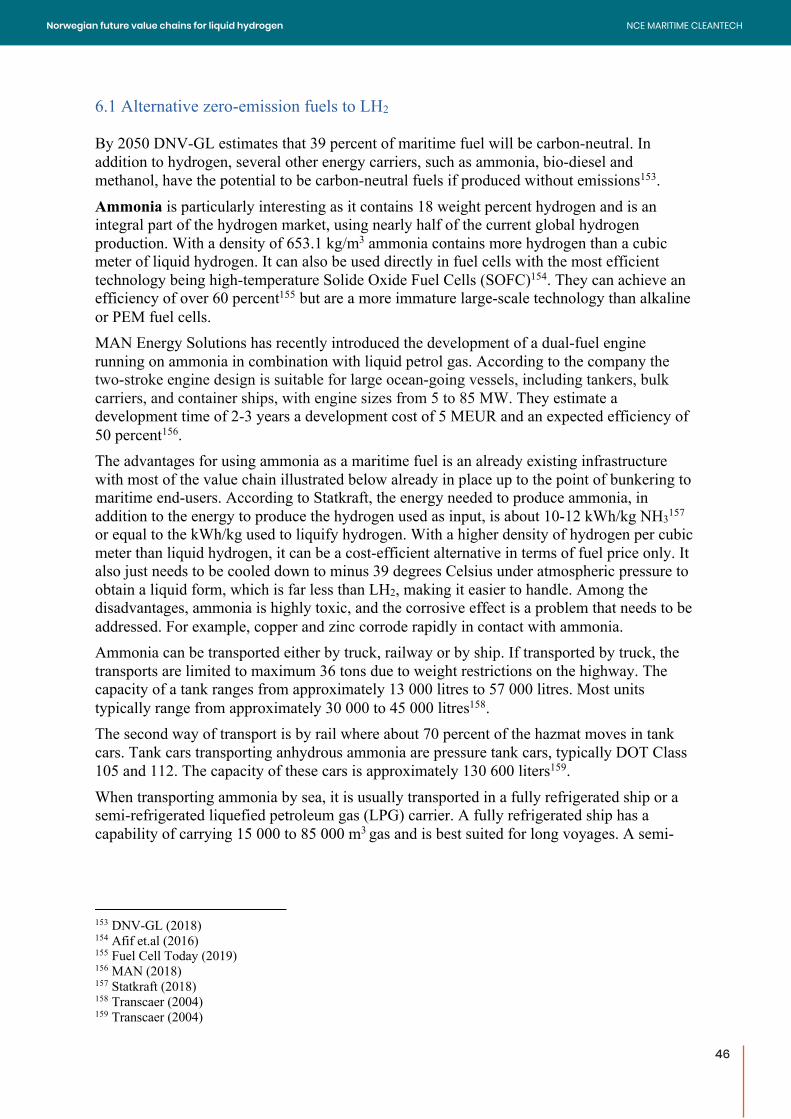
46
6.1 Alternative zero-emission fuels to LH2 By 2050 DNV-GL estimates that 39 percent of maritime fuel will be carbon-neutral. In addition to hydrogen, several other energy carriers, such as ammonia, bio-diesel and methanol, have the potential to be carbon-neutral fuels if produced without emissions153. Ammonia is particularly interesting as it contains 18 weight percent hydrogen and is an integral part of the hydrogen market, using nearly half of the current global hydrogen production. With a density of 653.1 kg/m3 ammonia contains more hydrogen than a cubic meter of liquid hydrogen. It can also be used directly in fuel cells with the most efficient technology being high-temperature Solide Oxide Fuel Cells (SOFC)154. They can achieve an efficiency of over 60 percent155 but are a more immature large-scale technology than alkaline or PEM fuel cells. MAN Energy Solutions has recently introduced the development of a dual-fuel engine running on ammonia in combination with liquid petrol gas. According to the company the two-stroke engine design is suitable for large ocean-going vessels, including tankers, bulk carriers, and container ships, with engine sizes from 5 to 85 MW. They estimate a development time of 2-3 years a development cost of 5 MEUR and an expected efficiency of 50 percent156. The advantages for using ammonia as a maritime fuel is an already existing infrastructure with most of the value chain illustrated below already in place up to the point of bunkering to maritime end-users. According to Statkraft, the energy needed to produce ammonia, in addition to the energy to produce the hydrogen used as input, is about 10-12 kWh/kg NH3157 or equal to the kWh/kg used to liquify hydrogen. With a higher density of hydrogen per cubic meter than liquid hydrogen, it can be a cost-efficient alternative in terms of fuel price only. It also just needs to be cooled down to minus 39 degrees Celsius under atmospheric pressure to obtain a liquid form, which is far less than LH2, making it easier to handle. Among the disadvantages, ammonia is highly toxic, and the corrosive effect is a problem that needs to be addressed. For example, copper and zinc corrode rapidly in contact with ammonia. Ammonia can be transported either by truck, railway or by ship. If transported by truck, the transports are limited to maximum 36 tons due to weight restrictions on the highway. The capacity of a tank ranges from approximately 13 000 litres to 57 000 litres. Most units typically range from approximately 30 000 to 45 000 litres158. The second way of transport is by rail where about 70 percent of the hazmat moves in tank cars. Tank cars transporting anhydrous ammonia are pressure tank cars, typically DOT Class 105 and 112. The capacity of these cars is approximately 130 600 liters159. When transporting ammonia by sea, it is usually transported in a fully refrigerated ship or a semi-refrigerated liquefied petroleum gas (LPG) carrier. A fully refrigerated ship has a capability of carrying 15 000 to 85 000 m3 gas and is best suited for long voyages. A semi-
153 DNV-GL (2018) 154 Afif et.al (2016) 155 Fuel Cell Today (2019) 156 MAN (2018) 157 Statkraft (2018) 158 Transcaer (2004) 159 Transcaer (2004)
46
NCE MARITIME CLEANTECHNorwegian future value chains for liquid hydrogen
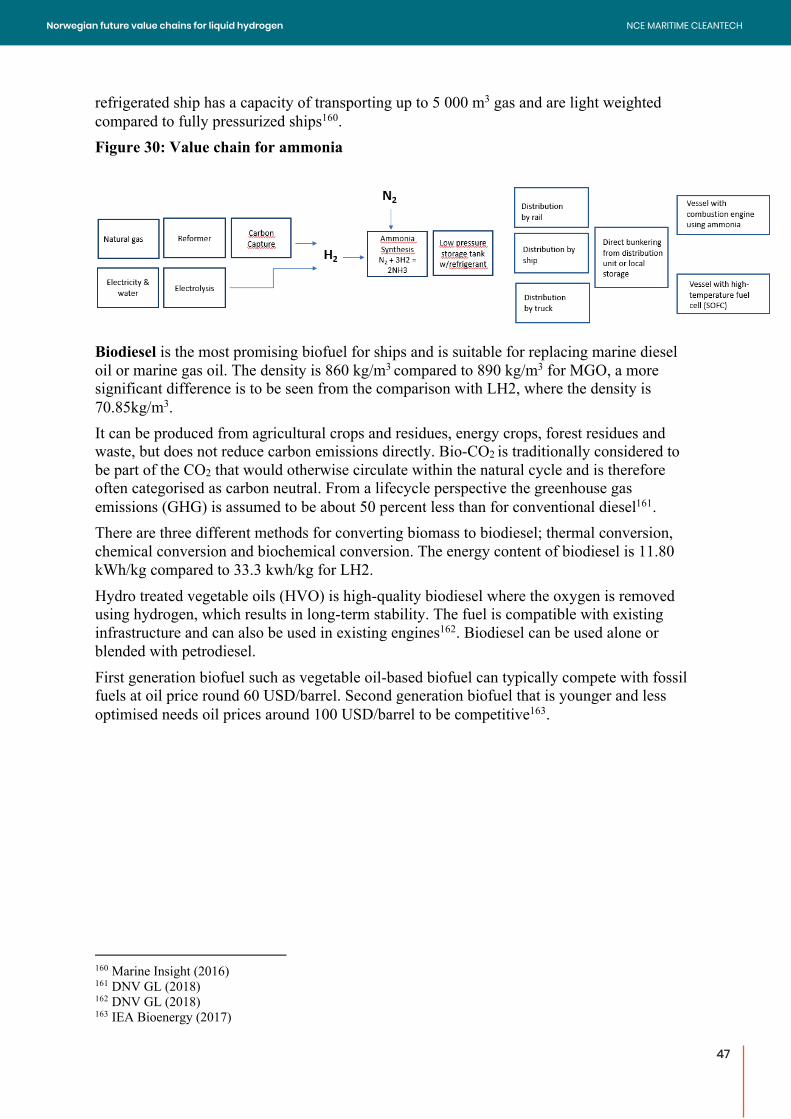
47
refrigerated ship has a capacity of transporting up to 5 000 m3 gas and are light weighted compared to fully pressurized ships160. Figure 30: Value chain for ammonia
Biodiesel is the most promising biofuel for ships and is suitable for replacing marine diesel oil or marine gas oil. The density is 860 kg/m3 compared to 890 kg/m3 for MGO, a more significant difference is to be seen from the comparison with LH2, where the density is 70.85kg/m3. It can be produced from agricultural crops and residues, energy crops, forest residues and waste, but does not reduce carbon emissions directly. Bio-CO2 is traditionally considered to be part of the CO2 that would otherwise circulate within the natural cycle and is therefore often categorised as carbon neutral. From a lifecycle perspective the greenhouse gas emissions (GHG) is assumed to be about 50 percent less than for conventional diesel161. There are three different methods for converting biomass to biodiesel; thermal conversion, chemical conversion and biochemical conversion. The energy content of biodiesel is 11.80 kWh/kg compared to 33.3 kwh/kg for LH2. Hydro treated vegetable oils (HVO) is high-quality biodiesel where the oxygen is removed using hydrogen, which results in long-term stability. The fuel is compatible with existing infrastructure and can also be used in existing engines162. Biodiesel can be used alone or blended with petrodiesel. First generation biofuel such as vegetable oil-based biofuel can typically compete with fossil fuels at oil price round 60 USD/barrel. Second generation biofuel that is younger and less optimised needs oil prices around 100 USD/barrel to be competitive163.
160 Marine Insight (2016) 161 DNV GL (2018) 162 DNV GL (2018) 163 IEA Bioenergy (2017)
47
NCE MARITIME CLEANTECHNorwegian future value chains for liquid hydrogen
48
Figure 31: Value chain for biofuel
Methanol, CH3OH is four parts hydrogen, one-part oxygen and one-part carbon, making it the lowest carbon content and the highest hydrogen content of any liquid fuel. It can be produced from several different resources, like natural gas or coal, or from renewable resources such as biomass and green164 hydrogen. The most common feedstock for the industrial process is oil or natural gas. The density of methanol is the same as for biodiesel, 780 kg/m3. In this case, where methanol is an alternative zero-emission fuel to LH2, it must be produced from green hydrogen. Methanol production from green hydrogen includes a carbon source, which needs to be included in a renewable life cycle in order to define it as carbon neutral. On the global market, the price of a kg renewable methanol is approximately 0,8 euro, which gives a price of 40 NOK per kg hydrogen165. The energy content of methanol is 5.56 kWh/kg which is far less that hydrogen’s 33.3 kWh/kg, the density however, shows 780 kg/m3 for methanol versus 70.85 kg/m3 for liquid hydrogen. Methanol is transferred in chemical tankers with an estimated price of 15-40 USD/ton, depending on distance and size of the ship166. It can be stored in tanks designed for diesel and other highly flammable hydrocarbons under atmospheric pressure and does not require cooling. Methanol fuel tanks are often twice the volume of oil tanks with the same energy content167.
164 Green hydrogen is produced from electrolysis with renewable energy as input, or from natural gas reforming with CCS. 165 Statkraft (2018) 166 Statkraft (2018) 167 DNV-GL (2018)
48
NCE MARITIME CLEANTECHNorwegian future value chains for liquid hydrogen
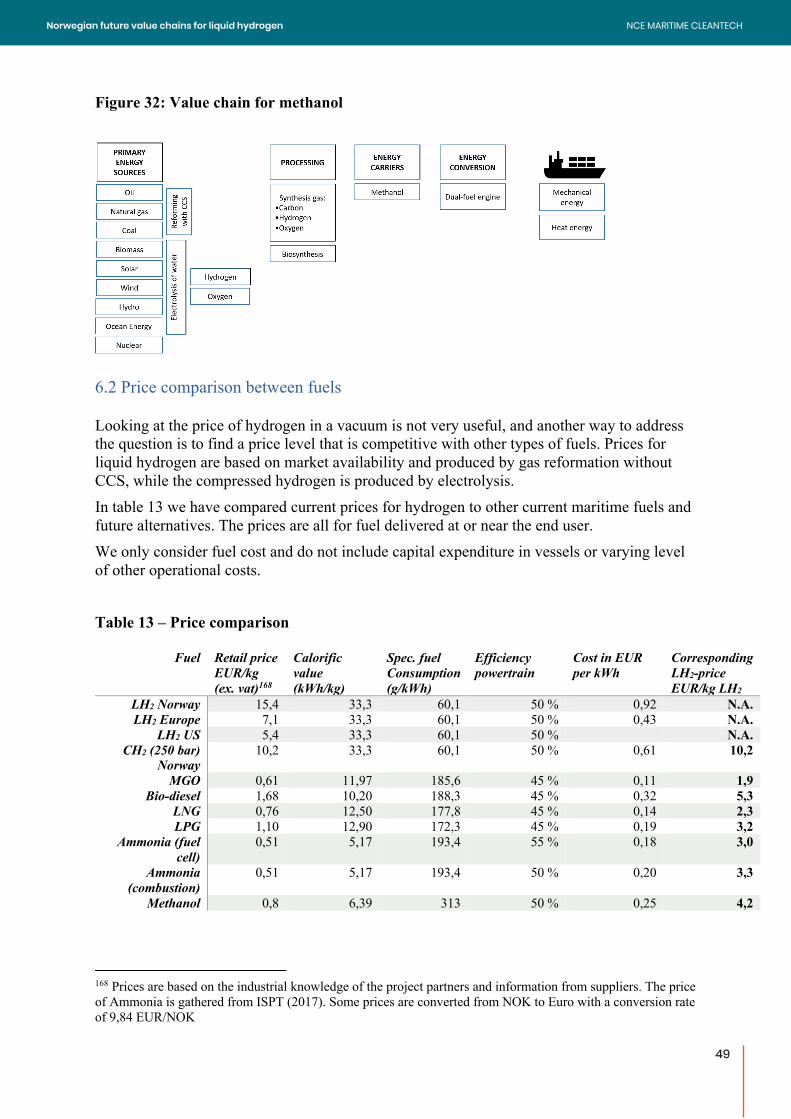
49
Figure 32: Value chain for methanol
6.2 Price comparison between fuels Looking at the price of hydrogen in a vacuum is not very useful, and another way to address the question is to find a price level that is competitive with other types of fuels. Prices for liquid hydrogen are based on market availability and produced by gas reformation without CCS, while the compressed hydrogen is produced by electrolysis. In table 13 we have compared current prices for hydrogen to other current maritime fuels and future alternatives. The prices are all for fuel delivered at or near the end user. We only consider fuel cost and do not include capital expenditure in vessels or varying level of other operational costs. Table 13 – Price comparison
Fuel Retail price EUR/kg (ex. vat)168
Calorific value (kWh/kg)
Spec. fuel Consumption (g/kWh)
Efficiency powertrain
Cost in EUR per kWh
Corresponding LH2-price EUR/kg LH2
LH2 Norway 15,4 33,3 60,1 50 % 0,92 N.A. LH2 Europe 7,1 33,3 60,1 50 % 0,43 N.A.
LH2 US 5,4 33,3 60,1 50 % N.A. CH2 (250 bar)
Norway 10,2 33,3 60,1 50 % 0,61 10,2
MGO 0,61 11,97 185,6 45 % 0,11 1,9 Bio-diesel 1,68 10,20 188,3 45 % 0,32 5,3
LNG 0,76 12,50 177,8 45 % 0,14 2,3 LPG 1,10 12,90 172,3 45 % 0,19 3,2
Ammonia (fuel cell)
0,51 5,17 193,4 55 % 0,18 3,0
Ammonia (combustion)
0,51 5,17 193,4 50 % 0,20 3,3
Methanol 0,8 6,39 313 50 % 0,25 4,2
168 Prices are based on the industrial knowledge of the project partners and information from suppliers. The price of Ammonia is gathered from ISPT (2017). Some prices are converted from NOK to Euro with a conversion rate of 9,84 EUR/NOK
49
NCE MARITIME CLEANTECHNorwegian future value chains for liquid hydrogen
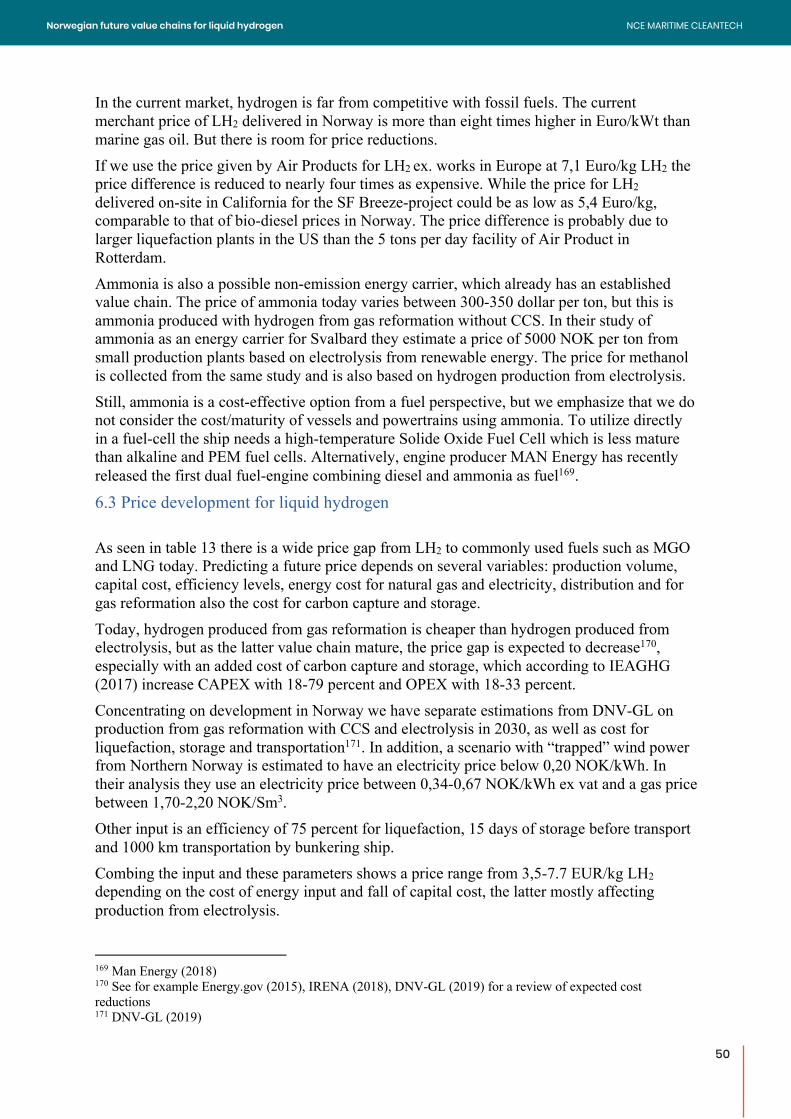
50
In the current market, hydrogen is far from competitive with fossil fuels. The current merchant price of LH2 delivered in Norway is more than eight times higher in Euro/kWt than marine gas oil. But there is room for price reductions. If we use the price given by Air Products for LH2 ex. works in Europe at 7,1 Euro/kg LH2 the price difference is reduced to nearly four times as expensive. While the price for LH2 delivered on-site in California for the SF Breeze-project could be as low as 5,4 Euro/kg, comparable to that of bio-diesel prices in Norway. The price difference is probably due to larger liquefaction plants in the US than the 5 tons per day facility of Air Product in Rotterdam. Ammonia is also a possible non-emission energy carrier, which already has an established value chain. The price of ammonia today varies between 300-350 dollar per ton, but this is ammonia produced with hydrogen from gas reformation without CCS. In their study of ammonia as an energy carrier for Svalbard they estimate a price of 5000 NOK per ton from small production plants based on electrolysis from renewable energy. The price for methanol is collected from the same study and is also based on hydrogen production from electrolysis. Still, ammonia is a cost-effective option from a fuel perspective, but we emphasize that we do not consider the cost/maturity of vessels and powertrains using ammonia. To utilize directly in a fuel-cell the ship needs a high-temperature Solide Oxide Fuel Cell which is less mature than alkaline and PEM fuel cells. Alternatively, engine producer MAN Energy has recently released the first dual fuel-engine combining diesel and ammonia as fuel169.
6.3 Price development for liquid hydrogen As seen in table 13 there is a wide price gap from LH2 to commonly used fuels such as MGO and LNG today. Predicting a future price depends on several variables: production volume, capital cost, efficiency levels, energy cost for natural gas and electricity, distribution and for gas reformation also the cost for carbon capture and storage. Today, hydrogen produced from gas reformation is cheaper than hydrogen produced from electrolysis, but as the latter value chain mature, the price gap is expected to decrease170, especially with an added cost of carbon capture and storage, which according to IEAGHG (2017) increase CAPEX with 18-79 percent and OPEX with 18-33 percent. Concentrating on development in Norway we have separate estimations from DNV-GL on production from gas reformation with CCS and electrolysis in 2030, as well as cost for liquefaction, storage and transportation171. In addition, a scenario with “trapped” wind power from Northern Norway is estimated to have an electricity price below 0,20 NOK/kWh. In their analysis they use an electricity price between 0,34-0,67 NOK/kWh ex vat and a gas price between 1,70-2,20 NOK/Sm3. Other input is an efficiency of 75 percent for liquefaction, 15 days of storage before transport and 1000 km transportation by bunkering ship. Combing the input and these parameters shows a price range from 3,5-7.7 EUR/kg LH2 depending on the cost of energy input and fall of capital cost, the latter mostly affecting production from electrolysis.
169 Man Energy (2018) 170 See for example Energy.gov (2015), IRENA (2018), DNV-GL (2019) for a review of expected cost reductions 171 DNV-GL (2019)
50
NCE MARITIME CLEANTECHNorwegian future value chains for liquid hydrogen
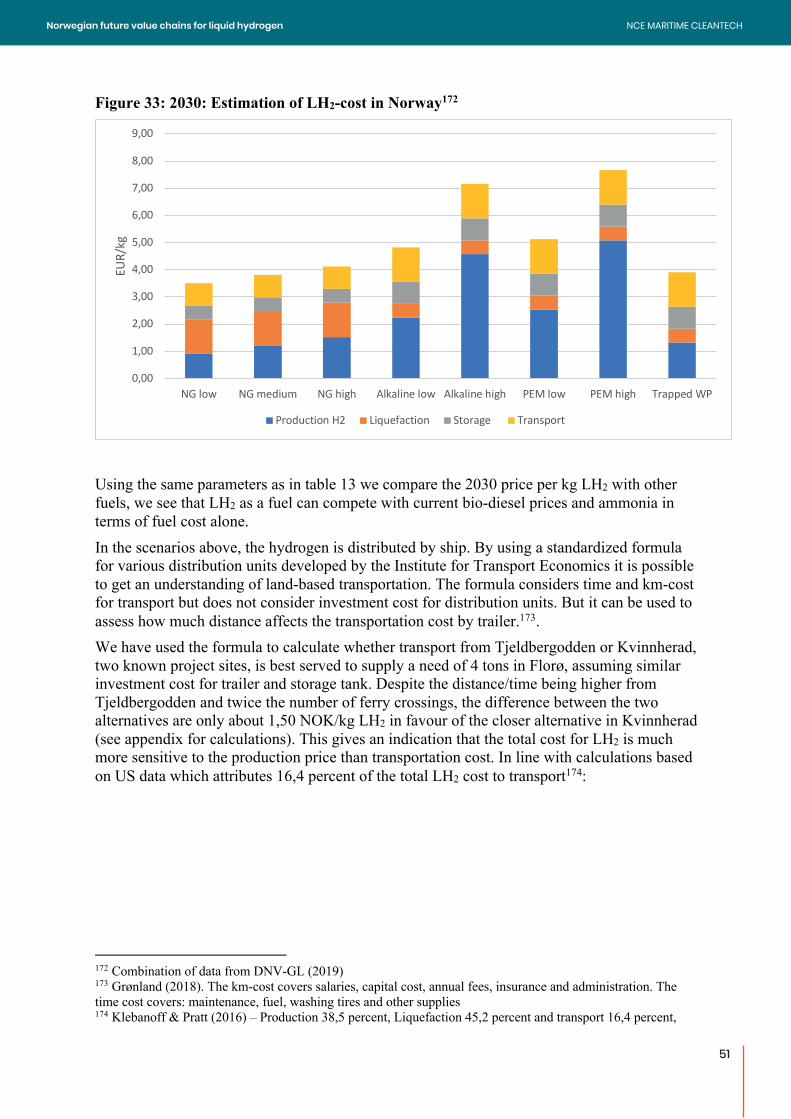
51
Figure 33: 2030: Estimation of LH2-cost in Norway172
Using the same parameters as in table 13 we compare the 2030 price per kg LH2 with other fuels, we see that LH2 as a fuel can compete with current bio-diesel prices and ammonia in terms of fuel cost alone. In the scenarios above, the hydrogen is distributed by ship. By using a standardized formula for various distribution units developed by the Institute for Transport Economics it is possible to get an understanding of land-based transportation. The formula considers time and km-cost for transport but does not consider investment cost for distribution units. But it can be used to assess how much distance affects the transportation cost by trailer.173. We have used the formula to calculate whether transport from Tjeldbergodden or Kvinnherad, two known project sites, is best served to supply a need of 4 tons in Florø, assuming similar investment cost for trailer and storage tank. Despite the distance/time being higher from Tjeldbergodden and twice the number of ferry crossings, the difference between the two alternatives are only about 1,50 NOK/kg LH2 in favour of the closer alternative in Kvinnherad (see appendix for calculations). This gives an indication that the total cost for LH2 is much more sensitive to the production price than transportation cost. In line with calculations based on US data which attributes 16,4 percent of the total LH2 cost to transport174:
172 Combination of data from DNV-GL (2019) 173 Grønland (2018). The km-cost covers salaries, capital cost, annual fees, insurance and administration. The time cost covers: maintenance, fuel, washing tires and other supplies 174 Klebanoff & Pratt (2016) – Production 38,5 percent, Liquefaction 45,2 percent and transport 16,4 percent,
0,00
1,00
2,00
3,00
4,00
5,00
6,00
7,00
8,00
9,00
NG low NG medium NG high Alkaline low Alkaline high PEM low PEM high Trapped WP
EUR/
kg
Production H2 Liquefaction Storage Transport
51
NCE MARITIME CLEANTECHNorwegian future value chains for liquid hydrogen
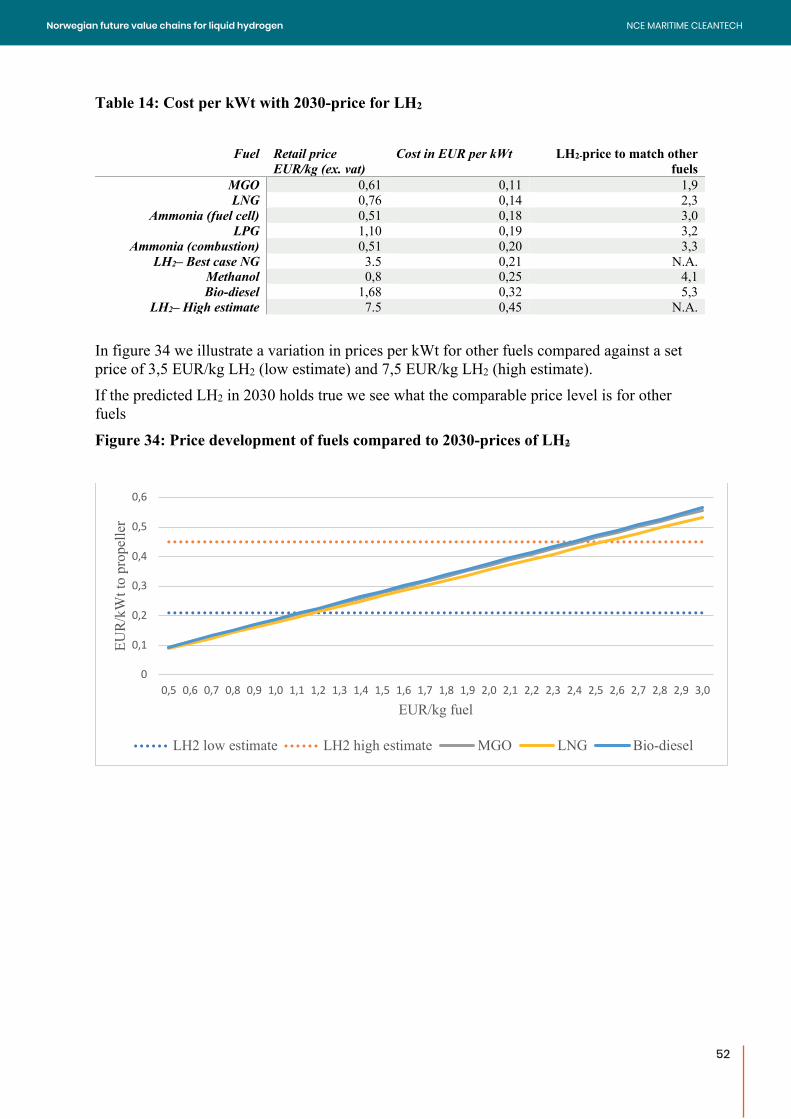
52
Table 14: Cost per kWt with 2030-price for LH2
Fuel Retail price EUR/kg (ex. vat)
Cost in EUR per kWt LH2-price to match other fuels
MGO 0,61 0,11 1,9 LNG 0,76 0,14 2,3
Ammonia (fuel cell) 0,51 0,18 3,0 LPG 1,10 0,19 3,2
Ammonia (combustion) 0,51 0,20 3,3 LH2– Best case NG 3.5 0,21 N.A.
Methanol 0,8 0,25 4,1 Bio-diesel 1,68 0,32 5,3
LH2– High estimate 7.5 0,45 N.A. In figure 34 we illustrate a variation in prices per kWt for other fuels compared against a set price of 3,5 EUR/kg LH2 (low estimate) and 7,5 EUR/kg LH2 (high estimate). If the predicted LH2 in 2030 holds true we see what the comparable price level is for other fuels Figure 34: Price development of fuels compared to 2030-prices of LH2
0
0,1
0,2
0,3
0,4
0,5
0,6
0,5 0,6 0,7 0,8 0,9 1,0 1,1 1,2 1,3 1,4 1,5 1,6 1,7 1,8 1,9 2,0 2,1 2,2 2,3 2,4 2,5 2,6 2,7 2,8 2,9 3,0
EUR/
kWt t
o pr
opel
ler
EUR/kg fuel
LH2 low estimate LH2 high estimate MGO LNG Bio-diesel
52
NCE MARITIME CLEANTECHNorwegian future value chains for liquid hydrogen
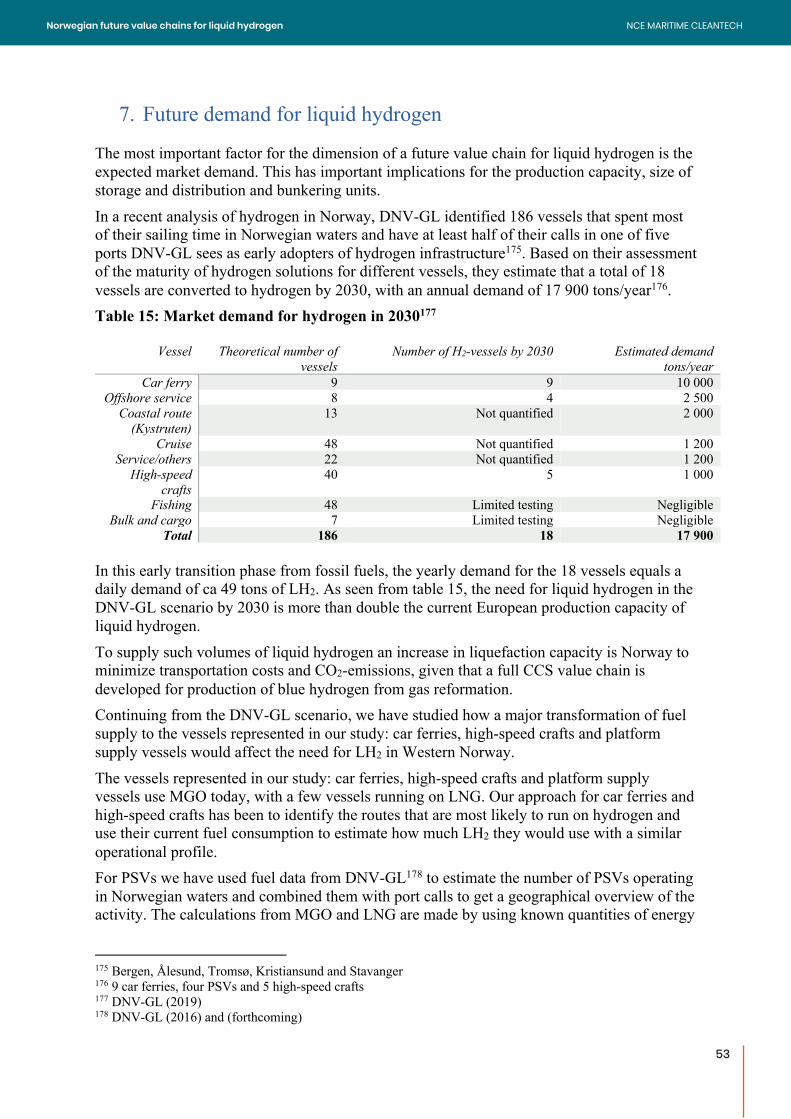
53
7. Future demand for liquid hydrogen The most important factor for the dimension of a future value chain for liquid hydrogen is the expected market demand. This has important implications for the production capacity, size of storage and distribution and bunkering units. In a recent analysis of hydrogen in Norway, DNV-GL identified 186 vessels that spent most of their sailing time in Norwegian waters and have at least half of their calls in one of five ports DNV-GL sees as early adopters of hydrogen infrastructure175. Based on their assessment of the maturity of hydrogen solutions for different vessels, they estimate that a total of 18 vessels are converted to hydrogen by 2030, with an annual demand of 17 900 tons/year176. Table 15: Market demand for hydrogen in 2030177
Vessel Theoretical number of vessels
Number of H2-vessels by 2030 Estimated demand tons/year
Car ferry 9 9 10 000 Offshore service 8 4 2 500
Coastal route (Kystruten)
13 Not quantified 2 000
Cruise 48 Not quantified 1 200 Service/others 22 Not quantified 1 200
High-speed crafts
40 5 1 000
Fishing 48 Limited testing Negligible Bulk and cargo 7 Limited testing Negligible
Total 186 18 17 900 In this early transition phase from fossil fuels, the yearly demand for the 18 vessels equals a daily demand of ca 49 tons of LH2. As seen from table 15, the need for liquid hydrogen in the DNV-GL scenario by 2030 is more than double the current European production capacity of liquid hydrogen. To supply such volumes of liquid hydrogen an increase in liquefaction capacity is Norway to minimize transportation costs and CO2-emissions, given that a full CCS value chain is developed for production of blue hydrogen from gas reformation. Continuing from the DNV-GL scenario, we have studied how a major transformation of fuel supply to the vessels represented in our study: car ferries, high-speed crafts and platform supply vessels would affect the need for LH2 in Western Norway. The vessels represented in our study: car ferries, high-speed crafts and platform supply vessels use MGO today, with a few vessels running on LNG. Our approach for car ferries and high-speed crafts has been to identify the routes that are most likely to run on hydrogen and use their current fuel consumption to estimate how much LH2 they would use with a similar operational profile. For PSVs we have used fuel data from DNV-GL178 to estimate the number of PSVs operating in Norwegian waters and combined them with port calls to get a geographical overview of the activity. The calculations from MGO and LNG are made by using known quantities of energy
175 Bergen, Ålesund, Tromsø, Kristiansund and Stavanger 176 9 car ferries, four PSVs and 5 high-speed crafts 177 DNV-GL (2019) 178 DNV-GL (2016) and (forthcoming)
53
NCE MARITIME CLEANTECHNorwegian future value chains for liquid hydrogen
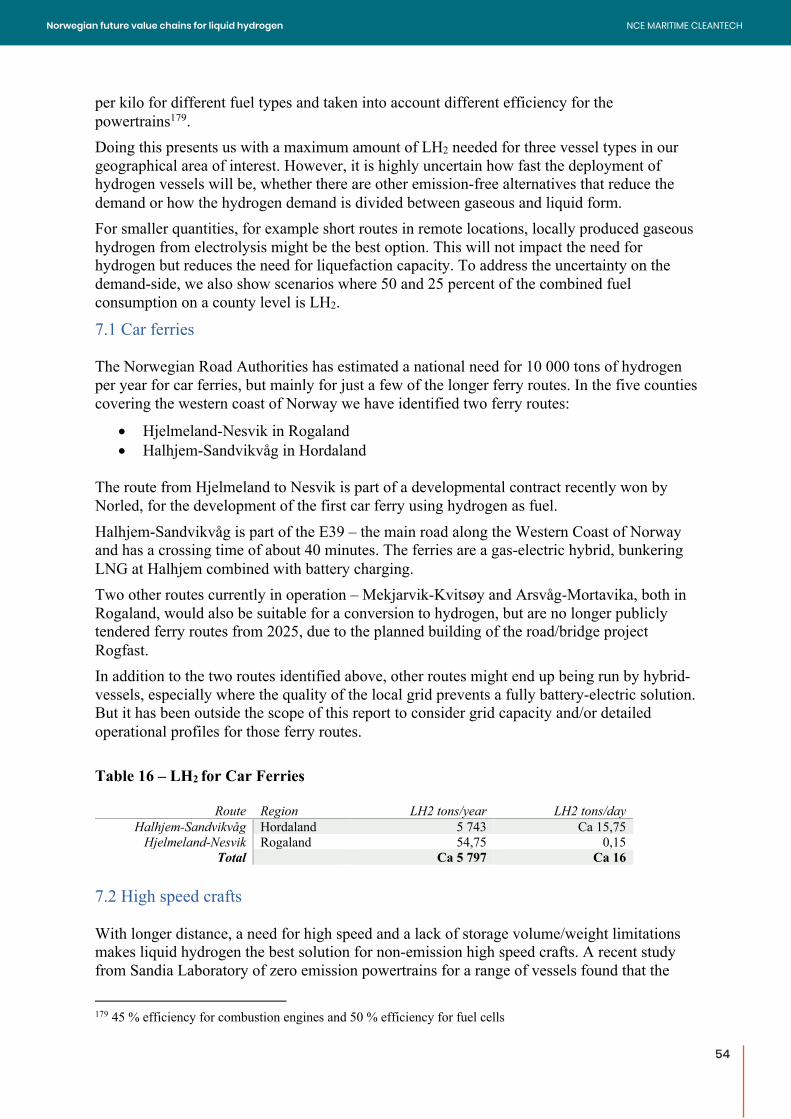
54
per kilo for different fuel types and taken into account different efficiency for the powertrains179. Doing this presents us with a maximum amount of LH2 needed for three vessel types in our geographical area of interest. However, it is highly uncertain how fast the deployment of hydrogen vessels will be, whether there are other emission-free alternatives that reduce the demand or how the hydrogen demand is divided between gaseous and liquid form. For smaller quantities, for example short routes in remote locations, locally produced gaseous hydrogen from electrolysis might be the best option. This will not impact the need for hydrogen but reduces the need for liquefaction capacity. To address the uncertainty on the demand-side, we also show scenarios where 50 and 25 percent of the combined fuel consumption on a county level is LH2.
7.1 Car ferries The Norwegian Road Authorities has estimated a national need for 10 000 tons of hydrogen per year for car ferries, but mainly for just a few of the longer ferry routes. In the five counties covering the western coast of Norway we have identified two ferry routes:
• Hjelmeland-Nesvik in Rogaland • Halhjem-Sandvikvåg in Hordaland
The route from Hjelmeland to Nesvik is part of a developmental contract recently won by Norled, for the development of the first car ferry using hydrogen as fuel. Halhjem-Sandvikvåg is part of the E39 – the main road along the Western Coast of Norway and has a crossing time of about 40 minutes. The ferries are a gas-electric hybrid, bunkering LNG at Halhjem combined with battery charging. Two other routes currently in operation – Mekjarvik-Kvitsøy and Arsvåg-Mortavika, both in Rogaland, would also be suitable for a conversion to hydrogen, but are no longer publicly tendered ferry routes from 2025, due to the planned building of the road/bridge project Rogfast. In addition to the two routes identified above, other routes might end up being run by hybrid-vessels, especially where the quality of the local grid prevents a fully battery-electric solution. But it has been outside the scope of this report to consider grid capacity and/or detailed operational profiles for those ferry routes. Table 16 – LH2 for Car Ferries
Route Region LH2 tons/year LH2 tons/day Halhjem-Sandvikvåg Hordaland 5 743 Ca 15,75
Hjelmeland-Nesvik Rogaland 54,75 0,15 Total Ca 5 797 Ca 16
7.2 High speed crafts With longer distance, a need for high speed and a lack of storage volume/weight limitations makes liquid hydrogen the best solution for non-emission high speed crafts. A recent study from Sandia Laboratory of zero emission powertrains for a range of vessels found that the
179 45 % efficiency for combustion engines and 50 % efficiency for fuel cells
54
NCE MARITIME CLEANTECHNorwegian future value chains for liquid hydrogen
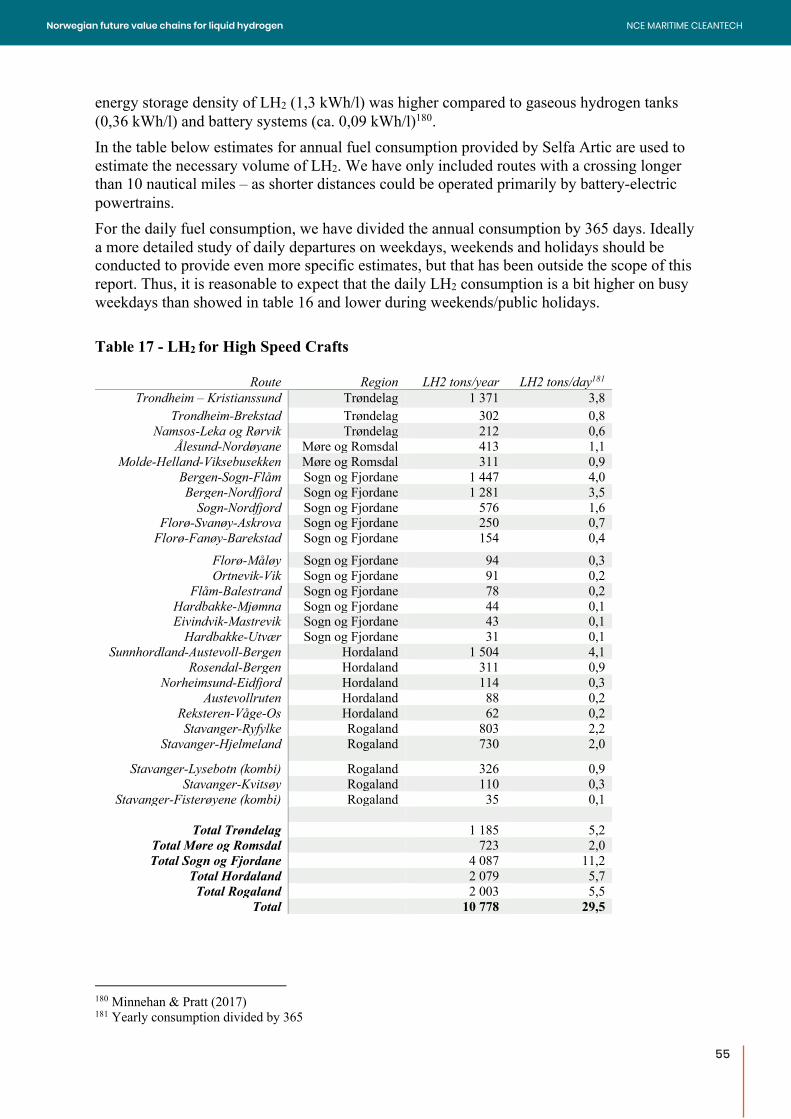
55
energy storage density of LH2 (1,3 kWh/l) was higher compared to gaseous hydrogen tanks (0,36 kWh/l) and battery systems (ca. 0,09 kWh/l)180. In the table below estimates for annual fuel consumption provided by Selfa Artic are used to estimate the necessary volume of LH2. We have only included routes with a crossing longer than 10 nautical miles – as shorter distances could be operated primarily by battery-electric powertrains. For the daily fuel consumption, we have divided the annual consumption by 365 days. Ideally a more detailed study of daily departures on weekdays, weekends and holidays should be conducted to provide even more specific estimates, but that has been outside the scope of this report. Thus, it is reasonable to expect that the daily LH2 consumption is a bit higher on busy weekdays than showed in table 16 and lower during weekends/public holidays. Table 17 - LH2 for High Speed Crafts
Route Region LH2 tons/year LH2 tons/day181 Trondheim – Kristianssund Trøndelag 1 371 3,8
Trondheim-Brekstad Trøndelag 302 0,8 Namsos-Leka og Rørvik Trøndelag 212 0,6
Ålesund-Nordøyane Møre og Romsdal 413 1,1 Molde-Helland-Viksebusekken Møre og Romsdal 311 0,9
Bergen-Sogn-Flåm Sogn og Fjordane 1 447 4,0 Bergen-Nordfjord Sogn og Fjordane 1 281 3,5
Sogn-Nordfjord Sogn og Fjordane 576 1,6 Florø-Svanøy-Askrova Sogn og Fjordane 250 0,7
Florø-Fanøy-Barekstad Sogn og Fjordane 154 0,4 Florø-Måløy Sogn og Fjordane 94 0,3 Ortnevik-Vik Sogn og Fjordane 91 0,2
Flåm-Balestrand Sogn og Fjordane 78 0,2 Hardbakke-Mjømna Sogn og Fjordane 44 0,1 Eivindvik-Mastrevik Sogn og Fjordane 43 0,1
Hardbakke-Utvær Sogn og Fjordane 31 0,1 Sunnhordland-Austevoll-Bergen Hordaland 1 504 4,1
Rosendal-Bergen Hordaland 311 0,9 Norheimsund-Eidfjord Hordaland 114 0,3
Austevollruten Hordaland 88 0,2 Reksteren-Våge-Os Hordaland 62 0,2 Stavanger-Ryfylke Rogaland 803 2,2
Stavanger-Hjelmeland Rogaland 730 2,0
Stavanger-Lysebotn (kombi) Rogaland 326 0,9 Stavanger-Kvitsøy Rogaland 110 0,3
Stavanger-Fisterøyene (kombi) Rogaland 35 0,1
Total Trøndelag 1 185 5,2 Total Møre og Romsdal 723 2,0 Total Sogn og Fjordane 4 087 11,2
Total Hordaland 2 079 5,7 Total Rogaland 2 003 5,5
Total 10 778 29,5
180 Minnehan & Pratt (2017) 181 Yearly consumption divided by 365
55
NCE MARITIME CLEANTECHNorwegian future value chains for liquid hydrogen
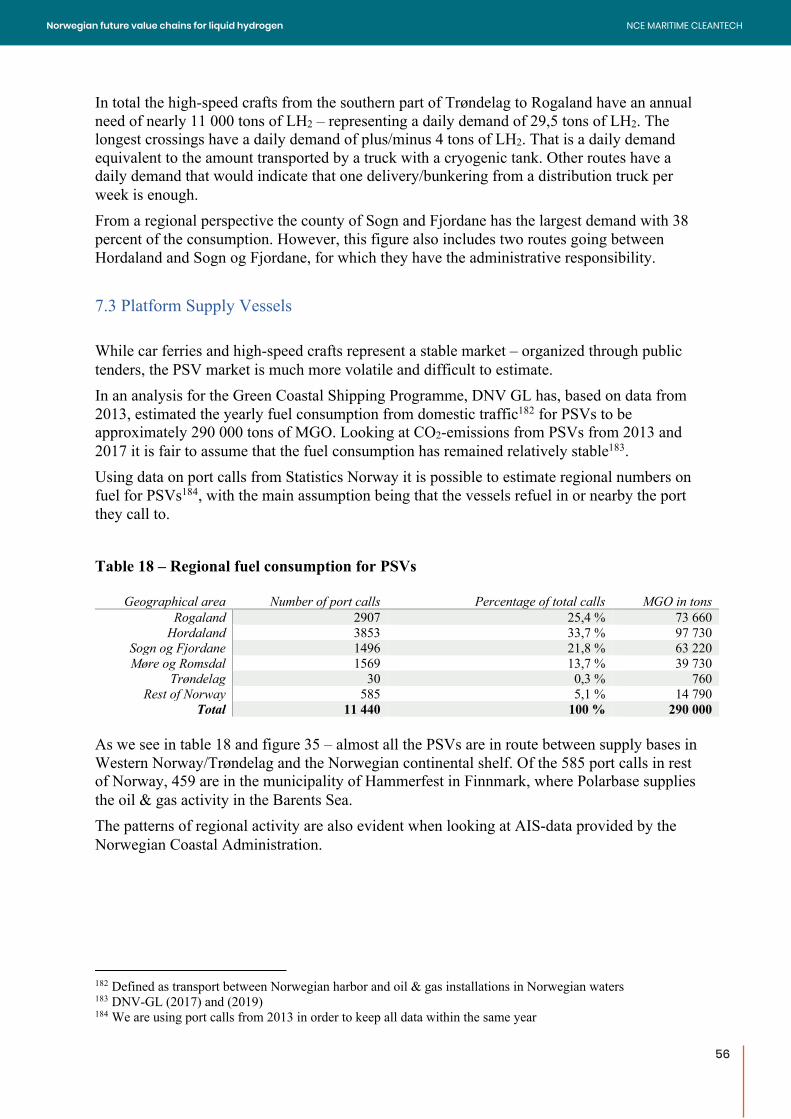
56
In total the high-speed crafts from the southern part of Trøndelag to Rogaland have an annual need of nearly 11 000 tons of LH2 – representing a daily demand of 29,5 tons of LH2. The longest crossings have a daily demand of plus/minus 4 tons of LH2. That is a daily demand equivalent to the amount transported by a truck with a cryogenic tank. Other routes have a daily demand that would indicate that one delivery/bunkering from a distribution truck per week is enough. From a regional perspective the county of Sogn and Fjordane has the largest demand with 38 percent of the consumption. However, this figure also includes two routes going between Hordaland and Sogn og Fjordane, for which they have the administrative responsibility. 7.3 Platform Supply Vessels While car ferries and high-speed crafts represent a stable market – organized through public tenders, the PSV market is much more volatile and difficult to estimate. In an analysis for the Green Coastal Shipping Programme, DNV GL has, based on data from 2013, estimated the yearly fuel consumption from domestic traffic182 for PSVs to be approximately 290 000 tons of MGO. Looking at CO2-emissions from PSVs from 2013 and 2017 it is fair to assume that the fuel consumption has remained relatively stable183. Using data on port calls from Statistics Norway it is possible to estimate regional numbers on fuel for PSVs184, with the main assumption being that the vessels refuel in or nearby the port they call to. Table 18 – Regional fuel consumption for PSVs
Geographical area Number of port calls Percentage of total calls MGO in tons Rogaland 2907 25,4 % 73 660
Hordaland 3853 33,7 % 97 730 Sogn og Fjordane 1496 21,8 % 63 220 Møre og Romsdal 1569 13,7 % 39 730
Trøndelag 30 0,3 % 760 Rest of Norway 585 5,1 % 14 790
Total 11 440 100 % 290 000 As we see in table 18 and figure 35 – almost all the PSVs are in route between supply bases in Western Norway/Trøndelag and the Norwegian continental shelf. Of the 585 port calls in rest of Norway, 459 are in the municipality of Hammerfest in Finnmark, where Polarbase supplies the oil & gas activity in the Barents Sea. The patterns of regional activity are also evident when looking at AIS-data provided by the Norwegian Coastal Administration.
182 Defined as transport between Norwegian harbor and oil & gas installations in Norwegian waters 183 DNV-GL (2017) and (2019) 184 We are using port calls from 2013 in order to keep all data within the same year
56
NCE MARITIME CLEANTECHNorwegian future value chains for liquid hydrogen
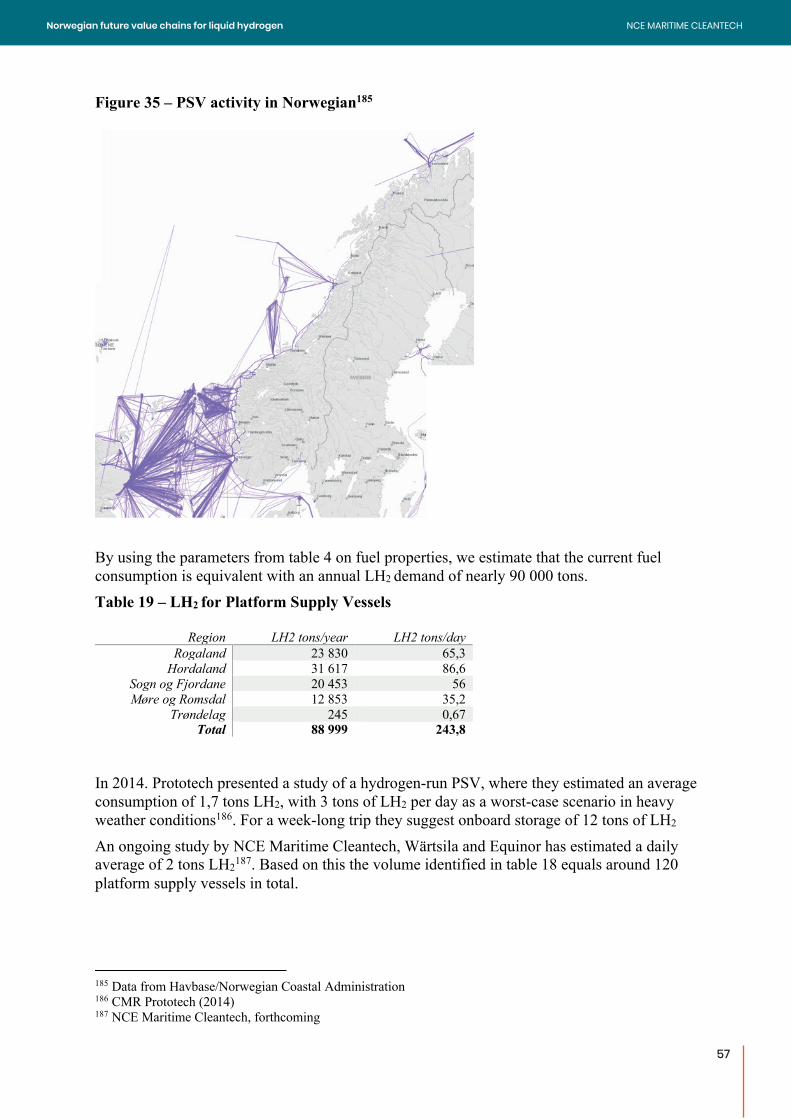
57
Figure 35 – PSV activity in Norwegian185
By using the parameters from table 4 on fuel properties, we estimate that the current fuel consumption is equivalent with an annual LH2 demand of nearly 90 000 tons. Table 19 – LH2 for Platform Supply Vessels
Region LH2 tons/year LH2 tons/day Rogaland 23 830 65,3
Hordaland 31 617 86,6 Sogn og Fjordane 20 453 56 Møre og Romsdal 12 853 35,2
Trøndelag 245 0,67 Total 88 999 243,8
In 2014. Prototech presented a study of a hydrogen-run PSV, where they estimated an average consumption of 1,7 tons LH2, with 3 tons of LH2 per day as a worst-case scenario in heavy weather conditions186. For a week-long trip they suggest onboard storage of 12 tons of LH2 An ongoing study by NCE Maritime Cleantech, Wärtsila and Equinor has estimated a daily average of 2 tons LH2187. Based on this the volume identified in table 18 equals around 120 platform supply vessels in total.
185 Data from Havbase/Norwegian Coastal Administration 186 CMR Prototech (2014) 187 NCE Maritime Cleantech, forthcoming
57
NCE MARITIME CLEANTECHNorwegian future value chains for liquid hydrogen
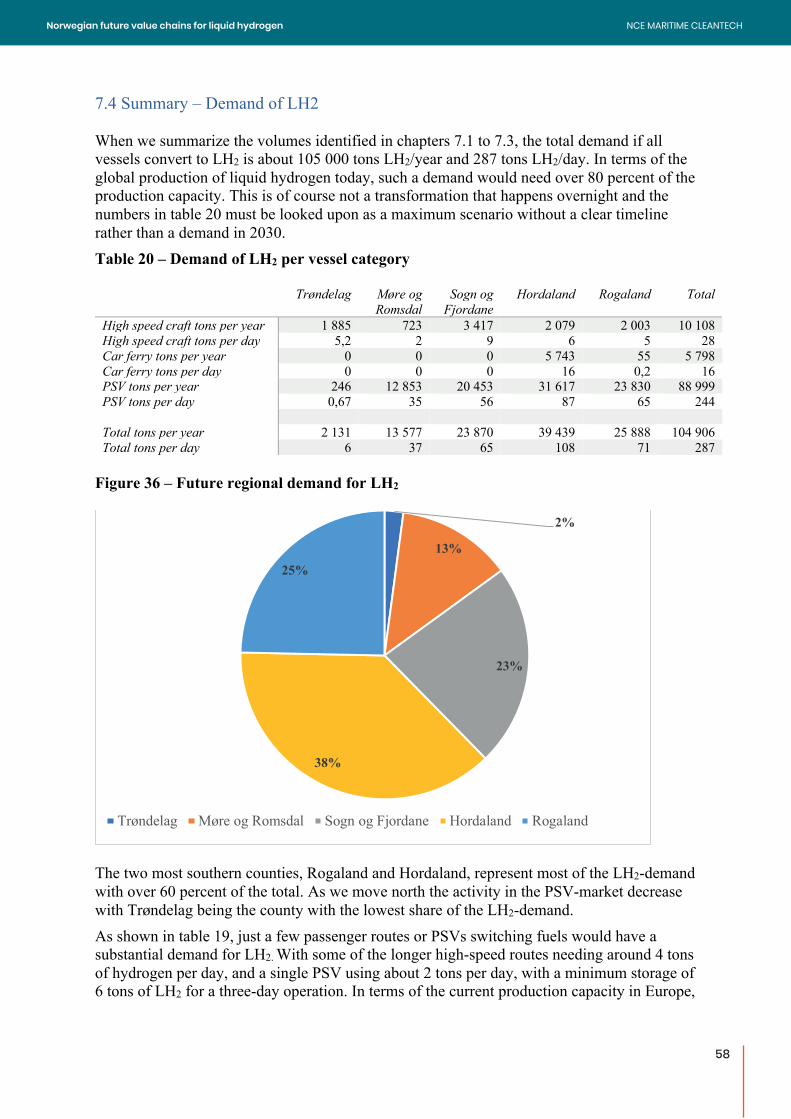
58
7.4 Summary – Demand of LH2 When we summarize the volumes identified in chapters 7.1 to 7.3, the total demand if all vessels convert to LH2 is about 105 000 tons LH2/year and 287 tons LH2/day. In terms of the global production of liquid hydrogen today, such a demand would need over 80 percent of the production capacity. This is of course not a transformation that happens overnight and the numbers in table 20 must be looked upon as a maximum scenario without a clear timeline rather than a demand in 2030. Table 20 – Demand of LH2 per vessel category
Trøndelag Møre og Romsdal
Sogn og Fjordane
Hordaland Rogaland Total
High speed craft tons per year 1 885 723 3 417 2 079 2 003 10 108 High speed craft tons per day 5,2 2 9 6 5 28 Car ferry tons per year 0 0 0 5 743 55 5 798 Car ferry tons per day 0 0 0 16 0,2 16 PSV tons per year 246 12 853 20 453 31 617 23 830 88 999 PSV tons per day 0,67 35 56 87 65 244
Total tons per year 2 131 13 577 23 870 39 439 25 888 104 906 Total tons per day 6 37 65 108 71 287
Figure 36 – Future regional demand for LH2
The two most southern counties, Rogaland and Hordaland, represent most of the LH2-demand with over 60 percent of the total. As we move north the activity in the PSV-market decrease with Trøndelag being the county with the lowest share of the LH2-demand. As shown in table 19, just a few passenger routes or PSVs switching fuels would have a substantial demand for LH2. With some of the longer high-speed routes needing around 4 tons of hydrogen per day, and a single PSV using about 2 tons per day, with a minimum storage of 6 tons of LH2 for a three-day operation. In terms of the current production capacity in Europe,
2%
13%
23%
38%
25%
Trøndelag Møre og Romsdal Sogn og Fjordane Hordaland Rogaland
58
NCE MARITIME CLEANTECHNorwegian future value chains for liquid hydrogen
59
even the demand in Trøndelag from high-speed crafts equals the total capacity of either Lindes or Air Products liquefaction plants in Leuna and Rotterdam. Without considering each individual car ferry, high-speed route or PSV we have also estimated the volume of LH2 needed for a 50 and 25 percent conversion from MGO and LNG. The 25 percent-scenario is close to DNV-GLs estimate for 2030 and should be a realistic demand for the next 10-15 years in Western Norway, especially if upcoming tenders for the major high-speed crafts in Sogn og Fjordane and Trøndelag includes hydrogen as a potential energy carrier. Table 21 – Demand of LH2 – different scenarios188
Scenario 100 % conversion to LH2 50 % conversion to LH2 25 % conversion to LH2 County t/year t/day t/year t/day t/year t/day
Trøndelag 2 131 6 1 066 3 533 1,5 Møre og Romsdal
13 577 37 6 789 19 3 394 9
Sogn og Fjordane
23 870 65 11 935 33 5 968 16
Hordaland 39 439 108 19 720 54 9 860 27 Rogaland 25 888 71 12 944 36 6 472 18
Total 104 905 287 52 454 144 26 227 72
Another way to calculate future market demand is to argue that the transformation of publicly tendered vessels will happen faster than in the private sector. Here, the authorities can include criteria for emission reduction that operators must follow. Also, hydrogen-powered car ferries and high-speed crafts are expected in 2021-22. From car ferries and high-speed crafts alone, the total demand of LH2 is 44 tons per day, with a gravity of demand in the three southern counties. In figures 37-40 we have visualized the volumes geographically. We have chosen to have separate maps for public tendered car ferries and high-speed crafts suitable for LH2 and one indicating consumption for platform supply vessels.
188 Figures are rounded to nearest whole number
59
NCE MARITIME CLEANTECHNorwegian future value chains for liquid hydrogen
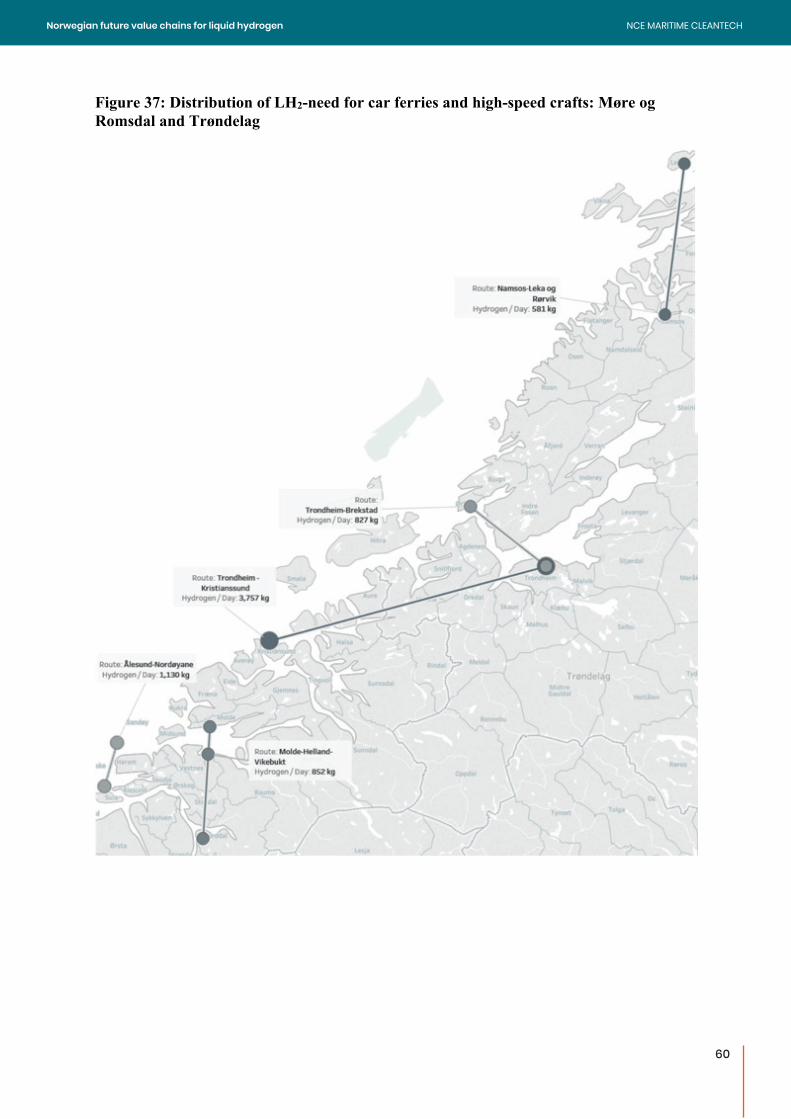
60
Figure 37: Distribution of LH2-need for car ferries and high-speed crafts: Møre og Romsdal and Trøndelag
60
NCE MARITIME CLEANTECHNorwegian future value chains for liquid hydrogen
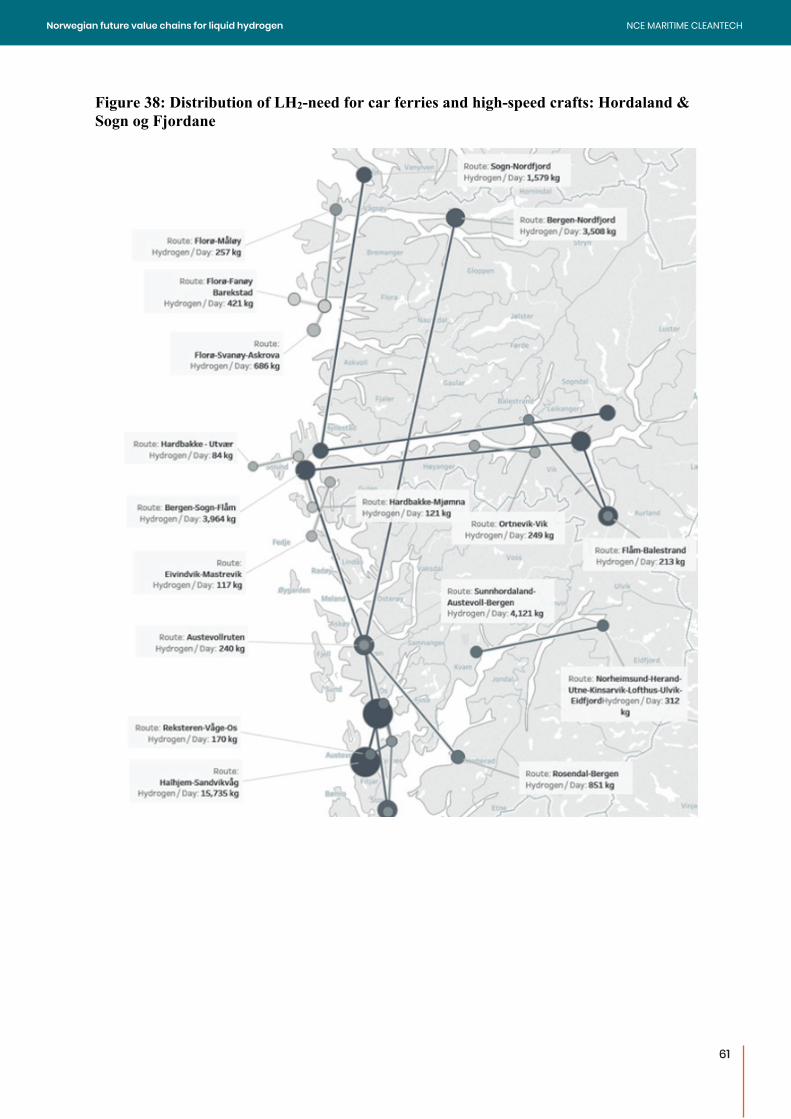
61
Figure 38: Distribution of LH2-need for car ferries and high-speed crafts: Hordaland & Sogn og Fjordane
61
NCE MARITIME CLEANTECHNorwegian future value chains for liquid hydrogen
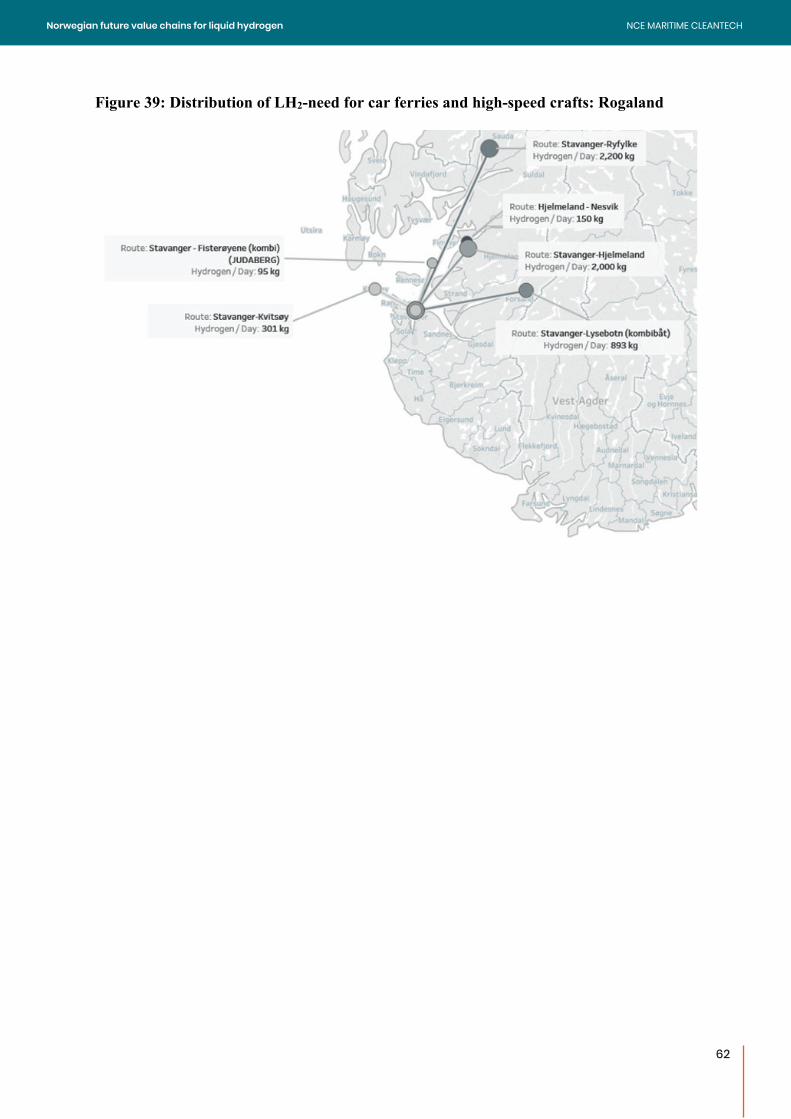
62
Figure 39: Distribution of LH2-need for car ferries and high-speed crafts: Rogaland
62
NCE MARITIME CLEANTECHNorwegian future value chains for liquid hydrogen
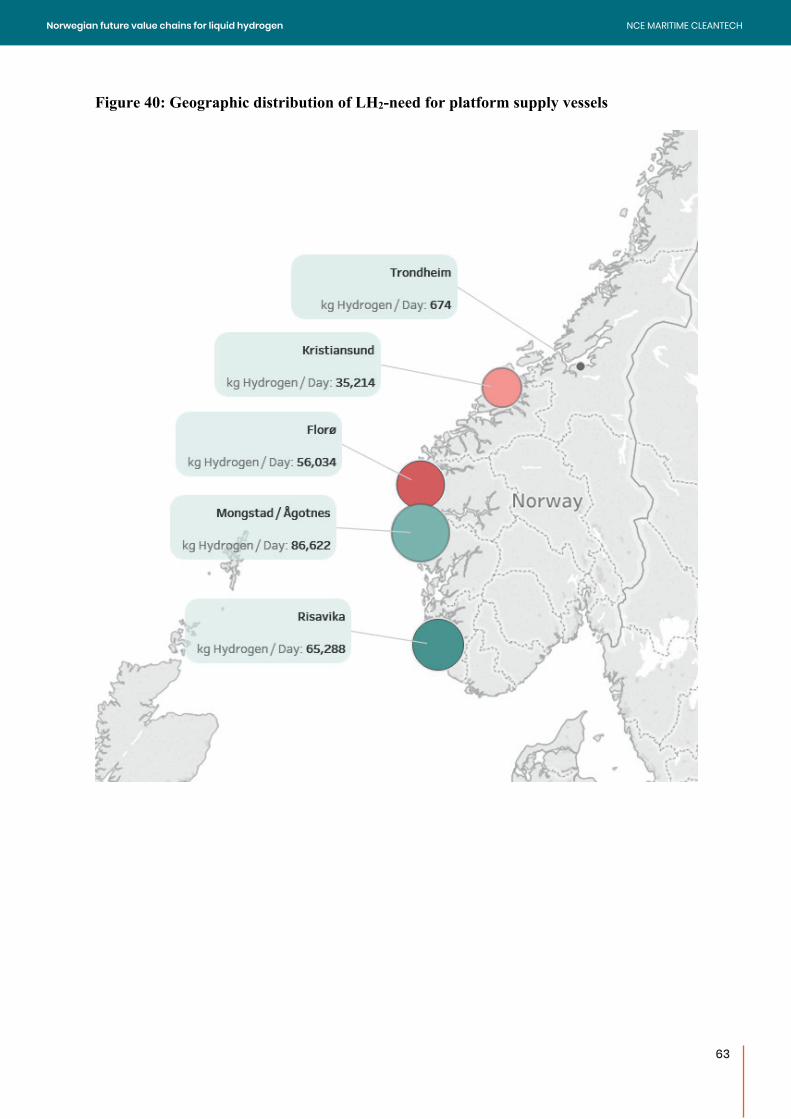
63
Figure 40: Geographic distribution of LH2-need for platform supply vessels
63
NCE MARITIME CLEANTECHNorwegian future value chains for liquid hydrogen

64
7.5 Energy need – natural gas and electricity Even with 25 percent of the current fuel consumption by car ferries, high-speed crafts and PSVs switching to LH2, it represents a daily demand of just above 70 tons/day. This is about 3,5 times more than the current European liquefaction capacity. In order to achieve a larger restructuring of fuel in the maritime sector the volumes clearly show that in order to supply the Norwegian maritime sector with green hydrogen it is necessary to establish local production of hydrogen and liquification plants in Norway. Following this line of thought, we have calculated the necessary energy input to produce the amounts above from either electrolysis or gas reformation. For each scenario we first identified how much energy the estimated volume of LH2 contained. Secondly, using efficiency data for electrolysers and gas reformation plants with carbon capture and liquefaction plants, both state-of-the-art and with future technology developments, we estimated how much electricity and grid capacity, or natural gas is needed. With a lower heating value of 33,3 kWh/kg LH2 the volumes presented in table 20 above represent an annual energy amount ranging from 0,6 to 3,5 TWh. Considering the energy efficiency of electrolysis and gas reformation with carbon capture and the subsequent liquefaction, the needed energy input is nearly the double with today’s technology. Table 22: Energy needed for H2 production - Today and Future189
Scenario DNV-GL 2030 25 % 50 % 100 % Ton H2 17 900 26 277 52 454 104 906
Energy from H2 (TWh) 0,60 0,80 1,75 3,50 Electricity demand – today/future (TWh) 1,1/1 1,7/1,4 3,3/2,9 6,6/5,8
Total cap. load from grid – today/future (MW) 129/122 189/165 377/329 754/659 Demand of natural gas (Million SM3) 104,2/93,8 153,1/137,7 305,6/275 611,1/550
If produced by electrolysis the volumes described in this report would require a substantial amount of the Norwegian electricity surplus. In 2018 Norway produced 146 TWh of electricity, mainly from hydropower, and had a gross consumption of 136 TWh, resulting in a surplus of ca 10 TWh190. The volumes estimated by DNV-GL in 2030 would require 11 percent of this surplus, while a complete change to LH2 for the vessels included in our scenario would require 66 percent of the surplus energy of 2018. A county breakdown of gross consumption is not publicly available from Statistics Norway, but using net consumption shows that the counties of Rogaland, Hordaland and Sogn og Fjordane has a substantial surplus of electricity191. While Møre og Romsdal and Trøndelag does not have the same surplus of electricity, the natural gas facility at Tjeldbergodden process volumes that are more than large enough to provide hydrogen from gas reformation to the region (and beyond).
189 Calculations are made from electrolyser data from IRENA (2018), liquefaction data from the Idealhy-project and calculations on SMR and carbon capture from IEAGHG (2017) 190 Statistics Norway (2019a) 191 Statistics Norway (2019d) and (2019e)
64
NCE MARITIME CLEANTECHNorwegian future value chains for liquid hydrogen
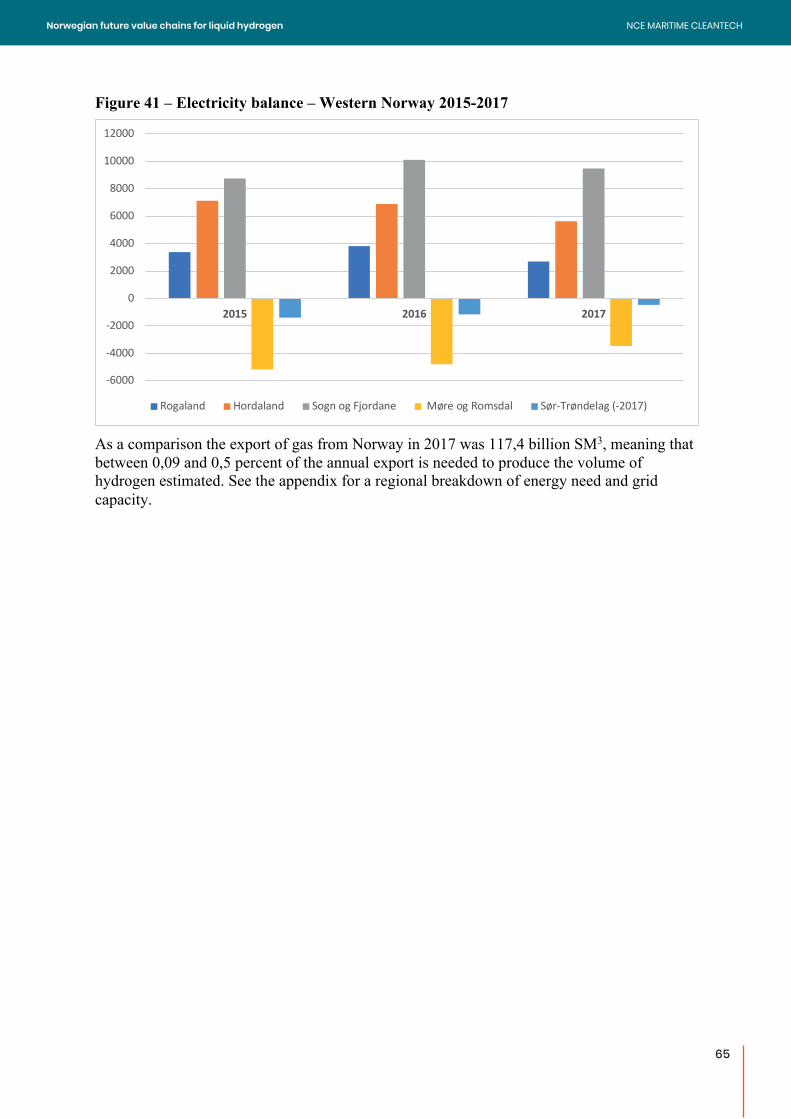
65
Figure 41 – Electricity balance – Western Norway 2015-2017
As a comparison the export of gas from Norway in 2017 was 117,4 billion SM3, meaning that between 0,09 and 0,5 percent of the annual export is needed to produce the volume of hydrogen estimated. See the appendix for a regional breakdown of energy need and grid capacity.
-6000
-4000
-2000
0
2000
4000
6000
8000
10000
12000
2015 2016 2017
Rogaland Hordaland Sogn og Fjordane Møre og Romsdal Sør-Trøndelag (-2017)
65
NCE MARITIME CLEANTECHNorwegian future value chains for liquid hydrogen
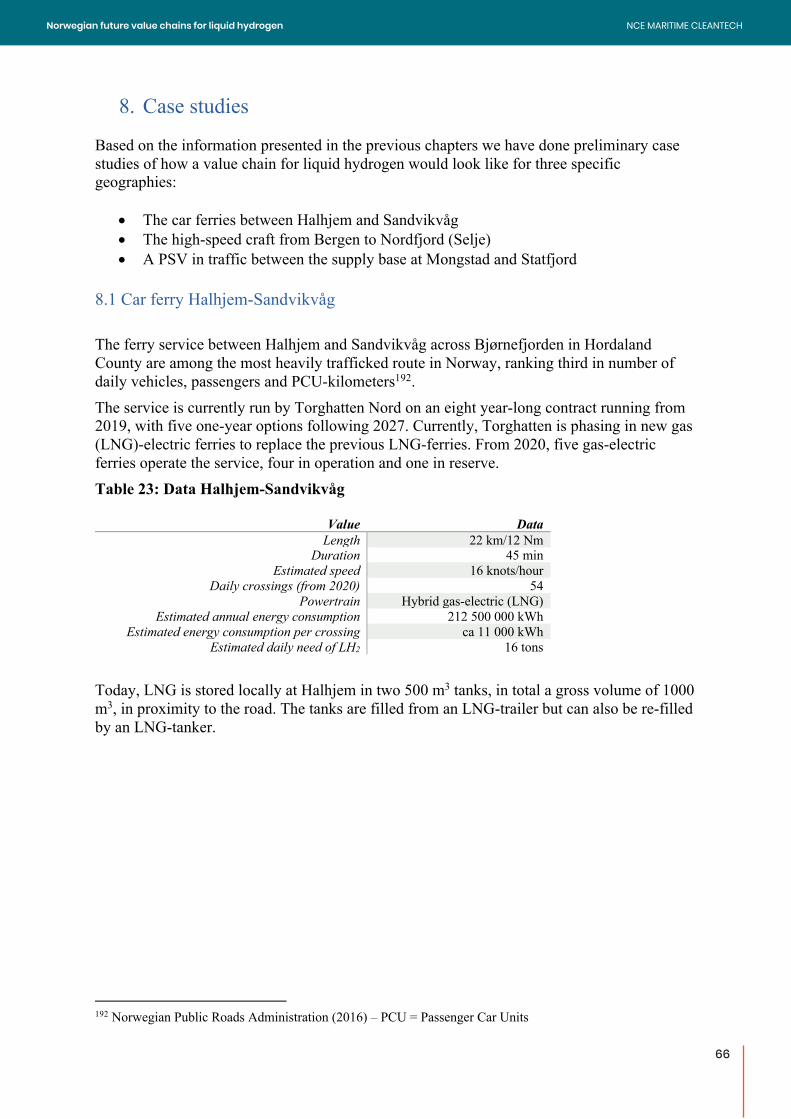
66
8. Case studies Based on the information presented in the previous chapters we have done preliminary case studies of how a value chain for liquid hydrogen would look like for three specific geographies:
• The car ferries between Halhjem and Sandvikvåg • The high-speed craft from Bergen to Nordfjord (Selje) • A PSV in traffic between the supply base at Mongstad and Statfjord
8.1 Car ferry Halhjem-Sandvikvåg The ferry service between Halhjem and Sandvikvåg across Bjørnefjorden in Hordaland County are among the most heavily trafficked route in Norway, ranking third in number of daily vehicles, passengers and PCU-kilometers192. The service is currently run by Torghatten Nord on an eight year-long contract running from 2019, with five one-year options following 2027. Currently, Torghatten is phasing in new gas (LNG)-electric ferries to replace the previous LNG-ferries. From 2020, five gas-electric ferries operate the service, four in operation and one in reserve. Table 23: Data Halhjem-Sandvikvåg
Value Data Length 22 km/12 Nm
Duration 45 min Estimated speed 16 knots/hour
Daily crossings (from 2020) 54 Powertrain Hybrid gas-electric (LNG)
Estimated annual energy consumption 212 500 000 kWh Estimated energy consumption per crossing ca 11 000 kWh
Estimated daily need of LH2 16 tons Today, LNG is stored locally at Halhjem in two 500 m3 tanks, in total a gross volume of 1000 m3, in proximity to the road. The tanks are filled from an LNG-trailer but can also be re-filled by an LNG-tanker.
192 Norwegian Public Roads Administration (2016) – PCU = Passenger Car Units
66
NCE MARITIME CLEANTECHNorwegian future value chains for liquid hydrogen
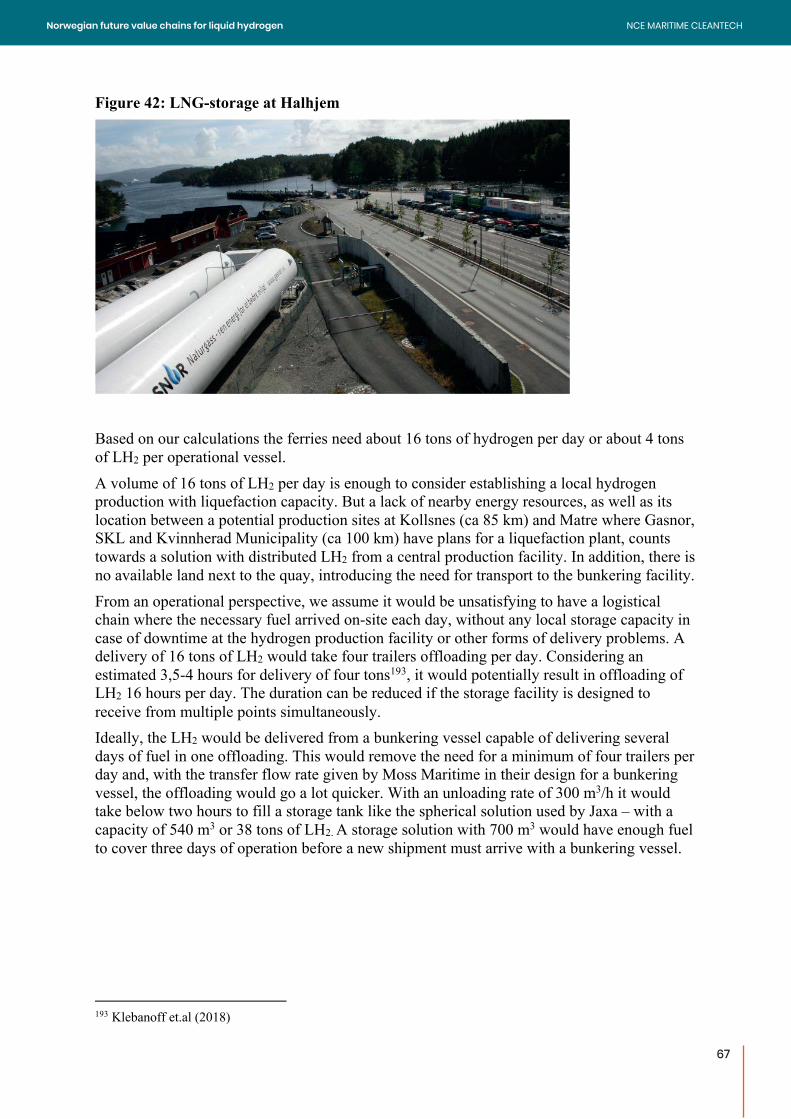
67
Figure 42: LNG-storage at Halhjem
Based on our calculations the ferries need about 16 tons of hydrogen per day or about 4 tons of LH2 per operational vessel. A volume of 16 tons of LH2 per day is enough to consider establishing a local hydrogen production with liquefaction capacity. But a lack of nearby energy resources, as well as its location between a potential production sites at Kollsnes (ca 85 km) and Matre where Gasnor, SKL and Kvinnherad Municipality (ca 100 km) have plans for a liquefaction plant, counts towards a solution with distributed LH2 from a central production facility. In addition, there is no available land next to the quay, introducing the need for transport to the bunkering facility. From an operational perspective, we assume it would be unsatisfying to have a logistical chain where the necessary fuel arrived on-site each day, without any local storage capacity in case of downtime at the hydrogen production facility or other forms of delivery problems. A delivery of 16 tons of LH2 would take four trailers offloading per day. Considering an estimated 3,5-4 hours for delivery of four tons193, it would potentially result in offloading of LH2 16 hours per day. The duration can be reduced if the storage facility is designed to receive from multiple points simultaneously. Ideally, the LH2 would be delivered from a bunkering vessel capable of delivering several days of fuel in one offloading. This would remove the need for a minimum of four trailers per day and, with the transfer flow rate given by Moss Maritime in their design for a bunkering vessel, the offloading would go a lot quicker. With an unloading rate of 300 m3/h it would take below two hours to fill a storage tank like the spherical solution used by Jaxa – with a capacity of 540 m3 or 38 tons of LH2. A storage solution with 700 m3 would have enough fuel to cover three days of operation before a new shipment must arrive with a bunkering vessel.
193 Klebanoff et.al (2018)
67
NCE MARITIME CLEANTECHNorwegian future value chains for liquid hydrogen
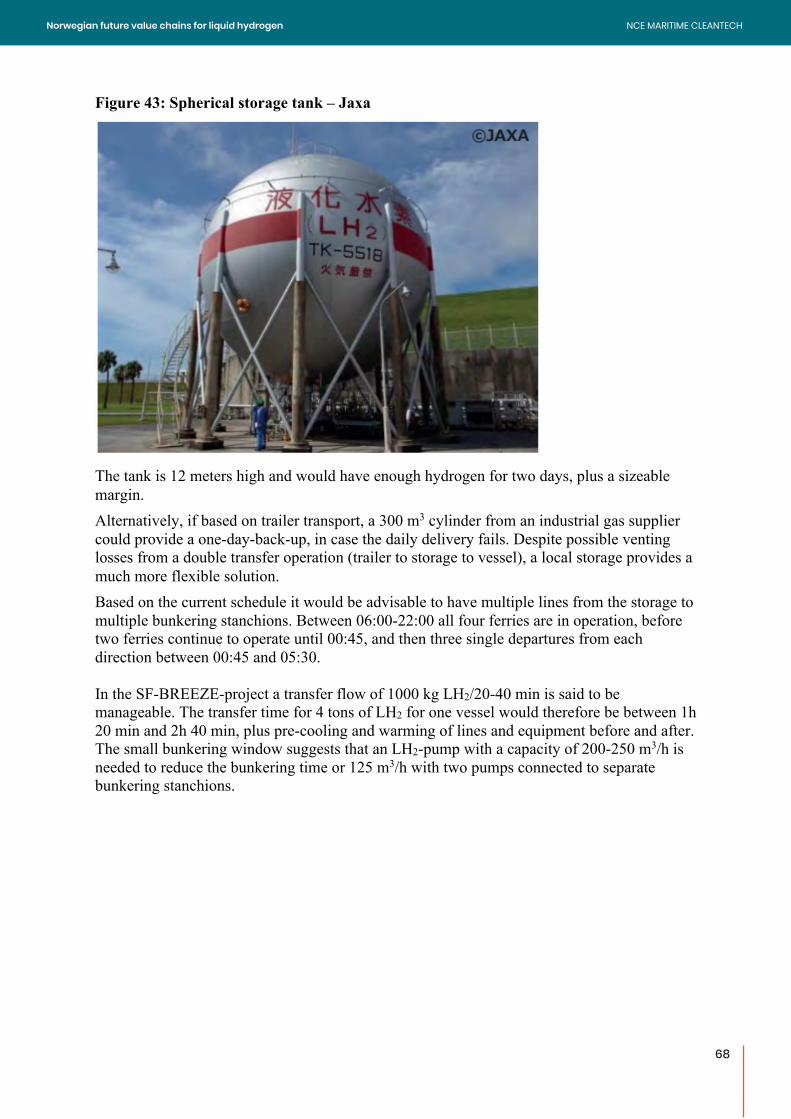
68
Figure 43: Spherical storage tank – Jaxa
The tank is 12 meters high and would have enough hydrogen for two days, plus a sizeable margin. Alternatively, if based on trailer transport, a 300 m3 cylinder from an industrial gas supplier could provide a one-day-back-up, in case the daily delivery fails. Despite possible venting losses from a double transfer operation (trailer to storage to vessel), a local storage provides a much more flexible solution. Based on the current schedule it would be advisable to have multiple lines from the storage to multiple bunkering stanchions. Between 06:00-22:00 all four ferries are in operation, before two ferries continue to operate until 00:45, and then three single departures from each direction between 00:45 and 05:30. In the SF-BREEZE-project a transfer flow of 1000 kg LH2/20-40 min is said to be manageable. The transfer time for 4 tons of LH2 for one vessel would therefore be between 1h 20 min and 2h 40 min, plus pre-cooling and warming of lines and equipment before and after. The small bunkering window suggests that an LH2-pump with a capacity of 200-250 m3/h is needed to reduce the bunkering time or 125 m3/h with two pumps connected to separate bunkering stanchions.
68
NCE MARITIME CLEANTECHNorwegian future value chains for liquid hydrogen
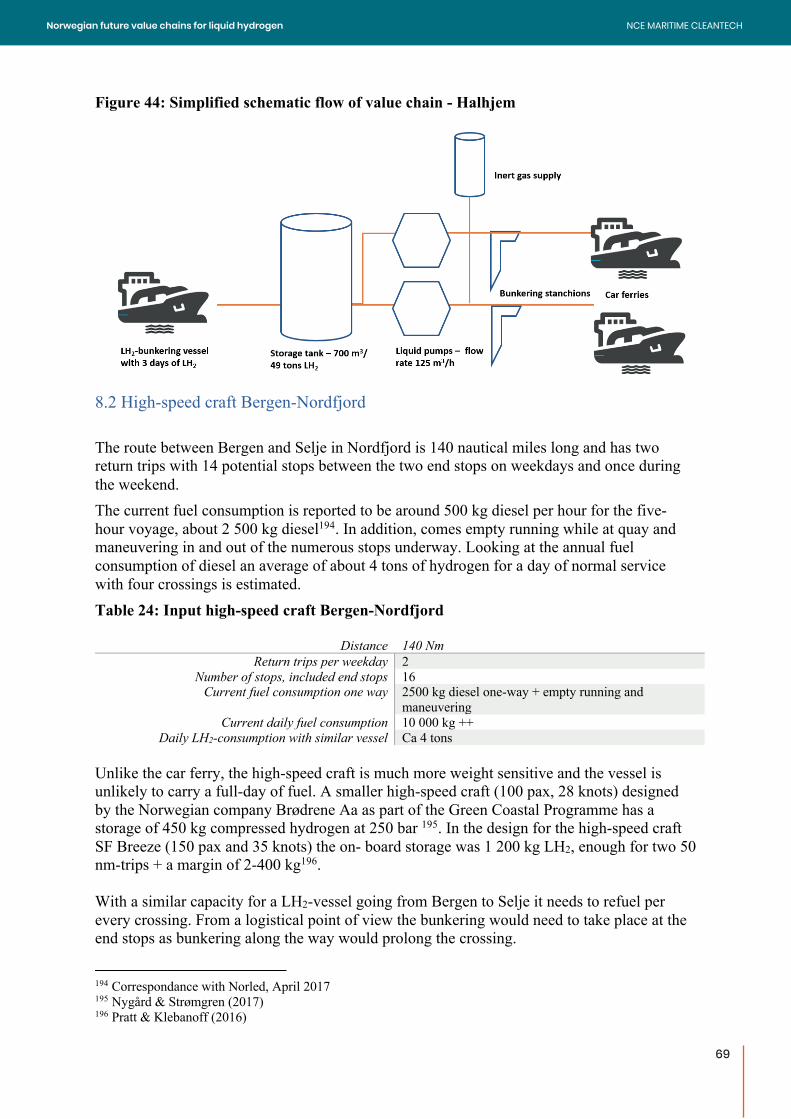
69
Figure 44: Simplified schematic flow of value chain - Halhjem
8.2 High-speed craft Bergen-Nordfjord The route between Bergen and Selje in Nordfjord is 140 nautical miles long and has two return trips with 14 potential stops between the two end stops on weekdays and once during the weekend. The current fuel consumption is reported to be around 500 kg diesel per hour for the five- hour voyage, about 2 500 kg diesel194. In addition, comes empty running while at quay and maneuvering in and out of the numerous stops underway. Looking at the annual fuel consumption of diesel an average of about 4 tons of hydrogen for a day of normal service with four crossings is estimated. Table 24: Input high-speed craft Bergen-Nordfjord
Distance 140 Nm Return trips per weekday 2
Number of stops, included end stops 16 Current fuel consumption one way 2500 kg diesel one-way + empty running and
maneuvering Current daily fuel consumption 10 000 kg ++
Daily LH2-consumption with similar vessel Ca 4 tons Unlike the car ferry, the high-speed craft is much more weight sensitive and the vessel is unlikely to carry a full-day of fuel. A smaller high-speed craft (100 pax, 28 knots) designed by the Norwegian company Brødrene Aa as part of the Green Coastal Programme has a storage of 450 kg compressed hydrogen at 250 bar 195. In the design for the high-speed craft SF Breeze (150 pax and 35 knots) the on- board storage was 1 200 kg LH2, enough for two 50 nm-trips + a margin of 2-400 kg196. With a similar capacity for a LH2-vessel going from Bergen to Selje it needs to refuel per every crossing. From a logistical point of view the bunkering would need to take place at the end stops as bunkering along the way would prolong the crossing.
194 Correspondance with Norled, April 2017 195 Nygård & Strømgren (2017) 196 Pratt & Klebanoff (2016)
69
NCE MARITIME CLEANTECHNorwegian future value chains for liquid hydrogen
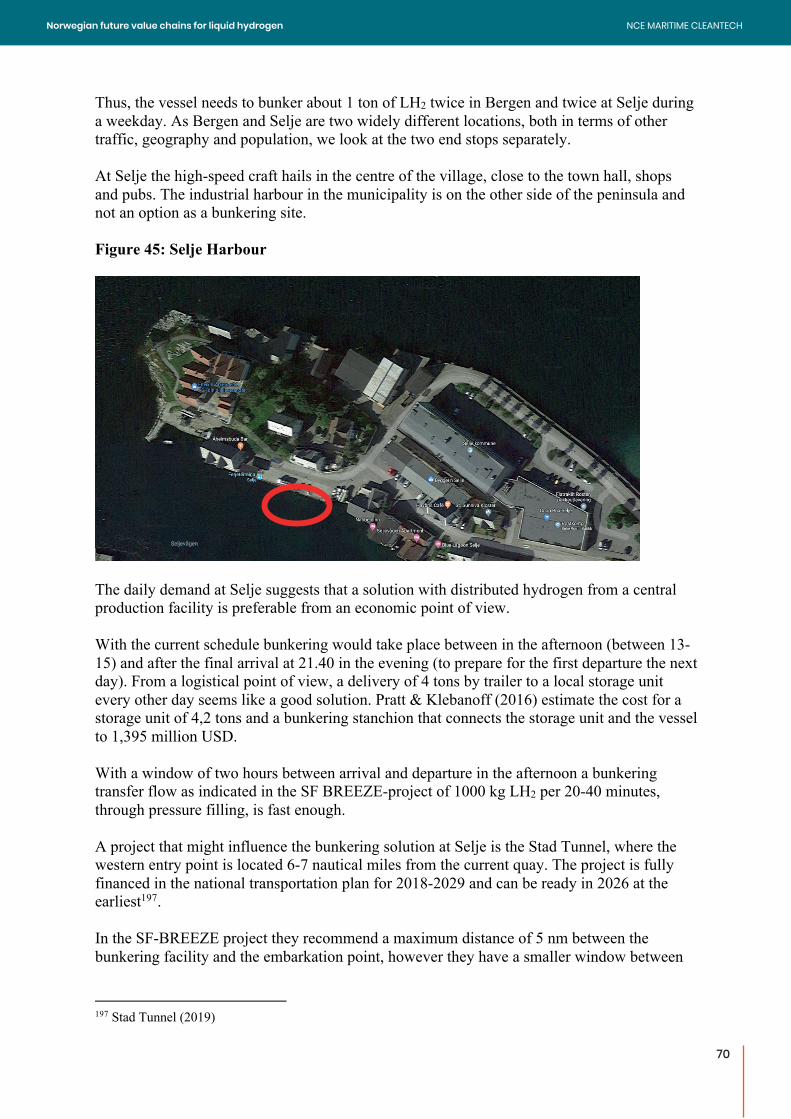
70
Thus, the vessel needs to bunker about 1 ton of LH2 twice in Bergen and twice at Selje during a weekday. As Bergen and Selje are two widely different locations, both in terms of other traffic, geography and population, we look at the two end stops separately. At Selje the high-speed craft hails in the centre of the village, close to the town hall, shops and pubs. The industrial harbour in the municipality is on the other side of the peninsula and not an option as a bunkering site. Figure 45: Selje Harbour
The daily demand at Selje suggests that a solution with distributed hydrogen from a central production facility is preferable from an economic point of view. With the current schedule bunkering would take place between in the afternoon (between 13-15) and after the final arrival at 21.40 in the evening (to prepare for the first departure the next day). From a logistical point of view, a delivery of 4 tons by trailer to a local storage unit every other day seems like a good solution. Pratt & Klebanoff (2016) estimate the cost for a storage unit of 4,2 tons and a bunkering stanchion that connects the storage unit and the vessel to 1,395 million USD. With a window of two hours between arrival and departure in the afternoon a bunkering transfer flow as indicated in the SF BREEZE-project of 1000 kg LH2 per 20-40 minutes, through pressure filling, is fast enough. A project that might influence the bunkering solution at Selje is the Stad Tunnel, where the western entry point is located 6-7 nautical miles from the current quay. The project is fully financed in the national transportation plan for 2018-2029 and can be ready in 2026 at the earliest197. In the SF-BREEZE project they recommend a maximum distance of 5 nm between the bunkering facility and the embarkation point, however they have a smaller window between
197 Stad Tunnel (2019)
70
NCE MARITIME CLEANTECHNorwegian future value chains for liquid hydrogen
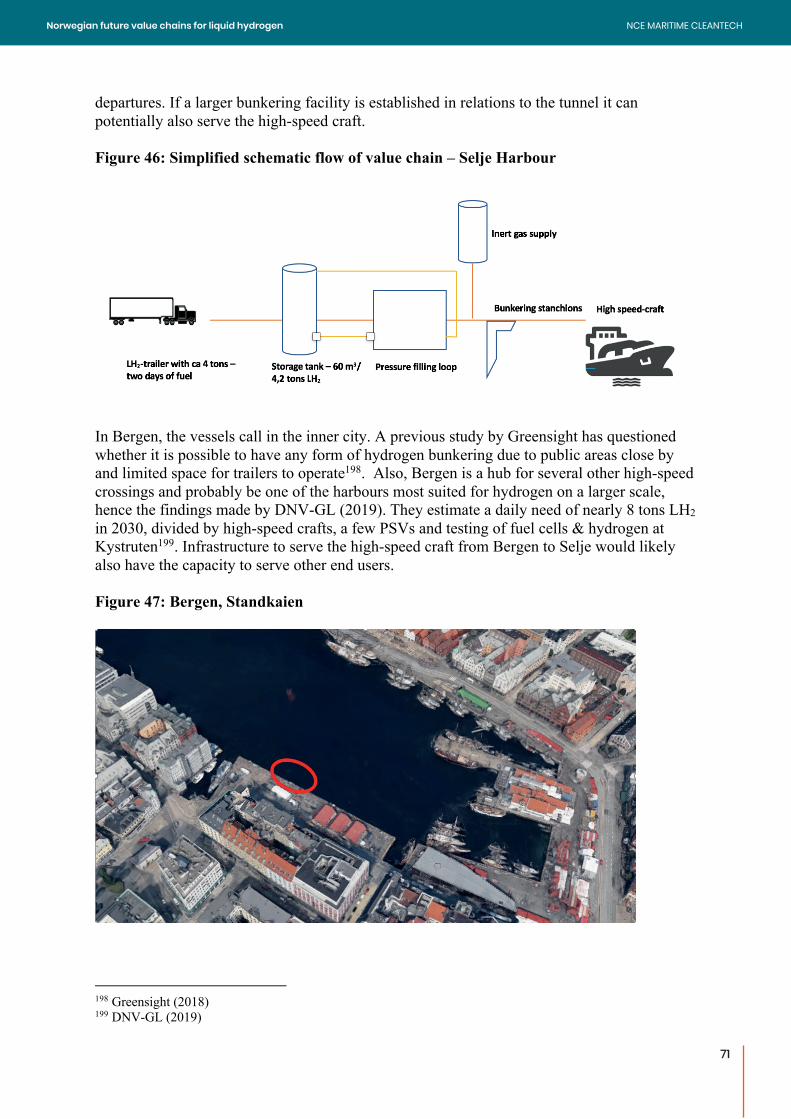
71
departures. If a larger bunkering facility is established in relations to the tunnel it can potentially also serve the high-speed craft. Figure 46: Simplified schematic flow of value chain – Selje Harbour
In Bergen, the vessels call in the inner city. A previous study by Greensight has questioned whether it is possible to have any form of hydrogen bunkering due to public areas close by and limited space for trailers to operate198. Also, Bergen is a hub for several other high-speed crossings and probably be one of the harbours most suited for hydrogen on a larger scale, hence the findings made by DNV-GL (2019). They estimate a daily need of nearly 8 tons LH2 in 2030, divided by high-speed crafts, a few PSVs and testing of fuel cells & hydrogen at Kystruten199. Infrastructure to serve the high-speed craft from Bergen to Selje would likely also have the capacity to serve other end users. Figure 47: Bergen, Standkaien
198 Greensight (2018) 199 DNV-GL (2019)
71
NCE MARITIME CLEANTECHNorwegian future value chains for liquid hydrogen
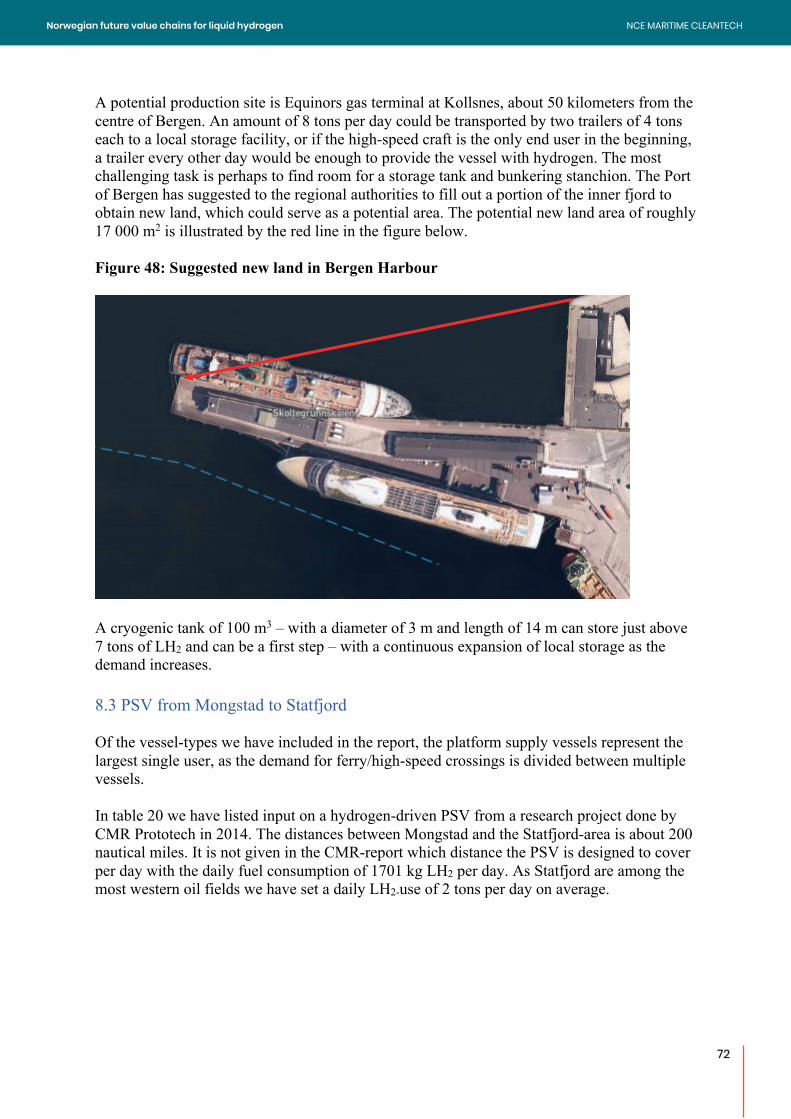
72
A potential production site is Equinors gas terminal at Kollsnes, about 50 kilometers from the centre of Bergen. An amount of 8 tons per day could be transported by two trailers of 4 tons each to a local storage facility, or if the high-speed craft is the only end user in the beginning, a trailer every other day would be enough to provide the vessel with hydrogen. The most challenging task is perhaps to find room for a storage tank and bunkering stanchion. The Port of Bergen has suggested to the regional authorities to fill out a portion of the inner fjord to obtain new land, which could serve as a potential area. The potential new land area of roughly 17 000 m2 is illustrated by the red line in the figure below. Figure 48: Suggested new land in Bergen Harbour
A cryogenic tank of 100 m3 – with a diameter of 3 m and length of 14 m can store just above 7 tons of LH2 and can be a first step – with a continuous expansion of local storage as the demand increases. 8.3 PSV from Mongstad to Statfjord Of the vessel-types we have included in the report, the platform supply vessels represent the largest single user, as the demand for ferry/high-speed crossings is divided between multiple vessels. In table 20 we have listed input on a hydrogen-driven PSV from a research project done by CMR Prototech in 2014. The distances between Mongstad and the Statfjord-area is about 200 nautical miles. It is not given in the CMR-report which distance the PSV is designed to cover per day with the daily fuel consumption of 1701 kg LH2 per day. As Statfjord are among the most western oil fields we have set a daily LH2-use of 2 tons per day on average.
72
NCE MARITIME CLEANTECHNorwegian future value chains for liquid hydrogen
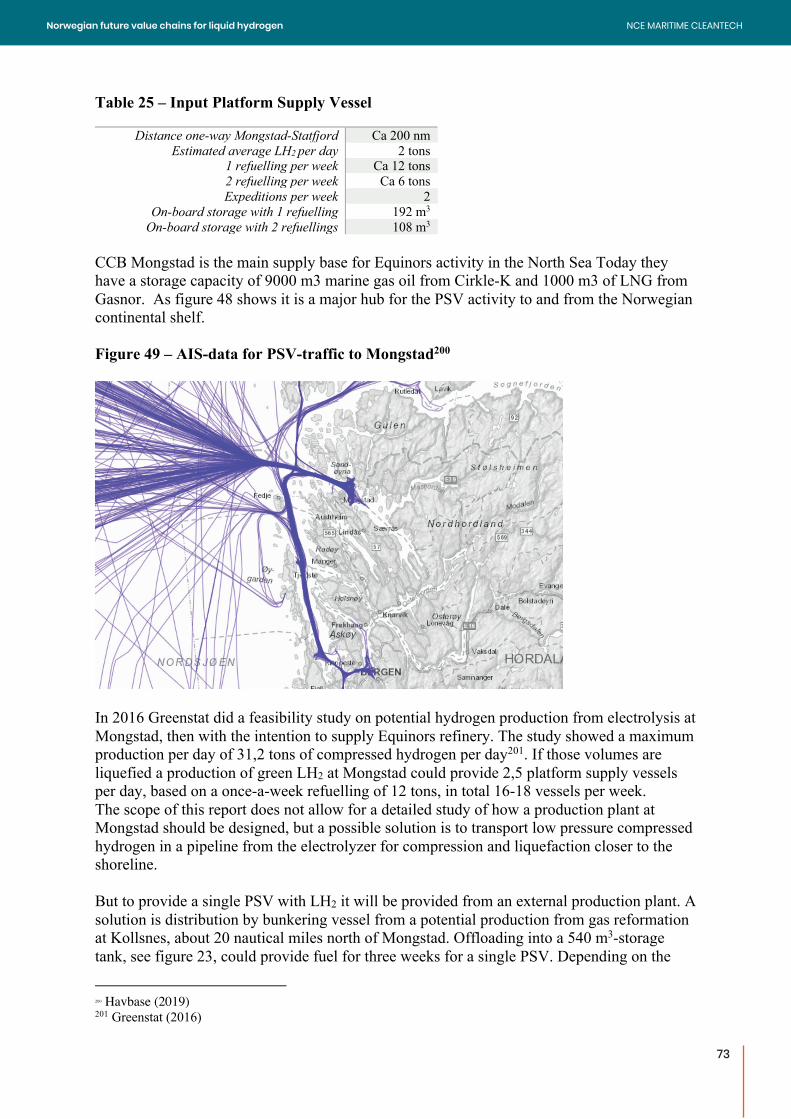
73
Table 25 – Input Platform Supply Vessel
Distance one-way Mongstad-Statfjord Ca 200 nm Estimated average LH2 per day 2 tons
1 refuelling per week Ca 12 tons 2 refuelling per week Ca 6 tons Expeditions per week 2
On-board storage with 1 refuelling 192 m3 On-board storage with 2 refuellings 108 m3
CCB Mongstad is the main supply base for Equinors activity in the North Sea Today they have a storage capacity of 9000 m3 marine gas oil from Cirkle-K and 1000 m3 of LNG from Gasnor. As figure 48 shows it is a major hub for the PSV activity to and from the Norwegian continental shelf. Figure 49 – AIS-data for PSV-traffic to Mongstad200
In 2016 Greenstat did a feasibility study on potential hydrogen production from electrolysis at Mongstad, then with the intention to supply Equinors refinery. The study showed a maximum production per day of 31,2 tons of compressed hydrogen per day201. If those volumes are liquefied a production of green LH2 at Mongstad could provide 2,5 platform supply vessels per day, based on a once-a-week refuelling of 12 tons, in total 16-18 vessels per week. The scope of this report does not allow for a detailed study of how a production plant at Mongstad should be designed, but a possible solution is to transport low pressure compressed hydrogen in a pipeline from the electrolyzer for compression and liquefaction closer to the shoreline. But to provide a single PSV with LH2 it will be provided from an external production plant. A solution is distribution by bunkering vessel from a potential production from gas reformation at Kollsnes, about 20 nautical miles north of Mongstad. Offloading into a 540 m3-storage tank, see figure 23, could provide fuel for three weeks for a single PSV. Depending on the
200 Havbase (2019) 201 Greenstat (2016)
73
NCE MARITIME CLEANTECHNorwegian future value chains for liquid hydrogen
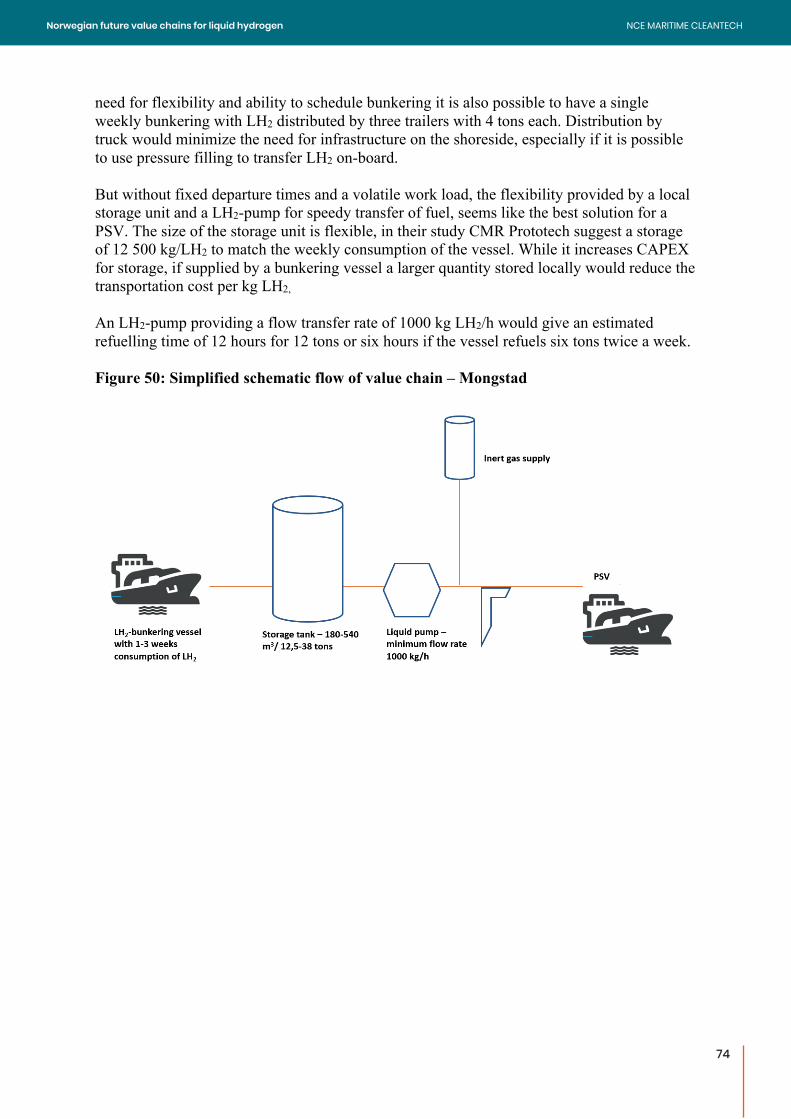
74
need for flexibility and ability to schedule bunkering it is also possible to have a single weekly bunkering with LH2 distributed by three trailers with 4 tons each. Distribution by truck would minimize the need for infrastructure on the shoreside, especially if it is possible to use pressure filling to transfer LH2 on-board. But without fixed departure times and a volatile work load, the flexibility provided by a local storage unit and a LH2-pump for speedy transfer of fuel, seems like the best solution for a PSV. The size of the storage unit is flexible, in their study CMR Prototech suggest a storage of 12 500 kg/LH2 to match the weekly consumption of the vessel. While it increases CAPEX for storage, if supplied by a bunkering vessel a larger quantity stored locally would reduce the transportation cost per kg LH2, An LH2-pump providing a flow transfer rate of 1000 kg LH2/h would give an estimated refuelling time of 12 hours for 12 tons or six hours if the vessel refuels six tons twice a week. Figure 50: Simplified schematic flow of value chain – Mongstad
74
NCE MARITIME CLEANTECHNorwegian future value chains for liquid hydrogen
75
9. Summary: Barriers for a liquid hydrogen value chain The goal of this report was to examine a future value chain for liquid hydrogen in Norway, with a special focus on car ferries, high-speed crafts and platform supply vessels. This has identified several barriers that need increased intention in the years to come. Demand for liquid hydrogen: A first step for a Norwegian value chain is to create a demand that leads to production of liquid hydrogen in Norway. Our volume scenarios and cost comparisons clearly show that the current European capacity is both too small and distant to serve a Norwegian maritime market. And even with the LH2-prices available in Europe, the cost per kWt to the propeller of a vessel represents a substantial increase in fuel cost. To reduce cost per kg the research literature clearly states that size matters. In combination with technology improvements a tenfold increase in production capacity per day can reduce the energy needed for liquefaction by 50 percent202. A minimum production capacity of 10-15 tons LH2 per day has been mentioned by Equinor and SKL/Gasnor for their potential production at Tjeldbergodden and Kvinnherad. A large barrier is therefore to substantiate a demand of liquid hydrogen large enough for trigger investment in hydrogen production and liquefaction in Norway. As seen from the development of electric ferries and the first car ferry on LH2, public tenders can be an effective tool. Our data on future demand high-speed crafts show that several crossings would require around 4 tons per day and the car ferry crossing from Halhjem to Sandvikvåg requiring around 15 tons per day on its own. Cost development: In addition to the scale of production, a positive cost development is closely connected to three areas: the cost of energy needed to produce hydrogen, increased efficiency for all parts of the value chain and a continued fall in capital cost for infrastructure. With about half of the production cost per kg of hydrogen being energy cost203, as well as a substantial energy need for liquefaction, a decrease of cost depends on stable energy prices or the ability to utilize “trapped power” outside of energy markets. Also, for production of hydrogen from natural gas, which currently is cheaper than electrolysis, the establishment of and cost associated with CCS provides an element of uncertainty. Our run-through of criteria for blue and/or green hydrogen shows that CCS is necessary in order to achieve a low enough level of kgCO2/kg LH2 to label hydrogen from natural gas as blue hydrogen. Technology: While there is a continued need for increased efficiency, both production and liquefaction of hydrogen is considered as a mature industry, from few, but highly competent industrial gas companies. The last year has also seen a spike in new capacity being built in the US (3x30 tons per day) and a doubling of Lindes plant in Leuna from 5 to 10 tons per day. In terms of land-based storage of LH2 there are several suppliers with experience and availability for cryogenic storage tanks and there exists large solutions developed for space industry.
202 Idealhy (2013) 203 DNV-GL (2019)
75
NCE MARITIME CLEANTECHNorwegian future value chains for liquid hydrogen
76
As we move further along the value chain the need for technology development increases. Currently distribution of LH2 in Europe is done by trailer truck or by ISO-containers on ships. This is a suitable solution for small volumes, but as seen in our case studies it is not a very cost efficient or flexible form of distribution for larger volumes. The development of LH2-tankers that can supply bunkering sites along the coastline is necessary for an effective distribution of large volumes. In general, for distribution and bunkering, suppliers seem to believe that existing technology for LNG can be modified and adapted to LH2. This includes tanks, submerged pumps for offloading, vacuum insulated pipes and valves and flexible pipes or loading arms. However, this requires considerable engineering and qualification before solutions are commercially available for maritime applications204. Regulations and standards: While some regulations and standards are developed for hydrogen as an energy carrier, less is available for maritime use of liquid hydrogen. In Norway it falls to a large degree under the general regulation on handling of dangerous substances with references made to maritime use of LNG. A development of international standards for a maritime use of hydrogen, especially concerning bunkering, is needed. Also hydrogen should be more directly addressed in national guidelines following the regulation on handling of dangerous goods. Spatial planning: The lower energy density, 8500 MJ/m3 compared to 38 000 MJ/m3 for MGO and 22 000 MJ/m3 for LNG, makes liquid hydrogen a more area demanding solution. As an example, we showed how much storage was needed to match the current amount of energy stored at major bunkering sites along the coastline (figure 29). In order to make room for infrastructure it is important that harbors, logistics bases and bunkering sites have this in mind for future spatial planning.
204 Moss Maritime (2018)
76
NCE MARITIME CLEANTECHNorwegian future value chains for liquid hydrogen
77
10. Literature and references Afif, Ahmed et.al (2016) Ammonia-fed fuel cells: a comprehensive review, Renewable and Sustainable Energy Review, vol. 60 (July), p. 822-835 Air Liquide (2015a) World premiere: Air Liquide inaugurates its CO2 cold capture system, Cryocap, https://www.airliquide.com/sites/airliquide.com/files/2015/11/05/world-premiere_air-liquide-inaugurates-its-co2-cold-capture-system-cryocap.pdf , last visited 28th of January 2019 Air Liquide (2015b) Hydrogen Storage on board aeronef and ground infrastructure, presentation given under FCH-JU Workshop on aeronautical applications of fuel cell and hydrogen technologies, https://www.fch.europa.eu/sites/default/files/12.%20Bensadoun%20%28ID%202844157%29_0.pdf , last visited 24th of March 2019. Air Liquide (2018) Air Liquide to build first world scale liquid hydrogen production plant dedicated to the supply of Hydrogen energy markets, https://www.airliquide.com/media/air-liquide-build-first-world-scale-liquid-hydrogen-production-plant-dedicated-supply-hydrogen-energy-markets , last visited 19th January 2019 Air Liquide (2019) Storing Hydrogen, https://energies.airliquide.com/resources-planet-hydrogen/how-hydrogen-stored, last visited 12th of March 2019. Air Products (2014) Safetygram 9: Liquid Hydrogen, available at https://www.airproducts.com/~/media/Files/PDF/company/safetygram-9.pdf, last visited on 4th January 2019 Air Products (2018) Air Products to Build World-Scale Liquid Hydrogen Plant at its La Porte, Texas Facility, http://www.airproducts.com/Company/news-center/2018/09/0911-air-products-to-build-world-scale-liquid-hydrogen-plant-at-laporte-texas-facility.aspx , last visited 19th January 2019 Asplan Viak (2018) Vedlegg 3.14: Metodikk for beregning av klimaintensiteten til Nordisk elektrisitetsmiks, provided by Asplan Viak for Statens Vegvesen in May 2018, available at request to the latter. Barth, Frederic (2016) CerifHy – Developing a European guarantee of origin scheme for green hydrogen, presentation from the CertifHy-project, https://www.certifhy.eu/images/media/files/CertifHy_Presentation_19_10_2016_final_Definition_of_Premium_Hydrogen.pdf , last visited 30th of January 2019. Barthelemy, Herve (2016) ISO and EIGA standards for cryogenic vessels and accessories, presentation given at Cern for Air Liquide 22.sep 2016, https://indico.cern.ch/event/495194/contributions/2223315/attachments/1338260/2019613/ISO_and_EIGA_stds_for_cryogenic_vessels_and_accessories.pdf last visited 19th of March 2019. Baykara, Sema. Z (2018) Hydrogen: A Brief overview on its sources, production and environmental impact, International Journal of Hydrogen Energy, 43 (2018), p. 10605-10614 Berstad, David, Jacob H. Stang and Petter Nekså (2009) Comparison criteria for large-scale hydrogen liquefaction processes, International Journal of Hydrogen Energy, 34 (2009), p. 1560-1568 Berstad, David et.al (2013) Schedule for Demonstration Plant including options for Location, report from Integrated design for demonstration of efficient liquefaction of hydrogen
77
NCE MARITIME CLEANTECHNorwegian future value chains for liquid hydrogen
78
(IDEALHY), https://www.idealhy.eu/uploads/documents/IDEALHY_D5-22_Schedule_demonstration_and_location_web.pdf , last visited 27th of March 2019. Berstad, David (2018a) Technologies for hydrogen liquefaction, presentation given at Gasskonferansen 11.04.2018 Berstad, David (2018b) Hydrogen liquefaction, storage and long distance transport, presentation given at Mission Innovation, Deep dive workshop, Berlin, 17.10.2018, https://www.now-gmbh.de/content/1-aktuelles/2-veranstaltungen/20181017-innovation-challenge-8-on-hydrogen/2_2_h2-liquefaction-storage-long-distance-transport_sintef_berstad.pdf , last visited 29th of January. Blaylock, Myra et.al (2018) Informing hazardous zones for on-board maritime hydrogen liquid and gas systems, Sandia Report – Sand2018-0585, https://prod-ng.sandia.gov/techlib-noauth/access-control.cgi/2018/180585.pdf , last visited 26th of March 2019. Cardella, U. et al (2017) Roadmap to economically viable large-scale hydrogen liquefaction, International Journal of Hydrogen Energy, vol 42 (19), p. 13329-13338 CertifHY (2015a) Technical report on the Definition of CertifHy Green Hydrogen, http://www.certifhy.eu/images/project/reports/Certifhy_Deliverable_D2_4_green_hydrogen_definition_final.pdf , last visited 30th of Januar 2019. CertifHY (2015b) Overview of the market segmentation for hydrogen across potential customer groups, based on key application areas, http://www.certifhy.eu/images/D1_2_Overview_of_the_market_segmentation_Final_22_June_low-res.pdf , last visited 07th of February 2019 CMR Prototech (2014) Hydrogen som drivstoff på skip, sluttrapport for Transnova-prosjektnr. 2014028990, available at request from the authors Cryostar (2016) Liquid hydrogen solutions, https://cleantuesdayparis.fr/media/files/HYVOLUTION_2016_CRYOSTAR_LH2_solutions_short_-_final.pdf , last visited 26th of March. Cryostar (2019) Hydrogen, https://cryostar.com/hydrogen/ , last visited 26th of March 2019. Damman, Sigrid et.al (2018) HyLaw – National Policy Paper – Norway, https://www.hylaw.eu/sites/default/files/2019-03/National%20Policy%20Paper%20-%20Norway%20%2810.03.2019%29.pdf, last visited 21th of March Dept. of Oil and Energy (2016) Mulighetsstudier av fullskala CO2-håndtering i Norge, https://www.regjeringen.no/globalassets/departementene/oed/pdf/mulighetsstudien.pdf last visited 29th of January 2019 Dillich, Sara et.al (2012) Hydrogen Production Cost Using Low-Cost Natural Gas, DOE Hydrogen and Fuel Cell Program Record 12024, https://www.hydrogen.energy.gov/pdfs/12024_h2_production_cost_natural_gas.pdf , last visited 7th of February 2019 DNV-GL (2017) Study on the use of fuel cells in shipping, report for EMSA European Maritime Safety Agency, http://www.emsa.europa.eu/emsa-documents/download/4545/2921/23.html , last visited 19th of March 2019. DNV-GL (2018) Maritime forecast to 2050, available from https://eto.dnvgl.com/2018/download , last visited 19th of February 2019. DNV-GL (2019) Synteserapport om produksjon og bruk av hydrogen i Norge, rapportnr. 2019-0039, Rev 1,
78
NCE MARITIME CLEANTECHNorwegian future value chains for liquid hydrogen
79
https://www.regjeringen.no/contentassets/0762c0682ad04e6abd66a9555e7468df/hydrogen-i-norge---synteserapport.pdf , last visited 12th of February 2019. DSB (2018) Guideline on tapping of dangerous substances, https://www.dsb.no/lover/farlige-stoffer/veiledning-til-forskrift/temaveiledning-om-omtapping-av-farlig-stoff/#kapittel-3--bunkring-av-lng, last visited 21th of March 2019. E4 Tech Sarl and Energy Element (2014) Study on the development of water electrolysis in the EU, report for FCH-JU https://www.fch.europa.eu/sites/default/files/FCHJUElectrolysisStudy_FullReport%20(ID%20199214).pdf , last visited 06th of February 2019 EIGA (2019) Safety in storage, handling and distribution of liquid hydrogen, Doc 06/19, https://www.eiga.eu/index.php?eID=dumpFile&t=f&f=3539&token=80a8580dc3996dcb1705315e53c21f7aa283db2e last visited 19th of March 2019. Energigass Norge (2015) Norskekysten LNG – Utvikling av infrastruktur for LNG som drivstoff i Norge, http://energigass.no/content/uploads/2017/06/Norskekysten_LNG_rapport.pdf , last visited 31th of January 2019. Energy.gov (2015) Department of Energy Technical Targets for Hydrogen Delivery, https://www.energy.gov/eere/fuelcells/doe-technical-targets-hydrogen-delivery , last visited 28th of March 2019 Equinor (2017) Minimizing greenhouse gas emissions – Greenhouse gas emissions of the Norwegian natural gas value chain 2016, https://www.equinor.com/content/dam/statoil/documents/climate-andsustainability/ 170135%20Greenhouse%20gas%20emissions_10.08.2017%20final.pdf , last visited 12th of February European Committee for Standardization (2017) Business Plan Cen-Cenelec/TC6 Hydrogen in Energy Systems, https://standards.cen.eu/bp/2121095.pdf , last visited 21th of March European Committee for Standardization (2019) CEN/TC 268 – Cryogenic vessels and specific hydrogen technologies applications, https://standards.cen.eu/dyn/www/f?p=204:7:0::::FSP_ORG_ID:6249&cs=172C7ABB5878BDDA737ED75C120F556C1 , last visited 21th of March 2019. European Environment Agency (2018) Overview of electricity production and use in Europe, https://www.eea.europa.eu/data-and-maps/indicators/overview-of-the-electricity-production-2/assessment-4 , last visited 22nd of January 2019 FCH-JU (2019) Hydrogen Roadmape Europe, https://fch.europa.eu/sites/default/files/Hydrogen%20Roadmap%20Europe_Report.pdf , last visited 14th of March 2019 Fuel Cell Today (2019) SOFC, http://www.fuelcelltoday.com/technologies/sofc , last visited 19th of February 2019 Gardener, Monterey (2009) Energy requirements for hydrogen gas compression and liquefaction as related to vehicle storage needs, DOE Hydrogen and Fuel Cells Program Record, https://www.hydrogen.energy.gov/pdfs/9013_energy_requirements_for_hydrogen_gas_compression.pdf , last visited 23th of March 2019.
79
NCE MARITIME CLEANTECHNorwegian future value chains for liquid hydrogen
80
Gas World (2019), NASA to build world’s largest liquid hydrogen storage tank, https://www.gasworld.com/nasa-to-build-worlds-largest-h2-tank/2016328.article, last visited 13th of March 2019. Green Coastal Shipping Programme (forthcoming) Hydrogen as maritime fuel for Norwegian short sea and coastal shipping, report for the Green Coastal Shipping Programme, available by request Greensight (2018) Barrierestudie for Bergen havn, http://www.greensight.no/wp-content/uploads/2019/02/Rapport-Bergen-Havn-min-2.pdf , last visited 26th of March 2019. Greenstat (2016) Feasbility study Mongstad – Executive Summary, published 15th of January 2016, http://www.greensight.no/wp-content/uploads/2019/03/Greenstat-hydrogenanlegg-Mongstad-Mulighetsstudie_-executive-summary.pdf , last visited 27th of March 2019 Grønland, Stein Erik (2018) Kostnadsmodeller for transport og logistikk – basisår 2016, Institute of Transport Economics, report 1638/2018, https://www.toi.no/getfile.php?mmfileid=48556 , last visited 24th of March 2019 H21 (2018) H21 North of England, https://www.northerngasnetworks.co.uk/h21-noe/H21-NoE-26Nov18-v1.0.pdf , last visited 27th of January 2019. Holst, Steffen Møller et al (2016) Hydrogen verdikjeder og potensial, Sintef paper for Green Coastal Shipping Programme, https://www.sintef.no/contentassets/cd105affc9d64e09a7b6e822203c5b0d/underlagsnotat_hydrogen_sintef.pdf , last visited 27th of January 2019 Houston Chronicle (2019) McDermott lands contract to build hydrogen storage tank at NASA’s Cape Canaveral, https://www.houstonchronicle.com/business/energy/article/McDermott-lands-contract-to-build-hydrogen-13647332.php, last visited 13th of March 2019. Hydrogen Council (2017) Hydrogen Scaling Up, http://hydrogencouncil.com/wp-content/uploads/2017/11/Hydrogen-scaling-up-Hydrogen-Council.pdf , last visited 20th of January 2019 Hydrogen.no (2019) Planlegger storstilt produksjon av flytende hydrogen i Kvinnherad, https://www.hydrogen.no/hva-skjer/aktuelt/planlegger-storstilt-produksjon-av-flytende-hydrogen-i-kvinnherad , last visited 14th of February 2019. HyLaw (2018) Online database, https://www.hylaw.eu/database , last visited 19th of March. Essler et.al (2012), Report on Technology Overview and Barriers to Energy- and Cost-Efficient Large Scale Hydrogen Liquefaction, report from Integrated design for demonstration of efficient liquefaction of hydrogen (IDEALHY), https://www.idealhy.eu/uploads/documents/IDEALHY_D1-1_Report_Tech_Overview_and_Barriers_web2.pdf , last visited 24th of March 2019. IEAGHG (2017) Techno-Economic Evaluation of SMR Based Standalone (Merchant) Hydrogen Plant with CCS, IEAGHG Technical Report 2017-02, https://ieaghg.org/exco_docs/2017-02.pdf , last visited 12th of February 2019. IEA (2015) Technology Roadmap Hydrogen and Fuel Cells, https://www.iea.org/publications/freepublications/publication/TechnologyRoadmapHydrogenandFuelCells.pdf last visited 18th March 2019
80
NCE MARITIME CLEANTECHNorwegian future value chains for liquid hydrogen
81
IEA (2017) Biofuels for the marine shipping sector, https://www.ieabioenergy.com/wp-content/uploads/2018/02/Marine-biofuel-report-final-Oct-2017.pdf, last visited 5th of March 2019. Ikuo Hamanaka (2015) Regulations, Codes & Standards for hydrogen handling and use, paper presented at the International workshop on Renewable Energy and Hydrogen Export, 24th of March, 2015, https://www.sintef.no/contentassets/9b9c7b67d0dc4fbf9442143f1c52393c/6-regulations-codes--standards-for-hydrogen-handling-ikuo-hamanaka-dnv-gl.pdf , last visited 19th of March 2019. IMO (2016) Resolution MSC. 420(97) Interim recommendations for carriage of liquefied hydrogen in bulk, https://www.iso.org/committee/54560.html, last visited 21th of March 2019 IMO (2018) UN Body adopts climate change strategy for shipping, published 13.04.2018, available at http://www.imo.org/en/mediacentre/pressbriefings/pages/06ghginitialstrategy.aspx, last visited 4th of January 2019 Institute for Sustainable Process Technology (2017) Power to ammonia – a feasibility study for the value chains and business cases to produce CO2-free ammonia suitable for various market applications, http://www.ispt.eu/media/ISPT-P2A-Final-Report.pdf , last visited 16th of January 2019 IRENA (2018) Hydrogen from renewable power: technology outlook for the energy transition, http://www.irena.org/publications/2018/Sep/Hydrogen-from-renewable-power , last visited 20th of January 2019 IRENA (2018b) Global Energy Transformation. A roadmap to 2050, https://www.irena.org/-/media/Files/IRENA/Agency/Publication/2018/Apr/IRENA_Report_GET_2018.pdf last visited 29th of January 2019. ISO (2019) ISO/TC 197 – Hydrogen Technologies, https://www.iso.org/committee/54560.html , last visited 21th of March 2019. Kawasaki (2014) Study on Introduction of CO2-free energy to Japan with Liquid Hydrogen, presentation given at University of Twente, 7-11th July of 2014, https://indico.cern.ch/event/244641/contributions/1563161/attachments/418191/580844/OO-2_Shoji_Kamiya-TUE-MO-Plenary_R2.pdf, last visited 24th of March 2019 Kawasaki (2018) Liquefied Hydrogen Supply Chain and Carrier Ship to Realize Hydrogen economy, presentation given at Gasskonferansen 10th of April 2018, http://gasskonferansen.com/images/foredrag/2018/A%CC%8A%20bygge%20hydrogen%C3%B8konomi%20som%20forsyningskjede%20for%20flytende%20hydrogen%20Katsuya%20Morimoto.pdf , last visited 7th of February. Klebanoff, Leonard et al (2018) Feasibility of the Zero-V: A Zero Emission, hydrogen fuel-cell, coastal research, Sandia National Laboratory report, https://energy.sandia.gov/download/43090/ , last visited 24th of March 2019 Krasae-In, Songwut (2013) Efficient Hydrogen in liquefaction processes, dissertation for a Phd from the Norwegian University of Science and Technology, https://brage.bibsys.no/xmlui/handle/11250/235025 , last visited 11th of February 2019. Krasae-In, Songwut et.al (2010) Development of large-scale hydrogen liquefaction processes from 1898 to 2009, International Journal of Hydrogen Energy, vol. 35 (10), p.4524-4533, https://www.sciencedirect.com/science/article/pii/S0360319910004118 , last visited 23th of March 2019
81
NCE MARITIME CLEANTECHNorwegian future value chains for liquid hydrogen
82
Linde (2014) The Cleanest energy carrier ever – hydrogen solutions from Linde, https://www.the-linde-group.com/en/images/HydrogenBrochure_EN_tcm14-10196.pdf, last visited 24th of March 2019. Linde (2016) Hydrogen Solutions, https://linde-kryotechnik.ch/wp-content/uploads/2016/10/hydrogen_solutions_eng.pdf, last visited 12th of March 2019. Linde (2018) Press information, http://www.linde-gas.de/de/images/PR_Linde_Wasserstoffanlage_Leuna_tcm565-502926.pdf , last visited on 19th January 2019. Linde (2019) Distribution Methods, https://www.lindeus.com/en/products_and_supply/bulk_gases/distribution-methods.html, last visited 5th of March 2019. Lovdata (2002) Act on protection against fire, explosion and accidents with dangerous substances, https://lovdata.no/dokument/NL/lov/2002-06-14-20, last visited 21th of March Lovdata (2009) Regulation for safe handling of inflammable, explosive and pressurized substances, including relevant installations and equipment, https://lovdata.no/dokument/SF/forskrift/2009-06-08-602?q=forskrift%20om%20h%C3%A5ndtering%20av%20farlig , last visited 21th of March 2019 Lovdata (2010) Regulation on maritime transport of dangerous goods https://lovdata.no/dokument/LTI/forskrift/2009-12-08-1481, last visited 21th of March 2019 Lovdata (2014) Regulations on detailed provisions on permitted weights and dimensions for public roads, https://lovdata.no/dokument/LTI/forskrift/2014-01-15-28, last visited 11th of April 2019 Ohlig, K and Decker, L. (2014) The latest developments and outlook for hydrogen liquefaction technology, AIP Conference Proceedings 1573, 1311, https://aip.scitation.org/doi/pdf/10.1063/1.4860858 , last visited 24th of March 2019 LNG World Shipping (2017) Kawasaki ship designs support Japan’s hydrogen-society plans, https://www.lngworldshipping.com/news/view,kawasaki-ship-designs-support-japans-hydrogensociety-plans_46421.htm, last visited on 5th of March 2019. MAN (2018) Ship operation using LPG and Ammonia as fuel on MAN B&W Dual Fuel ME-LGIP Engines, presentation given by Rene Sejer Laursen at NH3 Fuel Conference 2018 https://nh3fuelassociation.org/wp-content/uploads/2018/12/0900-Ammonia_vision-Rene-Sejer-Laursen-MAN.pdf , last visited 19th of February 2019. Marine Insight (2016) What are Gas Carrier Ships?, https://www.marineinsight.com/types-of-ships/what-are-gas-carrier-ships/, last visited 5th of March 2019. Minnehan, John and Pratt, Joseph (2017) Practical Application Limits of Fuel Cells and Batteries for Zero Emission Vessels, Sandia Report – Sand2017-12665, https://energy.sandia.gov/wp-content/uploads/2017/12/SAND2017-12665.pdf , last visited 26th of March 2019. Morelos, Joseph (2017) Hydrogen – Safety Considerations and Future Regulations, presentation given from Lloyd’s Register at Hydrogen Safety Considerations in Valencia 2017, https://www.fch.europa.eu/sites/default/files/3.%20Joseph%20Morelos%20-%20H2Safety.pdf , last visited 20th of March 2019.
82
NCE MARITIME CLEANTECHNorwegian future value chains for liquid hydrogen
83
Moss Maritime (2018) Ship transport solution for liquified hydrogen (LH2 Bunker Vessel) Summary report, available by request, last visited 5th of March 2019. NASA (2016) Ground Systems Development & Operations Highlights, https://www.nasa.gov/sites/default/files/atoms/files/gsdohighlights2016inreview_web.pdf, last visited 12th of March 2019. National Energy Technology Laboratory (2015) Life Cycle Greenhouse Gas Emissions – natural gas and power production, US Dept. of Energy, https://www.eia.gov/conference/2015/pdf/presentations/skone.pdf , last visited 12th of February 2019. National Public Road Administration (2016) Ferjestatistikk 2016, handbook V620, https://www.vegvesen.no/_attachment/2305773/binary/1258240?fast_title=H%C3%A5ndbok+V620+Ferjestatistikk+2016.pdf , last visited 12th of March 2019. National Public Road Administration (2018) Konkurransegrunnlag. Drift av riksferjesambandet Hjelmeland-Skipavik-Nesvik, available at request for NPRA NCE Maritime CleanTech (2019) Hydrogen PSV, https://maritimecleantech.no/project/hydrogen-psv/, last visited 5th of March 2019. NCE Maritime CleanTech (2018) Norled to develop the world’s first hydrogen ferry, https://maritimecleantech.no/2018/11/30/norled-to-develop-the-worlds-first-hydrogen-ferry/, last visited 5th of March 2019. Nexant (2008) H2A Hydrogen Delivery Infrastructure Analysis Model and Conventional Pathway Options Analysis Results, https://www.energy.gov/sites/prod/files/2014/03/f9/nexant_h2a.pdf , last visited 24th of March 2019. Norsk Petroleum (2019) Olje og gassproduksjon, https://www.norskpetroleum.no/produksjon-og-eksport/olje-og-gassproduksjon/ , last visited 28th of January 2019. Norwegian Maritime Authority (2017), Norway may get the world’s first hydrogen-powered cruise ship, https://www.sdir.no/en/news/news-from-the-nma/norway-may-get-the-worlds-first-hydrogen-powered-cruise-ship/, last visited 5th of March. NVE (2018) Nasjonal varedeklarasjon 2017, https://www.nve.no/reguleringsmyndigheten-for-energi-rme-marked-og-monopol/varedeklarasjon/nasjonal-varedeklarasjon-2017/ , last visited 22nd of January 2019. Nygård & Strømgren (2017) Hurtiggåande passasjerbåt med hydrogenbasert framdrift, Sogn og Fjordane, GKP7H2, https://brandcentral.dnvgl.com/download/DownloadGateway.dll?h=BE1B38BB718539CC0AB58A5FF2EA7A83229B8953BC99D8DE553CC23B3A0212AB9D71AB054084A26ECC513C4A16A40FEA , last visited 26th of March 2019 Office of Energy Efficiency and Renewable Energy (2019) Hydrogen production: Natural Gas Reforming, https://www.energy.gov/eere/fuelcells/hydrogen-production-natural-gas-reforming , last visited 27th of January 2019. Pratt, Joseph & Klebanoff, Leonard (2016) Feasibility of the SF-BREEZE: a Zero-Emission, Hydrogen Fuel Cell, High-Speed Passenger Ferry, Sandia Report – SAND2016-9719, https://energy.sandia.gov/download/38805/ , last visited 26th of March 2019 Praxair (2016) Hydrogen, refrigerated liquid, Safety Data sheet, https://www.praxair.com/-/media/corporate/praxairus/documents/sds/hydrogen/liquid-hydrogen-gas-h2-safety-data-
83
NCE MARITIME CLEANTECHNorwegian future value chains for liquid hydrogen
84
sheet-sds-p4603.pdf?la=en&rev=5c09c28f6acd421eb9330a58c3e5bd6a , last visited 21th of March 2019 Praxair (2018) Praxair to Build New Liquid Hydrogen Plant in La Porte, Texas, https://www.praxair.com/news/2018/praxair-to-build-new-liquid-hydrogen-plant-in-la-porte-texas , last visited 19th January 2019. Reddi, Krishna et. al (2016) Challenges and Opportunities of Hydrogen Delivery via Pipeline, Tube-Trailer, LIQUID Tanker and Methanation-Natural Gas Grid in Stolten, Detlef and Bernd Emots (ed) Hydrogen Science and Engineering: Materials, Processes, Systems and Technology, Wiley-VCH Verlag. Regjeringen (2016) Norge har ratifisert Parisavtalen, published 21.06.2016, available at https://www.regjeringen.no/no/aktuelt/norge-har-ratifisert-parisavtalen/id2505365/, last visited on 4th of January 2019. Sandia National Laboratories (2016), Feasibility of the SF-BREEZE:a Zero-Emission, Hydrogen Fuel Cell, High-Speed Passenger Ferry, https://energy.sandia.gov/download/38805/, last visited on 5th of March. Selfa Artic (2016) Batteri/brenselcelle hurtigbåt, FoU-prosjekt for Næringslivets NOx-fond, https://www.nho.no/siteassets/nox-fondet/rapporter/2018/batteri-og-brenselcelle-pa-hurtigbat.pdf , last visited 11th of March 2019. Shell (2017) Shell hydrogen study: Energy of the future? Sustainable mobility through fuel cells and hydrogen, https://www.shell.com/energy-and-innovation/the-energy-future/future-transport/hydrogen.html , last visited 12th of February 2019. Shell (2018) Shell Scenarios: SKY – Meeting the goals of the Paris agreement, https://www.shell.com/promos/meeting-the-goals-of-the-paris-agreement/_jcr_content.stream/1530643931055/d5af41aef92d05d86a5cd77b3f3f5911f75c3a51c1961fe1c981daebda29b726/shell-scenario-sky.pdf , last visited 14th of March 2019. Sintef (2018) – Power Point: Technologies for hydrogen liquefication, last visited 12th of March 2019, available on request. Soltani, R, M.A. Rosen and I. Dincer (2014) Assessment of CO2 capture options from various points in steam-methane reforming for hydrogen production, International Journal of Hydrogen Energy, Vol. 39 (35), p. 20266-20275 Stad Tunnel (2019) Facts about Stadt Tunnel, http://skipstunnel.no/om-stad-skipstunnel/ , last visited 26th of March 2019 Statistics Norway (2018a) Production and consumption of energy, energy account, https://www.ssb.no/en/statbank/table/11558 , last visited on 30th of January 2019. Statistics Norway (2018b) Utslipp til luft, publisert 18.12.2018, available at https://www.ssb.no/natur-og-miljo/statistikker/klimagassn, last visited on 4th of January Statistics Norway (2018c) Sales of petroleum products, by industry, https://www.ssb.no/statbank/table/11185/ , last visited 31th of January. Statistics Norway (2018d) Net consumption of electricity, by consumer group and county, https://www.ssb.no/en/statbank/table/08312/ , last visited 29th of March 2019
Statistics Norway (2018e) Production of electricity, by type and county, https://www.ssb.no/en/statbank/table/08308/ , last visited 29th of March 2019
84
NCE MARITIME CLEANTECHNorwegian future value chains for liquid hydrogen
85
Statistics Norway (2019a) Electricity balance (MWh), https://www.ssb.no/statbank/table/08583/tableViewLayout1/ last visited 15th of March 2019. Statistics Norway (2019b) Electricity balance from production https://www.ssb.no/statbank/table/08583/tableViewLayout1/ , last visited 28th of January 2019 Statkraft (2018) Fornybar energiforsyning til Svalbard – Longyearbyen. Input note by Statkraft, Sintef Industri og Nordic Zoning, https://www.statkraft.com/globalassets/explained/svalbard_rapport_0911_final.pdf , last visited 19th of February 2019. Stolzenburg, K et. al (2013) Efficient Liquifaction of hydrogen: results of the IDEALHY-project, presentation give at the XXth energie Symposium, Stralsund/Germany, 7-9th of November 2013, https://www.idealhy.eu/uploads/documents/IDEALHY_XX_Energie-Symposium_2013_web.pdf , last visited on 11th of February 2019 Teknisk Ukeblad (2019a) Samskip utvikler hydrogendrevet containerskip, publisert 10th of January 2019, https://www.tu.no/artikler/samskip-utvikler-hydrogendrevet-containerskip/455212?key=Jgt6Hjwt , last visited 25th of March 2019 Teknisk Ukeblad (2019b) Equinor vil lage hydrogen fra gass, ber om å få slippe CO2-rensing, published 20th of March 2019, https://www.tu.no/artikler/equinor-vil-lage-hydrogen-fra-gass-ber-om-a-slippe-co2-rensing/460459?key=cvOO5638 last visited 20th of March Timmers, Piet and Stam, Gea (2017) Risk based safety distances for hydrogen refuelling stations, International Conference Hydrogen Safety (ICHS), paper 107-ICHS-2017, https://hysafe.info/wp-content/uploads/2017_papers/107.pdf last visited 19th of March 2019 Tractabel Engie & Hincio (2017) Study on Early Business Cases for H2 in Energy Storage and more broadly power to H2 Applications, report for FCH-JU, https://www.fch.europa.eu/sites/default/files/P2H_Full_Study_FCHJU.pdf , last visited 06th of February 2019. Transcaer (2004) TRANSCAER® Anhydrous Ammonia Training Anhydrous Ammonia Properties. https://www.transcaer.com/docs/AATour/Transcaer_Ammonia_Training_Student_Handout_rev04.pdf, last visited 5th of March 2019. Trøndelag fylkeskommune (2019) Jakten på fremtidens hurtigbåt, https://www.trondelagfylke.no/nyhetsarkiv/jakten-pa-fremtidens-hurtigbat , last visited 5th of March Tüv Süd (2011) Generation of green hydrogen, https://www.netinform.de/GW/files/pdf/70_Erzeugung_GH-12-2011_en.pdf , last visited 13th of February 2019 Tüv Süd (2019) GreenHydrogen Certification, https://www.tuev-sued.de/plants-buildings-technical-facilities/fields-of-engineering/environmental-engineering/energy-certification/greenhydrogen-certification#tab_1542033222148822960138 , last visited 13th of February 2019 UNESE (2019) ADR – European Agreement Concerning the International Carriage of Dangerous Goods by Road, http://www.unece.org/fileadmin/DAM/trans/publications/ADR_2019_vol1_1818953_E.pdf , last visited 21th of March 2019.
85
NCE MARITIME CLEANTECHNorwegian future value chains for liquid hydrogen
86
US Drive (2013) Hydrogen Delivery Technical Team Roadmap, https://www.energy.gov/sites/prod/files/2014/02/f8/hdtt_roadmap_june2013.pdf , last visited 18th March 2019 Voldsund, Mari. et. al (2016) Hydrogen production with CO2 capture, International Journal of Hydrogen Energy, vol 41 (9), p. 4969-4992 West, James Evans (2003) The Economics of Small to Medium Liquid Hydrogen Facilities, published in Cryogas International in 2003, http://www.rmwsolutions.net/pub3.pdf , last visited 23th of March Wilhelmsen (2019) New design makes liquefied hydrogen bunker vessels a reality, https://www.wilhelmsen.com/media-news-and-events/press-releases/2019/new-design-makes-liquefied-hydrogen-bunker-vessels-a-reality/, last visited 5th of March 2019. W U Notardonato et al (2017) Zero boil-off methods for large-scale liquid hydrogen tanks using integrated refrigeration and storage, IOP Conference Series: Materials Science and Engineering, last visited 12th of March. Yang, C and Ogden, J (2007) Determining the lowest-cost hydrogen delivery mode, International Journal of Hydrogen Energy, vol. 32 (2), p. 268-286, https://www.sciencedirect.com/science/article/pii/S0360319906001765?via%3Dihub Zero Emissions platform (2017) Commercial scale feasibility of Clean Hydrogen, http://www.zeroemissionsplatform.eu/downloads/1640.html , last visited 28th of January 2019. Øystese, Kirsten (2019) Ferjekontrakt viktig sted mot produksjon av flytende hydrogen i Norge, article at Energi og Klima, 10th of January 2019, https://energiogklima.no/blogg/ferjekontrakt-viktig-steg-mot-produksjon-av-flytende-hydrogen-i-norge/ , last visited 14th of February 2019.
86
NCE MARITIME CLEANTECHNorwegian future value chains for liquid hydrogen
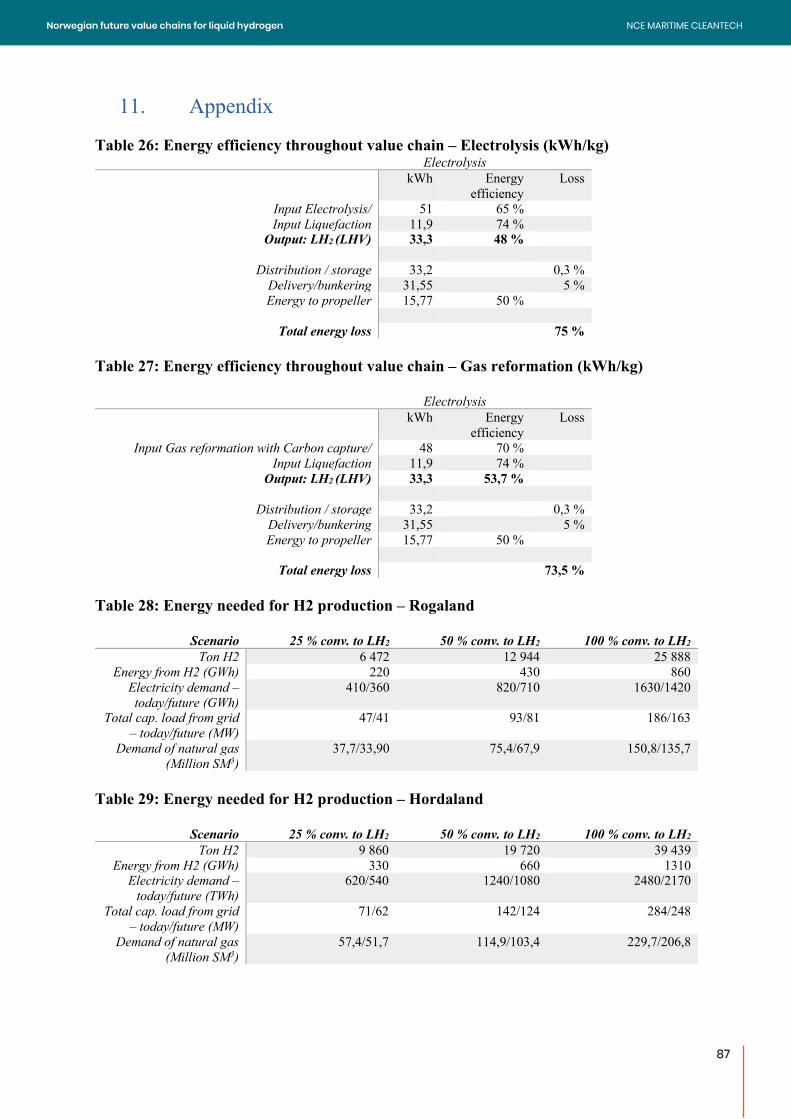
87
11. Appendix Table 26: Energy efficiency throughout value chain – Electrolysis (kWh/kg)
Electrolysis kWh Energy
efficiency Loss
Input Electrolysis/ 51 65 % Input Liquefaction 11,9 74 %
Output: LH2 (LHV) 33,3 48 %
Distribution / storage 33,2 0,3 % Delivery/bunkering 31,55 5 % Energy to propeller 15,77 50 %
Total energy loss 75 %
Table 27: Energy efficiency throughout value chain – Gas reformation (kWh/kg)
Electrolysis kWh Energy
efficiency Loss
Input Gas reformation with Carbon capture/ 48 70 % Input Liquefaction 11,9 74 %
Output: LH2 (LHV) 33,3 53,7 %
Distribution / storage 33,2 0,3 % Delivery/bunkering 31,55 5 % Energy to propeller 15,77 50 %
Total energy loss 73,5 %
Table 28: Energy needed for H2 production – Rogaland
Scenario 25 % conv. to LH2 50 % conv. to LH2 100 % conv. to LH2 Ton H2 6 472 12 944 25 888
Energy from H2 (GWh) 220 430 860 Electricity demand – today/future (GWh)
410/360 820/710 1630/1420
Total cap. load from grid – today/future (MW)
47/41 93/81 186/163
Demand of natural gas (Million SM3)
37,7/33,90 75,4/67,9 150,8/135,7
Table 29: Energy needed for H2 production – Hordaland
Scenario 25 % conv. to LH2 50 % conv. to LH2 100 % conv. to LH2 Ton H2 9 860 19 720 39 439
Energy from H2 (GWh) 330 660 1310 Electricity demand –
today/future (TWh) 620/540 1240/1080 2480/2170
Total cap. load from grid – today/future (MW)
71/62 142/124 284/248
Demand of natural gas (Million SM3)
57,4/51,7 114,9/103,4 229,7/206,8
87
NCE MARITIME CLEANTECHNorwegian future value chains for liquid hydrogen
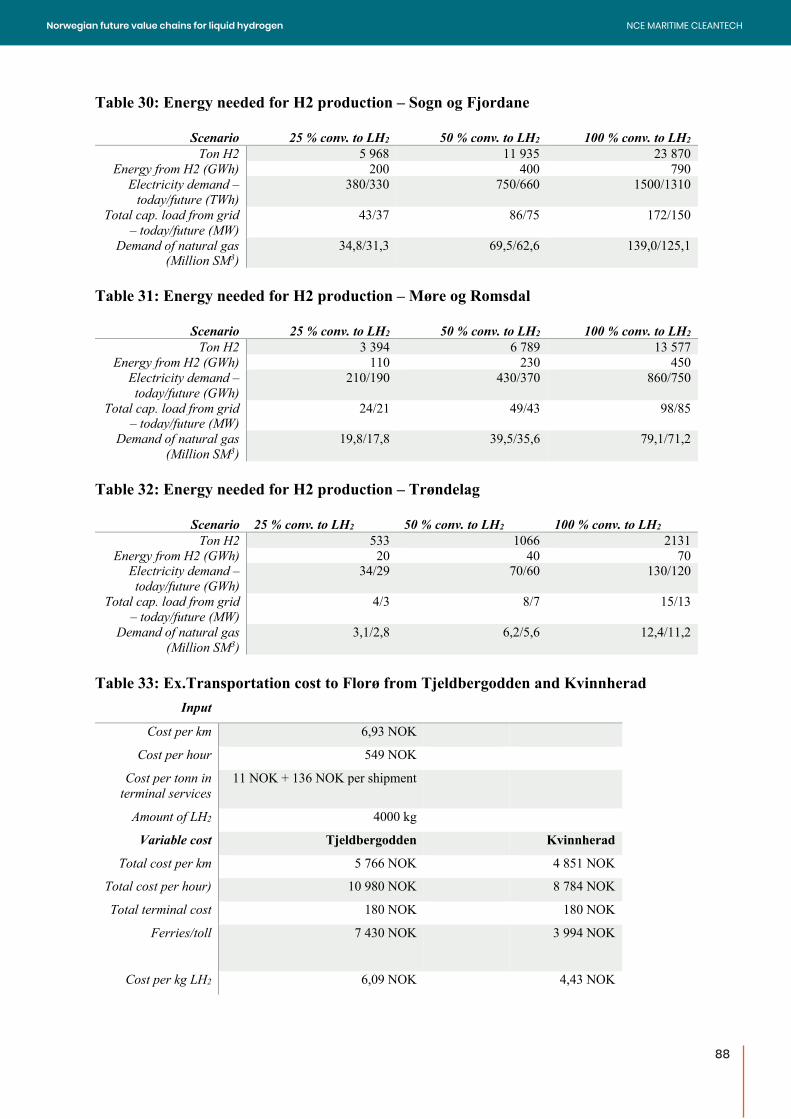
88
Table 30: Energy needed for H2 production – Sogn og Fjordane
Scenario 25 % conv. to LH2 50 % conv. to LH2 100 % conv. to LH2 Ton H2 5 968 11 935 23 870
Energy from H2 (GWh) 200 400 790 Electricity demand –
today/future (TWh) 380/330 750/660 1500/1310
Total cap. load from grid – today/future (MW)
43/37 86/75 172/150
Demand of natural gas (Million SM3)
34,8/31,3 69,5/62,6 139,0/125,1
Table 31: Energy needed for H2 production – Møre og Romsdal
Scenario 25 % conv. to LH2 50 % conv. to LH2 100 % conv. to LH2 Ton H2 3 394 6 789 13 577
Energy from H2 (GWh) 110 230 450 Electricity demand – today/future (GWh)
210/190 430/370 860/750
Total cap. load from grid – today/future (MW)
24/21 49/43 98/85
Demand of natural gas (Million SM3)
19,8/17,8 39,5/35,6 79,1/71,2
Table 32: Energy needed for H2 production – Trøndelag
Scenario 25 % conv. to LH2 50 % conv. to LH2 100 % conv. to LH2 Ton H2 533 1066 2131
Energy from H2 (GWh) 20 40 70 Electricity demand – today/future (GWh)
34/29 70/60 130/120
Total cap. load from grid – today/future (MW)
4/3 8/7 15/13
Demand of natural gas (Million SM3)
3,1/2,8 6,2/5,6 12,4/11,2
Table 33: Ex.Transportation cost to Florø from Tjeldbergodden and Kvinnherad
Input
Cost per km 6,93 NOK
Cost per hour 549 NOK
Cost per tonn in terminal services
11 NOK + 136 NOK per shipment
Amount of LH2 4000 kg
Variable cost Tjeldbergodden Kvinnherad
Total cost per km 5 766 NOK 4 851 NOK
Total cost per hour) 10 980 NOK 8 784 NOK
Total terminal cost 180 NOK 180 NOK
Ferries/toll 7 430 NOK 3 994 NOK
Cost per kg LH2 6,09 NOK 4,43 NOK
88
NCE MARITIME CLEANTECHNorwegian future value chains for liquid hydrogen
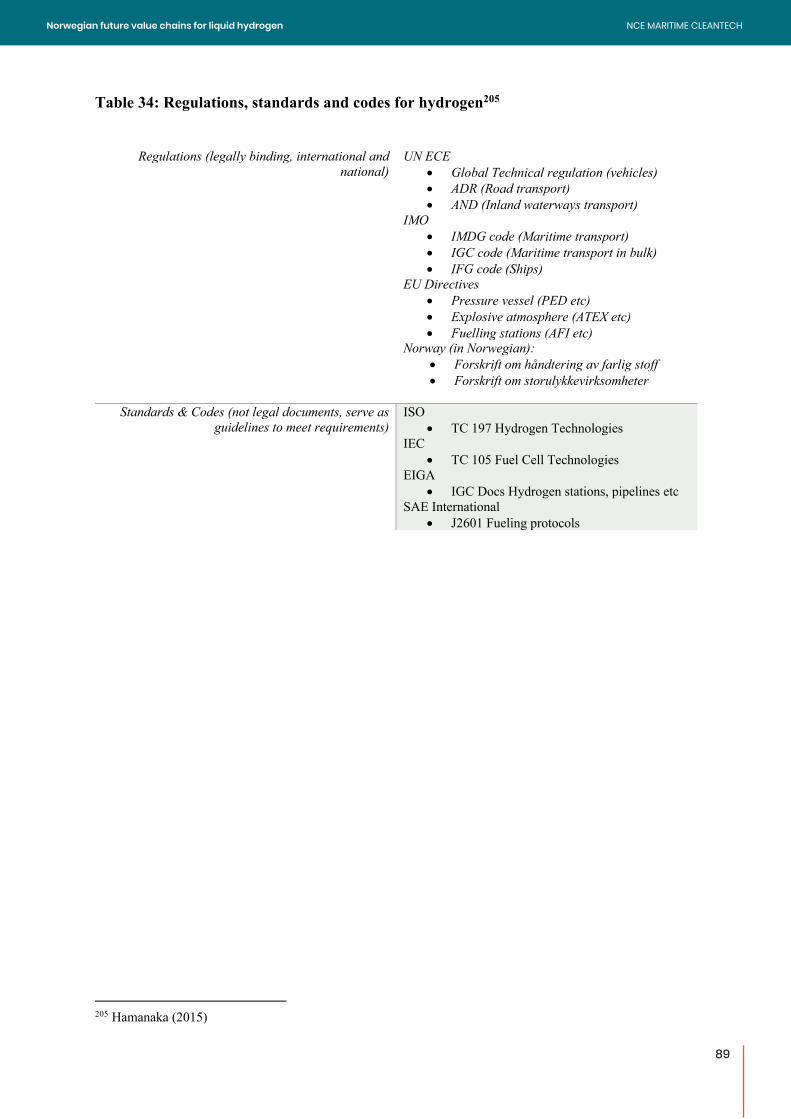
89
Table 34: Regulations, standards and codes for hydrogen205
Regulations (legally binding, international and national)
UN ECE • Global Technical regulation (vehicles) • ADR (Road transport) • AND (Inland waterways transport)
IMO • IMDG code (Maritime transport) • IGC code (Maritime transport in bulk) • IFG code (Ships)
EU Directives • Pressure vessel (PED etc) • Explosive atmosphere (ATEX etc) • Fuelling stations (AFI etc)
Norway (in Norwegian): • Forskrift om håndtering av farlig stoff • Forskrift om storulykkevirksomheter
Standards & Codes (not legal documents, serve as
guidelines to meet requirements) ISO
• TC 197 Hydrogen Technologies IEC
• TC 105 Fuel Cell Technologies EIGA
• IGC Docs Hydrogen stations, pipelines etc SAE International
• J2601 Fueling protocols
205 Hamanaka (2015)
89
NCE MARITIME CLEANTECHNorwegian future value chains for liquid hydrogen