Embed Size (px)
Citation preview
Norwegian Ministry of Finance IPD Fund Level AnalysisDecember 2011
Investment Property Databank Ltd1 St. John’s Lane
London EC1M 4BLUnited Kingdom
Tel: +44 (0) 20 7336 9200
Reporting period to: March to December 2011
This report is denominated in: NOK
This report was produced on: 14th December 2012
Version: 1.0
1 IPD Fund Level Analysis for the Norwegian Ministry of Finance
The report, commissioned by the Ministry of Finance, has been prepared by Investment Property Databank (“IPD”) to provide quality assurance of Norges Bank’s return calculation and to provide a return objective (benchmark) with corresponding benchmarking analysis of the Government Pension Fund Global (“GPFG”) real estate portfolio.
In the report IPD verifies Norges Bank’s calculations of total return for the real estate portfolio at -0.79% and -4.37% measured in NOK, and the GPFG’s currency basket respectively. This Net Asset Value (NAV) return is based upon fund subsidiaries and structures used for holding real estate assets, taking into account the effects of leverage, other assets and liabilities, fees, and any other financial structuring.
Separate to this report, Norges Bank have been verified as being GIPS (Global Investment Performance Standard) compliant. Balance sheet and Income statements have been subject to external audit by Deloitte AS.
For the benchmarking analysis calculated by IPD, a methodology different from that of Norges Bank is used to calculate the return of the real estate portfolio and the benchmark. IPD’s methodology is based upon calculations of returns starting at the property level, common to most of the direct property benchmarks that IPD constructs, and rising through the vehicle to the portfolio level (“bottom-up approach”). The use of this methodology enables the benchmarking of the GPFG portfolio against the broader real estate market. As explained in the report, this may lead to different return figures between the bottom up IPD approach and the Norges Bank methodology. The reasons behind them are covered, although as calculations span longer time horizons and asset specific factors become smaller relative to the overall portfolio size, they should become of less importance. Such differences are therefore to be expected, and relate to the dual role of the report, to provide both quality assurance of the Norges Bank return calculations and the benchmarking of real estate performance.
Beyond the differences in the methodology it is important to recognise that in the early stages of building up a real estate portfolio there are likely to be wide differences between the portfolio and benchmark performance. These differences, which arise due to the high concentration of the portfolio on a small number of assets and the acquisition costs associated with building the real estate portfolio, become less significant once the portfolio has moved beyond its construction phase.
IPD’s methodology gives a total return of NOK 1.2% and 5.0%, for the real estate portfolio and the benchmark respectively. All returns originate from time period between the GPFG real estate inception (end-March 2011), until the year-end 2011. The underperformance of the real estate portfolio relative to the benchmark is mainly a result of property specific factors such as acquisition costs, rather than structural factors related to asset allocation decisions. Such benchmark comparisons should, as highlighted in the report, be interpreted with caution at this early stage.
Norwegian Government Pension Fund – Real Estate Portfolio Report, 2011
Executive summary

IPD Fund Level Analysis for the Norwegian Ministry of Finance 2
Table of Contents
Executive Summary ..........................................................................................................
Explanatory Section ..........................................................................................................
Background and role of IPD ........................................................................
Norges Bank’s “top-down” Methodology ...…………………………..………
IPD’s “bottom-up” Methodology ..................................................................
Difference in Methodology ...........................................................................
Quality Assurance Calculations..........................................................................................
IPD Performance Analysis .................................................................................................
Real Estate Benchmarking ..................................………………..................
Real Estate Market Review ...............................……....................................
Portfolio and Relative Performance .............................................................
Balance Sheet ..................................................…………….......................
Absolute Returns ....................…................................................…….……..
Attribution Analysis ................................................................……………...
Appendix: Technical Note..................................................................................................
Intellectual Property Rights and use of IPD statistics as benchmarks
Whether in the public domain or otherwise, IPD’s statistics are the intellectual property of Investment Property
Databank Limited.
Subscription to the IPD Portfolio Analysis Service grants the subscriber a limited licence to publish the results for
the subscribing portfolio in any medium and to use the reported comparative analysis for purposes related to the
management and performance assessment of that portfolio. The licence granted to publish benchmark information
is more limited and set out in IPD’s standard client contract.
It is not permissible to use data drawn from this report as benchmarks for non-subscribing portfolios without a
licence. A separate licence is required in respect of each and every portfolio for which the benchmark is used.
© Investment Property Databank Limited (IPD) 2012. Database Right. All rights conferred by law of copyright and
by virtue of international conventions are reserved by IPD.
1
3
3
4
4
5
6
7
7
7
9
10
11
12
13
3 IPD Fund Level Analysis for the Norwegian Ministry of Finance
This report has been commissioned by the Ministry of Finance (“MoF”) and has been prepared by Investment Property Databank (“IPD”)1 . The scope of the report incorporates two approaches to performance measurement a) quality assurance on the performance calculations carried out by Norges Bank and b) the calculation of the direct property performance of the Government Pension Fund Global (“GPFG”) Property Portfolio (the “Portfolio”) relating to the return objective (benchmark) as described in the “Real estate benchmarking” chapter. As outlined in the methodology chapter there are distinct methodological differences between the quality assurance calculations and the direct property performance calculations. Because of these differences, a description of the main sources is also included in this report. IPD does not perform an audit control on the underlying data provided by Norges Bank or any other third party which has been required to perform relevant calculations, and this should not be seen to fall under the scope of this report. Separately to this report however, the GPFG balance sheet and income statement have been subject to external audit, and Norges Bank has been verified as being GIPS (Global Investment Performance Standards) compliant.
The report bridges between the two different methodologies employed by IPD in its analysis of performance by Norges Bank, these being a “top-down” quality assurance and a “bottom-up” direct property performance analysis.
Background and role of IPD
Explanatory Section
1 IPD is a global information business, dedicated to the objective measurement of commercial
real estate performance. As the world’s number one provider of real estate performance
analysis for funds, investors, managers and occupiers, IPD offers a full range of services
including research, reporting, benchmarking, conferences and indices. IPD operates in over 30
countries including most of Europe, the US, Canada, South Africa, Australia, New Zealand and
Japan. IPD’s indices are the basis for the developing commercial property derivatives market,
and the most authoritative measures of real estate returns worldwide. For further information
visit www.ipd.com and for IPD’s News Centre visit www.ipd.com/news. IPD is now a subsidiary
of MSCI Inc., a leading provider of investment decision support tools to investors globally,
including asset managers, banks, hedge funds and pension funds. MSCI products and services
include indices, portfolio risk and performance analytics, and governance tools. For further
information visit www.msci.com

IPD Fund Level Analysis for the Norwegian Ministry of Finance 4
Norges Bank’s “top-down” Methodology
The quality assurance calculations, which form the basis of the top-down approach, aim to independently verify the calculation methodology employed by Norges Bank, and validate the return from a methodological standpoint. All Norges Bank Real Estate ring fenced accounting terms are included, and incorporate all underlying assets and liabilities, working capital and management costs. Valuations are made in accordance with IFRS (International Financial Reporting Standards) accounting principles. Under IFRS accruals principle revenue is reported in the fiscal period it was earned regardless of when it is received, and expenses are deducted in the fiscal period they are incurred whether they are paid or not.
Based on these valuations return calculations are performed monthly and upon significant cash flow events. Performance calculations are calculated accordingly to a Time Weighted Return (“TWR”) methodology, with the data required to perform these submitted by Norges Bank, according to pre-specified data requirements deemed necessary for the verification by IPD.
More information on Norges Bank calculation principles can be found at:
www.nbim.no/en/Investments/Return-on-the-fund/methodology-for-the-calculation-of-returns/
Information on Real Estate structures within GPFG can be found in the GPFG annual report at:
www.nbim.no/en/press-and-publications/Reports/810/1062/
IPD’s “bottom-up” Methodology
The bottom-up calculations follow IPD methodology and are based upon returns from the individual property assets through to the vehicle level, and finally aggregated up to the portfolio level. IPD also employs a Time Weighted Return (“TWR”) methodology for all performance calculations on a monthly basis. This measure takes into account investment income, as well as realised and unrealised capital profit and loss. The use of a TWR minimises some of the timing distortions that exist in money-weighted formulae, and the difference that can occur depending on when cash flows in and out of a portfolio are recorded. Differences in return are likely to be greatest where a portfolio is growing rapidly over the period of measurement, and in particular where significant transactions have occurred near the start or end of the period. The TWR formula treats transactions the same regardless of the month in which they take place and there is no incentive to delay transactions because of the effect that timing will have on measurement.
Further details on IPD standard processes, methodology and indices can be found at www.ipd.com/indexguide.
Furthermore, the technical note in the back of this report describes calculation methodologies specific to this report. All of the data required to perform the calculations, except transaction information, has been submitted by Norges Bank’s joint venture (JV) partners according to pre-specified IPD data requirements. Transaction information and that relating to fund management fees and expenses have been submitted by Norges Bank.
5 IPD Fund Level Analysis for the Norwegian Ministry of Finance
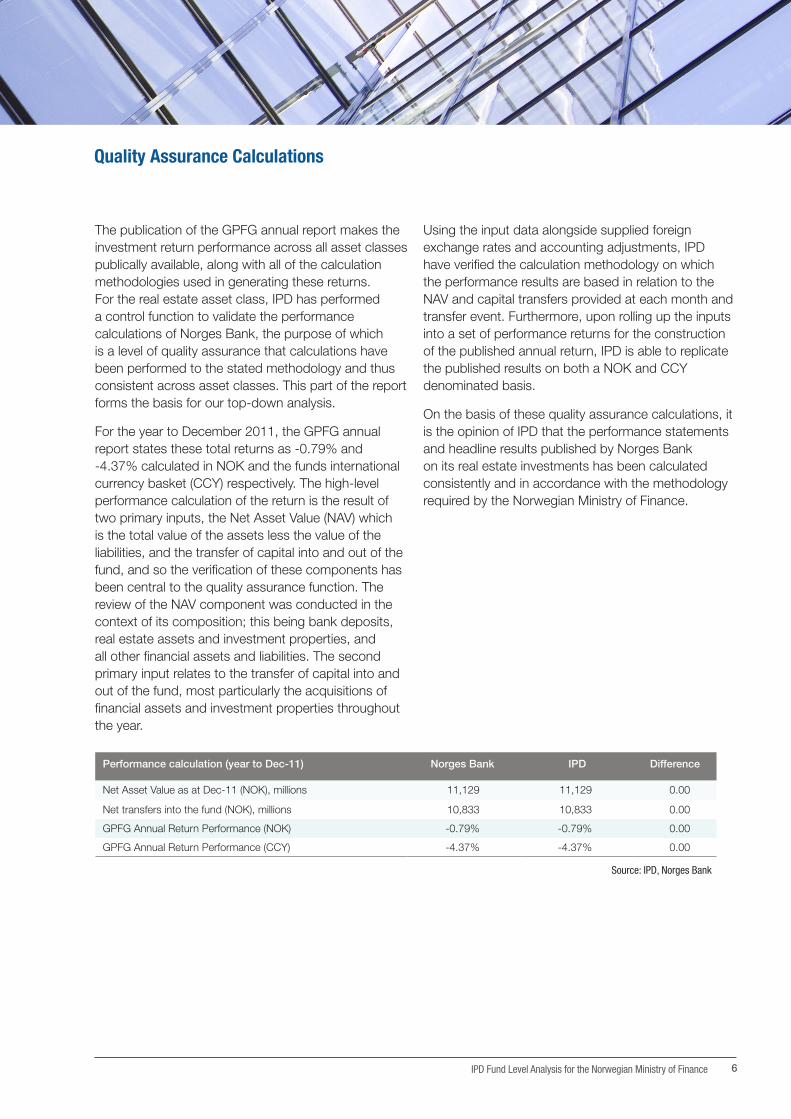
Difference Norges Bank IPD
Valuation hierarchy Asset class. IFRS fair value of total GPFG real estate asset class. Net Asset Value (NAV) incorporating all financial assets and liabilities, fund management fees and operating expenses, capital transfers in and out of the fund, and applicable accounting adjustments
Property level. Gross Asset Value (GAV) valuation of direct real estate investments. Incorporating fund management and operating fees incurred by Norges Bank
Foreign exchange rates GPFG values in both NOK and Currency Basket (CCY); converted monthly, and upon significant capital transfer events
Values converted to Norwegian Kroner (NOK) at WM/Reuters end-month closing spot rates
Acquisition & valuation Acquisition price, then held down for next subsequent valuation
Acquisition price, then interpolated between external valuation estimates
Calculation method Time Weighted Returns (TWR) calculated at month end, and capital transfer events
Time Weighted Returns (TWR) calculated at month end
Differences in MethodologyThe differences in performance that result from the “top-down” and “bottom-up” methodology are to be expected, although with calculations over longer time periods and when transactions become smaller relative to total real estate portfolio size, these differences should become of less importance. Following comparative reviews of the Norges Bank and IPD standard performance calculation methodologies, the differences can be summarised as follows:
In future, the report will be produced on an annual basis showing calendar year performance figures. For 2011, the time period is limited to 9 months (March to December) representing the GPFG real estate holding period. Given that not all markets in the benchmark practice quarterly valuations, it is necessary to apply straight line interpolations in order to generate quarterly benchmark results. This straight line interpolation may lead to a discrepancy between benchmark and actual market performance, particularly when market performance varies during the course of a year.
IPD Fund Level Analysis for the Norwegian Ministry of Finance 6
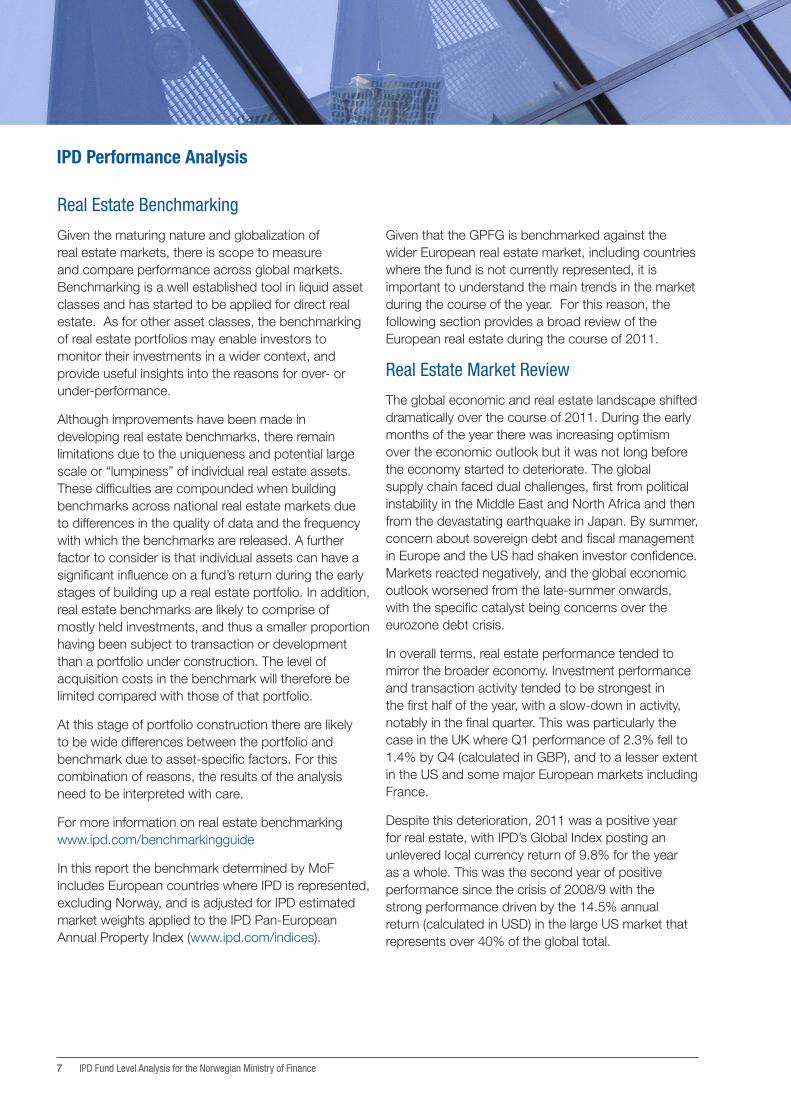
The publication of the GPFG annual report makes the investment return performance across all asset classes publically available, along with all of the calculation methodologies used in generating these returns. For the real estate asset class, IPD has performed a control function to validate the performance calculations of Norges Bank, the purpose of which is a level of quality assurance that calculations have been performed to the stated methodology and thus consistent across asset classes. This part of the report forms the basis for our top-down analysis.
For the year to December 2011, the GPFG annual report states these total returns as -0.79% and -4.37% calculated in NOK and the funds international currency basket (CCY) respectively. The high-level performance calculation of the return is the result of two primary inputs, the Net Asset Value (NAV) which is the total value of the assets less the value of the liabilities, and the transfer of capital into and out of the fund, and so the verification of these components has been central to the quality assurance function. The review of the NAV component was conducted in the context of its composition; this being bank deposits, real estate assets and investment properties, and all other financial assets and liabilities. The second primary input relates to the transfer of capital into and out of the fund, most particularly the acquisitions of financial assets and investment properties throughout the year.
Using the input data alongside supplied foreign exchange rates and accounting adjustments, IPD have verified the calculation methodology on which the performance results are based in relation to the NAV and capital transfers provided at each month and transfer event. Furthermore, upon rolling up the inputs into a set of performance returns for the construction of the published annual return, IPD is able to replicate the published results on both a NOK and CCY denominated basis.
On the basis of these quality assurance calculations, it is the opinion of IPD that the performance statements and headline results published by Norges Bank on its real estate investments has been calculated consistently and in accordance with the methodology required by the Norwegian Ministry of Finance.
Quality Assurance Calculations
Performance calculation (year to Dec-11) Norges Bank IPD Difference
Net Asset Value as at Dec-11 (NOK), millions 11,129 11,129 0.00
Net transfers into the fund (NOK), millions 10,833 10,833 0.00
GPFG Annual Return Performance (NOK) -0.79% -0.79% 0.00
GPFG Annual Return Performance (CCY) -4.37% -4.37% 0.00
Source: IPD, Norges Bank
7 IPD Fund Level Analysis for the Norwegian Ministry of Finance
Real Estate Benchmarking
Given the maturing nature and globalization of real estate markets, there is scope to measure and compare performance across global markets. Benchmarking is a well established tool in liquid asset classes and has started to be applied for direct real estate. As for other asset classes, the benchmarking of real estate portfolios may enable investors to monitor their investments in a wider context, and provide useful insights into the reasons for over- or under-performance.
Although improvements have been made in developing real estate benchmarks, there remain limitations due to the uniqueness and potential large scale or “lumpiness” of individual real estate assets. These difficulties are compounded when building benchmarks across national real estate markets due to differences in the quality of data and the frequency with which the benchmarks are released. A further factor to consider is that individual assets can have a significant influence on a fund’s return during the early stages of building up a real estate portfolio. In addition, real estate benchmarks are likely to comprise of mostly held investments, and thus a smaller proportion having been subject to transaction or development than a portfolio under construction. The level of acquisition costs in the benchmark will therefore be limited compared with those of that portfolio.
At this stage of portfolio construction there are likely to be wide differences between the portfolio and benchmark due to asset-specific factors. For this combination of reasons, the results of the analysis need to be interpreted with care.
For more information on real estate benchmarking www.ipd.com/benchmarkingguide
In this report the benchmark determined by MoF includes European countries where IPD is represented, excluding Norway, and is adjusted for IPD estimated market weights applied to the IPD Pan-European Annual Property Index (www.ipd.com/indices).
Given that the GPFG is benchmarked against the wider European real estate market, including countries where the fund is not currently represented, it is important to understand the main trends in the market during the course of the year. For this reason, the following section provides a broad review of the European real estate during the course of 2011.
Real Estate Market Review
The global economic and real estate landscape shifted dramatically over the course of 2011. During the early months of the year there was increasing optimism over the economic outlook but it was not long before the economy started to deteriorate. The global supply chain faced dual challenges, first from political instability in the Middle East and North Africa and then from the devastating earthquake in Japan. By summer, concern about sovereign debt and fiscal management in Europe and the US had shaken investor confidence. Markets reacted negatively, and the global economic outlook worsened from the late-summer onwards, with the specific catalyst being concerns over the eurozone debt crisis.
In overall terms, real estate performance tended to mirror the broader economy. Investment performance and transaction activity tended to be strongest in the first half of the year, with a slow-down in activity, notably in the final quarter. This was particularly the case in the UK where Q1 performance of 2.3% fell to 1.4% by Q4 (calculated in GBP), and to a lesser extent in the US and some major European markets including France.
Despite this deterioration, 2011 was a positive year for real estate, with IPD’s Global Index posting an unlevered local currency return of 9.8% for the year as a whole. This was the second year of positive performance since the crisis of 2008/9 with the strong performance driven by the 14.5% annual return (calculated in USD) in the large US market that represents over 40% of the global total.
IPD Performance Analysis

IPD Fund Level Analysis for the Norwegian Ministry of Finance 8
Global unlevered real estate returns, 2011 % pa
15.9 14.5
10.4 10.2 10.2 10.1 9.8 8.4 8.4 8.2 7.8 7.8 7.4 6.6 6.3 6.0 5.5 5.2 4.8 4.7 4.3 3.8 3.5 2.9
0.5
-2.4
-15
-10
-5
0
5
10
15
20
Can
ad
a
Un
ited
Sta
tes
So
uth
Afr
ica
Sw
ed
en
Po
lan
d
Au
stra
lia
IPD
Glo
bal I
nd
ex
Ko
rea
Fra
nce
Cze
ch
Rep
ub
lic
UK
Sw
itze
rlan
d
No
rway
Pan
-Eu
rop
ean
Au
stri
a
Fin
lan
d
Germ
an
y
Hu
ng
ary
Belg
ium
Den
mark
Italy
Neth
erl
an
ds
Jap
an
Sp
ain
Po
rtu
gal
Irela
nd
% pa Capital growth Income return Total return IPD Global Index
Note: Annual results based on local currency composite
Source: IPD, KTI (Finland)
European performance was weaker than global performance at 6.6% (annual, local currency returns) with most of the return coming through income (5.5%) rather than value growth (1.1%). Real estate traditionally provides strong income return relative to other asset classes and this continued to be the case in 2011, helped by the write-down of values during the 2008/9 downturn.
Although European markets continued their recovery during 2011, there were a number of important themes that characterized performance during the year, mostly related to variations across markets and properties.
First, there were significant variations from market to market. There was a wide discrepancy in performance across the 18 European countries covered by IPD between the best (Sweden at 10.2%) and worst (Ireland at -2.4%) performing markets. Within these extremes there were further important variations, with real estate values rising in half of the 18 European markets covered by IPD, and continuing to fall in the other nine markets. The UK and French markets generated similar levels of performance during the year, at 7.9% and 8.4% respectively (annual, local currency returns).
Real estate performance tends to vary significantly from market to market and this provides potentially attractive diversification benefits from investing across global markets.
Second, these variations across markets were reflected within countries, particularly the larger countries such as US, Germany, France and UK. Within the UK, for instance, the London market, driven by strong investor demand and relatively limited supply, generated a return of 11.2%, far stronger than some of the provincial UK markets such as Edinburgh where returns totalled 4.8%. In a similar way, the robust economy of Munich generated strong performance of 8.6%, nearly 600 bp higher than the financial capital of Germany, Frankfurt.
Third, across most markets it tended to be the better quality assets and locations that performed most strongly, with secondary assets tending to underperform. The weakness of the economic recovery, the limited availability of real estate debt and still cautious investor demand held back the recovery of secondary markets. In contrast, the good quality assets attracted relatively strong tenant demand and were the target of a series of major investors and this served to drive the performance of these better quality assets.
9 IPD Fund Level Analysis for the Norwegian Ministry of Finance
Portfolio and Relative Performance
IPD is best known for the indices and benchmarks it provides on direct real estate, on portfolios of property held by investing institutions, and this forms the basis for the “bottom-up” approach to performance measurement in this report. This focuses on the performance of direct real estate investment based on the Gross Asset Value (GAV) of the properties and their relative performance against comparable benchmarks. One of the key strengths with this methodology is the analytical capabilities it presents.
During the course of 2011, GPFG invested in two major assets, in London (March) and in Paris (August). The difference in the timing of the investments needs to be taken into account in calculating performance relative to the benchmark, particularly given the slowing of the UK market during the course of the year. A more fundamental caveat relates to the early stage and high asset concentration of the portfolio. At the early stages of building up a real estate portfolio it is likely that there will be wide differences between the portfolio and benchmark performance due to the high concentration and property risks. These asset specific factors become less significant once the portfolio has moved beyond its construction phase.
The overall fund performance for the relevant time period was 1.2% calculated on a NOK basis. This performance was mostly attributable to the direct real estate component given the lack of leverage over the period. The benchmark, which is adjusted for management costs2, returned 5.0% in the same period. The underlying direct real estate performance was 1.5% and it compares with the benchmark return of 5.3%. This direct property performance was driven by both weaker capital growth (-1.9% compared with 1.3% for the benchmark) and income return (3.4% compared with 4.0%).
There were marked differences in the performance of the two investments although, as already stressed, the high concentration and property-specific factors means there are limitations that can be drawn from any comparisons with the benchmarks at this stage. Despite this, the analysis illustrates the types of insights that can be gained and will become more useful as the portfolio grows in scale. For instance the attribution analysis demonstrates that the under-performance in both the UK and France was driven by property specific factors, rather than structural factors related to asset allocation decisions. This would suggest that in these early stages of portfolio construction, the asset allocation decisions in positioning the portfolio have been positive, but these have been offset by the acquisition costs associated with building the real estate portfolio.
2 The Fund Management Fees and Fund Operating Expenses included in the portfolio and
benchmark returns are equivalent to the total expenses borne by the fund over the period to
December 2011. These costs were equivalent to NOK 27 million and equated to 0.25% of
year-end Gross Asset Value. The Fund Management Fees included all fees charged by external
fund managers for their fund management services as defined by the fund management
agreement. This was equivalent to NOK 7 million in 2011 and reflects the external
management fees in 2011. In addition, Non-rechargeable expenses incurred in the course
of undertaking normal business are also included. These reflect the operating costs incurred
in the holding structure of entities owned and operated by NBIM. Specifically these relate to
accounting, insurance, legal costs, valuation fees and any other expenses that amounted to
NOK 20 million in 2011.

IPD Fund Level Analysis for the Norwegian Ministry of Finance 10
Europe - Direct Property
The Portfolio balance sheet shows the composition of the Portfolio. Starting from the overall exposure or Gross Asset Value (GAV), the Net Asset Value (NAV) is derived from deducting the total liabilities. The GAV is a composition of Direct Property Investments (DIP) and Other Indirect Assets (OIA).
Balance Sheet March to December 2011
All figures shown in NOK million Capital Value Mar ‘11 Capital Value Dec ‘11 Net Investment Value Change
Gross Asset Value (GAV) 3,962.6 10,932.0 6,892.8 76.6
Direct Property Investments (DIP) 3,962.6 10,932.0 6,892.8 76.6
Europe 3,962.6 10,932.0 6,892.8 76.6
Retail 2,639.1 3,006.1 77.9 289.1
France 0.0 5.6 2.8 2.8
UK 2,639.1 3,000.5 75.1 286.3
Rest of Europe - - - -
Office 1,285.2 7,883.5 6,814.3 -215.9
France 0.0 6,466.8 6,799.2 -332.4
UK 1,285.2 1,416.7 15.0 116.5
Rest of Europe - - - -
Industrial 0.0 0.0 0.0 0.0
France 0.0 0.0 0.0 0.0
UK 0.0 0.0 0.0 0.0
Rest of Europe - - - -
Residential 28.0 31.7 0.0 3.7
France 0.0 0.0 0.0 0.0
UK 28.0 31.7 0.0 3.7
Rest of Europe - - - -
Other 10.3 10.8 0.7 -0.2
France 0.0 0.0 0.0 0.0
UK 10.3 10.8 0.7 -0.2
Rest of Europe - - - -
Other Indirect Assets (OIA) 0.0 0.0 0.0 0.0
Other 0.0 0.0 0.0 0.0
Total Liabilities 0.0 0.0 0.0 0.0
Net Cash/Debt 0.0 0.0 0.0 0.0
Net Asset Value (NAV) 3,962.6 10,932.0 6,892.8 76.6
Office
Retail
Residential
Other
27.5%
72.1%
0.3% 0.1%Capital Value per end of period quantifies the
respective holding in an asset class. Gross Asset
Value is total wealth accumulated within the
Portfolio. Total Liabilities are the total of all debt
and cash position. Net Asset Value is the numeric
subtraction between GAV and Total Liabilities.

11 IPD Fund Level Analysis for the Norwegian Ministry of Finance
Components of Net Asset Value Return, in %
Absolute ReturnsMarch to December 2011
Components of Net Asset Return
All figures shown in % Net Asset Return - All
Assets
Impact of Leverage **
Direct Investment Property
Total Income Capital
Other Indirect Assets
Fees Tax Recon-ciliation
All Regions - Benchmark *** 5.0 0.0 5.3 4.0 1.3 - -0.3 0.0 0.0
All Regions - Portfolio 1.2 0.0 1.5 3.4 -1.9 - -0.3 0.0 0.0
Europe - Portfolio 1.2 0.0 1.5 3.4 -1.9 - -0.3 0.0 0.0
Retail 9.4 0.0 9.7 3.2 6.3 - -0.3 0.0 0.0
France* 98.1 0.0 98.4 -0.4 99.1 - -0.3 0.0 -
UK 9.3 0.0 9.6 3.2 6.3 - -0.3 0.0 0.0
Rest of Europe - - - - - - - -
Office -2.4 0.0 -2.1 3.7 -5.6 - -0.3 0.0 0.0
France -3.7 0.0 -3.6 2.1 -5.6 - -0.2 0.0 -
UK 7.7 0.0 7.9 3.5 4.3 - -0.3 0.0 0.0
Rest of Europe - - - - - - - -
Industrial - - - - - - - - -
France - - - - - - - - -
UK - - - - - - - - -
Rest of Europe - - - - - - - -
Residential 12.4 0.0 12.7 3.8 8.6 - -0.3 0.0 0.0
France - - - - - - - - -
UK 12.4 0.0 12.7 3.8 8.6 - -0.3 0.0 0.0
Rest of Europe - - - - - - - -
Other -15.1 0.0 -14.9 -6.2 -9.3 - -0.2 0.0 0.0
France - - - - - - - - -
UK -15.1 0.0 -14.9 -6.2 -9.3 - -0.2 0.0 0.0
Rest of Europe - - - - - - - -
Contribution to NAV Cumulative ReturnComponents of NAV Return
0.0
0.2
0.4
0.6
0.8
1.0
1.2
1.4
1.6
Direct Investment Property
Leverage ** Other Indirect Assets
Fees Tax Reconciliation Net Asset Return
Note: The graph below displays the breakdown of the Portfolio NAV return by each individual component. Starting with direct property investment on the left, each component adds either a positive or negative return (bar) to the cumulated NAV return (dot). A green bar indicates that the components have a positive contribution to the NAV return. A red bar indicates that the component records a negative return over the period and therefore contributes negatively to the NAV return. The sum of the components results in the total NAV over the period which is shown by the bar on the right
The table below shows the Portfolio performance per segment, sector and on total level. The Net Asset Return of the Portfolio is reconciled with the Direct Property, Other Indirect Assets, Fees and Tax performance.
* Extreme return from development asset.** There is currently no capacity to borrow within any JV partnership, leverage employed is zero.*** Benchmark adjusted by the same level of Debt/Fee/Tax components (as a percentage of value), as reported by NBIM.
Note: All calculated periodic returns are
linked geometrically

IPD Fund Level Analysis for the Norwegian Ministry of Finance 12
Attribution of relative return, in %
Attribution AnalysisMarch to December 2011
All figures shown in % Total Return
Portfolio Bmk Rel.
Attribution of relative return
Structure Property FX Impact
Percentage of capital employed
Portfolio Bmk Difference
All Regions 1.5 5.3 -3.8 0.6 -7.4 3.4 100.0 100.0 0.0
Europe 1.5 5.3 -3.8 0.6 -7.4 3.4 100.0 100.0 0.0
Retail 9.7 6.2 3.5 -0.1 -1.6 2.0 26.8 30.6 -3.8
France* 98.4 5.6 92.8 -0.1 0.0 0.0 0.0 3.7 -3.6
UK 9.6 9.4 0.2 0.0 -1.7 1.9 26.7 9.4 17.3
Rest of Europe - 4.6 - -0.1 - 0.1 0.0 17.5 -17.5
Office -2.1 4.3 -6.4 0.7 -5.7 1.5 72.8 41.7 31.1
France -3.6 3.7 -7.3 0.0 -4.0 0.5 60.2 8.2 52.0
UK 7.9 11.8 -3.9 0.4 -1.7 0.9 12.7 5.2 7.4
Rest of Europe - 3.2 - 0.3 - 0.2 0.0 28.3 -28.3
Industrial - 5.4 - 0.0 - -0.1 0.0 7.3 -7.3
France - 2.5 - 0.0 - 0.0 0.0 1.2 -1.2
UK - 10.2 - 0.0 - -0.1 0.0 2.5 -2.5
Rest of Europe - 3.1 - 0.0 - 0.0 0.0 3.6 -3.6
Residential 12.7 6.1 6.6 0.0 0.0 -0.1 0.3 15.7 -15.4
France - 8.3 - 0.0 - 0.0 0.0 2.4 -2.4
UK 12.7 13.0 -0.3 0.0 0.0 0.0 0.3 0.7 -0.4
Rest of Europe - 5.4 - 0.1 - -0.1 0.0 12.6 -12.6
Other -14.9 5.8 -20.7 0.0 -0.1 0.0 0.1 4.7 -4.6
France - 6.0 - 0.0 - 0.0 0.0 0.6 -0.6
UK -14.9 13.2 -28.1 0.0 -0.1 0.0 0.1 1.0 -0.9
Rest of Europe - 3.5 - 0.0 - 0.0 0.0 3.1 -3.1
The attribution technique calculates that part of the relative return derived from the Portfolio’s Gross Asset Value relative weighting in the strong or weak sectors of the market (structure component), and that portion which is due to the exceptional performance of the Portfolio’s own assets within each segment of the market (property component).
Structure score: If a portfolio has an above-average weighting in a strong performing segment of the market, the structure component for the segment will be positive. Conversely an above-average weighting in a poor performing segment of the market will result in a negative structure component.
Property score: If a Portfolio is represented in a segment of the market, and its properties have recorded above-average returns relative to the benchmark, the resultant property score will be positive.
FX Impact: Displays the impact of currency exchange rate fluctuation on the relative return of the portfolio vs. the benchmark. A positive currency impact implies that currency movements affected the portfolio “better” than the benchmark.
Structure Property FX Impact
-8.00 -6.00 -4.00 -2.00 0.00 2.00 4.00
All Regions
Retail
Office
Industrial
Residential
Other
* Extreme return verified and results from development asset.Note: All calculated periodic returns are linked geometrically
13 IPD Fund Level Analysis for the Norwegian Ministry of Finance
Appendix: Technical Notes
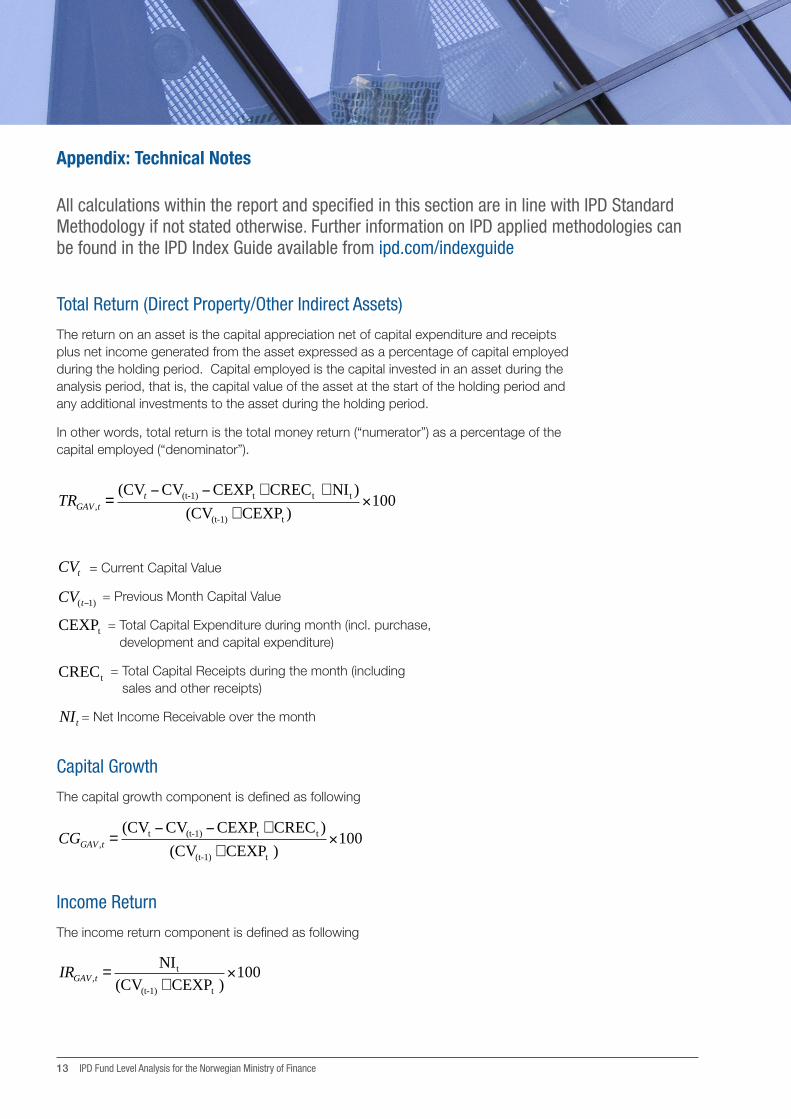
Total Return (Direct Property/Other Indirect Assets)
The return on an asset is the capital appreciation net of capital expenditure and receipts plus net income generated from the asset expressed as a percentage of capital employed during the holding period. Capital employed is the capital invested in an asset during the analysis period, that is, the capital value of the asset at the start of the holding period and any additional investments to the asset during the holding period.
In other words, total return is the total money return (“numerator”) as a percentage of the capital employed (“denominator”).
TRGAV ,t =(CVt −CV(t-1) −CEXPt + CRECt + NIt )
(CV(t-1) + CEXPt )×100
Capital Growth
The capital growth component is defined as following
CGGAV ,t =(CVt −CV(t-1) −CEXPt + CRECt )
(CV(t-1) + CEXPt )×100
Income Return
The income return component is defined as following
IRGAV ,t =NIt
(CV(t-1) + CEXPt )×100
All calculations within the report and specified in this section are in line with IPD Standard Methodology if not stated otherwise. Further information on IPD applied methodologies can be found in the IPD Index Guide available from ipd.com/indexguide
CVt = Current Capital Value
CV(t−1) = Previous Month Capital Value
CEXPt = Total Capital Expenditure during month (incl. purchase, development and capital expenditure)
CRECt = Total Capital Receipts during the month (including sales and other receipts)
NIt = Net Income Receivable over the month
IPD Fund Level Analysis for the Norwegian Ministry of Finance 14
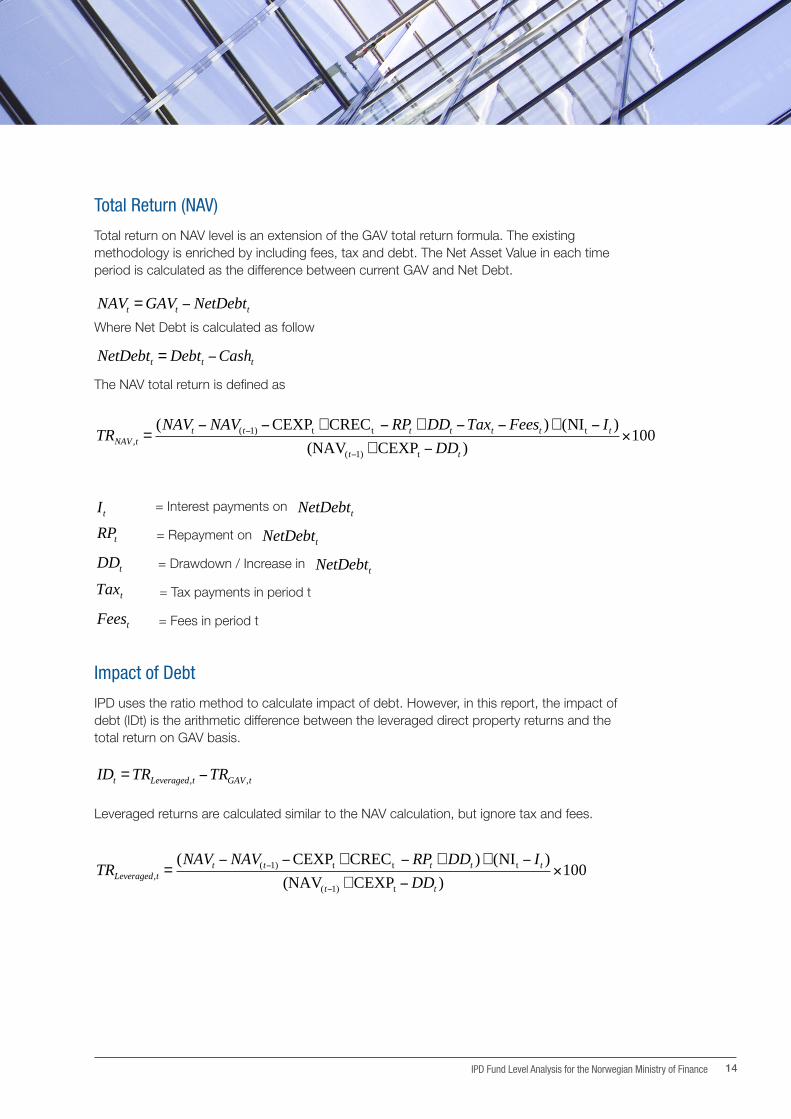
Total Return (NAV)
Total return on NAV level is an extension of the GAV total return formula. The existing methodology is enriched by including fees, tax and debt. The Net Asset Value in each time period is calculated as the difference between current GAV and Net Debt.
NAVt = GAVt − NetDebtt
Where Net Debt is calculated as follow
NetDebtt = Debtt −Casht
The NAV total return is defined as
TRNAV ,t =(NAVt − NAV(t−1) −CEXPt + CRECt − RPt + DDt −Taxt −Feest )+ (NIt − It )
(NAV(t−1) + CEXPt −DDt )×100
Impact of Debt
IPD uses the ratio method to calculate impact of debt. However, in this report, the impact of debt (IDt) is the arithmetic difference between the leveraged direct property returns and the total return on GAV basis.
IDt = TRLeveraged,t −TRGAV ,t
Leveraged returns are calculated similar to the NAV calculation, but ignore tax and fees.
TRLeveraged,t =(NAVt − NAV(t−1) −CEXPt + CRECt − RPt + DDt )+ (NIt − It )
(NAV(t−1) + CEXPt −DDt )×100
It = Interest payments on NetDebtt
RPt = Repayment on NetDebtt
DDt = Drawdown / Increase in NetDebtt
Taxt = Tax payments in period t
Feest = Fees in period t

15 IPD Fund Level Analysis for the Norwegian Ministry of Finance
Relative Return
IPD standard methodology for calculating relative returns is by taking the ratio of the fund return to the benchmark return. In this report, the relative return is the arithmetic difference between the fund performance and the chosen benchmark performance.
RRt = TRfund,t −TRbenchmark,t
Compounded Performance Measures
All IPD measures are calculated on monthly basis. In order to produce measures on a higher time denomination, the concept of compounding is applied. Compounding is performed as following (taking the annualised total return measure as an example):
100× 1+TRt−i
100⎛
⎝⎜
⎞
⎠⎟−1
i=0
11
∏⎡
⎣⎢
⎤
⎦⎥=100× 1+
TRt
100⎛
⎝⎜
⎞
⎠⎟× 1+
TRt−1
100⎛
⎝⎜
⎞
⎠⎟×...× 1+
TRt−11
100⎛
⎝⎜
⎞
⎠⎟−1
⎡
⎣⎢
⎤
⎦⎥
TRt = Total return
Attribution Analysis: Structure Score
Structure Score provides information on whether, compared with a peer group, an individual portfolio is best allocated to take advantage of market conditions.
IPD standard methodology for relative return is the geometric method which stands in contrast to the arithmetic approach used in this formula.
Structure Score is the proportion of the relative return attributable to the weightings of the portfolio relative to the benchmark in each of the segments used in the analysis.
WeightingFund,t −WeightingMarket,t⎡⎣ ⎤⎦× TRMarket _ Segment,t −TRMarket,t⎡⎣ ⎤⎦
RRt = Relative return
TRfund, t = Total Return of Fund (NAV)
TRbenchmark,t = Total Return of Benchmark (NAV)
WeightingFund,t = Weighting of the fund by Capital Employed
WeightingMarket,t = Weighting of the market by Capital Employed
TRMarket _ Segment,t = Market Total Return per segment in period t
TRMarket,t = Market Total Return in period t
IPD Fund Level Analysis for the Norwegian Ministry of Finance 16
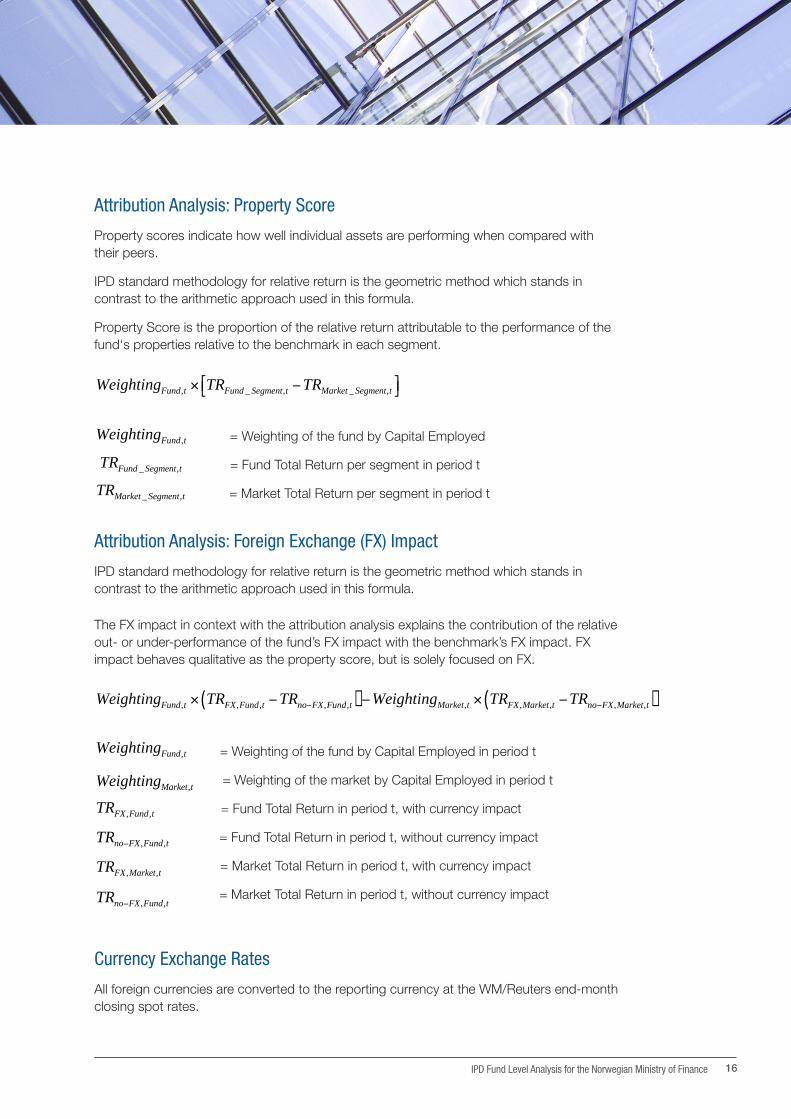
Attribution Analysis: Property Score
Property scores indicate how well individual assets are performing when compared with their peers.
IPD standard methodology for relative return is the geometric method which stands in contrast to the arithmetic approach used in this formula.
Property Score is the proportion of the relative return attributable to the performance of the fund‘s properties relative to the benchmark in each segment.
WeightingFund,t × TRFund _ Segment,t −TRMarket _ Segment,t⎡⎣ ⎤⎦
Attribution Analysis: Foreign Exchange (FX) Impact
IPD standard methodology for relative return is the geometric method which stands in contrast to the arithmetic approach used in this formula.
The FX impact in context with the attribution analysis explains the contribution of the relative out- or under-performance of the fund’s FX impact with the benchmark’s FX impact. FX impact behaves qualitative as the property score, but is solely focused on FX.
WeightingFund,t × TRFX,Fund,t −TRno−FX,Fund,t( )−WeightingMarket,t × TRFX,Market,t −TRno−FX,Market,t( )
Currency Exchange Rates
All foreign currencies are converted to the reporting currency at the WM/Reuters end-month closing spot rates.
WeightingFund,t = Weighting of the fund by Capital Employed
TRFund _ Segment,t = Fund Total Return per segment in period t
TRMarket _ Segment,t = Market Total Return per segment in period t
WeightingFund,t = Weighting of the fund by Capital Employed in period t
WeightingMarket,t = Weighting of the market by Capital Employed in period t
TRFX,Fund,t = Fund Total Return in period t, with currency impact
TRno−FX,Fund,t = Fund Total Return in period t, without currency impact
TRFX,Market,t = Market Total Return in period t, with currency impact
TRno−FX,Fund,t = Market Total Return in period t, without currency impact

Australia
T +61 (0) 2 9248 1900 [email protected] ipd.com/australia
France
T +33 (0) 15 805 3690 [email protected] ipd.com/france
Germany
T +49 (0) 611 3344 990 [email protected] ipd.com/germany
Hong Kong
T +85 2 8175 4388 [email protected] ipd.com/asia
Japan
T +81 3 5211 1455 [email protected] ipd.com/japan
Netherlands
T +31 (0) 88 328 2200 [email protected] ipd.com/netherlands
Sweden
T +46 (0) 8 4002 5230 [email protected] ipd.com/nordic
South Africa
T +27 (0) 11 656 2115 [email protected] ipd.com/southafrica
Spain
T +34 (0) 91 761 0271 [email protected] ipd.com/spain
United Kingdom
T +44 (0) 20 7336 4783 [email protected] ipd.com/uk
USA
T +1 (0) 312 646 6240 [email protected] ipd.com/usa
Visit us at IPD.com Follow us at @IPDnewsJoin us on LinkedIn