Embed Size (px)
Citation preview
Virginia Commonwealth University Virginia Commonwealth University
VCU Scholars Compass VCU Scholars Compass
Theses and Dissertations Graduate School
1987
Nosocomial Respiratory Tract Infections Associated with the Use Nosocomial Respiratory Tract Infections Associated with the Use
of Ventilatory Support Systems: Epidemiological and of Ventilatory Support Systems: Epidemiological and
Bacteriological Study of the Effect of Changing Breathing Circuits Bacteriological Study of the Effect of Changing Breathing Circuits
at 24 or 48 Hours at 24 or 48 Hours
Virginia Archer Lamb
Follow this and additional works at: https://scholarscompass.vcu.edu/etd
Part of the Medical Pathology Commons
© The Author
Downloaded from Downloaded from https://scholarscompass.vcu.edu/etd/3899
This Dissertation is brought to you for free and open access by the Graduate School at VCU Scholars Compass. It has been accepted for inclusion in Theses and Dissertations by an authorized administrator of VCU Scholars Compass. For more information, please contact [email protected].
Nosocomial Respiratory Tract Infections Associated with the Use of Ventilatory Support Systems:
Epidemiological and Bacteriological Study of the Effect of Changing Breathing Circuits at 24 or 48 Hours
A dissertation submitted in partial fulfillment of the requirement for the degree of Doctor of Philosophy at Virginia Commonwealth University.
by
Virginia Archer Lamb
B.A., Queens' College, 1969
MT(ASCP), University of Virginia,1970
M.S., Medical College of Virginia, 1975
Director: Dr. Harry P. Dalton, Professor of Pathology, Department of Pathology
Virginia Commonwealth University Richmond, Virginia
August, 1987

© Virginia Archer Lamb 1987 All Rights Reserved
ii
Acknowledgements
The author wishes to acknowledge the following people:
* My advisor, Dr. Harry P. Dalton for his encouragement, advise and support during the past 15 years
* My boss, Dr. C.Glen Mayhall for his guidance, patience and assistance during the past 13 years
* My thesis committee for their interest, support and concern
* The Respiratory Care personnel whose cooperation, encouragement and support contributed to this study
* Nursing personnel for their cooperation and pleasantness
* Katherine Eakins, Respiratory Therapist, for her extensive support, assistance and suggestions
* Dr. Kevin Cooper and Dr. Berry Fowler who gave innumerable hours in interpreting the chest X-rays of the study pat ients
* The Microbiology laboratory staff for processing the clinical specimens and preparing culture media
* Gaye 0. Hall for her laboratory assistance
* The members of the Hospital Epidemiology Unit for their patience and understanding
* My family for their encouragement, assistance and unrelenting confidence throughout my educational pursuits
* My friends for their tolerance and extensive support and encouragement
* The statistician, Dr.Al Best, for his endless hours of work and patience
* Schering Laboratories for providing the majority of the financial support for this project
* All who were not mentioned by name, but who have directed me
TABLE OF CONTENTS
Page List of Tables vi
List of Figures vii
Introduction 1
Literature Review 5
Normal Lung Anatomy 5
Normal Host Defenses 5
Pathophysiology of Hospital Acquired Pneumonias ... .9
Microorganisms that Cause Hospital Acquired Pneumonias.9
Routes of Infection 10
Oropharyngeal Colonization 11
Gastric Colonization and Amplification 16
Intubation of the Respiratory Tract 17
Aspiration 20
Removal of Respiratory Secretions with Suction Catheters 23
Epidemiology 23
Definition of Hospital Acquired Pneumonia 23
Diagnosis of Hospital Acquired Pneumonia 25
Descriptive Epidemiology 27
Risk Factors 29
Demographic factors 29
Underlying disease 30
Duration of hospitalization 31
iv
Presence of remote infection 31
Surgery 31
Ventilators 32
Outbreaks 34
Humidification by Nebulizers 35
Humidification by Humidifiers 36
Microbiology of Nebulizers and Humidifers 36
Nebulizers 36
Humidifiers 39
Description of Outbreaks 41
Epidemiology of Ventilator Breathing Circuits .... 45
Objectives of study 49
Materials and Methods 51
Respiratory Therapy Equipment 51
Randomization 52
Blinding 53
Epidemiology 53
Collection of Microbiologic Samples 54
Definitions 57
Microbiology 59
Statistical Analysis 59
Results 61
Infections and Outcome of Infections 62
Pneumonia 62
Tracheobronchitis 62
V
Bacteremia 65
Outcome of Infections 65
Epidemiology 65
Twenty-four versus Forty-eight Hour Circuit Changes. .65
Risk Factors for Infection 72
Multivariate Analysis 87
Microbiology 88
Microorganisms Isolated from Circuits 89
Cultures of Air 89
Cultures from Subgroup of Patients Randomized to Receive Circuit Changes at 24 Hours 95
Microbial Contamination of Circuits Changed every 48 Hours 98
Discussion 102
References 114
Appendix 124
Vita 131
vi
List of Tables
Table Page
1. Non-Pathogenic Microorganisms 58
2. Pathogens Isolated from the Sputum of Patients with Pneumonia 63
3. Pathogens Isolated from the Sputum of Patients with Tracheobronchitis 64
4. Cases of Septicemia: Microorganisms from Blood and Sputum 66
5. Results of Randomization: Demographic Factors. . . .67
6. Results of Randomization: Admitting Diagnoses. . . .68
7. Results of Randomization: Medications 70
8. Results of Randomization: Epidemiologic Characteristics 71
9. Patients with Pneumonia versus Patients without Pneumonia: Demographic Factors 74
10. Patients with Pneumonia versus Patients without Pneumonia: Admitting Diagnoses 75
11. Patients with Pneumonia versus Patients without Pneumonia: Medications 77
12. Patients with Pneumonia versus Patients without Pneumonia: Epidemiologic Characteristics 78
13. Patients with Pneumonia versus Patients without Infection: Demographic Factors 79
14. Patients with Pneumonia versus Patients without Infection: Admitting Diagnoses 80
15. Patients with Pneumonia versus Patients without Infection: Medications 81
16. Patients with Pneumonia versus Patients without Infection: Epidemiologic Characteristics 82
17
18
19
20
2 1
22
23
24
25
2 6 ,
27.
2 8 ,
29.
vii
Patients with Tracheobronchitis versus Patients without Infection: Demographic Factors 83
Patients with Tracheobronchitis versus Patients without Infection: Admitting Diagnoses 84
Patients with Tracheobronchitis versus Patients without Infection: Medications 85
Patients with Tracheobronchitis versus Patients without Infection: Epidemiologic Characteristics. . 86
Rates of Positive Cultures for Circuits Changed at 24 Hours versus 48 Hours 90
Microorganisms Isolated from Circuits Changed every 24 Hours 91
Microorganisms Isolated from Circuits Changed every 48 Hours 92
Microorganisms Isolated from Air of Ventilator Circuits Changed every 24 Hours 93
Microorganisms Isolated from Air of Ventilator Circuits Changed every 48 Hours 94
Culture Results from Circuits in Group IA and Group IB: Positive Cultures versus Negative Cultures 96
Culture Results from Circuits in Group IA and Group IB: Pathogens versus Absence of Pathogens 97
Culture Results from Circuits in Group I and Group I: Positive Cultures versus Negative Cultures 99
Culture Results from Circuits in Group I and Group II: Pathogens versus Absence of Pathogens . 100
viii
List of Figures
Figure Page
1. Patient on mechanical ventilation 4
INTRODUCTION
Nosocomial (hospital-acquired) pneumonia (HAP)
continues to be an important cause of morbidity and
mortality in the hospital. HAP is the third most common
nosocomial infection after urinary tract and surgical wound
infections (13). In addition, HAP is the nosocomial
infection with the highest mortality rate (93). These
infections are often difficult to treat, because most are
caused by Gram-negative bacilli (GNB) that may be highly
resistant to antimicrobial agents (12). HAPs frequently
occur in intensive care patients with underlying lung
and/or systemic diseases (45,39). Many patients are
intubated and are on assisted ventilation. Several sources
of infection associated with ventilators or respirators have
been described in the past. Most of these sources have been
eliminated by improvement in techniques used in the
disinfection and cleaning of ventilator equipment (25).
Today, the focus of concern is microbial contamination of
the breathing circuit of the ventilator (90). The Centers
for Disease Control (CDC) recommend that the ventilator
breathing circuits be changed every 24 hours. The very
limited epidemiological and microbiological data from one
medical center (17,20) demonstrate that it may not be
1
2
necessary to change these circuits as often as every 24
hours. However, before changing this conservative
recommendation, more data are needed to establish the
safety of changing circuits at longer intervals. The
approximate cost of the ventilator circuit is $15. It is
estimated that changing ventilator breathing circuits at 48
hours rather than 24 hours would amount to $50,000 per year
in savings at the Medical College of Virginia. On a
national scale the savings would amount to millions of
dollars.
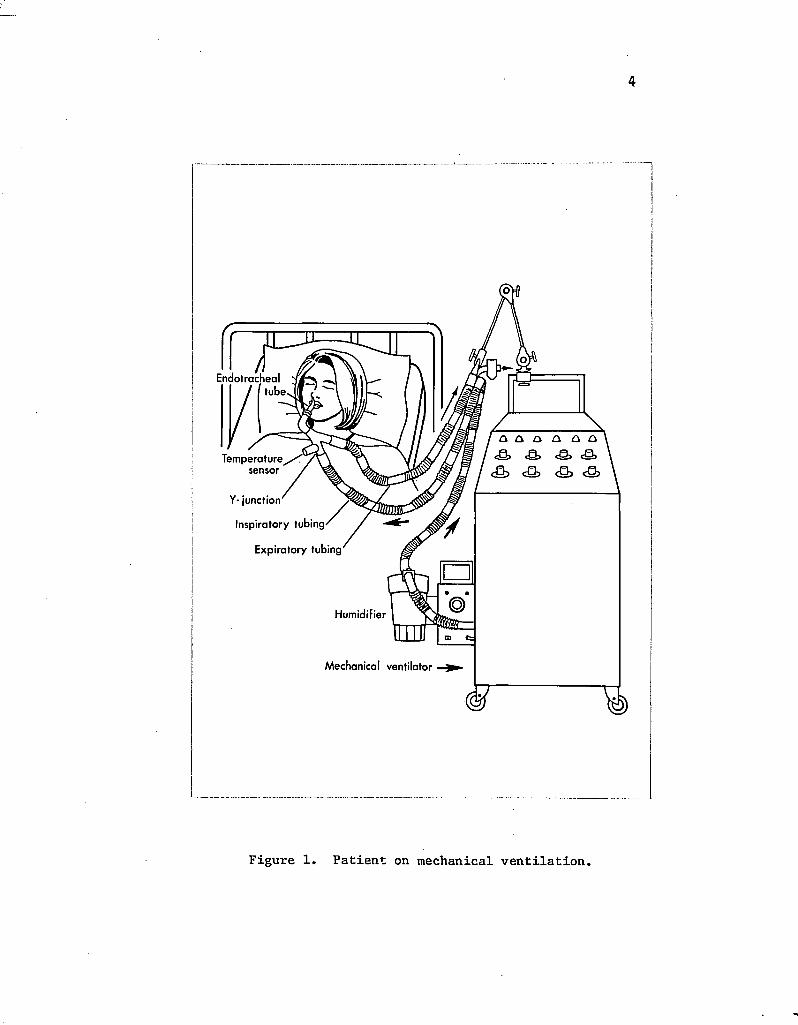
Most patients who are placed on ventilatory assistance
are supported by continuous volume respirators (Fig. 1).
Air is humidified when it is passed through a cascade, or
wick humidifier. After passage through the humidifier, the
gases are delivered to the patient by the inspiratory tubing
in the breathing circuit. The inspiratory tubing is
connected to the endotracheal tube of the patient by a Y-
connector and swivel adaptor. Expired gases from the
patient are conducted away by the expiratory tubing which
connects to the other limb of the Y-connector. Condensate
frequently collects in the respiratory breathing circuit.
The warm moist environment of the respiratory circuit is
conducive to growth of any microorganisms that may enter the
circuit. When the respiratory circuit is contaminated with
microorganisms, there is the potential for delivery of
bacteria or fungi to the patient's lower respiratory tract.
Whether or not infection takes place is determined by one or
a combination of several factors including the virulence of

3
the organisms, the size of the inoculum, the presence of
foreign bodies in the respiratory tract and the status
of host defenses.
4
Endotracheal / tube
<Q> eg,
<&> <s» <s> <& Temperature sensor /
Y- junction
Inspiratory tubing/
Expiratory tubing
Humidifier
Mechanical ventilator
Figure 1. Patient on mechanical ventilation.
LITERATURE REVIEW
Normal Lung Anatomy
The tracheobronchial tree of humans consists of the
trachea, bronchi,and bronchioles. The main bronchus is
subdivided into two branches known as the nonrespiratory
bronchioles. From these bronchioles branch the terminal
bronchioles and respiratory bronchioles. Distal to the
terminal bronchioles are the alveoli, where oxygen and CO 2
exchange takes place.
Normal Host Defenses
Humans are provided with a variety of non-specific
defenses against invasion of the lungs by foreign particles.
First, the size of the particle determines where it will be
deposited (87,64). The aerodynamic defenses of the
respiratory tract remove particulate matter from the
airstream by impaction or sedimentation. In the nose this
process begins with filtration by the nasal hairs of very
large particles (10-20u in size). These particles will
impact on the surfaces of the nasal septum and turbinates.
As the airstream then changes direction at the nasopharynx,
particles of approximately lOu in size will impact on the
posterior wall of the pharynx. The airway above the vocal
cords is narrow and irregular, creating turbulence and
5
6
forcing both large and smaller particles onto the
mucociliary blanket which lines the tracheobronchial tree.
This blanket which extends from the nasopharynx to the
terminal bronchioles rests on the cilia of the respiratory
epithelial cells. Each epithelial cell is laden with
approximately 200 cilia. The upward movement of the
respiratory cilia (more than 14 times per second) sweeps the
overlying mucus blanket towards the oropharynx where the
mucus and its entrapped material are swallowed or
expectorated.
Below the vocal cords, sedimentation, which removes
most particles of 5.0 u to 0.2 u, becomes more important
than impaction. The airstream velocity slows as it enters
the progressive bifurcations of the tracheobronchial tree.
Larger particles are removed in the more proximal bronchial
tree, and smaller ones may reach the peripheral airways
before being deposited onto the mucociliary blanket. A few
of these small particles can settle in the lower respiratory
tract. Particles smaller than 0.1 u are distributed
randomly throughout the airways by their brownian motion,
and most of them are exhaled (3,66).
In the air exchange units other components of the host
defenses become important. The substances lining the alveoli
include surfactant, iron-containing proteins (transferrin),
IgG, opsonins and properdin (78). Surfactant is a substance
secreted by alveolar cells into the alveoli which reduces
the surface tension. The remaining substances are present
in the blood. Transferrin is important in the transport of
7
iron, IgG is an immunoglobulin fraction which contains
antibodies, opsonins prepare bacteria for phagocytosis and
properdin is a nonspecific antibody-like substance that
kills bacteria and viruses and lyses certain red blood
cells.
The airway reflexes are an important adjunct to the
other defenses of the respiratory tract. The cough removes
excessive secretions and foreign materials from the
tracheobronchial tree. Bronchoconstriction prevents or
reduces penetration of inhaled materials into the distal
areas of the respiratory tract.
Several local factors inhibit adherence of GNB. Oral
secretions contain IgA antibody which has been shown to coat
various bacteria and prevent their adherence (102). The
adherence of GNB to epithelial cells of the oropharynx is
due to an alteration of the cells' receptors (66,104). Woods
and associates have shown that the host alterations
associated with increased susceptibility to Pseudomonas
§§£U£.ii]osa colonization are due to the loss of fibronectin
from the cell surface. They examined buccal epithelial
cells from 12 seriously ill patients who were colonized with
Ei §§EU£iD2§§ and from uncolonized controls. They found that
the presence of fibronectin prevented adherence of GNB. The
function of fibronectin in the lung is uncertain (78).
Fibronectin is an adhesive substance secreted by alveolar
macrophages which also coats microorganisms and facilitates
attachment to phagocytic cells.
8
In addition, the oropharynx contains a large and
complex resident bacterial flora. These normal microflora
are acquired shortly after birth and remain constant over
time in a given individual, but often differ among
individuals. Although the upper respiratory tract is bathed
with secretions which are in constant motion in the
oropharynx, the resident bacterial flora is not disturbed
(104). It has been found that the microbial composition of
a region is determined by the relative abilities of the
individual species to attach to the epithelial cells of that
region (32). Organisms which are unable to attach to the
cell surfaces are removed by secretions and thus fail to
colonize mucosal surfaces. Gram-negative bacteria are
unusual pharyngeal isolates in normal humans. The normal
oral defenses against GNB are highly effective and seem to
involve both physical clearance and local bactericidal
activity. LaForce (51) studied the elimination of GNB from
the mouth of individuals after gargle challenge. 8
Suspensions of GNB (10 organisms per ml) were gargled by
normal volunteers, and then pharyngeal cultures were taken
over a period of time. Suspensions of Escherichia colix
Klebsiella pneumoniae and Proteus mirabi1 is were used.
Bacterial counts rapidly decreased and less than IX of the
original inoculum was recovered after three hours. Using
piliated and nonpiliated strains of liColi, LaForce
demonstrated that GNB do not adhere well to normal buccal
epithelial cells unless the GNB are piliated. Stevens et al
(95) also demonstrated in vitro that meningococci with pili
9
consistently attach to human nasopharyngeal cells in greater
numbers than meningococci without pili.
Pathophysiology of Hospital Acquired Pneumonia
Microorganisms that cause Hospital Acguired Pneumonia
Data from the National Nosocomial Infection Study
(NNIS) of the CDC indicated that the majority of hospital
acquired pneumonias were caused by GNB. NNIS is an ongoing
study of nosocomial infections among 51 national hospitals.
Ei aeruginosa was the most common causative microorganism
followed by Staphylococcus aureus and Klebsiella (14). The
pathogen most frequently associated with HAPs on all
services was PA aeruginosa. SA aureus was the second most
common pathogen on all but the Gynecology and Newborn
services (14). A recent prospective study by Bartlett and
colleagues (6) examined HAP in 159 patients during a 42-
month study period. Bacteriological studies were limited to
transtracheal aspirates, pleural fluid and blood cultures.
Gram-negative bacilli were the causative agent in 46%. The
predominant microorganisms in this survey were Klebsiella
§Ei(23S>) .
LaForce stated "that the frequency with which GNB cause
HAP is due to 1) the ease with which these microorganisms
are recovered from culture; 2) the fact that these
microorganisms are ubiquitous in intensive care units (and
also are capable of becoming resistant to commonly used
antibiotics); and 3) the ease with which these bacteria
10
colonize the oropharynx in ill persons" (52).
Routes of Infection
According to Levison, pathogens "reach the lung by one
of five mechanisms: 1)inhalation of small airborne
particles; 2) aspiration of resident naso-oropharyngeal
flora or large airborne infectious particles after
deposition in the naso-oropharynx; 3) hematogenous spread of
particles to the lung from another site of infection; 4)
direct extension of bacteria from a contiguous site of
infection; or 5) exogenous penetration and contamination of
lung parenchyma by bacteria" (55). The aerogenic routes of
inhalation and aspiration are the most common mechanisms.
Several studies have shown normally that the airways
below the vocal cords are sterile. In a study of 100
patients, Potter and associates (73) collected expectorated
sputa, pharyngeal cultures and cultures from the trachea and
mainstem bronchi during bronchoscopy. Only one patient
yielded a potential respiratory pathogen from bronchial
cultures. Lees examined 42 patients and found all bronchial
secretions from "normal people" to be sterile (54). Pierce
and Sanford (72) stated that only 2% of normal persons are
at risk for developing pneumonia due to GNB, because the
oropharynx does not provide a suitable environment for the
growth of GNB. In Johanson's study (45) of colonization in
hospitalized groups of patients, 25% of the colonized
patients developed pneumonitis as compared to only 3% of
those patients who were not colonized. The latter study
indicated that the pharyngeal clearance of GNB is impaired
11
in ill patients.
Oropharyngeal Colonization
Colonization of the upper respiratory tract with GNB
normally occurs in only 2% to 18% of healthy subjects. In
1969, Johanson and coworkers (45) demonstrated that the
prevalence of colonization increased as the severity of
illness increased in a study of 230 patients from five
groups of adults: nonhospital-associated normal subjects;
hospital-associated normal subjects; physically normal
hospitalized patients; moderately ill hospitalized patients;
and moribund patients. Oropharyngeal cultures were obtained
from all subjects. Prevalence rates of colonization with GNB
were markedly increased in the moderately ill and moribund
patients. Johanson suggested that the increased prevalence
of GNB might have been the result either of increased
exposure to GNB or a diminished capacity to clear such
organisms from the pharynx. In 1972, Johanson and
associates (46) performed a prospective study of 213
patients in a medical intensive care unit, and 45% of them
became colonized (mostly with GNB) during the first four
days of hospitalization (22% on the first hospital day).
Nosocomial respiratory infections developed in 12.2% of the
patients. Pneumonia occurred in 23% of the colonized
patients compared to 3.3% of the noncolonized patients . The
presence of coma, hypotension, expectoration of sputum, the
use of endotracheal intubation, treatment with antibiotics,
acidosis, azotemia, and either leukocytosis or leukopenia
12
was significantly associated with colonization. There was
no consistent influence of diet on colonization. Of the 95
patients who became colonized with GNB, 59% were taking
solid food, 7* only liquids and 34% were receiving nothing
by mouth. There appeared to be no difference in the
invasiveness of the bacterial species. K.. ES§US20±§§x Ei
a§ry^iD°§§A co1i and species of Enterobacter were the
most commonly isolated organisms. In a prospective study of
149 patients by Tillotson and Finland, 25% of 88 colonized
patients developed nosocomial infection (98). Most were
due to colonizing GNB. In another study of 34 intensive care
unit patients, Johanson and colleagues (47) observed that
53% of the patients were colonized with GNB. He suggested
that epithelial cells of the upper respiratory tract contain
binding sites (receptors) for GNB and that factors
associated with serious illness appear to increase the
availability of these binding sites. Such colonization by
GNB appeared to precede the development of pneumonia.
Johanson et al's observation that colonization
occurred during the first few hospital days (46) suggested
to Pierce and Sanford that there is a "susceptible pool" of
patients in the hospital who are particularly predisposed to
colonization (72). The concept of a susceptible pool was
further supported by another study by Johanson and coworkers
when they found colonization rates due to GNB of 35% in
moderately ill hospitalized patients and of 73% in moribund
hospitalized patients (45). Valenti and coworkers (99)
performed throat culture surveys on persons over 65 years of
13
age who were living independently in apartments and elderly
hospitalized persons. Nine percent of the oropharyngeal
cultures from the first group were culture positive for GNB,
and 60% of cultures from patients in the hospital were
positive for GNB. Multivariate analysis suggested that the
presence of respiratory disease and a bedridden existence
were the two most important variables in predicting
colonization. Factors not significantly associated with
oropharyngeal colonization included age, mental status,
bowel incontinence, poor dental hygiene, the presence of
dentures, cigarette smoking or functional limitations due to
diabetes, neurologic disease or collagen vascular disease.
There also are some specific clinical conditions which
may predispose a person to colonization by GNB. Mackowiak
et al (56) demonstrated that alcoholics and diabetics have
colonization rates with aerobic GNB of 35% and 36%,
respectively. Niederman and colleagues (69) suggested a
relationship between nutritional status and colonization.
They observed a relationship between nutritional status and
both tracheal cell adherence and colonization of the lower
airways. Greater degrees of nutritional impairment based on
the prognostic nutritional index were associated with higher
levels of tracheal cell adherence than was observed in
patients who had less nutritional depletion. They noted less
binding of E§§udomonas to tracheal epithelial cells when
they improved the caloric intake of patients with chronic
tracheostomies.
14
The patients in intensive care units (ICUs) are at
markedly increased risk for HAP. Johanson reported (47) a
colonization rate of 22% on the first day of hospitalization
in medical ICU patients. The colonization rate rose sharply
over the first four days in the unit, then leveled off to a
rate of 45%. Rose and Babcock (82) cultured multiple body
sites of 64 patients admitted to a medical ICU and 85
patients admitted to a surgical ICU to determine the
frequency of colonization with GNB. Sites cultured included
oropharynx, rectum, urethral catheters, endotracheal or
tracheostomy tubes, nasogastric tubes, nasal oxygen
cannulae, and several other types of less commonly used
tubes. The pharyngeal carrier rate among the surgical
patients increased by a total of 34 strains of GNB compared
to 14 strains among medical patients. The authors
interpreted this to mean that surgical patients carried more
GNB because they had more tubes, and thus had a larger
reservoir of GNB available for pharyngeal colonization. The
most frequently recovered organisms were colijL
Klebsiella^ EnterobacterA SerratiPseudomonas and Proteus.
Also the administration of antibiotics may be related
to the colonization of the respiratory tract. Johanson and
his associates (46) provided evidence for this relationship
in their study of 213 medical ICU patients. Antimicrobial
drugs were administered to 50 of the 213 patients (23.4%).
The authors studied a subset of 38 patients and obtained
cultures before, during and after antimicrobial therapy.
They noted colonization by GNB in 21/38 patients (55%)
15
before therapy and in 30/38 patients (79%) during or after
therapy. They suggested that antimicrobial agents may have
increased the rate of colonization, but pointed out that
there was a high level of colonization before therapy.
Major surgery also may influence colonization of the
oropharynx. Johanson et al (48) demonstrated that following
major surgery, there was an increased adherence of GNB to 14
squamous buccal cells. They studied the adherence of C-
labeled P.. §§ruginosax gneumon iax col i and
mirabilis to buccal squamous cells of 32 noncolonized
patients undergoing elective surgery. Buccal mucosal cells
were taken from patients both pre- and post-surgically. The
IS vitro test results were correlated with the in vivo
occurrence of bacillary colonization. Preoperatively, the
mean adherence was 4.3 bacilli/cell and postoperatively it
was greater than 8.3 bacilli/cell. Sixty-nine percent of
the 16 patients in the postoperative group with adherence of
greater than 8.3 bacilli/cell became colonized with GNB,
whereas none of the 16 patients with adherence of less than
8.3 bacilli/cell postoperatively became colonized.
Raman et al. (75) suggested that there may be a
constituent present in smoker's saliva that is responsible
for increased adherence of organisms. Using an in vitro
assay, they examined the buccal epithelial cells of smokers,
nonsmokers and exsmokers for adherence of Streptococcus
pneumoniae. The background counts using cells washed with
phosphate buffered saline in the three groups were similar.
16
Smokers had a markedly increased pneumococcal adherence
(p<0.001). The authors also noted significantly increased
(p<0.001) adherence of the bacteria to cells of nonsmokers
when they were incubated with the saliva of smokers.
Gastric Colonization and Amplification
duMoulin and coworkers (28) studied the gastric and
upper-airway flora of 60 patients from a respiratory-
surgical ICU who were treated with antacids or cimetidine.
In 87% of the patients, one or more organisms were cultured
simultaneously from the upper airway and stomach. A
sequence of transmission was demonstrated in 17 of these
patients. In 11 patients, the upper-airway colonization
occurred after the organism first appeared in the stomach.
Pneumonia due to GNB occurred in 31 of these patients(52*).
No pneumonia developed in the eight patients whose gastric
and upper-airway flora differed. The pH of the fluid
correlated positively with the concentration of GNB in
gastric fluid. The authors concluded that maintenance of
high gastric pH led to increasing concentrations of GNB in
the stomach. Atherton and White (5) studied 10 adults on
ventilatory support who had paralytic ileus. There was
microbial overgrowth of GNB in the stomach of 9 patients.
In 6 patients, the bacteria multiplying in the stomach
corresponded with those found in the trachea. In 3
patients, the organism first appeared in the gastric
contents. These studies demonstrated that overgrowth of
bacteria in the stomach may provide a reservoir for
colonization of the esophagus, mouth, nasopharynx and
17
trachea.
Intubation of the Respiratory Tract
Patients who require ventilatory support are always
intubated or have a tracheostomy. Endotracheal tubes can be
introduced through the nares (i.e.,nasotracheal tube) or
through the mouth (i.e.,orotracheal tube). A tracheostomy
is a surgical opening into the trachea through which a
tracheostomy tube is inserted. Nasotracheal and orotracheal
tubes generally are used on patients who require short-term
ventilation. Patients on prolonged ventilation or with
secretion problems generally require tracheostomies. All
tubes inserted into the trachea are surrounded by a cuff
which may be inflated. Inflation of the cuff (balloon)
occludes the trachea around the tubes to prevent aspiration.
Although inflation of the endotracheal tube cuff prevents
aspiration of large volumes of gastric content or
oropharyngeal secretions, very small quantities of
oropharyngeal secretions still may be aspirated (48). This
was substantiated by Macrae and colleagues (58) who studied
a patient after resection of the middle third of the
esophagus. Barium was instilled into the upper esophagus to
evaluate the anastomosis. Chest X-ray showed that barium
had spilled over into the oropharynx and tracked around the
folds of the inflated cuff into the trachea and the left
main bronchus. Patients requiring artificial airways are
predisposed to HAPs because these tubes bypass the upper
airway defense mechanisms and preclude effective coughing.
18
In 1981, Cross and Roup (22) studied 13,086 patients
prospectively over 11 months for the development of HAP. Of
these, 814 patients had intubation or intubation plus
ventilation for at least 24 hours. Fifty-nine of the 814
patients {1.2%) developed pneumonia. Twelve of these (1*)
occurred in patients with endotracheal tubes who were
ventilated and 10 (1%) occurred in patients with
tracheostomies and ventilation. Thirteen HAPs (1.6%)
occurred in persons who had only tracheostomies. One case
(0.1*) occurred in a patient who had only an endotracheal
tube, and twenty-three (2.8%) occurred in patients who had
an endotracheal tube and either intermittent positive
pressure ventilation or nasal oxygen therapy.
In 1985, Sanderson (85) examined 37 intubated patients
( most of whom were surgical patients) to determine whether
or not pharyngeal bacteria were carried into the trachea
during intubation. Pre-intubation pharyngeal swabs were
taken, and pre- and post-operative tracheal aspirates were
obtained with a sterile catheter introduced through the
endotracheal tube. Thirteen (38%) of the tracheal samples
taken post-operatively revealed potential pathogens
(Hemophilus influenzae;,. pneumoniae, coliforms and S..
§UI§y§)• In each case the organisms had also been isolated
from the pharyngeal swab taken prior to intubation. This
illustrated the frequency with which organisms could be
introduced to the respiratory passages by intubation," even
when carried out without difficulty." Mehta ( 61) studied
90 patients undergoing surgery during endotracheal
19
anaesthesia. He placed 20 ml of contrast medium on the
back of the tongue in patients lying supine on the operating
table after obtaining an airtight seal in the trachea by
inflating the cuff of the endotracheal tube. In 18 patients
contrast medium passed through the larynx and accumulated in
the trachea above the inflated cuff, and entered the lungs
at the end of the operation when the cuff was deflated.
Dixon cites two ways in which persons with artificial
airways may aspirate oropharyngeal flora (25). Persons with
such devices are unable to clear their oral secretions
effectively, and those secretions collect in the posterior
pharynx. Even when oropharyngeal suctioning is performed
effectively, the pooled secretions enter the
tracheobronchial tree whenever the cuff is deflated.
Evidence that pooled respiratory secretions may be the
source of microorganisms that enter the tracheobronchial
tree in intubated patients was provided by Schwartz and
associates (89). They observed that many isolates of
bacteria recovered from endotracheal tubes, particularly
Enterobacteriaceae, had been recovered in prior cultures
from the hypopharynx. Spray (92) also noted that these
pooled respiratory secretions above the tube cuff are
heavily colonized with bacteria. Every four hours, she
placed Evan's blue dye on the tongues of one hundred medical
and surgical patients with endotracheal tubes. If blue dye
was obtained on suctioning, it was considered evidence for
aspiration. Aspiration was detected in 40 of the 100
20
patients an average of 14 hours after placement of the dye
on the tongue. Also according to Dixon, the presence of the
airway itself reduces the effectiveness of local
tracheobronchial defense mechanisms through local trauma and
drying (25).
Aspiration
Aspiration of oropharyngeal secretions is probably the
most important mechanism by which pneumonia develops.
However, pneumonia also may occur as a consequence of
inhalation of small airborne particles. Aspiration takes
place when fluid in the oropharynx passes into the lower
tracheobronchial tree during respiration. Aspiration may be
followed by no adverse effects or it may result in damage to
the lung parenchyma. When fluid is aspirated, it may carry
microorganisms into the lower respiratory tract. The
macrophage constitutes the principal cellular defense of the
alveolus. There is about one cell per three to four
alveoli. In most instances, bacteria are inactivated by
these cells. When aspiration takes place with a large
bacterial inoculum or with a particularly virulent
microorganism, the respiratory macrophages may be
overwhelmed (78). A second line of cellular defense is
constituted by the polymorphonuclear leukocytes. They are
located in capillaries in the interstitial space. They
migrate to the alveoli in response to a chemotactic
stimulus. Chemotactic factors are produced by alveolar
macrophages and by activation of the alternate complement
pathway by bacterial endotoxins. Green and Kass (34)
21
aerosolized labeled bacteria (p32-tagged staphylococci) into
the lungs of mice and immediately sacrificed the animals and
examined the lungs histologically. The authors demonstrated
that bacteria do not remain on the alveolar surface, but
within minutes are almost all ingested by macrophages
without histologic evidence of an inflammatory response.
They repeated the experiment with Gram-negative organisms
and demonstrated that ingestion takes place more slowly with
these organisms.
Several studies show that nonintubated normal and ill
adults may aspirate during sleep. In 1929, Quinn and Meyer
(74) demonstrated aspiration in 5 of 11 sleeping patients
after instillation of iodized oil into their noses. A
chest X-ray taken in the morning identified the oil in small
quantities in both lower lobe bronchi. Based on these
observations, the authors stated that aspiration of
infective material also might be possible. In 1953, Amberson
introduced iodized oil into the mouth of sleeping patients.
Chest X-ray the following morning revealed the oil in the
lungs of some of the adults (unpublished study by
J.B.Amberson, cited in 103). In a study of 8 patients,
Winfield and coworkers (103) attempted to reproduce the
earlier experiments by injecting 2-3 ml of contrast material
into the posterior nasopharynx during sleep. However, they
were unable to confirm the earlier work as in no instance
was the opaque medium visible in the lungs or trachea on
chest X-ray the next morning. On the other hand, by
22
111 injecting indium chloride into the posterior nasopharynx
of twenty normal subjects and ten patients with depressed
consciousness, Huxley and colleagues (43) were able to
demonstrate the occurrence of aspiration. The thorax of all
subjects was scanned within 4 hours of completing the
posterior pharyngeal injections with radioactive tracer.
Forty-five percent of the normal subjects aspirated during
deep sleep and aspiration was observed in 70% of the
patients with depressed consciousness.
The rare occurrence of pneumonia following aspiration
is evidence of the lung's remarkably efficient and effective
clearance mechanisms. If, however, the aspirated inoculum
is large or contains virulent bacteria, the clearance
mechanisms may be overcome. In 1972, Bryant et al (8)
studied the bacterial colonization profile of the patient
with tracheal intubation undergoing mechanical ventilation.
The author examined serial tracheal cultures of 129 patients
who required tracheal intubation for greater than 48 hours.
Tracheal cultures became positive for pathogens in 115
patients (89%). Although the initial cultures often
demonstrated normal flora of the upper respiratory tract,
within a few days pathogens (E§eudomonasA Klebsiella^
Proteusx Candida^ and aureus^ etc.) displaced the normal
flora. The author noted that, frequently, one pathogen
replaced another, and 43% of the patients became colonized
with two or more GNB. Tracheobronchitis occurred in 31
patients, 47 had pneumonitis, and 28 developed colonization
without evidence of respiratory infection.
23
Removal of Respiratory Secretions with Suction Catheters
An additional risk factor for HAP is the introduction
of suction catheters into artificial airways to remove
respiratory secretions. Demers stated that there were three
adverse effects of suctioning. This repeated procedure
predisposes the patients to pneumonia by: 1) direct injury
to the endobronchial mucosa; 2)by inducing hypoxemia; and 3)
by causing atelectasis (24). In addition if aseptic
technique is not practiced, bacteria can be introduced into
the lower respiratory tract.
Epidemiology
Definition of Hospital Acguired Pneumonia
Hospital acquired pneumonias are defined as those
respiratory infections that develop in hospitalized patients
in whom the infection was neither present nor incubating at
the time of admission (11). These infections usually are
not manifest in the first 48 hours of hospitalization. They
occur as a result of the introduction of. microorganisms into
the lungs during hospitalization. Pneumonia often is
difficult to diagnose. Johanson (45) classified infections
as "definite" or "probable". A diagnosis of "definite"
infection required the presence of all four determinants:
1) the appearance of a new or progressive infiltrate on
chest X-ray; 2) fever; 3)leukocytosis; and 4)purulent
tracheobronchial secretions. A diagnosis of "probable"
infection was based on 3 criteria: 1) fever; 2)leukocytosis;
and 3) either a new or progressive pulmonary infiltrate on
24
chest X-ray or the presence of purulent secretions. Results
of cultures were not used . In their review, Crane and
Lerner (16) relied on bacterial isolation from sputum for
definite diagnosis of pneumonia. They required: l)isolation
of the same predominant bacteria from two or more
consecutive sputum cultures; or 2) isolation in close
temporal proximity of the same species from blood and
sputum; or 3) isolation of appropriate bacteria from pleural
fluid. The definition for the diagnosis of HAP used by NNIS
of the CDC requires purulent sputum production more than 48
hours after admission in a patient with no evidence of prior
pulmonary infection or increased production of purulent
sputum with reappearance of fever in a patient admitted with
pulmonary disease. In addition, there must be one of the
following: 1) an infiltrate on chest X-ray; 2) char
acteristic clinical manifestations of pneumonia; or 3) the
patient must have cough, fever or pleuritic chest pain.
The most precise published criteria for HAP are those
oi -raven and colleagues (20). These include 1) purulent
atum with a Gram stain having greater than 25 leukocytes
and less than 10 squamous epithelial cells per high power
field; 2) a significant respiratory or nosocomial pathogen
isolated from sputum cultures and/or bacteria seen on Gram
stained smears of the sputum; 3) a peripheral leukocyte 3
count of greater than 10,000 per mm ;4) fever of greater o
than 100.4 F; and 5)a new and persistent infiltrate on chest
X-ray. Garibaldi and coworkers (30) used fever, purulent
25
sputum, clinical findings and abnormalities on chest X-ray
to define HAP (30). They used three categories for HAP.
Patients with microbiologically proven pneumonia were
categorized as Class 1. Patients were placed in Class 2
when they had clinical evidence of pneumonia without
microbiologic confirmation. Pneumonia was categorized as
Class 3 when patients had fever, purulent sputum, or
suggestive chest X-rays. In Sanford's opinion, the CDC
definition should be employed "unless there are specific
justifications in a study for not doing so" (85).
Diagnosis of Hospital Acquired Pneumonia
Respiratory secretions obtained as a coughed sputum
specimen are frequently contaminated by oropharyngeal flora
which may obscure the identity of the causative agent.
Numerous studies have demonstrated the discrepancy between
cultures of sputum and pathogens present in the lower
respiratory tract (6,23). In a bacteriologic study of
respiratory secretions obtained by transtracheal aspiration
from 488 patients, Bartlett (6) studied the diagnostic
accuracy of cultures obtained by this technique when
compared with clinical parameters and final diagnosis. Three
hundred and sixty-nine patients yielded potential pathogens
from sputum cultures. Three hundred and thirty-five cultures
were true positives, and cultures from 34 patients were
false positives for a false positivity rate of 9.2*. One
hundred and nineteen patients yielded no pathogen. In 71 of
these patients, criteria for pneumonia were not met. Forty-
eight of these patients had a bacterial infection of the
26
pulmonary parenchyma, but 44 of the 48 had received
antimicrobial drugs before the procedure. The author
concluded that transtracheal aspiration is a reliable
technique for determining the cause of bacterial infections
of the pulmonary parenchyma if there has been no prior
treatment with antimicrobial drugs.
Davidson (23) and colleagues studied 25 adult Navaho
Indian patients with acute pneumonia and compared cultures
of sputum, transtracheal aspirate and fluid obtained by
direct-needle aspiration of the lung. Multiple potential
pathogens were recovered from 83% of the sputum specimens,
from 21% of the transtracheal aspirates, and from 16% of
lung aspirates. Eighty percent of the positive lung
aspirate cultures yielded a single bacterial isolate. The
authors concluded that lung aspiration was more likely to
yield single, definitive bacterial isolates than the other
sampling techniques.
Adult Respiratory Distress Syndrome (ARDS) is a
respiratory condition due to acute lung injury with multiple
causes. This syndrome is characterized by hypoxemia,
increased lung stiffness and diffuse infiltration of the
lung parenchyma as seen on radiographic examination of the
chest. All of these abnormalities are related to an
increase in the permeability of pulmonary capillary
endothelium (42). Conditions frequently associated with
ARDS include shock, septicemia, pulmonary infection, trauma,
aspiration, inhaled toxins and metabolic disorders (67). The
27
presence of ARDS makes the diagnosis of pneumonia difficult
and further confusion may arise due to the frequent
colonization of the sputum of these patients with Gram-
negative bacilli (45). Andrew reviewed the postmortem
histology of 24 patients with ARDS, and found that the
accuracy of the clinical diagnosis of pneumonia in the ARDS
patient was only 64% (4).
Descriptive Epidemiology
The reported incidence of pneumonia will vary from
institution to institution, but data obtained from NNIS
(14) in 1984 indicated that 6.0 cases of nosocomial
pneumonia occurred per 1,000 patients discharged from U.S.
hospitals. This represented 17.8% of all hospital associated
infections. In addition, data from the 1986 NNIS study
reported the incidence of HAPs by service. Among large
teaching hospitals, the Surgical service accounted for 11.2
cases of HAP per 1000 discharges, and the Medical service
for 10.2 cases per 1000 discharges, the Pediatrics service
for 3.9 cases per 1000 discharges, the Newborn service for
2.9 cases per 1000 discharges, the Gynecology service for
2.6 cases per 1000 discharges and the Obstetrics service for
0.5 cases per 1000 discharges. In 1974, Pierce and Sanford
(72) stated that nosocomial pneumonia has been estimated
to occur in from 0.5 to 5% of all patients. Dixon stated
that approximately 5 to 10 of every 1,000 hospitalized
persons will develop an HAP, and he estimated that 238,000
persons acquire these infections in the United States each
year (25).
28
Certain hospital areas have appeared to experience an
increased incidence of HAPs. Hemming (39) reported that
7.2* of the patients in a newborn intensive care unit
developed an HAP. Johanson and co-workers (46) observed an
HAP rate of 12.2* in patients hospitalized in a general
medical intensive care unit, and 17.5* of the postoperative
patients in the study of Garibaldi et al developed an HAP
(30).
In a retrospective study by Stevens (96), 153 patients
with pneumonia were identified during the first 2 1/2 years
of operation of a respiratory-surgical ICU. Patients who
had pneumonia due to GNB other than P^ aeruginosa had a
mortality of 33*. On the other hand, isolation of
E§§lJdgmonas from respiratory cultures obtained from patients
with pneumonia was associated with a mortality of 70*. Data
from the Comprehensive Hospital Infections Project (CHIP)
(93) showed that HAP had a case-fatality ratio of 56* for
bacteremic patients and 19* for nonbacteremic patients. The
CHIP study was performed by the CDC in 1977 and was based on
nosocomial infections reported from eight national hospitals
over a two year period. Gross and colleagues (36) studied
100 consecutive patients who died at Columbia-Presbyterian
Medical Center and 100 consecutive patients who died at
Hackensack Hospital to assess the importance of nosocomial
infections as a contributory cause of death in patients who
die in the hospital. By definition, these nosocomial
infections were considered to be "contributing to death"
29
when the infection was an active infection of a major organ
and "causally related to death" when the infection was not
controlled at the time of death. Of 52 patients where
hospital acquired infection (HAI) either contributed to or
caused death, 31(60%) had HAP. In a study of 159 cases of
HAP, Bartlett and associates (6) observed a mortality rate
of 19* and in 13% of these patients, HAP contributed to
death.
HAPs have a significant financial impact. In 1977,
Wenzel estimated this cost to be $208 per infection (101).
Haley took this 1977 figure and adjusted it for inflation to
predict the 1985 hospital costs. The average hospital
charges for HAPs in 1985 were $4,947 per infection and the
maximum costs were $41,628 (38). Dixon estimated the average
per diem hospital cost.resulting from HAPs in 1984 to be
$385 and the average prolongation of stay to be 4.0 days
(26).
Risk Factors
Demographic factors. Stamm and associates observed in
1977 that advanced age was a risk factor for the development
of HAP (93). As a part of the Study on the Efficacy of
Nosocomial Infection Control (SENIC), Hooten et al (40)
developed an index of intrinsic patient risk. The SENIC
study was carried out by CDC over a period of 10 years and
included 338,000 general medical and surgical patients in
338 hospitals (38). In the SENIC study, Haley et al (37)
found that 13% of all nosocomial infections were HAPs.
They observed that an increase in age from 18 to 85 years
30
was associated with a three-fold increase in the rate of
HAP's, but did not indicate whether this was a statistically
significant relationship. Unlike Stamm et al and Haley et
al, Garibaldi and co-workers did not find a significant
relationship between age and HAP.
Stamm and associates (93) and the SENIC study (37)
concur with respect to male sex being a risk factor for HAP.
Stamm and associates found that males were approximately 3
times more likely to develop HAP than females. The SENIC
study found a greater male to female ratio (17.1:1) for the
acquisition of HAP. On the other hand, Garibaldi and co
workers (30) were unable to demonstrate a significant
relationship between the male sex and HAP.
Underlying disease. Hooten et al (41) found that
diagnosis was an important determinant for infection when
they constructed their risk index for HAP.
Immunocompromised patients were at increased risk for HAP.
Host defenses of these patients may be suppressed by
underlying illness, or by treatment with corticosteroids,
cytotoxic agents or other immunosuppressive drugs. Data from
the SENIC study showed that persons on immunosuppressive
therapy were 5.3 times more likely to develop HAP than
persons not on such therapy. Sobel (91) stated that
pneumonias account for as much as 25% to 50% of all
infectious deaths among patients with hematologic
malignancies. He also pointed out that the most important
cause of death in acute leukemia is infection and that the
31
most common site is the lower respiratory tract. Similarly,
Garibaldi and co-workers found a significant association
between HAP and underlying non-malignant disease (p<0.005).
A history of smoking (p<0.001) was also significantly
associated with HAP, but no significant relationship was
found between HAP and massive obesity (30).
Duration of hospitalization. In the two studies that
have assessed duration of hospitalization as a risk factor
for HAP, both found a significant association between
duration and infection. Stamm and associates (93) observed
that hospitalization for more than 7 days significantly
increased the risk for HAP. Although Haley and associates
(37) also found duration a risk factor, they observed that
the increased risk occurred only after 40 days of
hospitalization (37).
Presence of remote infection. Infection at various
sites in the body may be a risk factor for hospital acquired
infection. Two studies have shown that infection at a
remote site is a risk factor for the development of
postoperative wound infection (68,7). Only one study has
assessed remote infection as a possible risk factor for HAP.
Haley and associates (37) noted that previous infections at
any site, regardless of whether these were community-
acquired or hospital-acquired, were associated with a
fourfold increase in the risk of HAP.
Surgery. Prior surgery was an important factor in the
risk index developed by Hooten and associates (41). They
observed that 74% of all pneumonia cases in adults occurred
32
in surgical patients (37). On the other hand, Garibaldi and
co-workers found that 17.5* of 520 patients who underwent
elective thoracic, upper abdominal and lower abdominal
surgery developed HAP (31). Haley and associates found that
patients who had combined thoraco-abdominal surgery had a
risk 38 times that of other types of surgical procedures.
When thoracic and abdominal operations were examined
separately, there was a fourteen-fold greater risk for
thoracic surgery and the risk was 3.4 times greater for
abdominal operations than for other types of surgery (37).
Garibaldi and co-workers (31) also observed that location
of surgery was a risk factor for HAP. They found that
pneumonia was highly associated with thoracic or upper-
abdominal surgery (p<0.001). Another risk factor related to
surgery is duration of operation. The SENIC study found a
49-fold increase in HAP in operative procedures of greater
than 150 minutes (37).
Ventilators. Patients exposed to ventilatory support
have an especially high risk of acquiring HAP, although it
is difficult to separate the contribution of respiratory
care from that of intrinsic host susceptibility (25). The
SENIC study found a 21-fold increase in risk for persons on
ventilatory support compared to those not on ventilatory
support (41).
During the 1960s and early 1970s, respiratory care
equipment was reported to be a major source of HAP
(77,72,94,35,49). Due to changes in procedures for cleaning
33
and disinfection or sterilization of respiratory therapy
equipment, there has been a major reduction in hospital
acquired pneumonia. A review by Cross and Roup (22) in
1981 stated that respiratory equipment is now rarely a
direct cause of HAPs.
Nevertheless, mechanical ventilation is still a risk
factor for HAP. Cross and Roup prospectively studied 13,086
patients hospitalized at Walter Reed Army Medical Center
over an 11-month period and found that HAP developed in 7.7%
of patients who received respiratory support compared to
0.3% of patients who had no exposure to such therapy. No
case of HAP occurred in patients on ventilators less than 24
hours, but the risk of HAP increased significantly after the
fifth day of respiratory therapy. The highest incidence of
HAP occurred in patients with tracheostomy combined with
ventilatory support (66.7%). The rate of infection for
patients with tracheostomy who were not on a ventilator was
25%. The rate of HAP was lower still for patients who had
endotracheal intubation and ventilatory support, and was
lowest for patients who were intubated but did not require
ventilatory support (1.3%).
Because of the potential for bacterial contamination of
the system (i.e., the breathing circuit which connects to
the endotracheal tube), the CDC recommends that the circuit
be changed every 24 hours. There are no data to support
this recommendation, and workers from the CDC acknowledge
that the risk is probably low (90). In general, the CDC
recommendations to change solutions or equipment are based
34
on control measures practiced during equipment-associated
outbreaks.
In 1984, Craven and colleagues (18) reported on
ventilator circuit practices in the United States. Two
hundred and forty-nine hospitals across the nation were
surveyed. The majority (94.4*) changed their ventilator
tubing every 24 hours, and 5.6% changed the circuits every
48 hours. The scientific data available to guide hospitals
in the routine change of ventilatory circuits is very
limited. Most hospitals indicated that "self-study" was
used to determine the time interval of ventilator circuit
changes (19). Although the microbial study by Craven and
co-workers indicated that there was no difference in
contamination of circuits changed at 24 or 48 hours, only
epidemiologic studies that provide rates of HAP can lead to
definitive recommendations. In 1986, Craven and coworkers
(21) published the results of their prospective, randomized,
epidemiologic study of the effect of 24 versus 48 hour
circuit changes on the rate of HAP. They found a
significantly higher rate of HAP in patients whose
ventilator circuits were changed every 24 hours. These
authors suggested that ventilator circuits now may be
changed safely every 48 hours.
Outbreaks
Under normal conditions the upper airway humidifies
inspired air and prevents drying of mucus membranes of the
bronchial tree. This maintains normal function of the
35
mucociliary apparatus, hydration of the bronchial tree, and
prevents bronchial secretions from becoming thick and
inspissated.
Humidification by Nebulizers
A nebulizer is one means of providing humidification of
the gases from a respirator. Most commonly, these are fine
particle reservoir nebulizers which operate on the venturi
principle. A gas under pressure is directed across the
mouth of a capillary tube in which the lower end of the tube
is submerged in a reservoir of water. The negative pressure
produced at the mouth of the capillary tube by the rapidly
flowing gas, draws water from the reservoir into the gas
stream. The water is impacted against a baffle, dispersed
into droplets, and carried out of the nebulizer in
particulate form (50). From there, it passes through the
breathing circuit to the patient. Nebulizers create an
aerosol that contains particles (1-2 u) that can be
deposited into the lower respiratory tract (90). Units
utilizing nebulizers have been shown to be hazardous,
because the water droplets constitute an excellent vector
for transmitting bacteria (77).
Nebulizers may also generate an aerosol with
ultrasound produced by rapidly vibrating crystals or by
centrifugal force where liquid is dropped onto a rapidly
spinning disk (100). Nebulizers produce droplets of
different size. Small droplets are most useful for the
treatment of respiratory therapy patients. Smaller droplets
are distributed more uniformly in the lung tissue and
36
hydrate the patient more evenly and slowly. Therefore,
larger droplets usually are removed from the treatment
aerosol by a baffle (59).
Hymidification by Humidifiers^
The alternative method for providing moisture for
these gases is by a humidifier designed to deliver a water
vapor to the patient as molecular water. The gas is heated,
and the water vapor content is increased by either a bubble-
type humidifier or a wick humidifier. In the bubble-type
humidifier, the gas bubbles through 250-300 cc. of heated o
water (approximately 36 C). In the wick-type humidifier,
gas is humidified by passing over a wick which is
moisturized by a reservoir of water. The gas cools as it is
transported to the patient, and cooling causes the water
vapor to condense in the delivery tube (77). Because water
droplets are not produced, humidifiers are considered a low
risk as potential sources of infection.
Microbiology of Nebulizers and Humidifiers
Nebulizers The first microbiologic study of
respiratory therapy equipment was reported in 1958 by
Macpherson (57). He examined water from the
reservoir, oxygen from the wall connection, several valves,
and outlet ducts of nebulizers in use at Ohio State. He
recovered large numbers of microorganisms only from water
and outlet ducts. The majority (greater than 43X) were
members of the family Enterobacteriaceae. The remainder
were made up of a variety of organisms (yeast, Gram-positive
37
organisms and Pseudomonas). Alarmingly, Clostridium welchii
also was isolated. Therefore, the author initiated several
techniques designed to prevent contamination. These were
probably the first infection control guidelines for
inhalation therapy equipment. These guidelines were:
1. Use only sterile water;
2. Limit use to one week;
3. Discard residual water prior to refilling;
4. Clean and disinfect the reservoir prior to the next use;
5. Replace defective washers prior to the next use;
6. Autoclave the metal top of the humidifier between
patients or after one week;
7. Store all apparatus in the dry state;
8. Use disposable tubing whenever possible;
9. Take bacteriological samples at regular intervals.
In 1965, Reinarz and coworkers cultured respiratory
therapy equipment from six hospitals (77). Using an
Andersen air sampler, 226 ventilators with and without
nebulizers were sampled. Between 75-91* of all the tested
equipment yielded significant numbers of GNB in the effluent
air of the ventilators. There was a difference, however,
between ventilators with and without mainstream nebulizers.
Nearly all of the devices with mainstream nebulizers were
contaminated. Forty-five percent generated aerosols with
particles that ranged between 1.4 and 3.5 u. Further, there
were 2,500 viable bacteria per 7.5 L of air. The prevalence
and degree of contamination were similar in each hospital.
Only 16* generated aerosols with viable particle counts as
38
low as those in ambient air (not exceeding 5 particles per
7.5 L of air). Contaminated aerosols never were obtained
from the 52 ventilators without mainstream reservoir nebuli
zers, suggesting that the contamination was related to the
reservoir nebulizer. Correlation between fluid samples from
the nebulizers and the aerosol samples was performed. In
81% of the samples there was correlation of all organisms or
the predominant organisms. The major contaminants were
E§§ydomonas spec i es x Flavobacteria species^ Here Ilea lAci-
netobacterl species^ and Achromobacter species^
Morris (65) evaluated bacterial contamination of
aerosol generating equipment. Bacteria were recovered from
46% of 382 water specimens that were collected from the
nebulizers used on 15 patients. Twenty-four percent of the
specimens were contaminated with GNB. E^aeruginosa
accounted for 54% and Providencia stuartii for 21% of all
GNB isolated. The remainder of the cultures yielded
Staphylococcus species and Bacillus species.
While most infections related to use of nebulizers have
been due to contaminated mainstream nebulizers,
contamination of medication nebulizers also may produce
infectious aerosols resulting in ventilator-associated
pneumonia. Two outbreaks of infection due to contamination
of aerosol solutions in medication nebulizers have been
reported (62,84). Medication nebulizers are infrequently
associated with production of contaminated aerosols, because
the small volume of these nebulizers permits drying between
39
use (72). Craven and coworkers (20) observed that 79% of
cultures from in-use medication nebulizers were positive
culturally for Gram-negative bacilli, frequently in heavy
growth. In addition, it was shown that 71% of the
nebulizers which were culturally positive produced bacterial
aerosols. These observations were corroborated by in vitro
studies in which bacteria were added to these nebulizers.
The authors demonstrated that, under these conditions, the
nebulizers also produced aerosols. Further, these aerosols
were made up of particles with a diameter small enough to
allow deposition in the alveoli. Thus, it would appear that
although medication nebulizers usually provide a low risk to
patients, they should be cleaned after each use.
In their review of the literature, Simmons and Wong
(90) pointed out that nebulizers can become contaminated by
the introduction of nonsterile fluids, by manipulation of
the nebulizer reservoir and perhaps by retrograde flow of
condensate from the inspiratory limb of the breathing
circuit. Bacteria in the reservoir can multiply to high
concentrations within 24 hours, and place the patient at
high risk for infection.
Hysidifiers. Introduction of bubble-type humidifiers in
1967 reduced the risk of bacterial contamination of gases
during humidification. Schulze, Edmondson, Pierce and
Sanford (88) examined 100 humidifiers for bacterial
contamination after use. In 90% of the samples taken from
the gas stream of ventilators using bubble-type humidifiers,
the concentration of bacteria in the gas was comparable to
40
the concentration of bacteria in room air. Bacterial
concentrations greater than 2,500 CFU per 7.5 L of gas were
found in the effluent of only 2% of the machines. The
authors compared these results to those of Reinarz and
coworkers (77) who had demonstrated bacterial contamination
at a concentration greater than 2,500 CFU per 7.5 L of gas
in a high percentage of machines using mainstream reservoir
nebulizers. They concluded that the machines with bubble-
type humidifiers are unlikely to produce respiratory
infection.
There is widespread belief that bubble-type humidifiers
do not produce aerosols. Using an unheated bubble-type 5 6
humidifier with 10 to 10 microorganisms/ml of Pseudomonas,
and water, Ahlgren recovered bacteria from the effluent air
of the humidifier at a flow rate of 5 L/min (1). In 1986
Rhame and associates (79) demonstrated that bubble-type
humidifiers may aerosolize water. They added aeruginosa 6
(6.4 x 10 organisms per ml) to the water of various types
of unheated humidifiers, and then sampled the air discharged
from each humidifier. With a gas flow between 10 and 80 L
per minute, bubble-type humidifiers produced between 460 and
999 water droplets. With wick-type humidifiers, ho water
particles were produced. Although the risk for infection to
patients is unknown, the authors supported the
recommendation that sterile water be used in bubble-type
humidifiers. On the other hand, Goularte and coworkers (33)
showed that even with a high inoculum, essentially no
41
bacteria were recovered from the effluent when the
humidifier was heated and operated at a flow rate that is
commonly used for patients on artificial ventilation.
Description of Outbreaks
Reinarz, Pierce et al (77,71) reviewed autopsy records
at Parkland Memorial Hospital in Dallas to determine the
incidence of necrotizing pneumonia in the years 1952, 1957
and 1963. These years were chosen since they were prior to
the widespread use of respiratory therapy equipment. The
authors found that the rate of pneumonia caused by GNB had
increased from 0.8% in 1952, to 1.8% in 1957, and to 9% in
1963. They suggested that this increase was due to the use
of reservoir nebulizers with contaminated water, since other
predisposing factors, including broad spectrum antibiotics
and steroids, had been introduced prior to the use of
reservoir nebulizers. They then instituted guidelines for
the care of nebulizers. In 1966-67 they supported this
interpretation when they reported a decrease in the presence
of pneumonia (from 9% to 2.2% and 2.1%, respectively) and
the parallel decrease in the contamination of nebulizers
from 84% to less than 10%.
During the 1960s and 1970s many epidemics of Gram-
negative pneumonia were investigated, and various components
of respiratory care equipment were found to be contaminated
with the epidemic strains (70,62,80,65,77). In 1965,
Phillips and Spencer (70) investigated eight patients who
had been treated by tracheostomy and mechanical ventilation
and had become infected. The authors cultured the
42
ventilators, the humidifier and breathing inspiratory
tubing. All were heavily contaminated with the causative
organism which was being delivered to the patients'
tracheas. The routine cleaning method did not eliminate the
organism. They then recommended disinfection by ethylene
oxide. In addition, they proposed that a suitable bacterial
filter be developed and placed in the respiratory circuit.
Mertz et al (62) reported on an outbreak of pneumonia
caused by EI?eu5!°!2i§§ • The outbreak occurred over a
period of 22 days and involved 5 patients who had received
contaminated bronchodilator solution and developed
pneumonia. All 5 patients died. pneumoniae Type II was
isolated from bottles of bronchodilator stock solution and
the throat of a therapist who occasionally prepared these
solutions. It was not indicated whether the therapist was
the original source of the strain. To control the epidemic,
the author suggested that all medications and solutions be
prepared daily and that prolonged storage of premixed
solutions no longer be permitted.
Sanders and co-workers (84) reported on an outbreak due
to Serratia marcescens which involved 374 patients during a
ten-month period. The organism was isolated from sputum of
229 patients, the urine in 127 patients, surgical wounds in
47 patients, blood in 14 patients and other sites in 56
patients. Medications were stored for prolonged periods
because they had been purchased in large volume (100 to 500
ml). Even under refrigeration, bacterial contaminants
43
multiplied to high concentrations. These authors found that
12 of 17 medication nebulizers were contaminated with
Si marcescens, the same microorganism as that recovered from
the contaminated medication bottles. The outbreak was
controlled, but not eliminated) when medications were
purchased in small volumes (30-60 ml) and were discarded at
the end of each eight hour shift.
Ringrose and colleagues (81) described an outbreak in
which nineteen patients became colonized or infected with
l§rcescens over a two month period. In their investigation,
they sampled the aerosol of two ultrasonic nebulizers.
Cultures yielded a heavy growth of SA jnarcescens. When
these machines were removed from use, the isolation of
§§E£atia appeared to return to baseline rates.
Cartwright and Hargrave (10) reported on an outbreak of
infection by aeruginosa. The authors demonstrated that
the heating elements in the humidifier on the ventilator
were the source of contamination. Tap water had been used
to fill the humidifier over a 26-month period and the
organism had formed a scale on the surfaces of the heating
element.
During the ten-year period between 1971 and 1980, CDC
investigated only one nosocomial epidemic in the United
States attributed to contaminated respiratory therapy
devices (69). During the outbreak, 16 persons on
ventilatory support had sputum that was positive culturally
for Acinetobacter calcoaceticus. Four patients were
colonized with the organism, seven patients had
44
tracheobronchitis and five pneumonia. All organisms
exhibited a common biotype and a characteristic antibiogram.
The epidemic strain could not be cultured from the
environment, but pooled hand cultures from Respiratory Care
personnel were positive for the epidemic isolate. The
investigators found that the hands of only one Respiratory
Care therapist were colonized with calcoaceticus. The
therapist calibrated and assembled ventilators prior to use.
He had had a mild dermatitis of his hands for many months.
This outbreak was not caused by contaminated nebulizers or
medications, but by extrinsic contamination of respiratory
therapy equipment from the hands of a Respiratory Care
therapist.
Redding and McWalter (76) reported on an outbreak of
E§®M<|omonas fluorescens in an ICU. Seven patients on
ventilators for four days or more became colonized or
infected. Bacteriologic examination of the ventilators
revealed that humidifiers were the only source for P..
fll}or§§c§D§ • The distilled water container (8 L in size)
used to fill the humidifiers also yielded the organism and
was thought to be the reservoir for the Pseudomonas.
In a prospective study, Im et al (44) attempted to
identify the source of P.. aeruginosa that caused infection
in three patients on mechanical ventilation in an ICU. All
patients developed pneumonia with the same strain as that
recovered from the ventilator tubing. In each case, this
organism was recovered from the ventilator tubing prior to
45
its recovery from the trachea. The authors implicated the
ventilator as the source of the organism that caused
pneumonia in these patients. They stated that ventilator
tubing disinfection was ineffective due to trapping of air
and inadequate drying, allowing the proliferation of
microorganisms in the tubing.
Epidemiology of Ventilator Breathing Circuits
Little information is available on the effect of
ventilator breathing circuit changes on contamination or
HAP. In 1978 Lareau et al (53) found no differences in the
risk of HAP in patients exposed to ventilator breathing
circuits changed at 8, 16, or 24 hour intervals. There were
two independent approaches used in her study. First, she
performed a bacteriologic as well as epidemiologic study on
130 patients. In use aerosol sampling of 513 ventilator
treatment periods showed bacterial contamination in 1.8S> of
8 hour cycles, in 2.5% of 16 hour cycles, and 5.4% of 24
hour cycles. These differences in contamination were not
significant. In a second retrospective study, she compared
the incidence of pneumonia in patients on ventilators for
two one-year periods when ventilator circuits were changed
every 8 hours or 24 hours. In 1973 ventilator circuits were
changed every 8 hours on 213 patients receiving a total of
1,096 days of ventilatory therapy. In 1976, when ventilator
circuits were changed every 24 hours, 271 patients were
treated for a total of 2,098 days. The incidence of HAP was
the same for the one year periods (0.015 cases of pneumonia
46
per ventilator day). The author concluded that changing
ventilator circuits every 24 hours provided adequate
protection from HAP.
In 1982 Craven and co-workers (17) found no
statistically significant difference in the rates of
bacterial contamination of breathing circuits changed at 24
hour intervals (Group I) versus 48 hour intervals (Group
II). In a prospective bacteriological study, ninety-five
patients on continuous ventilation were studied. Two
hundred and forty aerosol samples of the inspiratory tubing
were obtained. Twenty percent of the aerosol cultures from
Group I versus 14* of aerosol samples from Group II yielded
high-level contamination. The high rates of air
contamination were attributed to an artifact of sampling;
during the extended sampling period, culture plates were
contaminated by droplets of condensate. Quantitative
analysis of colonization of the tubing also was performed.
Ninety-three cultures taken from twenty-three patients in
Group I and eighty cultures taken from thirty-one patients
in Group II showed no significant difference in colonization
rates between circuits changed at 24 and 48 hours.
Concentration of microorganisms in the broth used in the 2 7
broth washout culture technique ranged between 10 and 10
organisms per ml. Colonization at this level occurred in 15
patients from each group. The organisms isolated from the
sputum were predominantly GNB (i.e.,Pseudomonasx
Acinetobacter and Klebsiella). The author suggested that
the contamination of the tubing originated from the
47
patient's respiratory flora.
In 1984, Craven and co-workers (18) provided further
support for the concept that respiratory breathing tubing is
usually colonized by the bacteria present in the patients'
secretions. They suggested that condensate may be
contaminated and pose a risk for HAP. They cultured 58
ventilator circuits by taking samples of the proximal end of
the inspiratory breathing tubing (end closest to patient)
at 2, 4, 6, 8, 12, and 24 hours. After 24 hours, greater
than 1000 CFU were present in the end of the tubing nearest
the patient whereas there was no contaminatjion in the distal
tubing (end closest to machine). At 2 hours 33%, at 12
hours 67*, and at 24 hours 80% of proximal tubing sampled
was colonized. Condensate from the breathing tubing was
collected from 20 patients. The median level of 5
colonization was 3.0 x 10 organisms/ml. Seventy-six
percent of the organisms isolated were GNB. The survival of
Gram-negative and Gram-positive bacteria (K^ pneumoniaex A^
calcoaceticusx aeruginosa and aureus) in sterile water
was examined. No significant increase or decrease in
bacterial concentrations was observed. The author concluded
that retrograde contamination from patients is the primary
mode of condensate colonization.
In 1985, Malecka-Griggs (60) reported a microbiological
study of neonates' ventilator circuits that were changed at
24 and 48 hour intervals. The author evaluated the
significance of changes in microbial concentrations during
48
the two intervals. Over a two year period, 379 fluid
samples and 100 aerosol samples were obtained from the
disposable circuits of 23 premature infants. Only three of
23 infants had respiratory tract colonization with
pathogenic bacteria. One case of colonization occurred in
phase I of the study when circuits were changed every 24
hours, and two cases occurred in phase II when circuits were
changed every 48 hours. During the second phase, the author
noted increased colonization by potential pathogens, and
this led to a restoration of 24-hour circuit changes. Two
infants were infected, one with K^_ pneumoniae and aureus
and the other with Pj. aeruginosa. With 24 hour changes of
circuits (phase I), a 2.5% contamination rate was observed.
With 48 hour changes of circuits (phase II), the
contamination rate increased to 19%. These data suggested
to the author that frequent changing of the neonate circuits
reduces colonization and cross-infection with P.. aeruginosa.
In 1986, Craven and colleagues (20) reported from
Boston City Hospital the risk factors for pneumonia and
fatality in 233 intensive care unit patients receiving
continuous mechanical ventilation over a 15 month period.
Hospital acquired pneumonia was diagnosed in 49 (21%) of the
233 patients. The authors reported on eight risk factors
significantly associated with the development of pneumonia:
intracranial pressure monitoring, craniotomy, head trauma,
treatment with cimetidine, 24-hour changes of the ventilator
circuit, hospitalization during the Winter-Fall season,
steroid treatment and coma. However, when the data were
49
analysed by stepwise logistic regression analysis, only the
presence of an intracranial pressure monitor, treatment with
cimetidine, hospitalization during the Winter-Fall seasons,
and mechanical ventilator circuit changes every 24-hours
remained significant. Age, sex, race, type of intensive
care unit, shock, admission with pneumonia and positive end
expiratory pressure were not significantly associated with
pneumonia. Pneumonia was less frequent in patients who
received ampicillin (p<0.03) or gentamicin (p<0.03) and more
frequent for patients who received vancomycin (p<0.04).
Ninety-five (41%) of the patients died in the hospital.
Seventy-eight (82%) were receiving mechanical ventilation or
had received mechanical ventilation within 48-hours of
death. Patients who died during hospitalization had a
significantly higher mean age than the survivors (59+ 17
years versus 52+ 18 years [p=0.03]). After multivariate
analysis, the significant risk factors for fatality were:
creatinine equal to or greater than 1.5 mg/dl, admission
with pneumonia, not having received nebulized
bronchodilators, a long duration of mechanical ventilation,
having no abdominal surgery, being transferred from another
hospital or hospital ward and having coma on admission.
Objectives of Study
1. To determine the bacterial contamination rate of the
breathing circuit at 24 or 48 hours
2. To determine the incidence of pneumonia that develops
in patients on ventilatory support where the breathing
50
circuit is changed either every 24 or 48 hours
3. To study the bacterial flora of the patient who is
intubated (i.e.has a nasotracheal, orotracheal, or
tracheostomy tube)
MATERIALS AND METHODS
The study was a prospective, randomized, double-blinded
study and included all adult patients who were admitted to
intensive care units and received mechanical ventilation
during the period from January 1, 1984 until December
31,1984. Patients with pneumonia on admission, burn
patients and persons younger than 17 years of age were
excluded. Patients who were previously on a ventilator at
another hospital could be enrolled in the study, but were
excluded if they had pneumonia.
ratory Therapy Equipment
Each patient received mechanical ventilation via a
nasotracheal, (National Catheter, Glen Falls, New York;
Portex, Wilmington, Massachusetts) endotracheal (National
and Portex) or tracheostomy tube (Shiley, Irvine,
California; National Catheter, Portex) connected to one of
the following volume ventilators: 1) Bennett MA-1 (Puritan
Bennett, Linthicum Heights, Maryland); 2) Bear (Bournes
Medical Systems, Riverside, California); 3) Emerson (J.H.
Emerson, Cambridge, Massachusetts); and 4)Engstrom
(Engstrom- division Gambro Inc., Barrington, Illinois). A
Bennett MA-1 respirator was used by the majority of
patients. These ventilators were used with one of the
following humidifiers: 1) Cascade bubbling humidifiers 51
52
(Puritan Bennett); 2) Conchatherm wick humidifiers
(Respiratory Care Inc, Arlington Heights, Illinois) and 3)
Bird wick humidifiers (Bird Corp., Palm Springs,
California). Only sterile distilled water was used in the
humidifiers. All ventilators utilized a non-sterile
disposable circuit (Dart Industries, Ocala, Florida). Prior
to the study, all tubing and the connectors had been changed
every 24 hours.
B®Sdomization
The patients were randomized by the Respiratory Care
personnel into two groups. Group I consisted of patients
who had their entire ventilator circuit and humidifier
changed every 24 hours. Group II consisted of patients who
had their entire ventilator circuit and humidifier changed
every 48 hours. Patients were enrolled in the study by
Respiratory Care personnel when in their estimation a given
patient met the criteria for enrollment. Before placing a
patient on ventilation, the Respiratory Care personnel
selected a sealed envelope containing an index card on which
were either the numbers 24 or 48 (Group I or II). Envelopes
had been prepared by a person not associated with the study
using a computer generated table of random numbers. After
randomization, the card containing the number was reinserted
in the envelope and the patient's name, hospital number and
the date, time and results of randomization were written on
the outside of the envelope, and the envelope was stored for
future reference. A form indicating that the patient was
enrolled in the study was taped onto the ventilator.
53
B1inding
The author was blinded with respect to final diagnosis
(infection versus no infection). Two pulmonary physicians
evaluated all patients for lower respiratory tract infec
tion. These physicians were blinded with respect to the
timing of ventilator circuit changes. The technician in the
Hospital Epidemiology Laboratory who processed cultures from
the ventilators, and technicians from the Hospital
Laboratory who processed sputum for culture also were
blinded with respect to the timing of ventilator circuit
changes.
Epidemiology
At the time of randomization, Respiratory Care
personnel or Nursing personnel obtained a baseline specimen
of respiratory secretions using a sterile suction catheter
inserted into the endotracheal or tracheostomy tube. The
specimen was collected as soon as possible after enrollment.
These specimens were cultured in the Hospital Laboratory.
The author maintained a log book of all persons randomized.
Each morning, she reviewed the chart of each patient
enrolled during the preceding 19 hours. Patients who did
not meet criteria for enrollment were removed from the study
at that time.
When patients were enrolled in the study, the following
information on each patient was collected: name, hospital
number and location, age, sex, race, date of admission, all
patient diagnoses, type of intubation, smoking history,
54
underlying pulmonary diseases, and other underlying
diseases, and the presence of a ventriculostomy. While the
patient was on ventilatory support, additional data
collected included inclusive dates of ventilation, treatment *
with antibiotics , muscle relaxants and antacids, surgical +
operations (including type of operation, region of
incision, and duration of surgery), and results of blood
cultures and daily cultures of respiratory secretions.
If present at the time of collection of the daily
sputum specimen, the author would macroscopically evaluate
the sputum for absence or presence of "purulence".
Otherwise, the description of the patient's sputum in the
chart was used. Clinical and laboratory data for each
patient (including temperature, blood pressure, the presence
of chills, serum albumin and chest X-ray interpretations)
were recorded daily by the investigator.
Collection of Microbiologic Samples
Patients on ventilatory support were followed by the
author and cultures were obtained for the duration of
ventilation, up to a period of 30 days. At the
discontinuation of ventilation, the patients were followed
clinically, bacteriologically, and radiographically for 72
hours. On completion of followup, the author would supply
the pulmonary physicians with all of the data on the patient
• Only antibiotics given intravenously for> 48 hours during the period from 48 hours before the start of ventilatory support to the end of ventilatory support were recorded.
+ Surgical procedures were recorded from 1 week prior to ventilation to discontinuation from the study.
55
except the microbiological results from the ventilator and
timing of ventilator changes. Using the definitions given
below, the physicians reviewed the clinical data and the
chest X-rays to determine whether or not the patients had
developed an HAP or bacteremia. This information was
transferred to a computer form.
When the patient's ventilatory circuit and humidifier
were changed, the patient was ventilated with a
resuscitation bag. When the circuit was disconnected from
the patient, bacteriological cultures of the inspiratory
phase gas were taken using quantitative methods. The
ventilator was adjusted to a standard tidal volume of 2 L
per minute, a ventilatory rate of 25 breaths per minute, and
to the maximum flow rate for each ventilator used (75-125
L/min). A 2-stage Andersen air sampler (Andersen Sampler,
Inc, Atlanta, Georgia), was used to size the bacterial
particles into those small enough to reach the lower
respiratory tract and larger particles that would be
filtered out in the upper respiratory tract. A sterile cup
was attached to the end of the inspiratory tubing that had
been proximal to the patient, and was placed over the
sampling head of the sampler. The tubing was held flush to
the sampler intake for one minute. An agar plate containing
trypticase soy agar with 5% sheep blood was present in each
stage of the sampler.
When the Respiratory Care personnel detached the
circuit from the ventilator, the author cultured the distal
and proximal segments of the inspiratory and expiratory
56
tubing. The ends of the tubing were cultured by inserting
a swab to a depth of 3 cm using a spiral motion. As the
swab was withdrawn, it was moved in the opposite direction.
The swab was streaked over 1/2 of a blood agar plate at the
bedside. The two limbs of the Y-connector were cultured
using the same technique. The condensate from the
inspiratory tubing was drained from the distal orifice into
a sterile container. An equal volume of double strength
Brain Heart Infusion (BHI) broth was then added. Fifty ml
of BHI broth were aseptically poured into the inspiratory
tubing at the proximal orifice. The tubing was rotated back
and forth 10 times. The tubing was stretched as it was
emptied so that all internal surfaces of the convoluted
tubing came into contact with the broth. The broth then
was collected in a sterile cup. Next, the author gently
swirled the humidifier to mix the water and aspirated a 1-3
ml sample with a sterile syringe.
To determine the extent to which contamination from the
act of sampling itself contributed to positive cultures, 49
unused circuits were cultured in the laboratory using the
above described techniques. Only 25 of 400 samples from
surfaces and fluids (6.3%) were positive. Only Micrococcus
sp., coagulase-negative staphylocci and alpha hemolytic
streptococci were recovered. Most cultures were positive at
less than ten colonies. Thirteen of 22 (59%) of air samples
were culture positive. However, eleven of thirteen (84.6%)
had only one or two colonies recovered. The other two
57
positive air cultures had 3 and 7 colonies recovered,
respectively. The only microorganism recovered in air
cultures was coagulase-negative staphylococci. No
pathogenic species were isolated from any of these cultures.
2efinitions
Microorganisms were considered either pathogenic
or non-pathogenic. Microorganisms defined as non-pathogens
are shown in Table 1. All other microorganisms were
considered pathogenic. Pneumonia was defined as the
appearance of purulent sputum, and a new or progressive
infiltrate on chest X-ray. When these signs were present
without microbiologic data, the case was considered
clinically confirmed. When these criteria were met and
cultures of respiratory secretions yielded a potentially
pathogenic organism, the case was considered
microbiologically confirmed (31,97,11). Tracheobronchitis
was defined when sputum was purulent but chest X-ray
revealed a stable infiltrate or no infiltrate.
Tracheobronchitis also was confirmed microbiologically or
clinically. Ventilator-associated infection was defined as
pneumonia or tracheobronchitis that developed at least 48-
hours after start of ventilation or within 72 hours after
ventilation was discontinued. Septicemia was defined as two
or more positive blood cultures with a pathogenic organism
in conjunction with two or more of the following clinical o
signs: fever equal to or greater than 100 F, chills, and
hypotension.
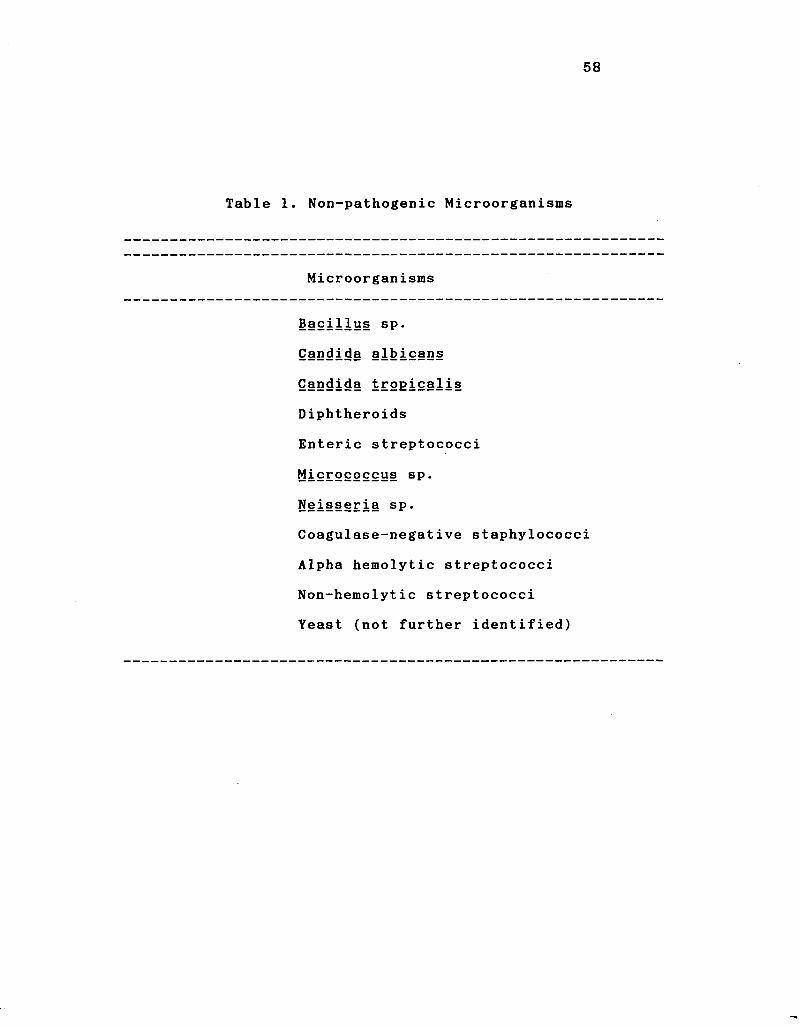
58
Table 1. Non-pathogenic Microorganisms
Microorganisms
Bacillus sp.
Candida albicans
Candida trogicalis
Diphtheroids
Enteric streptococci
Micrococcus sp.
Neisseria sp.
Coagulase-negative staphylococci
Alpha hemolytic streptococci
Non-hemolytic streptococci
Yeast (not further identified)
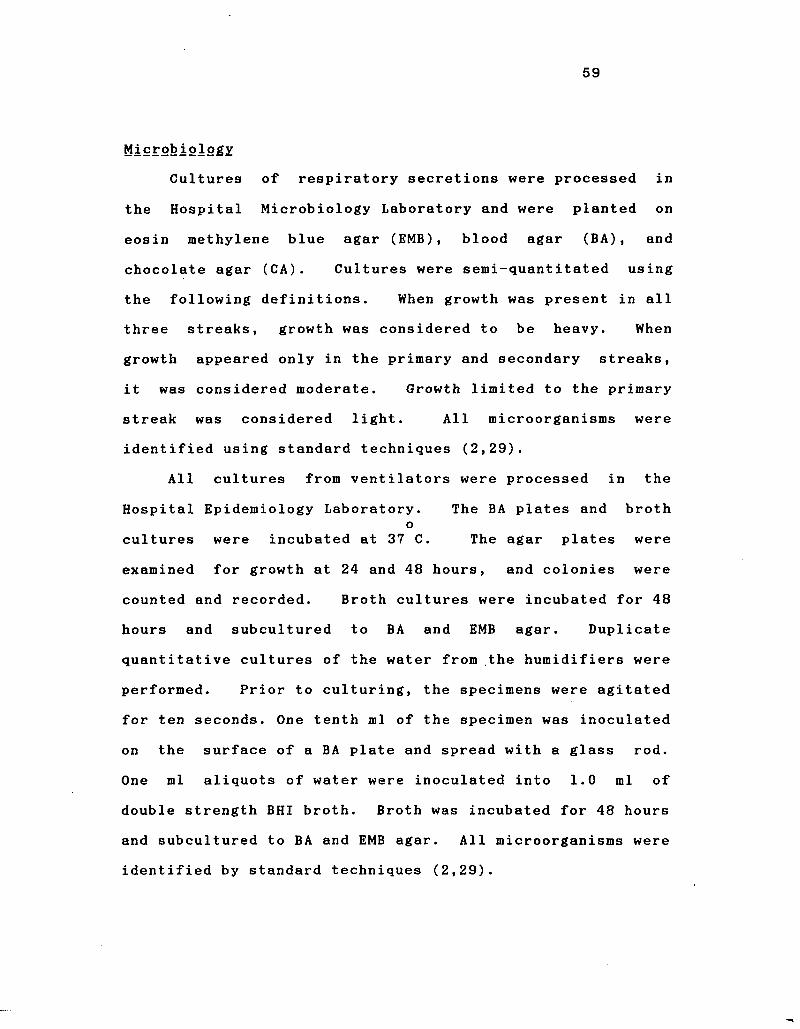
59
Microbiology
Cultures of respiratory secretions were processed in
the Hospital Microbiology Laboratory and were planted on
eosin methylene blue agar (EMB), blood agar (BA), and
chocolate agar (CA). Cultures were semi-quantitated using
the following definitions. When growth was present in all
three streaks, growth was considered to be heavy. When
growth appeared only in the primary and secondary streaks,
it was considered moderate. Growth limited to the primary
streak was considered light. All microorganisms were
identified using standard techniques (2,29).
All cultures from ventilators were processed in the
Hospital Epidemiology Laboratory. The BA plates and broth o
cultures were incubated at 37 C. The agar plates were
examined for growth at 24 and 48 hours, and colonies were
counted and recorded. Broth cultures were incubated for 48
hours and subcultured to BA and EMB agar. Duplicate
quantitative cultures of the water from the humidifiers were
performed. Prior to culturing, the specimens were agitated
for ten seconds. One tenth ml of the specimen was inoculated
on the surface of a BA plate and spread with a glass rod.
One ml aliquots of water were inoculated into 1.0 ml of
double strength BHI broth. Broth was incubated for 48 hours
and subcultured to BA and EMB agar. All microorganisms were
identified by standard techniques (2,29).
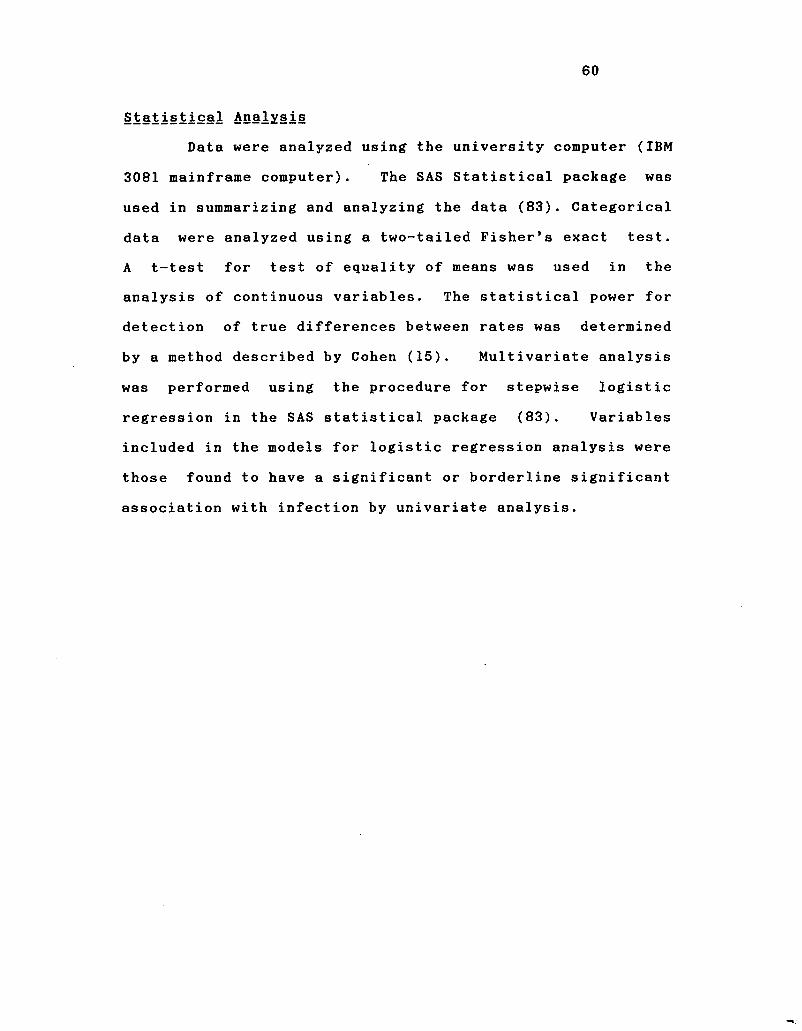
60
Statistical Analysis
Data were analyzed using the university computer (IBM
3081 mainframe computer). The SAS Statistical package was
used in summarizing and analyzing the data (83). Categorical
data were analyzed using a two-tailed Fisher's exact test.
A t-test for test of equality of means was used in the
analysis of continuous variables. The statistical power for
detection of true differences between rates was determined
by a method described by Cohen (15). Multivariate analysis
was performed using the procedure for stepwise logistic
regression in the SAS statistical package (83). Variables
included in the models for logistic regression analysis were
those found to have a significant or borderline significant
association with infection by univariate analysis.
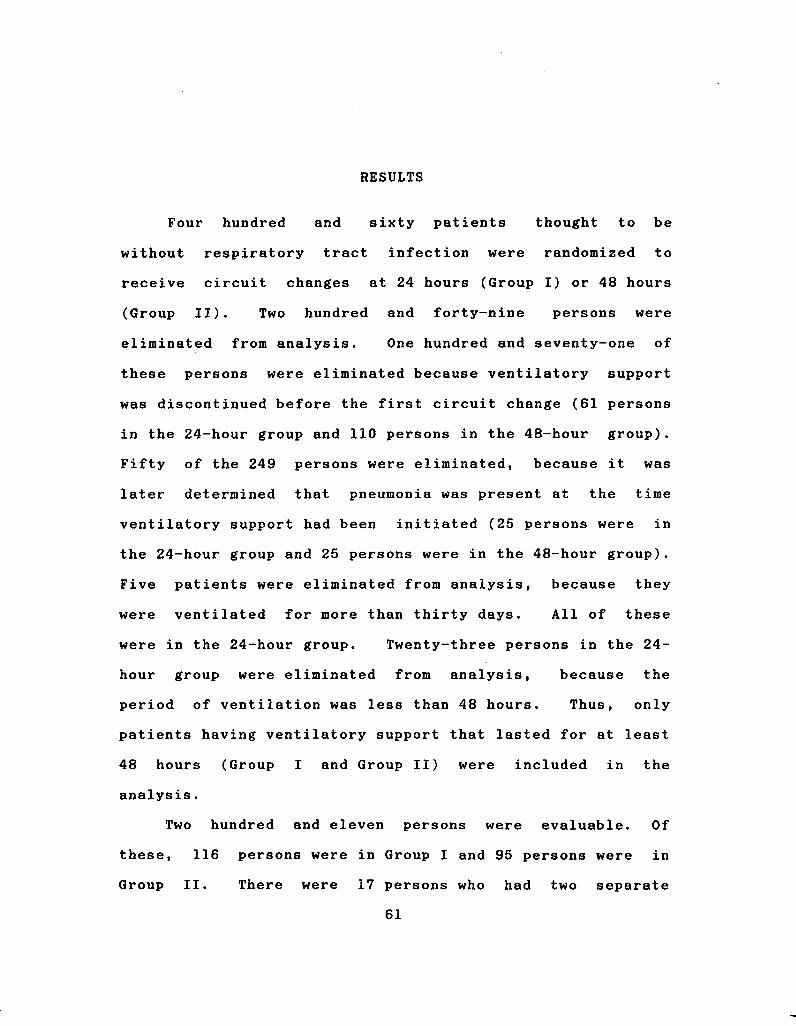
RESULTS
Four hundred and sixty patients thought to be
without respiratory tract infection were randomized to
receive circuit changes at 24 hours (Group I) or 48 hours
(Group II). Two hundred and forty-nine persons were
eliminated from analysis. One hundred and seventy-one of
these persons were eliminated because ventilatory support
was discontinued before the first circuit change (61 persons
in the 24-hour group and 110 persons in the 48-hour group).
Fifty of the 249 persons were eliminated, because it was
later determined that pneumonia was present at the time
ventilatory support had been initiated (25 persons were in
the 24-hour group and 25 persons were in the 48-hour group).
Five patients were eliminated from analysis, because they
were ventilated for more than thirty days. All of these
were in the 24-hour group. Twenty-three persons in the 24-
hour group were eliminated from analysis, because the
period of ventilation was less than 48 hours. Thus, only
patients having ventilatory support that lasted for at least
48 hours (Group I and Group II) were included in the
analysis.
Two hundred and eleven persons were evaluable. Of
these, 116 persons were in Group I and 95 persons were in
Group II. There were 17 persons who had two separate
61
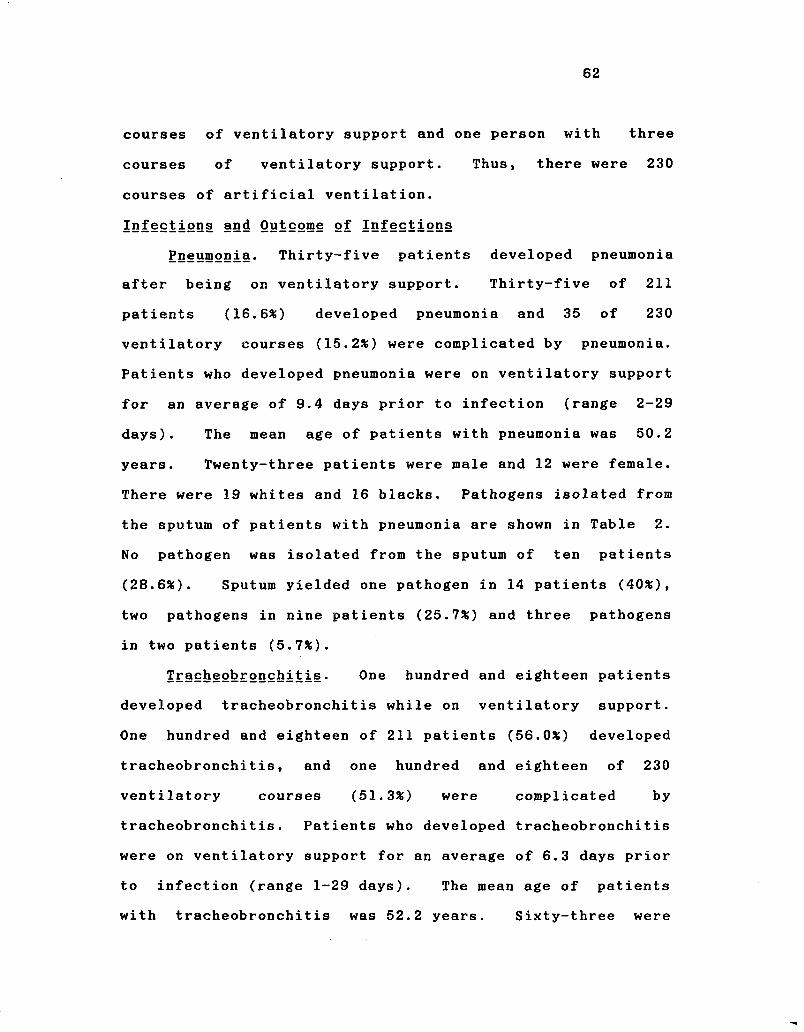
62
courses of ventilatory support and one person with three
courses of ventilatory support. Thus, there were 230
courses of artificial ventilation.
Isf§2ti2QS and Outcome of Infections
Pneumonia. Thirty-five patients developed pneumonia
after being on ventilatory support. Thirty-five of 211
patients (16.6%) developed pneumonia and 35 of 230
ventilatory courses (15.2*) were complicated by pneumonia.
Patients who developed pneumonia were on ventilatory support
for an average of 9.4 days prior to infection (range 2-29
days). The mean age of patients with pneumonia was 50.2
years. Twenty-three patients were male and 12 were female.
There were 19 whites and 16 blacks. Pathogens isolated from
the sputum of patients with pneumonia are shown in Table 2.
No pathogen was isolated from the sputum of ten patients
( 2 8 . 6 % ) . S p u t u m y i e l d e d o n e p a t h o g e n i n 1 4 p a t i e n t s ( 4 0 % ) ,
two pathogens in nine patients (25.7%) and three pathogens
in two patients (5.7%).
Tracheobronchitis. One hundred and eighteen patients
developed tracheobronchitis while on ventilatory support.
One hundred and eighteen of 211 patients (56.0%) developed
tracheobronchitis, and one hundred and eighteen of 230
ventilatory courses (51.3%) were complicated by
tracheobronchitis. Patients who developed tracheobronchitis
were on ventilatory support for an average of 6.3 days prior
to infection (range 1-29 days). The mean age of patients
with tracheobronchitis was 52.2 years. Sixty-three were
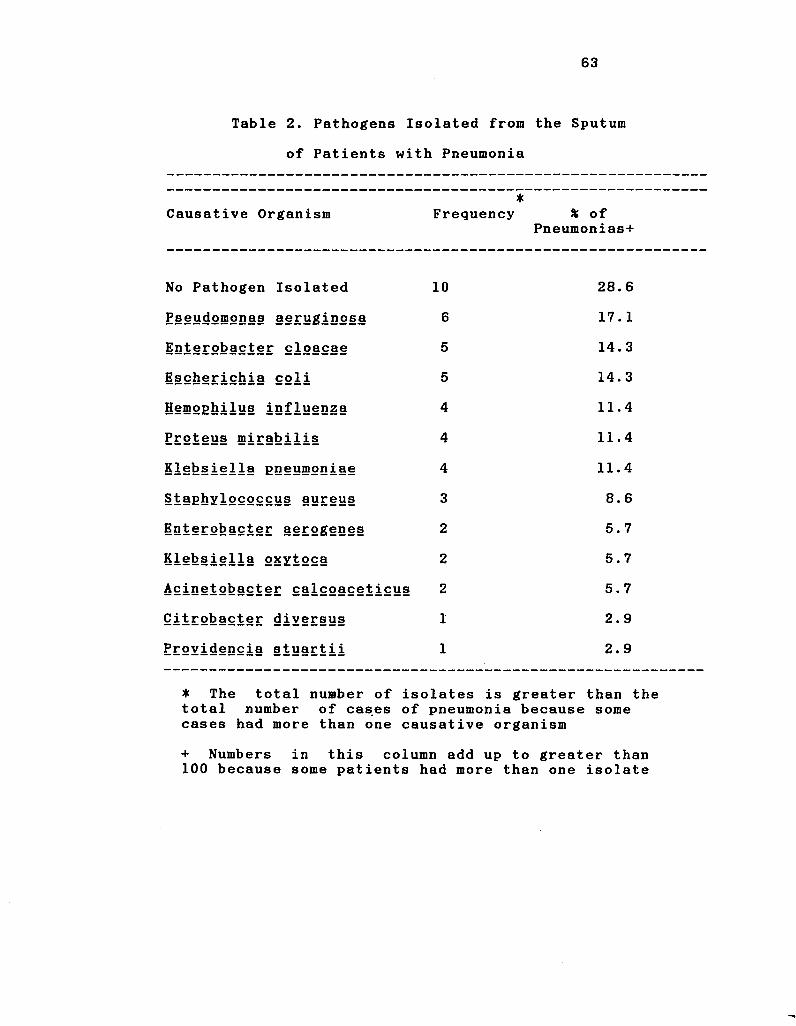
63
Table 2. Pathogens Isolated from the Sputum
of Patients with Pneumonia
Causative Organism *
Frequency * of Pneumonias+
No Pathogen Isolated 10 28.6
P§§udomonas aeruginosa 6 17.1
iDi§r°bacter cloacae 5 CO
Escherichia coli 5 14. 3
Hemophilus influenza 4 11.4
Proteus mirabilis 4 11.4
Klebsiella pneumoniae 4 11.4
Staphylococcus aureus 3 8.6
Enterobacter aerogenes 2 5.7
Klebsiella oxytoca 2 5.7
Acinetobacter calcoaceticus 2 5.7
Qitrobacter diversus 1 2.9
Erovidencia §tuartii 1 2.9
• The total number of isolates is greater than the total number of cases of pneumonia because some cases had more than one causative organism
+ Numbers in this column add up to greater than 100 because some patients had more than one isolate
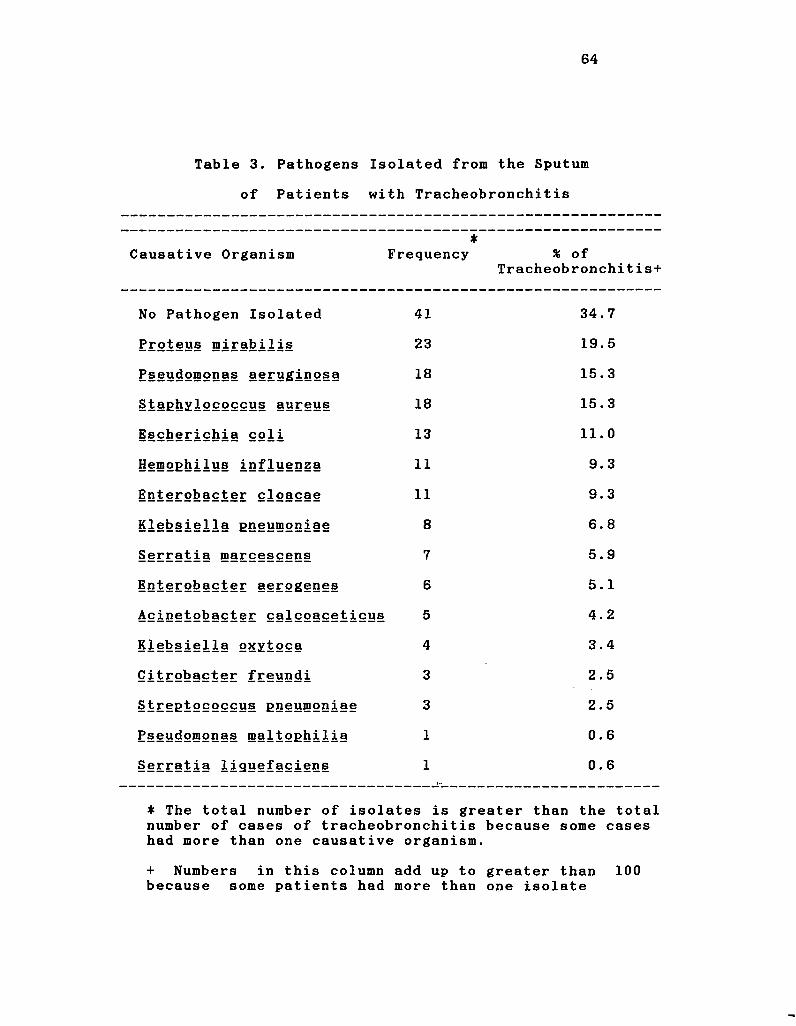
64
Table 3. Pathogens Isolated from the Sputum
of Patients with Tracheobronchitis
Causative Organism •
Frequency % of Tracheobronchitis+
No Pathogen Isolated 41 34.7
Proteus mirabilis 23 19.5
P§§J!<iomonas §§£ygiQ2§>§ 18 15.3
Staphylococcus aureus 18 15,3
Escherichia coli 13 11.0
Hemophilus influenza 11 9.3
lQ£§E2l>acter cloacae 11 9.3
Klebsiella pneumoniae 8 6.8
Serratia marcescens 7 5.9
iQterobacter aerogenes 6 5.1
Acinetobacter calcoaceticus 5 4.2
Klebsiella oxytoca 4 3.4
Qitrobacter freundi 3 2.5
Streptococcus pneumoniae 3 2.5
P§§ydgmonas maltophilia 1 0.6
Serratia 1iguefaciens 1 0.6
* The total number of isolates is greater than the total number of cases of tracheobronchitis because some cases had more than one causative organism.
+ Numbers in this column add up to greater than 100 because some patients had more than one isolate
65
male and 55 were female. There were 58 whites and 60
blacks. Pathogens isolated from the sputum of patients with
tracheobronchitis are shown in Table 3. No pathogen was
isolated from the sputum of 41 patients (34.7%). Sputum
yielded one pathogen in 52 patients (44.1%), two pathogens
in 16 patients (13.6%) and three pathogens in 9 patients
(7.6%).
Bacteremia. There were eleven cases of bacteremia in
211 patients (5.2%). Isolates from blood and sputum of
these patients are shown in Table 4. In two patients with
pneumonia and three patients with tracheobronchitis, the
species recovered from blood also was recovered from sputum
before or at the same time it was recovered from blood.
Outcome of Infections^ Mortality. Ventilator associated
pneumonia was associated significantly with a fatal outcome
(p= 0.0076). On the other hand, tracheobronchitis was not
associated significantly with mortality (p = 0.71).
Egidemiology
Twenty-four versus Forty^eight Hour Circuit Changes.
The results of randomization are shown in Tables 5-8.
Randomization of patients to either 24-hour or 48-hour
circuit changes (Group I or Group II) resulted in only two
significant differences between Group I and Group II.
Patients in Group II were significantly more likely to have
a diagnosis of chest injury (p=0.04), and were significantly
more likely to have received antacids (p=0.03). Thus,
randomization worked very well as the two groups differed
significantly in only two of fifty-four characteristics
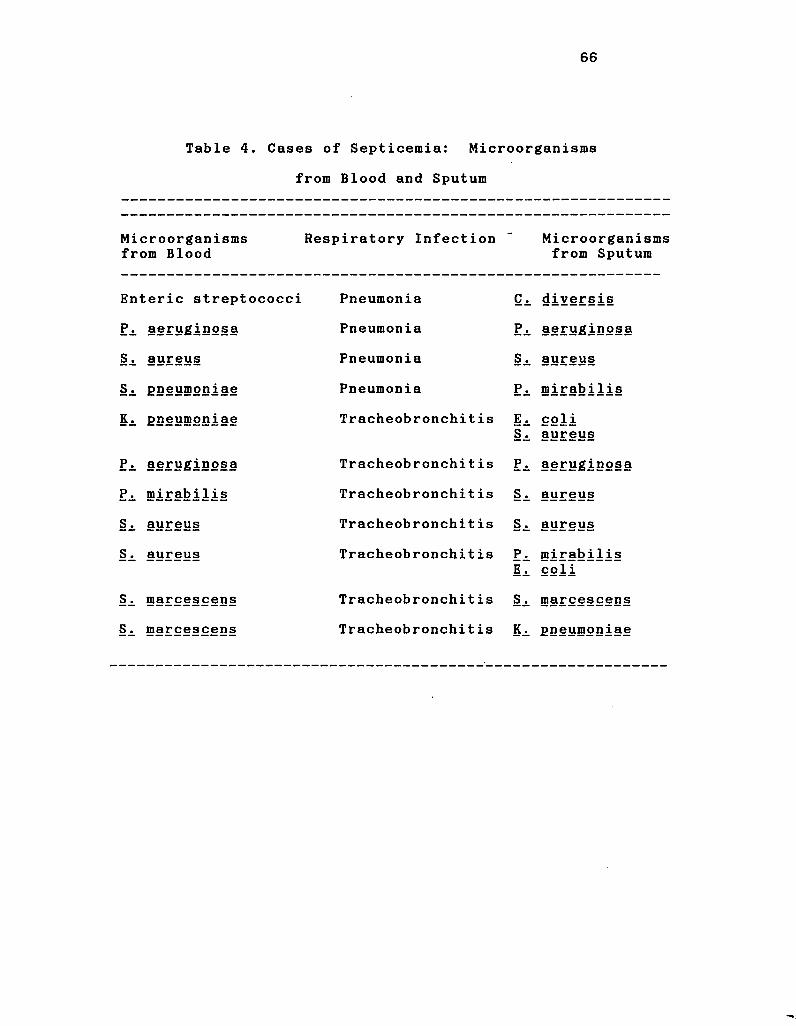
66
Table 4. Cases of Septicemia: Microorganisms
from Blood and Sputum
Microorganisms from Blood
Respiratory Infection ->
Microorganisms from Sputum
Enteric streptococci Pneumonia Ci diversis
F\ aeruginosa Pneumonia Pi aeruginosa
aureus Pneumonia Si aureus
§i pneumoniae Pneumonia Pi mirabilis
Ki pneumoniae Tracheobronchitis E. Si
col i aureus
Pi aeruginosa Tracheobronchit is Pi aeruginosa
Pi mirabilis Tracheobronchit is Si aureus
Si aureus Tracheobronchit is Si aureus
§i aureus Tracheobronchitis p.
Ei mirabilis col i
Si roarcescens Tracheobronchit is Si ®arcescens
Si 5?arcescens Tracheobronchitis Ki pneumoniae
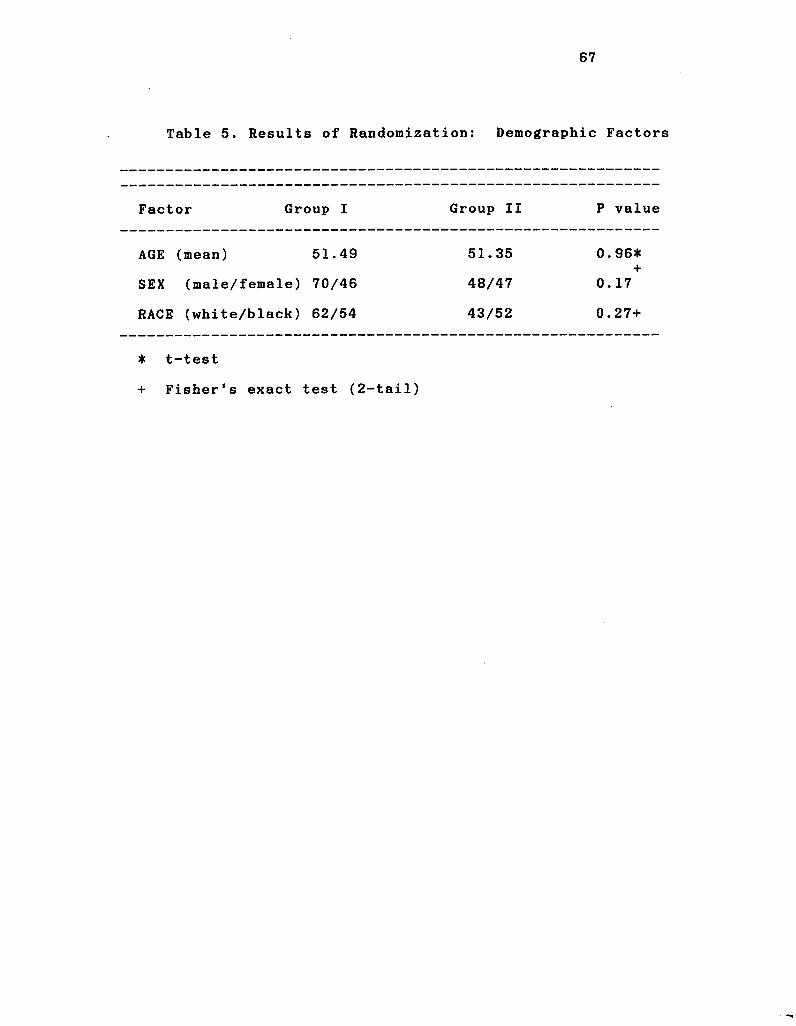
67
Table 5. Results of Randomization: Demographic Factors
Factor Group I Group II P value
AGE (mean) 51.49 51.35 0. 96*
SEX (male/female) 70/46 48/47 0. 17
RACE (white/black) 62/54 43/52 0. 27+
* t-test
+ Fisher's exact test (2-tail)
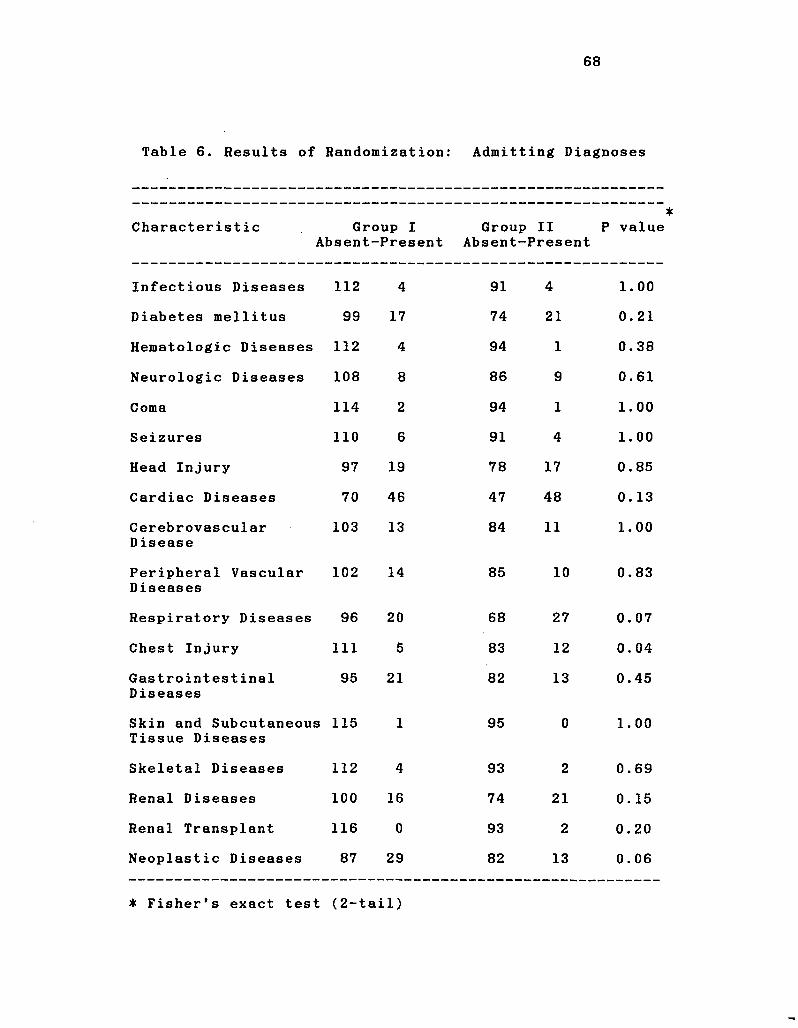
68
Table 6. Results of Randomization: Admitting Diagnoses
Characteristic Group I Absent-Present
Group II P value Absent-Present
Infectious Diseases 112 4 91 4 1. 00
Diabetes mellitus 99 17 74 21 0. 21
Hematologic Diseases 112 4 94 1 0. 38
Neurologic Diseases 108 8 86 9 0. 61
Coma 114 2 94 1 1. 00
Seizures 110 6 91 4 1. 00
Head Injury 97 19 78 17 0. 85
Cardiac Diseases 70 46 47 48 0. 13
Cerebrovascular Disease
103 13 84 11 1. 00
Peripheral Vascular Diseases
102 14 85 10 0. 83
Respiratory Diseases 96 20 68 27 0. 07
Chest Injury 111 5 83 12 0. 04
Gastrointestinal D iseases
95 21 82 13 0. 45
Skin and Subcutaneous Tissue Diseases
115 1 95 0 1. 00
Skeletal Diseases 112 4 93 2 0. 69
Renal Diseases 100 16 74 21 0. 15
Renal Transplant 116 0 93 2 0. 20
Neoplastic Diseases 87 29 82 13 0. 06
* Fisher's exact test (2-tail)
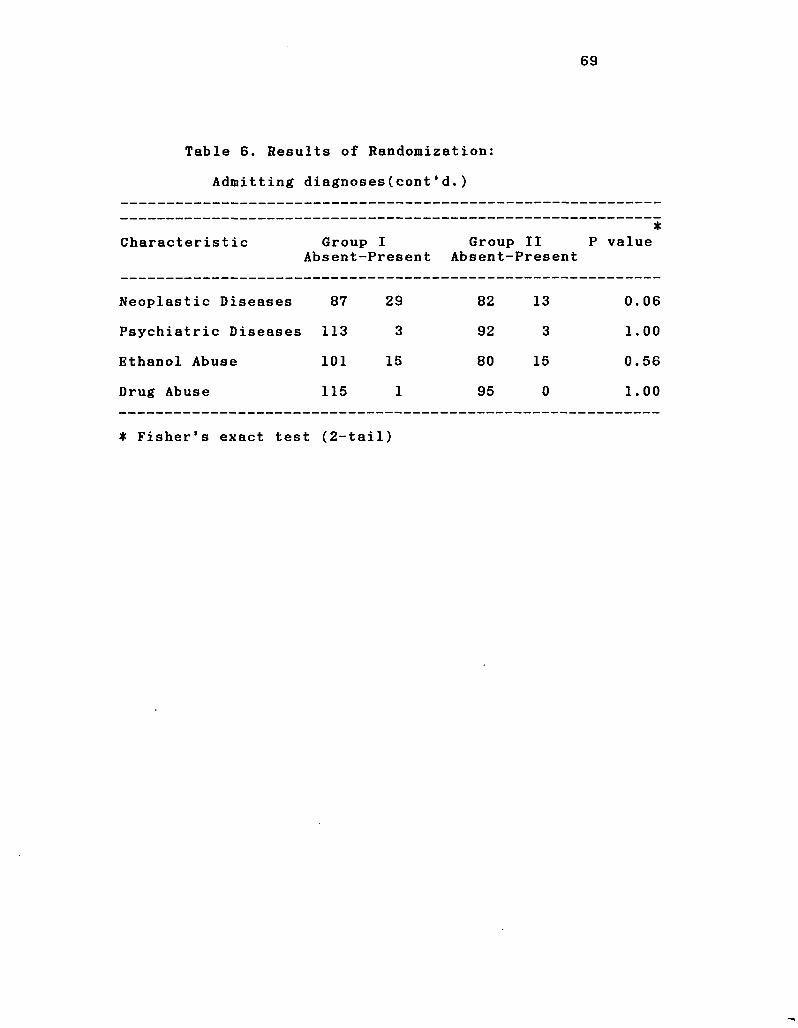
69
Table 6. Results of Randomization:
Admitting diagnoses(cont'd.)
Characterist ic Group Absent-
I Present
Group Absent-
II Present
• P value
Neoplastic Diseases 87 29 82 13
CO o
o
Psychiatric Diseases 113 3 92 3 1.00
Ethanol Abuse 101 15 80 15 0.56
Drug Abuse 115 1 95 0 1.00
• Fisher's exact test (2-tail)
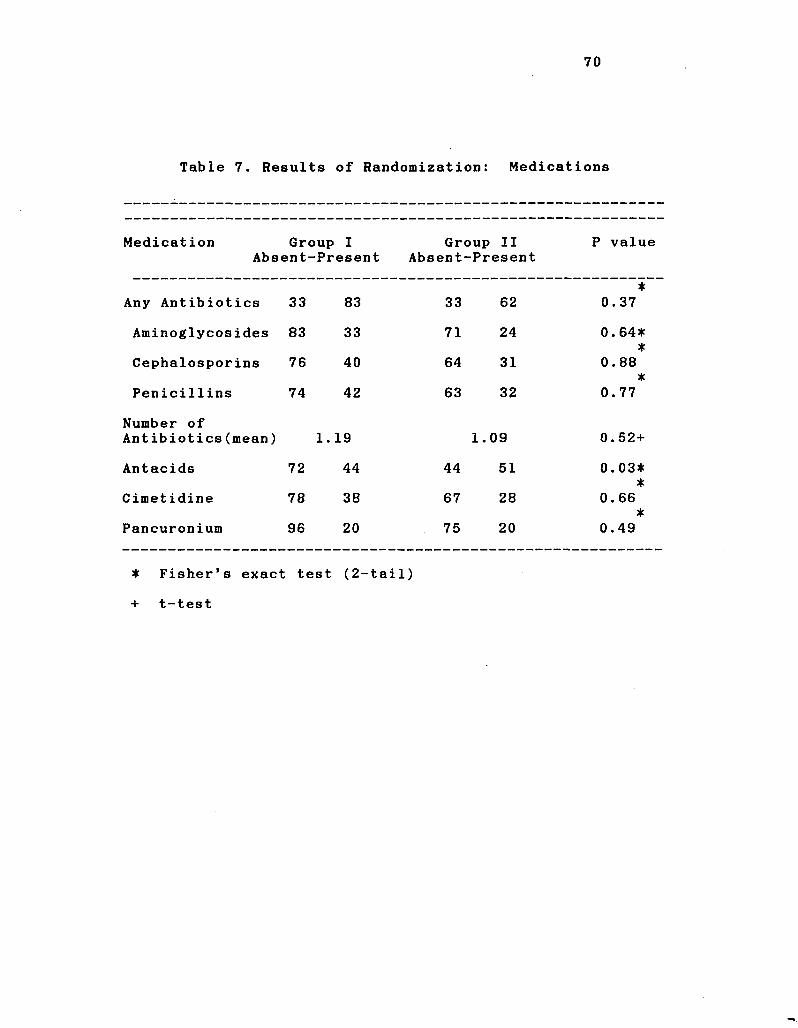
70
Table 7. Results of Randomization: Medications
Medication Group I Group II P value Absent--Present Absent--Present
Any Antibiotics 33 83 33 62 *
0.37
Aminoglycosides 83 33 71 24 0. 64* *
Cephalosporins 76 40 64 31
(• *
00 00 o
Penicillins 74 42 63 32 0. 77
Number of Antibiotics(mean) H-
1
1—»
CO
1.09 0.52+
Antacids 72 44 44 51 0.03* *
Cimetidine 78 38 67 28 0. 66 *
Pancuronium 96 20 75 20 0.49
* Fisher's exact test (2-tail)
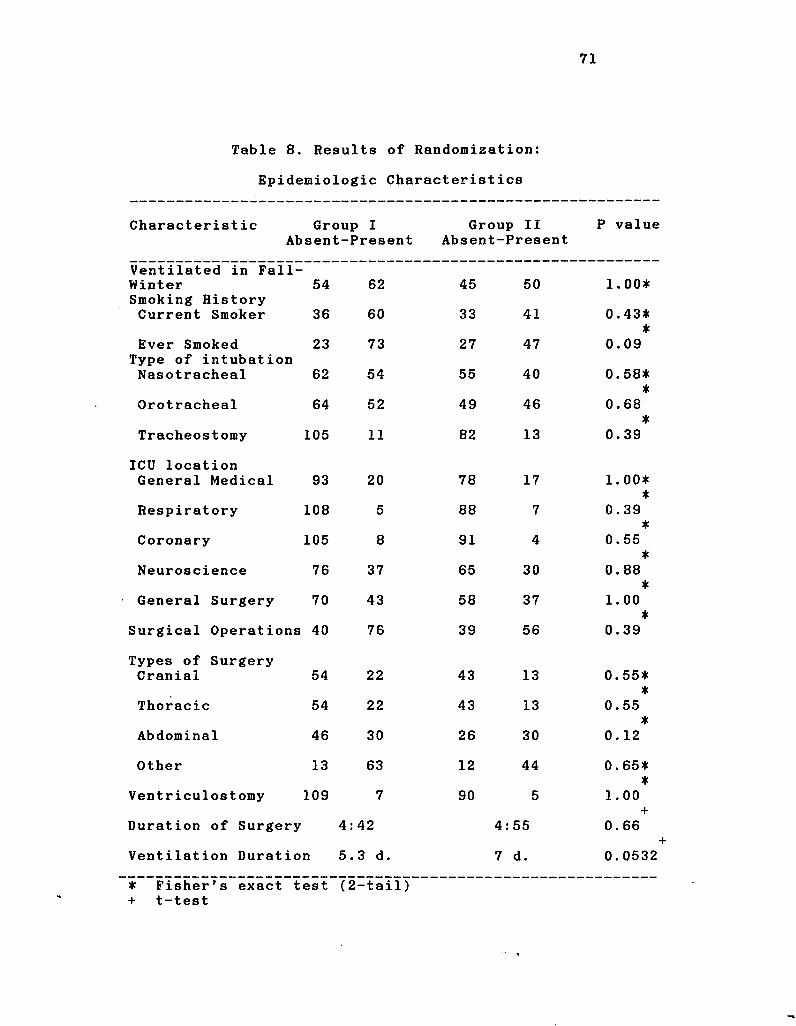
Table 8. Results of Randomization:
Epidemiologic Characteristics
Characteristic Group I Group II P value Absent-Present Absent-Present
Ventilated in Fall-Winter Smoking History Current Smoker
54
36
62
60
45
33
50
41
1.00*
0.43* *
Ever Smoked Type of intubation Nasotracheal
23
62
73
54
27
55
47
40
T 0.09
0.58*
Orotracheal 64 52 49 46 0.68 ±
Tracheostomy 105 11 82 13 T
0.39
ICU location General Medical 93 20 78 17 1. 00*
Respiratory 108 5 88 7 T
0.39 *
Coronary 105 8 91 4 0.55 ±
Neuroscience 76 37 65 30 0.88 ±
General Surgery 70 43 58 37 1.00 ±
Surgical Operations 40 76 39 56 0.39
Types of Surgery Cranial 54 22 43 13 0.55*
*
Thoracic 54 22 43 13 T
0.55 *
Abdominal 46 30 26 30 0. 12
Other 13 63 12 44 0.65* *
Ventriculostomy 109 7 90 5 1.00
Duration of Surgery 4: 42 4: : 55 "T
0. 66
Ventilation Duration 5. 3 d. 7 d. 0.0532
* Fisher's exact test + t-test
(2 -tail)
72
examined.
There were fifteen cases of pneumonia in Group I (13*)
and twenty cases of pneumonia in Group II (21.1%). The
difference in infection rates between Group I and Group II
was not significant (p=0.14). With these rates and the
sample size of 211 patients on ventilatory support, the
probability of detecting a significant difference is 47%
(statistical power = 47%). Thus, it would be possible to
detect a true difference in these rates only about half of
the time. A sample size of 523 persons would have been
required to reach 80% power.
There were 68 cases of tracheobronchitis in Group I
(58.6%) and 50 cases of tracheobronchitis in Group II
(52.6%). The difference between the tracheobronchitis rates
was not significant (p = 1.00). With these rates and the
sample size of 211 patients on ventilatory support, the
probability of detecting a significant difference is 21.8%
(statistical power = 21.8%). Thus, it would be possible to
detect a true difference in these rates only about one fifth
of the time. A sample size of 1,704 persons would have been
required to reach 80% power.
Bisk Factors for Infection. Three sets of analysis for
identification of risk factors were performed. First,
patients with pneumonia were compared to patients without
pneumonia. In the second analysis, patients with pneumonia
were compared to patients who had no infection (patients
with tracheobronchitis were excluded from the group of
patients without pneumonia). In the third analysis,
73
patients with tracheobronchitis were compared to patients
who had no infections.
Results of the first analysis are shown in Tables 9-12.
Risk factors for pneumonia included head injury, chest
injury, other types of surgery (surgery that was not
cranial, thoracic or abdominal), having been hospitalized in
the neurosciences ICU and a longer duration of ventilation.
Two factors were identified that appeared to protect
patients from developing pneumonia. These included having
received any antibiotics, and having a nasotracheal tube
rather than an orotracheal tube or tracheostomy.
Results of the second analysis are shown in Table 13-
16. For this analysis, patients with tracheobronchitis were
removed from the group of patients without pneumonia. Thus,
in this analysis, patients with pneumonia were compared with
patients without any respiratory tract infection. When the
analysis was performed in this manner, chest injury and
other types of surgery were no longer risk factors for
pneumonia. However, three additional risk factors were
identified including use of pancuronium, ventilation by way
of a tracheostomy and presence of a ventriculostomy. This
analysis appeared to sharpen the differences between
pneumonia and patients who did not develop pneumonia while
on ventilatory support. As in the first analysis, duration
of ventilation was significantly associated with development
of pneumonia. Use of antibiotics and nasotracheal
intubation were again found to be protective.
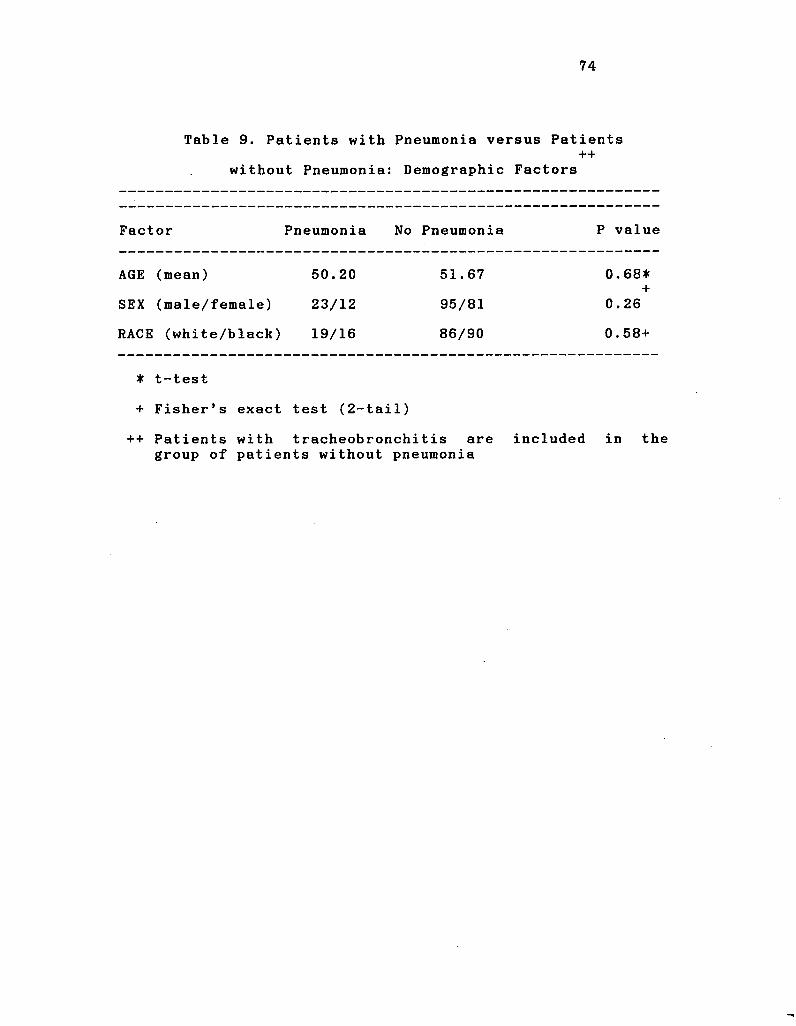
74
Table 9. Patients with Pneumonia versus Patients ++
without Pneumonia: Demographic Factors
Factor Pneumonia No Pneumonia P value
AGE (mean) 50.20 51.67 0.68* +
SEX (male/female) 23/12 95/81 0.26
RACE (white/black) 19/16 86/90 0.58+
* t-test
+ Fisher's exact test (2-tail)
++ Patients with tracheobronchitis are included in the group of patients without pneumonia
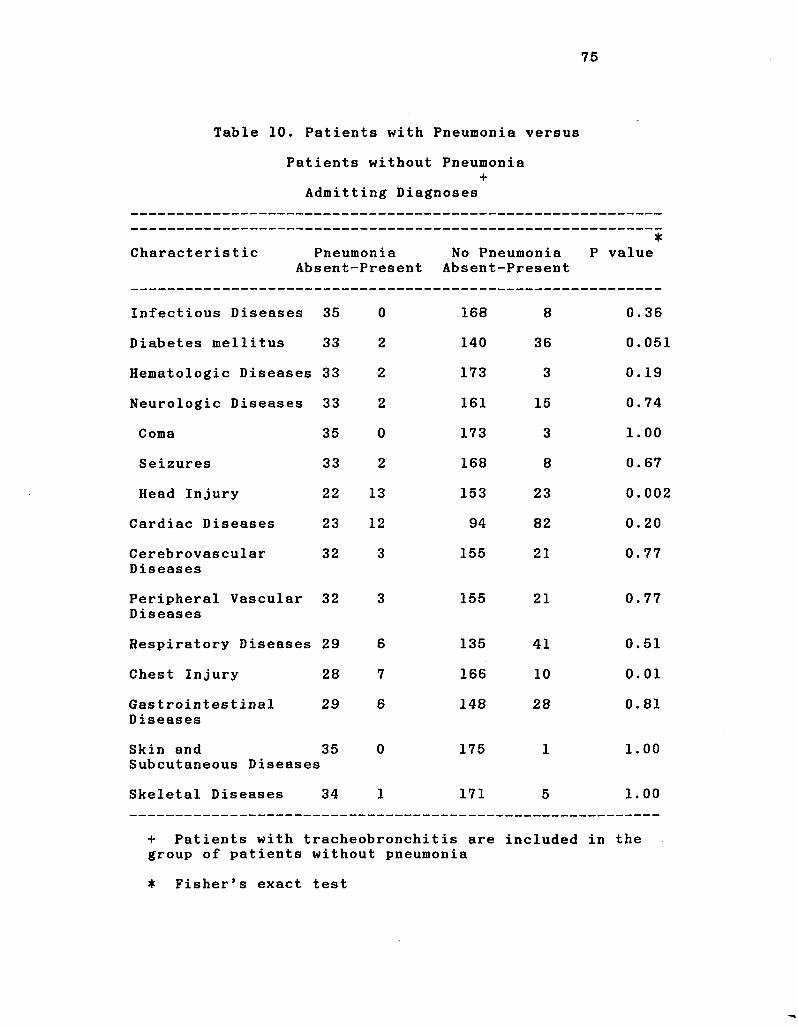
75
Table 10. Patients with Pneumonia versus
Patients without Pneumonia +
Admitting Diagnoses
Characterist ic Pneumonia Absent-Present
• No Pneumonia P value
Absent-Present
Infectious Diseases 35 0 168 8 0. 36
Diabetes mellitus 33 2 140 36 0. 051
Hematologic Diseases 33 2 173 3 0. 19
Neurologic Diseases 33 2 161 15 0. 74
Coma 35 0 173 3 1. 00
Seizures 33 2 168 8 0. 67
Head Injury 22 13 153 23 0. 002
Cardiac Diseases 23 12 94 82 0. 20
Cerebrovascular Diseases
32 3 155 21 0. 77
Peripheral Vascular Diseases
32 3 155 21 0. 77
Respiratory Diseases 29 6 135 41 0. 51
Chest Injury 28 7 166 10 0. 01
Gastrointestinal Diseases
29 6 148 28 0. 81
Skin and Subcutaneous Diseases
35 i
0 175 1 1. 00
Skeletal Diseases 34 1 171 5 1. 00
+ Patients with tracheobronchitis are included in the group of patients without pneumonia
* Fisher's exact test
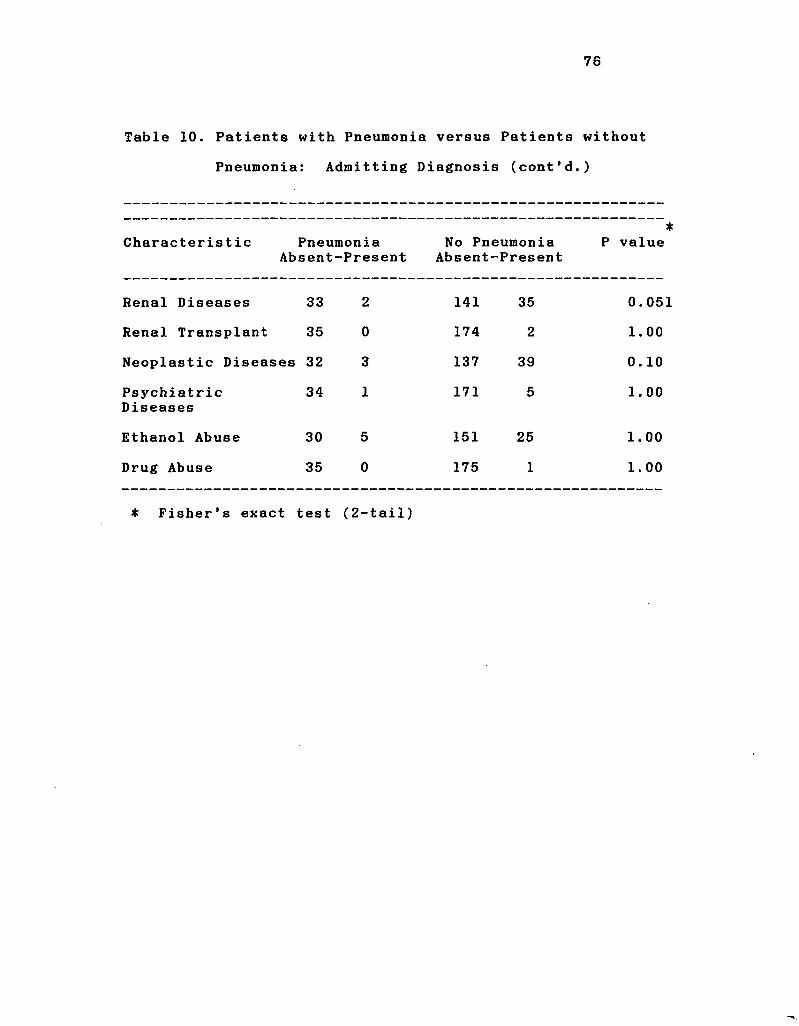
76
Table 10. Patients with Pneumonia versus Patients without
Pneumonia: Admitting Diagnosis (cont'd.)
Characteristic Pneumonia Absent-Present
No Pneumonia Absent-Present
P value
Renal Diseases 33 2 141 35 0.05!
Renal Transplant 35 0 174 2 1.00
Neoplastic Diseases 32 3 137 39 0.10
Psychiatric Diseases
34 1 171 5 1.00
Gthanol Abuse 30 5 151 25 1.00
Drug Abuse 35 0 175 1 1.00
* Fisher's exact test (2-tail)
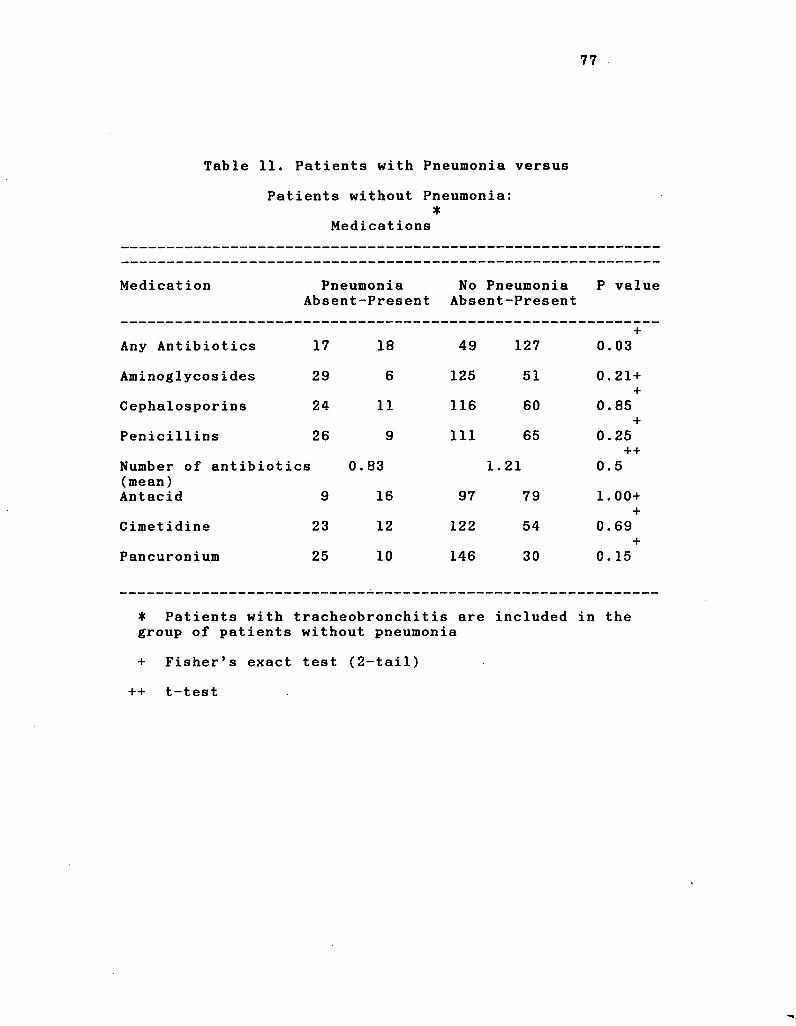
77
Table 11. Patients with Pneumonia versus
Patients without Pneumonia: •
Medications
Medication Pneumonia Absent-Present
No Pneumonia P value Absent-Present
+ Any Antibiotics 17 18 49 127 0.03
Aminoglycosides 29 6 125 51 0.21 + +
0.85 _1_
Cephalosporins 24 11 116 60
0.21 + +
0.85 _1_
Penicillins 26
Number of antibiotics (mean) Antacid 9
9
0. 83
16
111
97
65
1.21
79
T 0.25
++
0.5
1.00+ i
Cimetidine 23 12 122 54 +
0.69
Pancuronium 25 10 146 30 T
0. 15
• Patients with group of patients
tracheobronchitis are without pneumonia
included in the
+ Fisher's exact test (2-tail)
++ t-test
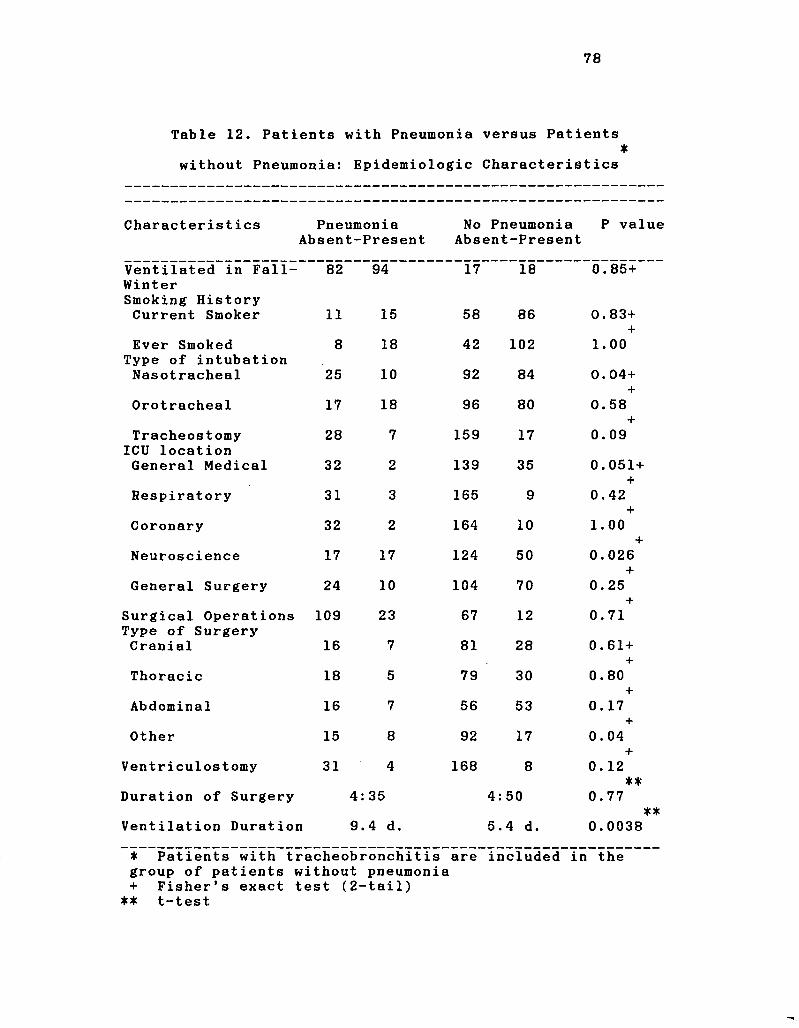
78
Table 12. Patients with Pneumonia versus Patients •
without Pneumonia: Epidemiologic Characteristics
Characteristics Pneumonia No Pneumonia P value Absent-Present Absent-Present
Ventilated in Fall- 8 2 9 4 1 7 1 8 0 . 8 5 + Winter Smoking History Current Smoker 1 1 1 5 5 8 8 6 0 . 8 3 +
x Ever Smoked 8 1 8 4 2 1 0 2 1 . 0 0
Type of intubation Nasotracheal 2 5 1 0 9 2 8 4 0 . 0 4 +
x Orotracheal 1 7 1 8 9 6 8 0 0 . 5 8
x Tracheostomy 2 8 7 1 5 9 1 7
*t* 0 . 0 9
ICU location General Medical 3 2 2 1 3 9 3 5 0 . 0 5 1 +
x Respiratory 3 1 3 1 6 5 9
T 0 . 4 2
Coronary 3 2 2 1 6 4 1 0 1 . 0 0 x
Neuroscience 1 7 1 7 1 2 4 5 0 0 . 0 2 6 x
General Surgery 2 4 1 0 1 0 4 7 0 0 . 2 5 x
Surgical Operations 1 0 9 2 3 6 7 1 2 0 . 7 1 Type of Surgery Cranial 1 6 7 8 1 2 8 0 . 6 1 +
x Thoracic 1 8 5 7 9 3 0
f 0 . 8 0
x Abdominal 1 6 7 5 6 5 3
T 0 . 1 7
i
Other 1 5 8 9 2 1 7 T
0 . 0 4 i
Ventriculostomy 3 1 4 1 6 8 8 0 . 1 2 **
Duration of Surgery 4 : 3 5 4 : 5 0 0 . 7 7 **
Ventilation Duration 9 .4 d. 5 . 4 d. 0 . 0 0 3 8
• Patients with tracheobronchitis are included in i the group of patients without pneumonia + Fisher's exact test ( 2 --tail)
** t-test
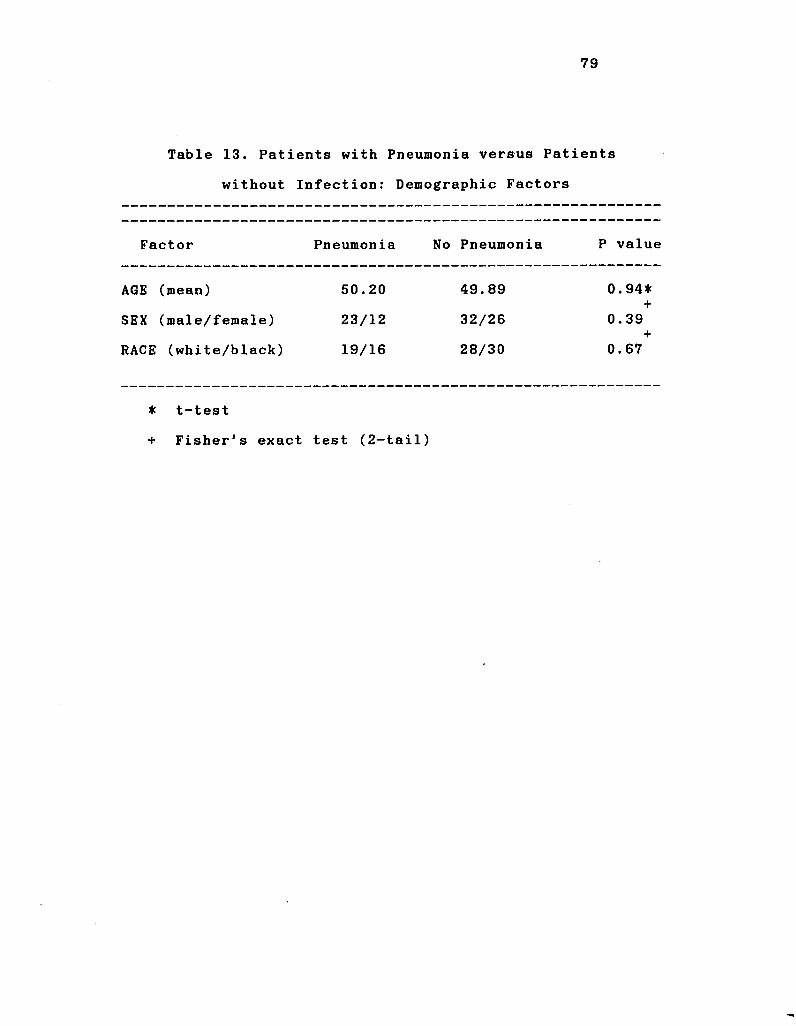
79
Table 13. Patients with Pneumonia versus Patients
without Infection: Demographic Factors
Factor Pneumonia No Pneumonia P value
AGE (mean)
SEX (male/female)
RACE (white/black)
50.20
23/12
19/16
49.89
32/26
28/30
0.94* +
0.39 +
0.67
* t-test
+ Fisher's exact test (2-tail)
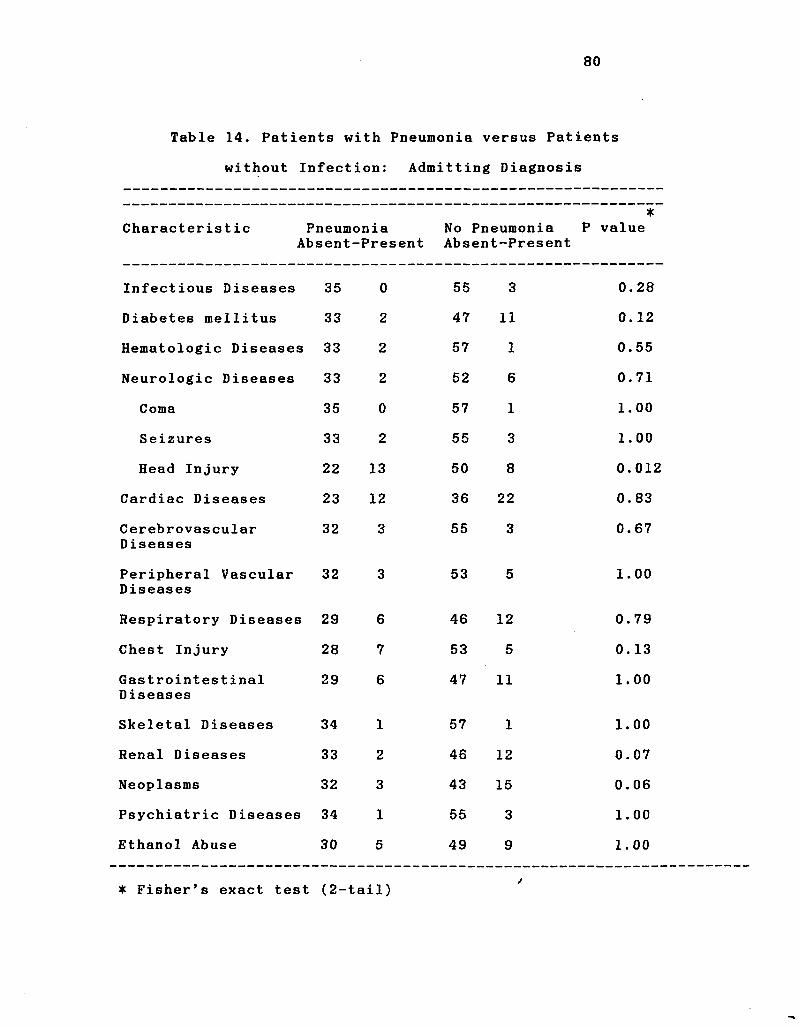
80
Table 14. Patients with Pneumonia versus Patients
without Infection: Admitting Diagnosis
Characterist ic Pneumonia Absent-Present
* No Pneumonia P value Absent-Present
Infectious Diseases 35 0 55 3 0.28
Diabetes mellitus 33 2 47 11 0.12
Hematologic Diseases 33 2 57 1 0.55
Neurologic Diseases 33 2 52 6 0.71
Coma 35 0 57 1 1.00
Seizures 33 2 55 3 1.00
Head Injury 22 13 50 8 0.012
Cardiac Diseases 23 12 36 22 0. 83
Cerebrovascular Diseases
32 3 55 3 0.67
Peripheral Vascular Diseases
32 3 53 5 1.00
Respiratory Diseases 29 6 46 12 0.79
Chest Injury 28 7 53 5 0. 13
Gastrointestinal Diseases
29 6 47 11 1.00
Skeletal Diseases 34 1 57 1 1.00
Renal Diseases 33 2 46 12 0.07
Neoplasms 32 3 43 15 0.06
Psychiatric Diseases 34 1 55 3 1.00
Ethanol Abuse 30 5 49 9 1.00
• Fisher's exact test (2-tail)
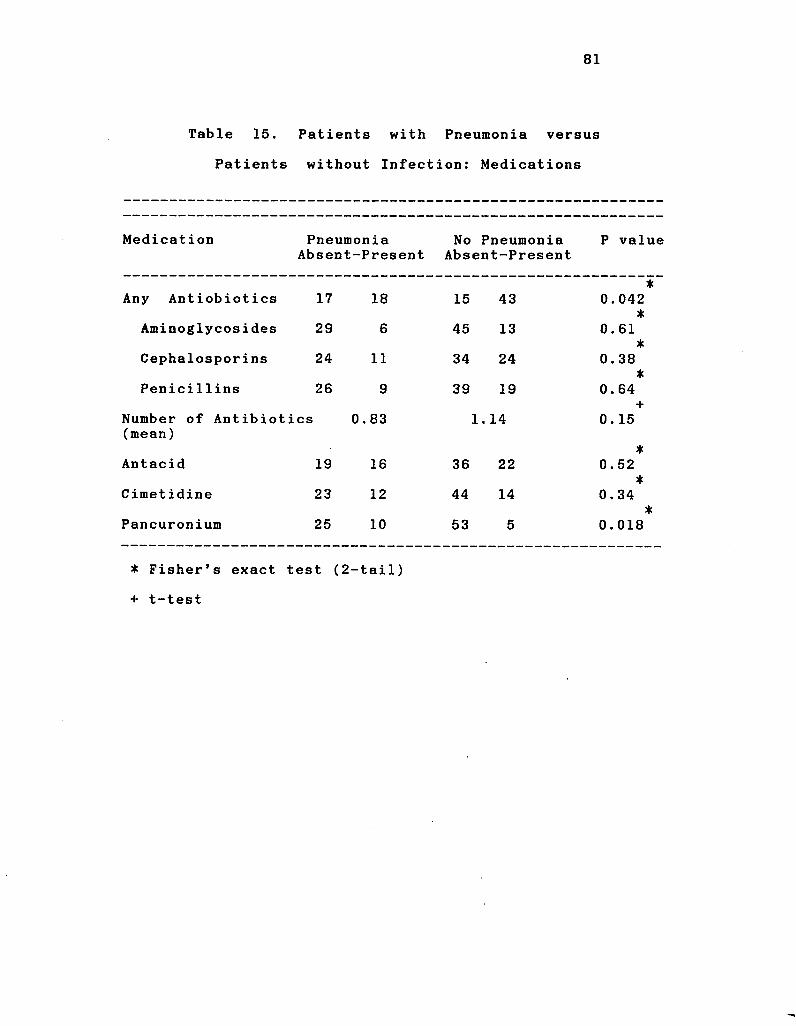
81
Table 15. Patients with Pneumonia versus
Patients without Infection: Medications
Medication Pneumonia No Pneumonia P value Absent-Present Absent-Present
• Any Antiobiotics 17 18 15 43 0.042
*
Aminoglycosides 29 6 45 13 T
0.61 *
Cephalosporins 24 11 34 24 0. 38 * *
Penicillins 26 9 39 19 0.64 i
Number of Antibiotics 0.83 1. 14 T
0. 15 (mean)
* Antacid 19 16 36 22 0.52
*
Cimet idine 23 12 44 14 *
0.34
Pancuronium 25 10 53 5 *
0.018
• Fisher's exact test (2-tail)
+ t-test
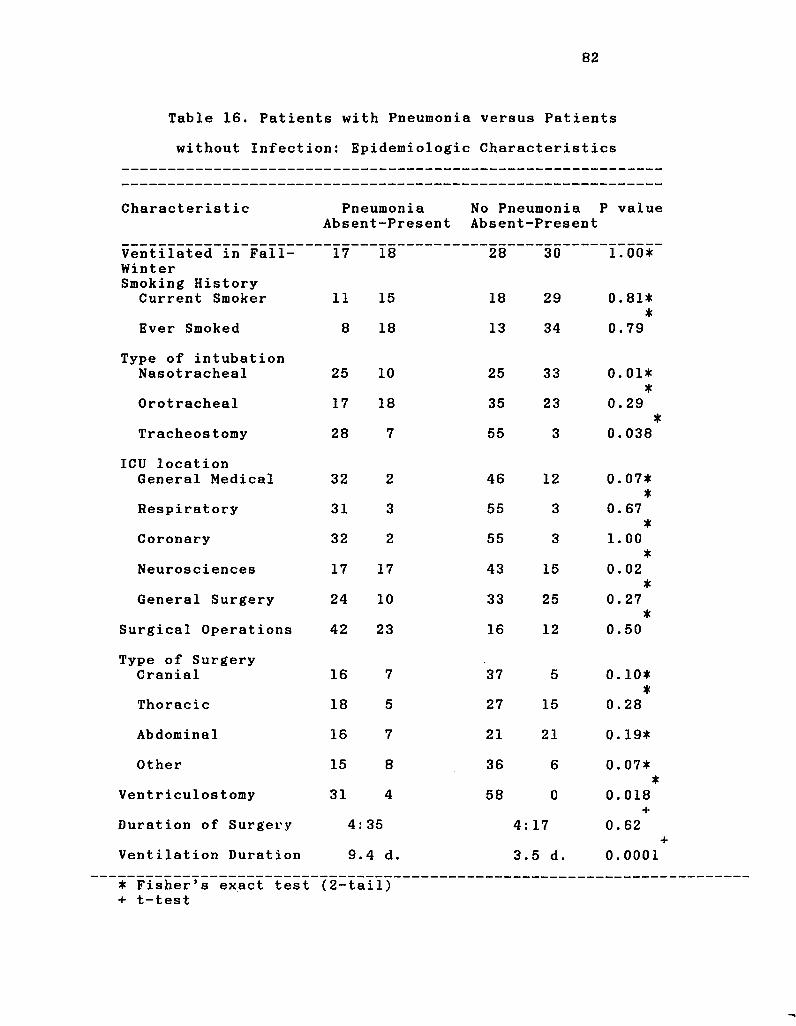
82
Table 16. Patients with Pneumonia versus Patients
without Infection: Epidemiologic Characteristics
Characteristic Pneumonia No Pneumonia P value Absent-Present Absent-Present
Ventilated in Fall-Winter Smoking History
17 18 28 30 1 . 0 0 *
Current Smoker 11 15 18 29 0.81* *
Ever Smoked 8 18 13 34 0.79
Type of intubation Nasotracheal 25 10 25 33 0.01*
*
Orotracheal 17 18 35 23 •
0.29 * *
Tracheostomy 28 7 55 3 0.038
ICU location General Medical 32 2 46 12 0. 07*
Respiratory 31 3 55 3 T
0.67 *
Coronary 32 2 55 3 •
1.00
Neurosciences 17 17 43 15 0.02 *
General Surgery 24 10 33 25 •
0. 27
Surgical Operations 42 23 16 12 •
0.50
Type of Surgery Cranial 16 7 37 5 0. 10*
*
Thoracic 18 5 27 15 0.28
Abdominal 16 7 21 21 0. 19*
Other 15 8 36 6 0.07* *
Ventriculostomy 31 4 58 0 T
0. 018 i
Duration of Surgery 4: 35 4: 17 "T*
0. 62
Ventilation Duration 9. 4 d. 3. 5 d. 0.0001
* Fisher's exact test (2-tail) + t-test
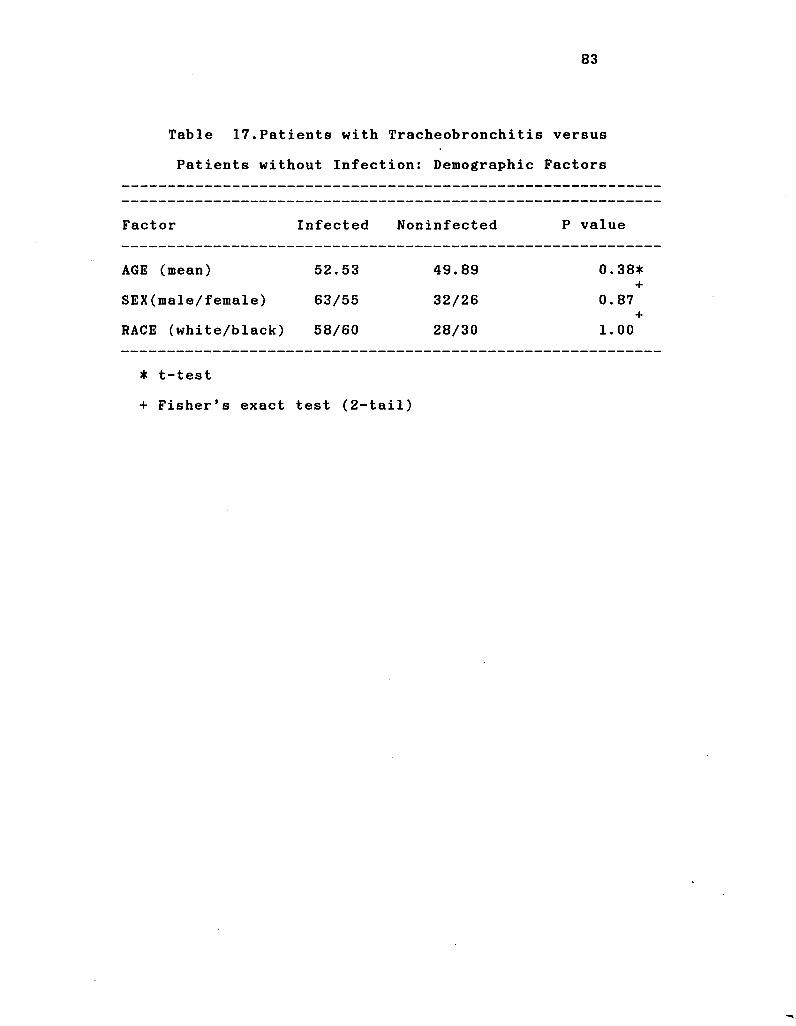
83
Table 17.Patients with Tracheobronchitis versus
Patients without Infection: Demographic Factors
Factor Infected Noninfected P value
AGE (mean)
SEX(male/female)
RACE (white/black)
52.53
63/55
58/60
49.89
32/26
28/30
* +
+
00
c-
o
CO 00
o
O O
rH
• t-test
+ Fisher's exact test (2-tail)
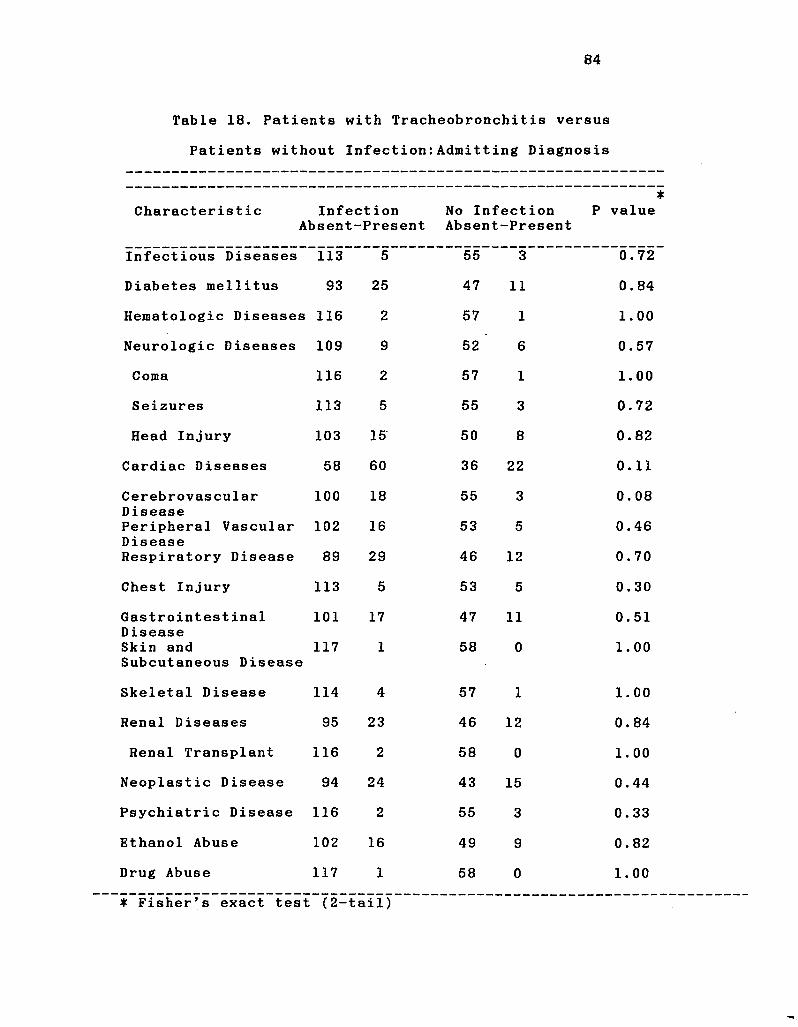
84
Table 18. Patients with Tracheobronchitis versus
Patients without Infection:Admitting Diagnosis
* Characteristic Infection No Infection P value
Absent-Present Absent-Present
Infectious Diseases 113 5 55 3 0.72
Diabetes mellitus 93 25 47 11 0.84
Hematologic Diseases 116 2 57 1 1.00
Neurologic Diseases 109 9 52 6 0.57
Coma 116 2 57 1 1.00
Seizures 113 5 55 3 0.72
Head Injury 103 15 50 8 0.82
Cardiac Diseases 58 60 36 22 0.11
Cerebrovascular 100 18 55 3 0.08 Disease Peripheral Vascular 102 16 53 5 0.46 Disease Respiratory Disease 89 29 46 12 0.70
Chest Injury 113 5 53 5 0.30
Gastrointestinal 101 17 47 11 0.51 Disease Skin and 117 1 58 0 1.00 Subcutaneous Disease
Skeletal Disease 114 4 57 1 1.00
Renal Diseases 95 23 46 12 0.84
Renal Transplant 116 2 58 0 1.00
Neoplastic Disease 94 24 43 15 0.44
Psychiatric Disease 116 2 55 3 0.33
Gthanol Abuse 102 16 49 9 0.82
Drug Abuse 117 1 58 0 1.00
* Fisher's exact test (2-tailJ
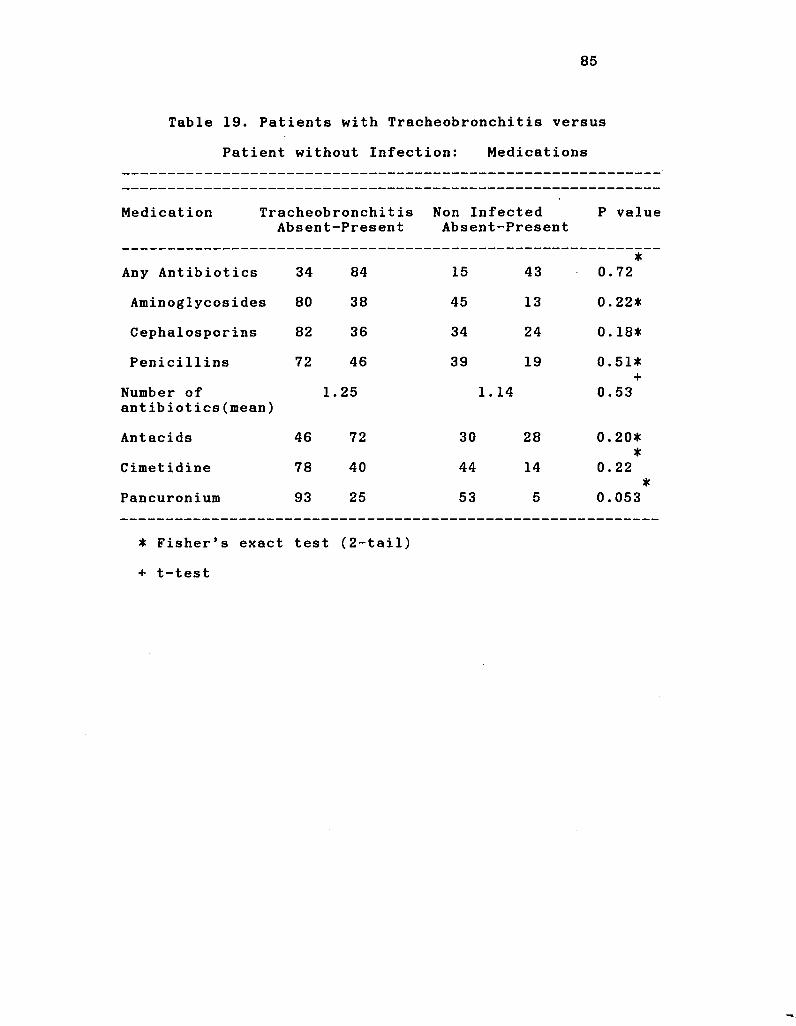
85
Table 19. Patients with Tracheobronchitis versus
Patient without Infection: Medications
Medication Tracheobronchitis Absent-Present
Non Infected Absent-Present
P value
Any Antibiotics 34 84 15 43 0. *
72
Aminoglycosides 80 38 45 13 0. 22*
Cephalosporins 82 36 34 24 0. 18*
Penicillins 72 46 39 19 0. 51*
Number of antibiotics(mean)
1.25 1. 14 0. 53
Antacids 46 72 30 28 0. 20*
Cimetidine 78 40 44 14 0. T
22 *
Pancuronium 93 25 53 5 0.053
• Fisher's exact test (2-tail)
+ t-test
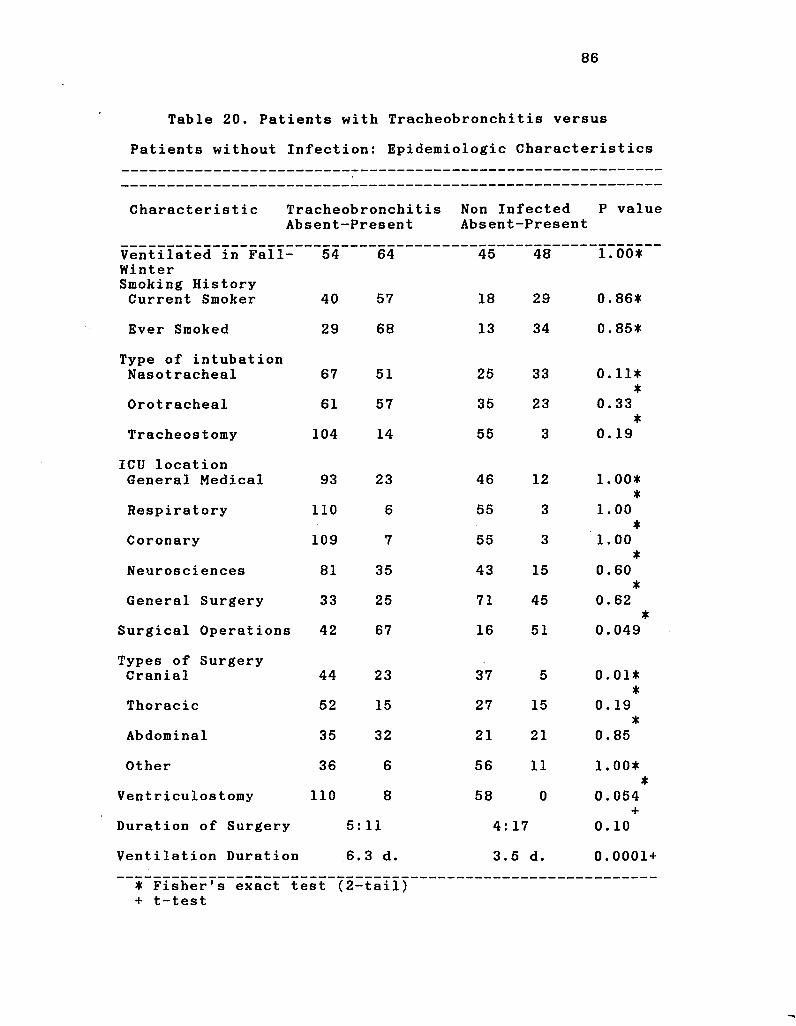
86
Table 20. Patients with Tracheobronchitis versus
Patients without Infection: Epidemiologic Characteristics
Characteristic Tracheobronchitis Absent-Present
Non Infected P value Absent-Present
Ventilated in Fall-Winter Smoking History Current Smoker
54
40
64
57 t-*
00
Oil
N)
£»|
CO
001
1.00*"
0. 86*
Ever Smoked 29 68 13 34 0.85*
Type of intubation Nasotracheal 67 51 25 33 0.11*
*
Orotracheal 61 57 35 23 0.33 *
Tracheostomy 104 14 55 3 T
0. 19
ICU location General Medical 93 23 46 12 1.00*
Respiratory 110 6 55 3 T
1.00
Coronary 109 7 55 3 •
1.00 ±
Neurosciences 81 35 43 15 •
0.60 *
General Surgery 33 25 71 45 0.62
Surgical Operations 42 67 16 51 •
0.049
Types of Surgery Cranial 44 23 37 5 0.01*
*
Thoracic 52 15 27 15 0.19 *
Abdominal 35 32 21 21 •
0.85
Other 36 6 56 11 1.00* *
Ventriculostomy 110 8 58 0 0.054
Duration of Surgery 5: 11 4: 17 T
0 . 10
Ventilation Duration 6. 3 d. 3. 5 d. 0 .0001
• Fisher's exact test (2-+ t-test
tail)
87
Results of the third analysis are shown in Tables 17-
20. Only three risk factors were identified for
tracheobronchitis. They were surgical operations in
general, cranial operations and duration of ventilation.
There were no factors that appeared to protect against
development of tracheobronchitis.
Multivariate analysis. Because many of the risk
factors identified by univariate analysis may have been
interrelated, these risk factors were subjected to
multivariate analysis using a stepwise logistic regression
procedure. All variables with a significant association or
a borderline significant association with the occurrence of
infection were included in the models.
In the first analysis, where patients with pneumonia
were compared with patients without pneumonia, variables
included in the model for the logistic regression procedure
included head injury, chest injury, other surgery, duration
of ventilation, not having received antibiotics, not having
a nasotracheal tube, location in the general medical ICU,
and location in the neurosciences ICU. After logistic
regression analysis, three variables remained associated
significantly with pneumonia. These included duration of
ventilation (p < 0.00009), not having received an antibiotic
(p = 0.0013), and having sustained a chest injury (p =
0.0019).
In the second analysis, where patients with pneumonia
were compared with patients without infection, variables
included in the model for the logistic regression procedure
88
included head injury, treatment with pancuronium, having had
a tracheostomy, duration of ventilation, location in the
neurosciences ICU, not having received antibiotics, and not
having a nasotracheal tube. After logistic regression
analysis, three variables remained associated significantly
with pneumonia. These included duration of ventilation (p =
0.0001), not having received an antibiotic ( p = 0.002), and
having received pancuronium (p = 0.0463).
For multivariate analysis of the factors associated
with tracheobronchitis, variables included in the model for
stepwise logistic regression were having had any surgical
operation, having had cranial surgery, having received
pancuronium and duration of ventilation. When these
variables were analysed by this procedure, only duration of
ventilation remained significantly associated with the
occurrence of tracheobronchitis.
Microbiology
Ten thousand and ten cultures were obtained from 1,247
breathing circuits and 56.5% were positive. Ten and seven-
tenths percent of all cultures taken yielded a pathogen.
Ninety and four-tenths percent of all cultures taken from
the internal surfaces of the ventilator circuits were
positive, and 6.6% of internal surface cultures of the
ventilator circuits were positive for a pathogenic species.
For condensate and humidifier water, the culture positivity
rate was lower (74.7% and 3.2%, respectively). Pathogens
were recovered from 38.2% of condensate cultures and 1.6% of
the cultures of humidifier water. Forty-eight and two-
89
tenths percent of stage 1 air cultures were positive. Only
about one-half as many stage 2 air cultures were positive
(26.3%). Pathogens were recovered from 9.5% of stage 1 air
cultures and 4.7% of stage 2 air cultures. The rates of
positive cultures for Group I and Group II circuits are
shown in Table 21.
Microorganisms Isolated from Circuits. The
microorganisms isolated from circuits changed at 24 hours or
48 hours are shown in Tables 22 and 23. Any microorganisms
were isolated from 94.1% of Group I circuits and 93.7% of
Group II circuits, and pathogens were isolated from 61.3% of
Group I circuits and 66.2% of Group II circuits. The great
preponderance of pathogens isolated from both 24 and 48 hour
circuits were Gram-negative bacilli. S^. aureus was the
major Gram-positive pathogen isolated from Group I and Group
II circuits and outnumbered all other Gram-positive
pathogens from 7:1 to 10:1.
Cultures of Air. Microorganisms isolated from the air
of the inspiratory limb of the circuit are shown in Tables
24 and 25. Microorganisms were recovered from air of 54% of
Group I circuits and 51.6% of Group II circuits. Twenty-
four percent of Group I positive air cultures yielded a
pathogenic organism. Thirty-seven percent of the positive
air cultures from Group II had one or more pathogens
isolated. Fifteen to 20% of the agar plates in stage 1 were
contaminated by condensate that dripped out of the proximal
inspiratory limb during air sampling. Of all the pathogenic
microorganisms present in respiratory circuits, only a
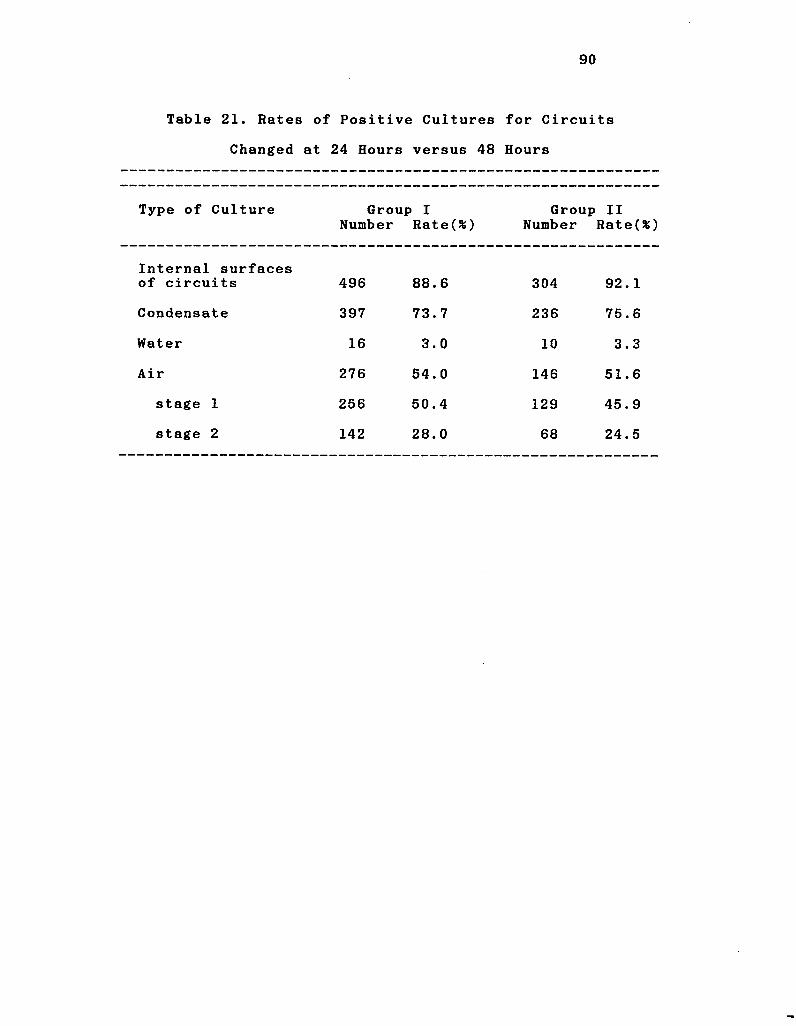
90
Table 21. Rates of Positive Cultures for Circuits
Changed at 24 Hours versus 48 Hours
Type of Culture Group I Number Rate(*)
Group Number
II Rate(%)
Internal surfaces of circuits 496 88.6 304 92.1
Condensate 397 73.7 236 75.6
Water 16 3.0 10 3.3
Air 276 54.0 146 51.6
stage 1 256 50.4 129 45.9
stage 2 142 28.0 68 24.5
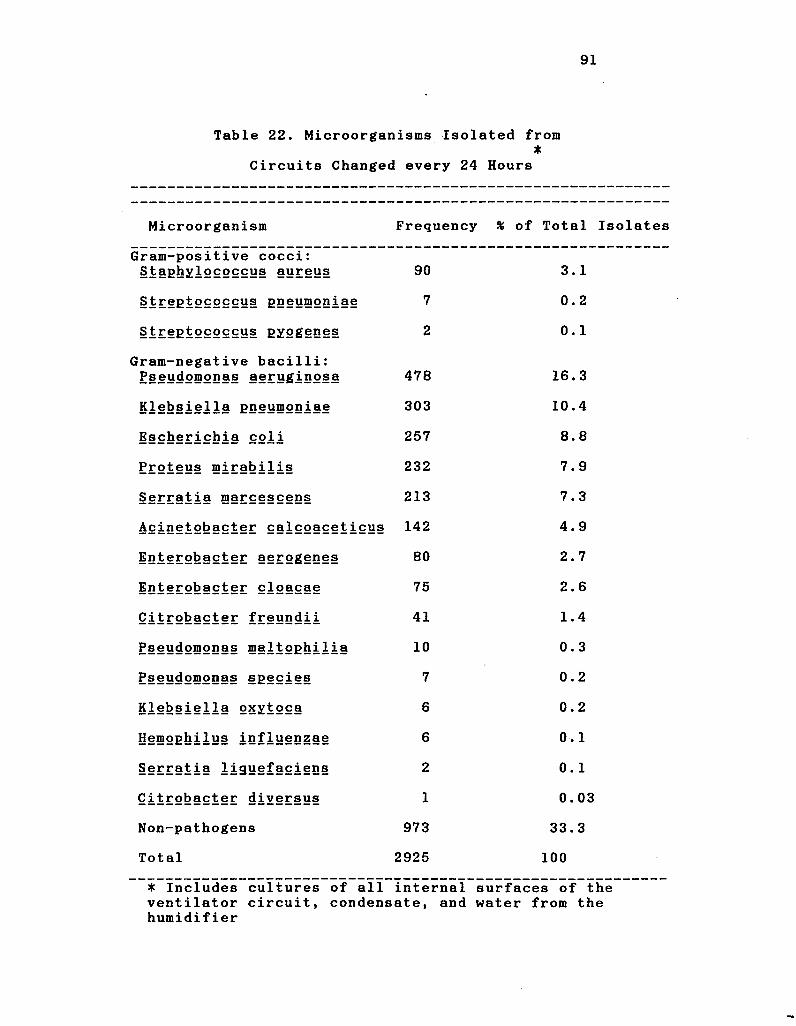
91
Table 22. Microorganisms Isolated from •
Circuits Changed every 24 Hours
Microorganism Frequency % of Total Isolates
Gram-positive cocci: Staphylococcus aureus 90 3.1
Streptococcus pneumoniae 7 0.2
Streptococcus pyogenes 2 0.1
Gram-negative bacilli: P§§ydomonas aeruginosa 478 16.3
Klebsiella pneumoniae 303 10.4
Escherichia coli 257 8.8
Proteus mirabilis 232 7.9
Serratia marcescens 213 7.3
Acinetobacter calcoaceticus 142 4.9
Iot§E2t>§cter aerogenes 80 2.7
Enterobacter cloacae 75 2.6
Qitrobacter freundii 41 1.4
Pseudomonas maltophilia 10 0.3
Pseudomonas species 7 0.2
Klebsiella oxytoca 6 0.2
Hemophilus influenzae 6 0. 1
Serratia 1iguefaciens 2 0.1
Qitrobacter diversus 1 0.03
Non-pathogens 973 33.3
Total 2925 100
* Includes cultures of all internal surfaces of the ventilator circuit, condensate, and water from the humidifier
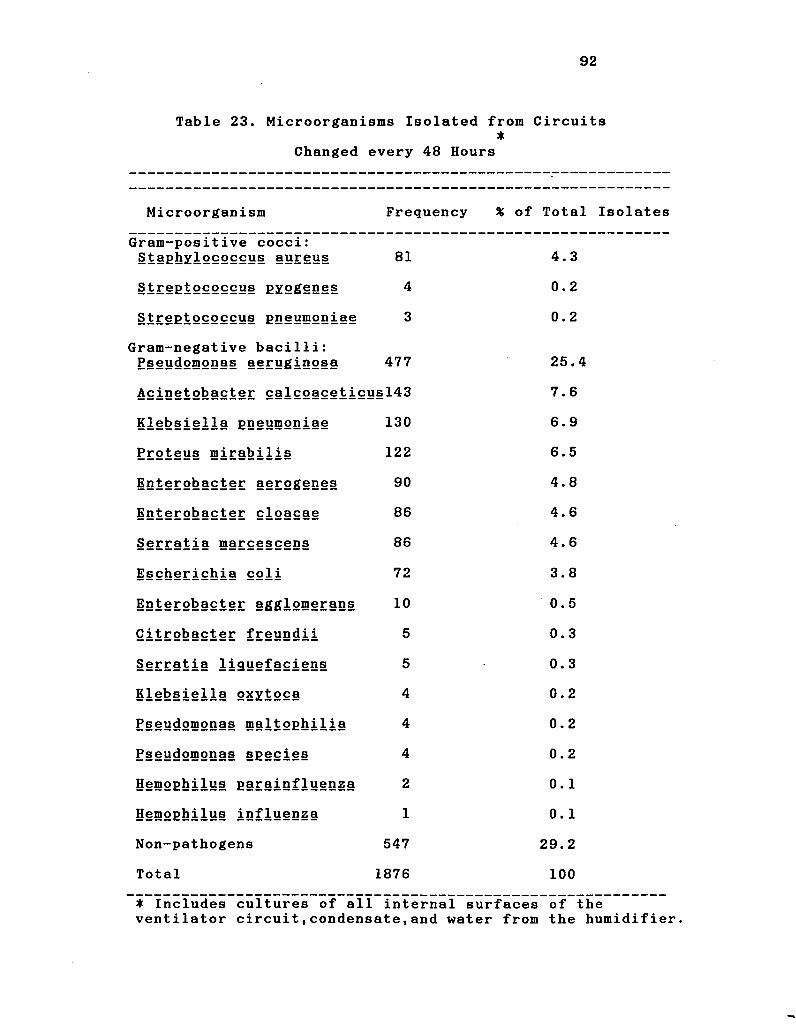
92
Table 23. Microorganisms Isolated from Circuits •
Changed every 48 Hours
Microorganism Frequency % of Total Isolates
Gram-positive cocci: Staphylococcus aureus 81 4.3
Streptococcus pyogenes 4 0.2
Streptococcus pneumoniae 3 0.2
Gram-negative bacilli: Pseudomonas aeruginosa 477 25.4
Acinetobacter calcoaceticusl43 7.6
Klebsiella pneumoniae 130 6.9
Proteus mirabilis 122 6.5
Enterobacter aerogenes 90 4.8
Enterobacter cloacae 86 4.6
Serratia marcescens 86 4.6
Escherichia col i 72 3.8
Enterobacter agglomerans 10 0.5
Citrobacter freundii 5 0.3
Serratia liguefaciens 5 0.3
Klebsiella oxytoca 4 0.2
E§§udomonas maltophilia 4
CM
•
o
Pseudomonas species 4 0.2
Hemophilus parainfluenza 2 0.1
Hemophilus influenza 1 0.1
Non-pathogens 547 29.2
Total 1876 100
• Includes cultures of all internal surfaces of the ventilator circuit,condensate,and water from the humidifier.
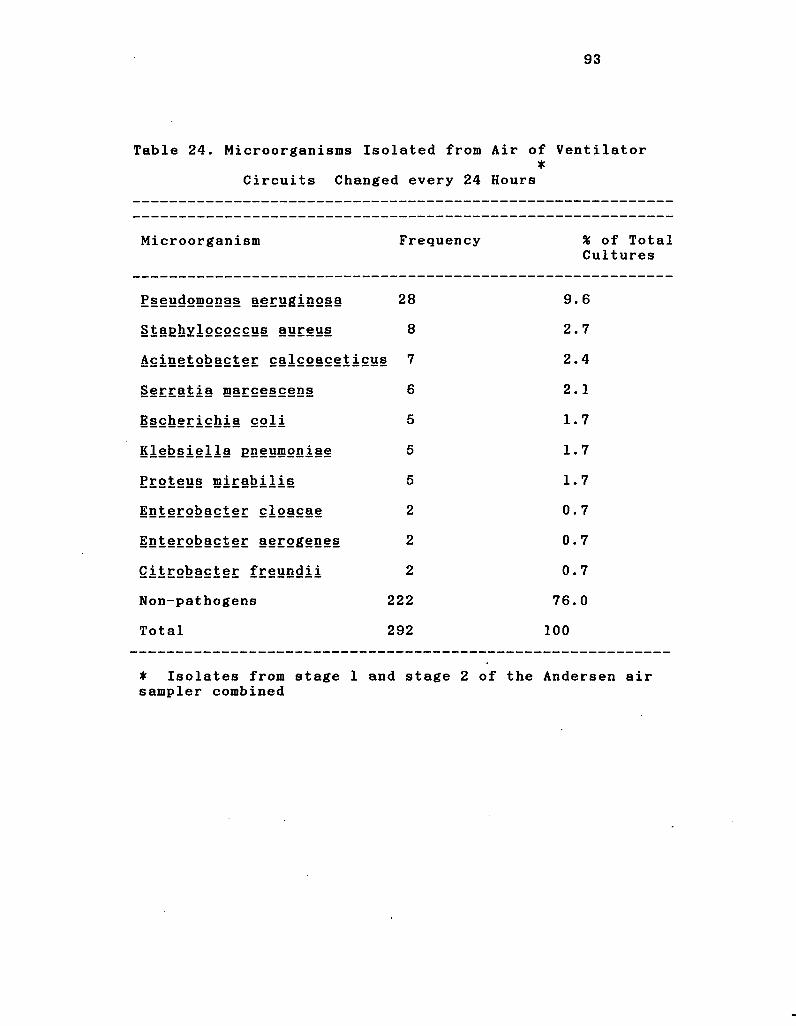
93
Table 24. Microorganisms Isolated from Air of Ventilator •
Circuits Changed every 24 Hours
Microorganism Frequency % of Total Cultures
E§§udomonas aeruginosa 28 9.6
Staghxlococcus aureus 8 2.7
Acinetobacter calcoaceticus 7 2.4
Serratia marcescens 6 2.1
Escherichia col i 5 1.7
Klebsiella pneumoniae 5 1.7
Proteus mirabilis 5 1.7
Enterobacter cloacae 2 0.7
Enterobacter aerogenes 2 0.7
Citrobacter freundii 2 0.7
Non-pathogens 222 76.0
Total 292 100
* Isolates from stage 1 sampler combined
and stage 2 of the Andersen air
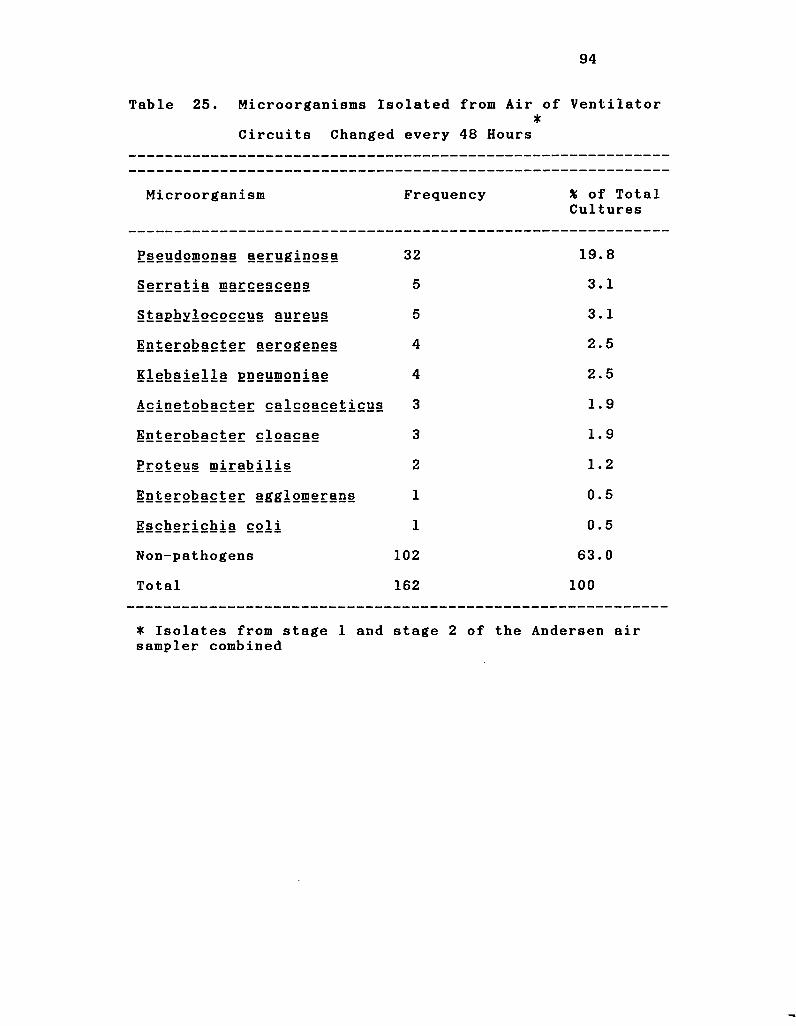
94
Table 25. Microorganisms Isolated from Air of Ventilator •
Circuits Changed every 48 Hours
Microorganism Frequency % of Total Cultures
E§§ydomonas aeruginosa 32 19.8
Serratia marcescens 5 3.1
Staphylococcus aureus 5 3.1
Enterobacter aerogenes 4 2.5
Klebsiella gneumoniae 4 2.5
Acinetobacter calcoaceticus 3 1.9
Enterobacter cloacae 3 1.9
Proteus mirabilis 2 1.2
Enterobacter agglomerans 1 0.5
Escherichia coli 1 0.5
Non-pathogens 102 63.0
Total 162 100
* Isolates from stage 1 and stage 2 of the Andersen air sampler combined
95
limited number could be recovered from the air. The only
pathogens isolated from Group I and Group II air cultures
were S^aureus and the nine GNB most commonly isolated from
circuit cultures (Tables 22 and 23). With one exception,
the pathogenic species isolated from the air of Group I
circuits were the same as those isolated from Group II
circuits. Only two-thirds (8 of 12) of the pathogenic
species isolated from the sputum of patients with pneumonia
(Table 2) also were isolated from the air of respiratory
circuits. However, P^. aeruginosa which was the pathogen
most frequently isolated from the sputum of patients with
pneumonia, was also the pathogen most frequently isolated
from the air cultures.
Cultures from Subgroups of Patients Randomized to
Receive Circuit Changes at 24 Hours. In a subset of 23
patients (Group IA), randomized to receive circuit changes
at 24 hours, ventilatory support was discontinued after only
one circuit change. In a subset of 116 patients (Group IB),
randomized to received circuit changes at 24 hours,
ventilatory support was continued for 48 or more hours.
Since all circuits in Group IA were exposed only during the
first 24 hours of ventilation, it was decided that Groups IA
and IB should be analyzed separately. Results of the
analyses where Group IA is compared with Group IB are shown
in Tables 26 and 27. As can be seen in Table 26, circuits
in Group IB are significantly more likely to be culture
positive than cultures in Group IA when circuit cultures
(all components) and internal surfaces of circuits are
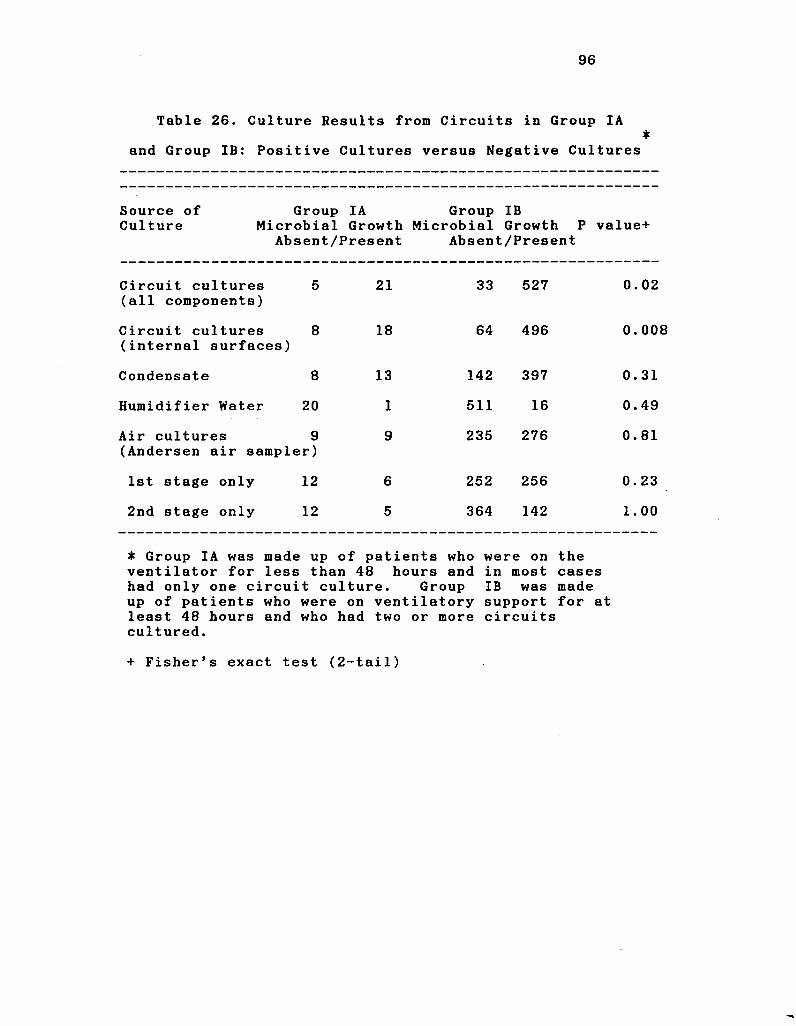
96
Table 26. Culture Results from Circuits in Group IA *
and Group IB: Positive Cultures versus Negative Cultures
Source of Group IA Group IB Culture Microbial Growth Microbial Growth P value+
Absent/Present Absent/Present
Circuit cultures 5 21 33 527 0.02 (all components)
Circuit cultures 8 18 64 496 0.008 (internal surfaces)
Condensate 8 13 142 397 0.31
Humidifier Water 20 1 511 16 0.49
Air cultures 9 9 235 276 0.81 (Andersen air sampler)
1st stage only 12 6 252 256 0.23
2nd stage only 12 5 364 142 1.00
• Group IA was made up of patients who were on the ventilator for less than 48 hours and in most cases had only one circuit culture. Group IB was made up of patients who were on ventilatory support for at least 48 hours and who had two or more circuits cultured.
+ Fisher's exact test (2-tail)
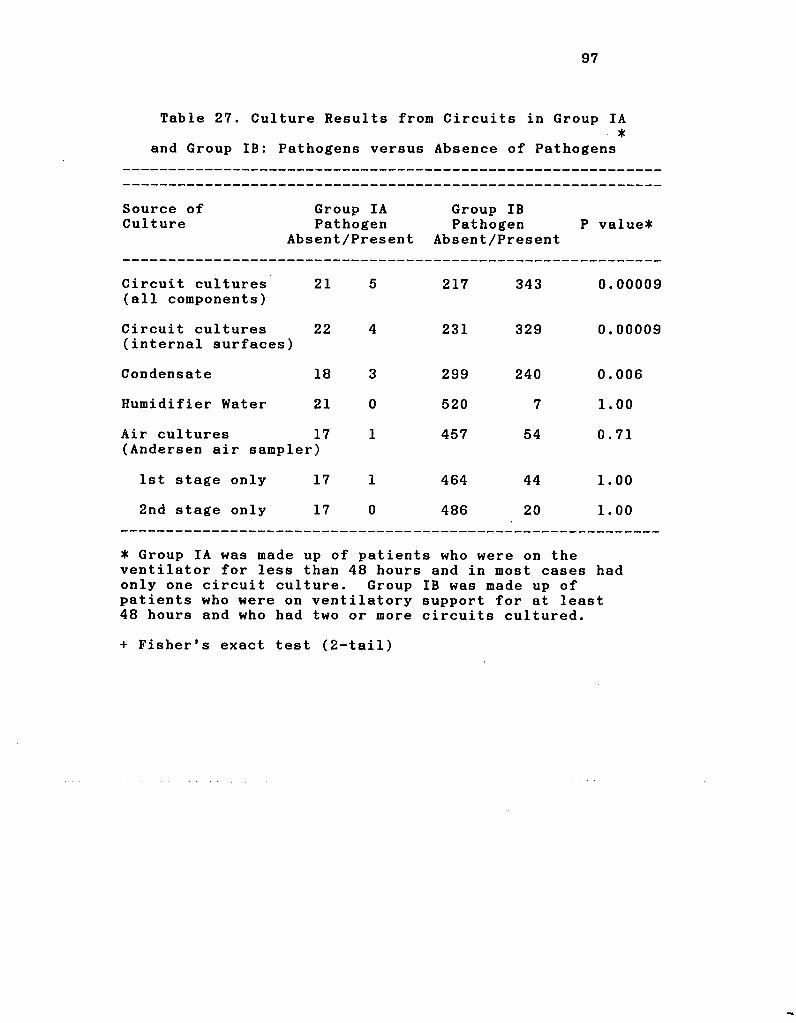
97
Table 27. Culture Results from Circuits in Group IA *
and Group IB: Pathogens versus Absence of Pathogens
Source of Culture
Group IA Group IB Pathogen Pathogen P value#
Absent/Present Absent/Present
Circuit cultures (all components)
21 5 217 343 0. 00009
Circuit cultures (internal surfaces)
22 4 231 329 0. 00009
Condensate 18 3 299 240 0. 006
Humidifier Water 21 0 520 7 1. 00
Air cultures 17 (Andersen air sampler)
1 457 54 0. 71
1st stage only 17 1 464 44 1. 00
2nd stage only 17 0 486 20 1. 00
• Group IA was made up of patients who were on the ventilator for less than 48 hours and in most cases had only one circuit culture. Group IB was made up of patients who were on ventilatory support for at least 48 hours and who had two or more circuits cultured.
+ Fisher's exact test (2-tail)
98
compared. It can be seen in Table 27, where only pathogenic
isolates are compared, that the differences between Group IA
and Group IB are even greater. Also, when cultures of
condensate that yielded pathogens are compared, it can be
seen that cultures from Group IB are significantly more
likely to be positive. Since Group IB circuits were
significantly more likely to be culture positive than Group
IA circuits, only data from Group IB circuits were used for
comparison of circuits changed at 24 hours and circuits
changed at 48 hours.
Microbial Contamination of Circuits Changed at 24 Hours
versus Circuits Changed at 48 Hours. Results of this
analysis are presented in Tables 28 and 29. As can be seen
in Table 28, there were no significant differences in the
results of any cultures taken from circuits in Group I and
Group II. The only significant difference between Group I
and Group II with respect to the presence of pathogens was
in the air cultures. Although there was a significantly
higher percentage of positive air cultures in circuits
changed at 48 hours, the difference for stage 1 cultures was
of borderline significance and the difference between Group
1 and Group II in the stage 2 air cultures was not
significant. These results indicate that there is no
important difference between the results of air cultures
from Group I and Group II. Only viable particles from stage
2 can reach the lower respiratory tract. Since there was no
significant difference in stage 2 cultures, it can be
concluded that changing circuits at 48 hours places the
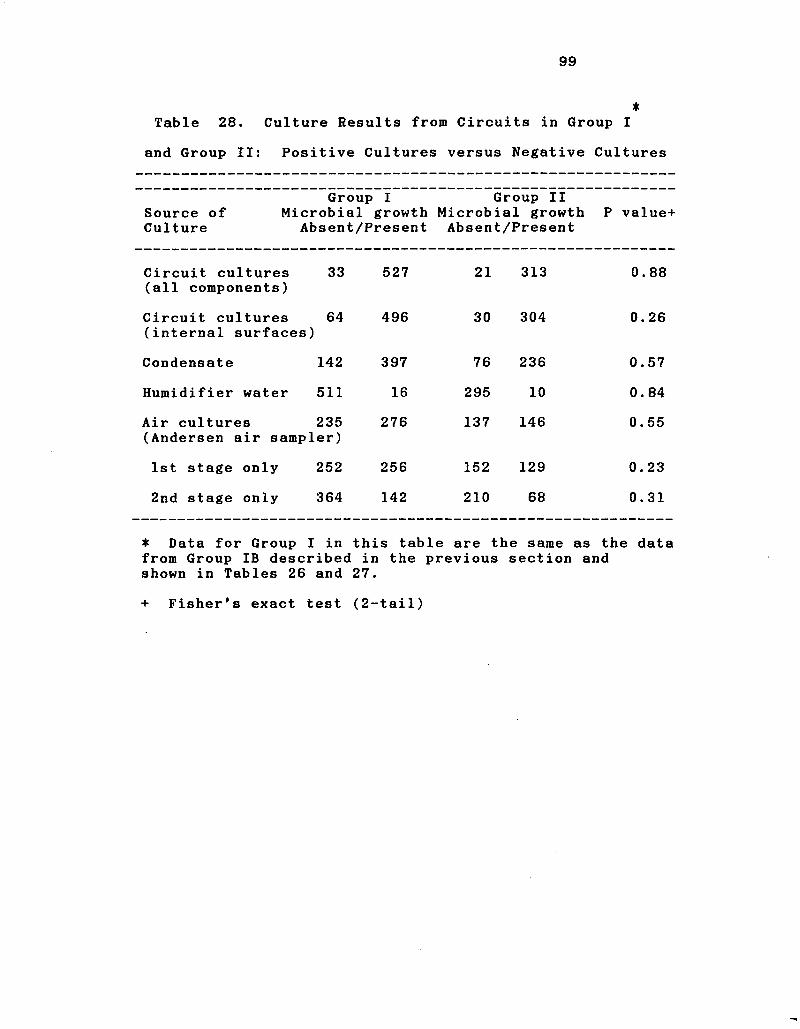
99
* Table 28. Culture Results from Circuits in Group I
and Group II: Positive Cultures versus Negative Cultures
Source of Culture
Group I Microbial growth
Absent/Present
Group II Microbial growth P value+ Absent/Present
Circuit cultures (all components)
33 527 21 313 0. 88
Circuit cultures (internal surfaces)
64 496 30 304 0. 26
Condensate 142 397 76 236 0. 57
Humidifier water 511 16 295 10 0. 84
Air cultures 235 (Andersen air sampler)
276 137 146 0. 55
1st stage only 252 256 152 129 0. 23
2nd stage only 364 142 210 68 0. 31
* Data for Group I in this table are the same as the data from Group IB described in the previous section and shown in Tables 26 and 27.
+ Fisher's exact test (2-tail)
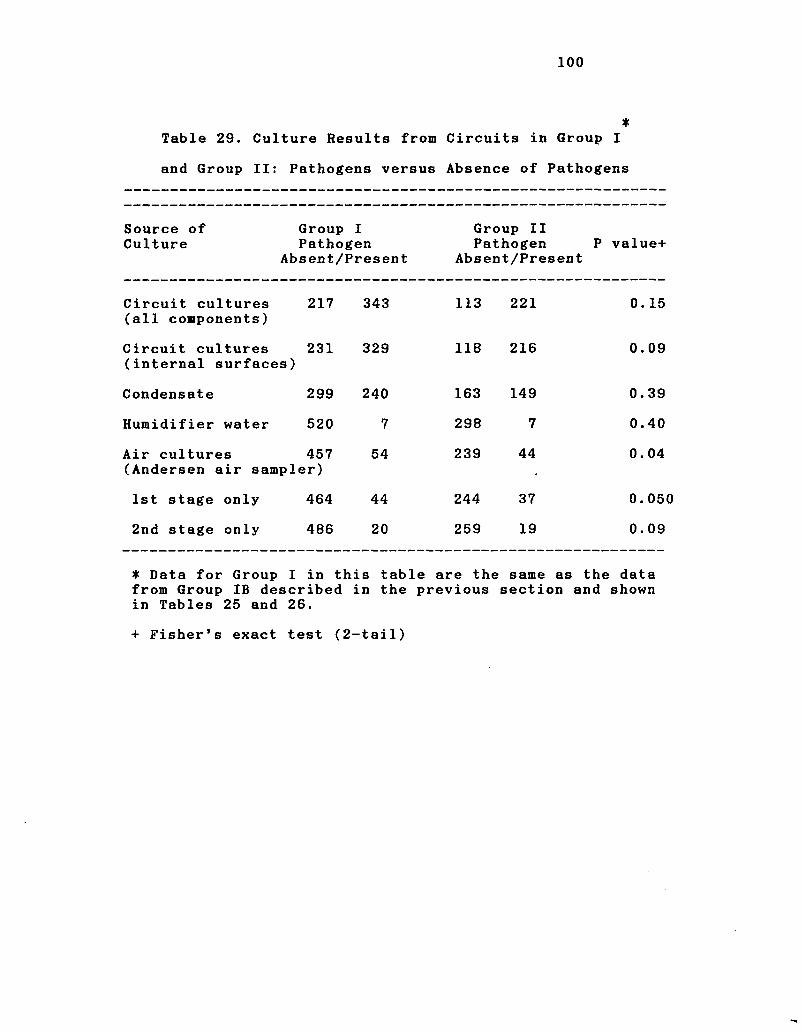
100
* Table 29. Culture Results from Circuits in Group I
and Group II: Pathogens versus Absence of Pathogens
Source of Group I Group II Culture Pathogen Pathogen P value+
Absent/Present Absent/Present
Circuit cultures (all components)
217 343 113 221 0. 15
Circuit cultures (internal surfaces)
231 329 118 216 0.09
Condensate 299 240 163 149 0.39
Humidifier water 520 7 298 7 0.40
Air cultures 457 (Andersen air sampler)
54 239 44
o
o
1st stage only 464 44 244 37 0.05i
2nd stage only 486 20 259 19 0.09
* Data for Group I in this table are the same as the data from Group IB described in the previous section and shown in Tables 25 and 26.
+ Fisher's exact test (2-tail)
101
patient at no greater risk that changing circuits
hours.
DISCUSSION
Thirty-five of 211 patients (16.630 developed pneumonia
during my study. There is very little published data with
which to compare this rate. In the SENIC study, Hooten and
co-workers (41) reported infection rates by level of risk.
From the lowest level of risk, stratum 1, the infection rate
was 0.02% and from the highest level of risk, stratum 9, the
infection rate was 15.3%. In this report, ventilatory
support was not examined as a risk factor. The only other
published study that evaluated patients on ventilatory
support was that of Craven and co-workers (20). Twenty-one
percent of their artificially ventilated patients developed
pneumonia. Thus, the rate of 16.6% in my study was similar
to that of Craven and co-workers.
Although no definitive studies have evaluated
ventilatory support as a risk factor for pneumonia, it would
appear that this type of therapy places persons at high risk
of pneumonia. To date, only one study has examined
ventilatory support as a risk factor. This study, by
Stevens and co-workers (96), was retrospective and there was
difficulty in determining when pneumonia occurred with
respect to when the patient was placed on controlled
ventilation. Although never proven in a prospective,
epidemiologic study, artificial ventilation would appear to
102
103
be an important risk factor for pneumonia since my rate and
that of Craven and co-workers were both higher than the rate
in the highest risk stratum from the CDC SENIC study (41).
More than one half (56%) of the patients developed
tracheobronchitis while on ventilatory support. To my
knowledge, this is the first study to define the rate of
tracheobronchitis in patients on artificial ventilation. It
is unclear as to why patients on respirators have a rate of
tracheobronchitis that is nearly four times that of
pneumonia. It is also unclear as to whether
tracheobronchitis and pneumonia have a similar pathogenesis.
It would be interesting to speculate that tracheobronchitis
is a precursor of pneumonia in ventilated patients. This is
suggested by the observations that tracheobronchitis occurs
at a mean time three days earlier than pneumonia, while the
pathogens isolated from patients with tracheobronchitis are
the same as those isolated from patients with pneumonia.
Changing ventilator circuits at 24 or 48 hours was not
related significantly to occurrence of pneumonia (13* versus
21.1%, respectively, p = 0.14). Whether circuits were
changed at 24 or 48 hours also had no significant impact on
the rate of tracheobronchitis (58.6% versus 52.6%, p =
1 . 0 0 ) .
When patients were randomized to 24 or 48 hour circuit
changes, there were significant differences in two of the 54
characteristics examined. One of these factors was chest
injury. As will be seen below, I found that chest injury
was a risk factor for pneumonia. Patients randomized to 48
104
hour circuit changes were significantly more likely to have
chest injury. This risk factor would tend to increase the
infection rate in Group II. In spite of this increased risk
for Group II patients, there was no significant difference
in infection rates between Group I and Group II. Patients
in Group II also had a significantly higher number of
patients receiving antacids. Although I did not find
antacids to be a risk factor for infection in this
population, duMoulin, Craven and Donowitz (28,20,27) found
that administration of antacids was a risk factor for
pneumonia. Once again, however, in spite of a potentially
higher risk of infection in Group II patients, there was no
significant difference in infection rates between patients
having their circuits changed at 24 hours or 48 hours.
I analyzed the risk factors for pneumonia using two
different approaches. In the first approach, patients with
pneumonia were analyzed versus all other patients without
pneumonia. Because the latter group contained patients with
tracheobronchitis, and therefore would tend to make this
group more like the infected group, I decided that a second
analysis should be carried out in which patients with
pneumonia were compared to patients with no respiratory
infections.
In the first analysis, where patients with pneumonia
were compared with patients without pneumonia, five risk
factors for pneumonia were identified. These five factors
included head injury, chest injury, surgical operation other
105
than cranial, thoracic or abdominal, being hospitalized in
the neurosciences ICU, and duration of ventilation. Having
received antibiotics and having been intubated by the
nasotracheal route appeared to protect against development
of pneumonia, and absence of each of these factors could be
considered a risk factor.
The only published prospective study in patients on
controlled ventilation is that by Craven and co-workers
(21). The only risk factors for pneumonia in patients on
controlled ventilation, identified both by me and Craven and
co-workers, were head injury and not having received
antibiotics during assisted ventilation. Four other
variables that I identified as risk factors, including chest
injury, absence of a nasotracheal tube, location in the
neurosiences ICU, and other types of surgery, were not
examined by Craven and co-workers nor, to my knowledge, in
any other published studies.
As in the study of Craven and co-workers, I also
examined intracranial pressure monitoring, craniotomy,
treatment with cimetidine, timing of circuit changes,
Winter-Fall season of ventilation (September 21-March 21),
and coma. I did not find any of these factors to be risk
factors for pneumonia. Failure to identify coma as a risk
factor in my study may have been due to the very low numbers
of patients with coma when head injury patients were
excluded. Except for ventilation in the Winter-Fall season,
I am unable to determine why Craven and co-workers showed
these latter characteristics to be risk factors and I did
106
not. With respect to ventilation in the Winter-Fall season,
this may have been a risk factor for patients at Boston City
Hospital where there may have been a higher proportion of
indigent patients and where the winters were more severe.
Stepwise logistic regression analysis of my data
revealed that the most powerful predictors of ventilator-
associated peumonia were duration of ventilation, never
having reveived an antibiotic and having had a chest injury.
These results of multivariate analysis are very different
from those of Craven and co-workers. However, the only
variable common to the models for logistic regression in my
study and that of Craven and co-workers was head injury.
Although the latter authors found that not having received
an antibiotic was a risk factor for pneumonia by univariate
analysis, they did not include this variable in their model
for logistic regression analysis. Unlike Craven and
co-workers, I found that duration of ventilation, not having
reveived an antibiotic and presence of chest injury were
more powerful predictors of pneumonia in patients on
controlled ventilation than presence of head injury.
When patients with pneumonia were analysed versus
patients with no infections, risk factors identified
included head injury, treatment with pancuronium, presence
of a tracheostomy, presence of a ventriculostomy, a
prolonged duration of ventilation, and hospitalization in
the neurosciences ICU. Again, treatment with antibiotics
and presence of a nasotracheal tube were protective against
107
pneumonia. If the absence of the latter two factors are
considered risk factors, then eight risk factors were
identified in this analysis. In the first analysis, chest
injury and other types of surgery were risk factors for
infection, but these factors were not associated with a
significantly increased risk of infection in the second
analysis. It is unclear why other types of surgery dropped
out as a risk factor. Chest injury could no longer be shown
to be a risk factor for pneumonia, because when the
tracheobronchitis patients were removed from the patients
without pneumonia, insufficient numbers of patients remained
in that group to accurately access chest injury as a risk
factor. In this analysis, treatment with pancuronium,
presence of a tracheostomy and presence of a ventriculostomy
were identified as risk factors, because removal of
tracheobronchitis patients from the group of patients
without pneumonia heightened the differences between the
groups with and without pneumonia. As in the study of
.Craven and co-workers (17), ventriculostomy was identified
as a risk factor for pneumonia.
Analysis of patients with pneumonia versus patients
with no infection appeared to be more informative than
analysis of patients with pneumonia versus patients with no
pneumonia. While one important risk factor, chest injury,
was lost in the second analysis, three new risk factors were
identified. However, multivariate analysis of this data
once again showed duration of ventilation, and absence of
treatment with antibiotics to be the most powerful
108
predictors of ventilator-associated pneumonia.
In the third analysis, patients with tracheobronchitis
were compared with patients without infection. Only three
risk factors could be identified for tracheobronchitis.
These included having had any type of surgical operation,
having had cranial surgery and having had a prolonged
duration of ventilation. Thus, only prolonged duration of
ventilation was a risk factor for both pneumonia and
tracheobronchitis. I am unable to explain why cranial
surgery and surgical operations are risk factors for
tracheobronchitis. Cranial surgery may have been
interrelated with the effects of ventriculostomy and
administration of pancuronium, both of which had a
borderline significant relationship with tracheobronchitis.
Patients who had cranial operations frequently had
ventriculostomies and were frequently treated with
pancuronium. However, multivariate analysis showed that
only duration of ventilation was a strong independent
predictor for the occurrence of tracheobronchitis.
Sixty-three percent of cultures from breathing circuits
were positive for pathogens. The culture positivity rate in
my study was higher than that observed by Craven and co
workers (17) of 45.5%. Craven and co-workers cultured only
effluent gases, water from the humidifier and internal
surfaces of the tubing with a broth washout technique. In
addition to these cultures, I cultured condensate drained
from the tubing, and internal surfaces of the ends of the
109
tubing and Y-connector using swabs.
There are few data in the literature on microorganisms
that contaminate ventilator circuits. The only report with
which to compare my data is that of Malecka-Griggs and
Reinhardt (59). The only microorganism isolated by these
authors that was not isolated from circuits in my study was
El&vpbacter ium nieningosepticum. On the other hand, I
isolated eleven species not recovered by these authors.
This may have been due to the much greater number of
circuits cultured in my study.
Fifty-four percent of Group I air cultures and 51.6* of
Group II air cultures were positive. These rates are nearly
twice the rates of 30* and 32% from Group I and Group II
patients of Craven and co-workers. My study and that of
Craven and co-workers are not strictly comparable, because
the ventilators were set at different flow rates. Further,
my data were all generated using the Andersen air sampler,
and the study of Craven and co-workers used three different
methods including the Andersen air sampler, the Aerotest air
sampler, and the tube-broth method for culturing
inspiratory-phase gas. Twenty-four percent of the Group I
air cultures and 37* of the Group II air cultures in my
study yielded pathogenic organisms. To my knowledge, my
study is the first to differentiate pathogenic and non
pathogenic organisms from air cultures. It would appear
that only a small number of the pathogenic microorganisms
present in the circuits could be aerosolized, because the
only pathogens aerosolized were the ones that were present
110
the greatest number of times in the circuits. I found that
two-thirds of the pathogenic species present in air cultures
were also present in the sputum of patients. aeruginosa
was the most frequently isolated pathogen from air cultures
and, interestingly, was the pathogen most commonly recovered
from the sputum of patients with pneumonia. Craven and co
workers also observed that pathogenic species recovered from
inspiratory-phase-gas were also frequently isolated from the
sputum of patients. The studies of Lareau and Craven and
co-workers (53,17) both suggested that these pathogens
frequently appear in sputum before they appear in
inspiratory-phase-gas cultures.
In this study, patients who were randomized to 24 hour
circuit changes (Group I), but who were on the ventilator
for less than two circuit changes, were not used for
comparison of infection rates between Group I and Group II
patients. These patients were excluded from analysis of
Group I and Group II infection rates, because they would
have all been exposed to the ventilator for less time than
any person randomized to 48 hour circuit changes. The
results of the analysis of patients randomized to 24 hour
circuit changes where cultures from the group who were on
the ventilator for less than two circuit changes (Group IA-
Tables 26 and 27) were compared with the cultures from the
group who were on ventilation for two or more changes (Group
IB-Tables 26 and 27), showed several significant differences
between these two groups. Thus, when positive versus
Ill
negative cultures were examined (Table 26), it was seen that
circuits in general and internal surfaces of circuits were
significantly more likely to be positive in Group IB than in
Group IA. Similarly, when only recovery of pathogens was
examined, it could be seen that cultures of circuits in
general, internal surfaces of circuits, and condensate were
significantly more likely to have been positive in Group IB
than in Goup IA (Table 27). The observation that the
circuits in Group I that were used at the beginning of
ventilation, and in many instances early in hospitalization,
were significantly less likely to be culture positive than
those circuits changed at 24 hours later in the course of
controlled ventilation supported the observations of others
(53,20) that circuits were frequently contaminated by the
patients themselves. Thus, it would appear that the longer
patients were on the ventilator and in the hospital, the
more likely they would have been colonized with nosocomial
pathogens and the more likely they themselves would have
contaminated the circuits used later . in the course of
ventilation. These data also supported the exclusion of
patients from Group I who were randomized to 24 hour circuit
changes but who were on ventilation for less than two
circuit changes prior to the comparison of infection rates
in Group I and Group II. Patients who were randomized to
the 24 hour circuit changes and who were on the ventilator
for less than two circuit changes would have been likely to
skew the infection rate in Group I, because they represented
a subgroup less likely to be colonized with pathogens and
112
less likely to develop HAP.
The results of the cultures of Group I and Group II
circuits supported the observation from the epidemiologic
portion of the study that there was no difference in
infection rates between patients whose circuits were changed
at 24 hours and patients whose circuits were changed at 48
hours. When one examines the data from Table 28 (Positive
Cultures versus Negative Cultures) and the data from Table
29 (Pathogens versus Absence of Pathogens), it can be seen
that there were only two significant differences in cultures
from Group I and Group II. Pathogens were significantly
more likely to be isolated from the air cultures of patients
in Group II. This difference was likely due to the
significantly higher percentage of stage 1 air cultures in
patients in Gr up II that were positive. However, the stage
1 cultures are not indicative of a significantly greater
risk of infection in Group II patients. First, stage 1
cultures were less precise than stage 2 cultures, because
15-20% were contaminated by condensate. Second, particles
carrying microorganisms that are trapped in stage 1 are too
large to reach the lower respiratory tract. When culture
data from stage 2, the only stage that measures numbers of
respirable particles, are considered, it can be seen that
there is no significant difference between Group I and Group
II. The microbiological data from this study confirm the
observation of Craven and co-workers (20).
In summary, the epidemiological and microbiological
113
data from this study corroborates the studies of Craven and
co-workers (17,20). However, I identified risk factors for
ventilator-associated pneumonia that have not been reported
previously in the literature. These included duration of
ventilation, the most powerful predictor for occurrence of
pneumonia and tracheobronchitis, presence of chest injury,
and administration of pancuronium. Although previously
reported by Craven and co-workers (20), not having received
antibiotics was the second most powerful predictor of
pneumonia after duration when the data were analyzed by
logistic regression analysis.

List of References
114
115
LIST OF REFERENCES
1. Ahlgren EW,Chapel JF,Dorn GL. Pseudomonas aeruginosa infection potential of oxygen humidifier devices. Resp Care 1977;22:383-385.
2. American Society for Microbiology. Lennette EH, Balows A, Hausler WJ Jr, Shadomy HJ,eds. Manual of Clinical Microbiology. Washington,D.C., 1985.
3. Andersen AA. New sampler for the collection,sizing and enumeration of viable airborne particles. J Bacteriol 1957;76:471-484.
4. Andrews CP, Coalson JJ, Smith JD, Johanson WG.Diagnosis of nosocomial bacterial pneumonia in acute,diffuse lung injury. Chest 1981;80:254-258.
5. Atherton ST, White DJ. Stomach as a source of bacteria colonizing respiratory tract during artificial ventilation. Lancet 1978;2;968-969.
6. Bartlett JG. Diagnostic accuracy of transtracheal aspiration bacteriologic studies. Am Rev Respir Dis 1977;115:777-782.
7. Brunn JN. Post-operative wound infection. Predisposing factors and the effect of a reduction in the dissemination of Staphylococci. Acta Med Scand (Suppl) 1970;514:1-89.
8. Bryant LR, Trinkle JK, Mobin-Uddin K, Baker J, Griffin WO. Bacterial colonization profile with tracheal intubation and mechanical ventilation. Arch Surg 1972;104:647-651.
9. Buxton AE, Anderson RL, Werdegar D, Atlas E. Nosocomial respiratory tract infection and colonization with Acinetobacter calcoaceticus: Epidemiologic Characteristics. Amer J Med 1978;65:507-513.
10. Cartwright RY, Hargrave PR. Pseudomonas in ventilators (Letter). Lancet 1970;1:40.
11. Centers for Disease Control. Outline for surveillance and control of nosocomial infections. Atlanta,1972.
12. Centers for Disease Control. National nosocomial infections study report, annual summary 1976. Atlanta,U.S.Government Printing Office,1978.
13. Centers for Disease Control. National nosocomial infections study report, annual summary 1983. MMWR 1985;
116
33(no. 255):9SS-2SS.
14. Centers for Disease Control. National nosocomial infections study report, annual summary 1984. MMWR 1986; 35:17SS-29SS.
15. Cohen J. Statistical power analysis for the behavioral sciences. New York: Wiley Publications. 1982.
16. Crane LR, Lerner AM. Gram-negative pneumonia in hospitalized patients. Postgrad Med 1975;58:85-92.
17. Craven DE,Connolly MG,Lichtenberg DA.Primeau PJ, McCabe WR. Contamination of mechanical ventilators with tubing changes every 24 or 48 hours. N Engl J Med 1982; 306:1505-1509.
18. Craven DE,Goularte TA, Make BJ. Contaminated condensate in mechanical ventilator circuits. Am Rev Respir Dis 1984;129:625-628.
19. Craven DE, Connolly MG, Goularte TA. Results of a survey of ventilator circuit practices in the United States. Infect Control 1984; 5:353-355.
20. Craven DE, Lichtenberg DA, Goularte TA, Make BJ, McCabe WR. Contaminated medication nebulizers in mechanical ventilator circuits: Source of bacterial aerosols. Am J Med 1984; 77:834-838.
21. Craven DE,Kunches LM,Kilinsky V,Lichtenberg DA,Make BJ, McCabe WR. Risk factors for pneumonia and fatality in patients receiving continuous mechanical ventilation. Am Rev Resp Dis 1986;33:792-796.
22. Cross AS, Roup B. Role of respiratory assistance devices in endemic nosocomial pneumonia. Am J Med 1981; 70:681-685.
23. Davidson M, Tempest B, Palmer DL. Bacteriologic diagnosis of acute pneumonia: comparison of sputum, transtracheal aspirates,and lung aspirates. JAMA 1976;235: 158-163.
24. Demers RR. Complications of endotracheal suctioning procedures. Resp Care 1982;27:453-457.
25. Dixon RE. Nosocomial respiratory infections. Infect Control 1983;4: 376-381.
26. Dixon RE. Economic costs of respiratory tract infections in the United States. Am J Med 1985; 78 (Suppl 6B):45-51.
27. Donowitz LG, Page MC, Mileur BL, Guenthner SH. Alter
117
ation of normal gastric flora in critical care patients receiving antacid and cimetidine therapy. Infect Control 1986;7:23-26.
28. duMoulin GC, Paterson DG, Hedley-Whyte J, Lisbon A. Aspiration of gastric bacteria in antacid-treated patients: a frequent cause of postoperative colonisation of the airway. Lancet 1982; 1:242-245.
29. Edwards PR, Ewing WH. Identification of Entero-bacteriaceae (3rd ed.). Minneapolis: Burgess,1972.
30. Garibaldi RA,Britt MR, Coleman ML, Reading JC, Pace NL. Risk factors for postoperative pneumonia. Am J Med 1981;70:677-680.
31. Garibaldi RA, Britt MR, Webster C, Pace NL. Failure of bacterial filters to reduce the incidence of pneumonia after inhalation anesthesia. Anesth 1981;54:364-368.
32. Gibbons RJ, vanHoute J. Selective bacterial adherence to oral epithelial surfaces and its role as an ecological determinant. Infec Immun 1971;3:567-573.
33. Goularte TA, Manning M, Craven DE. Bacterial colonization in humidifying cascade reservoirs after 24 and 48 hours of continuous mechanical ventilation. Infect Control 1987;8:200-203.
34. Green GM, Kass EH. The role of the alveolar macrophage in the clearance of bacteria from the lung. J Exp Med 1964;119:167-175.
35. Grieble HG, Colton R, Bird TJ, Toigi A, Griffith LG. Fine particle humidifiers: source of Pseudomonas §§raf>iS2§§ infections in a respiratory disease unit. N Eng J Med 1970;282:531-535.
36. Gross PA, Neu HC, Aswapokee P, Van Antwerpen C, Aswapokee N. Deaths from nosocomial infections: experience in a university hospital and a community hospital. Am J Med 1980; 68:219-223.
37. Haley RW,Hooten TM, Culver DH, Stanley RC, Emori TG, Hardison CD, Quade D,Schachtman RH,Schaberg DR.Shah BV, Schatz GD. Nosocomial infections in U.S. hospitals,1975-1976: estimated frequency by selected characteristics of patients. Am J Med 1981, 70: 947-959.
38. Haley RW. Managing hospital infection control for cost effectiveness: a strategy for reducing infectious complications. Chicago: Am Hosp Publishing, 1986.
39. Hemming VG,Overall JC Jr, Britt MR. Nosocomial
40
41
42
43
44
45
46
47
48
49
50
118
infections in a newborn intensive-care unit: results of forty-one months of surveillance. N Eng J Med 1976;294:1310-1316.
Hooten TM, Haley RW, Culver DH. A method for classifying patients according to the nosocomial infection risks associated with diagnoses and surgical procedures. Am J Epidemiol 1980;111:556-573.
Hooten TM, Haley RW, Culver DH, White JW, Morgan WM, Carroll RJ. The joint associations of multiple risk factors with the occurrence of nosocomial infection. Am J Med 1981;70:960-970.
Hopewell PC. Critical care medicine: Adult Respiratory Distress Syndrome. In: Wyngaarden JB, Smith LH, eds. Cecil textbook of medicine.Philadelphia: W.B. Saunders. 1985: 472.
Huxley EJ, Viroslav J,Gray WR, Pierce AK. Pharyngeal aspiration in normal adults and patients with depressed consciousness. Amer J Med 1978;64:564-568.
Im SWK.Fung JPH, So Sy, Yu Dye. Unusual dissemination of pseudomonads by ventilators. Anaesth 1982;37:1074-1077.
Johanson WG Jr, Pierce AK, Sanford JP. Changing pharyngeal bacterial flora in hospitalized patients: emergence of gram negative bacilli. N Eng J Med 1969;281:1137-1140.
Johanson WG Jr, Pierce AK, Sanford JP, Thomas GD. Nosocomial respiratory infections with gram-negative bacilli: the significance of colonization of the respiratory tract. Ann Intern Med 1972;77: 701-706.
Johanson WG Jr,Woods DE, Chaudhuri T. Association of respiratory tract colonization with adherence of gram-negative bacilli to epithelial cells. J Infec Dis 1979;139:667-673.
Johanson WG Jr, Higuchi JH, Chaudhuri TR, Woods DE. Bacterial adherence to epithelial cells in bacillary colonization of the respiratory tract. Am Rev Respir Dis 1980;121:55-63.
Johanson WG Jr. Infectious complications of respiratory therapy. Respiratory Care 1982;27:445-452.
Kelsen SG. The role of airborne bacteria in the contamination of fine particle nebulizers and the development of nosocomial pneumonia. Ann NY Acad Sci 1980;353:218-229.
119
51. LaForce F, Hopkins J, Trow R, Wang WLL. Human oral defenses against gram-negative rods. Am Rev Resp Dis 1976;114:929-935.
52. LaForce FM. Hospital-acquired pneumonias: epidemiologic summary and clinical approach.In Pennington JE,ed. Respiratory infections: diagnosis and management. New York: Raven Press. New York 1983:135-142.
53. Lareau SC, Ryan KJ, Diener CF. The relationship between frequency of ventilator circuit changes and infectious hazard. Am Rev Resp Dis 1978;118: 493-496.
54. lees AW, McNaught W. Bacteriology of lower-respiratory tract secretions, sputums, and upper respiratory tract secretions in normals and chronic bronchitics. Lancet 1959; ii:1112.
55. Levison ME. Pathogenesis of pneumonia. In Levison ME,ed. The pneumonias: clinical approaches to infectious diseases of the lower respiratory tract. Boston: John Wright-PSG Inc. 1984:1-7.
56. Mackowiak PA, Martin RM, Jones SR, Smith JW. Pharyngeal colonization by gram-negative bacilli in aspiration-prone persons.Arch Intern Med 1978;138:1224-1227.
57. MacPherson CR. Oxygen therapy- an unsuspected source of hospital infections? JAMA 1958; 167:1083-1086.
58. Macrae W, Wallace P. Aspiration around high-volume,low-pressure endotracheal cuff. Br Med J 1981; 283:1220-1221.
59. Malecka-Griggs B, Reinhardt DJ. Fundamentals of nosocomial infections associated with respiratory therapy. New York:Projects in Health,1976.
60. Malecka-Griggs B. Microbiological assessment of 24- and 48-hour changes and management of semiclosed circuits from ventilators in a neonatal intensive care unit. J Clin Micro 1986;23:322-328.
61. Mehta S. The risk of aspiration in presence of cuffed endotracheal tubes. Br J Anaesth 1972; 44:601-605.
62. Mertz JJ, Scharer L, McClement JH. A hospital outbreak Klebsiella pneumonia from inhalation therapy with
contaminated aerosol solutions. Am Rev Respir Dis 1966; 94:454-460.
63. Meyers CE, James HA, Zippin C. The recovery of aerosolized bacteria from humans: I.Effects of varying exposure, sampling times and subject variability. Arch Environ Hlth 1961; 2:384-390.
120
64. Mitchell RI. Retention of aerosol particles in the respiratory tract. Am Rev Respir Dis 1960;82:627-639.
65. Morris AH. Nebulizer contamination in a burn unit. Am Rev Respir Dis 1973;107:802-808.
66. Murphey SA. Host defenses in the respiratory tract. In: Levison ME, ed. The pneumonias; clinical approaches to infectious diseases of the lower respiratory tract. Boston: John Wright-PSG Inc. 1984: 8-22.
67. Murray JF. Respiratory failure. In: Wyngaarden JB, Smith LH,eds. Cecil textbook of medicine. Philadelphia: W.B.Saunders. 1985: 454-463.
68. National Academy of Sciences-National Research Council: Post-operative wound infections: the influence of ultraviolet irradiation of the operating room and of various other factors. Ann Surg 1964;160 (Suppl.2):1-32.
69. Niederman MS, Merrill WW, Ferranti RD, Pagano KM, Palmer LB, Reynolds HY. Nutritional status and bacterial binding in the lower respiratory tract in patients with chronic tracheostomy. Ann Intern Med 1984;100: 795-800.
70. Phillips I, Spencer G. Pseudomonas aeruginosa cross-infection due to contaminated respiratory apparatus. Lancet December 25,1965;1325-1327.
71. Pierce AK, Sanford JP, Thomas GD, Leonard JS. Long-term evaluation of decontamination of inhalation therapy equipment and the occurrence of necrotizing pneumonia. N Engl J Med 1970;282:528-530.
72. Pierce AK, Sanford JP. Aerobic gram-negative bacillary pneumonias. Am Rev Respir Dis 1974;110:647-658.
73. Potter RT, Rotman F, Fernandez F, McNeill TM, Chamberlain JM. The bacteriology of the lower respiratory tract: bronchoscopic study of 100 clinical cases. Am Rev Respir Dis 1968; 97:1051-1061.
74. Quinn LH, Meyer 00. The relationship of sinusitis and bronchiectasis. Arch Otolaryngol 1929;10:152.
75. Raman AS, Swinburne AJ, Fedullo AJ. Pneumococcal adherence to the buccal epithelial cells of cigarette smokers. Chest 1983;83:23-26.
76. Redding PJ, McWalter PW. Pseudomonas fluorescens cross-infection due to contaminated humidifier water. Brit Med J 1980;281:275.
77. Reinarz JA, Pierce AK, Mays BB, Sanford JP. The
121
potential role of inhalation therapy equipment in nosocomial pulmonary infection. J Clin Invest 1965; 44:831-839.
78. Reynolds HY. Normal and defective respiratory host defenses. In: Penington JE,ed. Respiratory infections: diagnosis and management. New York: Raven Press. 1983: 1-24.
79. Rhame FS, Streifel A, McComb C, Boyle M. Bubbling humidifiers produce microaerosols which can carry bacteria. Infect Control 1986;7:403-407.
0
80. Rhoades ER, Ringrose R, Mohr JA, Brooks L, McKown BA, Felton F. Contamination of ultrasonic nebulization equipment with gram-negative bacteria. Arch Intern Med 1971;127:228-232.
81. Ringrose RE, Mcknown B, Felton FG, Barclay BO, Muchmore HG, Rhoades ER. A hospital outbreak of Serratia !?§rcescens associated with ultrasonic nebulizers. Ann Intern Med 1968;69:719-729.
82. Rose HD, Babcock JB. Colonization of intensive care unit patients with gram-negative bacilli. Am J Epi-dem 1975;101:495-501.
83. SAS users guide,5th ed. Cary,North Carolina: SAS Institute Inc. 1985.
84. Sanders CV.Luby JP, Johanson WG, Barnett JA, Sanford JP. Serratia marcescens infections from inhalation therapy medications: nosocomial outbreak. Ann Intern Med 1970;73:15-21.
85. Sanderson PJ. The sources of pneumonia in the ITU patients.Infect Control 1986;7:104-106.
86. Sanford JP. Lower respiratory tract infections. In: Bennett JV, Brachman PS. eds. Hospital infections. Boston: Little,Brown,1986;255-286,385-404.
87. Sawyer WD. Airborne infection. Milit Med 1963;128:90-93.
88. Schulze T, Edmondson EB, Pierce AK, Sanford JP. Studies of a new humidifying device as a potential source of bacterial aerosols. Am Rev Respir Dis 1967;96: 517-519.
89. Schwartz SN, Dowling JN, Benkovic C, DeQuitter-Buchanan M, Prostko T, Yee RB. Sources of gram-negative bacilli colonizing the tracheae of intubated patients. J Infect Dis 1978; 138:227-231.
90. Simmons BP, Wong ES. CDC guidelines for prevention and
122
control of nosocomial infections: guidelines for prevention of nosocomial pneumonia. Infect Control 1983;11:230-243.
91. Sobel JD. Pulmonary infections in the immunocompromised host. In: Levison ME,ed. The pneumonias: clinical approaches to infectious diseases of the lower respiratory tract. Boston: John Wright-PSG Inc. 1984: 206-241.
92. Spray SB, Zuidema GD, Cameron JL. Aspiration pneumonia: Incidence of aspiration with endotracheal tubes. Am J Surg 1976;131:701-703.
93. Stamm WE, Martin SM, Bennett JV. Epidemiology of nosocomial infections due to gram-negative bacilli: aspects relevant to development and use of vaccines. J Infect Dis 1977;136:S151-S160.
94. Stamm WE. Infections related to medical devices. Annals Intern Med 1978;89(Part 2):764-769.
95. Stevens DS, McGee ZA. Attachment of Neisseria meningitidis to human mucosal surfaces: influence of pili and type of receptor cell. J Infect Dis 1981;143:525-532.
96. Stevens RM, Teres D, Skillman JJ, Feingold DS. Pneumonia in an intensive care unit. Arch Intern Med 1974;134: 1 0 6 - 1 1 1 .
97. Tenney JH, Hopkins JA, Wang WLL, LaForce FM. Pneumonia and pharyngeal colonization in a medical intensive care unit,1976,unpublished study.
98. Tillotson JR, Finland M. Bacterial colonization and clinical superinfection of the respiratory tract complicating antibiotic treatment of pneumonia. J Infect Dis 1969;119: 597-624.
99. Valenti WM.Trudell RG, Bentley DW. Factors predisposing to oropharyngeal colonization with gram-negative bacilli in the aged. N Eng J Med 1978;298:1108-1111.
100.Veazey JM. Hospital acquired pneumonia. In: Wenzel RP,ed. Handbook of hospital acquired infections. Boca Raton, Florida: CRC Press, Inc. 1981: 341-370.
101.Wenzel RP. Cost of hospital acquired infections. In: Wenzel RP,ed. Handbook of hospital acquired infections. Boca Raton, Florida: CRC Press, Inc. 1981:6.
102.Williams RC, Gibbons J. Inhibition of bacterial adherence by secretory immunoglobulin A: a mechanism of antigen disposal. Science 1972;177:697-699.
123
103.Winfield JB, Sande MA, Gwaltney JM Jr. Aspiration during sleep(Letter). JAMA 1973;223:1288.
104.Woods DE. Bacterial colonization of the respiratory tract: clinical significance. In Penington JE,ed. Respiratory infections : diagnosis and management. New York: Raven Press. 1983: 25-30.

Appendix
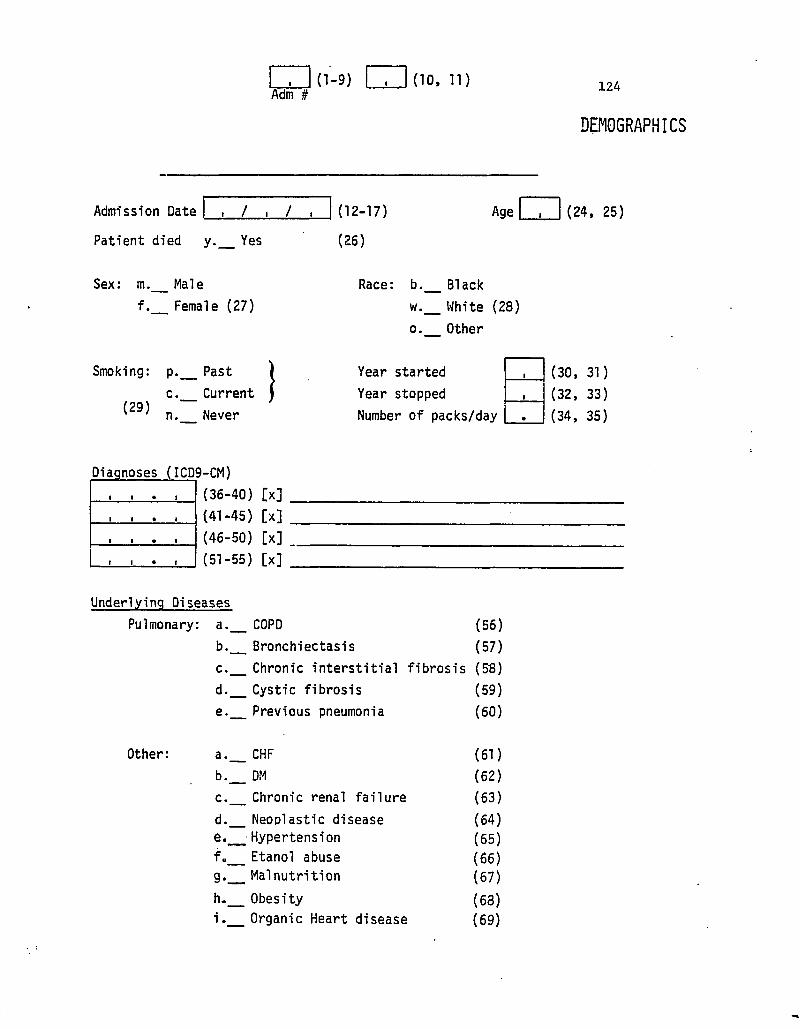
(1-9) LLJ O O , 11) 124 Adm #
DEMOGRAPHICS
Admission Date _
Patient died y Yes
(12-17)
(26)
Age (24, 25)
Sex: m. Male
f._ Female (27)
Smoking: p. Past
c. Current
n. Never (29)
Race: b. Black
w. White (28)
o. Other
Year started
Year stopped
Number of packs/day
(30, 31)
(32, 33)
(34, 35)
Diagnoses (ICD9-CM)
(36-40) [x] _
(41-45) [x] _
(46-50) [x]
(51-55) [x] _
Underlying Diseases
Pulmonary: a. _ COPD (56)
b . Bronchiectasis (57)
c . Chronic interstitial fibrosis (58)
d . Cystic fibrosis
e . Previous pneumonia
Other: a. CHF
b . DM
c . Chronic renal failure
d . Neoplastic disease e . Hypertension
f . Etanol abuse
g . Malnutrition
h . Obesity
i. Organic Heart disease
(59)
(60)
( 6 1 )
( 6 2 )
(63)
(64)
(65)
(66)
(67)
(63)
(69)
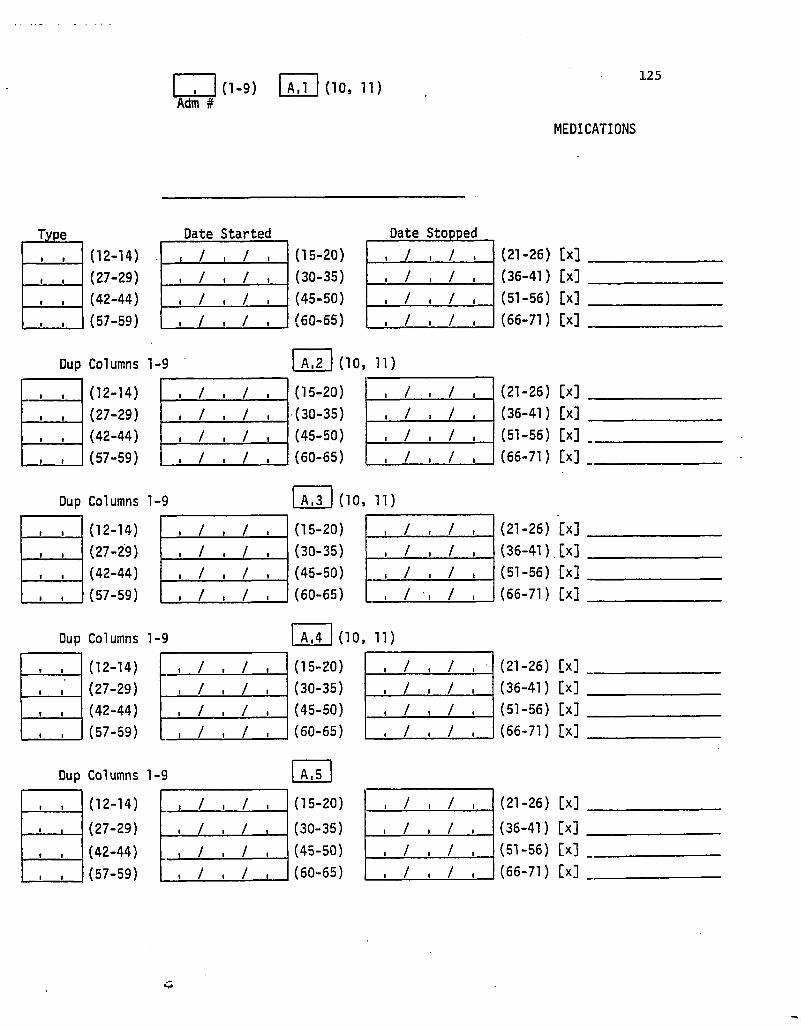
I , 1(1-9) 1 A.l I (10, 11) Adm #
125
MEDICATIONS
Type Date Started
( 1 (12-14) , / , / , 1 1 (27-29) , / , / , r i (42-44) , / , / , t i (57-59)
Dup Columns 1-9
1 I (12-14) , / , / . 1 1 (27-29) , / , / , • t (42-44)
I 1 (57-59)
Dup Columns 1-9
t 1 (12-14)
1 1 (27-29) , 1 , 1 ,
t I (42-44) , 1 , 1 ,
1 f (57-59) , 1 , 1 ,
Dup Columns 1-9
» 1 (12-14) , 1 , 1 ,
1 I (27-29) , 1 , 1 ,
t 1 (42-44) , 1 , 1 ,
1 | (57-59) , 1 , 1 ,
Dup Columns 1-9
I 1 (12-14) , 1 , 1 ,
' » (27-29) , 1 , 1 ,
f I (42-44) , 1 , 1 ,
1 I (57-59) , 1 , 1 ,
(15-20)
(30-35)
(45-50)
(60-65)
(15-20)
(30-35)
(45-50)
(60-65)
(15-20)
(30-35)
(45-50)
(60-65)
Date Stopped
(15-20)
(30-35)
(45-50)
(60-65)
A,5 I
(15-20)
(30-35)
(45-50)
(60-65)
, 1 , 1 , (21-26) [x]
, 1 , 1 , (36-41) [x]
, 1 , 1 , (51-56) [x]
, 1 , 1 , (66-71) [x]
, ID
, 1 , 1 , (21-26) [x]
, 1 , 1 , (36-41) [x]
, 1 , 1 , (51-56) [x]
, 1 , 1 , (66-71) [x]
. ID
, 1 , 1 , (21-26) [x]
, 1 , 1 , (36-41).[x]
, 1 , 1 , (51-56) [x]
, 1 , 1 , (66-71) [x]
, ID
, 1 , 1 , (21-26) [x]
, 1 , 1 , (36-41) [x]
, 1 , 1 , (51-56) [x]
, 1 , 1 , (66-71) [x]
, 1 , 1 , (21-26) [x]
, 1 , 1 , (36-41) [x]
, 1 , 1 , (51-56) [x]
, 1 , 1 , (66-71) [x]
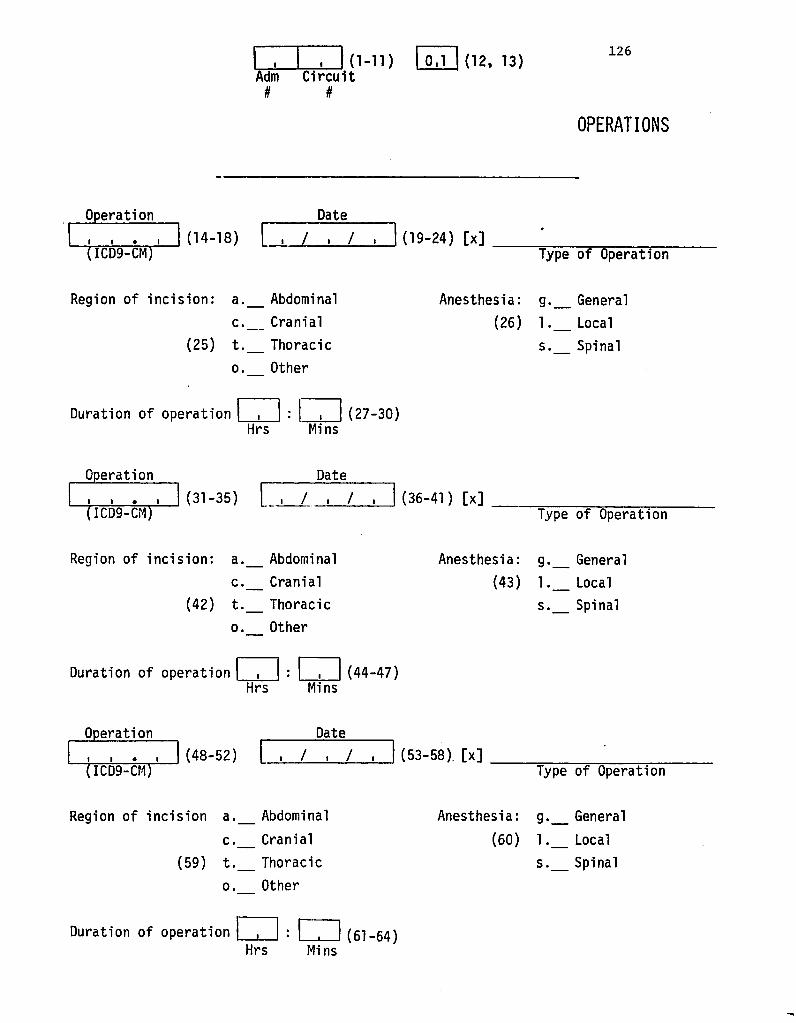
Adm Circuit # #
(1-11) I 0,1 I (12, 13) 126
OPERATIONS
Operation Date
(ICD9-CM) (14-18) 1 , 1 , 1 (19-24) [x]
Type of Operation
Region of incision: a.
c.
(25) t.
Abdominal
Cranial
Thoracic
Other
Anesthesia: g. General
(26) l._ Local
s. Spinal
Duration of operation Hrs Mins
(27-30)
Operation Date
(31-35) 1 , / , / , 1(36-41 ) [xl (ICD9-CM) Type of Operation
Region of incision: a.
c.
(42) t.
Abdominal
Cranial
Thoracic
Other
Anesthesia: g. General
(43) l._ Local
s. Spinal
Duration of operation Hrs Mins
(44-47)
Operation
I • I (ICD9-CM)
Date
( 4 8 - 5 2 ) , / , / , ! ( 5 3 - 5 8 ) . [ x ] Type of Operation
Region of incision a.
c.
(59) t.
Abdominal
Cranial
Thoracic
Other
Anesthesia: g. General
(60) 1. Local
s. Spinal
Duration of operation Hrs Mi ns
(61-64)
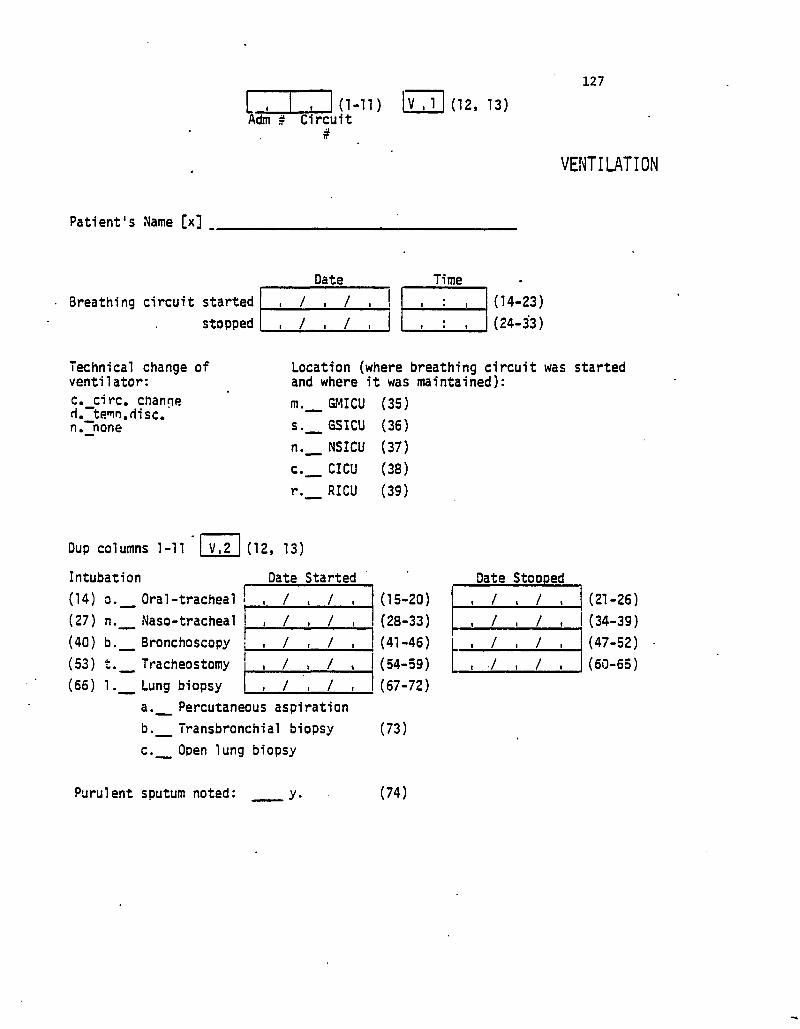
n.
127
Adm # Circuit #
0-n) lv, i! (12, 13)
VENTILATION
Patient's Name [x]
Date Time
Breathing circuit started , / , / , l • 1 (14-23)
stopped , / . / , I • 1 (24-33)
Technical change of ventilator: c._circ. change ri.__tenio.riisc. n. none
Location (where breathing circuit was started and where it was maintained):
m. GMICU (35)
s. GSICU (36)
n. NSICU (37)
c. CICU (38)
r. RICU (39)
Dup columns 1-11 I V,2 1 (12, 13)
Intubation Date Started Date Stoooed
(14) o. Oral-tracheal •./,/, (15-20) (21-26)
(27) n. Naso-tracheal , / , / , (28-33) (34-39)
(40) b. Bronchoscopy (41-46) (47-52)
(53) t . Tracheostomy (54-59) (60-65)
(65) 1. Lung biopsy (67-72)
a . Percutaneous aspiration
b . Transbronchial biopsy
c . Open lung biopsy
(73)
Purulent sputum noted: y. (74)
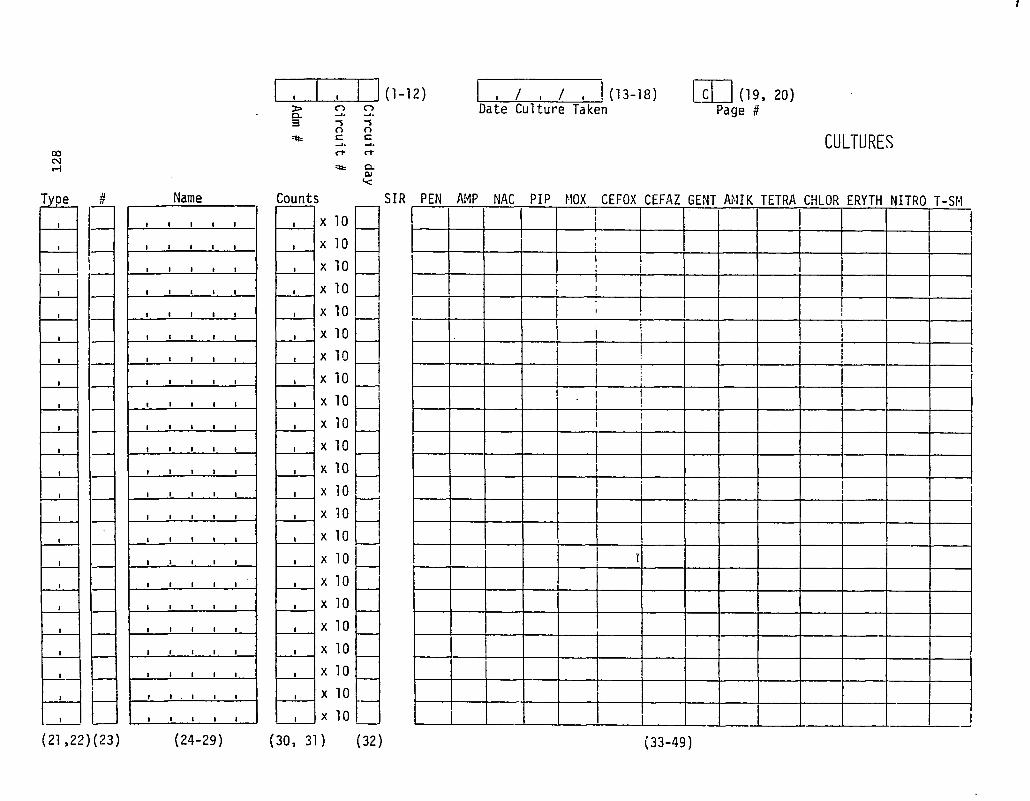
00 <N
Type # Name
( 2 1 , 2 2 ) ( 2 3 ) ( 2 4 - 2 9 )
(1 -12) / / Q. Date Culture Taken
( 1 3 - 1 8 ) ( 1 9 , 2 0 ) Page #
-5 n c rt
Counts
O c
Q. QJ
*<
CULTURES
X 0
X 0
X 0
X 0
X 0
X 0
X 0
X 0
X 0
X 0
X 0
X 0
X 0
X 0
X 0
X 0
X 0
X 0
X 0
X 0
X 0
X 0
X 0
SIR PEN AMP NAC PIP MOX CEFOX CEFAZ GENT AMIK TETRA CHLOR ERYTH NITRO T-SM i 1 I i l i < i i
i
! i
i !
! i
• ! ! »
1 1
!
1
( 3 0 , 3 1 ) ( 3 2 ) ( 3 3 - 4 9 )
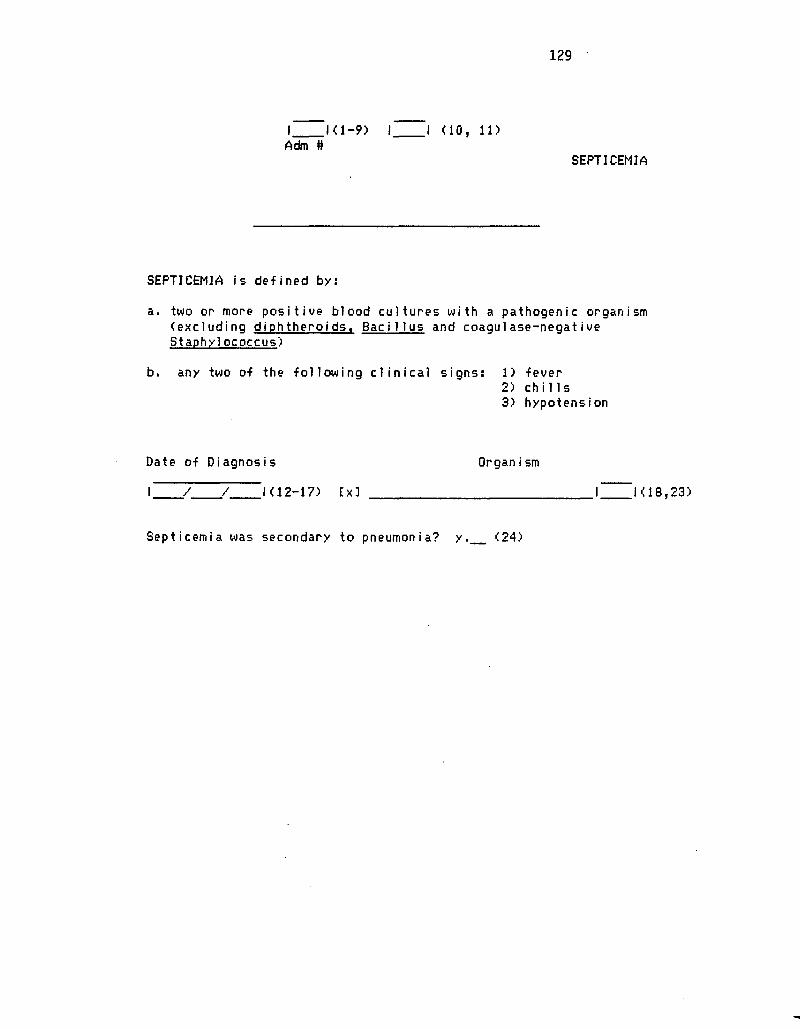
129
I<1-?> I < 1 0 , 1 1 )
A d m # S E P T I C E M I A
S E P T I C E M I A i s d e f i n e d b y :
a . t w o o r m o r e p o s i t i v e b l o o d c u l t u r e s w i t h a p a t h o g e n i c o r g a n i s m ( e x c l u d i n g d i p h t h e r o i d s . B a c i l l u s a n d c o a g u l a s e - n e g a t i v e S t a p h y l o c o c c u s )
b . a n y t w o o f t h e f o l l o w i n g c l i n i c a l s i g n s : 1 ) f e v e r 2 ) c h i l l s 3 ) h y p o t e n s i o n
D a t e o f D i a g n o s i s O r g a n i s m
/ / 1 ( 1 2 - 1 7 ) E x ] 1 ( 1 8 , 2 3 )
S e p t i c e m i a w a s s e c o n d a r y t o p n e u m o n i a ? y . ( 2 4 )
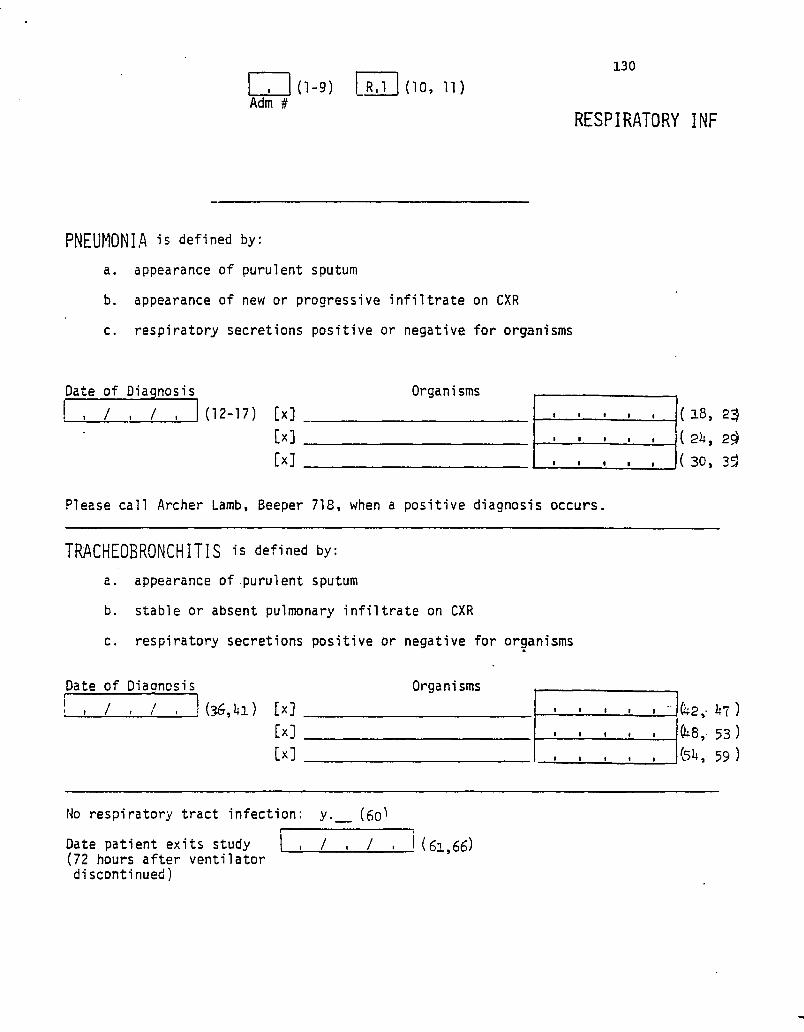
, I(1-9) I R,1 1(10, 11) Adm #
130
RESPIRATORY INF
PNEUMONIA is defined by:
a. appearance of purulent sputum
b. appearance of new or progressive infiltrate on CXR
c. respiratory secretions positive or negative for organisms
Date of Diagnosis Organisms
/ / (12-17) [ x ]
[ x ]
[x]
( 18, 23
( 2 U , 2 $
( 30, 33
Please call Archer Lamb, Beeper 718, when a positive diagnosis occurs.
TRACHEOBRONCHITIS is defined by:
a. appearance of purulent sputum
b. stable or absent pulmonary infiltrate on CXR
c. respiratory secretions positive or negative for organisms
Date of Diaancsis i /
Organisms
(36,M) Ix]
[ x ]
[ x ]
&2,- bl )
& 8 , 5 3 )
feh, 59 )
No respiratory tract infection: y. (60^
Date patient exits study (72 hours after ventilator discontinued)
/ / (61,66)


![Bearman nosocomial infections[1]](https://img.pdfslide.net/doc/110x75/55499096b4c90583678b5577/bearman-nosocomial-infections1.jpg)