Embed Size (px)
Citation preview

15
Not all Wireless Sensor Networks areCreated Equal: A Comparative Studyon Tunnels
LUCA MOTTOLASwedish Institute of Computer Science and University of Trento, ItalyGIAN PIETRO PICCOUniversity of Trento, ItalyMATTEO CERIOTTIBruno Kessler Foundation, ItalySTEFAN GUNAUniversity of Trento, ItalyandAMY L. MURPHYBruno Kessler Foundation, Italy
Wireless sensor networks (WSNs) are envisioned for a number of application scenarios. Never-theless, the few in-the-field experiences typically focus on the features of a specific system, andrarely report about the characteristics of the target environment, especially with respect to thebehavior and performance of low-power wireless communication. The TRITon project, funded byour local administration, aims to improve safety and reduce maintenance costs of road tunnels,using a WSN-based control infrastructure. The access to real tunnels within TRITon gives usthe opportunity to experimentally assess the peculiarities of this environment, hitherto not in-vestigated in the WSN field. We report about three deployments: (i) an operational road tunnel,enabling us to assess the impact of vehicular traffic; (ii) a nonoperational tunnel, providing insightsinto analogous scenarios (e.g., underground mines) without vehicles; (iii) a vineyard, serving as abaseline representative of the existing literature. Our setup, replicated in each deployment, usesmainstream WSN hardware, and popular MAC and routing protocols. We analyze and comparethe deployments with respect to reliability, stability, and asymmetry of links, the accuracy of linkquality estimators, and the impact of these aspects on MAC and routing layers. Our analysis showsthat a number of criteria commonly used in the design of WSN protocols do not hold in tunnels.Therefore, our results are useful for designing networking solutions operating efficiently in similarenvironments.
Authors’ address: Gian Pietro Picco, University of Trento, Department of Information Engineeringand Computer Science, Via Sommarive 14, 1-38050 Provo (TN), Italy; email: [email protected] to make digital or hard copies of part or all of this work for personal or classroom useis granted without fee provided that copies are not made or distributed for profit or commercialadvantage and that copies show this notice on the first page or initial screen of a display alongwith the full citation. Copyrights for components of this work owned by others than ACM must behonored. Abstracting with credit is permitted. To copy otherwise, to republish, to post on servers,to redistribute to lists, or to use any component of this work in other works requires prior specificpermission and/or a fee. Permissions may be requested from Publications Dept., ACM, Inc., 2 PennPlaza, Suite 701, New York, NY 10121-0701 USA, fax +1 (212) 869-0481, or [email protected]© 2010 ACM 1550-4859/2010/08-ART15 $10.00DOI 10.1145/1824766.1824771 http://doi.acm.org/10.1145/1824766.1824771
ACM Transactions on Sensor Networks, Vol. 7, No. 2, Article 15, Publication date: August 2010.

15:2 • L. Mottola et al.
Categories and Subject Descriptors: C.2.1 [Computer-communication Networks]: NetworkArchitecture and Design—Network topology
General Terms: Design, Experimentation
Additional Key Words and Phrases: Wireless sensor networks, network topologies, low-power wire-less communications, topology characterization, link quality, tunnel environment
ACM Reference Format:Mottola, L., Picco, G. P., Ceriotti, M., Guna, S., and Murphy, A. L. 2010. Not all wireless sensor net-works are created equal: A comparative study on tunnels. ACM Trans. Sens. Netw. 7, 2, Article 15(August 2010), 33 pages.DOI = 10.1145/1824766.1824771 http://doi.acm.org/10.1145/1824766.1824771
1. INTRODUCTION
Wireless sensor networks (WSNs) are used in a growing number of applica-tions, where they enable dense measurements with low-cost, untethered, andflexible deployments. Nevertheless, the literature on real-world WSN deploy-ments typically focuses on reporting about the features of a specific system,and only marginally considers its target environment. A characterization ofthe latter, especially for what concerns the behavior and performance of low-power wireless communication, complements the report of a successful de-ployment, providing results that are more general, and therefore: (i) can beused as guidelines by developers working in the same application area; (ii)enables comparisons across different application areas. In this article, the de-sign and development of a WSN-based system for monitoring and control-ling road tunnels is the motivation for a characterization of this unusual en-vironment, and its comparison against others that are more popular in theliterature.
Motivation and Research Goals. TRITon (Trentino Research & Innovationfor Tunnel Monitoring, triton.disi.unitn.it) is a 3-year project funded by thelocal administration of Trento (Italy) with the goals of reducing the manage-ment costs of road tunnels and improving their safety. One of the applicationscurrently under development exploits WSNs to provide adaptive control of thelight intensity. Densely-deployed light sensors, placed along the sides of thetunnel, measure the light intensity and report it to a controller, which performstuning of the illumination. In contrast to traditional solutions, which typicallyuse pre-set intensity values or at best are based on a single external sensor,this solution adapts to fine-grained light variations, both in space and time.Therefore, it is capable of dynamically maintaining the legislated light levels,which are instead typically statically determined according to the worst-casescenario. This enables energy savings at the tunnel entrances, where sunlightgreatly affects the perceived light intensity, but is also useful inside the tunnel,where the external light does not reach. In this case, the sensor readings allowfor maintenance of the light levels required by law even when lamps burn outor are obscured by dirt.
ACM Transactions on Sensor Networks, Vol. 7, No. 2, Article 15, Publication date: August 2010.
Not all Wireless Sensor Networks are Created Equal • 15:3
WSNs are an asset in the above scenario, as the nodes can be placed at arbi-trary points along the tunnel, not only where power and networking cables canreach. This drastically reduces installation and maintenance costs, and makesWSNs particularly appealing to augment the functionality of pre-existing tun-nels, where changes to the existing infrastructure should be minimized. Thedownside to such flexibility is the reliance on an autonomous energy source.Currently this is provided by batteries, which need to be changed periodically,for example, when tunnel maintenance occurs. As an alternative, we are alsoexploring the use of techniques to harvest energy from the environment, forexample, relying on solar light at the tunnel extremities or vibrations causedby vehicles in transit. In TRITon, the WSN supporting adaptive light control isexpected to become permanent in four existing tunnels, whose lengths rangefrom 400 to 1,400m. The tunnels are situated on a major freeway nearby Trentoand have an average traffic of ∼14,000 vehicles per day.
Other projects have envisioned the use of WSNs in road tunnels [Costa et al.2007] or in similar environments, such as metropolitan subways [Cheekiralla2005], underground mines [Li and Liu 2009], and service pipes [Sabata andBrossia 2005]. None of these projects, however, has yet reported a quantita-tive characterization of the deployment environment. Nevertheless, tunnelsare a peculiar setting, bringing elements from both indoor and outdoor deploy-ments. As in the former, the deployment area is delimited by walls and ceiling,making multi-path effects relevant. The walls are not, however, as denselypacked as in a building. Instead, they determine a regular, tube-like shape thathas already been proved, although mostly analytically, to act as an “oversizedwaveguide” [Molina-Garcia-Pardo et al. 2009]. On the other hand, tunnels areoutdoor, therefore susceptible to environmental conditions affecting connectiv-ity. Finally, the effect of vehicles transiting the tunnel brings an additionalunknown. While tunnels and similar scenarios are rapidly gaining attentionas targets for WSN deployments, the lack of quantitative, real-world evidenceabout these environments leaves WSN developers in the dark, without specificguidelines to drive their deployments.
The access to real tunnels in TRITon gives us a unique opportunity to fillthis gap. Our focus, however, is not on a theoretic or analytical characterizationof the tunnel environment. The availability of real tunnels within TRITon,and our own practical need to design an efficient WSN system, pushed ourgoals towards a pragmatic and system-oriented perspective, whose ultimateobjective is to understand the cause-effect relations between the behavior at thephysical layer and the performance of commonly employed sensor networkingtechniques. Our objectives were therefore to:
(1) gather and analyze quantitative evidence accumulated during extensiveexperimental campaigns using mainstream WSN technology, and
(2) distill practical findings to support the design and deployment of WSNapplications in tunnels.
Methodology. We analyze over 320,000 data points collected during over1,450 experiments of duration ranging from 2 seconds to 60 minutes, for a
ACM Transactions on Sensor Networks, Vol. 7, No. 2, Article 15, Publication date: August 2010.
15:4 • L. Mottola et al.
total in excess of 1,680 hours of experiments run between Dec. 20, 2008 andJan. 16, 2009. These were carried out across three deployments, described inSection 2: (i) an operational road tunnel, enabling us to assess the impact ofvehicular traffic; (ii) a nonoperational tunnel, providing insights into analogousscenarios (e.g., underground mines) without vehicles; (iii) a vineyard, servingas a baseline representative of deployments commonly found in the literature.To make the results comparable at least in the aspects we can control, wereplicated the node placement, ran the same suite of test applications, andused the same hardware and software in all deployments. As we describe inSection 3, we selected WSN technology that appears to be the most popular,in an effort to provide results that are of wide applicability for the researchcommunity.
In accordance with our goals, our experiments span multiple network layers,as described in Section 4. At the physical layer, we gather data about packet de-livery rate and link quality estimators. At the MAC layer, we assess the packetdelivery rate in the presence of packet collisions and the performance of radioduty-cycling. Finally, at the routing layer we gather data about end-to-end de-livery, the shape and dynamic characteristics of a tree-based routing topology,and the performance of popular techniques used by the routing protocol beingtested, for example, the ETX [Couto et al. 2005] metric and link-level acknowl-edgments. We also collect data about temperature and humidity, to assess theirimpact on the network performance.
The entire data set collected during the experiments is publicly avail-able [D3S Group].
Contribution. Our study shows that the tunnel environment is indeed signif-icantly different from those targeted in the traditional WSN literature, to thepoint that some commonly accepted techniques, trade-offs, observations, andrules-of-thumb lose their validity.
For instance, it is common wisdom that WSN links tend to be brittle andshort-range when using mainstream hardware. Instead, we observed that intunnels links are generally stable and long-range, an effect of the tunnel be-having similarly to a waveguide. In this situation, CSMA MAC protocols tendto perform inefficiently, due to a high probability of packet collision. Simi-larly, previous testbed experiments [Srinivasan and Levis 2006] noted that theLink Quality Indicator (LQI) provided by IEEE 802.15.4 radios does not accu-rately reflect the corresponding link reliability, unless the link is near-perfector hundreds of LQI values are averaged. As a consequence, ETX and its deriva-tives are generally preferred for building routing trees. Our experiments showthat, in a tunnel, this is only partially true: even a few LQI values yield rout-ing trees as good as ETX-based ones, but require significantly less networktraffic.
These and the other findings discussed in Section 5 show that tunnels andsimilar environments undermine common assumptions and, worse, make pop-ular protocols and techniques inefficient. The findings reported in this paper,supported by extensive quantitative evidence, help to build background knowl-edge for developing and deploying WSNs in these scenarios. Our survey of
ACM Transactions on Sensor Networks, Vol. 7, No. 2, Article 15, Publication date: August 2010.

Not all Wireless Sensor Networks are Created Equal • 15:5
Fig. 1. Deployment sites.
Fig. 2. TRAFFIC deployment. The distance between nodes is the same in all scenarios.
related work in Section 6 shows that we are the first to undertake such aneffort.
2. DEPLOYMENT SCENARIOS
The first deployment is an operational road tunnel (named TRAFFIC hereafter),where the presence of vehicular traffic allows us to analyze the impact of ob-jects moving inside the tunnel. The results we derive in this context are there-fore potentially applicable to analogous scenarios such as railway or subwaytunnels [Cheekiralla 2005]. The second scenario is a nonoperational tunnel(TUNNEL). In this case, the absence of traffic allows us to assess the impact ofthe tunnel shape in isolation, making our results of interest in scenarios suchas underground mines [Li and Liu 2009] and service pipes [Sabata and Brossia2005]. Our third scenario is a vineyard (VINEYARD), representative of traditionaloutdoor scenarios [Beckwith et al. 2004]. VINEYARD offers a comparison point forthe tunnel deployments, although the experimental results we derived for itare useful to shed additional light on this often-cited scenario. Figure 1 showsour three deployment sites.
The network we used in all experiments includes 20 battery-powered WSNnodes, whose hardware and software configuration is described in Section 3.The configuration of our deployments is essentially the same across all sce-narios and mirrors the one in TRAFFIC, shown in Figure 2. Nodes are placedalong two parallel lines on the opposite walls and skewed so that a node on onewall is never directly opposite to another node. In TRITon, this is motivatedby the need to minimize transient occlusions of the light sensors caused byvoluminous vehicles such as trucks.
ACM Transactions on Sensor Networks, Vol. 7, No. 2, Article 15, Publication date: August 2010.

15:6 • L. Mottola et al.
Fig. 3. WSN nodes in the field.
The network density is also driven by the requirements of the TRITonproject. The nodes are more densely deployed at the tunnel entrance, and be-come more sparse inside the tunnel. Indeed, light variations are expected to belarger and more frequent at the tunnel entrance. To capture these variations, itis necessary to attain higher sensing granularity in that area. A coarser sens-ing resolution is instead sufficient inside the tunnel, where light variations arelikely to be smaller and less frequent. On the other hand, the distances betweenadjacent nodes on the same wall are dictated by the desire to replicate the verysame configuration in VINEYARD. Indeed, unlike the tunnel scenarios where wecould freely place motes along the wall, in VINEYARD our choices were limited bythe pre-existing location of the vine-supporting poles.
Each node is packaged in a plastic box, shown in Figure 3, and placed sothat the board, containing the integrated antenna detailed in Figure 3(a), isparallel to the tunnel wall. This allows the light sensors, which are mountedon an extension board parallel to the node itself for ease of assembling, to facedirectly the road.
In all deployments we used a gateway, a Gumstix (www.gumstix.com) embed-ded PC featuring both Ethernet and Wi-Fi interfaces, to enable remote controlof the experiments and collection of the results. The gateway is connectedthrough USB to a WSN node where we collect the results of our experiments.
In the following, we provide additional details about the chosen scenariosand the corresponding WSN deployments.
2.1 Operational Tunnel (TRAFFIC)
The TRAFFIC deployment is in the “San Vigilio” tunnel, shown in Figure 1(a),situated about 4Km from Trento on the road SS 45bis “Gardesana”. This is amain road with a relatively high traffic load, as it provides access to the cityof Trento from the West, for example, from the nearby lake Garda. The tunnelis one-way, with two lanes. The average number of vehicles per hour variesbetween a few tens during the night to about a thousand during peak hours,for example, in the morning. The traffic includes heavyweight vehicles such astrucks, which account for 2% of night traffic and up to 10% of morning traffic.The tunnel is carved into a hill. It is 400m long, 8m high, and the distance
ACM Transactions on Sensor Networks, Vol. 7, No. 2, Article 15, Publication date: August 2010.

Not all Wireless Sensor Networks are Created Equal • 15:7
Fig. 4. Node placement in TUNNEL and VINEYARD.
between walls is 10m. In the 150m where we placed our nodes, the tunnel isstraight.
Deployment Details. The nodes are installed approximately 1.70 m from theground, the height at which light levels must be monitored in the TRITonproject for the control loop to be compliant with the current regulations. Nodesare packaged in a 14 × 17 × 9.5cm3 box that, according to regulations, must befire-proof and water-proof (IP65 or higher). Each node was equipped with foursize D Duracell batteries. The gateway is connected to the internal networkalready present at the entrance of the tunnel, which relays data through theInternet to a remote control center.
2.2 Nonoperational Tunnel (TUNNEL)
Within the TRITon project, we also had the opportunity to test our system ina nonoperational tunnel called “Doss Trento”, shown in Figure 1(b), situatedin the northern urban area of Trento. As it is no longer in operation, theTUNNEL deployment was much more accessible than the TRAFFIC one, where everychange to the placement of nodes or to the software running on them requireda number of authorizations from the local administration to enforce partial ortotal interruption of traffic and the execution of the required modifications bythe company in charge of the tunnel maintenance. Instead, in TUNNEL we couldaccess the site as needed, and perform the required tasks ourselves.
Unlike TRAFFIC, TUNNEL bends about 70m from the entry, as shown inFigure 4(a) (not to scale). Although the tunnel is 290m long, we were granted
ACM Transactions on Sensor Networks, Vol. 7, No. 2, Article 15, Publication date: August 2010.

15:8 • L. Mottola et al.
access only to the first 150m. Apart from these details, the other values aresimilar to those in TRAFFIC. The tunnel is old and its structure is not completelyimpermeable: on rainy days, water was seen to penetrate in the area aroundthe gateway.
Deployment Details. Compared to TRAFFIC, the only difference in TUNNEL, asseen by comparing Figure 2 and 4(a), is the mirrored placement of nodes, thatis, the walls on which the nodes with even and odd identifiers are placed areswitched. This is motivated by the availability of the power outlets, necessaryfor the gateway and for a radio bridge installed at the entry. The latter isnecessary to ensure connectivity to our institute because TUNNEL, unlike TRAFFIC,was not connected to any network infrastructure.
2.3 Vineyard (VINEYARD)
This scenario was made available by the Edmund Mach Foundation, in SanMichele all’Adige, nearby Trento. The area available to us, shown in Figure 1(c),is located on a slope, with a length of 190m and a width ranging from 20 to60m. The area can be divided in two sectors: A first one with a rectangularshape (approx. 110×60m2) and a second that progressively narrows over alength of 80m. Figure 4(b) provides a graphical representation (not to scale).In the second sector, the position of the poles is fairly regular: 6m betweenrows and 3m between the poles inside each row. Instead, in the first sector thedistance between rows varies between 1.3 and 3.9m, and even the type of polesis different, with a mixture of vertical and v-shaped poles. As mentioned earlierin this section, these constraints determined the node distances we chose forall deployments.
Deployment Details. The vineyard is far from the closest building where In-ternet connection and electricity are available. Therefore, it was not possibleto co-locate the gateway with the nodes in the field. As shown in Figure 4(b),we placed the gateway in reach of Internet access and ensured connectivitybetween the root and the gateway through 8 additional WSN “bridge” nodes.To avoid affecting the experiments, these operate only outside of the experi-ment times. During each experiment, the root node buffers on external storagethe information that would normally be forwarded to the gateway. The actualtransmission to the gateway through the bridge nodes takes places when theexperiment is over.
Each WSN node was packaged in a 13×13×7.5cm3 box, shown in Figure 3(b).The boxes were placed at the top of the vine-supporting poles, that is, at about1.5m from the ground. Unlike the other two deployments, we equipped eachnode with only one pair of Size D Duracell batteries, as the poles could notsupport a heavier weight. It is worth noting that since we performed most ofour tests in winter, the vineyard had no leaves.
3. WIRELESS SENSOR NETWORK TECHNOLOGY
The research goals we stated in Section 1 demand studying different layers inthe stack, namely the physical (PHY), MAC (MAC), and routing (RTN) ones. The
ACM Transactions on Sensor Networks, Vol. 7, No. 2, Article 15, Publication date: August 2010.

Not all Wireless Sensor Networks are Created Equal • 15:9
behavior of the physical layer is determined by the communication hardwareand the characteristics of the deployment, and is therefore essential to under-stand the peculiarities of the tunnel scenario. In contrast, the mechanisms andprotocols at the MAC and routing layers, affected by the physical layer, beara direct impact on the behavior of WSN applications. As such, the study ofthese two layers is fundamental in understanding the performance that can beobtained in our target scenarios.
Looking at the landscape of deployed WSN systems, it appears that most ofthem leverage a limited set of simple networking techniques [Raman and Che-brolu 2008]. Here, we employ the same solutions to assess the effectiveness ofthese popular mechanisms. A similar rationale motivated our choices of hard-ware and system support. For the former, we use nodes functionally equivalentto the the widespread TMote Sky [Polastre et al. 2005]. These are equippedwith a SHT11 temperature/humidity sensor, which in our experiments is usedto study how the environmental conditions affect our results. We avoided theuse of external antennas, as these would significantly increase the overall de-ployment costs and also make our results a function of the specific antennaemployed [Raman et al. 2006]. In retrospect, this turned out to be a wise deci-sion given that, as we show in Section 5, the on-board antenna already enablesa range up to 150m. This is sufficient for our application, where the distancesamong sensors are constrained by the position relative to the lamps, and is atmost 50m. For system support we use TinyOS [Hill et al. 2000], as this allowsus to re-use implementations of popular networking protocols.
In the following, we provide a concise overview of the specific hw/sw mecha-nisms we tested at the different layers.
Physical Layer (PHY). We use the IEEE 802.15.4-compliant ChipCon 2420[Chipcon Tech.] as the radio chip and the on-board inverted-F micro-stripomnidirectional antenna. The 802.15.4 standard prescribes a direct sequencespread spectrum OQPSK modulation across 16 channels in the ISM 2.4GHzband, yielding a nominal bandwidth of 250Kbit/s. For each packet received,the CC2420 computes two indicators: the received signal strength indicator(RSSI) and the link quality indicator (LQI). RSSI measures the received signalstrength, while LQI quantifies the correlation between a received symbol andthe symbol this is mapped to after the radio completes decoding [Chipcon Tech.]. Intuitively, the higher this value, the “cleaner” the channel. Optionally, theCC2420 provides hardware-generated acknowledgments for reliable deliveryof unicast packets.
MAC Layer (MAC). The default MAC layer used in TinyOS is a Carrier-SenseMultiple-Access (CSMA) protocol based on clear channel assessments (CCA)and random back-offs for channel arbitration [TinyOS]. On top of it, an asyn-chronous low-power listening (LPL) scheme [TinyOS] is available to save en-ergy by duty-cycling the radio. When LPL is employed, every node turns on theradio periodically (based on a sleep interval SI) to perform a receive check,and turns it off immediately after if no transmission is detected. Sendersretransmit the outgoing packet for a duration of twice the SI of receivers,therefore ensuring that the latter eventually detect the transmission. Unicast
ACM Transactions on Sensor Networks, Vol. 7, No. 2, Article 15, Publication date: August 2010.

15:10 • L. Mottola et al.
transmissions are acknowledged to allow the sender to stop its transmissionwhen the packet is received. The value of SI is set by the application, to balancethe trade-off between energy consumption and network throughput.
Routing Layer (RTN). The Collection Tree Protocol (CTP) [Gnawali et al.2009; TinyOS (c)] is a representative of commonly employed tree-based routingschemes. At a high-level, the behavior of most of these protocols is characterizedby two core elements: (i) a routing metric used by every device to select a parentnode in the tree; and (ii) a set of reliability mechanisms to improve the fractionof messages correctly delivered to the root of the tree.
The version of CTP we used leverages the expected transmissionscount (ETX) [Couto et al. 2005] as a basis for its routing metric. This metric iscomputed based on beacons broadcast by every node. In CTP, nodes select theirparent in the tree by minimizing the end-to-end ETX, that is, the number ofretransmissions required to deliver a message to the root, possibly across mul-tiple hops. Reliability is achieved mainly by using randomly-scattered retrans-missions and link-layer acknowledgments. In CTP, the latter is implementedentirely in software, instead of using the CC2420 hardware-level acknowledg-ments, to retain better control of retransmission timeouts.
4. EXPERIMENTS: GOALS AND SETUP
In each deployment we selected the radio channel to avoid interference causedby nearby devices transmitting in the same band, for example, WiFi or Blue-tooth. We also monitored the battery voltage before and after every experimentto verify that the battery never went below a threshold affecting the perfor-mance of the radio transceiver [Chipcon Tech.]. In all experiments, the packetsize was 105 bytes inclusive of MAC header and 94 bytes of payload, represen-tative of common WSN applications [Mainwaring et al. 2002]. Following themanufacturer’s suggestions, we set the CC2420 output power to -1 dBm, onelevel less than maximum power. This is to alleviate distortion effects due tomiscalibrated hardware or imperfections in the manufacturing process of theradio chips [Zuniga and Krishnamachari 2007].
4.1 Physical Layer (PHY)
Goal and Metrics. Our objective is to investigate the performance of the bare-bones physical layer, that is, in the absence of factors such as collisions andretransmissions that are normally dealt with by higher layers of the networkstack. To this end, each node sends periodic broadcast messages and tracksmessages received from other nodes. In each experiment, we input the durationof the test (DT), and compute the following quantities as output:
—the packet delivery ratio (PDRi→ j) between any pair of nodes i, j, that is, theratio of packets received by node j over the number of packets sent by nodei or, equivalently, the packet error ratio PERi→ j = 100% − PDRi→ j ;
—the average RSSI (RSSI) and LQI (LQI) between any pair of nodes, computedover the packets received;
—the average temperature and relative humidity observed during the test.
ACM Transactions on Sensor Networks, Vol. 7, No. 2, Article 15, Publication date: August 2010.

Not all Wireless Sensor Networks are Created Equal • 15:11
Fig. 5. Scheduling transmissions in PHY and MAC experiments.
PDR, RSSI, and LQI are fundamental to investigate the characteristicsof network links and the accuracy of link quality estimators, as illustratedin Section 5, where we also assess how these are affected by environmentalconditions.
Implementation. To avoid collisions, periodic transmissions are scatteredover time as illustrated in Figure 5(a). For the entire duration of an experi-ment, each node broadcasts a packet every N × δ time instants, where N isthe number of participating nodes and δ is a known time interval. The trans-missions are scattered at the beginning of each experiment by a time offset,different for each node, computed by multiplying the node identifier by δ. Tominimize clock drifts, the nodes are time synchronized at the beginning of eachexperiment by using a form of reference broadcast [Elson et al. 2002], wherethe reference message includes the duration of the experiment DT. Unlessotherwise specified, we use N = 20 and δ = 300ms: the latter is within theaccuracy of our time synchronization and of the back-off timers employed bythe radio transceiver. At the end of each experiment, all nodes transmit theirresults to the gateway using network-wide flooding, for maximum reliability.The nodes can also be configured to dump to flash memory the packets theyreceived during the experiment, and later communicate these to the gatewayalong with the aggregated results. Although this drastically increases the timerequired to perform an experiment, it allows us to study the variability of theabove metrics also across packets.
4.2 MAC Layer (MAC)
Goal and Metrics. To investigate the impact of collisions on the behavior ofthe TinyOS MAC layer—especially with respect to the effectiveness of theCCA functionality—we devised experiments where we control the probabilityof concurrent transmission Pct, that is, the probability that any two nodesbroadcast a packet concurrently. The value of Pct, along with the number Nof participating nodes, the test duration DT and, if LPL is used, the sleepinterval SI, are given as input to the experiments. As output, we collect thesame quantities of PHY tests. If LPL is used, we also compute the numberof radio activations (Ract) at each node. Here, however, RSSI, LQI, and theenvironmental readings are used mostly to “match” PHY and MAC experiments.This allows us to investigate how the behavior of the physical layer impactsthe MAC performance under similar conditions, as discussed in Section 5.
ACM Transactions on Sensor Networks, Vol. 7, No. 2, Article 15, Publication date: August 2010.

15:12 • L. Mottola et al.
Implementation. At the beginning of each experiment, and based on thenumber N of participating nodes, the desired probability Pct and the maximumduration of a packet transmission, the gateway computes a time interval ρ thatnodes use to proceed in rounds after a time-synchronization phase similar to PHY
experiments, as shown in Figure 5(b). Within ρ, a node decides randomly whento send a packet. Therefore, a shorter ρ corresponds to a higher probability ofconcurrent transmissions. The value of ρ is communicated to the nodes as partof the reference broadcast message, along with DT and SI (if any), whereas theresults of the experiment are collected as in PHY tests.
4.3 Routing Layer (RTN)
Goal and Metrics. To study how the tunnel environment affects the performanceof the routing layer, we developed a dummy data collection application atopCTP, where each node sends messages with a given intermessage interval(IMI), for an overall duration DT. The experiments return:
—the total message delivery ratio at the CTP root (node 0 in every deployment),that is, the number of application messages received over the total numberof application messages generated;
—the number of duplicates dropped inside the network (DUP);—the parent in the tree at every node at the time of sending a message, along
with the total number of parent changes (PT) observed throughout the ex-periment;
—the number of failed link-layer acknowledgments at every node (ACKfailed);—the number of beacons transmitted at each node to compute ETX.
The preceding metrics are used to study both the overall performance ofCTP, as in the case of message delivery ratio, and to assess the effectivenessof specific mechanisms. For instance, PT and the number of ETX beacons areuseful to investigate the behavior of ETX-based link quality estimates.
Implementation. We instrumented the CTP implementation to provide ourtest application with the necessary hooks to gather the above statistics. Weembed this information within the application messages to report them to thegateway. The tests are started as in the PHY case, but this time the genera-tion of messages is randomly scattered over time, as in most data collectionapplications [Mainwaring et al. 2002].
5. RESULTS AND DISCUSSION
The ultimate objective of our experiments is to understand if and how thecharacteristics of the physical layer in the tunnel environment affect the per-formance of MAC and routing protocols. To this end, instead of discussing theresults separately at each layer, we draw first some observations on the behav-ior of the physical layer based on the results of PHY tests. For every such finding,we investigate its impact on the performance of the higher layers by analyzing
ACM Transactions on Sensor Networks, Vol. 7, No. 2, Article 15, Publication date: August 2010.

Not all Wireless Sensor Networks are Created Equal • 15:13
Table I. Summary of the Main Findings about the Tunnel Environment
Observation at the physicallayer
Section Effects and implications
Links are long-range and stable,grey areas and noise from fartransmitters are relevant.
5.1 [MAC] CSMA has poorreliability and high energyconsumption, TDMA-liketechniques are more suited.
LQI is a good indicator of linkquality, RSSI is not except forvery good links.
5.2 [Routing] LQI can be used inplace of the more costly ETX,as they build similar routes.
Link asymmetries are mostlypermanent and related to theposition of nodes.
5.3 [Routing] Link-layeracknowledgments workpoorly, but pathological linkscould be identified a priori.
Vehicular traffic affects thephysical layer with temporarylink disruptions.
5.4 [Routing] Need specificreliability mechanisms toavoid high resourceconsumption.
data obtained from MAC and RTN tests in comparable conditions. This processis the stepping stone to derive a set of guidelines for the design of networkingtechniques suited to the scenarios we consider.
Table I summarizes the observations we draw at the physical layer and theirimplications on MAC and routing protocols, while also providing a road-map forthe rest of this section. First, however, we discuss the impact of environmentalconditions on the physical layer, which provides the rationale to match PHY teststo MAC and RTN experiments.
Impact of Environmental Conditions. We studied the impact of environmen-tal conditions on the network performance using the on-board temperature andhumidity sensors. To allow the measurement of these parameters, we piercedfour holes on the bottom of the (otherwise air-tight and water-proof) boxes inwhich nodes were packaged. Based on the results of PHY experiments, we canstate that:
(1) in both tunnels, humidity varies the most at the entrance, whereas theinner portions are barely affected by changes in the outside environmentalconditions;
(2) throughout our study, temperature did not affect the performance of thephysical layer, while humidity had an impact only above a given threshold.
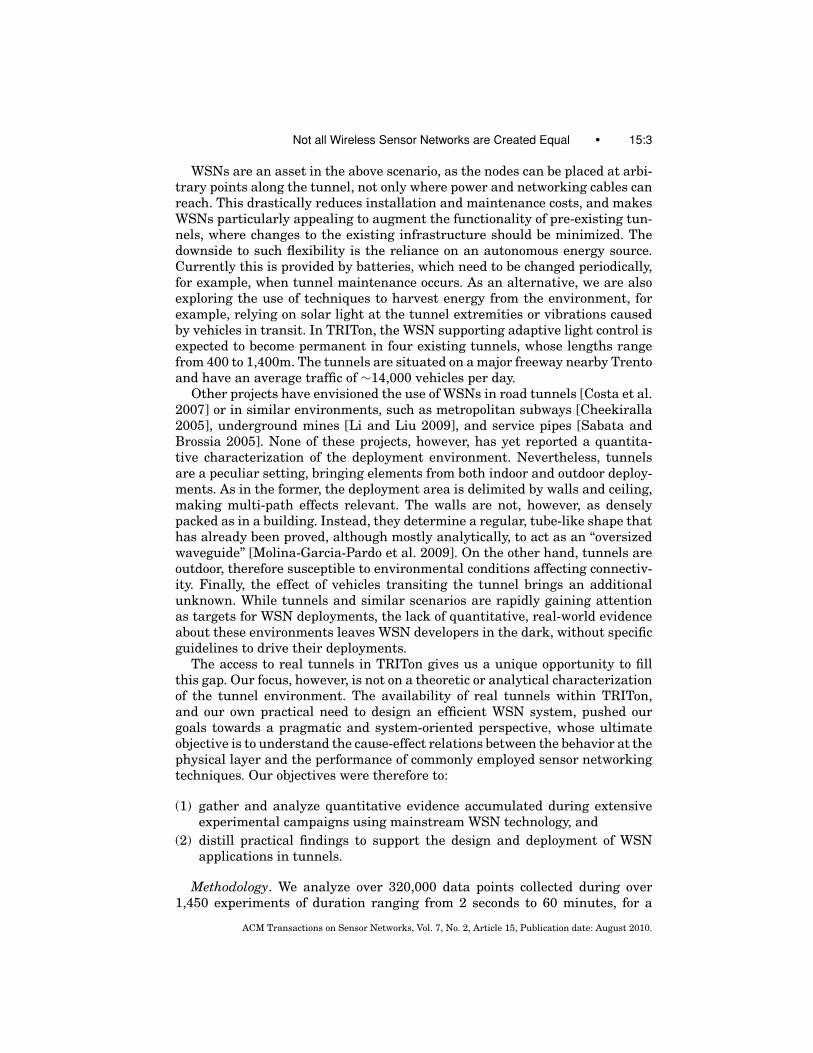
Figure 6(a) provides quantitative support for the first observation, by plot-ting the average relative humidity and its standard deviation at some samplenodes, recorded in both tunnels at the same time. The plot shows that theexcursion in both cases is significantly higher at nodes closer to the entrance.Similar trends are observed also for temperature. In a sense, the tunnel acts asa “low-pass filter” for humidity and temperature, preventing short-term vari-ations from propagating inside the tunnel. This confirms previous findings in
ACM Transactions on Sensor Networks, Vol. 7, No. 2, Article 15, Publication date: August 2010.
15:14 • L. Mottola et al.
Fig. 6. Impact of humidity.
the field of tunnel engineering [Sun et al. 2008] and similar phenomena inanalogous contexts such as mine galleries [Nowak et al. 1997].
To motivate the second consideration, we consider a sample set of 192 PHY
tests with duration DT = 30min evenly distributed over 4 days. Figure 6(b)shows the relative humidity and PER over time between node 1 and 2 inTRAFFIC.1 Figure 6(b) shows three distinct behaviors. Until 23:00, humiditywas around 85% with PER ≈ 1%. During the night, humidity reached 93%and the PER increased abruptly to 9%. Later on, when humidity decreased toabout 75%, the link performed similarly to when humidity was around 85%.Therefore, humidity appears to affect the PER only when over a thresholdof about 90%. We observed the same trends for almost every pair of nodesin all deployments. We also noticed that, unlike humidity, temperature is notrelevant, at least in the period of our experiments. To some extent, this isexpected because temperature should affect the performance only when outsidethe hardware operating range ([−40oC,+60oC] in our case), whereas we alwaysobserved average temperatures in the [−9oC,+11oC] range.
Based on the results we just described, the considerations presented nextare derived on tests run under comparable environmental conditions.
5.1 Spatio-Temporal Characteristics of Links
Physical Layer. To characterize the network links, we ran a total of 650 PHY
tests in each deployment with varying DT. For now, we ignore periods withsignificant vehicular traffic in TRAFFIC, deferring the corresponding discussionto Section 5.4. By comparing the results across the three deployments, we drawthe following observations.
(1) The communication range measured in VINEYARD confirms previous re-sults [Zhao and Govindan 2003; Srinivasan et al. 2010]; in contrast, inboth tunnels the communication range is much greater than in VINEYARD.
1The chart was obtained from tests run on non-working days. In accordance with to the dataprovided by the local authorities, during this time span the vehicular traffic inside TRAFFIC is verylight. Thus it does not constitute a relevant factor in these experiments.
ACM Transactions on Sensor Networks, Vol. 7, No. 2, Article 15, Publication date: August 2010.

Not all Wireless Sensor Networks are Created Equal • 15:15
Fig. 7. PDR against distance from node 0.
(2) Similarly, the extent of the “grey areas” in VINEYARD matches knownresults [Zhao and Govindan 2003; Srinivasan et al. 2010]; instead, inboth tunnels grey areas span a significant fraction of the maximumcommunication range.
(3) In contrast to most WSN deployments reported in the literature, the linkperformance in both tunnels is quite stable over time.
The first observation is supported by the PDR data we obtained from PHY
tests. As an example, we consider the average PDR against distance, for packetssent by node 0 over 200 PHY experiments with DT = 10min, although the resultswe obtained for different DT are essentially the same. As Figure 7 illustrates,in both tunnels nodes more than 100m apart have a PDR as high as 94%.Figure 7(b) shows how this phenomenon is even more evident in TUNNEL, wherethe link between node 0 and 18 has PDR ≈ 96.67%, over a distance of about120m. Conversely, in VINEYARD the PDR drops abruptly with distance: nodesbarely communicate when more than 30m apart.
Figure 8 offers an aggregate view on the behavior of PDR, based on all650 PHY experiments. The trends show that in VINEYARD communication tendsto be localized, while a relevant fraction of the transmitter-receiver pairs inboth tunnels enjoys good reliability. The complementary cumulative distribu-tion function (CDF) for PDR shows that about 60% of the transmitter-receiverpairs in the two tunnels observe a PDR higher than 90%, while in VINEYARD this
ACM Transactions on Sensor Networks, Vol. 7, No. 2, Article 15, Publication date: August 2010.

15:16 • L. Mottola et al.
Fig. 8. Complementary CDF for PDR.
Fig. 9. Average PDR difference.
percentage drops to only 25%. We conjecture that these trends are due to thepeculiar shape of the tunnel environment and the corresponding waveguideeffect, which yields significant multipath effects. This may create construc-tive interferences resulting in extended communication range with respect tooutdoor environments [Molina-Garcia-Pardo et al. 2009]. Although our resultsare in accordance to known propagation models for tunnels, to the best of ourknowledge this is the first time that quantitative results obtained in a real-world setting are reported.
On the other hand, while constructive interference may appear in some ar-eas, others may experience destructive interference. This phenomenon is con-firmed in our PHY experiments. Indeed, we observed the existence of large “greyareas”, where physically close nodes experience large differences in PDR forpackets sent by the same transmitter, as already shown, for instance, in Fig-ure 7. Nevertheless, for a deeper understanding, we consider again transmis-sions from node 0 and, for each receiver i, we compute the absolute differencebetween PDR0→i and PDR0→ j , where j ranges among each of the four physi-cally closest neighbors of i. The results are illustrated in Figure 9 and 10(a).2
The former shows the average value over the four aforementioned neighbors.This value is markedly higher in both TRAFFIC and TUNNEL compared to VINEYARD,
2In Figures 10(a) and 10(b), data points along the diagonal of the base plane are excluded from theanalysis.
ACM Transactions on Sensor Networks, Vol. 7, No. 2, Article 15, Publication date: August 2010.

Not all Wireless Sensor Networks are Created Equal • 15:17
Fig. 10. Spatial and temporal characteristics of PDR.
showing that grey areas are more severe in tunnel environments. Figure 10(a)shows an alternative view that makes the spatial extent of grey areas moreevident. In both tunnels, these are larger than in VINEYARD, demonstrating thatconstructive/destructive interference has a greater impact in tunnels.
The temporal characteristics of packet reception in the two tunnels are alsopeculiar. We investigated this aspect both across and within experiments. Asfor the former, we ran 330 PHY tests with DT = 1min, randomly scatteredthroughout the entire time span of our study, to “sample” the links at differentpoints in time. Figure 10(b) depicts the standard deviation of PDR betweenany transmitter-receiver pair across all these experiments. The performanceof wireless links varies largely in VINEYARD, where the standard deviation ofPDR is significant only for physically close nodes, as farther ones often donot communicate at all. On the contrary, wireless links in the two tunnelsare quite stable, although some small changes are observed for almost everylink. To the best of our knowledge, similar behaviors where the link perfor-mance remains stable over large time scales are rarely observed in real-worldsettings.
ACM Transactions on Sensor Networks, Vol. 7, No. 2, Article 15, Publication date: August 2010.

15:18 • L. Mottola et al.
Fig. 11. Conditional packet delivery function (CPDF) in TUNNEL for a link with average PDR =94.73%. Negative values on the x-axis indicate previously missed packets.
To study the link behavior in the tunnels within individual experiments, wetook advantage of our access to TUNNEL and ran about 200 ad-hoc tests with onlyone node transmitting, using DT = 2s and varying δ, from 50ms to 250ms. Thistime, the other nodes logged every received packet on flash memory.3 Basedon this information, we computed the Conditional Packet Delivery Function(CPDF) as done by Srinivasan et al. [2010]. This describes the probabilitythat the current packet is received, based on whether the last k packets werereceived or missed. As shown by two sample charts in Figure 11, given thatthe behavior of wireless links in TUNNEL is either very good or very poor, mostof the CPDFs turn out to be flat and approaching the average PDR on thesame link. This indicates that losses are independent, confirming previousresults [Srinivasan et al. 2010].
These observations have deep implications on the performance of commonWSN MAC protocols, as described next.
Implications on MAC. To test the effectiveness of a CSMA MAC layer suchas the one in TinyOS, we ran about 200 MAC tests with varying DT and Pct. Halfof the tests were conducted using LPL with different SI.
Not surprisingly, in a very connected scenario like the two tunnels, con-current transmissions are very likely to generate collisions and thus packetlosses. In quantitative terms, when Pct approaches 40% almost no packet iscorrectly received. This performance was surprisingly bad, as one would ex-pect the CCA mechanism to alleviate the risk of collisions, at least to someextent. To investigate this aspect further, we went back to TUNNEL and carriedout some experiments with only some of the nodes, identifying some patho-logical configurations. Consider for instance a setting where only nodes 1, 2,and 18 are operating. Node 18 is very far from both node 1 and 2, as shownin Figure 4(a), and has no network-level visibility to either of them in eitherdirection, that is, PDR1→18 = PDR18→1 = 0 (similarly for node 2). In this config-uration, one would expect node 18 to affect communication between 1 and 2 onlyto a very limited extent. Therefore, in the worst case, assuming that the CCA
3The absence of a wired back-channel in TUNNEL, and the consequent use of flash memory to logreceived packets, prevented using δ <50ms.
ACM Transactions on Sensor Networks, Vol. 7, No. 2, Article 15, Publication date: August 2010.

Not all Wireless Sensor Networks are Created Equal • 15:19
Fig. 12. Performance of a CSMA MAC protocol in the tunnel environment.
mechanism constantly fails and therefore each concurrent transmission resultsin a packet loss, the PDR between 1 and 2 in MAC experiments should obey theexpression:
PDRworst−case:1→2 = PDR1→2 ∗ (1 − Pct)
Nevertheless, Figure 12(a) indicates that this is not the case. The PDR mea-sured with our MAC tests was lower than the worst-case, suggesting that node 18did have significant impact even without network-level visibility. We conjecturethat the additional noise caused by 18 was responsible for this behavior. Specif-ically, we mantain that the communication hardware at node 1 or 2 was notaccurate enough to recognize the on-going transmission from a far node, yet thenoise did corrupt the ongoing transmissions. We verified that the observed be-havior was not caused by malfunctioning hardware, by replacing node 1 and 2with other two nodes. On the other hand, when we repeated the same experi-ment without node 18, the measured PDR1→2 was on average 61% higher thanthe expected worst-case.
In addition to poor reliability, the phenomena above also cause relevantenergy consumption when asynchronous LPL layers are used, as in our MAC
tests. Transmissions from very far nodes induce frequent attempts to receivemessages that, however, turn out to be corrupted as they fail CRC checks.As these protocols usually employ some form of “delay after receiving,”4 theradio may end up staying on much longer than necessary. To quantify thisaspect, we compute the effective duty-cycle, that is, the fraction of time theradio is on over the entire test duration DT, based on the number Ract of radioactivations during the same test. Figure 12(b) depicts the corresponding trendsagainst different Pct, when LPL operates with SI = 250ms. When Pct goes above30%, in both tunnels the effective duty-cycle increases abruptly and the radioremains on most of the time. This behavior is not observed in VINEYARD, wherethe long-range noise effect is absent. Presumably, this time the communicationhardware failed in the opposite way with respect to the MAC experiments above,
4With this technique, MAC protocols keep the radio on after a receive attempt to favor packetbursts [TinyOS (a)].
ACM Transactions on Sensor Networks, Vol. 7, No. 2, Article 15, Publication date: August 2010.

15:20 • L. Mottola et al.
recognizing an attempt to transmit when the transmitted power was too low toguarantee a successful reception.
Tunnel-like environments have thus two deep implications on the behavior ofCSMA-like MAC protocols for WSNs: (i) collisions and noise due to concurrentpacket transmissions have a great impact on reliability even without link-level visibility of the nodes involved, and (ii) asynchronous LPL techniquessuffer from frequent failed attempts at receiving packets, yielding bad radioduty-cycling performance. Note how these findings implicitly suggest the use ofTDMA schemes (e.g., Rajendran et al. [2006]), as most of the issues above couldbe solved by controlling the transmission schedules. The temporal stability oflinks would also reduce the need for reconfiguring the schedules too frequently.However, the use of TDMA MAC protocols would come at the extra cost of timesynchronization. Unfortunately, at the time we conducted our tests we couldnot find stable implementations of TDMA MAC protocols for our platform toverify the argument. Nevertheless, the results we presented can be an assetto MAC designers in their investigation and further motivation to refine theexisting TDMA implementations.
5.2 Performance of Link Quality Estimators
Physical Layer. A number of approaches to evaluate the quality of networklinks, that is, their expected delivery performance, rely on information gatheredat the physical layer, such as RSSI and LQI. To investigate their performance,we refer to PHY tests with DT = 1 min as in Section 5.1, and look at thecorresponding LQI and RSSI. Our results suggest that:
(1) in all deployments, RSSI does not reflect accurately the link quality unlessits value crosses a threshold; in this case, however, it is useful to identifyonly very good links;
(2) contrary to most reported experiences and our own observations in VINE-YARD, in both tunnels a small number of LQI measurements suffice to iden-tify also links of intermediate quality.
To support the first observation, we consider about 125,000 data points〈RSSI, PDR〉 obtained from the aforementioned PHY tests where each nodesends 10 packets with DT = 1min. We round the former to the nearest integerRSSI and compute the average and standard deviation of all PDR valueswith the same RSSI. Figure 13 plots the results of this analysis. In all de-ployments, values of RSSI over −81dBm exhibit a sharp reduction in standarddeviation, and usually indicate a good link, that is, PDR > 80%. However, theydo not allow one to discern among different specific values of PDR in this range.Below −81dBm, instead, the standard deviation of RSSI readings is larger andthe same RSSI may be observed for good and bad links, which are thereforeindistinguishable based solely on this metric. We conjecture that the thresholdof −81dBm we observed is due to a combined effect of the radio sensitivitythreshold and of the environmental noise floor characteristic of our tunnels. Abetter understanding of this phenomenon, however, would require dedicatedinstrumentation.
ACM Transactions on Sensor Networks, Vol. 7, No. 2, Article 15, Publication date: August 2010.

Not all Wireless Sensor Networks are Created Equal • 15:21
Fig. 13. Relation between RSSI and average PDR with standard deviation.
Figure 14 supports the second observation by illustrating the relation be-tween LQI and PDR, similarly to the previous analysis. The results forVINEYARD in Figure 14(c) are in line with the existing literature [Srinivasanet al. 2010]. In this scenario, LQI can be used only to identify good links, asit shows high variability below 110. However, both tunnels exhibit a differentbehavior, characterized by three areas. Below 85, LQI values are very variable,although not as much as in VINEYARD. Between 85 and 110, the variability isreduced, making LQI a reasonably good estimator also for intermediate linkswith PDR > 50%. Above 110, LQI has a close correspondence with PDR.
These observations suggest that LQI should receive better consideration asan indication of the link quality in tunnel-like environments, as we discussnext.
Implications on Routing. To study the impact of these findings on CTP, weran 100 RTN tests with DT = 1 hour and IMI ranging5 from 30 to 10s. Basedon the corresponding results, we assessed that the ETX estimator used inCTP captures reasonably well the quality of links in the tunnels. Indeed, asFigure 15(a) illustrates, CTP yields good message delivery in both tunnels.The performance in VINEYARD is not as good, however, presumably because ofthe poor connectivity pointed out in Figure 8. Furthermore, ETX recognizes
5CTP is not really designed to sustain IMI < 30s. However, we wanted to stress its mechanisms toinvestigate how heavy network traffic impacts its performance.
ACM Transactions on Sensor Networks, Vol. 7, No. 2, Article 15, Publication date: August 2010.

15:22 • L. Mottola et al.
Fig. 14. Relation between LQI and average PDR with standard deviation.
Fig. 15. CTP performance.
the stability of network links in the tunnels, as Figure 15(b) highlights byplotting the average number of parent changes PT at some sample nodes. Theexperiments in TUNNEL and TRAFFIC indeed show a much smaller PT than inVINEYARD. Minimizing this figure is important in tree-based routing protocols,as frequent parent changes may cause temporary loops and thus redundanttransmissions. Moreover, in every deployment, nodes farther from the rootusually have a higher PT. This is due to the end-to-end nature of the ETX-based routing metric in CTP, which is likely to vary more as more physicallinks are travelled to reach the root, “accumulating” oscillations at each hop.
ACM Transactions on Sensor Networks, Vol. 7, No. 2, Article 15, Publication date: August 2010.

Not all Wireless Sensor Networks are Created Equal • 15:23
Fig. 16. Overlapping between ETX-based and LQI-based trees, in TUNNEL. The picture shows thelinks that are used more than 90% of the times in our CTP experiments and overlap with ourtopology based on LQI.
Nevertheless, we maintain that the properties shown by LQI in tunnelsare an asset protocol designers should leverage off in this environment. Insupport of this claim, we carry out the following exercise: we take the valuesof LQI in Figure 14 (from experiments with DT = 1min) and use them tocompute offline the values of a metric, alternative to ETX, used to derive therouting tree that maximizes end-to-end delivery. In a sense, we reconstructoff-line a routing topology similar to the one that LQI-based protocols such asMultiHopLQI [TinyOS (b)] would build.6 Next, at every minute during a 1-hourlong experiment, we log the shape of the CTP tree. Based on these data, weisolate the links used more than 90% of the time throughout an experiment.Figure 16 shows the links common to the two topologies, in TUNNEL. Surprisingly,there is a substantial overlapping: to make the topology connected, only 4 linksare missing. A similar exercise for TRAFFIC experiments yields 5 missing links.However, our logs show that ETX requires at least an order of magnitude moremessages per node to build such a topology.
5.3 Link Asymmetries
Physical Layer. According to Srinivasan et al. [2010], a link between node iand node j is said to be asymmetric if |PDRi→ j − PDRj→i| > 40%. Existingworks report that asymmetric links are mostly transient and presumably dueto the different noise floor at different nodes, or to miscalibrated hardware[Zuniga and Krishnamachari 2007]. We analyze asymmetric links by lookingat the results of PHY tests mentioned in Section 5.1, which lead to the followingconsiderations:
(1) as a consequence of the stability of network links in the tunnels, whenasymmetric links are present they are mostly permanent;
(2) in the two tunnels, link asymmetries seem to be related to node positioning;indeed, every asymmetric link was observed between nodes not in line-of-sight, although the opposite does not necessarily hold.
6While [TinyOS (b)] considers single LQI values, in this case LQI is the average of 10 LQI readingsobtained during PHY tests with DT = 1min.
ACM Transactions on Sensor Networks, Vol. 7, No. 2, Article 15, Publication date: August 2010.
15:24 • L. Mottola et al.
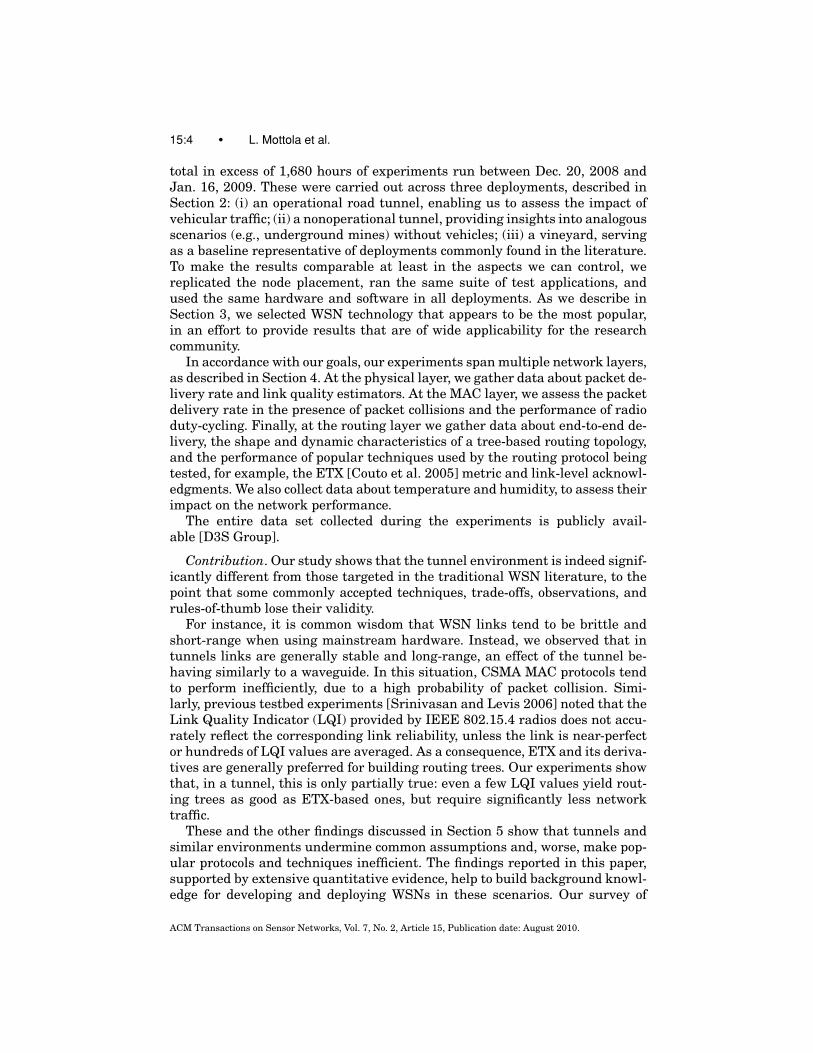
Fig. 17. Asymmetric links at example nodes. The node at the center is i such that PDRi→ j −PDR j→i > 40%. Thin lines denote bidirectional links, thick arrows denote asymmetric links.
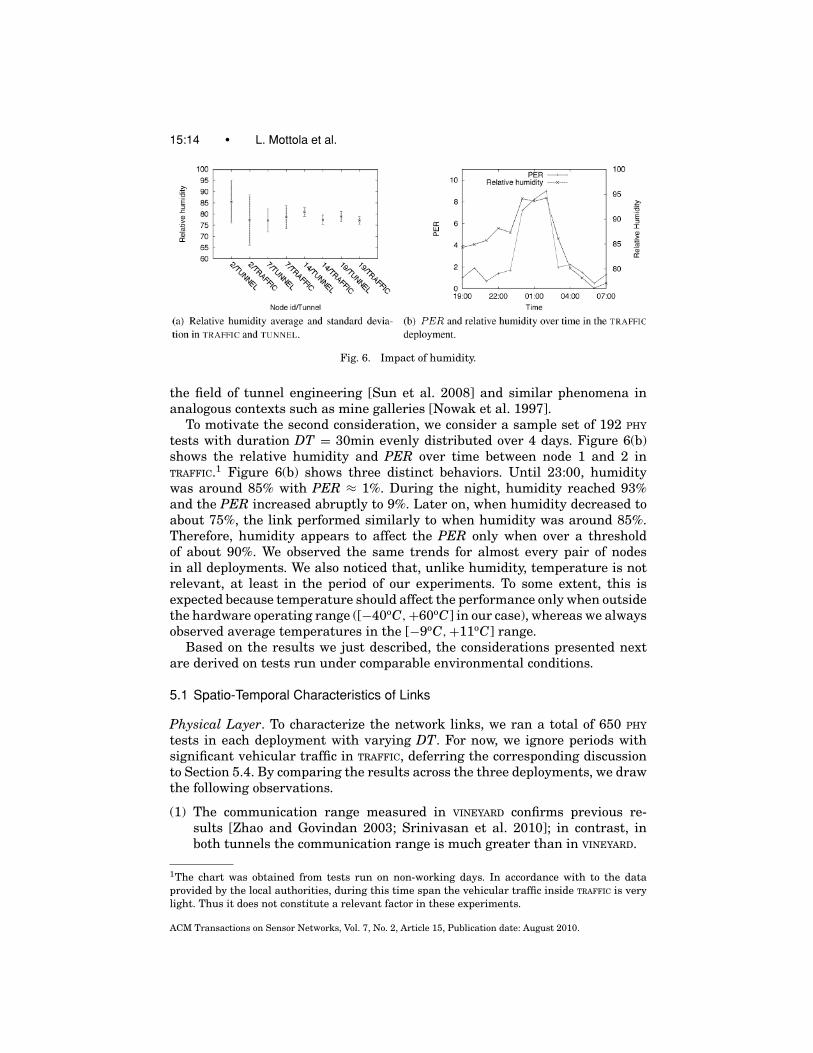
Fig. 18. Line-of-sight relations, represented by thin lines, at example nodes.
The first observation is supported by the results we already showed inFigure 10(b). Given the small variability of PDR among all transmitter-receiverpairs in the tunnels, an asymmetric link tends to remain so over time.
Figure 17 and 18 offer a graphical representation in support of the secondconsideration. For some sample nodes, Figure 17 depicts the links in TUNNEL
found to be asymmetric in at least 90% of our PHY tests, whereas Figure 18 rep-resents the line-of-sight relations between the chosen nodes and the remainingdevices. By overlapping the two pictures we note that link asymmetries “im-ply” the lack of line-of-sight, but the vice versa does not hold. The PHY resultswe obtained in TRAFFIC confirm this phenomenon, in that all nodes are roughlyin line-of-sight in this deployment and indeed we found no link asymmetries.This phenomenon, however, has serious implications on the performance ofWSN routing protocols, as explained next.
Implications on Routing. Asymmetric links are detrimental to the perfor-mance of CTP because of the link-level acknowledgement mechanism employedfor reliable delivery. If the bidirectional-link assumption is not valid, the proto-col ends up repeating the transmission a number of times, ultimately causingnetwork congestion.
ACM Transactions on Sensor Networks, Vol. 7, No. 2, Article 15, Publication date: August 2010.

Not all Wireless Sensor Networks are Created Equal • 15:25
Fig. 19. Average ACKfailed in CTP.
A closer look at the RTN tests discussed in Section 5.2 indeed reveals thatsome nodes suffer a much higher number of failed acknowledgments ACKfailed
compared to others, as Figure 19 illustrates. In particular, node 19 confirms ourhypothesis that link asymmetries are most likely the cause of failed acknowl-edgments. Our logs show that at the beginning of the experiments node 19often insisted in selecting node 2 as its parent—connected to 19 only throughan asymmetric link, as shown in Figure 17(c)—before eventually settling onnode 16. Instead, nodes 2 and 5, shown in Figure 17 to have asymmetric linksonly towards nodes very far from the CTP root, never selected any of those astheir parent.
These behaviors also evidence how ETX incurs a significant latency—up toseveral minutes in our experiments—before eventually recognizing and exclud-ing asymmetric links. From the perspective of routing protocol designers, thesefindings highlight that when reliability is provided with acknowledgment-likemechanisms, dedicated solutions are required to recognize asymmetric links.In addition, if the relation between link asymmetry and node placement wereto be systematically confirmed, WSN designers could devise mechanisms toprevent routing through links that are, based on the shape of the scenario athand, likely to be asymmetric.
5.4 Impact of Vehicular Traffic
Physical Layer. The availability of TRAFFIC was a unique opportunity to investi-gate the impact of vehicular traffic on the system behavior. We carried out thisanalysis by looking at the results of 100 PHY tests with DT = 30min run duringJan. 12–16, 2009. As these span the 24 hours, they include periods with bothlight traffic (late night, <100 vehicles/hour) and heavy traffic (early morning,>800 vehicles/hour). Information on the flow of vehicles inside the tunnel wasprovided by the local authorities based on the observations at a monitoringstation along the road leading to TRAFFIC. The results of our experiments formthe basis for the following considerations:
(1) vehicular traffic does impact the reliability of the network, especially forlinks of intermediate quality;
ACM Transactions on Sensor Networks, Vol. 7, No. 2, Article 15, Publication date: August 2010.

15:26 • L. Mottola et al.
Fig. 20. Impact of vehicular traffic.
(2) the links most affected are those between nodes on the opposite sides of thetunnel;
(3) as expected, link disruptions are largely transient.
Figure 20(a) provides quantitative support for the first observation. We plotthe complementary CDF for PDR, with light and heavy vehicular traffic. Thereis a substantial gap between the two curves until the PDR reaches 90%. Partic-ularly, the largest gaps are observed for links whose PDR is between 40% and80%. These links are more susceptible than others to temporary disruptions.On the other hand, when the transmission between two nodes is very reliable,vehicles have only limited impact.
To investigate the spatial characteristics of link disruptions, we computethe measured probability that no packet is delivered through any of the linksacross the road, according to the following formula:
PERroad =∏
i∈odd
∏
j∈even
(PERi→ j · PERj→i),
where odd and even are the nodes on either side of the tunnel, as shown inFigure 2. In statistical terms, PERroad represents the aggregate PER betweennodes on opposite sides of the tunnel.
Figure 20(b) plots PERroad and the average hourly vehicular traffic againsttime of day. Remarkably, the former closely follows the traffic trends. On theother hand, our data do not show relevant changes in PDR for links betweennodes on the same side of the tunnel. This is further confirmed by looking atthe variability of PDR over time. To this end, Figure 21 illustrates differentviews on the PDR standard deviation across all PHY experiments in TRAFFIC.Figure 21(a) considers only transmissions from node 0. The PDR is an order ofmagnitude more when the receiver is on the side opposite to where node 0 is de-ployed, compared to situations where the receiver is on the same side of node 0.Figure 21(b) and 21(c)7 complement this analysis by considering transmissions
7Data points along the diagonal of the base plane are excluded from the analysis.
ACM Transactions on Sensor Networks, Vol. 7, No. 2, Article 15, Publication date: August 2010.

Not all Wireless Sensor Networks are Created Equal • 15:27
Fig. 21. PDR standard deviation in TRAFFIC, with heavy vehicular traffic.
between all pairs of nodes, therefore illustrating the spatial trends. Figure 21(b)shows that heavy traffic causes the links connecting nodes on opposite sidesto experience transient disruptions. Instead, links between nodes on the sameside are largely unaffected by traffic: the trends in Figure 21(c) are compa-rable to the average ones in Figure 10(b) for TRAFFIC. Therefore, our resultsquantitatively confirm the last two observations above.
To the best of our knowledge, we are the first to investigate the impact ofvehicular traffic on WSN transmissions and to provide quantitative data tocharacterize it. Next, we provide some insights into how these observationsaffect the behavior of routing protocols like CTP.
Implications on Routing. To study this aspect, we ran 100 RTN tests withDT = 30min and IMI = 30s interleaved with the previous PHY tests. Generally,the temporary link disruptions caused by heavy traffic increase the dynamicityof the environment, yet CTP is able to cope with this scenario. The messagedelivery ratio is indeed almost the same as with light traffic. However, thisoccurs at the cost of a drastic increase in resource consumption. An indicationof this comes from the higher ACKfailed and corresponding retransmissions,illustrated in Figure 22. Most likely, these are a direct result of the temporarylink disruptions discussed above. Moreover, these also affect the ETX metric,yielding frequent parent changes. In turn, this causes temporary routing loops,resulting in a higher number of duplicates DUP in the presence of heavy traffic,also shown in Figure 22.
ACM Transactions on Sensor Networks, Vol. 7, No. 2, Article 15, Publication date: August 2010.

15:28 • L. Mottola et al.
Fig. 22. DUP and ACKfailed in CTP with light and heavy vehicular traffic.
It is also interesting to analyze which links are most used by CTP underheavy traffic. Figure 23(a) depicts the links used more than 90% of the times8
under light traffic. Figure 23(b) shows the same metric under heavy traffic. Inthe former case these links are more numerous, and many connect nodes onopposite sides. In the latter case, not only there are fewer links used often, butalmost all frequently used links connect nodes on the same side, unless a node isvery close to the CTP root. This behavior was expected, as it is the most naturalway for ETX to react to the characteristics of the physical layer we discussedabove. The decrease in the number of links used often is a consequence of theincreased variability of the link performance, whereas their particular locationis the effect of temporary link disruptions between nodes on opposite sides ofthe tunnel.
The observations discussed here, especially those regarding the resourceconsumption of CTP to sustain good performance in this setting, suggest thatphenomena like link disruptions caused by heavy vehicular traffic deserve moreattention. As part of our future work, we plan to investigate a link quality met-ric immune to these phenomena, allowing us to establish routes independentlyof vehicular traffic, and to design reliability mechanisms that take into accountthis kind of temporary link disruption.
6. RELATED WORK
The scientific literature related to our work can be divided in three classes: (i)analytical propagation models for tunnel-like environments obtained from, orverified with, short-term experimental results gathered with specialized equip-ment; (ii) experiences from real-world WSNs deployments; and (iii) systematicstudies on low-power wireless transmissions, mostly performed in controlledtestbeds. The pragmatic, system-oriented perspective we took distinguishesour work from those in (i). Indeed, these works focus on issues such as decidingthe optimal modulation scheme in a tunnel-like environment, while in our case
8These links do not necessarily form a fully connected topology. For instance, node 11 is notconnected by any of these links: its data will be relayed through links (not shown here) that areused less than 90% of the times.
ACM Transactions on Sensor Networks, Vol. 7, No. 2, Article 15, Publication date: August 2010.

Not all Wireless Sensor Networks are Created Equal • 15:29
Fig. 23. Links used at least 90% of the times by CTP in TRAFFIC.
these aspects are dictated by the WSN platform we chose. On the other hand,our work can be regarded as a combination of the approaches taken in (ii) and(iii), with the goal to increase the intrinsic value of our results to WSN de-signers. However, it should be noted that the works in (iii) focus mostly on thephysical layer with a few exceptions considering also non-duty-cycling MACprotocols. In contrast, our study extends up to the routing layer, which bears amore direct impact on the application performance.
Propagation Models. Because of their ability to act as an “oversized waveg-uide” [Molina-Garcia-Pardo et al. 2009], tunnel-like environments have beenquite extensively studied in the field of wireless communications. In their recentwork, Molina-Garcia-Pardo et al. [2009] investigate the electromagnetic fieldstatistics in an arched tunnel across frequency bands from 2.8GHz to 5GHzto develop a detailed channel model. Sun and Akyildiz [2008] present a multi-mode channel model for road tunnels and subways, able to determine the pathloss and delay spread at any point along the tunnel. Earlier works (e.g., Wangand Yang [2006]) focus on understanding the behavior of wireless propagationat frequencies used by mobile telephony. As already mentioned, these workshave different and complementary goals with respect to ours. However, theresults reported in this article could be used to verify the existing analyticalpropagation models against experimental findings.
Application Deployments. A number of application deployments witness be-haviors similar to the ones we observed in VINEYARD. For instance, Mainwaringet al. [2002] report poor system performance in outdoor environments with sig-nificant vegetation, using WSN platforms operating in the 400/900MHz band.However, the authors also acknowledge problems with their implementation,
ACM Transactions on Sensor Networks, Vol. 7, No. 2, Article 15, Publication date: August 2010.

15:30 • L. Mottola et al.
which makes their results difficult to compare with ours. Thelen et al. [2005]report about a deployment in potato fields where the link layer performanceimproves with high humidity, contrary to our findings in all deployments. Weconjecture that this is due to the radio technology they employed (400MHzband) and the placement of nodes close to the ground.
Grape monitoring is investigated, for instance, in Beckwith et al. [2004],where the authors report a partial failure of the WSN due to connectivity issues.However, no quantitative data is gathered to analyze the corresponding causes.The use of WSNs is also reported in environments analogous to our tunnels,such as metropolitan subways [Cheekiralla 2005], underground mines [Li andLiu 2009], and service pipes [Sabata and Brossia 2005]. However, to the bestof our knowledge, a characterization of the performance of low-power wirelesstransmissions in these scenarios is largely missing.
Systematic Studies. Srinivasan et al. [2010] carry out a comprehensive studyon IEEE 802.15.4 radios in the absence of concurrent transmissions. Theirobjective is different from ours in that they mostly aim to study the link-layer behavior on tiny time scales, to provide guidelines on fine-grained designdecisions such as scheduling re-transmissions at the MAC layer. Because ofour practical need to develop a real-world, efficient WSN system, we weremore interested in the long-term behaviors affecting macro design decisions,for example, whether to choose a CSMA or a TDMA MAC protocol.
The symmetry of WSN links is the subject of several studies [Srinivasanet al. 2010; Zuniga and Krishnamachari 2007; Reijers et al. 2004], yet generalconclusions are still to come. Srinivasan et al. [2010] notice that asymmetriclinks are mostly transient and due to differences in the noise floor. Zuniga andKrishnamachari [2007] analyze link asymmetries due to imperfections in thehardware that may cause variations in the power output during transmissions.Both Zhou et al. [2004] and Reijers et al. [2004] investigate the effect of antennaorientation on the generation of asymmetric links. In contrast to these works,in TUNNEL we observed asymmetric links to be permanent and related to nodeplacement.
Zhao and Govindan [2003] study the link characteristics using low-powerradios in the 800/900MHz band. They verify that grey areas may extend to upto one third of the communication range, and conjecture that multi-path effectsare the cause. The analytical models defined by Zuniga and Krishnamachari[2004] confirm this hypothesis. The results we presented in Section 5.1 alsoconcur, although we use a different wireless technology. Zhao and Govindan[2003] also hint at a MAC-level neighbor filtering mechanism to address thisissue. This solution, however, is unlikely to work in a tunnel because of theinfluence of far transmitters without link-layer visibility, as we illustrated inSection 5.1.
Several experimental studies exist whose objective is to derive syntheticmodels to use in simulations. For instance, Son et al. [2006] focus on under-standing the effect of concurrent transmissions and on their modeling in sim-ulation. Anastasi et al. [2005] study factors such as distance from the groundand transmission data rate, and derive corresponding analytical models. These
ACM Transactions on Sensor Networks, Vol. 7, No. 2, Article 15, Publication date: August 2010.

Not all Wireless Sensor Networks are Created Equal • 15:31
works are complementary to ours. By making our data publicly available [D3SGroup], we aim to provide further input to similar investigations.
Understanding the characteristics of WSN links in indoor environments hasreceived particular attention. For instance, Lal et al. [2003] present an ex-perimental study on wireless link quality in office environments to derive alink cost metric that minimizes the necessary channel measurements. Tanget al. [2007] perform extensive experimental studies to understand the effect ofobstacles and moving objects in factory environments. As already mentioned,road tunnels bring together elements from both indoor and outdoor deploy-ments. For instance, despite being delimited by walls, there are no fixed obsta-cles in the tunnels. Thus, they represent a unique setting for which we are thefirst to report a quantitative characterization based on extensive experimentalstudies.
Finally, some works explored the use of external antennas in WSNs. Anexample is the work by Raman et al. [2006], where different external anten-nas are tested in a narrow-road and a dense-foliage environments. Using aparabolic antenna, the authors reach communication ranges up to 800m whenthe nodes are in line of sight, leading to the conclusion that 1-hop topologiesand centralized routing may be a viable alternative to multi-hop topologies anddistributed routing. However, as already mentioned, in our scenario the use ofexternal antennas would drastically increase costs and complicate the installa-tion, while in the tunnels the on-board antenna already enables communicationranges above 100m.
7. CONCLUSIONS AND FUTURE WORK
In this article, we reported about an extensive experimental study on the be-havior and performance of WSNs in tunnels. We analyzed the behavior of thephysical layer in real road tunnels, and its impact on the operation of com-monly employed MAC and routing protocols. We showed that some popularnetworking techniques are ill-suited to the tunnel environment, and providedguidelines to support the design of more efficient solutions.
The results we presented are an asset for the community at large, althoughthey were originally motivated by the needs of the TRITon project. The completedata set gathered during our experiments is publicly available [D3S Group].Our immediate plans are to apply our findings in the TRITon project, beginningwith the design of a dedicated MAC layer providing an efficient foundation forhigher-level protocols.
ACKNOWLEDGMENTS
The authors wish to thank the Autonomous Province of Trentino, and in partic-ular the Department of Road Management (Servizio Gestione Strade) that par-tially funded the TRITon project and therefore this work, for making availableto us the tunnels and related traffic data described in this article. The authorsalso wish to thank the Edmund Mach Foundation, in S. Michele all’Adige, Italy,for making their vineyards available to us, and for their logistical support withthe experimental setup.
ACM Transactions on Sensor Networks, Vol. 7, No. 2, Article 15, Publication date: August 2010.

15:32 • L. Mottola et al.
REFERENCES
ANASTASI, G., BORGIA, E., CONTI, M., GREGORI, E., AND PASSARELLA, A. 2005. Understanding thereal behavior of mote and 802.11 ad hoc networks: An experimental approach. Elsevier PervasiveMobile Comput. J. 1, 2, 237–256.
BECKWITH, R., TEIBEL, D., AND BOWEN, P. 2004. Unwired wine: Sensor networks in vineyards. InProceedings of IEEE Sensors. IEEE Computer Society Press, Los Alamitos, CA, 561–564.
CHEEKIRALLA, S. 2005. Wireless sensor network-based tunnel monitoring. In Proceedings of theRealWSN Workshop.
CHIPCON TECH. CC2420 Datasheet. focus.ti.com/docs/prod/folders/print/cc2420.html. (Ac-cessed on 1/2010.)
COSTA, P. ET AL. 2007. The RUNES middleware for networked embedded systems and its appli-cation in a disaster management scenario. In Proceedings of the 5th International Conference onPervasive Communications. IEEE Computer Society Press, Los Alamitos, CA, 69–78.
COUTO, D. D., AGUAYO, D., BICKET, J., AND MORRIS, R. 2005. A high-throughput path metric formulti-hop wireless routing. Wirel. Netw. 11, 4, 419–434.
D3S GROUP. Comparative Study on Tunnels - Data Sets. d3s.disi.unitn.it/tunnelvineyard.ELSON, J., GIROD, L., AND ESTRIN, D. 2002. Fine-grained network time synchronization using
reference broadcasts. SIGOPS Operat. Syst. Rev. 36, SI, 147–163.GNAWALI, O., FONSECA, R., JAMIESON, K., MOSS, D., AND LEVIS, P. 2009. The collection tree protocol.
In Proceedings of the 7th International Conference on Embedded Networked Sensor Systems(SenSys). ACM, New York, 1–14.
HILL, J., SZEWCZYK, R., WOO, A., HOLLAR, S., CULLER, D., AND PISTER, K. 2000. System architecturedirections for networked sensors. In Proceedings of the 9th International Conference on Archi-tectural Support for Programming Languages and Operating Systems (ASPLOS-IX). ACM, NewYork, 93–104.
LAL, D., MANJESHWAR, A., HERRMANN, F., UYSAL-BIYIKOGLU, E., AND KESHAVARZIAN, A. 2003. Mea-surement and characterization of link quality metrics in energy constrained wireless sensornetworks. In Proceedings of the International Global Telecommunications Conference (GLOBE-COM). IEEE Computer Society Press, Los Alamitos, CA, 446–452.
LI, M. AND LIU, Y. 2009. Underground coal mine monitoring with wireless sensor networks. ACMTrans. Sensor Netw. 5, 2, 1–29.
MAINWARING, A., CULLER, D., POLASTRE, J., SZEWCZYK, R., AND ANDERSON, J. 2002. Wireless sensornetworks for habitat monitoring. In Proceedings of the 1st International Workshop on WirelessSensor Networks and Applications. ACM, New York, 88–97.
MOLINA-GARCIA-PARDO, J., LIENARD, M., AND DEGAUQUE, P. 2009. Propagation in tunnels: Experi-mental investigations and channel modeling in a wide frequency band for MIMO applications.EURASIP J. Wireless Comm. Netw., 3, 1–9.
NOWAK, B., FILEK, K., AND SINHA, A. 1997. Temperature and humidity of cooled air in mininggalleries. In Proceedings of the 6th International Mine Ventilation Congress. Society for Mining,Metallurgy, and Exploration.
POLASTRE, J., SZEWCZYK, R., AND CULLER, D. 2005. Telos: Enabling ultra-low power wireless re-search. In Proceedings of the 5th International Conference on Information Processing in SensorNetworks (IPSN). IEEE Computer Society Press, Los Alamitos, CA, 48.
RAJENDRAN, V., OBRACZKA, K., AND GARCIA-LUNA-ACEVES, J. J. 2006. Energy-efficient, collision-freemedium access control for wireless sensor networks. Wirel. Netw. 12, 1.
RAMAN, B., AND CHEBROLU, K. 2008. Censor networks: a critique of “sensor networks” from asystems perspective. SIGCOMM Comput. Comm. Rev. 38, 3, 75–78.
RAMAN, B., CHEBROLU, K., MADABHUSHI, N., GOKHALE, D., VALIVETI, P., AND JAIN, D. 2006. Implica-tions of link range and (in)stability on sensor network architecture. In Proceedings of the 1stInternational Workshop on Wireless Network Testbeds, Experimental Evaluation & Characteri-zation. ACM, New York, 65–72.
REIJERS, N., HALKES, G., AND LANGENDOEN, K. 2004. Link layer measurements in sensor networks.In Proceedings of the International Conference on Mobile Ad-hoc and Sensor Systems (MASS).IEEE Computer Society Press, Los Alamitos, CA, 224–234.
ACM Transactions on Sensor Networks, Vol. 7, No. 2, Article 15, Publication date: August 2010.
Not all Wireless Sensor Networks are Created Equal • 15:33
SABATA, A., AND BROSSIA, S. 2005. Remote monitoring of pipelines using wireless sensor network.US Patent Application 20050145018.
SON, D., KRISHNAMACHARI, B., AND HEIDEMANN, J. 2006. Experimental study of concurrent trans-mission in wireless sensor networks. In Proceedings of the 4th International Conference onEmbedded Networked Sensor Systems (SenSys). ACM, New York, 237–250.
SRINIVASAN, K., DUTTA, P., TAVAKOLI, A., AND LEVIS, P. 2010. An empirical study of low powerwireless. ACM Trans. Sens. Netw. To appear.
SRINIVASAN, K., AND LEVIS, P. 2006. RSSI is under-appreciated. In Proceedings of the 3rd Interna-tional Workshop on Embedded Networked Sensors (EmNets). emnets@eecs,harvard,edu.
SUN, Y.-J., LI, J., CAO, J., LU, S.-L., AND SHI, Y. 2008. Small variation of annual temperature indeep tunnel can produce annual variation in tilt and strain. Acta Seismologica Sinica 21, 5,464–473.
SUN, Z., AND AKYILDIZ, I. 2008. Channel modeling of wireless networks in tunnels. In Proceed-ings of the International Global Telecommunications Conference (GLOBECOM). IEEE ComputerSociety Press, Los Alamitos, CA, 158–162.
TANG, L., WANG, K.-C., AND GU, Y. H. F. 2007. Channel characterization and link quality assess-ment of IEEE 802.15.4-compliant radio for factory environments. IEEE Trans. Indust. Inf. 3, 2,99–110.
THELEN, J., GOENSE, D., AND LANGENDOEN, K. 2005. Radio-wave propagation in potato fields. InProceedings of 1st Workshop on Wireless Network Measurements. IEEE Computer Society Press,Los Alamitos, CA.
TINYOS (a). TEP 105—Low Power Listening. www.tinyos.net. (Accessed on 1/10.)TINYOS (b). TEP 119—Collection. www.tinyos.net. (Accessed on 1/10.)TINYOS (c). TEP 123—Collection Tree Protocol. www.tinyos.net. (Accessed on 1/10.)TINYOS (d). TEP 126—CC2420 Radio Stack. www.tinyos.net. (Accessed on 1/10.)WANG, T.-S., AND YANG, C.-F. 2006. Simulations and measurements of wave propagations in curved
road tunnels for signals from GSM base stations. IEEE Trans. Antennas Propag. 54, 9, 2577–2584.
ZHAO, J., AND GOVINDAN, R. 2003. Understanding packet delivery performance in dense wirelesssensor networks. In Proceedings of the 3rd International Conference on Embedded NetworkedSensor Systems (SenSys). ACM, New York, 1–13.
ZHOU, G., HE, T., KRISHNAMURTHY, S., AND STANKOVIC, J. 2004. Impact of radio irregularity onwireless sensor networks. In Proceedings of the 2nd International Conference on Mobile Systems,Applications, and Services (MobiSys). ACM, New York, 125–138.
ZUNIGA, M. AND KRISHNAMACHARI, B. 2004. Analyzing the transitional region in low power wirelesslinks. In Proceedings of the International Conference on Sensors and Ad-hoc Communicationsand Networks (SECON). IEEE Computer Society Press, Los Alamitos, CA, 517–526.
ZUNIGA, M. AND KRISHNAMACHARI, B. 2007. An analysis of unreliability and asymmetry in low-power wireless links. ACM Trans. Sensor Netw. 3, 2, 63–81.
Received June 2009; revised March 2010 and April 2010; accepted April 2010
ACM Transactions on Sensor Networks, Vol. 7, No. 2, Article 15, Publication date: August 2010.