Embed Size (px)
Citation preview

15-1
Note 15 Properties of Bulk MatterSections Covered in the Text: Chapter 16
In this note we survey certain concepts that comprisethe macroscopic description of matter, that is to say,matter in bulk. These include temperature, pressureand changes in phase. We shall touch on the variousstates of matter, namely solids, liquids and gases, butwe shall focus primarily on gases, the simplest macro-scopic systems. We have already discussed certainmacroscopic aspects of fluids in Notes 13 and 14.These ideas were organized by scientists who are seentoday as the founders of modern chemistry.
Matter in BulkBy matter in bulk we mean matter in a quantity to beseen, touched or weighed. At a given temperature andpressure a substance is either a solid, liquid or gas.Water, the best-known substance, is a solid (ice) at apressure of 1 atm and temperature of 0 ˚C and below.Between 0 ˚C and 100 ˚C water is a liquid, and above100 ˚C it is a gas (in the form of steam or water vapor).The solid, liquid and gaseous states of a substance arecalled phases. When a substance melts (or freezes) andboils (or condenses) it is said to undergo a phasechange. We shall discuss phase changes in more detaillater in this note. The three phases of matter can bedescribed succinctly as follows.
SolidA solid is a rigid macroscopic system with a definiteshape and volume. It consists of particle-like atomsconnected together by molecular bonds. Each atomvibrates about an equilibrium position, but an atom isnot free to move around inside the solid. A solid isnearly incompressible, meaning that the atoms areabout as close together as they can get.
LiquidLike a solid, a liquid is nearly incompressible too. Aliquid flows and deforms to fit the shape of itscontainer. The molecules are held together by weakmolecular bonds and are therefore free to movearound.
GasEach molecule in a gas moves through space as a free,noninteracting particle until, on occasion, it collideswith another molecule or with the wall of the con-tainer. A gas, like a liquid, is a fluid. It is also highlycompressible, meaning that a lot of space existsbetween molecules.
State VariablesMatter in bulk is described by so-called state variables.These variables include volume V, pressure p, mass M,mass density ρ, thermal energy Eth and temperature T. Ifany one state variable is changed then the state of thesystem as a whole is changed.
All MatterThe fundamental building block of all matter is theatom. An example is atomic hydrogen. However, somestates of matter, many gases for example, are bestdescribed in terms of a grouping of atoms called amolecule. To form a molecule two or more atoms bindtogether via a combination of electrostatic andquantum mechanical processes that we shall not gointo here. The complexity of molecules varies widelyfrom the simplest, hydrogen gas, which consists ofonly two atoms of hydrogen, to the complex, likeDNA, that typically consists of many thousands ofatoms.
Atoms and MoleculesThe idea that matter consists of indivisible entitiescalled “atoms” dates back 2500 years. The Greekphilosopher Democritus (460-370 BC) speculated thatrepeated subdivision of matter would eventuallyyield a smallest unit which could not be furthersubdivided. The earliest quantitative ideas wereformulated at the beginning of the 19th century byDalton (1800) and others.
A Few DefinitionsFrom experiments too numerous to go into here weknow today that an atom consists of a nucleus madeup of protons and neutrons, and electrons moving instable orbits about the nucleus. A proton has apositive charge +e, an electron a negative charge –eand a neutron no charge. The best measurements of eyield the value 1.609 x 10⁻¹⁹ Coulombs (C) (to 4significant digits). An atom is electrically neutral; thenumber of electrons surrounding the nucleus equalsthe number of protons in the nucleus. 1
The atomic number Z is the number of protons in thenucleus (or the number of electrons circling the nuc-leus). The atomic mass number A is the number of pro-tons plus neutrons in the nucleus. The number A is
1 We shall be discussing electric charge in detail starting in Note20.
Note 15
15-2
conventionally written as a leading superscript on thesymbol for the atom, for example 1H for hydrogen.Isotopes are atoms that differ only in the number ofneutrons in the nucleus. Atomic hydrogen has 3isotopes, hydrogen 1H, deuterium 2H and tritium 3H.A selection of elements and their A numbers is listedin Table 15-1.
Table 15-1. A selection of elements and their atomic massnumbersElement A1H Hydrogen 17He Helium 412C Carbon 1214N Nitrogen 1416O Oxygen 16
Atomic and Molecular MassThe mass of an atom or molecule is expressed mostfundamentally in the absolute unit kg. The mass of anatom of atomic hydrogen is 1.674 x 10⁻²⁷ kg (expressedto 4 significant digits). This is a very small number.
It is convenient to express an atomic (and molecular)mass not in this absolute unit but in a relative unit.The relative unit is based on a scale in which the massof the isotope of carbon, 12C, is taken to be exactly 12units—atomic mass units (abbreviated u). That is,m(12C) = 12 u. The atomic mass of any other atom is itsmass relative to 12C. For example, careful experimentswith hydrogen have established that the mass ratiom(1H)/m(12C) is 1.0078/12. Thus the atomic mass ofhydrogen is m(1H) = 1.0078 u. Some examples ofatomic masses are listed in Table 15-2. 2
Table 15-2. Examples of atomic and molecular masses.The approximate values can be used in calculations.
Type Symbol At. mass (u) Approx (u)atomic 1H 1.0078 1molecular H2 2.016 2atomic 12C 12.000 12atomic N 14.007 14molecular N2 28.014 28molecular NH3 17.031 17
A molecule’s molecular mass is the sum of the atomicmasses of the atoms forming the molecule. Notice that 2 The author of our textbook uses the lower-case letter m to denotethe mass of an atom or molecule, and we shall do likewise.
the atomic and molecular masses are nearly integers.The fourth column in Table 15-2 contains the atomicor molecular mass rounded to an integer; this numberis sufficiently accurate to use in most calculations.NOTE: An element’s atomic mass (e.g., 1.0078 for 1H) isnot the same as the atomic number (1 for 1H). Theatomic number, which is the element’s position in theperiodic table, is the number of protons in theelement’s nucleus.
Mole and Molar MassIn chemistry where substances in everyday amountsare weighed on a balance and mixed it is convenientto use what is called a molar mass. (Note the use of thelower case mole, not Mole.) By definition,
one mole of a substance (abbreviated 1 mol), whethersolid, liquid or gas, is the amount of substance thatcontains as many basic particles as there are atoms in 12g of 12C. 3
A basic particle may be an atom or a molecule. Forexample, the basic particle of Helium, which is amonatomic gas, is the helium atom. The basic particleof oxygen gas, which is a diatomic molecule, is theoxygen molecule. The number of basic particles in amole has been carefully measured. It has the value
€
NA = 6.02 ×10²³ mol–1.
This number, denoted NA, is called Avogadro’s number.NA has units; they are number of basic particles per mole.Thus the number of moles n in a substance containingN basic particles is
€
n =NNA
. …[15-1]
Since NA 12C atoms have a mass of 12 g, the mass of asingle 12C atom is
€
m =12(g)
6.02×1023= 1.993×10⁻²³g = 1.993×10⁻²⁶kg .
The conversion factor between atomic mass units andkilograms is
3 The definition of the mole given here may differ from its defin-ition in your chemistry text or in the physics text you used in highschool. This is the definition given in our textbook, and to avoidconfusion the definition we shall use.
Note 15
15-3
€
1u =m(12C)12
=1.993×10⁻²⁶ (kg)
12= 1.661×10⁻²⁷kg.
Some examples of molar masses are listed in Table 15-3. Thus the molar mass of a substance is the mass ingrams of 1 mol of the substance. We shall denote themolar mass by Mmol. The number of moles n in asystem of mass M (g) consisting of atoms or moleculeswith molar mass Mmol is given by:
€
n =M(g)Mmol
. …[15-2]
Table 15-3. A selection of molar massesSubstance molar mass (g)molecular hydrogen (H2) 2.016atomic nitrogen (N) 14.007ammonia (NH3) 17.031
It is important to note that M and Mmol in eq[15-2] areexpressed in grams not kilograms. Let us consider anexample using moles.
Example Problem 15-1Calculating the Number of Moles in a Quantity ofOxygen
How many moles are contained in 100 g of oxygengas?
Solution:The basic particle in oxygen gas is the oxygen mole-cule (O2). The molecular mass of the O2 molecule is m= 32 u. Converting this to kg, we get the mass of onemolecule to be
€
m = 32(u) × 1.661×10⁻²⁷ (kg)
1u= 5.31×10⁻²⁰ kg.
The number of molecules in 100 g = 0.100 kg is
€
N =Mm
=0.100(kg)
5.31×10⁻²⁰(kg)=1.88 ×1024 .
The number of moles is therefore this number dividedby Avogadro’s number:
€
n =NNA
=1.88 ×1024
6.02 ×1023= 3.13 mol.
Alternatively, we can use eq[15-2] to find n moredirectly
€
n =M(g)
Mmol (g.mol−1)
=100(g)
32(g.mol−1)= 3.13 mol.
The Periodic TableElectronic properties of elements are summarized inthe periodic table of the elements. The table wasinvented by Mendeleev in 1869. He found that byarranging the elements in order of increasing atomicmass, regularly-recurring properties were revealed.By so arranging the 62 elements then known, hepredicted that unknown elements would soon bediscovered to fill the gaps. With the guidance of hispredictions of their chemical and physical properties,three new elements were discovered in the next fewyears, providing striking confirmation of the generalcorrectness of his ideas. However, a full understand-ing of the periodic table had to await the developmentof the quantum mechanics of many electron atoms.We shall leave this aspect of matter to a course inchemistry.
Another topic concerning matter in bulk is thermo-dynamics. Thermodynamics is the study of the flow ofheat. The laws of thermodynamics relate heat flow,work, and thermal energy. In order to study the flowof heat, it is necessary to introduce a new physicalquantity called temperature. But before doing so weintroduce two related concepts, thermal contact andthermal equilibrium.
Two objects are said to be in thermal contact if heat canbe exchanged between them without work beingdone.
If two objects are placed in thermal contact with eachother, and no net heat exchange occurs between them,then they are said to be in thermal equilibrium. 4
We are now in a position to discuss temperature inqualitative terms.
4 We don’t yet know precisely what heat is. For the moment weshall have to be content with our intuitive sense of the concept. Weshall be discussing heat in detail in Notes 16, 17 and 18.
Note 15
15-4
TemperatureWe live with the idea of temperature every day. Weknow that temperature has something to do with“hotness” or “coldness”. We know that we can“measure” the hotness or coldness with a devicecalled a thermometer.
The idea of temperature can be understood by con-sidering a number of everyday situations. Considertwo objects that are not in thermal equilibrium. If theyare placed in thermal contact, then heat flows betweenthem until they reach thermal equilibrium.
If two objects A and B are not in thermal contact,then how can we tell whether they are in thermalequilibrium with each other? We can tell by doing thefollowing:
1 Place a thermometer C in thermal contact with A,and wait for thermal equilibrium to occur (i.e. waituntil the reading of the thermometer is steady).
2 Now place thermometer C in thermal contact withB, and wait for thermal equilibrium to occur. If thetwo readings of the thermometer are the same, thenA and B are in thermal equilibrium with each other.
These observations are expressed by the zeroth law ofthermodynamics.
Zeroth law of thermodynamicsThe zeroth law of thermodynamics can be stated inthese words:
If two objects A and B are separately in thermal equilib-rium with object C, then they are in thermal equilibriumwith each other.
In order to establish a quantitative scale of tempera-ture, it is necessary to adopt some particular kind ofthermometer.
ThermometersA thermometer measures the temperature of a systemby displaying the change in some physical property,such as
a) length of a solidb) volume of a liquidc) pressure of a gas at constant volumed) volume of a gas at constant pressuree) electrical resistance of a conductorf) colour of a very hot object
To understand the working of a thermometer basedon a) or b) we need to know something about how a
solid responds to a change in temperature. In otherwords, we need to know something about the thermalexpansion/contraction of the substance.
Thermal expansionThermal expansion is a macroscopic property. It is aconsequence of the temperature-induced change inthe average separation between atoms. There are twokinds of thermal expansion: linear expansion andvolume expansion.
Linear expansion is commonly described by anexpression of the form:
€
ΔLL0
=αΔT ,
where α is the coefficient of linear expansion and L0 is thelength of the solid at STP. 5 Linear expansion onlyapplies to solids. For solids α ≅ 10–5 T–1.
Volume expansion is commonly described by an ex-pression of the form
€
ΔVV0
= βΔT
where β is the coefficient of volume expansion and V0 isthe volume at STP. Volume expansion applies tosolids, liquids and gases. For liquids β ≅ 10–4 T–1 whilefor gases β ≅ 10–4 T–1.
Temperature ScalesThe most commonly-used scale of temperature in theworld today is the Celsius scale. On this scale thefreezing point of water at 1 atm pressure is set at 0,and the boiling point of water is set at 100. Betweenthese two points are 100 Celsius degrees. Atemperature of 10 degrees Celsius is written 10 ˚C.The Fahrenheit scale (that actually predates the Celsiusscale) is still in use in the U.S. On the Fahrenheit scalethe freezing point of water is set at 32 and the boilingpoint of water is set at 212, making for 180 Fahrenheitdegrees between the two points. Thus a temperatureof TC ˚C and TF ˚F are related by
€
TF =95TC + 32 . …[15-2]
5 STP stands for standard temperature and pressure, or 0 ˚C and 1atm. STP was introduced in Note 13.
Note 15
15-5
Both scales have disadvantages, making it desireableto define an absolute scale of temperature. This we doin the next section.
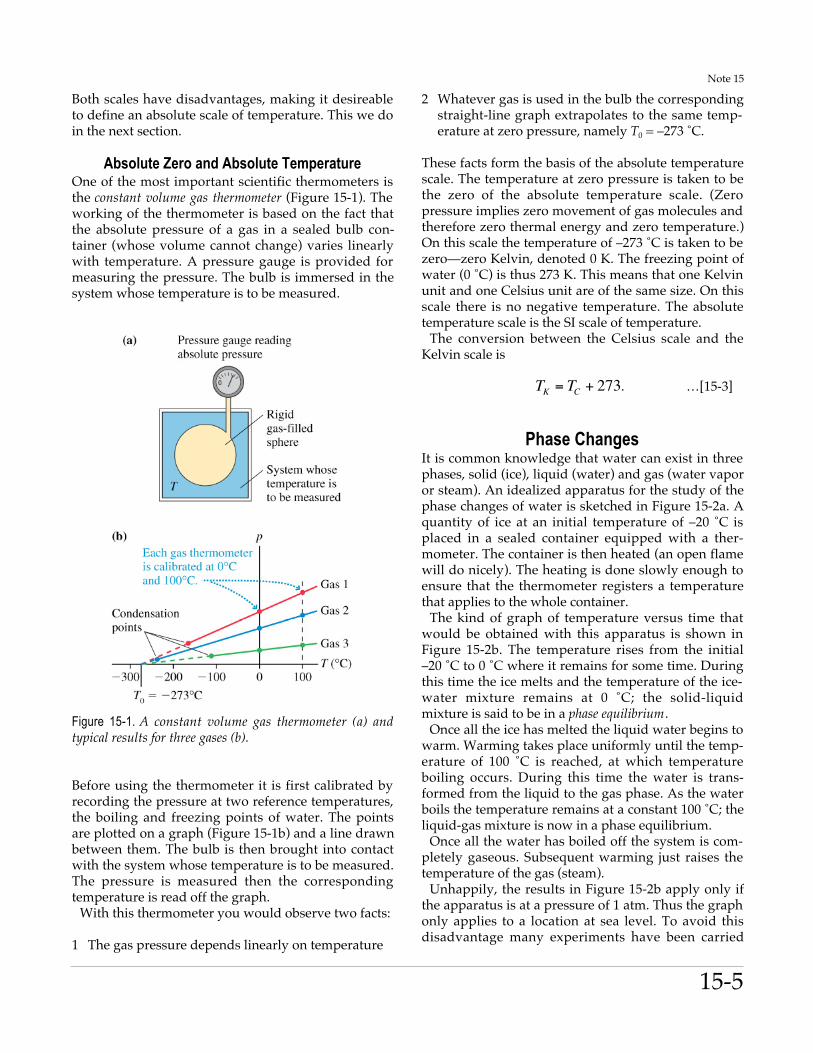
Absolute Zero and Absolute TemperatureOne of the most important scientific thermometers isthe constant volume gas thermometer (Figure 15-1). Theworking of the thermometer is based on the fact thatthe absolute pressure of a gas in a sealed bulb con-tainer (whose volume cannot change) varies linearlywith temperature. A pressure gauge is provided formeasuring the pressure. The bulb is immersed in thesystem whose temperature is to be measured.
Figure 15-1. A constant volume gas thermometer (a) andtypical results for three gases (b).
Before using the thermometer it is first calibrated byrecording the pressure at two reference temperatures,the boiling and freezing points of water. The pointsare plotted on a graph (Figure 15-1b) and a line drawnbetween them. The bulb is then brought into contactwith the system whose temperature is to be measured.The pressure is measured then the correspondingtemperature is read off the graph.
With this thermometer you would observe two facts:
1 The gas pressure depends linearly on temperature
2 Whatever gas is used in the bulb the correspondingstraight-line graph extrapolates to the same temp-erature at zero pressure, namely T0 = –273 ˚C.
These facts form the basis of the absolute temperaturescale. The temperature at zero pressure is taken to bethe zero of the absolute temperature scale. (Zeropressure implies zero movement of gas molecules andtherefore zero thermal energy and zero temperature.)On this scale the temperature of –273 ˚C is taken to bezero—zero Kelvin, denoted 0 K. The freezing point ofwater (0 ˚C) is thus 273 K. This means that one Kelvinunit and one Celsius unit are of the same size. On thisscale there is no negative temperature. The absolutetemperature scale is the SI scale of temperature.
The conversion between the Celsius scale and theKelvin scale is
€
TK = TC + 273. …[15-3]
Phase ChangesIt is common knowledge that water can exist in threephases, solid (ice), liquid (water) and gas (water vaporor steam). An idealized apparatus for the study of thephase changes of water is sketched in Figure 15-2a. Aquantity of ice at an initial temperature of –20 ˚C isplaced in a sealed container equipped with a ther-mometer. The container is then heated (an open flamewill do nicely). The heating is done slowly enough toensure that the thermometer registers a temperaturethat applies to the whole container.
The kind of graph of temperature versus time thatwould be obtained with this apparatus is shown inFigure 15-2b. The temperature rises from the initial–20 ˚C to 0 ˚C where it remains for some time. Duringthis time the ice melts and the temperature of the ice-water mixture remains at 0 ˚C; the solid-liquidmixture is said to be in a phase equilibrium.
Once all the ice has melted the liquid water begins towarm. Warming takes place uniformly until the temp-erature of 100 ˚C is reached, at which temperatureboiling occurs. During this time the water is trans-formed from the liquid to the gas phase. As the waterboils the temperature remains at a constant 100 ˚C; theliquid-gas mixture is now in a phase equilibrium.
Once all the water has boiled off the system is com-pletely gaseous. Subsequent warming just raises thetemperature of the gas (steam).
Unhappily, the results in Figure 15-2b apply only ifthe apparatus is at a pressure of 1 atm. Thus the graphonly applies to a location at sea level. To avoid thisdisadvantage many experiments have been carried

Note 15
15-6
out at various pressures yielding the so-called phasediagrams shown in Figures 15-3. Figure 15-3a for watershows three regions corresponding to the solid, liquidand gas phases. The boundary lines separating theregions delineate the phase transitions.
Figure 15-2. An idealized apparatus for the study of phasechanges in water (a) and the temperature-time graphobtained with the apparatus (b).
A point of special interest on the diagram for water isthe triple point where the phase boundaries meet. Thetriple point is the one value of temperature andpressure for which all three phases can coexist inphase equilibrium. For water, the triple point occursat T3 = 0.01 ˚C and p3 = 0.006 atm.
The triple point of water is actually used to completethe definition of the Kelvin temperature scale. Recallthat the Celsius scale required the boiling and meltingpoints of water as two reference points. Thesetemperatures are not satisfactory because their valuesdepend on pressure. The Kelvin scale requires onlyone reference point since the low end, zero tempera-ture at zero pressure, is fixed. The triple point ofwater is taken as the second reference point because itis a fixed, identifiable point (same pressure andtemperature) regardless of the location of study.
The Kelvin temperature scale is therefore defined tobe a linear temperature scale starting from 0 K atabsolute zero and passing through the temperature
273.16 K at the triple point of water.
Figure 15-3. Phase diagrams (not to scale) for water (a) andcarbon dioxide (b).
Because the temperature at the triple point of water isT3 = 0.01 ˚C on the Celsius scale, absolute zero on theCelsius scale is T0 = –273.15 ˚C. This completes thedefinition of the absolute temperature scale.
A gas is the simplest macroscopic system. A real gas isknown to consist of small, hard atoms or mole-culesmoving randomly at high speeds which, on occasion,collide with each other and with the walls of thecontainer. No matter how simple a real gas is, it is stilluseful to model it as a so-called ideal gas.
The Idea of an Ideal GasThe potential energy curve of two atoms or mole-cules in an ideal gas can be represented as in Figure15-4. This curve represents the interaction of two hardspheres that have no interaction at all until they comeinto actual contact, at separation r contact, and thenbounce. It is found experimentally that the ideal gasmodel is a good model for real gases if the followingconditions are met:

Note 15
15-7
Figure 15-4. The “idealized” potential energy diagram fortwo atoms or molecules in an ideal gas.
1 the density is low2 the temperature is well above the condensation
point
The Ideal Gas LawRecall that the macroscopic state of a system is des-cribed by the state variables—volume V, number ofmoles n, temperature T and pressure p.
Numerous experiments have shown that for any gas,whether monatomic, diatomic or polyatomic, a plot ofpV vs nT yields the kind of graph shown in Figure 15-5. The pressure p must be in units of Pa and temp-erature T must be in units of Kelvin. The graph is astraight line, with pV and nT being related by
€
pV = (const)nT . …[15-4]
Figure 15-5. A graph of pV vs nT for an ideal gas.
The slope of the graph, found experimentally, is
€
const = 8.31 J.mol–1K–1.
The constant, denoted R, is called the universal gas
constant. This means we can write eq[15-4] as
€
pV = nRT . …[15-5]
Eq[15-5] is called the ideal gas law. Remarkably, allgases yield the same graph and the same value of R.
For a gas in a sealed container the number of moles nis constant. Thus we can write from eq[15-5]:
€
pVT
= nR = const . …[15-6]
This means that for any two states i and f of the gas,
€
pfVf
Tf=piVi
Ti. …[15-7]
The ideal gas law written in terms of the number N ofmolecules in the gas is
€
pV = nRT =NNA
RT = N RNA
T . …[15-8]
The factor R/NA is known as Boltzmann’s constant andis denoted kB:
€
kB =RNA
=1.38 ×10⁻²³ J.K–1.
Thus the ideal gas law can be written in terms of kB:
€
pV = NkBT . …[15-9]
Eqs[15-5] and [15-9] are equivalent.
Ideal Gas ProcessesThe state of an ideal gas changes in a process in whichp changes, V changes or T changes. These changes aremost easily represented on a so-called pV diagram(Figures 15-6). Each state of the gas is represented as apoint on the diagram (Figure 15-6a).
A process in which a gas changes state isrepresented by a path or trajectory on the pV diagram(Figure 15-6b). Different processes take a gas from onestate to another via different trajectories (Figure 15-6c).
The ideal gas law applies only to gases in thermalequilibrium. Thus the kind of processes we shallconsider here are those which keep the gas in thermalequilibrium as it is taking place. These are processes
Note 15
15-8
that take place very slowly and are therefore calledquasistatic processes. A quasistatic process is also areversible process.
We now consider three of the simplest processes inturn, a constant volume process, a constant pressureprocess, and a constant temperature process.
Figure 15-6. A pV diagram of an ideal gas
Constant Volume ProcessA constant volume process is called an isochoric pro-cess. In such a process
€
Vf =Vi . …[15-10]
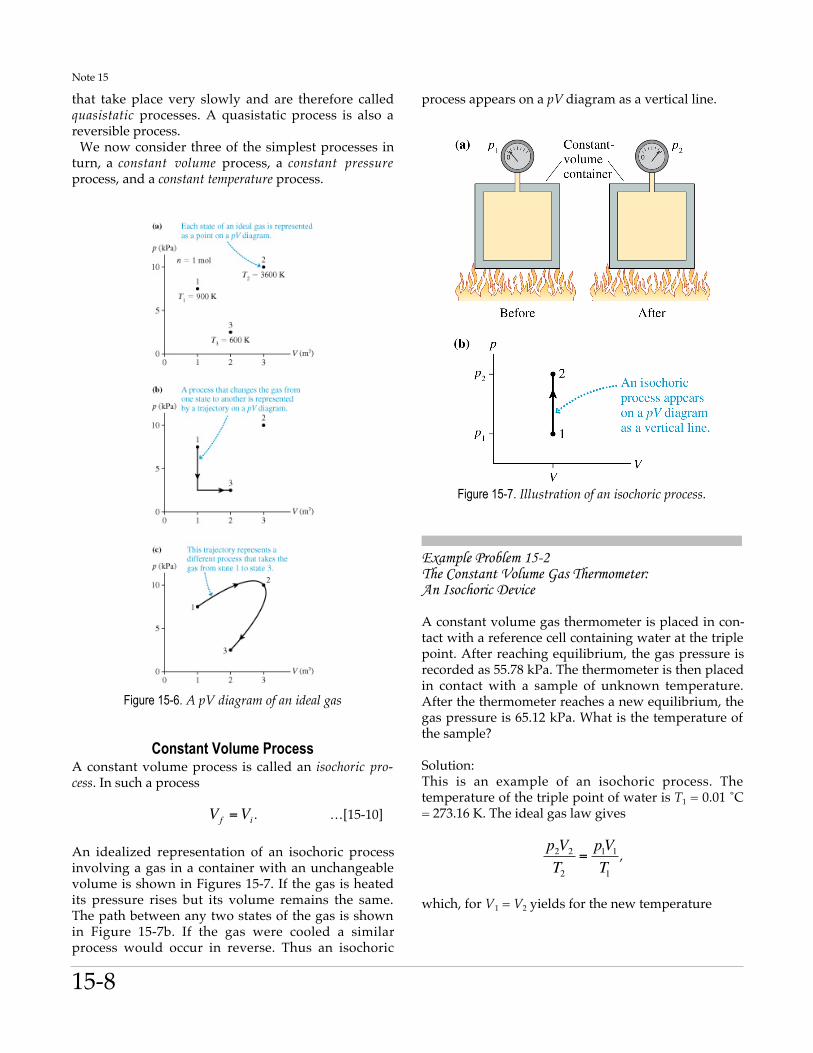
An idealized representation of an isochoric processinvolving a gas in a container with an unchangeablevolume is shown in Figures 15-7. If the gas is heatedits pressure rises but its volume remains the same.The path between any two states of the gas is shownin Figure 15-7b. If the gas were cooled a similarprocess would occur in reverse. Thus an isochoric
process appears on a pV diagram as a vertical line.
Figure 15-7. Illustration of an isochoric process.
Example Problem 15-2The Constant Volume Gas Thermometer:An Isochoric Device
A constant volume gas thermometer is placed in con-tact with a reference cell containing water at the triplepoint. After reaching equilibrium, the gas pressure isrecorded as 55.78 kPa. The thermometer is then placedin contact with a sample of unknown temperature.After the thermometer reaches a new equilibrium, thegas pressure is 65.12 kPa. What is the temperature ofthe sample?
Solution:This is an example of an isochoric process. Thetemperature of the triple point of water is T1 = 0.01 ˚C= 273.16 K. The ideal gas law gives
€
p2V2T2
=p1V1T1
,
which, for V1 = V2 yields for the new temperature

Note 15
15-9
€
T2 = T1p2p1
= (273.16K) 65.12(kPa)55.78(kPa)
= 318.90 K = 45.75 ˚C.
Keep in mind here that pressures are expressed in Pa,temperatures in K.
Constant Pressure ProcessA constant pressure process is called an isobaric pro-cess. In such a process
€
pf = pi. …[15-11]
An idealized apparatus for producing an isobaric pro-cess is shown in Figure 15-8. A cylinder of gas has atight-fitting piston of cross sectional area A on whichis placed a mass m. As the temperature is raised thevolume increases but the pressure remainsunchanged. If the temperature is lowered the volumedecreases but still the pressure remains unchanged.
Figure 15-8. Illustration of an isobaric process.
The gas pressure inside the cylinder is
€
p = patmos +mgA
. …[15-12]
This pressure is constant so long as m remains con-stant. Thus an isobaric process appears on a pVdiagram as a horizontal line.
Example Problem 15-3An Isobaric Process
A gas occupying 50 cm3 at 50 ˚C is cooled at constantpressure until the temperature is 10 ˚C. What is itsfinal volume?
Solution:This is a constant pressure, isobaric process. Using theideal gas law as in Example Problem 15-2 but thistime putting p2 = p1 we have for the final volume:
€
V2 =V1T2T1
= (50cm3) (10 + 273)K(50 + 273)K
= 43.8 cm3
The volume decreases as it must if the temperaturedecreases.
Constant Temperature ProcessA constant temperature process is called an isothermalprocess. In such a process
€
Tf = Ti . …[15-13]
Using the ideal gas law we can put eq[15-13] into theform:
€
pfVf
nR= Tf = Ti =
piVi
nR
or
€
pfVf = piVi. …[15-14]
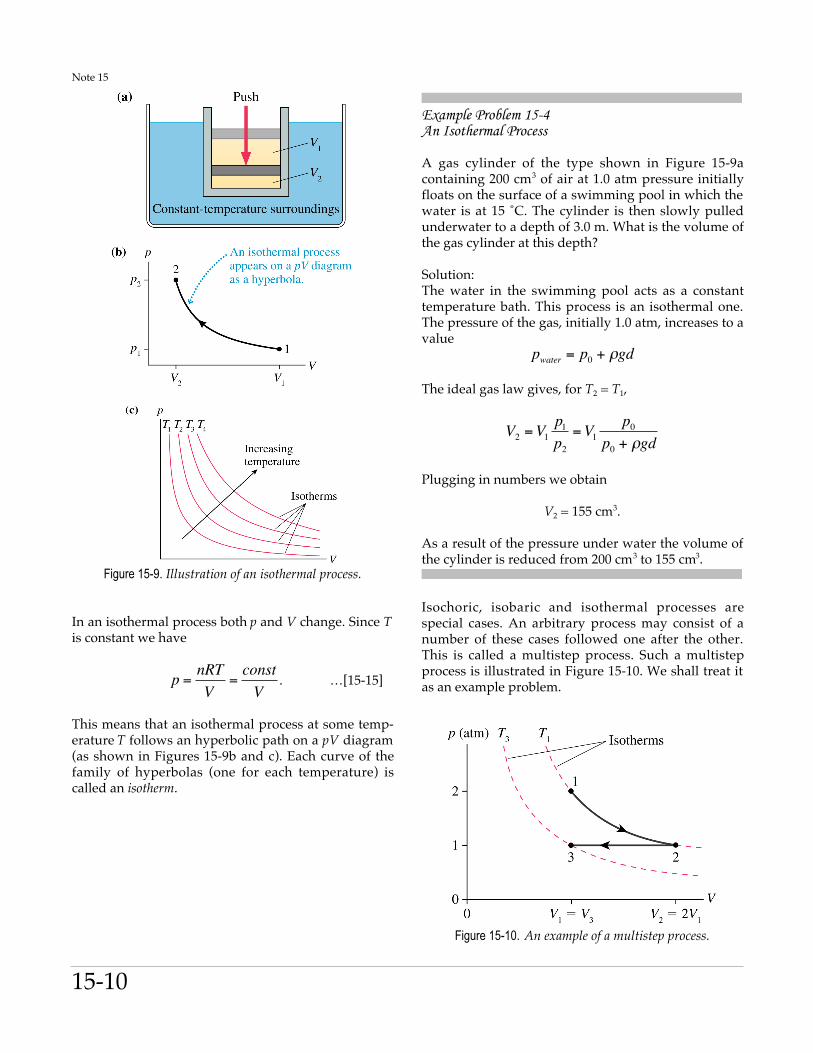
An idealized apparatus for studying an isothermalprocess is shown in Figure 15-9.
The container of gas equipped with a movable close-fitting piston is held in thermal equilibrium with aconstant temperature bath. If the piston is moveddownwards (slowly) or upwards (slowly) then the gasand the bath remain at thermal equilibrium and there-fore at the same temperature.
Note 15
15-10
Figure 15-9. Illustration of an isothermal process.
In an isothermal process both p and V change. Since Tis constant we have
€
p =nRTV
=constV
. …[15-15]
This means that an isothermal process at some temp-erature T follows an hyperbolic path on a pV diagram(as shown in Figures 15-9b and c). Each curve of thefamily of hyperbolas (one for each temperature) iscalled an isotherm.
Example Problem 15-4An Isothermal Process
A gas cylinder of the type shown in Figure 15-9acontaining 200 cm3 of air at 1.0 atm pressure initiallyfloats on the surface of a swimming pool in which thewater is at 15 ˚C. The cylinder is then slowly pulledunderwater to a depth of 3.0 m. What is the volume ofthe gas cylinder at this depth?
Solution:The water in the swimming pool acts as a constanttemperature bath. This process is an isothermal one.The pressure of the gas, initially 1.0 atm, increases to avalue
€
pwater = p0 + ρgd
The ideal gas law gives, for T2 = T1,
€
V2 =V1p1p2
=V1p0
p0 + ρgd
Plugging in numbers we obtain
V2 = 155 cm3.
As a result of the pressure under water the volume ofthe cylinder is reduced from 200 cm3 to 155 cm3.
Isochoric, isobaric and isothermal processes arespecial cases. An arbitrary process may consist of anumber of these cases followed one after the other.This is called a multistep process. Such a multistepprocess is illustrated in Figure 15-10. We shall treat itas an example problem.
Figure 15-10. An example of a multistep process.
Note 15
15-11
Example Problem 15-5An Example of a Multistep Process
A gas at 2.0 atm pressure and a temperature of 200 ˚Cis first expanded isothermally until its volume hasdoubled. It then undergoes an isobaric compressionuntil it returns to its original volume. First show thisprocess on a pV diagram. Then find the final tempera-ture and pressure.
Solution:This process is shown on the pV diagram of Figure 15-10. The gas starts in state 1 at pressure p1 = 2.0 atmand volume V1. As the gas expands isothermally itmoves downward along an isotherm until it reachesvolume V2 = 2V1. The pressure decreases during thisprocess to a lower value p2. The gas is then com-pressed at constant pressure p2 until its final volumeV3 equals its original volume V1. State 3 is on anisotherm closer to the origin, so we expect to find T3 <T1.
Since from eq[15-15], p1 = nRT1/V1 and p2 = nRT2/V2we have
€
p2p1
=nRT2V2
V1nRT1
=
V1V2
=12
.
Thus
€
p2 =12p1 =1.0 atm.
During the isobaric process we have V3 = V1 = V2/2and so
€
T3 =V3V2T2 =
V2 /2V2
=12T2
= 236.5 K = –36.5 ˚C
Thus, indeed, T3 < T1.
Note 15
15-12
To Be Mastered
• Definitions: atomic mass unit, mole, Avogadro’s number, molar mass• Definitions: Thermal contact, thermal equilibrium• Statement: zeroth law of thermodynamics• Definitions: Celsius temperature scale, Fahrenheit temperature scale, kelvin temperature scale• Definitions: coefficient of linear expansion, coefficient of volume expansion• Physics of: Ideal gas, the ideal gas law• Physics of: Ideal gas processes: isochoric, isobaric, isothermal• Physics of: pV diagram of an ideal gas
Typical Quiz/Test/Exam Questions
1.
2.
3.
4.
5.6.
7.
8.


![UNIVERSITY OF TORONTO FACULTY OF .PILIFi) SCIENCE AND …exams.skule.ca/exams/bulk/20191/CIV209FS_2019_ENGINEERINGM… · Student No.: Question 4 - \IcchanicaI Behaviour of 'Fitt]](https://img.pdfslide.net/doc/110x75/60a37cb04de6b756dc76a74f/university-of-toronto-faculty-of-pilifi-science-and-examsskulecaexamsbulk20191civ209fs2019engineeringm.jpg)