Embed Size (px)
Citation preview
2012 2011 2012 2011
NOTE RUPEES RUPEES NOTE RUPEES RUPEES
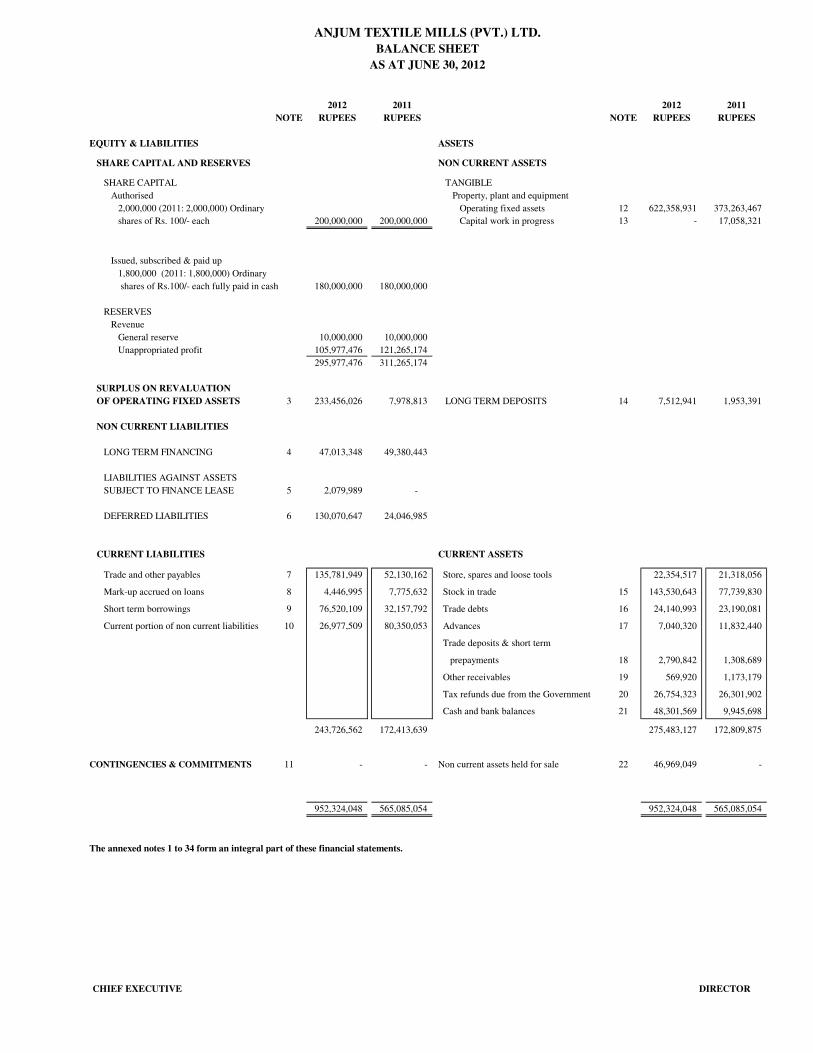
EQUITY & LIABILITIES ASSETS
SHARE CAPITAL AND RESERVES NON CURRENT ASSETS
SHARE CAPITAL TANGIBLE
Authorised Property, plant and equipment
2,000,000 (2011: 2,000,000) Ordinary Operating fixed assets 12 622,358,931 373,263,467
shares of Rs. 100/- each 200,000,000 200,000,000 Capital work in progress 13 - 17,058,321
Issued, subscribed & paid up
1,800,000 (2011: 1,800,000) Ordinary
shares of Rs.100/- each fully paid in cash 180,000,000 180,000,000
RESERVES
Revenue
General reserve 10,000,000 10,000,000
Unappropriated profit 105,977,476 121,265,174
295,977,476 311,265,174
SURPLUS ON REVALUATION
OF OPERATING FIXED ASSETS 3 233,456,026 7,978,813 LONG TERM DEPOSITS 14 7,512,941 1,953,391
NON CURRENT LIABILITIES
LONG TERM FINANCING 4 47,013,348 49,380,443
LIABILITIES AGAINST ASSETS
SUBJECT TO FINANCE LEASE 5 2,079,989 -
DEFERRED LIABILITIES 6 130,070,647 24,046,985
CURRENT LIABILITIES CURRENT ASSETS
Trade and other payables 7 135,781,949 52,130,162 Store, spares and loose tools 22,354,517 21,318,056
Mark-up accrued on loans 8 4,446,995 7,775,632 Stock in trade 15 143,530,643 77,739,830
Short term borrowings 9 76,520,109 32,157,792 Trade debts 16 24,140,993 23,190,081
Current portion of non current liabilities 10 26,977,509 80,350,053 Advances 17 7,040,320 11,832,440
Trade deposits & short term
prepayments 18 2,790,842 1,308,689
Other receivables 19 569,920 1,173,179
Tax refunds due from the Government 20 26,754,323 26,301,902
Cash and bank balances 21 48,301,569 9,945,698
243,726,562 172,413,639 275,483,127 172,809,875
CONTINGENCIES & COMMITMENTS 11 - - Non current assets held for sale 22 46,969,049 -
-
952,324,048 565,085,054 952,324,048 565,085,054
The annexed notes 1 to 34 form an integral part of these financial statements.
ANJUM TEXTILE MILLS (PVT.) LTD.
BALANCE SHEET
AS AT JUNE 30, 2012
CHIEF EXECUTIVE DIRECTOR
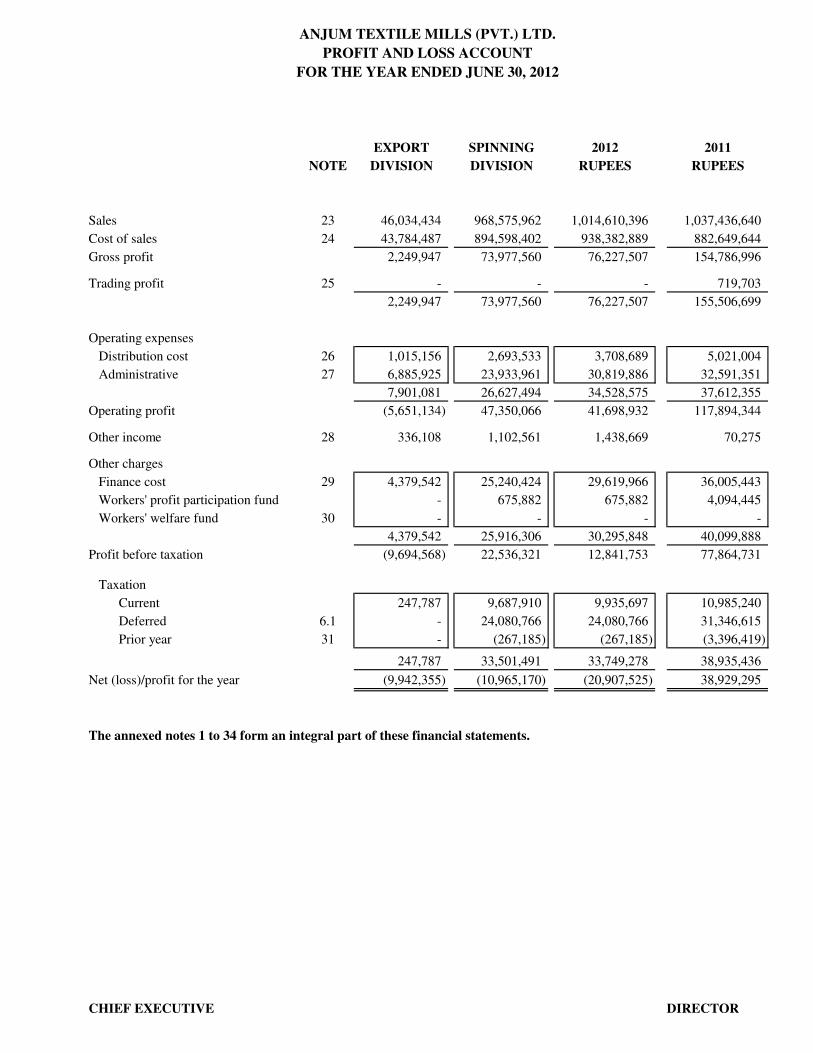
EXPORT SPINNING 2012 2011
NOTE DIVISION DIVISION RUPEES RUPEES
Sales 23 46,034,434 968,575,962 1,014,610,396 1,037,436,640
Cost of sales 24 43,784,487 894,598,402 938,382,889 882,649,644
Gross profit 2,249,947 73,977,560 76,227,507 154,786,996
Trading profit 25 - - - 719,703
2,249,947 73,977,560 76,227,507 155,506,699
Operating expenses
Distribution cost 26 1,015,156 2,693,533 3,708,689 5,021,004
Administrative 27 6,885,925 23,933,961 30,819,886 32,591,351
7,901,081 26,627,494 34,528,575 37,612,355
Operating profit (5,651,134) 47,350,066 41,698,932 117,894,344
Other income 28 336,108 1,102,561 1,438,669 70,275
Other charges
Finance cost 29 4,379,542 25,240,424 29,619,966 36,005,443
Workers' profit participation fund - 675,882 675,882 4,094,445
Workers' welfare fund 30 - - - -
4,379,542 25,916,306 30,295,848 40,099,888
Profit before taxation (9,694,568) 22,536,321 12,841,753 77,864,731
Taxation
Current 247,787 9,687,910 9,935,697 10,985,240
Deferred 6.1 - 24,080,766 24,080,766 31,346,615
Prior year 31 - (267,185) (267,185) (3,396,419)
247,787 33,501,491 33,749,278 38,935,436
Net (loss)/profit for the year (9,942,355) (10,965,170) (20,907,525) 38,929,295
The annexed notes 1 to 34 form an integral part of these financial statements.
ANJUM TEXTILE MILLS (PVT.) LTD.
PROFIT AND LOSS ACCOUNT
FOR THE YEAR ENDED JUNE 30, 2012
CHIEF EXECUTIVE DIRECTOR
2012 2011
RUPEES RUPEES
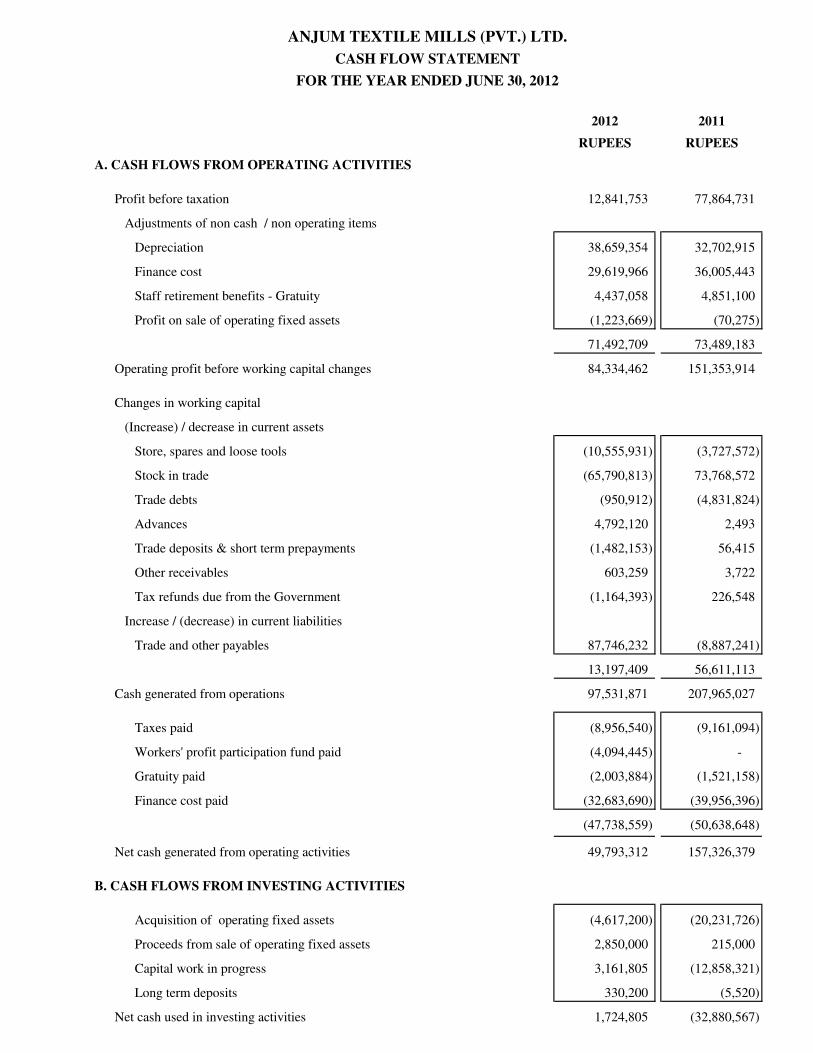
A. CASH FLOWS FROM OPERATING ACTIVITIES
Profit before taxation 12,841,753 77,864,731
Adjustments of non cash / non operating items
Depreciation 38,659,354 32,702,915
Finance cost 29,619,966 36,005,443
Staff retirement benefits - Gratuity 4,437,058 4,851,100
Profit on sale of operating fixed assets (1,223,669) (70,275)
71,492,709 73,489,183
Operating profit before working capital changes 84,334,462 151,353,914
Changes in working capital
(Increase) / decrease in current assets
Store, spares and loose tools (10,555,931) (3,727,572)
Stock in trade (65,790,813) 73,768,572
Trade debts (950,912) (4,831,824)
Advances 4,792,120 2,493
Trade deposits & short term prepayments (1,482,153) 56,415
Other receivables 603,259 3,722
Tax refunds due from the Government (1,164,393) 226,548
Increase / (decrease) in current liabilities
Trade and other payables 87,746,232 (8,887,241)
13,197,409 56,611,113
Cash generated from operations 97,531,871 207,965,027
Taxes paid (8,956,540) (9,161,094)
Workers' profit participation fund paid (4,094,445) -
Gratuity paid (2,003,884) (1,521,158)
Finance cost paid (32,683,690) (39,956,396)
(47,738,559) (50,638,648)
Net cash generated from operating activities 49,793,312 157,326,379
B. CASH FLOWS FROM INVESTING ACTIVITIES
Acquisition of operating fixed assets (4,617,200) (20,231,726)
Proceeds from sale of operating fixed assets 2,850,000 215,000
Capital work in progress 3,161,805 (12,858,321)
Long term deposits 330,200 (5,520)
Net cash used in investing activities 1,724,805 (32,880,567)
ANJUM TEXTILE MILLS (PVT.) LTD.
CASH FLOW STATEMENT
FOR THE YEAR ENDED JUNE 30, 2012
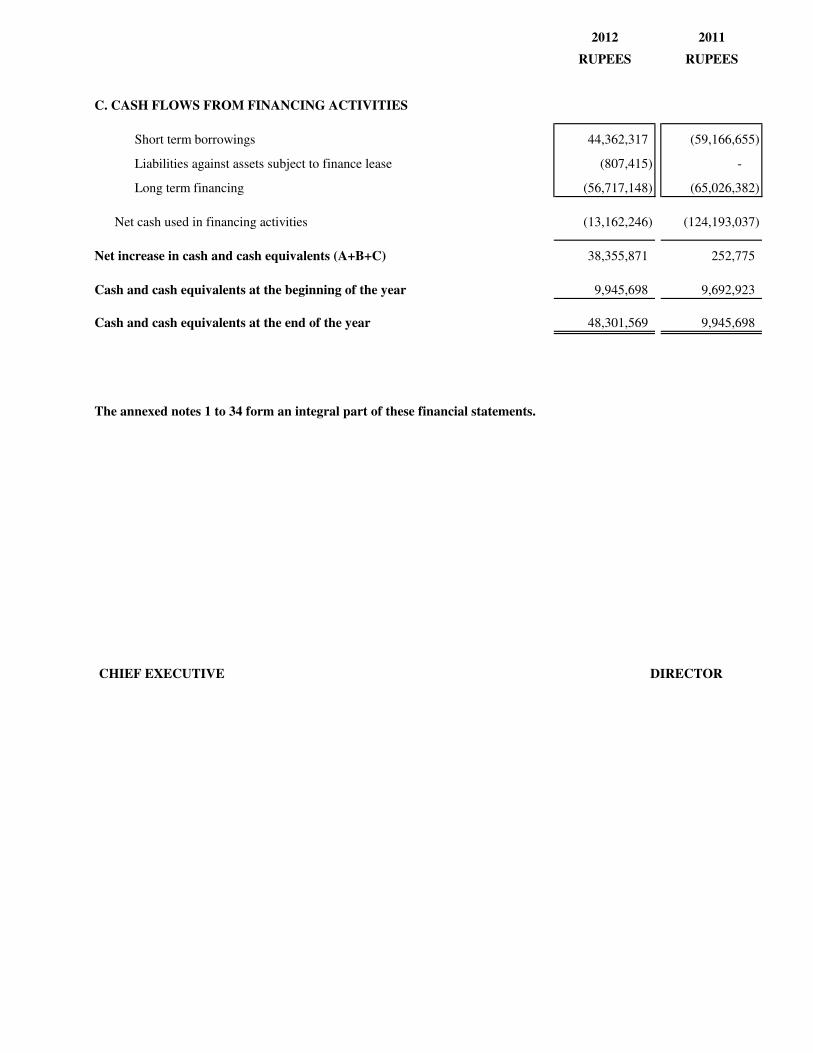
2012 2011
RUPEES RUPEES
C. CASH FLOWS FROM FINANCING ACTIVITIES
Short term borrowings 44,362,317 (59,166,655)
Liabilities against assets subject to finance lease (807,415) -
Long term financing (56,717,148) (65,026,382)
Net cash used in financing activities (13,162,246) (124,193,037)
Net increase in cash and cash equivalents (A+B+C) 38,355,871 252,775
Cash and cash equivalents at the beginning of the year 9,945,698 9,692,923
Cash and cash equivalents at the end of the year 48,301,569 9,945,698
The annexed notes 1 to 34 form an integral part of these financial statements.
CHIEF EXECUTIVE DIRECTOR
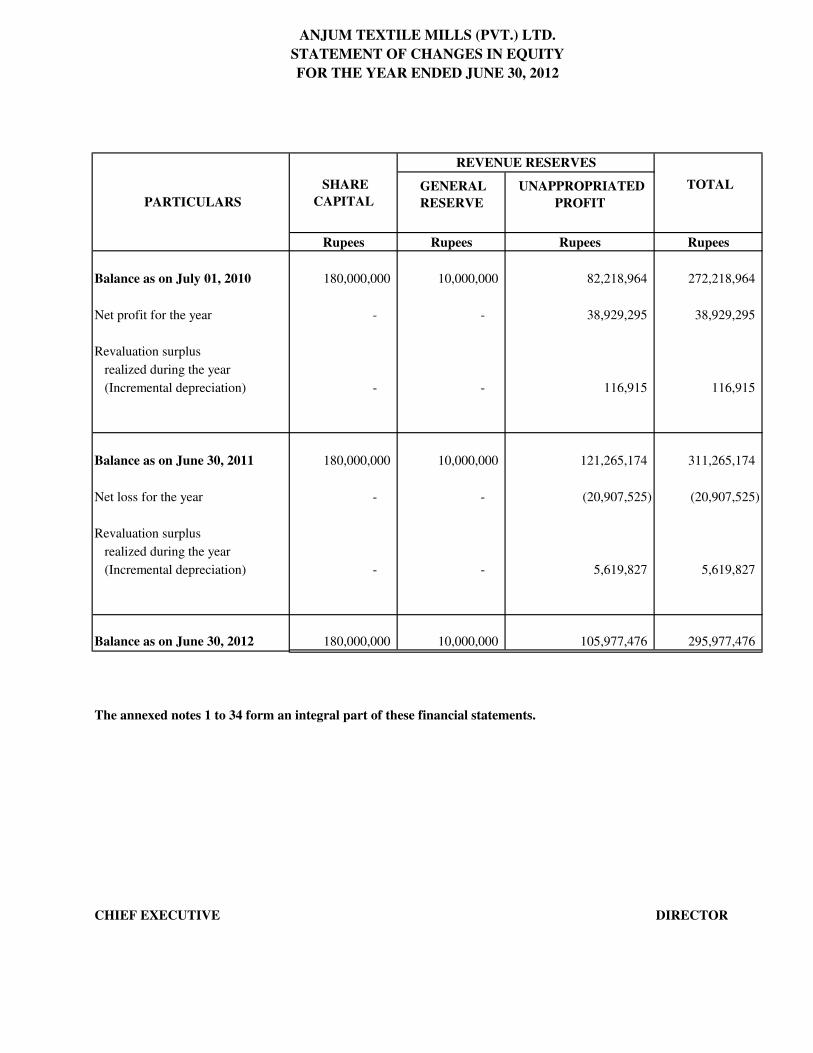
GENERAL
RESERVE
UNAPPROPRIATED
PROFIT
Rupees Rupees Rupees Rupees
Balance as on July 01, 2010 180,000,000 10,000,000 82,218,964 272,218,964
Net profit for the year - - 38,929,295 38,929,295
Revaluation surplus
realized during the year
(Incremental depreciation) - - 116,915 116,915
Balance as on June 30, 2011 180,000,000 10,000,000 121,265,174 311,265,174
Net loss for the year - - (20,907,525) (20,907,525)
Revaluation surplus
realized during the year
(Incremental depreciation) - - 5,619,827 5,619,827
Balance as on June 30, 2012 180,000,000 10,000,000 105,977,476 295,977,476
The annexed notes 1 to 34 form an integral part of these financial statements.
CHIEF EXECUTIVE DIRECTOR
ANJUM TEXTILE MILLS (PVT.) LTD.
STATEMENT OF CHANGES IN EQUITY
FOR THE YEAR ENDED JUNE 30, 2012
PARTICULARS
SHARE
CAPITAL
REVENUE RESERVES
TOTAL
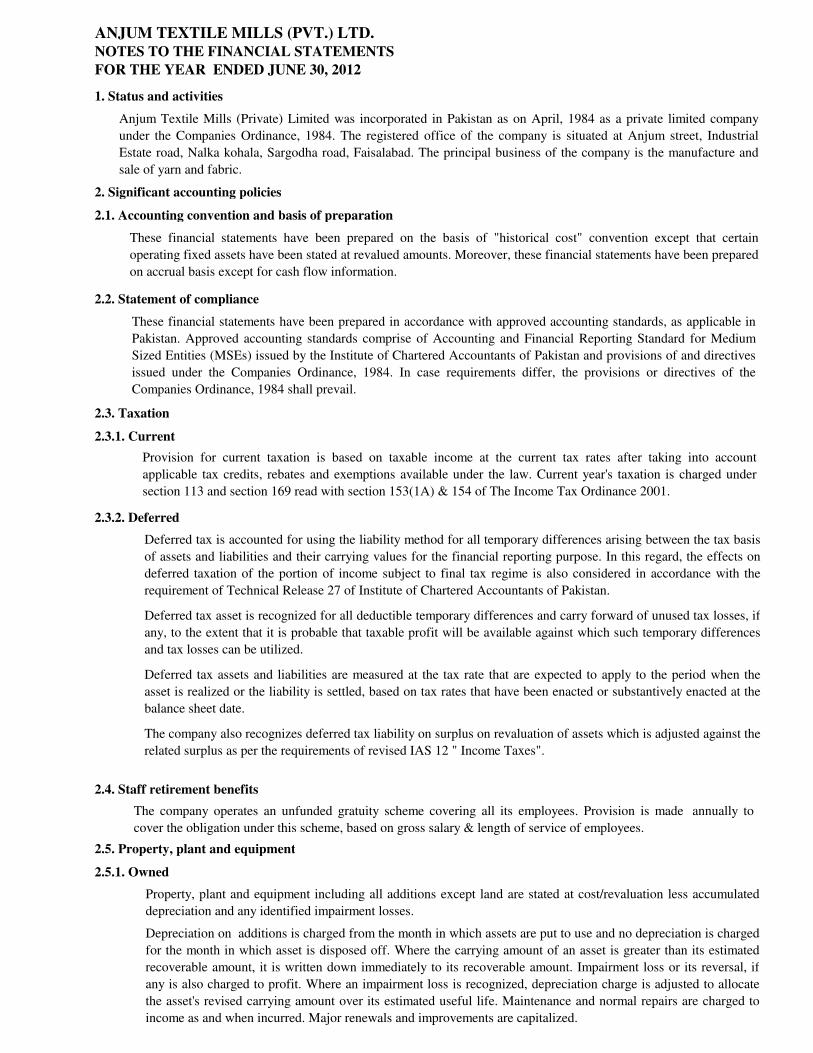
ANJUM TEXTILE MILLS (PVT.) LTD.
NOTES TO THE FINANCIAL STATEMENTS
FOR THE YEAR ENDED JUNE 30, 2012
1. Status and activities
2. Significant accounting policies
2.1. Accounting convention and basis of preparation
or
2.2. Statement of compliance
2.3. Taxation
2.3.1. Current
2.3.2. Deferred
2.4. Staff retirement benefits
2.5. Property, plant and equipment
2.5.1. Owned
Anjum Textile Mills (Private) Limited was incorporated in Pakistan as on April, 1984 as a private limited company
under the Companies Ordinance, 1984. The registered office of the company is situated at Anjum street, Industrial
Estate road, Nalka kohala, Sargodha road, Faisalabad. The principal business of the company is the manufacture and
sale of yarn and fabric.
These financial statements have been prepared on the basis of "historical cost" convention except that certain
operating fixed assets have been stated at revalued amounts. Moreover, these financial statements have been prepared
on accrual basis except for cash flow information.
These financial statements have been prepared in accordance with approved accounting standards, as applicable in
Pakistan. Approved accounting standards comprise of Accounting and Financial Reporting Standard for Medium
Sized Entities (MSEs) issued by the Institute of Chartered Accountants of Pakistan and provisions of and directives
issued under the Companies Ordinance, 1984. In case requirements differ, the provisions or directives of the
Companies Ordinance, 1984 shall prevail.
Provision for current taxation is based on taxable income at the current tax rates after taking into account
applicable tax credits, rebates and exemptions available under the law. Current year's taxation is charged under
section 113 and section 169 read with section 153(1A) & 154 of The Income Tax Ordinance 2001.
Deferred tax is accounted for using the liability method for all temporary differences arising between the tax basis
of assets and liabilities and their carrying values for the financial reporting purpose. In this regard, the effects on
deferred taxation of the portion of income subject to final tax regime is also considered in accordance with the
requirement of Technical Release 27 of Institute of Chartered Accountants of Pakistan.
Deferred tax asset is recognized for all deductible temporary differences and carry forward of unused tax losses, if
any, to the extent that it is probable that taxable profit will be available against which such temporary differences
and tax losses can be utilized.
Deferred tax assets and liabilities are measured at the tax rate that are expected to apply to the period when the
asset is realized or the liability is settled, based on tax rates that have been enacted or substantively enacted at the
balance sheet date.
The company also recognizes deferred tax liability on surplus on revaluation of assets which is adjusted against the
related surplus as per the requirements of revised IAS 12 " Income Taxes".
Property, plant and equipment including all additions except land are stated at cost/revaluation less accumulated
depreciation and any identified impairment losses.
Depreciation on additions is charged from the month in which assets are put to use and no depreciation is charged
for the month in which asset is disposed off. Where the carrying amount of an asset is greater than its estimated
recoverable amount, it is written down immediately to its recoverable amount. Impairment loss or its reversal, if
any is also charged to profit. Where an impairment loss is recognized, depreciation charge is adjusted to allocate
the asset's revised carrying amount over its estimated useful life. Maintenance and normal repairs are charged to
income as and when incurred. Major renewals and improvements are capitalized.
The company operates an unfunded gratuity scheme covering all its employees. Provision is made annually to
cover the obligation under this scheme, based on gross salary & length of service of employees.
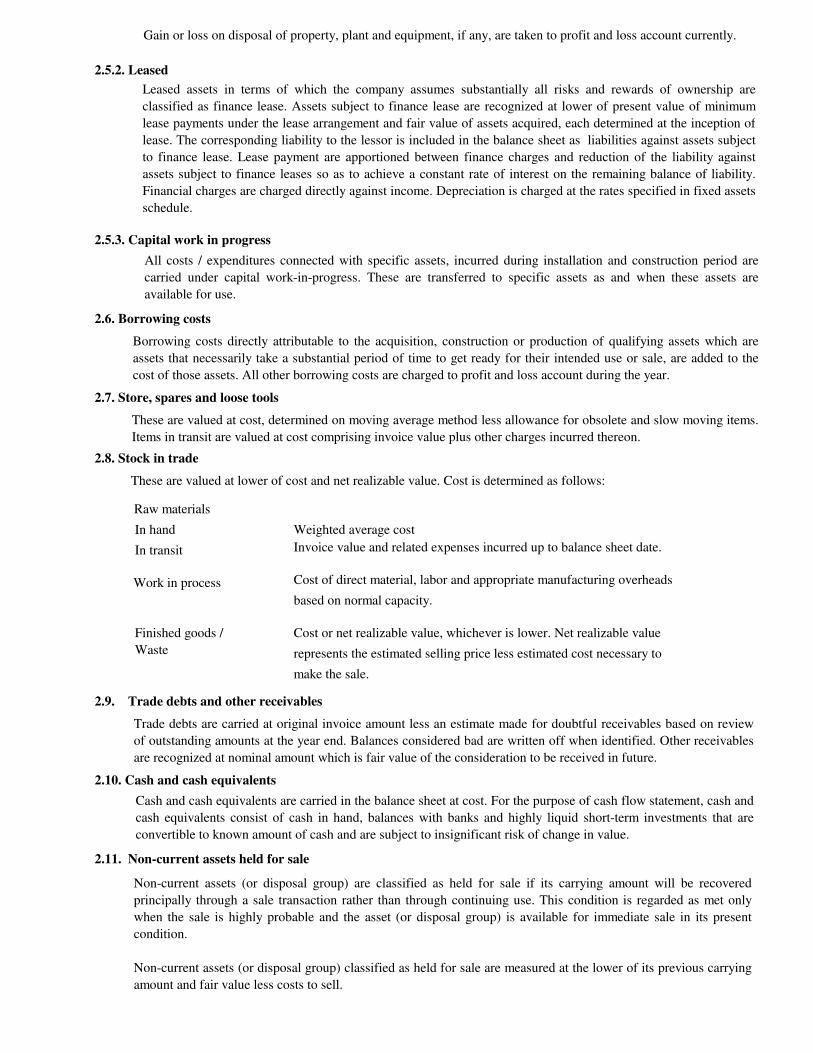
2.5.2. Leased
2.5.3. Capital work in progress
2.6. Borrowing costs
2.7. Store, spares and loose tools
2.8. Stock in trade
Weighted average cost
Invoice value and related expenses incurred up to balance sheet date.
Cost of direct material, labor and appropriate manufacturing overheads
based on normal capacity.
Cost or net realizable value, whichever is lower. Net realizable value
represents the estimated selling price less estimated cost necessary to
make the sale.
2.9. Trade debts and other receivables
2.10. Cash and cash equivalents
2.11. Non-current assets held for sale
Work in process
Finished goods /
Waste
Raw materials
In hand
In transit
All costs / expenditures connected with specific assets, incurred during installation and construction period are
carried under capital work-in-progress. These are transferred to specific assets as and when these assets are
available for use.
Borrowing costs directly attributable to the acquisition, construction or production of qualifying assets which are
assets that necessarily take a substantial period of time to get ready for their intended use or sale, are added to the
cost of those assets. All other borrowing costs are charged to profit and loss account during the year.
Trade debts are carried at original invoice amount less an estimate made for doubtful receivables based on review
of outstanding amounts at the year end. Balances considered bad are written off when identified. Other receivables
are recognized at nominal amount which is fair value of the consideration to be received in future.
Cash and cash equivalents are carried in the balance sheet at cost. For the purpose of cash flow statement, cash and
cash equivalents consist of cash in hand, balances with banks and highly liquid short-term investments that are
convertible to known amount of cash and are subject to insignificant risk of change in value.
These are valued at cost, determined on moving average method less allowance for obsolete and slow moving items.
Items in transit are valued at cost comprising invoice value plus other charges incurred thereon.
These are valued at lower of cost and net realizable value. Cost is determined as follows:
Non-current assets (or disposal group) are classified as held for sale if its carrying amount will be recovered
principally through a sale transaction rather than through continuing use. This condition is regarded as met only
when the sale is highly probable and the asset (or disposal group) is available for immediate sale in its present
condition.
Non-current assets (or disposal group) classified as held for sale are measured at the lower of its previous carrying
amount and fair value less costs to sell.
Gain or loss on disposal of property, plant and equipment, if any, are taken to profit and loss account currently.
Leased assets in terms of which the company assumes substantially all risks and rewards of ownership are
classified as finance lease. Assets subject to finance lease are recognized at lower of present value of minimum
lease payments under the lease arrangement and fair value of assets acquired, each determined at the inception of
lease. The corresponding liability to the lessor is included in the balance sheet as liabilities against assets subject
to finance lease. Lease payment are apportioned between finance charges and reduction of the liability against
assets subject to finance leases so as to achieve a constant rate of interest on the remaining balance of liability.
Financial charges are charged directly against income. Depreciation is charged at the rates specified in fixed assets
schedule.
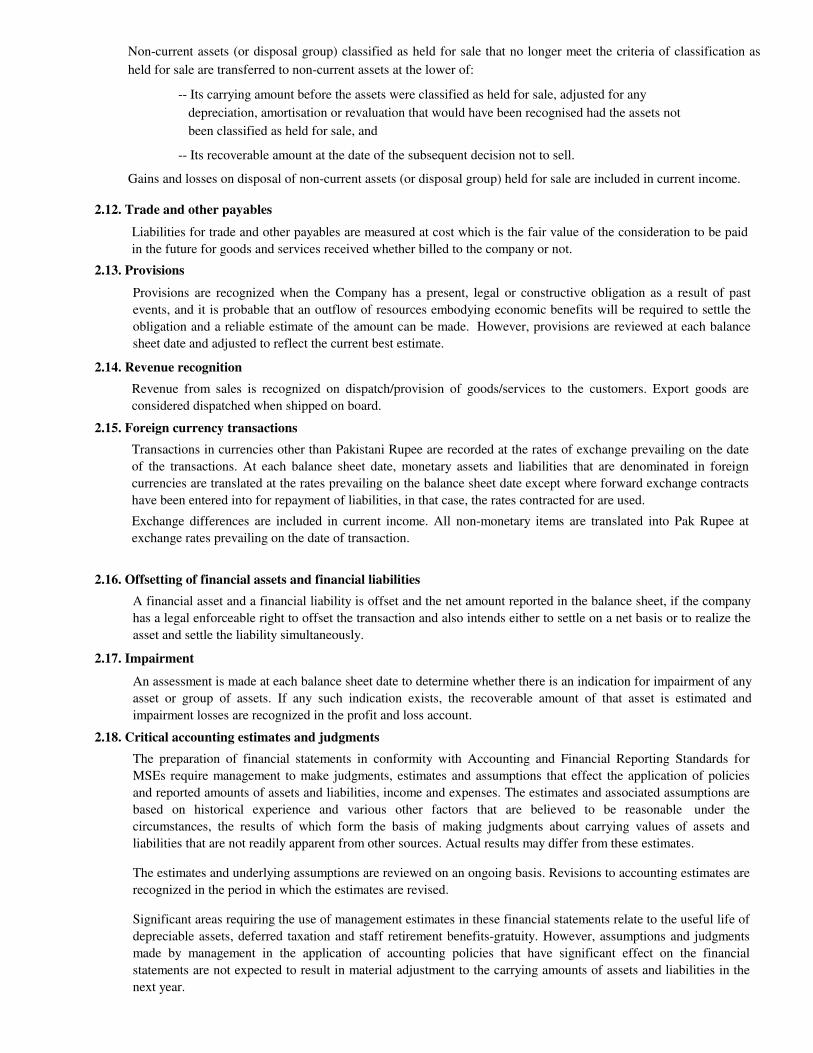
-- Its carrying amount before the assets were classified as held for sale, adjusted for any
depreciation, amortisation or revaluation that would have been recognised had the assets not
been classified as held for sale, and
-- Its recoverable amount at the date of the subsequent decision not to sell.
2.12. Trade and other payables
2.13. Provisions
2.14. Revenue recognition
2.15. Foreign currency transactions
2.16. Offsetting of financial assets and financial liabilities
2.17. Impairment
2.18. Critical accounting estimates and judgments
Non-current assets (or disposal group) classified as held for sale that no longer meet the criteria of classification as
held for sale are transferred to non-current assets at the lower of:
Gains and losses on disposal of non-current assets (or disposal group) held for sale are included in current income.
Provisions are recognized when the Company has a present, legal or constructive obligation as a result of past
events, and it is probable that an outflow of resources embodying economic benefits will be required to settle the
obligation and a reliable estimate of the amount can be made. However, provisions are reviewed at each balance
sheet date and adjusted to reflect the current best estimate.
Revenue from sales is recognized on dispatch/provision of goods/services to the customers. Export goods are
considered dispatched when shipped on board.
Transactions in currencies other than Pakistani Rupee are recorded at the rates of exchange prevailing on the date
of the transactions. At each balance sheet date, monetary assets and liabilities that are denominated in foreign
currencies are translated at the rates prevailing on the balance sheet date except where forward exchange contracts
have been entered into for repayment of liabilities, in that case, the rates contracted for are used.
Exchange differences are included in current income. All non-monetary items are translated into Pak Rupee at
exchange rates prevailing on the date of transaction.
A financial asset and a financial liability is offset and the net amount reported in the balance sheet, if the company
has a legal enforceable right to offset the transaction and also intends either to settle on a net basis or to realize the
asset and settle the liability simultaneously.
The preparation of financial statements in conformity with Accounting and Financial Reporting Standards for
MSEs require management to make judgments, estimates and assumptions that effect the application of policies
and reported amounts of assets and liabilities, income and expenses. The estimates and associated assumptions are
based on historical experience and various other factors that are believed to be reasonable under the
circumstances, the results of which form the basis of making judgments about carrying values of assets and
liabilities that are not readily apparent from other sources. Actual results may differ from these estimates.
The estimates and underlying assumptions are reviewed on an ongoing basis. Revisions to accounting estimates are
recognized in the period in which the estimates are revised.
Significant areas requiring the use of management estimates in these financial statements relate to the useful life of
depreciable assets, deferred taxation and staff retirement benefits-gratuity. However, assumptions and judgments
made by management in the application of accounting policies that have significant effect on the financial
statements are not expected to result in material adjustment to the carrying amounts of assets and liabilities in the
next year.
An assessment is made at each balance sheet date to determine whether there is an indication for impairment of any
asset or group of assets. If any such indication exists, the recoverable amount of that asset is estimated and
impairment losses are recognized in the profit and loss account.
Liabilities for trade and other payables are measured at cost which is the fair value of the consideration to be paid
in the future for goods and services received whether billed to the company or not.
2012 2011
NOTE RUPEES RUPEES
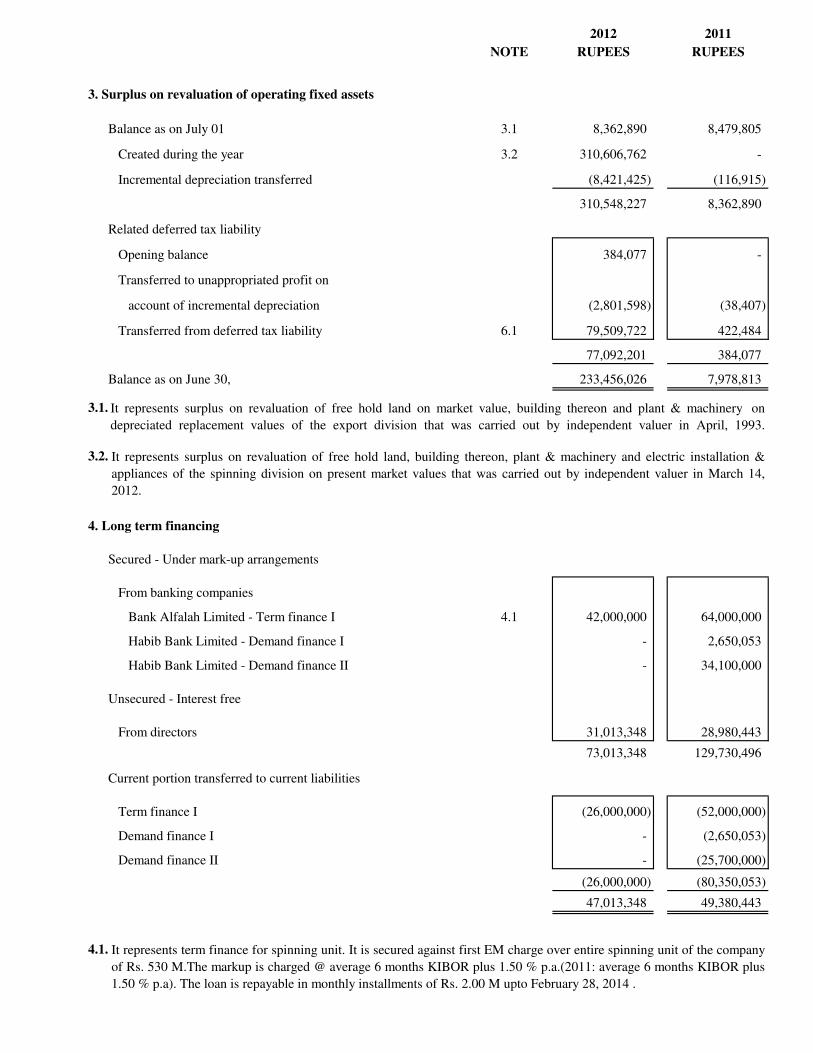
3. Surplus on revaluation of operating fixed assets
Balance as on July 01 3.1 8,362,890 8,479,805
Created during the year 3.2 310,606,762 -
Incremental depreciation transferred (8,421,425) (116,915)
310,548,227 8,362,890
Related deferred tax liability
Opening balance 384,077 -
Transferred to unappropriated profit on
account of incremental depreciation (2,801,598) (38,407)
Transferred from deferred tax liability 6.1 79,509,722 422,484
77,092,201 384,077
Balance as on June 30, 233,456,026 7,978,813
3.1.
3.2.
4. Long term financing
Secured - Under mark-up arrangements
From banking companies
Bank Alfalah Limited - Term finance I 4.1 42,000,000 64,000,000
Habib Bank Limited - Demand finance I - 2,650,053
Habib Bank Limited - Demand finance II - 34,100,000
Unsecured - Interest free
From directors 31,013,348 28,980,443
73,013,348 129,730,496
Current portion transferred to current liabilities
Term finance I (26,000,000) (52,000,000)
Demand finance I - (2,650,053)
Demand finance II - (25,700,000)
(26,000,000) (80,350,053)
47,013,348 49,380,443
4.1.
It represents term finance for spinning unit. It is secured against first EM charge over entire spinning unit of the company
of Rs. 530 M.The markup is charged @ average 6 months KIBOR plus 1.50 % p.a.(2011: average 6 months KIBOR plus
1.50 % p.a). The loan is repayable in monthly installments of Rs. 2.00 M upto February 28, 2014 .
It represents surplus on revaluation of free hold land on market value, building thereon and plant & machinery on
depreciated replacement values of the export division that was carried out by independent valuer in April, 1993.
It represents surplus on revaluation of free hold land, building thereon, plant & machinery and electric installation &
appliances of the spinning division on present market values that was carried out by independent valuer in March 14,
2012.
2012 2011
NOTE RUPEES RUPEES
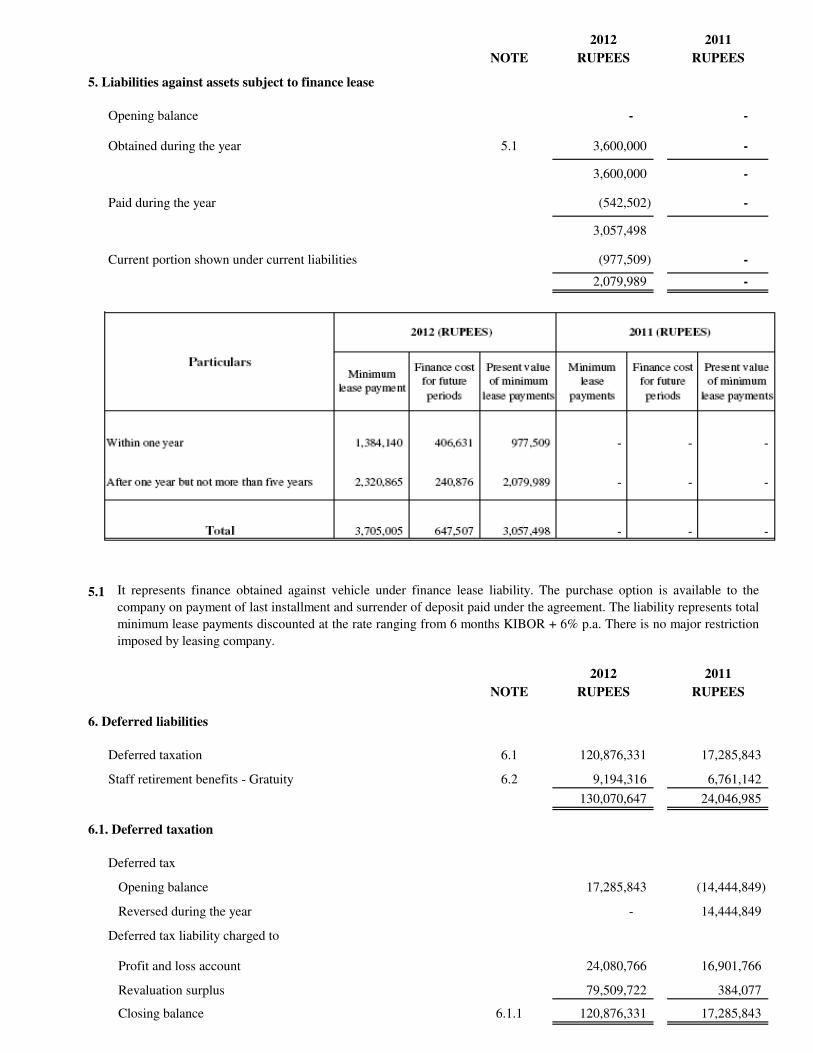
5. Liabilities against assets subject to finance lease
Opening balance - -
Obtained during the year 5.1 3,600,000 -
3,600,000 -
Paid during the year (542,502) -
3,057,498
Current portion shown under current liabilities (977,509) -
2,079,989 -
5.1
2012 2011
NOTE RUPEES RUPEES
6. Deferred liabilities
Deferred taxation 6.1 120,876,331 17,285,843
Staff retirement benefits - Gratuity 6.2 9,194,316 6,761,142
130,070,647 24,046,985
6.1. Deferred taxation
Deferred tax
Opening balance 17,285,843 (14,444,849)
Reversed during the year - 14,444,849
Deferred tax liability charged to
Profit and loss account 24,080,766 16,901,766
Revaluation surplus 79,509,722 384,077
Closing balance 6.1.1 120,876,331 17,285,843
It represents finance obtained against vehicle under finance lease liability. The purchase option is available to the
company on payment of last installment and surrender of deposit paid under the agreement. The liability represents total
minimum lease payments discounted at the rate ranging from 6 months KIBOR + 6% p.a. There is no major restriction
imposed by leasing company.
2012 2011
NOTE RUPEES RUPEES
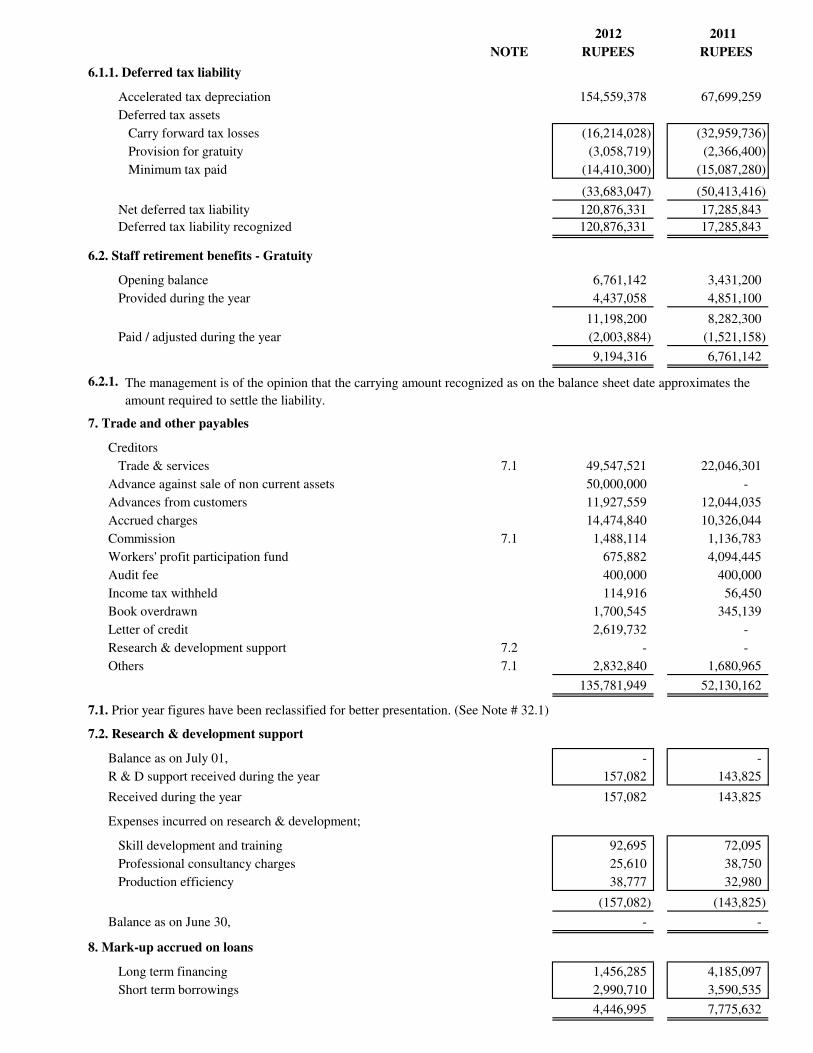
6.1.1. Deferred tax liability
Accelerated tax depreciation 154,559,378 67,699,259
Deferred tax assets
Carry forward tax losses (16,214,028) (32,959,736)
Provision for gratuity (3,058,719) (2,366,400)
Minimum tax paid (14,410,300) (15,087,280)
(33,683,047) (50,413,416)
Net deferred tax liability 120,876,331 17,285,843
Deferred tax liability recognized 120,876,331 17,285,843
6.2. Staff retirement benefits - Gratuity
Opening balance 6,761,142 3,431,200
Provided during the year 4,437,058 4,851,100
11,198,200 8,282,300
Paid / adjusted during the year (2,003,884) (1,521,158)
9,194,316 6,761,142
6.2.1.
7. Trade and other payables
Creditors
Trade & services 7.1 49,547,521 22,046,301
Advance against sale of non current assets 50,000,000 -
Advances from customers 11,927,559 12,044,035
Accrued charges 14,474,840 10,326,044
Commission 7.1 1,488,114 1,136,783
Workers' profit participation fund 675,882 4,094,445
Audit fee 400,000 400,000
Income tax withheld 114,916 56,450
Book overdrawn 1,700,545 345,139
Letter of credit 2,619,732 -
Research & development support 7.2 - -
Others 7.1 2,832,840 1,680,965
135,781,949 52,130,162
7.1. Prior year figures have been reclassified for better presentation. (See Note # 32.1)
7.2. Research & development support
Balance as on July 01, - -
R & D support received during the year 157,082 143,825
Received during the year 157,082 143,825
Expenses incurred on research & development;
Skill development and training 92,695 72,095
Professional consultancy charges 25,610 38,750
Production efficiency 38,777 32,980
(157,082) (143,825)
Balance as on June 30, - -
8. Mark-up accrued on loans
Long term financing 1,456,285 4,185,097
Short term borrowings 2,990,710 3,590,535
4,446,995 7,775,632
The management is of the opinion that the carrying amount recognized as on the balance sheet date approximates the
amount required to settle the liability.
2012 2011
NOTE RUPEES RUPEES
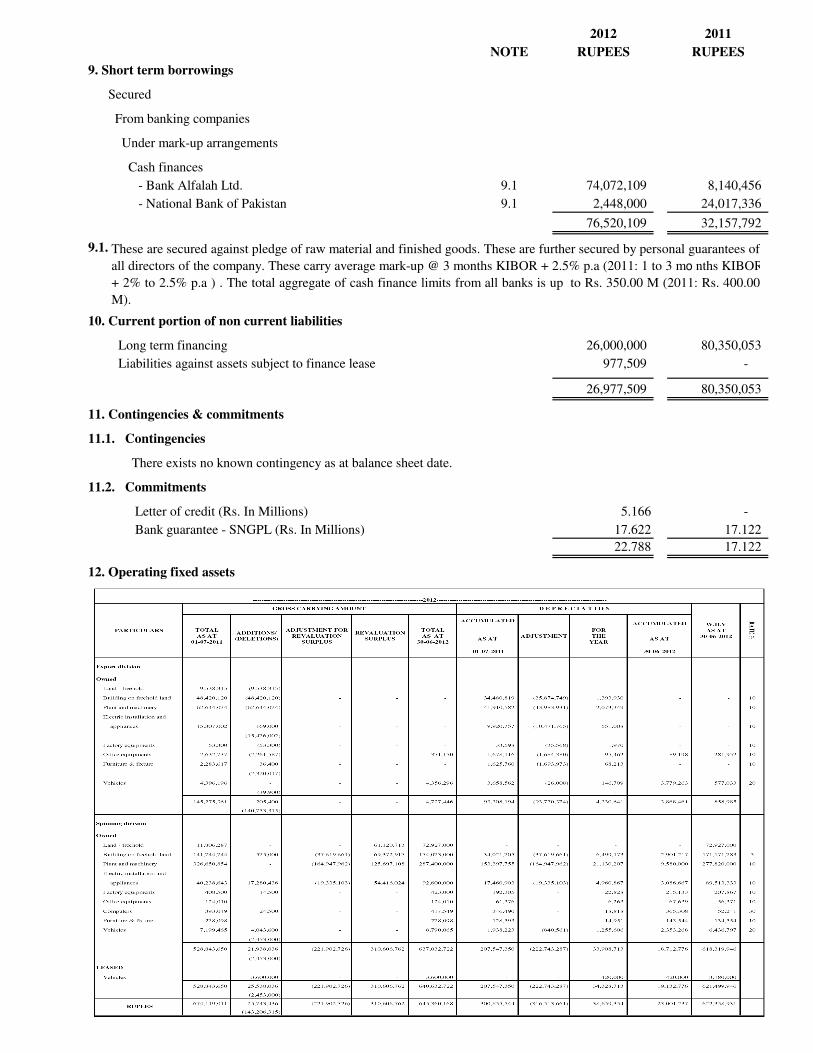
9. Short term borrowings
Secured
From banking companies
Under mark-up arrangements
Cash finances
- Bank Alfalah Ltd. 9.1 74,072,109 8,140,456
- National Bank of Pakistan 9.1 2,448,000 24,017,336
76,520,109 32,157,792
9.1.
10. Current portion of non current liabilities
Long term financing 26,000,000 80,350,053
Liabilities against assets subject to finance lease 977,509 -
26,977,509 80,350,053
11. Contingencies & commitments
11.1. Contingencies
There exists no known contingency as at balance sheet date.
11.2. Commitments
Letter of credit (Rs. In Millions) 5.166 -
Bank guarantee - SNGPL (Rs. In Millions) 17.622 17.122
22.788 17.122
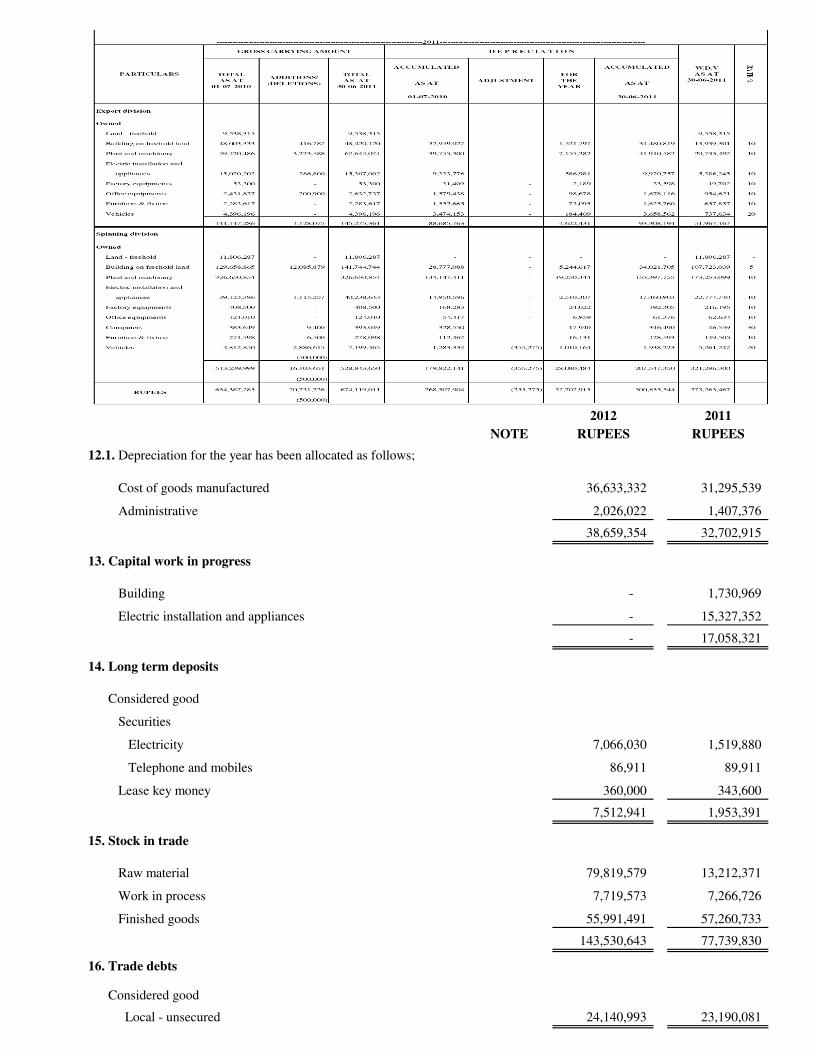
12. Operating fixed assets
These are secured against pledge of raw material and finished goods. These are further secured by personal guarantees of
all directors of the company. These carry average mark-up @ 3 months KIBOR + 2.5% p.a (2011: 1 to 3 mo nths KIBOR
+ 2% to 2.5% p.a ) . The total aggregate of cash finance limits from all banks is up to Rs. 350.00 M (2011: Rs. 400.00
M).
2012 2011
NOTE RUPEES RUPEES
12.1. Depreciation for the year has been allocated as follows;
Cost of goods manufactured 36,633,332 31,295,539
Administrative 2,026,022 1,407,376
38,659,354 32,702,915
13. Capital work in progress
Building - 1,730,969
Electric installation and appliances - 15,327,352
- 17,058,321
14. Long term deposits
Considered good
Securities
Electricity 7,066,030 1,519,880
Telephone and mobiles 86,911 89,911
Lease key money 360,000 343,600
7,512,941 1,953,391
15. Stock in trade
Raw material 79,819,579 13,212,371
Work in process 7,719,573 7,266,726
Finished goods 55,991,491 57,260,733
143,530,643 77,739,830
16. Trade debts
Considered good
Local - unsecured 24,140,993 23,190,081
2012 2011
NOTE RUPEES RUPEES
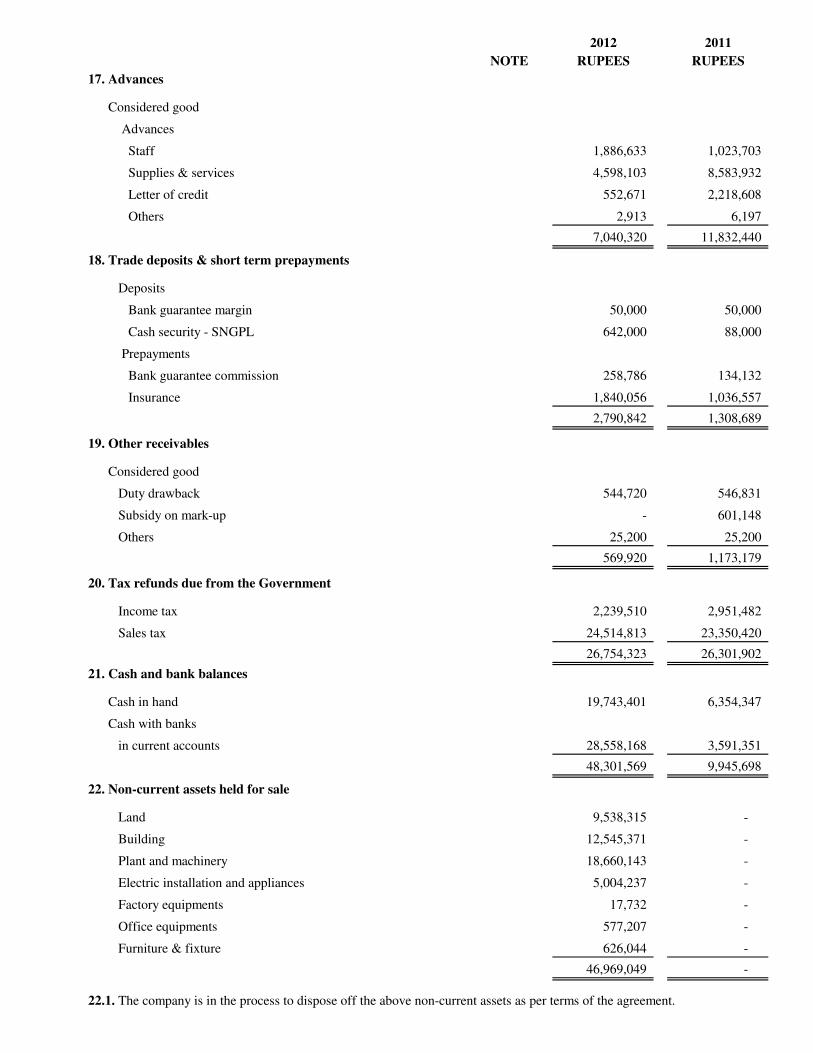
17. Advances
Considered good
Advances
Staff 1,886,633 1,023,703
Supplies & services 4,598,103 8,583,932
Letter of credit 552,671 2,218,608
Others 2,913 6,197
7,040,320 11,832,440
18. Trade deposits & short term prepayments
Deposits
Bank guarantee margin 50,000 50,000
Cash security - SNGPL 642,000 88,000
Prepayments
Bank guarantee commission 258,786 134,132
Insurance 1,840,056 1,036,557
2,790,842 1,308,689
19. Other receivables
Considered good
Duty drawback 544,720 546,831
Subsidy on mark-up - 601,148
Others 25,200 25,200
569,920 1,173,179
20. Tax refunds due from the Government
Income tax 2,239,510 2,951,482
Sales tax 24,514,813 23,350,420
26,754,323 26,301,902
21. Cash and bank balances
Cash in hand 19,743,401 6,354,347
Cash with banks
in current accounts 28,558,168 3,591,351
48,301,569 9,945,698
22. Non-current assets held for sale
Land 9,538,315 -
Building 12,545,371 -
Plant and machinery 18,660,143 -
Electric installation and appliances 5,004,237 -
Factory equipments 17,732 -
Office equipments 577,207 -
Furniture & fixture 626,044 -
46,969,049 -
22.1. The company is in the process to dispose off the above non-current assets as per terms of the agreement.
EXPORT SPINNING 2012 2011
NOTE DIVISION DIVISION RUPEES RUPEES
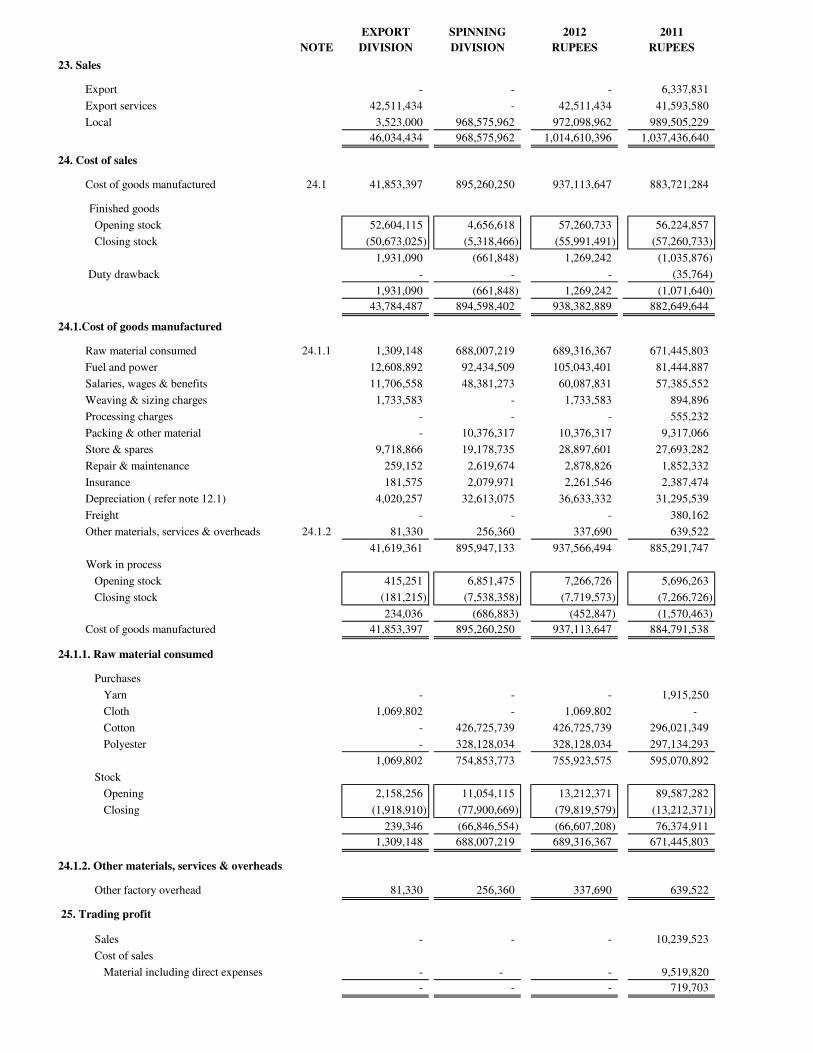
23. Sales
Export - - - 6,337,831
Export services 42,511,434 - 42,511,434 41,593,580
Local 3,523,000 968,575,962 972,098,962 989,505,229
46,034,434 968,575,962 1,014,610,396 1,037,436,640
24. Cost of sales
Cost of goods manufactured 24.1 41,853,397 895,260,250 937,113,647 883,721,284
Finished goods
Opening stock 52,604,115 4,656,618 57,260,733 56,224,857
Closing stock (50,673,025) (5,318,466) (55,991,491) (57,260,733)
1,931,090 (661,848) 1,269,242 (1,035,876)
Duty drawback - - - (35,764)
1,931,090 (661,848) 1,269,242 (1,071,640)
43,784,487 894,598,402 938,382,889 882,649,644
24.1.Cost of goods manufactured
Raw material consumed 24.1.1 1,309,148 688,007,219 689,316,367 671,445,803
Fuel and power 12,608,892 92,434,509 105,043,401 81,444,887
Salaries, wages & benefits 11,706,558 48,381,273 60,087,831 57,385,552
Weaving & sizing charges 1,733,583 - 1,733,583 894,896
Processing charges - - - 555,232
Packing & other material - 10,376,317 10,376,317 9,317,066
Store & spares 9,718,866 19,178,735 28,897,601 27,693,282
Repair & maintenance 259,152 2,619,674 2,878,826 1,852,332
Insurance 181,575 2,079,971 2,261,546 2,387,474
Depreciation ( refer note 12.1) 4,020,257 32,613,075 36,633,332 31,295,539
Freight - - - 380,162
Other materials, services & overheads 24.1.2 81,330 256,360 337,690 639,522
41,619,361 895,947,133 937,566,494 885,291,747
Work in process
Opening stock 415,251 6,851,475 7,266,726 5,696,263
Closing stock (181,215) (7,538,358) (7,719,573) (7,266,726)
234,036 (686,883) (452,847) (1,570,463)
Cost of goods manufactured 41,853,397 895,260,250 937,113,647 884,791,538
24.1.1. Raw material consumed
Purchases
Yarn - - - 1,915,250
Cloth 1,069,802 - 1,069,802 -
Cotton - 426,725,739 426,725,739 296,021,349
Polyester - 328,128,034 328,128,034 297,134,293
1,069,802 754,853,773 755,923,575 595,070,892
Stock
Opening 2,158,256 11,054,115 13,212,371 89,587,282
Closing (1,918,910) (77,900,669) (79,819,579) (13,212,371)
239,346 (66,846,554) (66,607,208) 76,374,911
1,309,148 688,007,219 689,316,367 671,445,803
24.1.2. Other materials, services & overheads
Other factory overhead 81,330 256,360 337,690 639,522
25. Trading profit
Sales - - - 10,239,523
Cost of sales
Material including direct expenses - - - 9,519,820
- - - 719,703
EXPORT SPINNING 2012 2011
NOTE DIVISION DIVISION RUPEES RUPEES
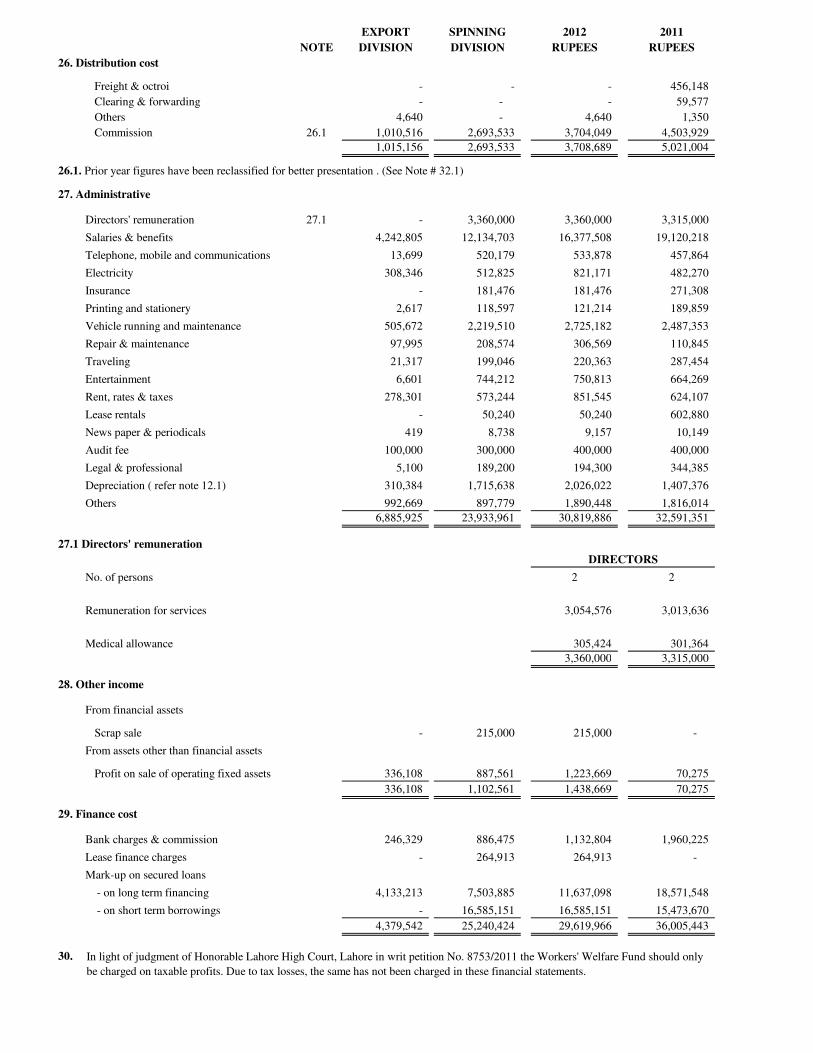
26. Distribution cost
Freight & octroi - - - 456,148
Clearing & forwarding - - - 59,577
Others 4,640 - 4,640 1,350
Commission 26.1 1,010,516 2,693,533 3,704,049 4,503,929
1,015,156 2,693,533 3,708,689 5,021,004
26.1. Prior year figures have been reclassified for better presentation . (See Note # 32.1)
27. Administrative
Directors' remuneration 27.1 - 3,360,000 3,360,000 3,315,000
Salaries & benefits 4,242,805 12,134,703 16,377,508 19,120,218
Telephone, mobile and communications 13,699 520,179 533,878 457,864
Electricity 308,346 512,825 821,171 482,270
Insurance - 181,476 181,476 271,308
Printing and stationery 2,617 118,597 121,214 189,859
Vehicle running and maintenance 505,672 2,219,510 2,725,182 2,487,353
Repair & maintenance 97,995 208,574 306,569 110,845
Traveling 21,317 199,046 220,363 287,454
Entertainment 6,601 744,212 750,813 664,269
Rent, rates & taxes 278,301 573,244 851,545 624,107
Lease rentals - 50,240 50,240 602,880
News paper & periodicals 419 8,738 9,157 10,149
Audit fee 100,000 300,000 400,000 400,000
Legal & professional 5,100 189,200 194,300 344,385
Depreciation ( refer note 12.1) 310,384 1,715,638 2,026,022 1,407,376
Others 992,669 897,779 1,890,448 1,816,014
6,885,925 23,933,961 30,819,886 32,591,351
27.1 Directors' remuneration
No. of persons 2 2
Remuneration for services 3,054,576 3,013,636
Medical allowance 305,424 301,364
3,360,000 3,315,000
28. Other income
From financial assets
Scrap sale - 215,000 215,000 -
From assets other than financial assets
Profit on sale of operating fixed assets 336,108 887,561 1,223,669 70,275
336,108 1,102,561 1,438,669 70,275
29. Finance cost
Bank charges & commission 246,329 886,475 1,132,804 1,960,225
Lease finance charges - 264,913 264,913 -
Mark-up on secured loans
- on long term financing 4,133,213 7,503,885 11,637,098 18,571,548
- on short term borrowings - 16,585,151 16,585,151 15,473,670
4,379,542 25,240,424 29,619,966 36,005,443
30.
DIRECTORS
In light of judgment of Honorable Lahore High Court, Lahore in writ petition No. 8753/2011 the Workers' Welfare Fund should only
be charged on taxable profits. Due to tax losses, the same has not been charged in these financial statements.
EXPORT SPINNING 2012 2011
NOTE DIVISION DIVISION RUPEES RUPEES
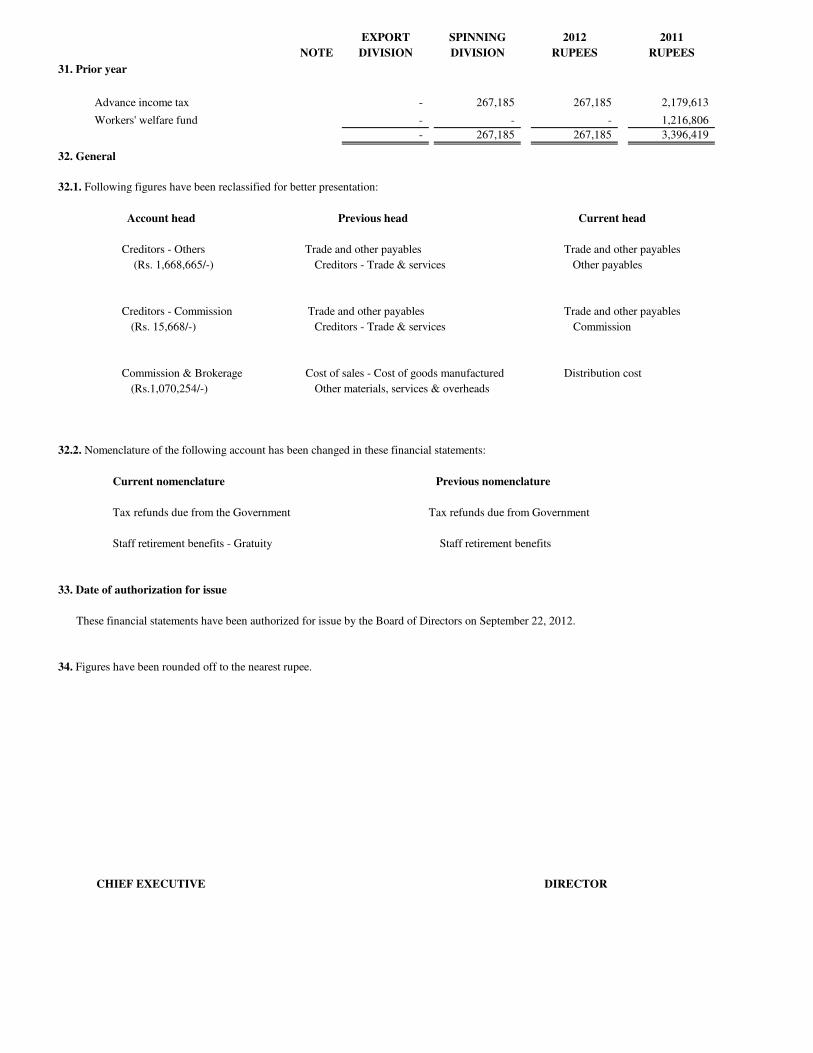
31. Prior year
Advance income tax - 267,185 267,185 2,179,613
Workers' welfare fund - - - 1,216,806
- 267,185 267,185 3,396,419
32. General
32.1. Following figures have been reclassified for better presentation:
Account head Previous head Current head
Creditors - Others Trade and other payables Trade and other payables
(Rs. 1,668,665/-) Creditors - Trade & services Other payables
Creditors - Commission Trade and other payables Trade and other payables
(Rs. 15,668/-) Creditors - Trade & services Commission
Commission & Brokerage Cost of sales - Cost of goods manufactured Distribution cost
(Rs.1,070,254/-) Other materials, services & overheads
32.2. Nomenclature of the following account has been changed in these financial statements:
Current nomenclature Previous nomenclature
Tax refunds due from the Government Tax refunds due from Government
Staff retirement benefits - Gratuity Staff retirement benefits
33. Date of authorization for issue
These financial statements have been authorized for issue by the Board of Directors on September 22, 2012.
34. Figures have been rounded off to the nearest rupee.
CHIEF EXECUTIVE DIRECTOR