Embed Size (px)
Citation preview
2292 VOLUME 39J O U R N A L O F A P P L I E D M E T E O R O L O G Y
q 2000 American Meteorological Society
NOTES AND CORRESPONDENCE
A Comparison of Cloud and Rainfall Information from Instantaneous Visible andInfrared Scanner and Precipitation Radar Observations over a Frontal Zone in
East Asia during June 1998
TOSHIRO INOUE AND KAZUMASA AONASHI
Meteorological Research Institute/Japan Meteorological Agency, Tsukuba, Ibaraki, Japan
4 October 1999 and 16 June 2000
ABSTRACT
The comparison between cloud information and rainfall is studied using infrared and radar data from theTropical Rainfall Measuring Mission. Cloud information from the visible and infrared scanner was comparedwith rain information from precipitation radar (PR) for rain cases assembled during June 1998 over a frontalzone in east Asia. The authors selected the following four parameters: 1) radiance ratio of 0.6 and 1.6 mm[channel 1/channel 2 (Ch1/Ch2)], 2) brightness temperature difference between 11 and 12 mm (BTD45), 3)brightness temperature difference between 3.8 and 11 mm (BTD34), and 4) brightness temperature (TBB) inchannel 4 (Ch4) as the cloud information. The flags of ‘‘rain certain,’’ stratiform rain, brightband existence, andconvective rain observed by PR, and integrated rain rate from the rain bottom to rain top were used as therainfall information.
From the comparison between rain–no-rain information by PR and the four cloud parameters, it is found thatvalues of the radiance ratio of Ch1/Ch2 larger than 25, BTD45 smaller than 1.5 K, and BTD34 smaller than 8K are effective in delineating rain area. The probability of detection (POD), false alarm ratio (FAR), and skillscore (SS) are computed and compared for the following rain and no-rain algorithms: 1) single cloud thresholdof 235 K in Ch4 TBB as in the Geostationary Operational Environmental Satellite Precipitation Index, 2) singlethreshold of 260 K in Ch4 TBB, 3) Ch1/Ch2 larger than 25 and Ch4 TBB colder than 260 K (C12), 4) BTD45smaller than 1.5 K and Ch4 TBB colder than 260 K (C45), and 5) BTD34 smaller than 8 K and Ch4 TBBcolder than 260 K. The C12 method shows the highest SS, and the C45 method shows the highest POD. TheBTD34 scores better in FAR than the BTD45 and is better than BTD45 in delineating the thicker part of cirrusclouds. The use of the second channel shows better scores than does use of the single infrared threshold algorithm.
The cloud characteristics for convective rain and stratiform rain are also studied using Ch1/Ch2, BTD45, andBTD34. The percentage of occurrence of stratiform rain shows a local maximum for clouds of small BTD45/BTD34 with Ch4 TBB of 220–250 K. The higher percentage of convective rain corresponds well to the opticallythicker (smaller BTD45) clouds colder than 210 K. However, there is no significant difference in Ch1/Ch2between convective and stratiform rain, because significant convective cases are not included in the data thatwere processed.
1. Introduction
Rainfall events are characterized as highly variablein time and space. High temporal resolution and largecoverage areas are essential for observing these events.Therefore, observations from satellites, especially fromthose in geostationary orbit, are considered to be effec-tive tools.
There is a long history of visible and infrared ob-servations from geostationary satellites that enablehigh–temporal resolution (half-hourly) observations ofcloud and precipitation systems. Developing better rain-
Corresponding author address: Dr. Toshiro Inoue, MRI/JMA, 1-1Nagamine, Tsukuba, Ibaraki 305-0052, Japan.E-mail: [email protected]
fall estimation algorithms is thus extremely importantfor making the best possible use of these data.
Recent space platforms carry several kinds of sensorsthat measure visible, infrared, and microwave radiation.Rainfall estimation from infrared data is indirect, be-cause the rainfall signal inside the cloud is not measured.However, passive and active microwave instruments di-rectly measure the rain or water signal. Therefore, in-stantaneous rainfall estimates made from microwavemeasurements are superior to those from infrared dataonly. However, the Third Algorithm IntercomparisonProject shows that the infrared method scores higherthan the microwave method for monthly mean rainfallestimation (Ebert and Manton 1998). This result is duemostly to better time sampling in the infrared dataset.
It is an essential but difficult task to construct col-
Unauthenticated | Downloaded 01/29/22 09:42 AM UTC
DECEMBER 2000 2293N O T E S A N D C O R R E S P O N D E N C E
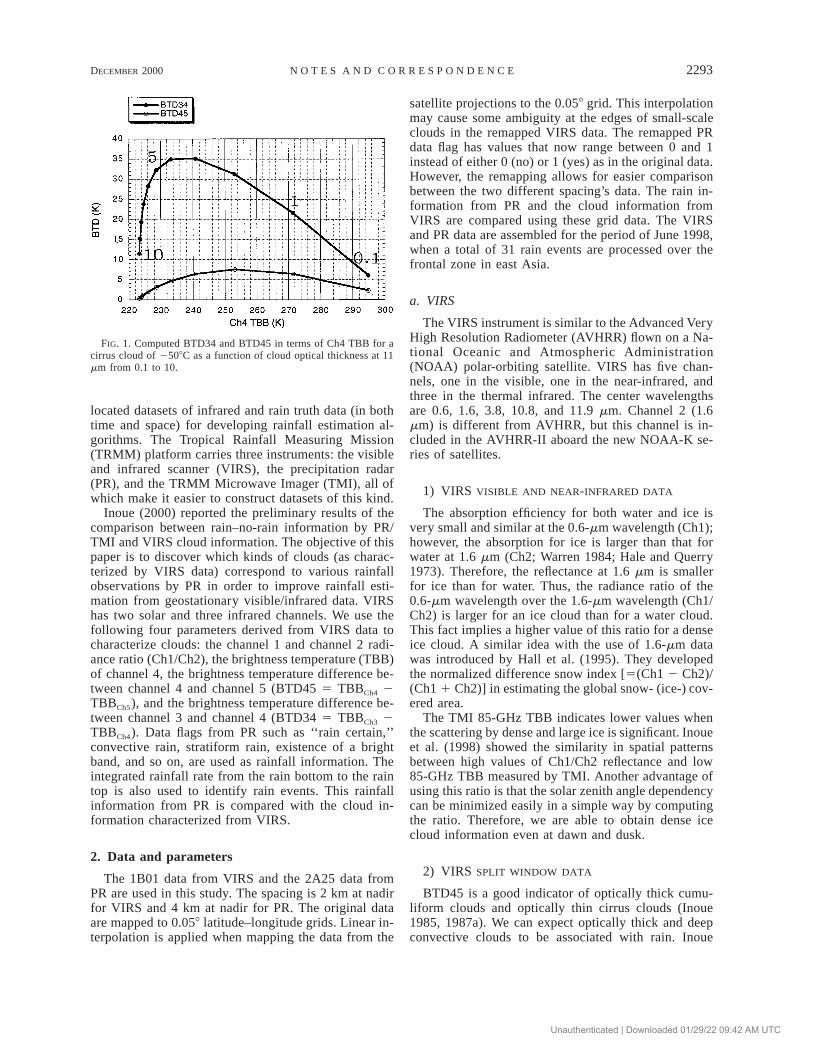
FIG. 1. Computed BTD34 and BTD45 in terms of Ch4 TBB for acirrus cloud of 2508C as a function of cloud optical thickness at 11mm from 0.1 to 10.
located datasets of infrared and rain truth data (in bothtime and space) for developing rainfall estimation al-gorithms. The Tropical Rainfall Measuring Mission(TRMM) platform carries three instruments: the visibleand infrared scanner (VIRS), the precipitation radar(PR), and the TRMM Microwave Imager (TMI), all ofwhich make it easier to construct datasets of this kind.
Inoue (2000) reported the preliminary results of thecomparison between rain–no-rain information by PR/TMI and VIRS cloud information. The objective of thispaper is to discover which kinds of clouds (as charac-terized by VIRS data) correspond to various rainfallobservations by PR in order to improve rainfall esti-mation from geostationary visible/infrared data. VIRShas two solar and three infrared channels. We use thefollowing four parameters derived from VIRS data tocharacterize clouds: the channel 1 and channel 2 radi-ance ratio (Ch1/Ch2), the brightness temperature (TBB)of channel 4, the brightness temperature difference be-tween channel 4 and channel 5 (BTD45 5 TBBCh4 2TBBCh5), and the brightness temperature difference be-tween channel 3 and channel 4 (BTD34 5 TBBCh3 2TBBCh4). Data flags from PR such as ‘‘rain certain,’’convective rain, stratiform rain, existence of a brightband, and so on, are used as rainfall information. Theintegrated rainfall rate from the rain bottom to the raintop is also used to identify rain events. This rainfallinformation from PR is compared with the cloud in-formation characterized from VIRS.
2. Data and parameters
The 1B01 data from VIRS and the 2A25 data fromPR are used in this study. The spacing is 2 km at nadirfor VIRS and 4 km at nadir for PR. The original dataare mapped to 0.058 latitude–longitude grids. Linear in-terpolation is applied when mapping the data from the
satellite projections to the 0.058 grid. This interpolationmay cause some ambiguity at the edges of small-scaleclouds in the remapped VIRS data. The remapped PRdata flag has values that now range between 0 and 1instead of either 0 (no) or 1 (yes) as in the original data.However, the remapping allows for easier comparisonbetween the two different spacing’s data. The rain in-formation from PR and the cloud information fromVIRS are compared using these grid data. The VIRSand PR data are assembled for the period of June 1998,when a total of 31 rain events are processed over thefrontal zone in east Asia.
a. VIRS
The VIRS instrument is similar to the Advanced VeryHigh Resolution Radiometer (AVHRR) flown on a Na-tional Oceanic and Atmospheric Administration(NOAA) polar-orbiting satellite. VIRS has five chan-nels, one in the visible, one in the near-infrared, andthree in the thermal infrared. The center wavelengthsare 0.6, 1.6, 3.8, 10.8, and 11.9 mm. Channel 2 (1.6mm) is different from AVHRR, but this channel is in-cluded in the AVHRR-II aboard the new NOAA-K se-ries of satellites.
1) VIRS VISIBLE AND NEAR-INFRARED DATA
The absorption efficiency for both water and ice isvery small and similar at the 0.6-mm wavelength (Ch1);however, the absorption for ice is larger than that forwater at 1.6 mm (Ch2; Warren 1984; Hale and Querry1973). Therefore, the reflectance at 1.6 mm is smallerfor ice than for water. Thus, the radiance ratio of the0.6-mm wavelength over the 1.6-mm wavelength (Ch1/Ch2) is larger for an ice cloud than for a water cloud.This fact implies a higher value of this ratio for a denseice cloud. A similar idea with the use of 1.6-mm datawas introduced by Hall et al. (1995). They developedthe normalized difference snow index [5(Ch1 2 Ch2)/(Ch1 1 Ch2)] in estimating the global snow- (ice-) cov-ered area.
The TMI 85-GHz TBB indicates lower values whenthe scattering by dense and large ice is significant. Inoueet al. (1998) showed the similarity in spatial patternsbetween high values of Ch1/Ch2 reflectance and low85-GHz TBB measured by TMI. Another advantage ofusing this ratio is that the solar zenith angle dependencycan be minimized easily in a simple way by computingthe ratio. Therefore, we are able to obtain dense icecloud information even at dawn and dusk.
2) VIRS SPLIT WINDOW DATA
BTD45 is a good indicator of optically thick cumu-liform clouds and optically thin cirrus clouds (Inoue1985, 1987a). We can expect optically thick and deepconvective clouds to be associated with rain. Inoue
Unauthenticated | Downloaded 01/29/22 09:42 AM UTC
2294 VOLUME 39J O U R N A L O F A P P L I E D M E T E O R O L O G Y
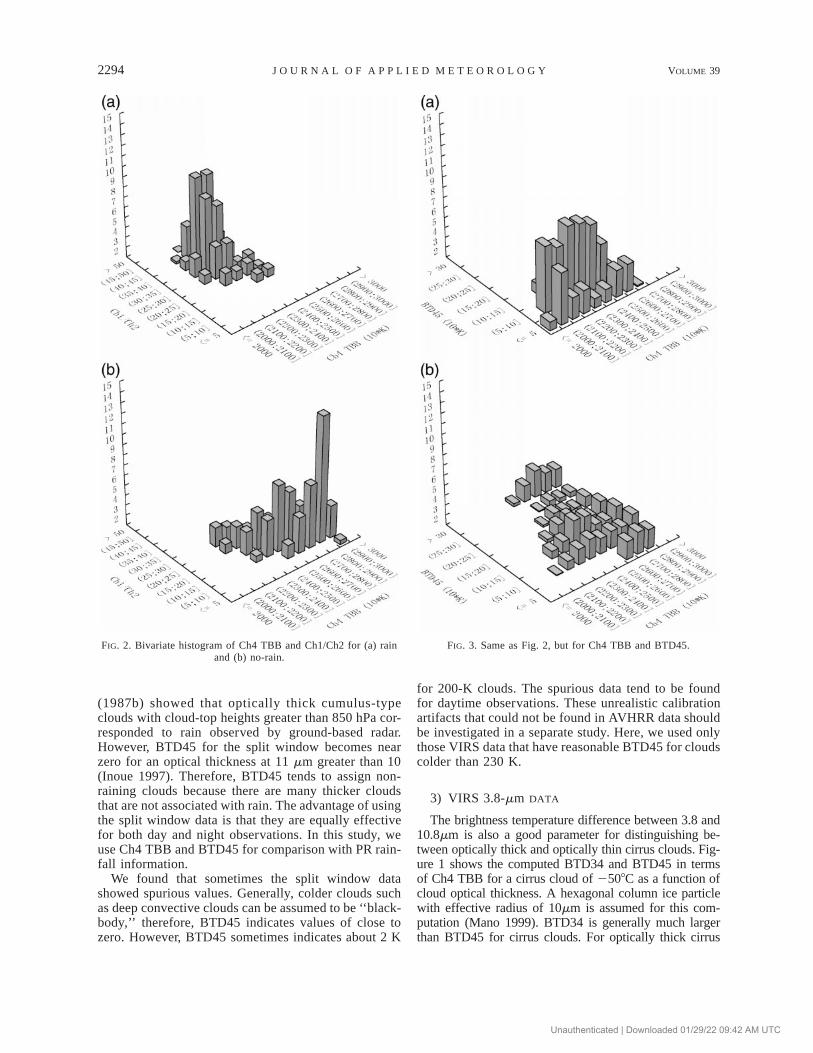
FIG. 2. Bivariate histogram of Ch4 TBB and Ch1/Ch2 for (a) rainand (b) no-rain.
FIG. 3. Same as Fig. 2, but for Ch4 TBB and BTD45.
(1987b) showed that optically thick cumulus-typeclouds with cloud-top heights greater than 850 hPa cor-responded to rain observed by ground-based radar.However, BTD45 for the split window becomes nearzero for an optical thickness at 11 mm greater than 10(Inoue 1997). Therefore, BTD45 tends to assign non-raining clouds because there are many thicker cloudsthat are not associated with rain. The advantage of usingthe split window data is that they are equally effectivefor both day and night observations. In this study, weuse Ch4 TBB and BTD45 for comparison with PR rain-fall information.
We found that sometimes the split window datashowed spurious values. Generally, colder clouds suchas deep convective clouds can be assumed to be ‘‘black-body,’’ therefore, BTD45 indicates values of close tozero. However, BTD45 sometimes indicates about 2 K
for 200-K clouds. The spurious data tend to be foundfor daytime observations. These unrealistic calibrationartifacts that could not be found in AVHRR data shouldbe investigated in a separate study. Here, we used onlythose VIRS data that have reasonable BTD45 for cloudscolder than 230 K.
3) VIRS 3.8-mm DATA
The brightness temperature difference between 3.8 and10.8mm is also a good parameter for distinguishing be-tween optically thick and optically thin cirrus clouds. Fig-ure 1 shows the computed BTD34 and BTD45 in termsof Ch4 TBB for a cirrus cloud of 2508C as a function ofcloud optical thickness. A hexagonal column ice particlewith effective radius of 10mm is assumed for this com-putation (Mano 1999). BTD34 is generally much largerthan BTD45 for cirrus clouds. For optically thick cirrus
Unauthenticated | Downloaded 01/29/22 09:42 AM UTC

DECEMBER 2000 2295N O T E S A N D C O R R E S P O N D E N C E
FIG. 4. Same as Fig. 2, but for Ch4 TBB and BTD34.
TABLE 1. The averages of the probability of detection (POD), falsealarm ratio (FAR), and skill score (SS) computed for five algorithms:1) single threshold of 235 K in Ch4 TBB (IR235), 2) single thresholdof 260 K in Ch4 TBB (IR260), 3) BTD45 smaller than 1.5 K andCh4 TBB colder than 260 K (C45), 4) BTD34 smaller than 8 K andCh4 TBB colder than 260 K (C34), and 5) Ch1/Ch2 larger than 25and Ch4 TBB colder than 260 K (C12).
Method POD FAR SS
IR235IR260C45C34C12
0.460.860.770.650.73
0.200.590.360.270.21
0.250.170.310.320.46
(colder in Ch4 TBB), BTD45 becomes close to zero, whileBTD34 indicates larger values. Therefore, we can expectthat a small BTD34 may detect the thicker parts of cirrusclouds more effectively than does BTD45. The 3.8-mmdata are used only at night to avoid problems from re-flection of solar radiation.
b. PR data
The PR instrument is an active phased-array micro-wave radar operating with horizontal polarization, witha minimum measurable rain rate of 0.5 mm h21. Thereare 49 nadir angle bins with an angle bin interval of0.718 over a swath width of 215 km. The spatial reso-lution at nadir is 4 km, and the vertical resolution is250 m from the surface to 20 km.
We use the level 2A25 data as rain truth data. Thedata contain attenuation-corrected rainfall rates at every
vertical level, with 250-m vertical resolution. The dataalso include flags such as rain certain, convective rain,stratiform rain, and the existence of a bright band, andso on. In this study, the rain flags of rain certain, con-vective rain, stratiform rain, and the bright band are usedas rainfall information. The integrated rainfall rate fromthe rain bottom to the rain top is also used to identifyrain events.
3. Results
a. Cloud features of rain–no-rain grid
The rain information in the PR rain flags [rain certain(RC), stratiform rain, convective rain, and bright band]are compared with cloud parameters of Ch4 TBB,BTD45, BTD34, and Ch1/Ch2. The rain flag data showfractions from 0 to 1 instead of 0 (no) or 1 (yes) as inthe original data, because we use the grid data. The databecome hard to understand, but here we assume thatvalues of 0.8 or greater correspond to the original 1(yes) data and 0.2 or smaller correspond to the original0 (no). From an inspection of the spatial distribution ofthe total rain rate (sum of the rainfall rate from thesurface to 20-km height), we assign the rain area to bewhere the rain rate is greater than 8 mm h21 (corre-sponding to 0.4 mm h21 as an average rain rate in theobserved bin) to exclude noise. We assigned the grid asrain grid when RC was greater than 0.8 and the totalrain rate was larger than 8 mm h21.
Figure 2 shows a bivariate histogram of cloud char-acteristics in terms of Ch4 TBB and Ch1/Ch2 for (a)rain grid and (b) no-rain grid. Each bar represents thepercentage for rain and no-rain cases. The rain grids aremostly covered by cloud for which Ch1/Ch2 is greaterthan 25 with Ch4 TBB colder than 260 K. The no-raingrids are cloud free or are covered by clouds for whichCh1/Ch2 is smaller than 25. Thus, 73% of the rain gridsare covered by clouds for which Ch1/Ch2 is greater than25 with Ch4 TBB colder than 260 K. The same type ofcloud covers only 21% of the no-rain grids. The cloudsthat are colder than 260 K and have a Ch1/Ch2 valuelarger than 25 correspond well to rain according to thePR observations.
Inoue (2000) showed that an optically thick cloud
Unauthenticated | Downloaded 01/29/22 09:42 AM UTC
2296 VOLUME 39J O U R N A L O F A P P L I E D M E T E O R O L O G Y
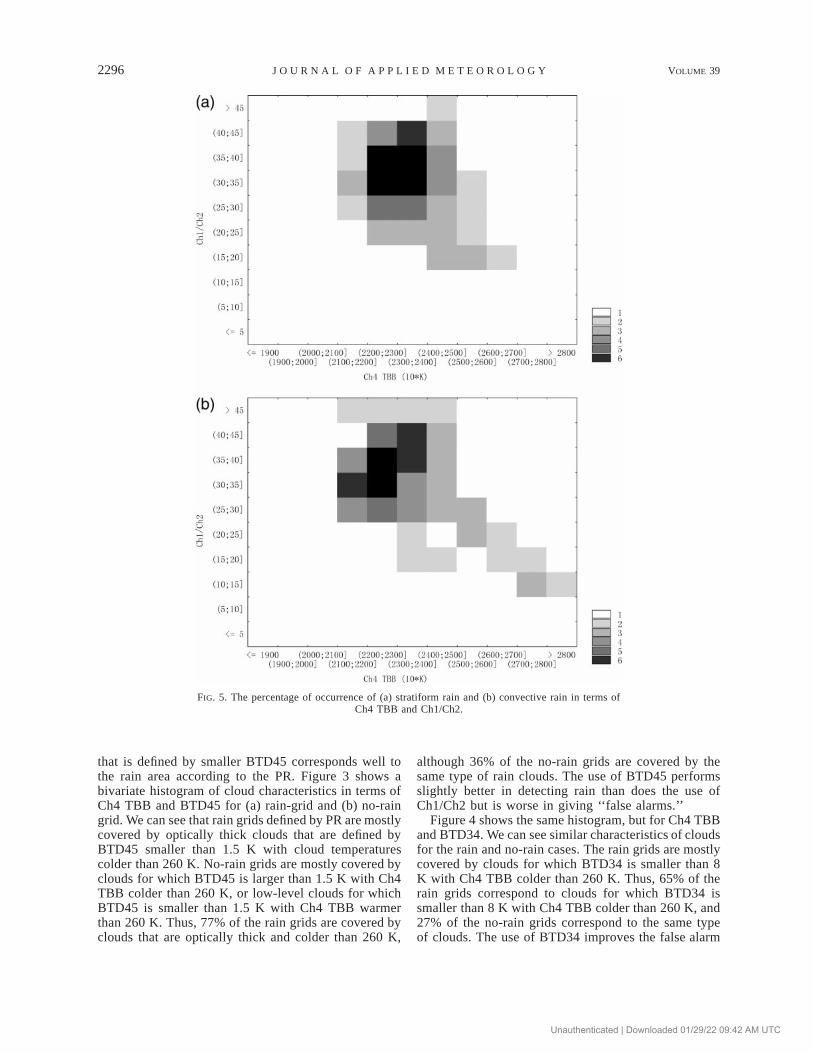
FIG. 5. The percentage of occurrence of (a) stratiform rain and (b) convective rain in terms ofCh4 TBB and Ch1/Ch2.
that is defined by smaller BTD45 corresponds well tothe rain area according to the PR. Figure 3 shows abivariate histogram of cloud characteristics in terms ofCh4 TBB and BTD45 for (a) rain-grid and (b) no-raingrid. We can see that rain grids defined by PR are mostlycovered by optically thick clouds that are defined byBTD45 smaller than 1.5 K with cloud temperaturescolder than 260 K. No-rain grids are mostly covered byclouds for which BTD45 is larger than 1.5 K with Ch4TBB colder than 260 K, or low-level clouds for whichBTD45 is smaller than 1.5 K with Ch4 TBB warmerthan 260 K. Thus, 77% of the rain grids are covered byclouds that are optically thick and colder than 260 K,
although 36% of the no-rain grids are covered by thesame type of rain clouds. The use of BTD45 performsslightly better in detecting rain than does the use ofCh1/Ch2 but is worse in giving ‘‘false alarms.’’
Figure 4 shows the same histogram, but for Ch4 TBBand BTD34. We can see similar characteristics of cloudsfor the rain and no-rain cases. The rain grids are mostlycovered by clouds for which BTD34 is smaller than 8K with Ch4 TBB colder than 260 K. Thus, 65% of therain grids correspond to clouds for which BTD34 issmaller than 8 K with Ch4 TBB colder than 260 K, and27% of the no-rain grids correspond to the same typeof clouds. The use of BTD34 improves the false alarm
Unauthenticated | Downloaded 01/29/22 09:42 AM UTC
DECEMBER 2000 2297N O T E S A N D C O R R E S P O N D E N C E
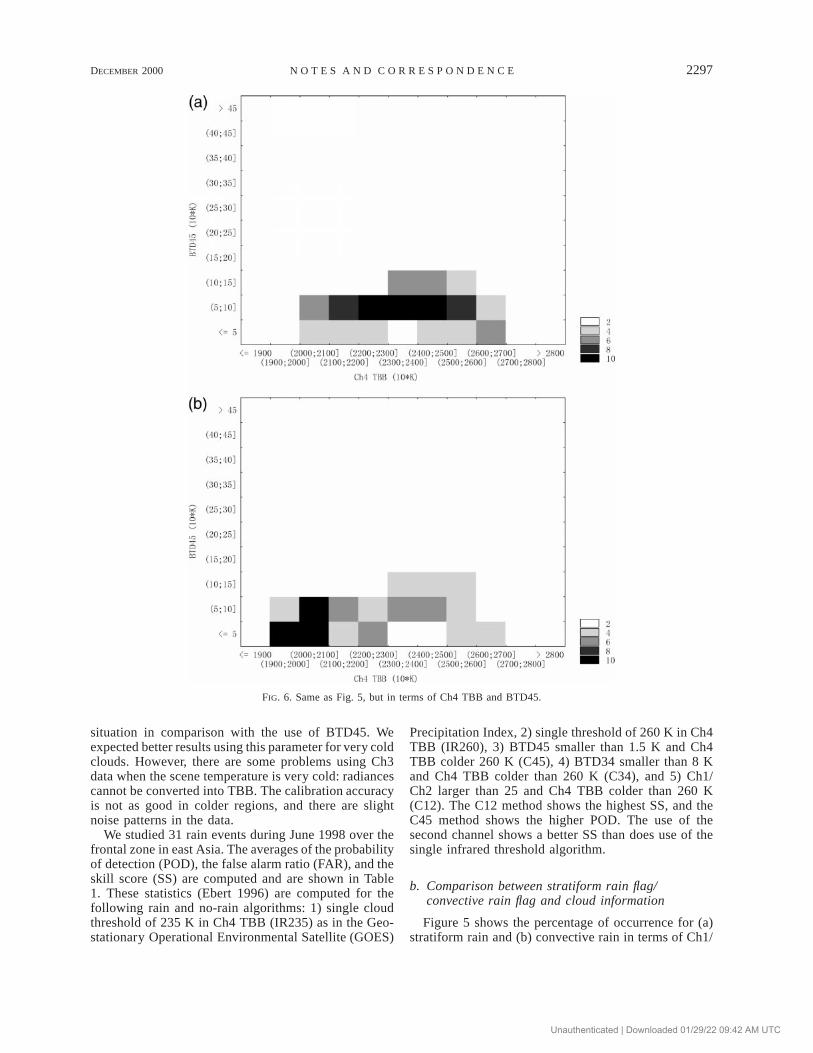
FIG. 6. Same as Fig. 5, but in terms of Ch4 TBB and BTD45.
situation in comparison with the use of BTD45. Weexpected better results using this parameter for very coldclouds. However, there are some problems using Ch3data when the scene temperature is very cold: radiancescannot be converted into TBB. The calibration accuracyis not as good in colder regions, and there are slightnoise patterns in the data.
We studied 31 rain events during June 1998 over thefrontal zone in east Asia. The averages of the probabilityof detection (POD), the false alarm ratio (FAR), and theskill score (SS) are computed and are shown in Table1. These statistics (Ebert 1996) are computed for thefollowing rain and no-rain algorithms: 1) single cloudthreshold of 235 K in Ch4 TBB (IR235) as in the Geo-stationary Operational Environmental Satellite (GOES)
Precipitation Index, 2) single threshold of 260 K in Ch4TBB (IR260), 3) BTD45 smaller than 1.5 K and Ch4TBB colder 260 K (C45), 4) BTD34 smaller than 8 Kand Ch4 TBB colder than 260 K (C34), and 5) Ch1/Ch2 larger than 25 and Ch4 TBB colder than 260 K(C12). The C12 method shows the highest SS, and theC45 method shows the higher POD. The use of thesecond channel shows a better SS than does use of thesingle infrared threshold algorithm.
b. Comparison between stratiform rain flag/convective rain flag and cloud information
Figure 5 shows the percentage of occurrence for (a)stratiform rain and (b) convective rain in terms of Ch1/
Unauthenticated | Downloaded 01/29/22 09:42 AM UTC
2298 VOLUME 39J O U R N A L O F A P P L I E D M E T E O R O L O G Y
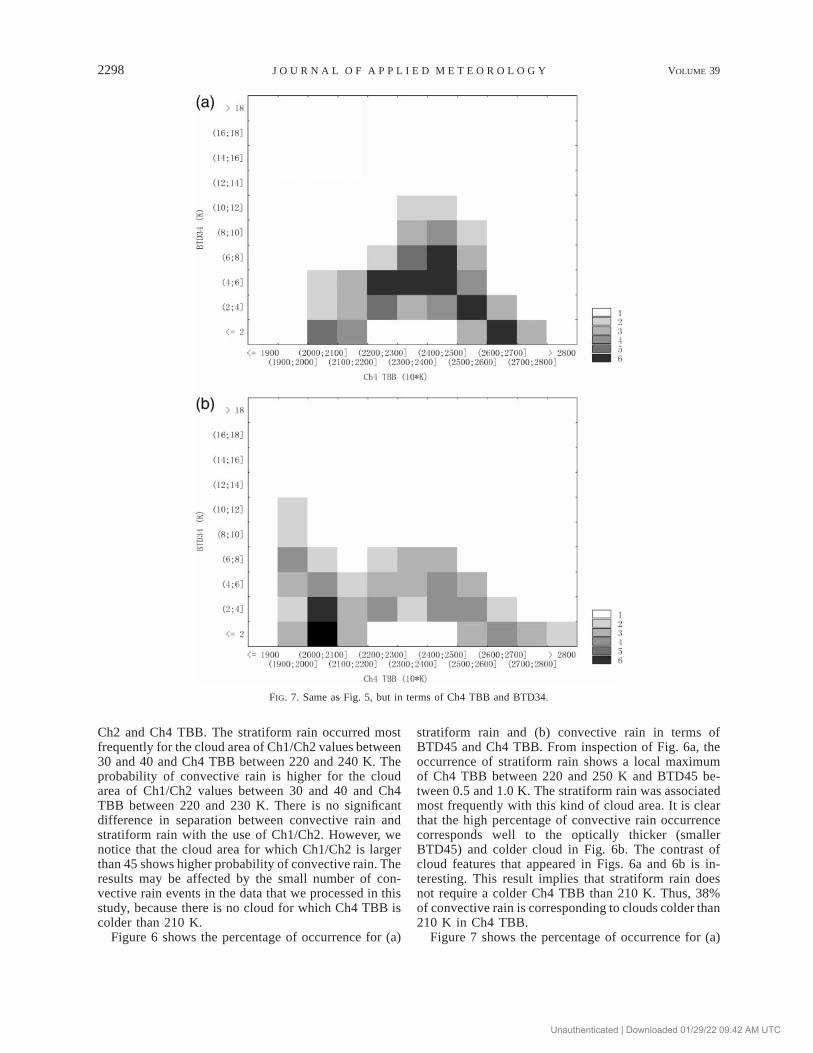
FIG. 7. Same as Fig. 5, but in terms of Ch4 TBB and BTD34.
Ch2 and Ch4 TBB. The stratiform rain occurred mostfrequently for the cloud area of Ch1/Ch2 values between30 and 40 and Ch4 TBB between 220 and 240 K. Theprobability of convective rain is higher for the cloudarea of Ch1/Ch2 values between 30 and 40 and Ch4TBB between 220 and 230 K. There is no significantdifference in separation between convective rain andstratiform rain with the use of Ch1/Ch2. However, wenotice that the cloud area for which Ch1/Ch2 is largerthan 45 shows higher probability of convective rain. Theresults may be affected by the small number of con-vective rain events in the data that we processed in thisstudy, because there is no cloud for which Ch4 TBB iscolder than 210 K.
Figure 6 shows the percentage of occurrence for (a)
stratiform rain and (b) convective rain in terms ofBTD45 and Ch4 TBB. From inspection of Fig. 6a, theoccurrence of stratiform rain shows a local maximumof Ch4 TBB between 220 and 250 K and BTD45 be-tween 0.5 and 1.0 K. The stratiform rain was associatedmost frequently with this kind of cloud area. It is clearthat the high percentage of convective rain occurrencecorresponds well to the optically thicker (smallerBTD45) and colder cloud in Fig. 6b. The contrast ofcloud features that appeared in Figs. 6a and 6b is in-teresting. This result implies that stratiform rain doesnot require a colder Ch4 TBB than 210 K. Thus, 38%of convective rain is corresponding to clouds colder than210 K in Ch4 TBB.
Figure 7 shows the percentage of occurrence for (a)
Unauthenticated | Downloaded 01/29/22 09:42 AM UTC

DECEMBER 2000 2299N O T E S A N D C O R R E S P O N D E N C E
FIG. 8. (a) Ch4 TBB map, (b) and (c) satellite-derived rain-expected cloud map, and (d) rain certain index map by PR for orbit number3116 on 13 Jun 1998.
TABLE 2. POD, FAR, and SS computed for four algorithms:IR235, IR260, C45, and C34 on 13 Jun 1998.
Method POD FAR SS
IR235IR260C45C34
0.810.900.800.66
0.400.680.310.16
0.400.210.480.50
stratiform rain and (b) convective rain in terms ofBTD34 and Ch4 TBB. Similar cloud features are seenin Fig. 7 as in Fig. 6. Stratiform rain occurs more fre-quently for the clouds for which Ch4 TBB is between220 and 250 K with BTD34 between 4 and 10 K, andconvective rain occurs more frequently for the coldercloud area.
4. Case studies
From comparisons between PR ‘‘rain truth’’ data andVIRS cloud characterization data, we can assign rainthresholds for clouds. The use of BTD45 indicates thebest score for POD, although FAR is worse than withthe use of Ch1/Ch2 and BTD34. Therefore, we can useBTD45 as a first rain area delineation, then we can addthe BTD34 information for night cases and the Ch1/Ch2 information for daytime cases. In this section, the
spatial distribution of the rain-expected clouds derivedfrom VIRS and PR rain observations are compared forthe deep convective rain case (case 1) and the better-delineating case (case 2). Both case 1 and case 2 arenighttime observations. The rain area information byPR is compared with the rain-expected cloud area de-rived from the four satellite algorithms: 1) IR235, 2)IR260, 3) C45, and 4) C34.
a. Case 1
Figure 8 shows (a) the Ch4 TBB map, (b) and (c) therain-expected cloud map from VIRS, and (d) the raincertain index map from PR for orbit number 3116 on13 June 1998. In this figure, the VIRS data are trimmedjust over the PR coverage. The rain-expected cloudsderived from IR235, IR260, C45, and C34 are shownin red in Fig. 8c, in green in Fig. 8b, in blue in Fig. 8b,and in purple in Fig. 8c, respectively. The cloud areaby IR260 covers all the C45 cloud area, where the greenis overdrawn by blue. The cloud area by IR235 coversall the C34 cloud area, where the red is overdrawn bypurple. The rain certain index that indicates decimalsbetween 0 and 1 from interpolation is shown in Fig. 8d.
The rain-expected cloud area by C34 is smaller thanthat by C45 for the convective cloud area. This resultsuggests that BTD34 works better than BTD45 in de-
Unauthenticated | Downloaded 01/29/22 09:42 AM UTC

2300 VOLUME 39J O U R N A L O F A P P L I E D M E T E O R O L O G Y
FIG. 9. (a) Ch4 TBB map, (b) and (c) satellite-derived rain-expected cloud map, and (d) integrated total rain-rate map by PR for orbitnumber 3085 on 11 Jun 1998.
TABLE 3. POD, FAR, and SS computed for four algorithms:IR235, IR260, C45, and C34 on 11 Jun 1998.
Method POD FAR SS
IR235IR260C45C34
0.230.690.660.60
0.050.410.190.13
0.190.270.470.48
tecting thicker parts of cirrus clouds, although the areais still larger than the actual rain area by PR. The bright-ness temperature difference captures the low-level thickclouds over the northwest part of the observation area,but these clouds do not correspond well to the rain areashown by PR. The small-scale isolated clouds with Ch4TBB of about 250 K (shown by arrows), which corre-spond to rain by PR, are captured by both C45 and C34.
The POD, FAR, and SS for this deep convective caseare shown in Table 2. IR260 shows highest for PODbut lowest for SS and FAR. IR260 assigns too manylow-level no-rain clouds as rain-expected clouds. C45and C34 can delineate some of the small-scale shallowrain. C34 shows lowest for POD but highest for SS,because FAR is lowest due to the smaller rain-expectedcloud area for shallow clouds. Furthermore, C34 is mosteffective in delineating rain area for the main convectivepart in this figure, although still showing overestimation.
b. Case 2
Figure 9 shows (a) the Ch4 TBB map, (b) and (c) therain-expected cloud map from VIRS, and (d) the inte-grated total rain-rate map from PR for orbit number3085 on 11 June 1998 over China. The rain-expectedcloud derived from IR235, IR260, C45, and C34 areshown in red in Fig. 9c, in green in Fig. 9b, in blue inFig. 9b, and in purple in Fig. 9c, respectively. The cloudarea by IR260 covers all C45 cloud area, where thegreen is overdrawn by the blue. The cloud area by C34covers almost all the IR235 cloud area, where the purpleis overdrawn by the red.
From the inspection of Fig. 9d, the noisy rain areacan be seen for the rain rate smaller than 8 mm h21.Therefore, we processed the the PR data as rain areawhen the integrated total rain rate is greater than 8 mmh21 and the RC flag is greater than 0.8.
This case corresponds to the shallow rain case. Wecan see good correspondence between the rain-expectedcloud area distribution by C45/C34 and the PR rain area.POD, FAR, and SS for this case are shown in Table 3.C34 shows the highest score of SS, although the dif-ference is small in comparison with C45. In this case,IR235 shows the worst for SS, because deep convectiveclouds are not significant in this analyzed area. IR260indicates the highest score for POD but the lowest for
Unauthenticated | Downloaded 01/29/22 09:42 AM UTC
DECEMBER 2000 2301N O T E S A N D C O R R E S P O N D E N C E
FAR. The single IR threshold method generally indi-cates a higher score for POD using a warmer thresholdin Ch4 TBB, but a lower score for FAR. BTD45 andBTD34 work in improving the delineation of the rainarea.
5. Summary
We compared cloud information from VIRS with raininformation from PR for rain cases assembled duringJune 1998 over a frontal zone in east Asia. We selectedthe following four parameters: 1) radiance ratio of 0.6and and 1.6 mm, 2) brightness temperature differencebetween Ch4 and Ch5, 3) brightness temperature dif-ference between Ch3 and Ch4, and 4) brightness tem-perature in Ch4 as the cloud information. We use theflags of rain certain, stratiform rain, bright band exis-tence, and convective rain observed by PR, and theintegrated rain rate from the rain bottom to the rain topas the rainfall information. These cloud and rain dataare gridded to 0.058 latitude–longitude by interpolationand are compared with each other.
From the comparison between rain–no-rain infor-mation by PR and the four cloud parameters, we foundthat values of the radiance ratio of Ch1/Ch2 larger than25, BTD45 smaller than 1.5 K, and BTD34, smallerthan 8 K are effective in delineating the rain area. Theprobability of detection, false alarm ratio, and skill scoreare computed and compared for the following rain andno-rain algorithms: 1) single cloud threshold of 235 Kin Ch4 TBB as in the GOES Precipitation Index, 2)single threshold of 260 K in Ch4 TBB, 3) Ch1/Ch2larger than 25 and Ch4 TBB colder than 260 K, 4)BTD45 smaller than 1.5 K and Ch4 TBB colder than260 K, and 5) BTD34 smaller than 8 K and Ch4 TBBcolder than 260 K. The C12 method shows the highestSS and the C45 method shows the highest POD. TheBTD34 scores better for FAR than does the BTD45 andis better than BTD45 in delineating the thicker part ofcirrus clouds. The use of the second channel shows bet-ter scores than does use of the single infrared thresholdalgorithm.
The cloud characteristics for convective rain andstratiform rain are also studied using the Ch1/Ch2,BTD45, and BTD34. The percentage of occurrence pos-sibility of stratiform rain shows a local maximum forclouds of small BTD45 with Ch4 TBB of 220–250 K.The higher percentage of convective rain correspondswell to the optically thicker (smaller BTD45) cloudscolder than 210 K. The contrast of cloud features thatappeared in the Ch4 TBB and BTD45 is clear betweenconvective rain and stratiform rain. Ch1/Ch2 is expectedas a good classifier between convective and stratiformrain, because convective rain generally corresponds toa deeper cloud that has more ice and a higher value ofCh1/Ch2. However, there is no significant difference inCh1/Ch2 for convective and stratiform rain. One reason
is that the data that we processed did not include deepconvection, because Ch4 TBB is warmer than 210 K.
Case studies show the effectiveness in delineating thethicker part of cirrus clouds by the use of BTD34, al-though the rain-expected cloud area is larger than therain area by PR. The BTD45 and BTD34 are also goodin delineating shallow optically thick clouds, which gen-erally correspond to rain information by PR.
We found that sometimes the split window datashowed spurious values. BTD45 sometimes indicatesabout 2 K for 200 K clouds that can be assumed asblackbody. These spurious data tend to be found fordaytime observations. These unrealistic calibration ar-tifacts that could not be found in AVHRR data shouldbe investigated in a separate study. When the cloud isvery cold, the Ch3 radiance data become near zero andcannot be converted into TBB. Thus BTD34 at the coldend should be used carefully.
Acknowledgments. This study was supported by theNASDA TRMM program. The VIRS and PR data wereprovided by the NASA Goddard Space Flight Centerand the Earth Observation Research Center/NASDA.
REFERENCES
Ebert, E., 1996: Results of the 3rd Algorithm Intercomparison Project(AIP-3) of the Global Precipitation Climatology Project (GPCP).BMRC Research Rep. 55, Bureau of Meteorology, Australia,199 pp., and M. Manton, 1998: Performance of satellite rainfall esti-mation algorithms during TOGA COARE. J. Atmos. Sci., 55,1537–1557.
Hale, G. M., and M. R. Querry, 1973: Optical constants of water inthe 200-nm to 200-mm wavelength region. Appl. Opt., 12, 555–563.
Hall, D., G. Riggs, and V. Salomonson, 1995: Development of meth-ods for mapping global snow cover using moderate resolutionimaging spectroradiometer data. Remote. Sens. Environ., 54,127–140.
Inoue, T., 1985: On the temperature and effective emissivity deter-mination of semi-transparent cirrus clouds by bi-spectral mea-surements in the 10-mm window region. J. Meteor. Soc. Japan,63, 88–99., 1987a: A cloud type classification with NOAA-7 split-windowmeasurements. J. Geophys. Res., 92, 3991–4000., 1987b: An instantaneous delineation of convective rainfall ar-eas using split window data of NOAA-7 AVHRR. J. Meteor. Soc.Japan, 65, 469–481., 1997: Day-to-night cloudiness change of cloud types inferredfrom split window measurements aboard NOAA polar-orbitingsatellites. J. Meteor. Soc. Japan, 75, 59–66., 2000: Early results on comparison between cloud informationby VIRS and rain information by PR/TMI. Adv. Space Res., 25,977–980., H. Oguma, and M. Kachi, 1998: Visible–Infrared Scanner onTRMM and its application (in Japanese). J. Remote Sens. Soc.Japan, 18, 470–480.
Mano, Y., 1999: Infrared radiative properties of cirrus clouds usingthe accurate scattering computation with hexagonal column (inJapanese). Preprints, 1999 Fall Meeting of the MeteorologicalSociety of Japan, Fukuoka, Japan, Meteorological Society ofJapan, 271.
Warren, S. G., 1984: Optical constants of ice from the ultraviolet tothe microwave. Appl. Opt., 23, 1206–1225.
Unauthenticated | Downloaded 01/29/22 09:42 AM UTC


![[Infographic] 2015 Cloud Comparison](https://img.pdfslide.net/doc/110x75/587820891a28aba12d8b6633/infographic-2015-cloud-comparison.jpg)