Embed Size (px)
Citation preview

Nothing Matters More than a Quality Teacher
•Sander’s cross-sectional work found that effective teachers boosted the math scores of low-achieving students 39 percentile points more than students assigned to the ineffective teachers.
Nothing Matters More than a Quality Teacher
•Sanders longitudinal work demonstrated that students who performed equally well in math in second grade showed enormous performance differences three years later, depending on the quality of the teachers.

Nothing Matters More than a Quality Teacher
•Rivers longitudinal work found that average achieving students assigned to 4 years of ineffective teachers had only a 40 percent chance of passing the Tennessee high school exit examination. The same students assigned to 4 years of effective teachers had an 80 percent chance of passing.

Salaries not competitive
Everyone gets same pay
Costs of training not warranted by salary
Women have more career opportunities now
Little collegiality
Little respect from community
Often unpleasant, dangerous environment


New Ways to Attract TeachersNew Ways to Attract Teachers
Increase Salaries
School Debt Forgiveness
Housing Subsidies
Perks
PR Campaign
New Recruitment Strategies
Accelerated Teacher Education
More Rigorous Training

small
isolated efforts
not school-centered
poorly designed
poorly implemented
rather than systemic reforms
solve one problem only to create another
Programs to Attract & Retain High Quality Teachers


TAP – Both Old and New
Multiple Career Paths Career Ladders
Performance Pay Odden,Denver,Cincinnati
Assessment Sanders, Danielson, NBPTS
Ongoing, Applied ???Professional Development
Expanding the Pool N.J. Alt. Cert, Troops to Teaches, Teach for
America
TAP is unique because it ties both teacher performance assessment & student value added to teacher compensation & supports that with a unique professional development tool.

Single Career PathTeacher Position Only
Requiring the same level of:• professional qualifications• responsibility• authority• assessment rigor
Multiple Career PathsSenior, Mentor & Lead Positions
Requiring increasing levels of:• professional qualifications• responsibilities• authority• assessment rigor
Models for the Teaching Profession:
Career Advancement
Traditional Model TAP Model

Salary Schedule Drives Compensation
Lock-step salary determined only by years of
experience and training units accrued.
Performance and Responsibility Drive
Compensation
Salary determined by level of responsibilities and effectiveness of performance.
Models for the Teaching Profession:
Compensation
Traditional Model TAP Model


Uneven Accountability
• Idiosyncratic evaluation standards & procedures
• Rewards and sanction unrelated to evaluation outcomes
• Support provided for deficiencies only
Performance-based Accountability
• TAP standards, procedures and performance rubrics
• Hiring, advancement and compensation tied to evaluation
• Support provided for growth
Models for the Teaching Profession:
Professional Accountability
Traditional Model TAP Model

Inservice/Course-based Professional Development
• Individual commitment, intermittent activities
• Goals and activities tied to personal and financial interests of the individual
• Unconnected to evaluation
Ongoing Applied Professional Growth
• Schoolwide commitment, weekly, site-based, teacher lead activities
• Goals and activities tied to standards, local SIP & analysis of student learning outcomes
• Used to support and reinforce evaluation growth goals
Models for the Teaching Profession:
Professional Growth
Traditional Model TAP Model

Improving Teacher Quality Through Performance-based Accountability
Evaluating teacher performance means: • observing what teachers do in their classrooms,
• rating how well they do it, and• assessing each teacher’s and the school’s impact on student achievement.

Teaching Performance Standards
Five Performance Levels
Evaluation includes school and classroom achievement
Multiple EvaluatorsEvaluation support
professional growthPerformance tied to
compensation
TAP Teacher Accountability Versus Past Teacher Accountability Efforts
Checklist of Teaching Behaviors
Two Performance Levels
Evaluation excludes student achievement
One EvaluatorEvaluation supports
deficiencies onlyPerformance
independent of compensation
TAPPast Efforts


TAP Teaching Performance Standards:Skills Knowledge & ResponsibilitiesWhat do the teacher performance
standards look like?
•5 levels of performance ranging from exemplary to proficient to unsatisfactory
• Descriptive narratives of expected performance
Teacher Performance Standards Examples:
• Communicating Directions & Instructional Content
• Questioning
• Thinking

TAP Teaching Performance Standards
Who rates teacher performance?Four Qualified School-based Evaluators
• Administrator• Master Teacher• Mentor Teacher• Self
• How often is each teacher observed?
• 10 times per year
• Administrator - at least 2 times per year
• Master teacher - at least 6 times per year
• Mentor teacher - at least 2 times per year

TAP Classroom and School Value-Added Achievement
• Base decisions on value-added gains
• Use the TAP value-added statistical model
• Set leveled criteria for school gains, and classroom gains (13%, 8%, 4%, Years Growth, Negative gain)
• Test every year
• Use reliable and valid tests
• Tie student level data to teacher each year

Teacher Compensation
• Abysmally low
• Not differentiated
• Not tied to teaching performance
• Not tied to student achievement
• Based on teachers years experience and units earned which are both poor predictors of student achievement.


TAP Compensation
• Pays teachers based on performance
• Pays teachers differently based on performance.
Three types of performances count:
1.Teaching Performance Standards: Skills, Knowledge & Responsibilities – 50%
2.Classroom Achievement - 20%
3.School Achievement – 30%


Augment not supplant single salary schedule
Reward teachers for achieving school wide goals
Financial incentives for low performing schools
Bonuses for passing National Board


How TAP Compensation System Has Evolved
Performance awards are given as a bonus to be earned each year.
Performance awards supplement rather than replace traditional step and column pay scale.
No one earns less than they would have earned under the traditional compensation system.
Performance awards are not cumulative and must be constrained by available funds, usually augmenting salaries
by $5,000 or less
50% of the bonus is awarded for skills and knowledge 50% is based upon student achievement (value-added)
30% school-wide for all teachers20% based on achievement of individual
teacher’s students

How TAP Compensation System Has Evolved
Since subject specific tests are often unavailable, the student achievement element of the bonus for high school teachers is complicated.
Bonuses are criterion referenced rather than relative, which means that any teacher who meets a standard receives the
bonus.
No one loses money (compared to what they would have earned without TAP) for poor performance.
Teachers who score well on the skills and knowledge part can earn bonuses even if their students’ scores do not
improve.
There must be the opportunity for all teachers to get a bonus of some amount. We cannot say only the top X% will receive
bonuses.
If teacher work more days, they must get paid for them at least at their former daily rate.

Implementating TPBA System
Develop Teacher Evaluation System
1.Establish career, mentor, and master teaching performance standards
2.Establish career, mentor, and master teacher responsibilities performance standards
3. Review the TAP T-PBA policies
4.Establish the criteria for classroom achievement gains attributed to the teacher
5.Establish the criteria for the school achievement gains

Implementation: Compensation
Establish the school or district compensation model
1. Establish TAP Salary Augmentations2. Establish TAP Performance Award Fund3. Establish Performance Award Weights

Implementation: Teacher Evaluation Training
Participate in the teacher performance-based accountability training
1.Train all evaluators using the TAP video training materials
2.Certify all evaluators3.Continue training throughout the
year
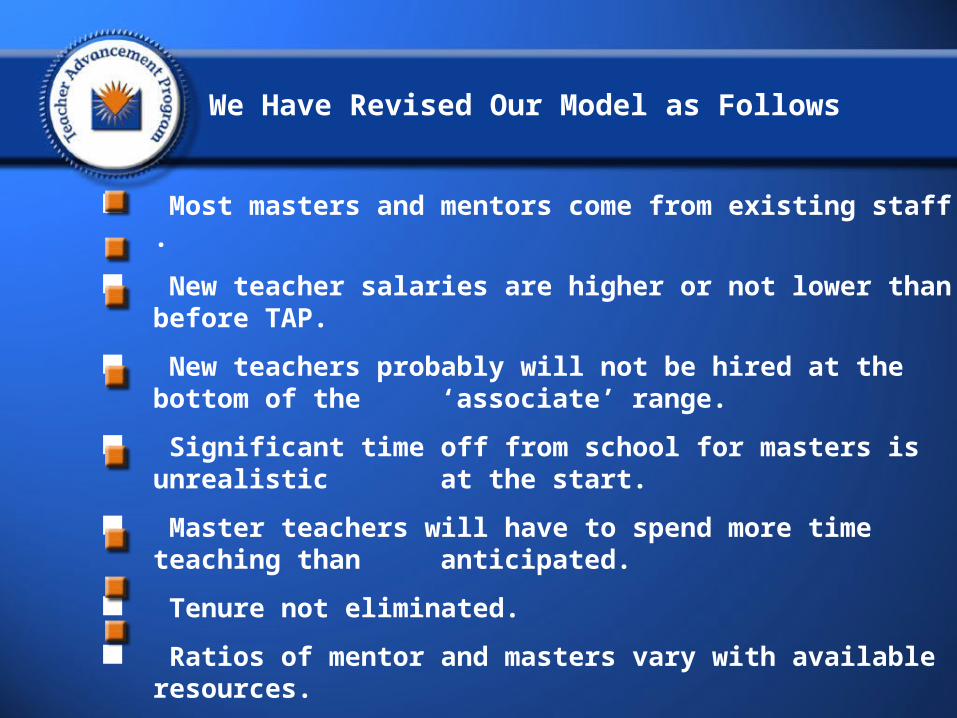
We Have Revised Our Model as Follows
Most masters and mentors come from existing staff .
New teacher salaries are higher or not lower than before TAP.
New teachers probably will not be hired at the bottom of the ‘associate’ range.
Significant time off from school for masters is unrealistic at the start.
Master teachers will have to spend more time teaching than anticipated.
Tenure not eliminated.
Ratios of mentor and masters vary with available resources.
Unanticipated costs: paying for tests not now given, travel expenses for teachers to get training, training materials.

Intermediate Outcomes
Teachers opt for new system vs. existing system
Changes in types of individuals applying
Number of applicants
Differences in characteristics of people hired
Changes in teacher retention rates
Changes in which teachers stay in classroom
Survival rates in the first five years
Changing nature of collective bargaining
Stakeholder perceptions of staff quality & professionalism
Teacher satisfaction data

Process Issues
Number of schools using the model
Distribution of TAP schools by location, SES, ethnicity
Amount of discretionary funds to support TAP
Support from private foundations and corporations
Extent to which schools adhere to the five principles

The Cost of TAP
Incremental costs = 6% of budget OR $400/student
No current teacher worse off
Salary supplements for Master & Mentor teachers
New teacher positions
New specialists hired
Associate teachers’ summer professional growth
Turnover savings not kept by school
Traditional salary schedule increases in place

We Can Cover Costs By
Changing parameters (master & mentor ratios)
Keeping turnover savings in the schools
Converting regular salary schedule increases into performance pool
Utilizing existing grants (Title I for aides or lead teachers)
New money

Total Number of AZTAP School 7
Number in year one implementation 2
Number in year two implementation 5
School Characteristics Range in TAP School
Student Population 400 to 1,350 students
Ratio of Master to Career Teachers 9/1 to 17/1
Ratio of Mentor to Career Teachers 3/1 to 8/1
Number of Cluster Groups 4 to 10
Time Cluster Groups Meet Weekly 1 hour to 4 hours
Grades Represented K-2 -K-4 -K-6 -K-12 - 3-8
Overview of AZTAP School Characteristics

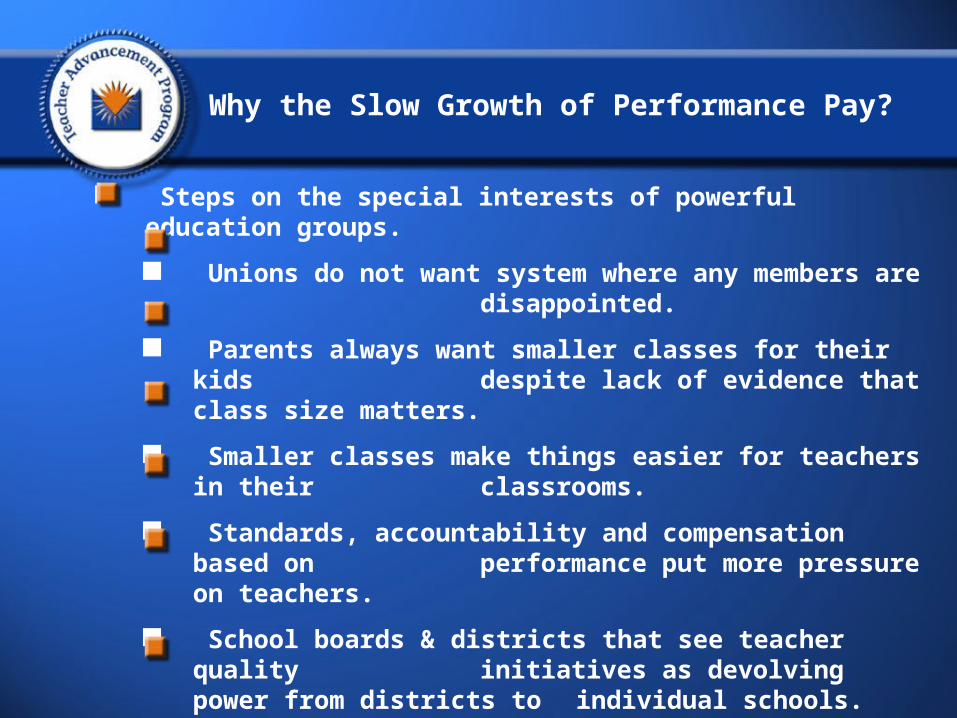
Why the Slow Growth of Performance Pay?
Steps on the special interests of powerful education groups.
Unions do not want system where any members are disappointed.
Parents always want smaller classes for their kids despite lack of evidence that class size matters.
Smaller classes make things easier for teachers in their classrooms.
Standards, accountability and compensation based on performance put more pressure on
teachers.
School boards & districts that see teacher quality initiatives as devolving power from districts to individual schools.
Education schools see their market for credentials and professional development courses
getting smaller

Why the Slow Growth of Performance Pay?
Strong vested interests oppose having teachers held accountable & evaluated by student performance.
They disparage research that concludes that teachers are responsible for student achievement and should be rewarded accordingly
Some people do not find the research compelling because it depends upon test scores as the measure of
student performance.
They claim test scores may be a fatally flawed measure of student learning
Teachers think using test scores for evaluation is unfair because they depend upon who is in their class – THEY DO NOT UNDERSTAND OR ACKNOWLEDGE VALUE ADDED (GAINS RATHER THAN LEVELS)

Why the Slow Growth of Performance Pay?
Schools have other responsibilities than student achievement.
In earlier generations, kids who could learn were in school and those who couldn’t learn left to pursue
unskilled work.
Then it was decided that in the name of equity and social justice (and to keep delinquent kids off the
street), all kids should stay in school, regardless of what they could learn.
Schools were distracted from main goal of helping kids learn.
To show effectiveness, teachers needed more achievable/ abstract/different goals than student
learning to justify efforts.
Focus moved away from what kids learn to how they feel.
K-12 education has focused on affective domain that what kids learn has gotten short shrift
Extremely radical to now change entire focus of education

Why the Slow Growth of Performance Pay?
Effective teachers are defined as raising student test scores, but there is little evidence on the characteristics of such teachers.
We still do not know what these effective teachers do that is different or how to get others to do those
things.
Little agreement about what expert pedagogy means, and little empirical confirmation of effective
practice.
Traditionally, teachers have been expected to demonstrate their effectiveness-however defined-only
while in school one time through National Board certification, not annually.

Systemic policy change requires leadership &support at the school, district and state levels. Those in positions of leadership may resist because:
School principals have rarely been instructional leaders
Most principals are more often building and personnel managers
Such efforts are controversial
They have other priorities
They require a huge commitment
It is hard work
Why the Slow Growth of Performance Pay?
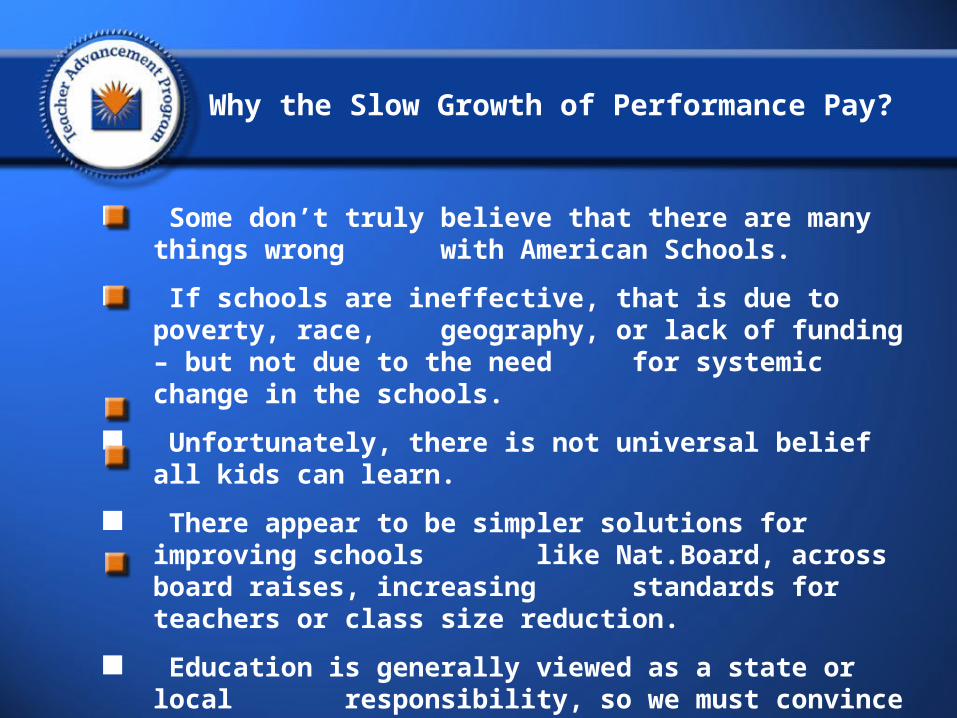
Why the Slow Growth of Performance Pay?
Some don’t truly believe that there are many things wrong with American Schools.
If schools are ineffective, that is due to poverty, race, geography, or lack of funding – but not due to the need for systemic change in the schools.
Unfortunately, there is not universal belief all kids can learn.
There appear to be simpler solutions for improving schools like Nat.Board, across board raises,
increasing standards for teachers or class size reduction.
Education is generally viewed as a state or local responsibility, so we must convince 17,000 separate organizations of its merit.

Why the Slow Growth of TAP?
Other priorities
Unwilling to fight teachers unions
Belief that pluses of Perf. Pay outweighed by the negatives
Reluctance of school boards to support site based programs
Reform is not likely to be pivotal in reelection/reappointment
No evidence yet that TAP improves student test scores
Sticker shock – high cost compared to other reforms
Lack of new funds – state budget problems
Belief that political/educational payoff would be better if discretionary funds were spent elsewhere
Unwillingness to spend disproportionate share of discretionary funds on small # of TAP schools

What It Takes to Successfully Implement Whole-School Reform
Commitment to all components of reform model.
Buy-in by entire staff
Minimum of 80% buy-in.
Consensus of teacher support
Implementation must be by choice rather than mandated
Low teacher turnover
Commitment by staff to work beyond traditional levels to shift school paradigm.

What It Takes to Successfully Implement Whole-School Reform
Political support by:
School board
District leadership
Teachers associations/unions
Community
State education agency
State legislature

What It Takes to Successfully Implement Whole-School Reform
Teacher perceptions
Need for reform
Readiness of students to learn
Support for all reform elements
Limited classroom management issues
What It Takes to Successfully Implement Whole-School Reform
Consistent and stable leadership at school and district levels
Implement in well-managed schools
Strong principal with authority to make changes at the school level
Strong superintendent with commitment to program
Leadership communicates well with staff
Personal commitment to program

What It Takes to Successfully Implement Whole-School Reform
Support of program developers and/or design team
Clear communication of program
Flexibility to adapt to local context
Ongoing training
Research support
Technical support
Ongoing teacher training
Orient new teachers
Provide ongoing support to continuing teachers

What It Takes to Successfully Implement Whole-School Reform
Ongoing financial support
Appropriate reallocation of resources
Acquisition of new, ongoing funding

What It Takes to Successfully Implement Whole-School Reform
Compatibility of assessments to curriculum standards and teaching strategies
Confidence that achievement gains will be captured by assessments used.
Appropriate use of student-level, teacher-level and aggregated school-level data
Consistency of implementation within and acrossschools
Absence of conflicting or distracting reforms being implemented at school
Absence of pressure from outside groups to implement alternative or additional reforms

What It Takes to Successfully Implement Whole-School Reform
Implement on a small-scale before trying to implement on a large-scale
implement in 2 or 3 schools in a district, adding more schools gradually
Continued increase in schools implementing reform
Smaller schools easier to implement than secondary schools
Elementary schools easier to implement than secondary schools
Allow time for implementation: 3-5 years minimum

What It Takes to Successfully Implement Whole-School Reform
Long –term commitment by school and district leadership: 5-20 years
Research to study impact of program on student learning must be long-term
Results cannot be expected until 2-3 years after full implementation
Longitudinal data is necessary
Track students and staff over time