Embed Size (px)
Citation preview

Nothing speaks like performance2002 Annual Report
101 Bullitt LaneSuite 450Louisville, Kentucky 40222Phone: (502) 329-2000Fax: (502) 329-2050www.sypris.com
®

00 01 02
Net Revenue (in millions)
00 01 02
Net Income (in millions)
$3.2
$6.4
$11.4
$217
$255$273
ContentsLetter to Stockholders 3 Corporate Officers 6Our Customers Speak Out 7 Sypris at a Glance 20 Board of Directors 22
Financial Summary 24 Financial Review 25 Common Stock Information 52 Corporate Directory 53 Company Locations 54 Investor Information 55
Sypris Solutions is a diversified provider of outsourced services and specialty products. Weperform a wide range of manufacturing, engineering,design, testing and other technical services, typicallyunder multi-year, sole-source contracts with major corporations and government agencies.
We are focused on three core markets: aerospace anddefense electronics, truck components and assemblies,and test and measurement services.
Our mission is to become the leading supply chain partner in each of our core markets.
00 01 02
Operating Income (in millions)
00 01 02
Diluted Earnings Per Share
$0.32
$0.63
$0.84
$5.5
$13.0
$19.0
00 01 02
00 01 02
Operating Margin
Net Book Value Per Share
$6.44$6.99
$10.03
2.5%
5.1%
6.9%
Our performance speaks for itself Performance 2002
Revenue Continued to Grow: Up 7.4%Driven by an 84% increase for the Industrial Group, revenue increased for the third consecutive year.
Operating Income Reached a New Record: Up 45%Improved margin performance resulted in record operating income of $19.0 million.
Net Income Growth Was Impressive: Up 80%Net income increased to $11.4 million from $6.4 million in 2001.
Earnings per Share Continued to Climb: Up 33%Earnings per share increased to $0.84 per share including the effect of a 36% increase in the number of shares outstanding.
EBITDA Rose to a New Record: Up 31%EBITDA exceeded $30 million, while cash flow from operations increased 61%.
Net Book Value Soared: Up 95%Net book value increased to $137 million, or $10.03 per share, as a result of a successful stock offering and strong earnings.
Revenue per Employee Hit a New Record: Up 15%This important measure of productivity increased for the third consecutive year to $177,000 per employee.
Net Debt Declined Significantly: Down 67%The proceeds from the stock offering and strong cash flow enabled the Company to reduce debt to just 15% of total capital.
Total Assets Reached a New Record: $224 millionCapital investment of almost $20 million in new technology and equipment pushed total assets to a record high.
Orders Remained Strong: $266 millionFirm orders with specified shipment dates increased almost 10% for the year.

2 SYPR SYPR 3
LETTER TO STOCKHOLDERS
In our letter last year, we discussed the importance ofmarket leadership and the vital role played by highlyqualified, motivated employees in the future developmentof Sypris. We believe these two leadership elements areessential to any business that expects to generateconsistently outstanding results.
We are pleased to build upon last year’s strongfoundation with a report of our progress during 2002. The financial results were very positive andclearly reflected a continued improvement in theCompany’s performance.
The numbers only tell part of the story, however, so wethought you might like to hear directly from several of ourmajor customers, six of whom have been featured insidethis annual report. Nothing speaks like performance,especially when expressed by others.
FINANCIAL RESULTS
The year 2002 was a record-setting year for SyprisSolutions. The Company reported significant gains interms of virtually all important financial measures andbegan to realize the benefits derived from a number ofkey operating initiatives.
Revenue for 2002 increased for the third consecutiveyear, rising 7% to $273 million from $255 million in2001. The increase was driven by an 84% increase inrevenue from our Industrial Group, which benefited froma new manufacturing services contract with Visteon, aswell as a full year of production under a long-termcontract signed with Dana during 2001.
Operating income increased 45% to a record $19million, while net income rose 80% to exceed $11 millionfor the year. Margins continued to expand, driven largelyby a 90% increase in gross profit for our IndustrialGroup. Revenue per employee increased 15% to arecord $177,000, reflecting a continuing and successfuleffort throughout the Company to improve productivity.
Earnings per share increased 33% to $0.84 from $0.63in 2001, including the effect of a 36% increase in thenumber of shares outstanding. Net book value increased95% to $137 million, or $10.03 per share, as a result ofstrong earnings and the successful sale of $56 million ofcommon stock to the public in March 2002.
Cash flow from operations increased 61% to a record$14 million. This increase was achieved even after weinvested $6 million in two of our defined benefit pensionplans during the fourth quarter, ensuring that they were100% funded and the future of our employees’ retirementwas on solid ground.
The growing financial strength and positive earningstrend of Sypris led the Board of Directors to declare theCompany’s first quarterly dividend of $0.03 per shareduring 2002. We are optimistic that the futureperformance of the Company will enable the Board tocontinue providing stockholders with a current rate ofreturn on their investment.
Our strong report card for 2002 could have been better,however, as cost overruns on new programs and revenueshortfalls on others prevented us from reaching our targetedexpectations. We will continue to address these and otherissues with the appropriate sense of urgency so as tofurther enhance the Company’s financial performance.
ROBERT E. GILL, Chairman of the Board and JEFFREY T. GILL, President & CEO
DEAR FELLOW STOCKHOLDERS:

4 SYPR SYPR 5
INVESTMENTS
We continued to invest in the future of the Company, with capital expenditures approximating $20 millionduring 2002, or over 7% of revenue.
During the past five years, we have invested over $100million in new technology and automation to support the needs of our customers. We believe that theseinvestments are essential to our ability to provide ourcustomers with manufacturing and technical services thatare cost-competitive on a global scale.
Of particular note, we also invested in the implementationof a Six Sigma program in our Electronics Group duringthe year. The results in terms of improved quality, customerservice and reduced costs were outstanding. We are nowcommitted to expanding the Six Sigma programthroughout Sypris and plan to train all of our employees in these powerful techniques within the next few years.
CONTRACT AWARDS
During 2002, we secured new multi-year supplyagreements with the National Security Agency, Visteon,BAE Systems, Honeywell and the Federal AviationAdministration, bringing the total estimated value of new contract awards to $302 million for the year.
The Visteon contract is particularly noteworthy. Under the supply agreement, which began in early 2002,Sypris is providing axle shafts for Ford’s F-150, F-250, F-350 and Ranger-series pickup trucks; the FordExpedition; the Lincoln Navigator and the Ford MustangGT. The agreement runs through 2006 and has a projectedvalue of $150 million over the term of the contract.
Long-term, sole-source contracts serve as the foundation ofour strategic partnerships with a growing number of large
corporations and government agencies, with new contractawards reaching an estimated $676 million over the past24 months. We expect these supply agreements to makea meaningful contribution to the growth and stability ofSypris for years to come.
THE FUTURE
As we look ahead:
Aerospace & Defense Electronics
The market for aerospace and defense electronics isexpected to benefit from the Government’s renewed andsustained focus on our Country’s national defense.
We have long-term contracts with many of the leadingaerospace and defense contractors, including BAESystems, Boeing, Honeywell, Lockheed Martin, NorthropGrumman and Raytheon. We also have a long-termrelationship with the National Security Agency to designand build secure communications equipment and developencryption software.
These strategic partnerships enable us to invest theresources necessary to deliver the high-level of technicalservices demanded by these important customers, afactor that we believe sets us apart from our competition.Consequently, we believe that Sypris, with over 35 yearsof experience in aerospace and defense electronics, isuniquely positioned to play an increasingly larger role forour customers as they prepare to meet the expectedincrease in demand for their own products and services.
Truck Components & Assemblies
According to recent industry publications, the productionof medium and heavy-duty trucks is forecast toapproximate 2002 levels in 2003, then increase by
LETTER TO STOCKHOLDERS LETTER TO STOCKHOLDERS
an estimated 15% per year through 2006 as fleet owners replace aging vehicles.
Sypris is the principal supplier of manufacturing servicesfor the production of medium and heavy-duty truck axleshafts in North America. We will continue investing toexpand our relationships with and provide additionalvalue for our strategic customers in this market. As industryforecasts indicate, our opportunities are significant.
Test & Measurement Services
The market for test and measurement services has beenhit hard by the difficult economy and remains highlyfragmented, with a wide variety of often thinly-capitalizedbusinesses vying to service the local needs of largenational corporations.
Due to the need to control costs and ensure quality andreliability, these corporations are increasingly looking forstrong national providers to handle all of their servicerequirements. We will use our financial strength duringthe coming years to accelerate the growth of our nationalcapability to meet the needs of these large anddemanding customers.
Our Vision
Our vision is focused and clear. Sypris is an outsourcingspecialist that is dedicated to using its resources to servicelong-term, strategic partnerships with industry-leadingcorporations and government agencies.
We will continue to invest in markets where we cansustain a competitive advantage. We believe that ourongoing initiatives to increase market share, whilemaintaining a balanced business mix, will serve Syprisand its stockholders well for many years to come.
OUR CUSTOMERS SPEAK OUT
Exceeding customer expectations is critical to the successof any company in today’s harsh economic businessclimate. The statements of six of our key customers in thisannual report reflect the devoted efforts of our employeesto do whatever is necessary to contribute to the success ofour customers. We hope you find their perspectives to beof value and interest.
THANK YOU
We want to thank our employees, many of whom arefellow stockholders, for their hard work over this pastyear. The many achievements of 2002 would not havebeen possible without their commitment, energy and hard work.
We also want to thank our customers for the opportunityto serve them. We are dedicated to providing each ofthese business partners with the right solutions to improvetheir competitiveness.
We sincerely appreciate your investment in SyprisSolutions and encourage you to contact us. Wewelcome your comments and would be pleased toanswer your questions.
Jeffrey T. Gill Robert E. GillPresident & CEO Chairman of the Board

6 SYPR SYPR 7
Corporate Officers from left:RICHARD L. DAVIS, G. DARRELL ROBERTSON, JOHN M. KRAMER, DAVID D. JOHNSON, JAMES G. COCKE, ANTHONY C. ALLEN
CORPORATE OFFICERS
Performance 2002
The numbers speak for themselves.We thought you might like to hear from
a few of our key customers.

8 SYPR SYPR 9
Honeywell partnered with Sypris to build thecolor display avionics for the AH-64D Apache
Longbow attack helicopter, the world’s mostadvanced multi-role combat helicopter.
Why?
“Flight controls and displays represent a core competency for Honeywell.We needed a partnerthat we and our customer could absolutely rely
upon. Flight Safety and Quality simply could not be compromised.”
Robert B. SandersSite Executive & Director of Display ProgramsHoneywell Defense & Space Electronic Systems
HONEYWELL
Honeywell is a leading provider of integrated avionics, engines, systems and servicesolutions for aircraft manufacturers, airlines, business and general aviation, military,space and airport operations.
Robert B. Sanders

SYPR 1110 SYPR
BAE Systems selected Sypris to help produce itsJoint Chemical Agent Detector, a revolutionary new
product for the detection of nerve, blister andblood agents.
Why?
“The global market for this hand-held product isexpected to grow significantly. Sypris has the
proven manufacturing capability we needed tomeet this demand.”
Ronda FosterVice President &
General ManagerBattlespace Awareness Systems
BAE SYSTEMS
BAE Systems Integrated Defense Solutions creatively adapts and integrates technologiesto rapidly produce solutions for homeland security. Products include chemical and biological detection systems, mine countermeasures, intelligent combat systems and airborne target presentations.
Ronda Foster

SYPR 1312 SYPR
Raytheon and Sypris have worked closelytogether for years to produce the highly effectiveAMRAAM missile for the Air Force, Navy and
our allies.
Why?
“Sypris has helped us to continuously reduce ourcost even as we enhanced the missile’s design and
capabilities time and again.”
Franklin D. WyattDirector of AMRAAM Missile Program
RAYTHEON
Franklin D. Wyatt
Raytheon Missile Systems is the world leader in the design, development and productionof missile systems for critical requirements, including air-to-air, strike, surface Navy airdefense, land combat missiles, guided projectiles, exoatmospheric kill vehicles anddirected energy weapons.

14 SYPR SYPR 15
Dana relies on Sypris to supply axle shafts, ring gears and pinions for its axle assemblies for North American medium and heavy-duty
truck customers.
Why?
“In today’s volatile heavy truck market, we count onSypris to provide top-quality, on-time parts and to
help us control our production costs.”
Bill HennessyDirector of Global Manufacturing
Heavy Vehicle Technologiesand Systems Group
The Heavy Vehicle Technologies and Systems Group of Dana designs, manufacturesand markets front steer, rear-drive, trailer and auxiliary axles, drive shafts, steeringshafts, brakes, suspensions and related systems, modules and services for the commercial vehicle market.
Bill Hennessy
DANA CORPORATION

SYPR 1716 SYPR
Lockheed Martin selected Sypris data recordersto support the mission-critical requirements of the
Navy Trident II Fleet Ballistic Missile program.
Why?
“Sypris simply has the best technical staff in the industry. They are responsive and always
available to help.”
Mo AshrafManager
Fleet Ballistic Missile Systems EngineeringMissile Data Center
Lockheed Martin Space Systems is a global leader in the design, development, test and production of space launch systems, ground systems, scientific spacecraft,satellites for commercial and government customers, fleet ballistic missiles and missile defense systems.
LOCKHEED MARTIN
Mo Ashraf

SYPR 1918 SYPR
The Federal Aviation Administrationdepends upon Sypris to provide critical calibration
and certification services at over 400 airports in the United States.
Why?
“The loss of control tower radar at any time wouldparalyze an airport. Sypris has the unique ability
to service our requirements at all of our locations.”
Frank KulesaNational Test Equipment Manager
FEDERAL AVIATION ADMINISTRATION
The FAA manages the nation’s airspace and provides the facilities and servicesnecessary for air commerce. The mission of the FAA is to provide a safe, secureand efficient global aerospace system that contributes to national security and thepromotion of U.S. aerospace safety.
Frank Kulesa

20 SYPR SYPR 21
Electronic assemblies and subsystems for use inmilitary cockpit control and display systems, missileguidance systems, commercial avionics, satellitecommunications systems, ruggedized hand-heldcomputers, and secure communications networks and products.
BAE Systems, Boeing, Eaton, Honeywell, L3,Lockheed Martin, National Security Agency,Northrop Grumman, Raytheon and U.S. Army.
Calibration and Repair Calibration, repair and certification ofelectrical, electronic, physical anddimensional test equipment, diagnosticand process control equipment.
Testing Testing of digital, linear, discrete, passiveand hybrid components, environmentaltesting, dynamics testing, failure analysisand transportation testing on products,systems and subassemblies.
Network and communications security, collection ofsonar data from submarines, test data from aircraft,biological data from space flights, performance data from missiles and voice data from intelligencenetworks.
General Dynamics, Government of Israel, JohnsonSpace Center, Lockheed Martin, NASA, NationalSecurity Agency, Northrop Grumman, Raytheon,Titan Corporation, TRW, U.S. Air Force, U.S. Army and U.S. Navy.
Products Encryption devices, digital and analogrecorders, multiplexers, storage systemsand touch screen control software.
Axle shafts, ring gears, pinions, input shafts, helicalgears and other drive train components for use inlight, medium and heavy-duty trucks, SUVs, pickuptrucks and automobiles. Jet engine shafts andconstruction vehicle components.
ArvinMeritor, Caterpillar, Dana, John Deere, Pratt & Whitney, Teledyne Technologies and Visteon.
Manufacturing Services Automated forging, machining, inductionhardening, cold extrusion, heat-treating,testing and fabrication of products,production tooling and prototypes.
Secured transmission of voice and data forintelligence and surveillance applications.
General Services Administration, National SecurityAgency and U.S. Army.
Engineering Services Software design services for data andcommunications security products andcontract design services.
Military, semiconductor manufacturing, aerospace,satellite and launch systems, avionics, medical,telecommunications and transportation.
Abbott Labs, Arrow-Zeus, BAE Systems, Boeing,Eldec, Goodrich, Honeywell, JPL, L-3, LockheedMartin, Medtronics, NASA, Northrop Grumman,Raytheon, Sawtek and Suntron.
Pipeline and chemical systems in the energy and chemical industries.
Chevron, ExxonMobil and Shell Oil.Products High-pressure closures, transition jointsand insulated joints.
Current measurement applications in locomotives,mass transit systems, elevators, automotive diagnosticsystems and laboratory diagnostic systems. Magneticmeasurement for research and development, qualitycontrol and manufacturing.
General Motors, Genie, Lockheed Martin, Miltope,Snap-on, Toyo, Ithaco and SPX.
Products Hall generators, current sensors,autoprobes and gaussmeters.
Market-Focused Businesses Business Summary Applications and Uses Select Customers
Sypris is a diversified provider of outsourced services and specialty products. Outsourced manufacturing and technicalservices accounted for approximately 84% of total revenue in 2002. We are a leading supplier of manufacturingservices for the production of complex circuit cards, high-level assemblies and subsystems to major aerospace anddefense companies and agencies of the U.S. Government. We are the principal supplier of manufacturing services forthe forging and machining of heavy-duty truck axle shafts in North America, and we provide technical services for the calibration, certification and repair of test and measurement equipment in the United States.
SYPRIS AT A GLANCE
Truc
k Co
mpo
nent
s an
d A
ssem
blie
sA
eros
pace
and
Def
ense
El
ectro
nics
Test
and
Mea
sure
men
t Se
rvic
es
Manufacturing Services Integrated design and engineeringservices, component selection, sourcingand procurement, automated assembly,design and implementation of producttesting, systems assembly, and repairand warranty services.
Telecommunications systems, air traffic control systems,electronic component manufacturing, automotive,process control, weather radar systems, aerospaceand defense, medical equipment manufacturing andpower generation and distribution.
Anadigics, AT&T, Bose, Delphi Automotive, FAA,General Dynamics, Honeywell, ITT, LucentTechnologies, Maxtor, National Weather Service,Siemens, Square D, Tyco Electronics and TRWAutomotive.

22 SYPR SYPR 23
William L. Healey has served as President and Chief Executive Officer of Cal QualityElectronics, an electronics manufacturing company, since 2002. Mr. Healey served as a privateinvestor and consultant from 1999 to 2002, as Chairman of the Board of Smartflex Systems, anelectronics manufacturing company, from 1996 to 1999 and as its President and Chief ExecutiveOfficer from 1989 to 1999. Prior to 1989, Mr. Healey served in a number of senior executivepositions with Silicon Systems, including Senior Vice President of Operations. A director of Syprissince 1997, Mr. Healey also serves as a director of Microsemi Corporation. He is Chairman ofthe Nominating and Governance Committee.
Roger W. Johnson is currently a private investor, educator and business consultant. Mr. Johnsonserved as Chairman of the Board and Chief Executive Officer of Collectors Universe, a provider ofservices to dealers and collectors of high-end collectibles, from 2001 to 2002. Mr. Johnson served asChief Executive Officer of YPO International (Young Presidents Organization) from 1998 to 2000 and asAdministrator of the General Services Administration from 1993 to 1996. Prior to 1993, Mr. Johnsonserved in a number of senior executive positions, including Chairman of the Board and Chief ExecutiveOfficer of Western Digital Corporation. A director of Sypris since 1997 and of Sypris Electronics from1996 until its merger with Sypris in 1998, Mr. Johnson also serves as a director of the NeedhamFunds, Insulectro, Maxtor Corporation and Computer Access Technology Corporation. He is Chairmanof the Audit and Finance Committee and a member of the Nominating and Governance Committee.
Sidney R. Petersen retired as Chairman of the Board and Chief Executive Officer of Getty Oil in 1984, where he served in a variety of increasingly responsible management positions since1955. A director of Sypris since 1997 and of Sypris Electronics from 1994 until its merger withSypris in 1998, Mr. Petersen also serves as a director of Avery Dennison Corporation. He is amember of the Compensation and Audit and Finance Committees.
Robert Sroka has served as Managing Partner of Lighthouse Partners, a private investment and business consulting company, since 1998. Mr. Sroka served as Managing Director ofInvestment Banking-Mergers and Acquisitions for J.P. Morgan from 1994 to 1998. Prior to1994, Mr. Sroka served in a variety of senior executive positions with J.P. Morgan, includingVice President-Investment Banking and Vice President-Corporate Finance. A director of Syprissince 1997, Mr. Sroka also serves as a director of Avado Brands. He is a member of theCompensation and Audit and Finance Committees.
Robert E. Gill has served as Chairman of the Board of Sypris and its predecessor since 1983,and as President and Chief Executive Officer of its predecessor from 1983 to 1992. Prior to1983, Mr. Gill served in a number of senior executive positions, including Chairman, Presidentand Chief Executive Officer of Armor Elevator Company, Vice President of A. O. SmithCorporation and President and Chief Executive Officer of Elevator Electric Company. Mr. Gillholds a BS degree in Electrical Engineering from the University of Washington and an MBA from the University of California at Berkeley. He is Chairman of the Executive Committee. Robert E. Gill is the father of Jeffrey T. Gill and R. Scott Gill.
Jeffrey T. Gill has served as President and Chief Executive Officer of Sypris and its predecessorsince 1992, and as Executive Vice President of its predecessor from 1983 to 1992. Mr. Gillholds a BS degree in Business Administration from the University of Southern California and anMBA from Dartmouth College. A director of Sypris and its predecessor since 1983, Mr. Gill is amember of the Executive Committee. Jeffrey T. Gill is the son of Robert E. Gill and the brother ofR. Scott Gill.
Henry F. Frigon has served as a private investor and business consultant since 1994. Mr. Frigonserved as Chairman of CARSTAR, a national provider of collision repair services, from 2000 to 2001, and as its President and Chief Executive Officer from 1998 to 2000. Prior to 1994, Mr. Frigon served in a number of senior executive positions, including Executive Vice President-Corporate Development and Strategy, and Chief Financial Officer of Hallmark Cards, andPresident and Chief Executive Officer of BATUS. A director of Sypris since 1997 and of SyprisElectronics from 1994 until its merger with Sypris in 1998, Mr. Frigon also serves as a directorof H&R Block, Buckeye Technologies, Dimon, Tuesday Morning and Packaging Corporation ofAmerica. He is Chairman of the Compensation Committee and a member of the Executive andNominating and Governance Committees.
R. Scott Gill has served as a Managing Broker with Koenig & Strey GMAC Real Estate, aresidential real estate firm, since 2001. Mr. Gill served as an Associate with Koenig & StreyGMAC Real Estate from 1999 to 2001, as Project Manager for IA Chicago, an architecturaldesign firm, from 1998 to 1999, as Senior Vice President and Secretary of Sypris from 1997 to1998, and as Vice President and Secretary of its predecessor from 1983 to 1998. A director ofSypris and its predecessor since 1983, Mr. Gill is a member of the Executive Committee. R. ScottGill is the son of Robert E. Gill and the brother of Jeffrey T. Gill.
BOARD OF DIRECTORS BOARD OF DIRECTORS

24 SYPR
(in thousands, except for per share data)
Years ended December 31, 2002 2001 2000 1999 1998(1)
INCOME STATEMENT DATA:
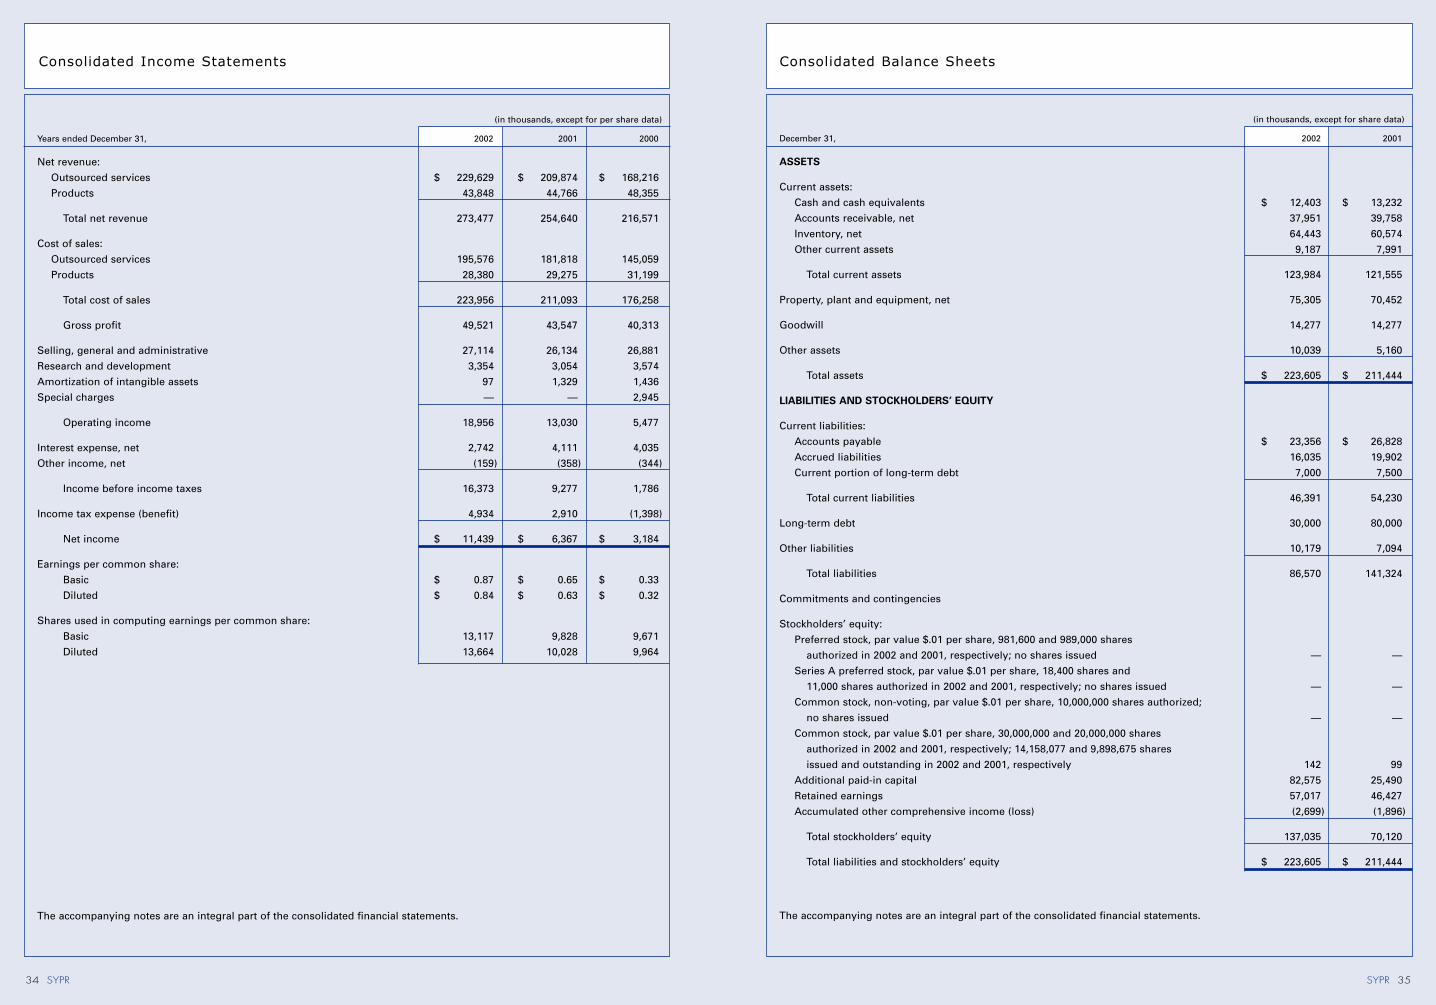
Net revenue $ 273,477 $ 254,640 $ 216,571 $ 202,130 $ 211,625
Gross profit 49,521 43,547 40,313 44,949 47,923
Operating income 18,956 13,030 5,477 14,166 12,851
Net income 11,439 6,367 3,184 9,556 7,446
Earnings per common share:
Basic $ 0.87 $ 0.65 $ 0.33 $ 1.00 $ 0.79
Diluted $ 0.84 $ 0.63 $ 0.32 $ 0.97 $ 0.76
(in thousands)
December 31, 2002 2001 2000 1999 1998(1)
BALANCE SHEET DATA:
Working capital $ 77,593 $ 67,325 $ 58,602 $ 53,705 $ 32,121
Total assets 223,605 211,444 179,122 148,564 121,119
Total debt 37,000 87,500 65,000 54,400 28,583
Total stockholders’ equity 137,035 70,120 64,205 60,820 49,359
(1) For periods ended prior to March 30, 1998:
• The consolidated financial statements of our predecessor are included as our predecessor was deemed to be the acquirer foraccounting purposes in our reorganization.
• The computation of earnings per common share has been adjusted to exclude the minority interests reflected in the historicalfinancial statements of our predecessor.
• Shares used in computing earnings per common share reflect our one-for-four reverse stock split that occurred on March 30, 1998,and include the outstanding shares of our common stock as of March 30, 1998 and the dilution associated with common stockoptions issued prior to that date.
FINANCIAL SUMMARY Financial Review
SYPR 25
Report of Management
Report of Independent Auditors
Management’s Discussion and Analysis
Consolidated Income Statements
Consolidated Balance Sheets
Consolidated Statements of Cash Flows
Consolidated Statements of Stockholders’ Equity
Notes to Consolidated Financial Statements
26
27
28
34
35
36
37
38

SYPR 27
Report of Management Report of Independent Auditors
26 SYPR
The management of Sypris Solutions, Inc. is responsible for the preparation and integrity of the accompanying consolidated
financial statements, which were prepared in accordance with accounting principles generally accepted in the United States.
The consolidated financial statements include amounts based on management’s best estimates and judgments. Financial
information included elsewhere in this annual report is consistent with these consolidated financial statements.
We maintain a system of internal control designed to provide reasonable assurance that transactions are executed in
accordance with proper authorization and are appropriately recorded in order to permit preparation of financial statements in
conformity with generally accepted accounting principles, and that assets are adequately safeguarded and accountability for
assets is maintained. Although no cost-effective internal control system will prevent all errors and irregularities, we believe our
controls provide reasonable assurance that the consolidated financial statements are reliable and that our assets are
reasonably safeguarded. Internal controls and procedures are periodically reviewed and revised, when appropriate, due to
changing circumstances and requirements.
To ensure the effective administration of internal control, we strive to carefully select and train our employees, maintain and
disseminate written policies and procedures, provide appropriate communication channels and seek to foster an environment
conducive to the effective functioning of internal controls. We have adopted a Code of Business Conduct that requires all
employees, including officers and senior level executives, to adhere to high standards of personal and professional integrity.
The Audit and Finance Committee of the Board of Directors is composed entirely of outside directors, including one of whom
the Board of Directors has deemed to be a financial expert. The Audit and Finance Committee members meet the Nasdaq
Stock Market standards for independence and operate under a written charter adopted by the Board of Directors. The Audit
and Finance Committee meets periodically with representatives of management and our independent auditors to review our
financial reporting process and our controls to safeguard assets. Our independent auditors have full and free access to the
Audit and Finance Committee members at all times, without the presence of management, to discuss the results of their
audits, the adequacy of our internal accounting control and the quality of our financial reporting process.
Jeffrey T. Gill David D. Johnson
President & CEO Vice President, CFO & Treasurer
Board of Directors and Stockholders
Sypris Solutions, Inc.
We have audited the accompanying consolidated balance sheets of Sypris Solutions, Inc. as of December 31, 2002 and 2001,
and the related consolidated statements of income, stockholders’ equity, and cash flows for each of the three years in the period
ended December 31, 2002. These financial statements are the responsibility of the Company’s management. Our responsibility
is to express an opinion on these financial statements based on our audits.
We conducted our audits in accordance with auditing standards generally accepted in the United States. Those standards
require that we plan and perform the audit to obtain reasonable assurance about whether the financial statements are free of
material misstatement. An audit includes examining, on a test basis, evidence supporting the amounts and disclosures in the
financial statements. An audit also includes assessing the accounting principles used and significant estimates made by
management, as well as evaluating the overall financial statement presentation. We believe that our audits provide a
reasonable basis for our opinion.
In our opinion, the consolidated financial statements referred to above present fairly, in all material respects, the consolidated
financial position of Sypris Solutions, Inc. at December 31, 2002 and 2001, and the consolidated results of its operations and its
cash flows for each of the three years in the period ended December 31, 2002, in conformity with accounting principles
generally accepted in the United States.
As discussed in Note 1 to the consolidated financial statements, in 2002 the Company changed its method of accounting for
goodwill and other intangible assets.
Louisville, Kentucky
January 31, 2003

SYPR 29
Management�s Discussion and Analysis
28 SYPR
Management�s Discussion and Analysis
The following discussion of our results of operations and financial condition should be read together with the consolidated
financial statements and notes thereto.
As of January 1, 2002, we changed the name of our four major operating subsidiaries as part of a comprehensive branding initiative.
The new names of our four subsidiaries are Sypris Data Systems, Inc., formerly Metrum-Datatape, Inc.; Sypris Electronics, LLC,
formerly Group Technologies Corporation; Sypris Technologies, Inc., formerly Tube Turns Technologies, Inc.; and Sypris Test &
Measurement, Inc., formerly Bell Technologies, Inc.
Critical Accounting Policies and Estimates
Our results of operations are based on the preparation of consolidated financial statements in conformity with accounting
principles generally accepted in the U.S. The preparation of consolidated financial statements requires management to select
accounting policies for critical accounting areas as well as estimates and assumptions that affect the amounts reported in the
consolidated financial statements. Significant changes in assumptions and/or conditions in our critical accounting policies could
materially impact our operating results.
Our significant accounting policies are described in Note 1 to the consolidated financial statements. We believe our most critical
accounting policies include revenue recognition and cost estimation on certain contracts for which we use a percentage of
completion, units of delivery method of accounting. This accounting method is applied by our Electronics Group for outsourced
services provided under multi-year contracts with aerospace and defense customers. Approximately 44%, 53% and 49% of total
net revenue was recognized under the percentage of completion, units of delivery method of accounting during 2002, 2001 and
2000, respectively. Revenue is recognized on these contracts when units are accepted by and shipped to the customer, with unit
revenue derived based upon the total contract revenue and total units to be delivered over the life of the contract. The
corresponding recognition of cost of sales for the delivered units is based upon our estimates of costs to be incurred for the total
contract. Under this approach, we compare estimated costs to complete an entire contract to total net revenue for the term of the
contract to arrive at an estimated gross margin percentage for each contract. Each month, the estimated gross margin percentage
is applied to the cumulative net revenue recognized on the contract to arrive at cost of sales for the period. Management reviews
these estimates monthly and the effect of any change in the estimated gross margin percentage for a contract is reflected in cost
of sales in the period in which the change is known. Such changes to these estimates have not been material to our quarterly
results of operations during the three year period ended December 31, 2002. If increases in projected costs to complete are
sufficient to create a loss contract, the entire estimated loss is charged to operations in the period the loss first becomes known.
Additionally, our reserve for excess and obsolete inventory is primarily based upon forecasted demand for our products and any
change to the reserve arising from forecast revisions is reflected in cost of sales in the period the revision is made.
The complexity of the estimation process and all issues related to the assumptions, risks and uncertainties inherent with the
application of the percentage of completion, units of delivery method of accounting affect the amounts reported in our
consolidated financial statements. A number of internal and external factors affect our cost of sales estimates, including labor rate
and efficiency variances, revised estimates of warranty costs, estimated future material prices and customer specification and
testing requirement changes. If our business conditions were different, or if we used different assumptions in the application of
this and other accounting policies, it is likely that materially different amounts would be reported in our consolidated financial
statements.
Consistent with Statement of Financial Accounting Standards ("SFAS") No. 142, "Goodwill and Other Intangible Assets," goodwill
is no longer amortized, but instead tested at least annually for impairment. Prior to 2002, goodwill was amortized using the
straight-line method over its estimated period of benefit of 15 years. We have not recorded any impairments of goodwill since
adopting SFAS No. 142.
Consistent with SFAS No. 144, "Accounting for the Impairment or Disposal of Long-Lived Assets," we evaluate long-lived assets
for impairment and assess their recoverability based upon anticipated future cash flows. If facts and circumstances lead us to
believe that the cost of one of our assets may be impaired, we will write down that carrying amount to fair value to the extent
necessary. We have not recorded any impairments of long-lived assets since adopting SFAS No. 144.
Results of Operations
The following table sets forth certain data from our consolidated income statements for the years ended December 31, 2002, 2001
and 2000, expressed as a percentage of net revenue:
Years ended December 31, 2002 2001 2000
Net revenue:Electronics Group 68.2% 81.4% 84.1%Industrial Group 31.8 18.6 15.9
Total net revenue 100.0 100.0 100.0
Cost of sales 81.9 82.9 81.4
Gross profit 18.1 17.1 18.6
Selling, general and administrative 9.9 10.3 12.4Research and development 1.3 1.2 1.6Amortization of intangible assets — 0.5 0.7Special charges — — 1.4
Operating income 6.9% 5.1% 2.5%
Net income 4.2% 2.5% 1.5%
Year Ended December 31, 2002 Compared to Year Ended December 31, 2001
Net Revenue. Net revenue was $273.5 million in 2002, an increase of $18.9 million, or 7.4%, from $254.6 million in 2001. Backlog
at December 31, 2002 was $154.2 million, a decrease of $8.1 million from $162.3 million at December 31, 2001. Backlog for our
Electronics Group and Industrial Group at December 31, 2002 was $115.4 million and $38.8 million, respectively.
Net revenue for our Electronics Group in 2002 was $186.6 million, a decrease of $20.7 million, or 10.0%, from $207.3 million in 2001.
The decrease in net revenue was primarily due to lower revenue in manufacturing services and other outsourced services.
Manufacturing services revenue decreased $14.7 million primarily due to lower aerospace and defense shipments during 2002 and
the completion of a commercial contract in the fourth quarter of 2001. Other outsourced services revenue decreased $5.4 million
primarily due to a 16% decline in revenue for test and measurement services. Weak economic conditions and a slowdown in the
telecommunications, semiconductor, and commercial avionics markets negatively affected demand for test and measurement
services from our customers. Product sales accounted for a decrease in net revenue of $0.6 million during 2002, primarily due to
reduced sales quantities for magnetics products.
Net revenue for our Industrial Group in 2002 was $86.9 million, an increase of $39.6 million, or 83.3%, from $47.3 million in 2001.
The increase in net revenue was primarily due to the full year effect of the May 2001 contract with Dana Corporation and the
addition of a contract with Visteon Corporation. The contract with Dana for fully machined, medium and heavy-duty truck axle
shafts and other drive train components, generated outsourced services revenue totaling $38.6 million in 2002, as compared to
$17.7 million in 2001. Under the contract with Visteon we began supplying light axle shafts for pickup trucks and sport utility
vehicles during the first quarter of 2002.
Gross Profit. Gross profit in 2002 was $49.5 million, an increase of $6.0 million, or 13.8%, from $43.5 million in 2001. Gross
margin as a percentage of net revenue in 2002 increased to 18.1% from 17.1% in 2001.
Gross profit for our Electronics Group in 2002 was $37.8 million, an increase of $0.4 million, or 1.1%, from $37.4 million in 2001.
Gross margin for our Electronics Group increased to 16.2% in 2002 from 14.0% in 2001. Gross margin increased due to cost
reductions, improved manufacturing efficiencies and a more favorable revenue mix in 2002 as compared to 2001. This improvement
in margin was partially offset by lower profit resulting from a decrease in net revenue.
Gross profit for our Industrial Group in 2002 was $11.7 million, an increase of $5.6 million, or 91.8%, from $6.1 million in 2001.
Gross margin for our Industrial Group increased to 13.5% in 2002 from 13.0% in 2001. The increase in gross profit was primarily
due to revenue growth from contracts with Dana and Visteon. Start-up costs and manufacturing inefficiencies related to our initial
production under the Visteon contract limited the gross profit contribution from this business.

Management�s Discussion and Analysis Management�s Discussion and Analysis
30 SYPR SYPR 31
Selling, General and Administrative. Selling, general and administrative expense in 2002 was $27.1 million, or 9.9% of net
revenue, as compared to $26.1 million, or 10.3% of net revenue in 2001. The increase in selling, general and administrative
expense was primarily attributable to additional management and administrative infrastructure to support the growth in our
Industrial Group, partially offset by reduced selling expenses in our Electronics Group. During the fourth quarter of 2002, selling,
general and administrative expense was 8.8% of net revenue, primarily due to a reduction in our incentive bonus expense based
on performance measures defined in our incentive plans.
Research and Development. Research and development expense in 2002 was $3.4 million, or 1.3% of net revenue, as compared
to $3.1 million, or 1.2% of net revenue in 2001. Our research and development spending in 2002 and 2001 was primarily
attributable to our Electronics Group and was related to new product releases for the data systems product lines.
Amortization of Intangible Assets. Amortization of goodwill and indefinite-lived intangible assets ceased when we adopted SFAS
No. 142 effective January 1, 2002. Amortization of intangible assets in 2002 was $0.1 million, compared to $1.3 million in 2001.
Interest Expense, Net. Interest expense in 2002 was $2.7 million, a decrease of $1.4 million, or 34.1%, from $4.1 million in 2001.
The decrease in interest expense from the comparable period reflects the 2002 repayment of debt with proceeds from our public
stock offering combined with a reduction in our weighted average interest rate. Our weighted average debt outstanding
decreased to approximately $49.8 million for 2002 from approximately $74.5 million for 2001. The weighted average interest rate
for 2002 was approximately 5.8% as compared to approximately 7.4% for 2001. There was no capitalized interest for 2002 as
compared to $1.8 million for 2001.
Income Taxes. Income tax expense was $4.9 million in 2002 as compared to $2.9 million in 2001. The effective tax rate was
30.1% and 31.4% in 2002 and 2001, respectively. The effective tax rate for both years reflects research and development tax
credits, Extraterritorial Income Exclusion tax benefits and a reduction in our valuation allowance on deferred tax assets. The
reduction in the valuation allowance for 2002 and 2001 was $0.7 million and $0.3 million, respectively.
Year Ended December 31, 2001 Compared to Year Ended December 31, 2000
Net Revenue. Net revenue was $254.6 million in 2001, an increase of $38.0 million, or 17.6%, from $216.6 million in 2000.
Backlog at December 31, 2001 was $162.3 million, an increase of $1.5 million from $160.8 million at December 31, 2000. Backlog
for our Electronics Group and Industrial Group at December 31, 2001 was $118.5 million and $43.8 million, respectively.
Net revenue for our Electronics Group in 2001 was $207.3 million, an increase of $25.2 million, or 13.8%, from $182.1 million in
2000. The increase in net revenue was primarily from contracts with aerospace and defense customers for manufacturing
services, which generated an increase of $28.7 million in 2001 over the prior year. Other outsourced services accounted for an
increase in net revenue of $0.5 million during 2001. Product sales accounted for a decrease in net revenue of $4.0 million during
2001, primarily due to reduced sales quantities for data systems products.
Net revenue for our Industrial Group in 2001 was $47.3 million, an increase of $12.8 million, or 37.5%, from $34.5 million in 2000.
During May 2001, we entered into a new long-term contract with Dana, including the acquisition of certain manufacturing assets
and inventory from Dana for approximately $11.5 million in cash. The assets are used to produce fully machined, medium and
heavy-duty truck axle shafts and other drive train components for integration into subassemblies produced for leading truck
manufacturers. This business generated outsourced services revenue of $17.7 million during 2001. Excluding the acquisition, the
Industrial Group’s net revenue declined $4.9 million in 2001 from the prior year. The decrease in net revenue was primarily due to
a decline in outsourced services provided to customers in the heavy-duty truck market. Unfavorable market conditions that arose
during the second half of 2000 for heavy-duty truck production resulted in an industry-wide market decrease of approximately
40% by the second half of 2001 and reduced the volume of axles we supplied to that market.
Gross Profit. Gross profit in 2001 was $43.5 million, an increase of $3.2 million, or 8.0%, from $40.3 million in 2000. Gross
margin in 2001 declined to 17.1% from 18.6% in 2000.
Gross profit for our Electronics Group in 2001 was $37.4 million, an increase of $1.1 million, or 3.1%, from $36.3 million in 2000.
The increase in manufacturing services revenue generated an increase in gross profit of $3.8 million, while gross profit from other
outsourced services decreased $0.6 million. Gross margin in 2001 declined to 18.0% from 19.9% in 2000. Manufacturing services
comprised approximately 59% of our Electronics Group’s revenue in 2001 as compared to approximately 51% in 2000. Gross
margin from manufacturing services improved slightly over the prior year; however, since gross margin on manufacturing
services is lower than other outsourced services, the change in revenue mix contributed to the decrease in gross margin. Another
factor in the gross margin decline was a slight decrease in gross margin on other outsourced services, primarily due to adverse
economic conditions impacting demand and pricing for certain services provided to our customers. Gross profit from product
sales decreased $2.1 million during 2001, primarily due to reduced demand for certain product offerings.
Gross profit for our Industrial Group in 2001 was $6.1 million, an increase of $2.1 million or 52.5% from $4.0 million in 2000.
Excluding the new contract with Dana, gross profit declined $0.9 million in 2001 primarily due to the downturn of the heavy-duty
truck market. The reduction in demand and corresponding impact on shipments occurred as our organizational infrastructure to
support future growth plans was being developed. The increased cost structure associated with the additional people and systems
required to meet future contractual requirements and the underabsorption of overhead due to the volume decline resulted in a
decline in our gross margin, excluding the impact of the new contract with Dana, to 10.6% in 2001, as compared to 11.7% for the
prior year. Gross margin for our Industrial Group during 2001, including the new contract with Dana, was 13.0%.
Selling, General and Administrative. Selling, general and administrative expense in 2001 was $26.1 million, or 10.3% of net
revenue, as compared to $26.9 million, or 12.4% of net revenue in 2000. Although net revenue increased 17.6% from 2000 to 2001
and the new contract with Dana added approximately $1.0 million to selling, general and administrative expense during 2001, our
total selling, general and administrative spending decreased by $0.8 million, or 2.8%. The decline in selling, general and
administrative expense was primarily attributable to decreased selling expenses and commissions related to lower product sales
for our Electronics Group, decreased marketing costs and cost reductions in both our Electronics Group and Industrial Group in
response to the general weakness in the U.S. economy.
Research and Development. Research and development expense in 2001 was $3.1 million, or 1.2% of net revenue, as compared
to $3.6 million, or 1.6% of net revenue in 2000. The decrease in research and development expense was attributable to our
Electronics Group, and was related to the quantity and timing of new product releases for the data systems product lines and the
increased utilization of strategic alliances with suppliers for product development.
Amortization of Intangible Assets. Amortization of intangible assets in 2001 was $1.3 million, a decrease of $0.1 million, or 7.5%
compared to $1.4 million in 2000.
Special Charges. Special charges of $2.9 million were recognized during 2000 for activities related to the consolidation of certain
operations within our Electronics Group. The consolidation activities were completed in 2000 and no such charges were recognized in
2001.
Interest Expense, Net. Interest expense in 2001 was $4.1 million, an increase of $0.1 million, or 1.9%, from $4.0 million in 2000.
Interest expense attributable to increased borrowings during 2001 was offset by a reduction in interest rates and the capitalization
of interest incurred on our Industrial Group’s capital expenditure program. Our weighted average debt outstanding increased to
approximately $74.5 million during 2001 from approximately $58.7 million in 2000. This increase reflected the $11.5 million
acquisition from Dana made by our Industrial Group in May 2001 and capital expenditures during 2000 and 2001 to support new
business opportunities. The weighted average interest rate in 2001 was approximately 7.4% as compared to approximately 8.5%
for the prior year. Capitalized interest in 2001 was $1.8 million as compared to $0.9 million in 2000.
Income Taxes. Income tax expense was $2.9 million in 2001 as compared to an income tax benefit of $1.4 million in 2000. The
effective tax rate in 2001 was 31.4%. The effective tax rate for 2001 and the income tax benefit in 2000 reflect research and
development tax credits, Extraterritorial Income Exclusion tax benefits and a reduction in our valuation allowance on deferred tax
assets. The reduction in the valuation allowance for 2001 and 2000 was $0.3 million and $3.0 million, respectively.
Liquidity, Capital Resources and Financial Condition
Net cash provided by operating activities was $13.6 million in 2002, as compared to $8.5 million in 2001, primarily due to an
increase in net income and deferred income taxes and a decrease in accounts receivable, partially offset by contributions to
pension plans. On November 27, 2002, we made a voluntary contribution to the pension plans totaling $5.7 million.
Net cash used in investing activities was $20.2 million in 2002 as compared to $32.9 million in 2001. Capital expenditures for our
Electronics Group and Industrial Group totaled $7.5 million and $12.0 million, respectively, in 2002. Capital expenditures for our
Electronics Group were principally comprised of manufacturing, assembly and test equipment. Our Industrial Group’s capital
expenditures included new forging and machining equipment to increase and expand the range of production capabilities.

Management�s Discussion and Analysis Management�s Discussion and Analysis
32 SYPR SYPR 33
Recently Issued Accounting Standards
Effective January 1, 2001, we adopted SFAS No. 133, "Accounting for Derivative Instruments and Hedging Activities" as amended
by SFAS No. 137 and 138. SFAS No. 133, and its subsequent amendments, requires us to recognize all derivatives on the
consolidated balance sheet at fair value. Derivatives that are not hedges must be adjusted to fair value through income. If the
derivative is a hedge, depending on the nature of the hedge, changes in the fair value of derivatives are either offset against the
change in fair value of assets, liabilities, or firm commitments through earnings or recognized in other comprehensive income until
the hedged item is recognized in earnings. The ineffective portion of a derivative’s change in fair value must be recognized
currently in earnings. In 2001, we entered into interest rate swap agreements, which are deemed to be effective hedges in
accordance with SFAS No. 133.
Effective January 1, 2002, we adopted SFAS No. 142, "Goodwill and Other Intangible Assets." Under SFAS No. 142, goodwill and
indefinite lived intangible assets are no longer amortized but will be reviewed at least annually for impairment. Separable
intangible assets that are not deemed to have an indefinite life will continue to be amortized over their useful lives.
Effective January 1, 2002, we adopted SFAS No. 144, "Accounting for the Impairment or Disposal of Long-Lived Assets." SFAS No.
144 supersedes SFAS No. 121, "Accounting for the Impairment of Long-Lived Assets and for Long-Lived Assets to Be Disposed
Of," and the accounting and reporting provisions of Accounting Principles Board Opinion No. 30, "Reporting the Results of
Operations — Reporting the Effects of Disposal of a Segment of a Business, and Extraordinary, Unusual and Infrequently Occurring
Events and Transactions." SFAS No. 144 requires one accounting model to be used for long-lived assets to be disposed of by sale,
whether previously held or used or newly acquired, and it broadens the presentation of discontinued operations to include more
disposal transactions. Adoption of SFAS No. 144 did not impact our financial statements in 2002.
Quantitative and Qualitative Disclosures about Market Risk
On July 26, 2001, we entered into interest rate swap agreements with a syndicate of banks that effectively convert a portion of our
variable rate debt to a fixed rate of 4.52%, excluding our applicable margin, through July 2003. We entered into interest rate swap
agreements as a means to reduce the impact of interest rate changes on future interest expense. Approximately 81% ($30.0
million) of our outstanding debt was covered under the interest rate swap agreements at December 31, 2002. We are exposed to
financial market risks, including changes in interest rates and foreign currency exchange rates. Excluding the borrowings included
in the interest rate swap agreements, all other borrowings under our credit agreement bear interest at a variable rate based on the
prime rate, the London Interbank Offered Rate, or certain alternative short-term rates, plus a margin (1.0% at December 31, 2002)
based upon our leverage ratio. An increase in interest rates of 100 basis points would result in additional interest expense of
approximately $70,000 on an annualized basis, based upon our debt outstanding at December 31, 2002. The vast majority of our
transactions are denominated in U.S. dollars. As such, fluctuations in foreign currency exchange rates have historically had little
impact on us. Inflation has not been a significant factor in our operations in any of the periods presented and it is not expected to
affect operations in the foreseeable future.
Forward Looking Statements
This annual report may contain projections and other forward-looking statements within the meaning of Section 21E of the
Securities Exchange Act of 1934. These projections and statements reflect our current views with respect to future events and
financial performance. No assurance can be given, however, that these events will occur or that these projections will be achieved
and actual results could differ materially from those projected as a result of certain factors. These factors include our dependence
on our current management; the risks and uncertainties present in our business, including changes in laws or regulations; business
conditions and growth in the general economy and the electronics and industrial markets served by us; competitive factors and
price pressures; availability of third party component parts at reasonable prices; inventory risks due to shifts in market demand
and/or price erosion of purchased components; changes in product mix; cost and yield issues associated with our manufacturing
facilities; the ability to successfully manage growth; the effects (including possible increases in the cost of doing business) resulting
from future war and terrorists activities or political uncertainties; as well as other factors included in our periodic reports filed with
the Securities and Exchange Commission.
Our Industrial Group invested $12.0 million, $19.5 million and $15.5 million during 2002, 2001 and 2000, respectively, in facilities,
equipment and systems to support our growth in the truck components and assemblies market. We substantially completed the
investments for this growth during 2002, which provides us with the capacity to serve the requirements of our existing multi-year
contracts with ArvinMeritor, Dana and Visteon. The Industrial Group’s acquisition of certain assets related to the Dana contract for
$11.5 million was included in investing activities in 2001.
Net cash provided by financing activities was $5.8 million during 2002 as compared to $23.0 million in 2001. We received net
proceeds of $55.7 million from our public stock offering during March and April 2002. Prior to the offering, we reduced debt by $5.0
million and proceeds from the offering were used to reduce debt by an additional $45.5 million in 2002. Dividends paid in 2002
totaled $0.4 million.
Subject to certain loan covenants, we had total availability for borrowings and letters of credit under the revolving credit facility of
$87.8 million at December 31, 2002, which, when combined with the cash balance of $12.4 million, provides for total cash and
borrowing capacity of $100.4 million. Our borrowing capacity was increased by $25.0 million in July 2002, as we agreed with our
bank group to raise maximum borrowings on the revolving credit facility from $100.0 million to $125.0 million. Other terms of the
credit agreement remained substantially unchanged. Borrowings under the revolving credit facility may be used to finance working
capital requirements, acquisitions and for general corporate purposes, including capital expenditures. Most acquisitions require the
approval of our bank group.
Our principal commitments at December 31, 2002 consisted of repayments of borrowings under the credit agreement and obligations
under operating leases for certain of our real property and equipment. We also had purchase commitments totaling approximately
$2.8 million at December 31, 2002, primarily for manufacturing equipment. The following table provides information about the
payment dates of our contractual obligations at December 31, 2002, excluding current liabilities except for the current portion of
long-term debt:
(in thousands)
2008 &
2003 2004 2005 2006 2007 Thereafter
Revolving credit facility $ 7,000 $ — $ 30,000 $ — $ — $ —Operating leases 6,935 6,468 5,753 5,179 9,537 138
Total $ 13,935 $ 6,468 $ 35,753 $ 5,179 $ 9,537 $ 138
We believe that sufficient resources will be available to satisfy our cash requirements for at least the next twelve months. Cash
requirements for periods beyond the next twelve months depend on our profitability, ability to manage working capital requirements
and rate of growth. If we make significant acquisitions or if working capital and capital expenditure requirements exceed expected
levels during the next twelve months or in subsequent periods, we may require additional external sources of capital. There can be
no assurance that any additional required financing will be available through bank borrowings, debt or equity financings or
otherwise, or that if such financing is available, it will be available on terms acceptable to us. If adequate funds are not available on
acceptable terms, our business, results of operations and financial condition could be adversely affected.
Outlook
The short-term outlook for several of our Electronics Group’s aerospace and defense customers is becoming less certain as these
customers compete for funds that appear to be increasingly redirected to support the deployment of the U.S. military to the Middle
East. After the expected appropriation of funds for the war effort by Congress, however, we believe the outlook for this portion of
our business will regain its momentum. As a result, comparable period growth in our Electronics Group is not expected to occur
until the second half of 2003 as shipments are expected to increase on certain aerospace and defense contracts.
Our Industrial Group expects a steady recovery in the production of medium and heavy-duty trucks during the second half of 2003.
The late 2002 decline in the heavy-duty truck market is expected to stabilize during the first half of 2003 and increase over the
balance of the year. This anticipated rebound in the heavy-duty truck market, combined with an expected increase in volume from
supplying additional parts to our existing customers and the full year impact of the Visteon contract, is expected to result in an
increase in our Industrial Group’s revenue in 2003.
Consolidated Income Statements Consolidated Balance Sheets
34 SYPR SYPR 35
(in thousands, except for per share data)
Years ended December 31, 2002 2001 2000
Net revenue:
Outsourced services $ 229,629 $ 209,874 $ 168,216
Products 43,848 44,766 48,355
Total net revenue 273,477 254,640 216,571
Cost of sales:
Outsourced services 195,576 181,818 145,059
Products 28,380 29,275 31,199
Total cost of sales 223,956 211,093 176,258
Gross profit 49,521 43,547 40,313
Selling, general and administrative 27,114 26,134 26,881
Research and development 3,354 3,054 3,574
Amortization of intangible assets 97 1,329 1,436
Special charges — — 2,945
Operating income 18,956 13,030 5,477
Interest expense, net 2,742 4,111 4,035
Other income, net (159) (358) (344)
Income before income taxes 16,373 9,277 1,786
Income tax expense (benefit) 4,934 2,910 (1,398)
Net income $ 11,439 $ 6,367 $ 3,184
Earnings per common share:
Basic $ 0.87 $ 0.65 $ 0.33
Diluted $ 0.84 $ 0.63 $ 0.32
Shares used in computing earnings per common share:
Basic 13,117 9,828 9,671
Diluted 13,664 10,028 9,964
The accompanying notes are an integral part of the consolidated financial statements.
(in thousands, except for share data)
December 31, 2002 2001
ASSETS
Current assets:
Cash and cash equivalents $ 12,403 $ 13,232
Accounts receivable, net 37,951 39,758
Inventory, net 64,443 60,574
Other current assets 9,187 7,991
Total current assets 123,984 121,555
Property, plant and equipment, net 75,305 70,452
Goodwill 14,277 14,277
Other assets 10,039 5,160
Total assets $ 223,605 $ 211,444
LIABILITIES AND STOCKHOLDERS’ EQUITY
Current liabilities:
Accounts payable $ 23,356 $ 26,828
Accrued liabilities 16,035 19,902
Current portion of long-term debt 7,000 7,500
Total current liabilities 46,391 54,230
Long-term debt 30,000 80,000
Other liabilities 10,179 7,094
Total liabilities 86,570 141,324
Commitments and contingencies
Stockholders’ equity:
Preferred stock, par value $.01 per share, 981,600 and 989,000 shares
authorized in 2002 and 2001, respectively; no shares issued — —
Series A preferred stock, par value $.01 per share, 18,400 shares and
11,000 shares authorized in 2002 and 2001, respectively; no shares issued — —
Common stock, non-voting, par value $.01 per share, 10,000,000 shares authorized;
no shares issued — —
Common stock, par value $.01 per share, 30,000,000 and 20,000,000 shares
authorized in 2002 and 2001, respectively; 14,158,077 and 9,898,675 shares
issued and outstanding in 2002 and 2001, respectively 142 99
Additional paid-in capital 82,575 25,490
Retained earnings 57,017 46,427
Accumulated other comprehensive income (loss) (2,699) (1,896)
Total stockholders’ equity 137,035 70,120
Total liabilities and stockholders’ equity $ 223,605 $ 211,444
The accompanying notes are an integral part of the consolidated financial statements.

Consolidated Statements of Cash Flows Consolidated Statements of Stockholders� Equity
36 SYPR SYPR 37
(in thousands, except for share data)
Accumulated
Common StockAdditional Other Total
Paid-In Retained Comprehensive Stockholders’Shares Amount Capital Earnings Income (Loss) Equity
Balance at January 1, 2000 9,589,214 $ 96 $ 23,921 $ 36,876 $ (73) $ 60,820
Net income — — — 3,184 — 3,184Adjustment in minimum pension liability — — — — (280) (280)Comprehensive income (loss) — — — 3,184 (280) 2,904
Issuance of shares under Employee Stock Purchase Plan 35,290 — 273 — — 273
Exercise of stock options 85,165 1 207 — — 208
Balance at December 31, 2000 9,709,669 97 24,401 40,060 (353) 64,205
Net income — — — 6,367 — 6,367Adjustment in minimum pension liability,
net of tax of $828 — — — — (1,124) (1,124)Change in fair value of interest rate swap
agreements, net of tax of $309 — — — — (419) (419)Comprehensive income (loss) — — — 6,367 (1,543) 4,824
Issuance of shares under Employee Stock Purchase Plan 52,206 1 256 — — 257
Exercise of stock options 136,800 1 566 — — 567Stock option tax benefit — — 267 — — 267
Balance at December 31, 2001 9,898,675 99 25,490 46,427 (1,896) 70,120
Net income — — — 11,439 — 11,439Adjustment in minimum pension liability,
net of tax of $582 — — — — (873) (873)Change in fair value of interest rate swap
agreements, net of tax of $99 — — — — 70 70Comprehensive income (loss) — — — 11,439 (803) 10,636
Cash dividends, $0.06 per common share — — — (849) — (849)Issuance of common shares 4,100,000 41 55,615 — — 55,656Issuance of shares under Employee
Stock Purchase Plan 37,695 1 335 — — 336Exercise of stock options 123,983 1 758 — — 759Stock option tax benefit — — 377 — — 377Retire unvested restricted shares (2,276) — — — — —
Balance at December 31, 2002 14,158,077 $ 142 $ 82,575 $ 57,017 $ (2,699) $ 137,035
The accompanying notes are an integral part of the consolidated financial statements.
(in thousands)
Years ended December 31, 2002 2001 2000
Cash flows from operating activities:
Net income $ 11,439 $ 6,367 $ 3,184
Adjustments to reconcile net income to net cash
provided by operating activities:
Depreciation and amortization 11,386 9,856 9,351
Deferred income taxes 3,684 479 (2,478)
Provision for excess and obsolete inventory 727 432 453
Provision for doubtful accounts 231 122 18
Other noncash charges 339 59 202
Contributions to pension plans (7,451) (754) (1,181)
Changes in operating assets and liabilities, net of acquisitions:
Accounts receivable 1,576 (8,474) (8,121)
Inventory (4,559) (3,519) (2,046)
Other current assets (863) (416) (344)
Accounts payable (1,010) 3,648 9,274
Accrued and other liabilities (1,898) 671 (180)
Net cash provided by operating activities 13,601 8,471 8,132
Cash flows from investing activities:
Capital expenditures (19,747) (27,623) (23,886)
Purchase of the net assets of acquired entities — (11,486) —
Proceeds from sale of assets 211 6,816 9,292
Changes in nonoperating assets and liabilities (662) (650) (351)
Net cash used in investing activities (20,198) (32,943) (14,945)
Cash flows from financing activities:
Net (decrease) increase in debt under revolving credit agreements (50,500) 22,500 10,600
Cash dividends paid (424) — —
Proceeds from issuance of common stock 56,692 530 481
Net cash provided by financing activities 5,768 23,030 11,081
Net (decrease) increase in cash and cash equivalents (829) (1,442) 4,268
Cash and cash equivalents at beginning of year 13,232 14,674 10,406
Cash and cash equivalents at end of year $ 12,403 $ 13,232 $ 14,674
The accompanying notes are an integral part of the consolidated financial statements.

Notes to Consolidated Financial Statements Notes to Consolidated Financial Statements
38 SYPR SYPR 39
Note 1. Organization and Significant Accounting Policies
Consolidation Policy
The accompanying consolidated financial statements include the accounts of Sypris Solutions, Inc. and its wholly-owned
subsidiaries (collectively, "Sypris" or the "Company"). All significant intercompany accounts and transactions have been eliminated.
Nature of Business
Sypris is a diversified provider of outsourced services and specialty products. The Company performs a wide range of
manufacturing, engineering, design, testing, and other technical services, typically under multi-year, sole-source contracts with
corporations and government agencies in the markets for aerospace and defense electronics, truck components and assemblies,
and for users of test and measurement equipment.
As of January 1, 2002, the Company changed the name of its four major operating subsidiaries as part of a comprehensive
branding initiative. The new names of the four subsidiaries are Sypris Data Systems, Inc., formerly Metrum-Datatape, Inc.; Sypris
Electronics, LLC, formerly Group Technologies Corporation; Sypris Technologies, Inc., formerly Tube Turns Technologies, Inc.; and
Sypris Test and Measurement, Inc., formerly Bell Technologies, Inc., all of which are located in the U.S.
Use of Estimates
The preparation of the consolidated financial statements in conformity with accounting principles generally accepted in the U.S.
requires management to make estimates and assumptions that affect the amounts reported in the consolidated financial statements
and accompanying notes. Actual results could differ from those estimates.
Cash Equivalents
The Company considers all highly liquid investments with a maturity of three months or less when purchased to be cash equivalents.
Inventory
Contract inventory is stated at actual production costs, reduced by the cost of units for which revenue has been recognized. Gross
contract inventory is considered work in process. Progress payments under long-term contracts are specified in the contracts as a
percentage of cost and are liquidated as contract items are completed and shipped. Other inventory is stated at the lower of cost or
market. The first-in, first-out method was used for determining the cost of inventory excluding contract inventory and certain other
inventory, which was determined using the last-in, first-out method ("LIFO") (see Note 5). The Company’s reserve for excess and
obsolete inventory is primarily based upon forecasted demand for its product sales, and any change to the reserve arising from
forecast revisions is reflected in cost of sales in the period the revision is made.
Property, Plant and Equipment
Property, plant and equipment is stated on the basis of cost. Depreciation of property, plant and equipment is generally computed
using the straight-line method over their estimated economic lives. For land improvements, buildings and building improvements,
the estimated economic life is generally 40 years. Estimated economic lives range from three to fifteen years for machinery,
equipment, furniture and fixtures. Leasehold improvements are amortized over the respective lease term using the straight-line
method. Expenditures for maintenance, repairs and renewals of minor items are expensed as incurred. Major renewals and
improvements are capitalized.
Interest cost is capitalized for qualifying assets during the period in which the asset is being installed and prepared for its intended
use. Capitalized interest cost is amortized on the same basis as the related depreciation.
Goodwill
Beginning in 2002 with the adoption of Statement of Financial Accounting Standards ("SFAS") No. 142, "Goodwill and Other
Intangible Assets," goodwill is no longer amortized, but instead tested at least annually for impairment. Prior to 2002, goodwill was
amortized using the straight-line method over its estimated period of benefit of 15 years (see "Adoption of Recently Issued
Accounting Standards"). Goodwill is reported net of accumulated amortization totaling $4,146,000 at December 31, 2002 and 2001.
Long-lived Assets
Consistent with SFAS No. 144, "Accounting for the Impairment or Disposal of Long-Lived Assets," the Company evaluates long-lived
assets for impairment and assesses their recoverability based upon anticipated future cash flows. If facts and circumstances lead the
Company’s management to believe that the cost of one of its assets may be impaired, the Company will write down that carrying
amount to fair value to the extent necessary (see "Adoption of Recently Issued Accounting Standards").
Revenue Recognition
A portion of the Company’s business is conducted under long-term, fixed-price contracts with aerospace and defense companies
and agencies of the U.S. Government. Contract revenue is generally included in the consolidated income statements as units are
completed and shipped using the units of delivery, percentage of completion method of accounting. The costs attributed to contract
revenue are based upon the estimated average costs of all units to be shipped. The cumulative average costs of units shipped to
date are adjusted through current operations as estimates of future costs to complete change (see "Contract Accounting" below).
Revenue recognized under the percentage of completion method of accounting totaled approximately $120,424,000, $134,478,000
and $105,535,000 for the years ended December 31, 2002, 2001 and 2000, respectively. Substantially all such amounts were
accounted for under the units of delivery method. All other revenue is recognized as product is shipped and title passes, or when
services are rendered.
Contract Accounting
For long-term contracts, the Company capitalizes in inventory direct material, direct labor and factory overhead as incurred. The
Company also capitalizes certain general and administrative costs for estimating and bidding on contracts awarded (of which
approximately $105,000 and $210,000 remained in inventory at December 31, 2002 and 2001, respectively). Selling costs are
expensed as incurred. Costs to complete long-term contracts are estimated on a monthly basis. Estimated margins at completion
are applied to cumulative contract revenue to arrive at costs charged to operations.
Accounting for long-term contracts under the percentage of completion method involves substantial estimation processes,
including determining the estimated cost to complete a contract. As contracts may require performance over several accounting
periods, formal detailed costs-to-complete estimates are performed and updated monthly via performance reports. Management’s
estimates of costs-to-complete change due to internal and external factors, such as labor rate and efficiency variances, revised
estimates of warranty costs, estimated future material prices and customer specification and testing requirement changes. Changes
in estimated costs are reflected in gross profit in the period in which they are known. If increases in projected costs-to-complete are
sufficient to create a loss contract, the entire estimated loss is charged to operations in the period the loss first becomes known.
Product Warranty Costs
The provision for estimated warranty costs is recorded at the time of sale and periodically adjusted to reflect actual experience. The
accrued liability for warranty costs is included in the caption "Accrued liabilities" in the accompanying consolidated balance sheets.
Concentrations of Credit Risk
Financial instruments which potentially expose the Company to concentrations of credit risk consist of accounts receivable. The
Company’s customer base consists of various departments or agencies of the U.S. Government, aerospace and defense companies
under contract with the U.S. Government and a number of customers in diverse industries across geographic areas, primarily in
North America. The Company performs periodic credit evaluations of its customers’ financial condition and does not require
collateral on its commercial accounts receivable. Credit losses are provided for in the consolidated financial statements and
consistently have been within management’s expectations. Approximately 56% of accounts receivable outstanding at December 31,
2002 are due from four of the Company’s largest customers.
The Company recognized revenue from contracts with the U.S. Government and its agencies of approximately $44,185,000,
$40,046,000 and $45,467,000 during the years ended December 31, 2002, 2001 and 2000, respectively. The Company’s largest
customers for the year ended December 31, 2002 were Raytheon Company and Dana Corporation, which represented
approximately 19% and 14%, respectively, of the Company’s total net revenue. The Company’s largest customers for the year
ended December 31, 2001 were Raytheon Company and Honeywell International, Inc., which represented approximately 21% and
11%, respectively, of the Company’s total net revenue. For the year ended December 31, 2000, the Company’s largest customer
was Raytheon Company, which represented approximately 15% of the Company’s total net revenue. No other single customer
accounted for more than 10% of the Company’s total net revenue for the years ended December 31, 2002, 2001 or 2000.

Notes to Consolidated Financial Statements Notes to Consolidated Financial Statements
40 SYPR SYPR 41
Stock Based Compensation
Stock options are granted under various stock compensation programs to employees and independent directors (see Note 12).
The Company accounts for stock option grants in accordance with Accounting Principles Board Opinion No. 25, "Accounting for
Stock Issued to Employees" ("APB 25"). For purposes of pro forma disclosures, the estimated fair value of the options is amortized to
expense over the options’ vesting period. The Company’s pro forma information is as follows:
(in thousands, except for per share data)
Years ended December 31, 2002 2001 2000
Net income $ 11,439 $ 6,367 $ 3,184
Pro forma stock-based compensation expense, net of tax 1,591 1,390 1,098
Pro forma net income $ 9,848 $ 4,977 $ 2,086
Pro forma earnings per common share:Basic $ 0.75 $ 0.51 $ 0.22Diluted $ 0.72 $ 0.50 $ 0.21
Derivative Financial Instruments
In June 1998, the Financial Accounting Standards Board issued SFAS No. 133, "Accounting for Derivative Instruments and Hedging
Activities" and issued its amendments, SFAS No. 137 and 138, in June 1999 and June 2000, respectively. SFAS No. 133, and its
subsequent amendments, required the Company to recognize all derivatives on the consolidated balance sheet at fair value beginning
January 1, 2001. Derivatives that are not hedges must be adjusted to fair value through income. If the derivative is a hedge, depending
on the nature of the hedge, changes in the fair value of derivatives are either offset against the change in fair value of assets, liabilities,
or firm commitments through earnings or recognized in other comprehensive income until the hedged item is recognized in earnings.
The ineffective portion of a derivative’s change in fair value must be recognized currently in earnings. In 2001, the Company entered
into interest rate swap agreements, which are deemed to be effective hedges in accordance with SFAS No. 133 (see Note 8).
Adoption of Recently Issued Accounting Standards
In June 2001, the FASB issued SFAS No. 141, "Business Combinations." SFAS No. 141 requires all business combinations initiated
after June 30, 2001 to be accounted for using the purchase method of accounting. SFAS No. 141 also specifies criteria for the
recognition of identifiable intangible assets separately from goodwill. We will apply the provisions of SFAS No. 141 to all future
business combinations. The adoption of SFAS No. 141 on July 1, 2001 did not have an impact on the Company’s consolidated
financial statements.
Effective January 1, 2002, the Company adopted SFAS No. 142, "Goodwill and Other Intangible Assets." Under SFAS No. 142,
goodwill and indefinite lived intangible assets are no longer amortized but will be reviewed at least annually for impairment.
Separable intangible assets that are not deemed to have an indefinite life will continue to be amortized over their useful lives.
The nonamortization of goodwill has increased the Company’s net income and earnings per share beginning in 2002. Following
are pro forma results assuming goodwill had not been amortized prior to January 1, 2002:
(in thousands, except for per share data)
Years ended December 31, 2002 2001 2000
Reported net income $ 11,439 $ 6,367 $ 3,184Adjustment for amortization of goodwill, net of tax — 782 782
Adjusted net income $ 11,439 $ 7,149 $ 3,966
Basic earnings per common share as reported $ 0.87 $ 0.65 $ 0.33Adjustment for amortization of goodwill, net of tax — 0.08 0.08
Adjusted basic earnings per common share $ 0.87 $ 0.73 $ 0.41
Diluted earnings per common share as reported $ 0.84 $ 0.63 $ 0.32Adjustment for amortization of goodwill, net of tax — 0.08 0.08
Adjusted diluted earnings per common share $ 0.84 $ 0.71 $ 0.40
There has been no change to the carrying value of the Company’s goodwill since January 1, 2002. Goodwill, net of accumulated
amortization, at December 31, 2002 for the Electronics Group and the Industrial Group was approximately $13,837,000 and $440,000,
respectively. The Company’s other intangible assets subject to amortization and the related amortization expense are not material to
the Company’s consolidated financial position or results of operations, respectively.
Effective January 1, 2002, the Company adopted SFAS No. 144, "Accounting for the Impairment or Disposal of Long-Lived Assets."
SFAS No. 144 supersedes SFAS No. 121, "Accounting for the Impairment of Long-Lived Assets and for Long-Lived Assets to Be
Disposed Of," and the accounting and reporting provisions of Accounting Principles Board Opinion No. 30, "Reporting the Results of
Operations — Reporting the Effects of Disposal of a Segment of a Business, and Extraordinary, Unusual and Infrequently Occurring
Events and Transactions." SFAS No. 144 requires one accounting model to be used for long-lived assets to be disposed of by sale,
whether previously held or used or newly acquired, and it broadens the presentation of discontinued operations to include more
disposal transactions. Adoption of SFAS No. 144 did not impact the Company’s financial statements in 2002.
Reclassifications
Certain reclassifications have been made to the prior years’ financial statements to conform to the 2002 classification, none of
which had an effect on previously reported net income.
Note 2. Acquisitions and Mergers
On May 31, 2001, the Company acquired certain assets and liabilities of the Marion Forge plant from Dana Corporation. The
business produces fully machined, medium and heavy-duty truck axle shafts and other drive components for integration into
subassemblies and is included with Sypris Technologies in the Industrial Group. The transaction was accounted for as a purchase,
in which the purchase price of $11,486,000 was allocated based on the fair values of the assets and liabilities acquired. The results
of operations of the acquired business have been included in the consolidated financial statements since the acquisition date. The
acquisition was financed by the Company’s Credit Agreement (see Note 8).
Note 3. Special Charges
Special charges of $2,945,000 were recognized during the year ended December 31, 2000 for activities related to the consolidation
of certain operations within the Electronics Group. The special charges incurred and paid during 2000 include workforce reductions,
related severance and other benefit costs of $1,211,000, facilities rearrangement and relocation costs of $480,000, and employment
costs related to the transfer of production of $1,254,000. The workforce reductions resulted in the termination of 48 employees
involved in manufacturing, engineering, sales and administrative activities during 2000.
Note 4. Accounts Receivable
Accounts receivable consists of the following:
(in thousands)
December 31, 2002 2001
Commercial $ 34,108 $ 34,658U.S. Government 4,366 5,875
38,474 40,533
Allowance for doubtful accounts (523) (775)
$ 37,951 $ 39,758
Accounts receivable from the U.S. Government includes amounts due under long-term contracts, all of which are billed at
December 31, 2002 and 2001, of $2,930,000 and $2,939,000, respectively.
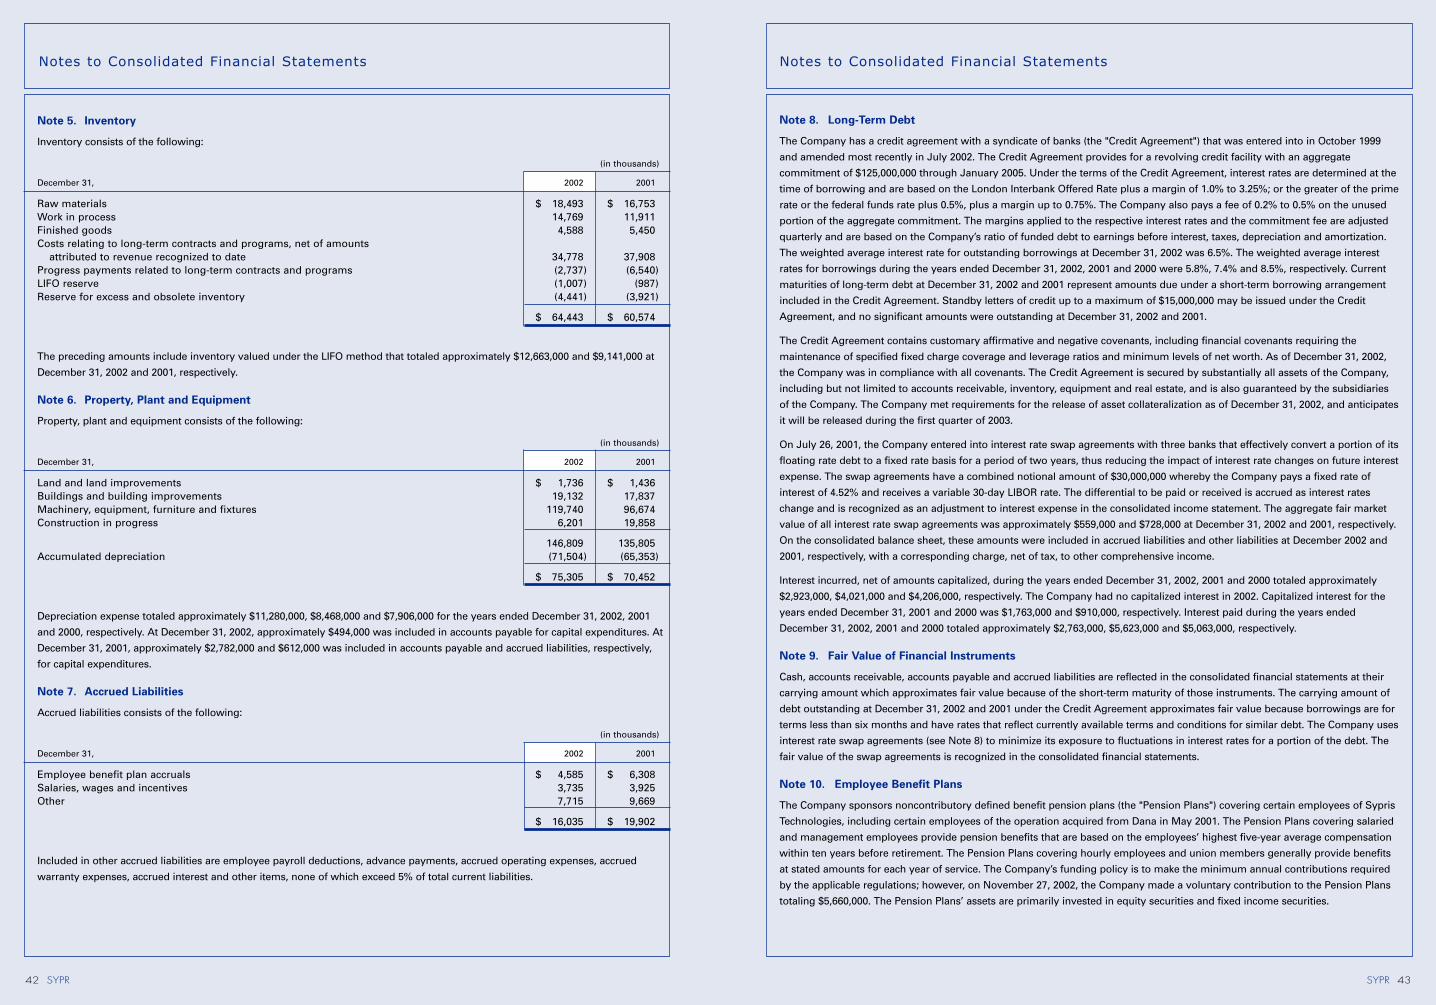
Notes to Consolidated Financial Statements Notes to Consolidated Financial Statements
42 SYPR SYPR 43
Note 8. Long-Term Debt
The Company has a credit agreement with a syndicate of banks (the "Credit Agreement") that was entered into in October 1999
and amended most recently in July 2002. The Credit Agreement provides for a revolving credit facility with an aggregate
commitment of $125,000,000 through January 2005. Under the terms of the Credit Agreement, interest rates are determined at the
time of borrowing and are based on the London Interbank Offered Rate plus a margin of 1.0% to 3.25%; or the greater of the prime
rate or the federal funds rate plus 0.5%, plus a margin up to 0.75%. The Company also pays a fee of 0.2% to 0.5% on the unused
portion of the aggregate commitment. The margins applied to the respective interest rates and the commitment fee are adjusted
quarterly and are based on the Company’s ratio of funded debt to earnings before interest, taxes, depreciation and amortization.
The weighted average interest rate for outstanding borrowings at December 31, 2002 was 6.5%. The weighted average interest
rates for borrowings during the years ended December 31, 2002, 2001 and 2000 were 5.8%, 7.4% and 8.5%, respectively. Current
maturities of long-term debt at December 31, 2002 and 2001 represent amounts due under a short-term borrowing arrangement
included in the Credit Agreement. Standby letters of credit up to a maximum of $15,000,000 may be issued under the Credit
Agreement, and no significant amounts were outstanding at December 31, 2002 and 2001.
The Credit Agreement contains customary affirmative and negative covenants, including financial covenants requiring the
maintenance of specified fixed charge coverage and leverage ratios and minimum levels of net worth. As of December 31, 2002,
the Company was in compliance with all covenants. The Credit Agreement is secured by substantially all assets of the Company,
including but not limited to accounts receivable, inventory, equipment and real estate, and is also guaranteed by the subsidiaries
of the Company. The Company met requirements for the release of asset collateralization as of December 31, 2002, and anticipates
it will be released during the first quarter of 2003.
On July 26, 2001, the Company entered into interest rate swap agreements with three banks that effectively convert a portion of its
floating rate debt to a fixed rate basis for a period of two years, thus reducing the impact of interest rate changes on future interest
expense. The swap agreements have a combined notional amount of $30,000,000 whereby the Company pays a fixed rate of
interest of 4.52% and receives a variable 30-day LIBOR rate. The differential to be paid or received is accrued as interest rates
change and is recognized as an adjustment to interest expense in the consolidated income statement. The aggregate fair market
value of all interest rate swap agreements was approximately $559,000 and $728,000 at December 31, 2002 and 2001, respectively.
On the consolidated balance sheet, these amounts were included in accrued liabilities and other liabilities at December 2002 and
2001, respectively, with a corresponding charge, net of tax, to other comprehensive income.
Interest incurred, net of amounts capitalized, during the years ended December 31, 2002, 2001 and 2000 totaled approximately
$2,923,000, $4,021,000 and $4,206,000, respectively. The Company had no capitalized interest in 2002. Capitalized interest for the
years ended December 31, 2001 and 2000 was $1,763,000 and $910,000, respectively. Interest paid during the years ended
December 31, 2002, 2001 and 2000 totaled approximately $2,763,000, $5,623,000 and $5,063,000, respectively.
Note 9. Fair Value of Financial Instruments
Cash, accounts receivable, accounts payable and accrued liabilities are reflected in the consolidated financial statements at their
carrying amount which approximates fair value because of the short-term maturity of those instruments. The carrying amount of
debt outstanding at December 31, 2002 and 2001 under the Credit Agreement approximates fair value because borrowings are for
terms less than six months and have rates that reflect currently available terms and conditions for similar debt. The Company uses
interest rate swap agreements (see Note 8) to minimize its exposure to fluctuations in interest rates for a portion of the debt. The
fair value of the swap agreements is recognized in the consolidated financial statements.
Note 10. Employee Benefit Plans
The Company sponsors noncontributory defined benefit pension plans (the "Pension Plans") covering certain employees of Sypris
Technologies, including certain employees of the operation acquired from Dana in May 2001. The Pension Plans covering salaried
and management employees provide pension benefits that are based on the employees’ highest five-year average compensation
within ten years before retirement. The Pension Plans covering hourly employees and union members generally provide benefits
at stated amounts for each year of service. The Company’s funding policy is to make the minimum annual contributions required
by the applicable regulations; however, on November 27, 2002, the Company made a voluntary contribution to the Pension Plans
totaling $5,660,000. The Pension Plans’ assets are primarily invested in equity securities and fixed income securities.
Note 5. Inventory
Inventory consists of the following:
(in thousands)
December 31, 2002 2001
Raw materials $ 18,493 $ 16,753Work in process 14,769 11,911Finished goods 4,588 5,450Costs relating to long-term contracts and programs, net of amounts
attributed to revenue recognized to date 34,778 37,908Progress payments related to long-term contracts and programs (2,737) (6,540)LIFO reserve (1,007) (987)Reserve for excess and obsolete inventory (4,441) (3,921)
$ 64,443 $ 60,574
The preceding amounts include inventory valued under the LIFO method that totaled approximately $12,663,000 and $9,141,000 at
December 31, 2002 and 2001, respectively.
Note 6. Property, Plant and Equipment
Property, plant and equipment consists of the following:
(in thousands)
December 31, 2002 2001
Land and land improvements $ 1,736 $ 1,436Buildings and building improvements 19,132 17,837Machinery, equipment, furniture and fixtures 119,740 96,674Construction in progress 6,201 19,858
146,809 135,805Accumulated depreciation (71,504) (65,353)
$ 75,305 $ 70,452
Depreciation expense totaled approximately $11,280,000, $8,468,000 and $7,906,000 for the years ended December 31, 2002, 2001
and 2000, respectively. At December 31, 2002, approximately $494,000 was included in accounts payable for capital expenditures. At
December 31, 2001, approximately $2,782,000 and $612,000 was included in accounts payable and accrued liabilities, respectively,
for capital expenditures.
Note 7. Accrued Liabilities
Accrued liabilities consists of the following:
(in thousands)
December 31, 2002 2001
Employee benefit plan accruals $ 4,585 $ 6,308Salaries, wages and incentives 3,735 3,925Other 7,715 9,669
$ 16,035 $ 19,902
Included in other accrued liabilities are employee payroll deductions, advance payments, accrued operating expenses, accrued
warranty expenses, accrued interest and other items, none of which exceed 5% of total current liabilities.

Notes to Consolidated Financial Statements Notes to Consolidated Financial Statements
44 SYPR SYPR 45
The Company sponsors a defined contribution plan (the "Defined Contribution Plan") for substantially all employees of the Company.
The Defined Contribution Plan is intended to meet the requirements of Section 401(k) of the Internal Revenue Code. The Defined
Contribution Plan allows the Company to match participant contributions and provides discretionary contributions. Contributions to
the Defined Contribution Plan in 2002, 2001 and 2000 totaled approximately $2,267,000, $1,933,000 and $2,278,000, respectively.
The Company has self-insured medical plans (the "Medical Plans") covering substantially all employees. The number of employees
participating in the Medical Plans was approximately 1,300, 1,350 and 1,300 at December 31, 2002, 2001 and 2000, respectively. The
Medical Plans limit the Company’s annual obligations to fund claims to specified amounts per participant and in the aggregate. The
Company is adequately insured for amounts in excess of these limits. Employees are responsible for payment of a portion of the
premiums. During 2002, 2001 and 2000, the Company charged approximately $6,677,000, $5,890,000 and $4,456,000, respectively, to
operations related to reinsurance premiums, medical claims incurred and estimated, and administrative costs for the Medical Plans.
Claims paid during 2002, 2001 and 2000 did not exceed the aggregate limits.
Note 11. Commitments and Contingencies
The Company leases certain of its real property and certain equipment, vehicles and computer hardware under operating leases
with terms ranging from month-to-month to ten years and which contain various renewal and rent escalation clauses. Future
minimum annual lease commitments under operating leases that have initial or remaining noncancelable lease terms in excess of
one year as of December 31, 2002 are as follows:
(in thousands)
2003 $ 6,9352004 6,4682005 5,7532006 5,1792007 9,5372008 and thereafter 138
$ 34,010
Rent expense for the years ended December 31, 2002, 2001 and 2000 totaled approximately $7,387,000, $5,550,000 and $3,650,000,
respectively.
The Company entered into agreements for the sale and leaseback of certain specific manufacturing and testing equipment during
2001 and 2000. The terms of the operating leases range from five to nine years and the Company has the option to purchase the
equipment at the expiration of the respective lease term at a fixed price based upon the equipment’s estimated residual value. Lease
payments on these operating leases are guaranteed by the Company. Proceeds from the sale and leaseback transactions during 2001
and 2000 were approximately $5,420,000 and $9,251,000, respectively, and the transactions resulted in a deferred loss for the years
ended December 31, 2001 and 2000 of approximately $787,000 and $351,000, respectively, that is amortized on a straight-line basis
over the term of the respective leases. As of December 31, 2002, the deferred loss net of amortization was approximately $1,039,000.
Future minimum annual lease commitments related to these leases are included in the above schedule.
As of December 31, 2002, the Company had outstanding purchase commitments of approximately $2,800,000, primarily for the
acquisition of manufacturing equipment.
The Company’s Sypris Technologies subsidiary is a co-defendant in a lawsuit arising out of an explosion at a coker plant owned by
Exxon Mobil Corporation located in Baton Rouge, Louisiana. In this lawsuit, it is alleged that a carbon steel pipe elbow that Sypris
Technologies manufactured was improperly installed and the failure of which caused the explosion. In the third quarter of 2002, the
Company obtained a summary judgment in its favor, which is now final and nonappealable, in a related lawsuit brought by Exxon
Mobil in 1994 in state district court in Louisiana claiming damages for destruction of the plant. The pending action is a class action
suit also filed in 1994 in federal court in Louisiana on behalf of the residents living around the plant and claims unspecified damages.
Sypris Technologies is a co-defendant in this action with Exxon Mobil, the contractor and the fabricator. In this action, the Company
maintains that the carbon steel pipe elbow at issue was appropriately marked as carbon steel and was improperly installed, without
Sypris Technologies’ knowledge, by the fabricator and general contractor in circumstances that required the use of a chromium steel
elbow. As to all claims in the pending suit, the Company has received favorable summary judgment rulings, but some of such
rulings remain subject to appeal. The Company is optimistic that the judgments in its favor will be upheld or become final.
The following table details the components of pension expense:
(in thousands)
Years ended December 31, 2002 2001 2000
Service cost $ 172 $ 358 $ 180Interest cost on projected benefit obligation 2,306 1,939 1,409Net amortizations and deferrals 339 247 222Expected return on plan assets (2,329) (1,961) (1,338)
$ 488 $ 583 $ 473
The following are summaries of the changes in the benefit obligations and plan assets and of the funded status of the Pension Plans:
(in thousands)
December 31, 2002 2001
Change in benefit obligation:Benefit obligation at beginning of year $ 31,983 $ 19,096Benefit obligation assumed in acquisition — 11,547Service cost 172 358Interest cost 2,306 1,939Actuarial loss 2,394 463Benefits paid (1,618) (1,420)
Benefit obligation at end of year $ 35,237 $ 31,983
Change in plan assets:Fair value of plan assets at beginning of year $ 24,789 $ 15,156Fair value of plan assets acquired in acquisition — 10,457Actual return on plan assets (1,142) (158)Company contributions 7,451 754Benefits paid (1,618) (1,420)
Fair value of plan assets at end of year $ 29,480 $ 24,789
Funded status of the plans:Benefit obligation at end of year $ 35,237 $ 31,983Fair value of plan assets at end of year 29,480 24,789
Funded status of plan (underfunded) (5,757) (7,194)Unrecognized actuarial loss 8,074 2,339Unrecognized prior service cost 694 903
Net asset (liability) recognized $ 3,011 $ (3,952)
Balance sheet assets (liabilities):Accrued benefit liability $ (5,661) $ (7,160)Prepaid benefit cost 4,876 —Intangible asset 36 903Accumulated other comprehensive loss 3,760 2,305
Net asset (liability) recognized $ 3,011 $ (3,952)
Assumptions at year end:Discount rate used in determining present values 6.75% 7.50%Rate of compensation increase 4.00% 4.00%Expected long-term rate of return on plan assets 8.50% 9.50%

Notes to Consolidated Financial Statements Notes to Consolidated Financial Statements
46 SYPR SYPR 47
The Company is involved in certain litigation and contract issues arising in the normal course of business. While the outcome of
these matters cannot, at this time, be predicted in light of the uncertainties inherent therein, management does not expect that
these matters will have a material adverse effect on the consolidated financial position or results of operations of the Company.
Note 12. Stock Option and Purchase Plans
The Company has certain stock compensation plans under which options to purchase common stock may be granted to officers,
key employees and non-employee directors. Options may be granted at not less than the market price on the date of grant. Options
are exercisable in whole or in part up to two years after the date of grant and ending ten years after the date of grant. The following
table summarizes option activity for the three years ended December 31, 2002:
Weighted
Average
Exercise Exercise
Shares Price Range Price
Balance at January 1, 2000 1,312,460 $ 1.72 - 31.00 $ 6.71Granted 518,746 6.56 - 10.50 9.52Exercised (114,246) 2.76 - 8.75 4.08Forfeited (163,223) 4.24 - 10.50 7.20
Balance at December 31, 2000 1,553,737 1.72 - 31.00 7.79Granted 632,819 3.88 - 13.27 6.15Exercised (164,616) 1.72 - 8.75 3.06Forfeited (174,980) 6.25 - 11.76 8.21
Balance at December 31, 2001 1,846,960 1.72 - 31.00 7.61Granted 362,391 9.95 - 19.00 14.32Exercised (127,561) 1.72 - 10.50 6.23Forfeited (144,425) 6.25 - 16.03 9.39
Balance at December 31, 2002 1,937,365 $ 1.72 - 31.00 $ 8.83
The following table summarizes certain weighted average data for options outstanding and currently exercisable at December 31, 2002:
Outstanding Exercisable
Weighted AverageWeighted
Remaining Average
Exercise Contractual Exercise
Exercise Price Range Shares Price Life Shares Price
$1.72 - $5.00 184,402 $ 3.84 5.0 155,027 $ 3.65$5.12 - $7.00 490,693 6.16 6.1 41,218 6.34$7.37 - $10.00 753,351 8.68 5.0 484,601 8.72$10.06 - $15.00 406,881 12.34 6.5 56,442 11.24$15.59 - $20.00 96,550 17.24 8.0 51,550 18.30$23.00 - $31.00 5,488 27.38 2.3 5,488 27.38
Total 1,937,365 $ 8.83 5.7 794,326 $ 8.54
The Company’s stock compensation program also provides for the grant of performance-based stock options to key employees
("Performance Options"). The terms and conditions of the Performance Options grants provide for the determination of the exercise
price and the beginning of the vesting period to occur when the fair market value of the Company’s common stock achieves certain
targeted price levels. The Company did not grant Performance Options in 2002. Performance Options to purchase 56,000 shares
and 108,000 shares of common stock were granted during 2001 and 2000, respectively. Performance Options to purchase 49,000
shares, 32,000 shares and 112,000 shares of common stock were forfeited in 2002, 2001 and 2000, respectively. One targeted price
level of the Performance Options was achieved in 2002, resulting in determination of the exercise price and beginning of the
vesting period for options to purchase 52,000 shares of common stock. Performance Options for which the targeted price level has
not been achieved total 315,000 shares, 416,000 shares and 392,000 shares at December 31, 2002, 2001 and 2000, respectively, and
are excluded from disclosures of options outstanding.
The aggregate number of shares of common stock reserved for issuance under the Company’s stock compensation programs as of
December 31, 2002 and 2001 was 4,750,000 and 3,000,000, respectively. The aggregate number of shares available for future grant
as of December 31, 2002 and 2001 was 2,013,261 and 380,227, respectively. Shares available for future grant as of December 31,
2002 includes 141,550 shares of common stock related to stock options that may be subject to future grant under certain of the
Company’s incentive plans based upon the achievement of certain financial targets and individual performance objectives and
action by the Company’s Board of Directors.
The Company applies APB 25 and related interpretations in accounting for its employee stock options because, as discussed below,
the alternative fair value accounting provided for under SFAS No. 123, "Accounting for Stock-Based Compensation," requires use of
option valuation models that were not developed for use in valuing employee stock options. Under APB 25, when the exercise
price of the Company’s employee stock options is at least equal to the market price of the underlying stock on the date of grant, no
compensation expense is recognized.
Pro forma information regarding net income and earnings per share is required by SFAS No. 123, and has been determined as if
the Company had accounted for its employee stock options under the fair value method of SFAS No. 123. The fair value for options
granted by the Company during 2002, 2001 and 2000 were estimated at the date of grant using a Black-Scholes option pricing
model with the following weighted-average assumptions:
Years ended December 31, 2002 2001 2000
Expected life (years) 7 8 8Expected volatility 74.79% 75.20% 70.30%Risk-free interest rates 3.83% 4.93% 4.98%Expected dividend yield 1.09% — —
The weighted average Black-Scholes value of options granted under the stock option plans during 2002, 2001 and 2000 was $9.39,
$4.71 and $7.05 per share, respectively.
The Black-Scholes option valuation model was developed for use in estimating the fair value of traded options that have no vesting
restrictions and are fully transferable. In addition, option valuation models require the input of highly subjective assumptions
including the expected stock price volatility. Because the Company’s employee stock options have characteristics significantly
different from those of traded options, and because changes in the subjective input assumptions can materially affect the fair value
estimate, in management’s opinion, the existing models do not necessarily provide a reliable single measure of the fair value of its
employee stock options.
The Company has a stock purchase plan that provides substantially all employees who have satisfied the eligibility requirements
the opportunity to purchase shares of the Company’s common stock on a compensation deduction basis. The purchase price is the
lower of 85% of the fair market value of the common stock on the first or last business day of the purchase period. Payroll
deductions may not exceed $6,000 for any six-month cycle. The stock purchase plan expires January 31, 2006. At December 31,
2002 and 2001, there were 159,209 shares and 196,904 shares, respectively, available for purchase under the plan. During 2002,
2001 and 2000, a total of 37,695 shares, 52,206 shares and 35,290 shares, respectively, were issued under the plan.

Notes to Consolidated Financial Statements Notes to Consolidated Financial Statements
48 SYPR SYPR 49
Note 13. Stockholders’ Equity
On March 26, 2002, the Company completed a public stock offering of 3,600,000 shares of its common stock and, on April 19, 2002,
an additional 500,000 shares were issued through the exercise of an over-allotment option. The shares were sold at $14.50 per
share and generated proceeds, after underwriting discounts and expenses, of approximately $55,656,000. Proceeds from the
offering were primarily used to repay debt. On May 7, 2002, the Company's stockholders approved an amendment to increase the
Company’s authorized common stock from 20,000,000 shares to 30,000,000 shares.
On September 12, 2002, the Company’s Board of Directors declared an initial quarterly cash dividend of $0.03 (three cents)
per common share outstanding that was paid on November 15, 2002. On October 29, 2002, the Company’s Board of Directors
declared an additional quarterly cash dividend of $0.03 (three cents) per common share outstanding. The dividend was paid on
January 10, 2003.
The Company has a stockholder rights plan, under which each stockholder owns one right for each outstanding share of common
stock owned. Each right entitles the holder to purchase one one-thousandth of a share of a new series of preferred stock at an
exercise price of $63.00. The rights trade along with, and not separately from, the shares of common stock unless they become
exercisable. If any person or group acquires or makes a tender offer for 15% or more of the common stock of the Company (except
in transactions approved by the Company’s Board of Directors in advance) the rights become exercisable, and they will separate,
become tradable, and entitle stockholders, other than such person or group, to acquire, at the exercise price, preferred stock with a
market value equal to twice the exercise price. If the Company is acquired in a merger or other business combination with such
person or group, or if 50% of its earning power or assets are sold to such person or group, each right will entitle its holder, other
than such person or group, to acquire, at the exercise price, shares of the acquiring company’s common stock with a market value
of twice the exercise price. The rights will expire on October 23, 2011, unless redeemed or exchanged earlier by the Company, and
will be represented by existing common stock certificates until they become exercisable.
As of December 31, 2002, 18,400 shares of the Company’s preferred stock were designated as Series A Preferred Stock in
connection with the adoption of the stockholder rights plan. There are no shares of Series A Preferred Stock currently outstanding.
The holders of Series A Preferred Stock will have voting rights, be entitled to receive dividends based on a defined formula and
have certain rights in the event of the Company’s dissolution. The shares of Series A Preferred Stock shall not be redeemable.
However, the Company may purchase shares of Series A Preferred Stock in the open market or pursuant to an offer to a holder or
holders.
Cumulative losses recorded in other comprehensive income for adjustments in the minimum pension liability, net of tax, totaled
$2,350,000, $1,477,000 and $353,000 at December 31, 2002, 2001 and 2000, respectively. Cumulative amounts recorded in other
comprehensive income for the aggregate fair market value of all swap agreements, net of tax, totaled $349,000 and $419,000 at
December 31, 2002 and 2001, respectively.
Note 14. Income Taxes
The Company accounts for income taxes in accordance with SFAS No. 109, "Accounting for Income Taxes." Accordingly, deferred
income taxes have been provided for temporary differences between the recognition of revenue and expenses for financial and income
tax reporting purposes and between the tax basis of assets and liabilities and their reported amounts in the financial statements.
The components of income tax expense (benefit) are as follows:
(in thousands)
Years ended December 31, 2002 2001 2000
Current:Federal $ 1,184 $ 2,161 $ 969State 45 255 102Other 21 15 9
1,250 2,431 1,080
Deferred:Federal 3,427 706 (2,351)State 257 (227) (127)
3,684 479 (2,478)
$ 4,934 $ 2,910 $ (1,398)
The Company files a consolidated federal income tax return which includes all subsidiaries. Income taxes paid during 2002, 2001
and 2000 totaled approximately $3,656,000, $1,962,000 and $1,347,000, respectively. The Company received approximately
$208,000, $2,108,000 and $2,102,000 in federal income tax refunds during 2002, 2001 and 2000, respectively.
At December 31, 2002, the Company had approximately $12,013,000 of state net operating loss carryforwards available to offset future
state taxable income. Such carryforwards reflect income tax losses incurred which will expire on December 31 of the following years:
(in thousands)
2009 $ 4,9902010 5602011 5,9992017 464
$ 12,013
The following is a reconciliation of income tax expense (benefit) to that computed by applying the federal statutory rate of 34% to
income before income taxes:
(in thousands)
Years ended December 31, 2002 2001 2000
Federal tax at the statutory rate $ 5,567 $ 3,154 $ 607State income taxes, net of federal tax benefit 646 238 153Change in valuation allowance for deferred tax asset (677) (300) (3,008)Research and development tax credit (330) (338) (262)Other (272) 156 1,112
$ 4,934 $ 2,910 $ (1,398)

Notes to Consolidated Financial Statements Notes to Consolidated Financial Statements
50 SYPR SYPR 51
Deferred income tax assets and liabilities are as follows:
(in thousands)
December 31, 2002 2001
Deferred tax assets:Compensation and benefit accruals $ 1,190 $ 1,287Inventory valuation 1,042 728State net operating loss carryforwards 689 977Contract provisions 572 517Accounts receivable allowance 199 290Defined benefit pension plan — 1,451Interest rate swap agreements 210 309Other 103 303
4,005 5,862Valuation allowance — (677)
4,005 5,185Deferred tax liabilities:
Depreciation (4,115) (2,354)Defined benefit pension plan (258) —
(4,373) (2,354)
Net deferred tax (liability) asset $ (368) $ 2,831
The valuation allowance for deferred tax assets decreased by $677,000, $300,000 and $3,008,000 in 2002, 2001 and 2000,
respectively. Management believes it is more likely than not that the Company’s future earnings will be sufficient to ensure the
realization of deferred tax assets for federal and state purposes.
Note 15. Earnings per Common Share
Basic earnings per common share is calculated by dividing net income available to common stockholders by the weighted average
number of common shares outstanding during the year. Diluted earnings per common share is calculated by using the weighted
average number of common shares outstanding adjusted to include the potentially dilutive effect of outstanding stock options.
The following table presents information necessary to calculate earnings per common share:
(in thousands, except for per share data)
Years ended December 31, 2002 2001 2000
Shares outstanding:Weighted average shares outstanding 13,117 9,828 9,671Effect of dilutive employee stock options 547 200 293
Adjusted weighted average shares outstanding and assumed conversions 13,664 10,028 9,964
Net income applicable to common stock $ 11,439 $ 6,367 $ 3,184
Earnings per common share:Basic $ 0.87 $ 0.65 $ 0.33Diluted $ 0.84 $ 0.63 $ 0.32
Note 16. Segment Information
The Company’s operations are conducted in two reportable business segments: the Electronics Group and the Industrial Group.
The segments are each managed separately because of the distinctions between the products, services, markets, customers,
technologies, and workforce skills of the segments. The Electronics Group provides a wide range of manufacturing and technical
services for a diversified customer base as an outsourced service provider. The Electronics Group also manufactures complex
data storage systems, magnetic instruments, current sensors, and other electronic products. The Industrial Group provides
manufacturing services for a variety of customers that outsource forged and finished steel components and subassemblies.
The Industrial Group also manufactures high-pressure closures and other fabricated products. Revenue derived from outsourced
services for the Electronics Group accounted for 55%, 67% and 65% of total net revenue in 2002, 2001 and 2000, respectively.
Revenue derived from outsourced services for the Industrial Group accounted for 29%, 15% and 12% of total net revenue in 2002,
2001 and 2000, respectively. There was no intersegment net revenue recognized for all years presented. The following table
presents financial information for the reportable segments of the Company:
(in thousands)
Years ended December 31, 2002 2001 2000
Net revenue from unaffiliated customers:Electronics Group $ 186,562 $ 207,282 $ 182,126Industrial Group 86,915 47,358 34,445
$ 273,477 $ 254,640 $ 216,571
Gross profit:Electronics Group $ 37,796 $ 37,385 $ 36,272Industrial Group 11,725 6,162 4,041
$ 49,521 $ 43,547 $ 40,313
Operating income:Electronics Group $ 14,447 $ 12,903 $ 6,935Industrial Group 8,210 3,563 1,648General, corporate and other (3,701) (3,436) (3,106)
$ 18,956 $ 13,030 $ 5,477
Total assets:Electronics Group $ 114,305 $ 121,228 $ 124,523Industrial Group 90,781 73,820 37,851General, corporate and other 18,519 16,396 16,748
$ 223,605 $ 211,444 $ 179,122
Depreciation and amortization:Electronics Group $ 6,885 $ 7,951 $ 8,037Industrial Group 4,224 1,694 1,109General, corporate and other 277 211 205
$ 11,386 $ 9,856 $ 9,351
Capital expenditures:Electronics Group $ 7,518 $ 7,917 $ 7,971Industrial Group 12,009 19,547 15,546General, corporate and other 220 159 369
$ 19,747 $ 27,623 $ 23,886
The Company’s export sales from the U.S. totaled $25,437,000, $23,890,000 and $25,250,000 in 2002, 2001 and 2000, respectively.

Notes to Consolidated Financial Statements
52 SYPR
Note 17. Quarterly Financial Information (Unaudited)
The following is an analysis of certain items in the consolidated income statements by quarter for the years ended December 31,
2002 and 2001:
(in thousands, except for per share data)
2002 2001
First Second Third Fourth First Second Third Fourth
Net revenue $ 62,533 $ 73,509 $ 70,757 $ 66,678 $ 58,035 $ 63,152 $ 65,228 $ 68,225Gross profit 11,129 12,882 13,974 11,536 10,164 10,914 11,063 11,406Operating income 3,733 4,759 5,658 4,806 2,577 2,912 3,501 4,040Net income 1,825 2,805 3,534 3,275 1,019 1,209 1,760 2,379Earnings per
common share:Basic $ 0.18 $ 0.20 $ 0.25 $ 0.23 $ 0.10 $ 0.12 $ 0.18 $ 0.24Diluted $ 0.17 $ 0.19 $ 0.24 $ 0.23 $ 0.10 $ 0.12 $ 0.18 $ 0.23
Cash dividends declared per common share $ — $ — $ 0.03 $ 0.03 $ — $ — $ — $ —
Our common stock is traded on the Nasdaq National Market under the symbol "SYPR." The following table sets forth, for the
periods indicated, the high and low closing sale prices per share of our common stock as reported by the Nasdaq National Market.
High Low
Year ended December 31, 2001:First Quarter $ 8.00 $ 4.00Second Quarter $ 8.22 $ 3.75Third Quarter $ 10.55 $ 7.50Fourth Quarter $ 13.46 $ 9.80
Year ended December 31, 2002:First Quarter $ 16.35 $ 12.50Second Quarter $ 21.35 $ 15.30Third Quarter $ 16.03 $ 10.00Fourth Quarter $ 12.28 $ 9.94
As of February 24, 2003 there were 816 holders of record of our common stock.
On September 22, 2002, our Board of Directors declared an initial quarterly cash dividend of $0.03 (three cents) per common share
outstanding. Cash dividends declared in 2002 totaled $0.06 (six cents) per common share outstanding. Dividends may be paid on
common stock only when, as, and if declared by our Board of Directors in its sole discretion.
Common Stock Information
Corporate Directory
Board of Directors
ROBERT E. GILL (1†)Chairman of the Board
JEFFREY T. GILL (1)President & CEO
HENRY F. FRIGON (1,2†, 4)Private Investor & Consultant
R. SCOTT GILL (1)Managing BrokerKoenig & Strey GMAC Real Estate
WILLIAM L. HEALEY (4†)President & CEOCal Quality Electronics, Inc.
ROGER W. JOHNSON (3†, 4)Private Investor, Educator & Consultant
SIDNEY R. PETERSEN (2, 3)Retired Chairman & CEOGetty Oil, Inc.
ROBERT SROKA (2, 3)Managing PartnerLighthouse Partners, LLC
Corporate Officers
ROBERT E. GILL (5)Chairman of the Board
JEFFREY T. GILL (5)President & CEO
DAVID D. JOHNSON (5)Vice President, CFO& Treasurer
RICHARD L. DAVIS (5)Senior Vice President& Secretary
ANTHONY C. ALLEN (5)Vice President of Finance and Information Systems& Assistant Secretary
Subsidiary Officers
CYNTHIA Y. BELAKVice President of FinanceSypris Data Systems, Inc.
JAMES G. COCKE (5)Vice President; President & CEOSypris Electronics, LLC
STUART W. JONESVice President of FinanceSypris Test & Measurement, Inc.
JOHN M. KRAMER (5)Vice President; President & CEOSypris Technologies, Inc.
ROBERT G. MARRAHVice President of BusinessDevelopmentSypris Electronics, LLC
DAVID L. MONACOVice President of FinanceSypris Electronics, LLC
G. DARRELL ROBERTSON (5)Vice President; President & CEOSypris Data Systems, Inc.
EDMUND R. STUCZYNSKIVice President of OperationsSypris Electronics, LLC
NORMAN E. ZELESKYVice President of FinanceSypris Technologies, Inc.(1) Member of Executive Committee
(2) Member of Compensation Committee
(3) Member of Audit and Finance Committee
(4) Member of Nominating and Governance Committee
(5) Executive Officer
† Committee Chairman
SYPR 53

Company Locations
ALABAMASypris Data Systems
3322 S. Memorial ParkwaySuite 505Huntsville, AL 35801Phone: (256) 881-2231
ARIZONASypris Test & Measurement
2320 West Peoria AvenueBuilding D-133Phoenix, AZ 85029Phone: (602) 395-5900
CALIFORNIASypris Test & Measurement
2102 Ringwood AvenueSan Jose, CA 95131Phone: (408) 954-8050
Sypris Test & Measurement
16340 Roscoe Boulevard Suite 100Van Nuys, CA 91406Phone: (818) 830-9111
Sypris Data Systems
Subsidiary Headquarters605 East Huntington DriveMonrovia, CA 91016Phone: (626) 358-9500
COLORADOSypris Data Systems
7307 S. Revere ParkwayCentennial, CO 80112Phone: (303) 773-4700
Sypris Test & Measurement
8020 Southpark CircleSuite 300Littleton, CO 80120Phone: (303) 773-4616
FLORIDASypris Test & Measurement
Subsidiary Headquarters6120 Hanging Moss RoadOrlando, FL 32807Phone: (407) 678-6900
Sypris Electronics
Subsidiary Headquarters10901 North McKinley DriveTampa, FL 33612Phone: (813) 972-6000
Sypris Data Systems
2460 N. Courtney ParkwaySuite 107Merritt Island, FL 32953Phone: (321) 449-9243
Sypris Data Systems
8 Eighth StreetShalimar, FL 32579Phone: (850) 651-5158
GEORGIASypris Test & Measurement
1000 Cobb Place BoulevardBuilding 200Suite 240Kennesaw, GA 30144Phone: (770) 795-8092
ILLINOISSypris Test & Measurement
2055 Army Trail RoadSuite 108Addison, IL 60101Phone: (630) 620-5800
KENTUCKYSypris Solutions, Inc.
Corporate Headquarters101 Bullitt LaneSuite 450Louisville, KY 40222Phone: (502) 329-2000
Sypris Technologies
Subsidiary Headquarters2820 West BroadwayLouisville, KY 40211Phone: (502) 774-6011
Sypris Technologies
Tube Turns Division2612 Howard StreetLouisville, KY 40211Phone: (502) 774-6011
MARYLANDSypris Test & Measurement
9020 Junction DriveSuite 3Annapolis Junction, MD 20701Phone: (301) 483-9753
Sypris Data Systems
9020 Junction DriveAnnapolis Junction, MD 20701Phone: (301) 470-0110
MASSACHUSETTSSypris Test & Measurement
53 Second AvenueBurlington, MA 01803Phone: (781) 272-9050
Sypris Test & Measurement
257 Simarano DriveMarlborough, MA 01752Phone: (508) 786-9633
MICHIGANSypris Test & Measurement
24301 Catherine Industrial RoadSuite 116Novi, MI 48375Phone: (248) 305-5200
NEW JERSEYSypris Test & Measurement
650 Liberty AvenueUnion, NJ 07083Phone: (908) 688-9779
Sypris Test & Measurement
1133 Route 23 SouthWayne, NJ 07470Phone: (973) 628-1363
NEW YORKSypris Test & Measurement
c/o Delphi Harrison200 Upper Mountain RoadBuilding 6Lockport, NY 14094Phone: (716) 438-4584
OHIOSypris Technologies
1550 Marion Agosta RoadMarion, OH 43302Phone: (740) 383-2111
Sypris Test & Measurement
925 Keynote CircleBrooklyn Heights, OH 44131Phone: (216) 741-7040
Sypris Test & Measurement
3148 Presidential DriveFairborn, OH 45234Phone: (937) 427-3444
SOUTH CAROLINASypris Test & Measurement
c/o Square D8821 Garners Ferry RoadHopkins, SC 29061Phone: (803) 695-7874
Sypris Test & Measurement
c/o Bose Facility2000 Carolina Pines DriveBlythewood, SC 29016Phone: (803) 714-8397
TENNESSEESypris Test & Measurement
305 Seaboard LaneSuite 318Franklin, TN 37067Phone: (615) 771-2421
TEXASSypris Test & Measurement
258 East ArapahoSuite 150Richardson, TX 75081Phone: (972) 231-4443
Sypris Data Systems
8500 Dyer StreetSuite 65El Paso, TX 79904Phone: (915) 757-2547
Sypris Technologies
9801 Westheimer DriveSuite 302Houston, TX 77042Phone: (713) 917-6878
CORPORATE ADDRESSSypris Solutions, Inc.101 Bullitt LaneSuite 450Louisville, KY 40222Phone: (502) 329-2000Fax: (502) 329-2050
ANNUAL MEETINGThe Annual Meeting of Stockholders willbe held on Tuesday, April 29, 2003, at10:00 a.m. at 101 Bullitt Lane, LowerLevel Seminar Room, Louisville, Kentucky.
FOR MORE INFORMATIONTo learn more about Sypris Solutions, Inc.,visit our site on the World Wide Web atwww.sypris.com.
INVESTOR MATERIALS
The Sypris Web page – www.sypris.com– is your entry point for a vast array ofinformation about Sypris, including itsproducts, financial information, real-time stock quotes, links to each of its subsidiary operations, corporategovernance information and other useful information.
For investor information, including additional annual reports, 10-Ks, 10-Qs or any other financial literature, pleasecontact Carroll A. Dunavent, Director ofLegal and Corporate Services, 101 BullittLane, Suite 450, Louisville, KY 40222.
SYPRIS ON NASDAQThe common stock of Sypris trades on the Nasdaq National Market under the symbol SYPR.
TRANSFER AGENTLaSalle Bank N.A.135 South LaSalle StreetSuite 1811Chicago, IL 60603Phone: (800) 246-5761Fax: (312) 904-2236
INDEPENDENT AUDITORSErnst & Young LLP400 West Market StreetSuite 2100Louisville, KY 40202Phone: (502) 585-1400Fax: (502) 584-4221
CORPORATE COUNSELWyatt, Tarrant & Combs, LLP2800 PNC PlazaLouisville, KY 40202Phone: (502) 589-5235Fax: (502) 589-0309
FORWARD LOOKING STATEMENTSThis annual report may contain projections and other forward-looking statements within the meaningof Section 21E of the Securities Exchange Act of 1934. These projections and statements reflect ourcurrent views with respect to future events and financial performance. No assurance can be given,however, that these events will occur or that these projections will be achieved and actual results could differ materially from those projected as a result of certain factors. These factors include ourdependence on our current management; the risks and uncertainties present in our business, includingchanges in laws or regulations; business conditions and growth in the general economy and the electronics and industrial markets served by us; competitive factors and price pressures; availability of third party component parts at reasonable prices; inventory risks due to shifts in market demandand/or price erosion of purchased components; changes in product mix; cost and yield issues associated with our manufacturing facilities; the ability to successfully manage growth; the effects(including possible increases in the cost of doing business) resulting from future war and terroristsactivities or political uncertainties; as well as other factors included in our periodic reports filed withthe Securities and Exchange Commission.
INVESTOR INFORMATION
54 SYPR