Embed Size (px)
Citation preview
Thomas C. Lambert President & CEO
ACCESSIBILITY AND SPECIAL ACCOMMODATIONS METRO’s meetings are held in a facility accessible to persons with disabilities. Request for accommodations should be directed to the Board Office at 713-739-4834 at least 48 hours in advance of the meeting.
SECURITY Individuals attending this meeting will be subject to being scanned with a security wand and/or metal detector walk through. You and your property are subject to being searched.
FINANCE and AUDIT
COMMITTEE MEMBERS Cindy Siegel, Chair
Sanjay Ramabhadran Lisa Castañeda
Troi Taylor
Notice and Agenda of a Meeting of the Finance and Audit Committee
of the METRO Board of Directors
Metropolitan Transit Authority of Harris County, Texas Lee P. Brown METRO Administration Building
1900 Main Street, 2nd Floor Board Room, Houston, TX 77002 Thursday, July 19, 2018 at 3:00 p.m.
ACTIONS
1. Request Board approval to accept the monthly committee reports, including the investmentreportA. Smiley
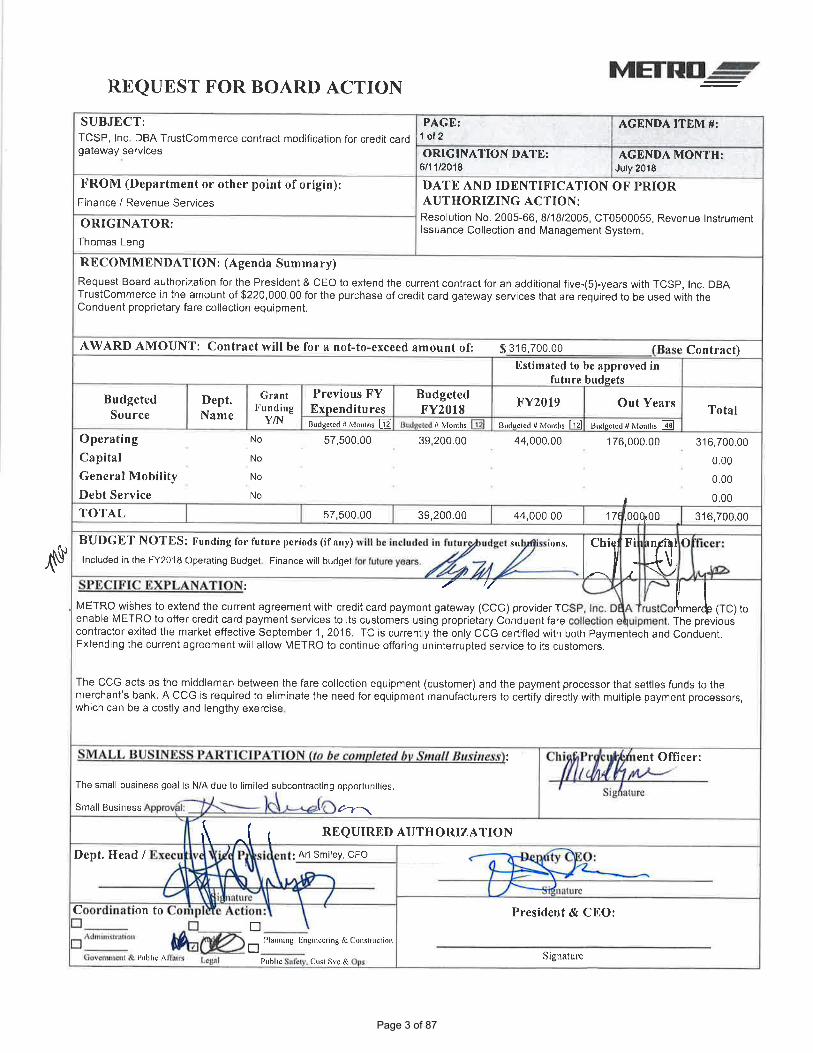
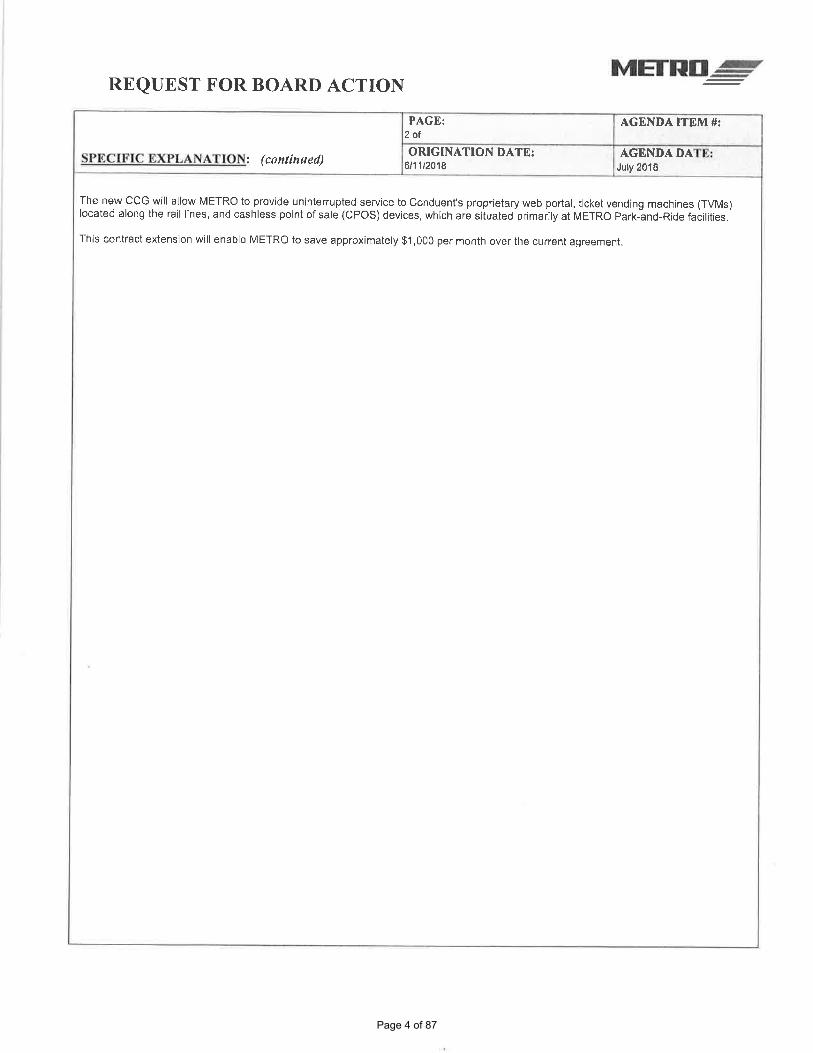
2. Request Board authorization for the President & CEO to modify the contract with TSCP, Inc.DBA Trust Commerce for the purchase of credit card gateway servicesA. Smiley
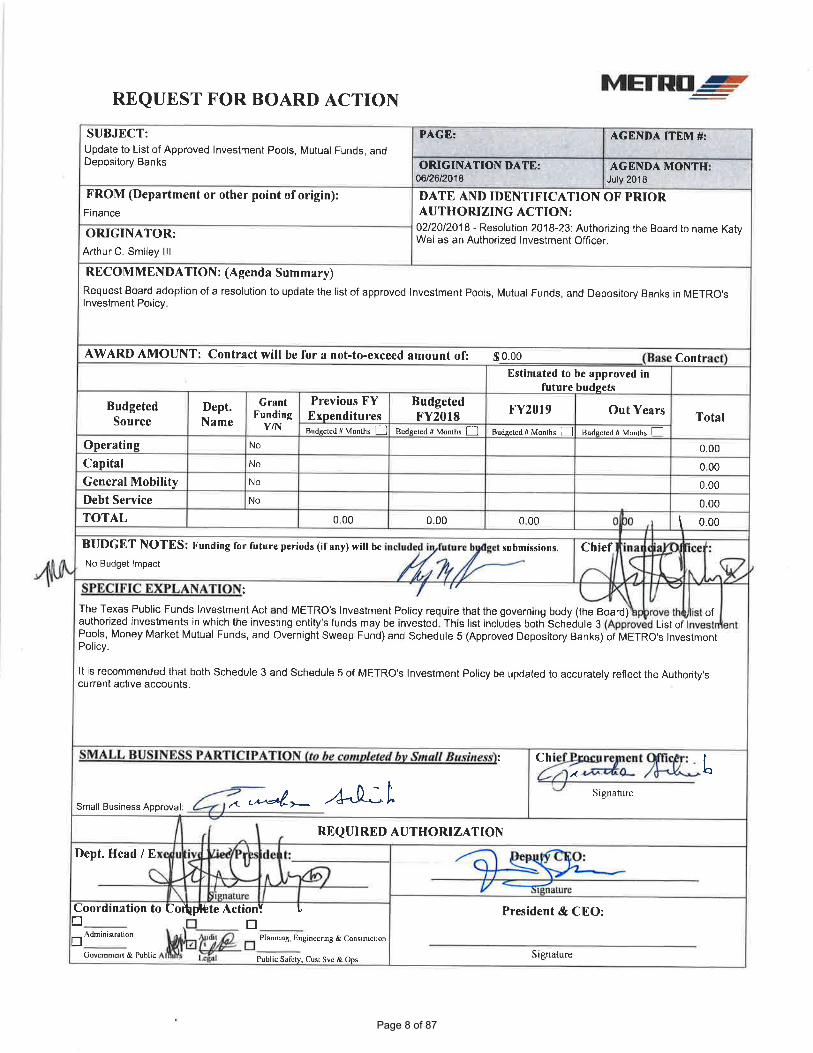
3. Request Board approval of the updated list of approved investment pools, mutual funds, anddepository banks in METRO’s Investment PolicyG. Fotinos
GRANT NOTIFICATION
4. Notification of submittal of a grant application for the bus and bus facilities infrastructureinvestment discretionary grant program sponsored by the Federal Transit AdministrationA. Lyne
BRIEFINGS
5. Monthly Compliance ReportJ. Garcia
6. Monthly Financial ReportsA. Smiley
a. CFO Presentationb. Sales Tax Reportc. Investment Reportd. Debt Reporte. Monthly Performance Reportf. Fuel Hedge Report
Page 1 of 87
Page 2 of 87
Page 3 of 87
Page 4 of 87
Rev 8-3-17 MErAD-
SUMMARY OF PROCUREMENT
MODIFICATION No. 002
PROJECT NAME: Gateway Services
CONTRACT NO.(S): CT1600065
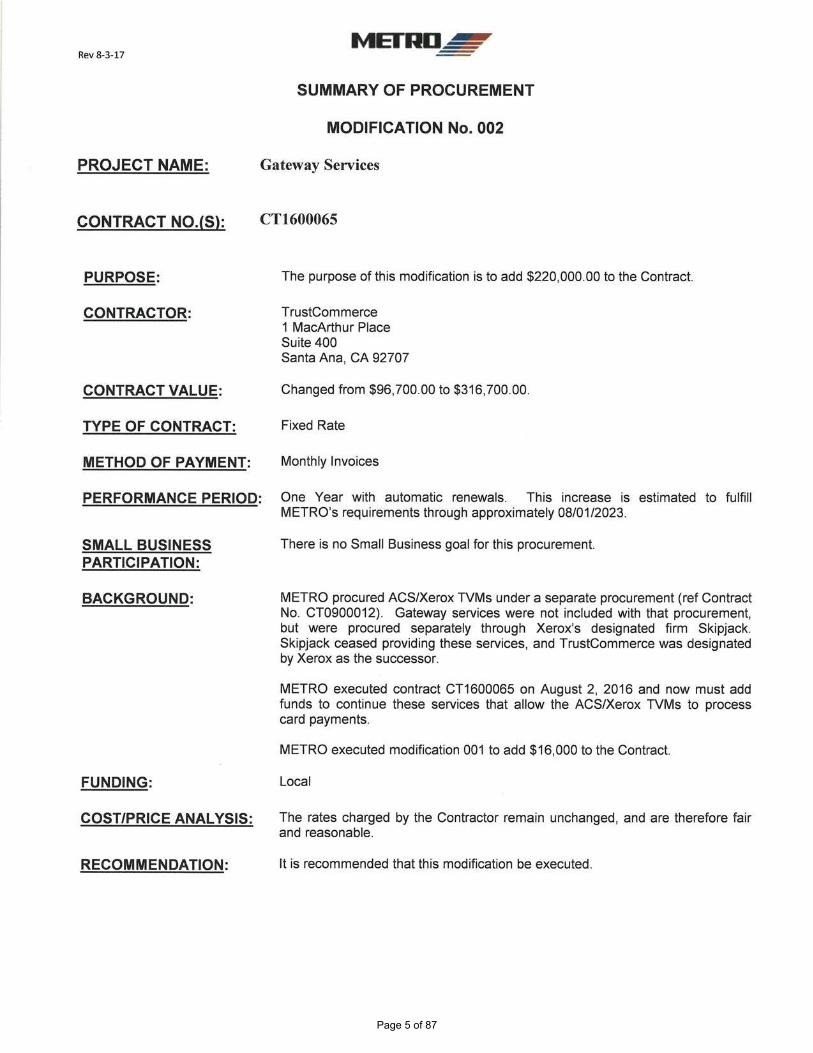
PURPOSE: The purpose of this modification is to add $220,000.00 to the Contract.
CONTRACTOR: TrustCommerce 1 MacArthur Place Suite 400 Santa Ana, CA 92707
CONTRACT VALUE: Changed from $96,700.00 to $316,700.00.
TYPE OF CONTRACT: Fixed Rate
METHOD OF PAYMENT: Monthly Invoices
PERFORMANCE PERIOD: One Year with automatic renewals. This increase is estimated to fulfill METRO's requirements through approximately 08/01/2023.
SMALL BUSINESS There is no Small Business goal for this procurement. PARTICIPATION:
BACKGROUND: METRO procured ACS/Xerox TVMs under a separate procurement (ref Contract No. CT0900012). Gateway services were not included with that procurement, but were procured separately through Xerox's designated firm Skipjack. Skipjack ceased providing these services, and TrustCommerce was designated by Xerox as the successor.
METRO executed contract CT1600065 on August 2, 2016 and now must add funds to continue these services that allow the ACS/Xerox TVMs to process card payments.
METRO executed modification 001 to add $16,000 to the Contract.
FUNDING:
COST/PRICE ANALYSIS:
RECOMMENDATION:
Local
The rates charged by the Contractor remain unchanged, and are therefore fair and reasonable.
It is recommended that this modification be executed.
Page 5 of 87

Summary of Procurement - Contract Mod
Contract No. CT1600065 Page 2
SUP. CONTRACT SPECIALIST
~/2.'i//,Jl
DATE
----" C-Jrl/ DATE
MANAGER PROCUREMENT
Page 6 of 87
Page 8 of 87

Request for Board ActionJuly Finance & Audit Committee of the METRO
Board of Directors
Page 9 of 87
• The Texas Public Funds Investment Act and METRO's Investment Policy require that the governing body (the Board) approve the list of authorized investments in which the investing entity’s funds may be invested
• This list includes the following items found in METRO’s Investment Policy:
− Schedule 3 (Approved List of Investment Pools, Money Market Mutual Funds, and Overnight Sweep Fund)
− Schedule 5 (Approved Depository Banks and Broker/Dealers)
2
Page 10 of 87

• Request Board adoption of a resolution to approve:
− Updates to both Schedule 3 and Schedule 5 of METRO's Investment Policy to accurately reflect the Authority's current active accounts
3
Page 11 of 87
Page 13 of 14
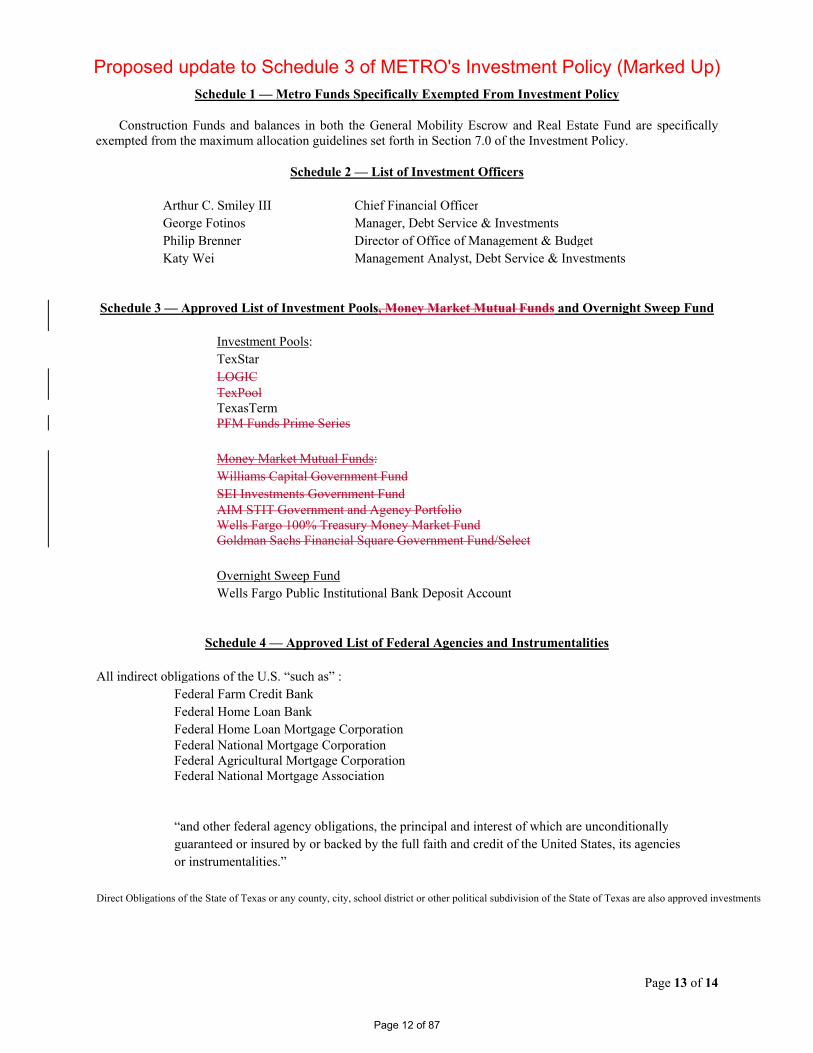
Schedule 1 — Metro Funds Specifically Exempted From Investment Policy
Construction Funds and balances in both the General Mobility Escrow and Real Estate Fund are specifically exempted from the maximum allocation guidelines set forth in Section 7.0 of the Investment Policy.
Schedule 2 — List of Investment Officers
Arthur C. Smiley III Chief Financial Officer George Fotinos Manager, Debt Service & Investments Philip Brenner Director of Office of Management & Budget Katy Wei Management Analyst, Debt Service & Investments
Schedule 3 — Approved List of Investment Pools, Money Market Mutual Funds and Overnight Sweep Fund
Investment Pools: TexStar LOGIC TexPool TexasTerm PFM Funds Prime Series
Money Market Mutual Funds: Williams Capital Government Fund SEI Investments Government Fund AIM STIT Government and Agency Portfolio Wells Fargo 100% Treasury Money Market Fund Goldman Sachs Financial Square Government Fund/Select
Overnight Sweep Fund Wells Fargo Public Institutional Bank Deposit Account
Schedule 4 — Approved List of Federal Agencies and Instrumentalities
All indirect obligations of the U.S. “such as” : Federal Farm Credit Bank Federal Home Loan Bank Federal Home Loan Mortgage Corporation Federal National Mortgage Corporation Federal Agricultural Mortgage Corporation Federal National Mortgage Association
“and other federal agency obligations, the principal and interest of which are unconditionally guaranteed or insured by or backed by the full faith and credit of the United States, its agencies or instrumentalities.”
Direct Obligations of the State of Texas or any county, city, school district or other political subdivision of the State of Texas are also approved investments
Proposed update to Schedule 3 of METRO's Investment Policy (Marked Up)
Page 12 of 87
Page 14 of 14
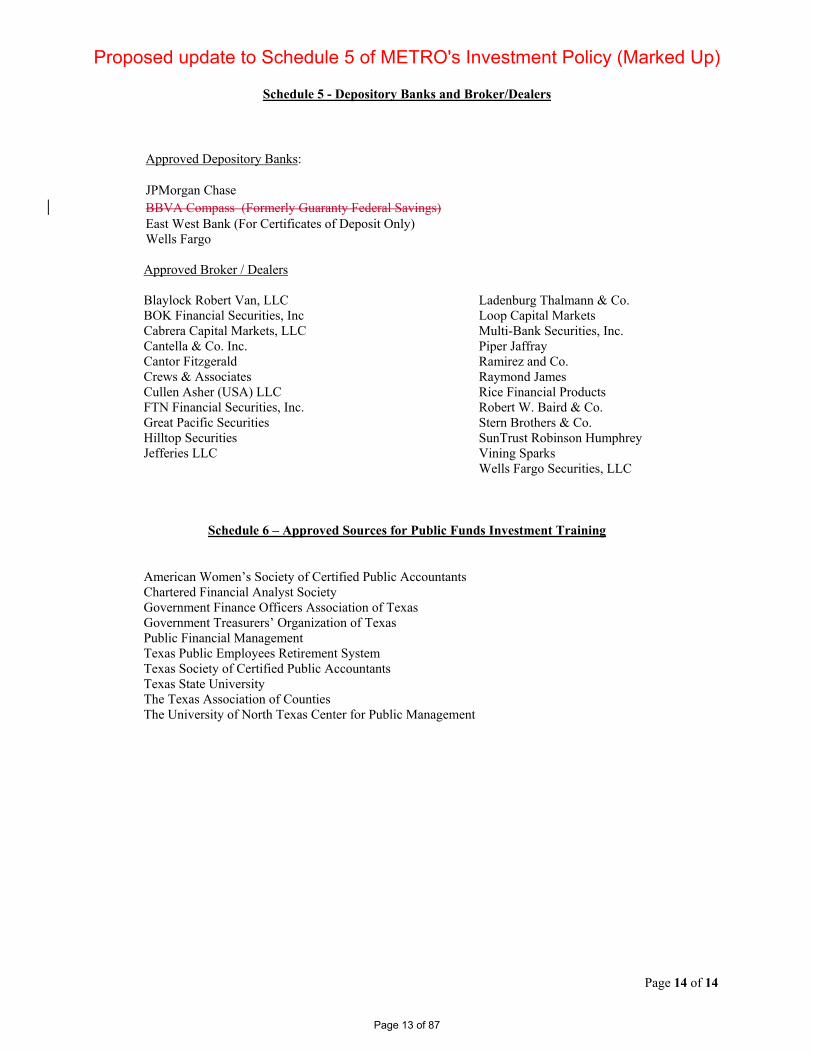
Schedule 5 - Depository Banks and Broker/Dealers
Approved Depository Banks: JPMorgan Chase BBVA Compass (Formerly Guaranty Federal Savings) East West Bank (For Certificates of Deposit Only) Wells Fargo Approved Broker / Dealers Blaylock Robert Van, LLC BOK Financial Securities, Inc Cabrera Capital Markets, LLC Cantella & Co. Inc. Cantor Fitzgerald Crews & Associates Cullen Asher (USA) LLC FTN Financial Securities, Inc. Great Pacific Securities Hilltop Securities Jefferies LLC
Ladenburg Thalmann & Co. Loop Capital Markets Multi-Bank Securities, Inc. Piper Jaffray Ramirez and Co. Raymond James Rice Financial Products Robert W. Baird & Co. Stern Brothers & Co. SunTrust Robinson Humphrey Vining Sparks Wells Fargo Securities, LLC
Schedule 6 – Approved Sources for Public Funds Investment Training
American Women’s Society of Certified Public Accountants Chartered Financial Analyst Society Government Finance Officers Association of Texas Government Treasurers’ Organization of Texas Public Financial Management Texas Public Employees Retirement System Texas Society of Certified Public Accountants Texas State University The Texas Association of Counties The University of North Texas Center for Public Management
Proposed update to Schedule 5 of METRO's Investment Policy (Marked Up)
Page 13 of 87
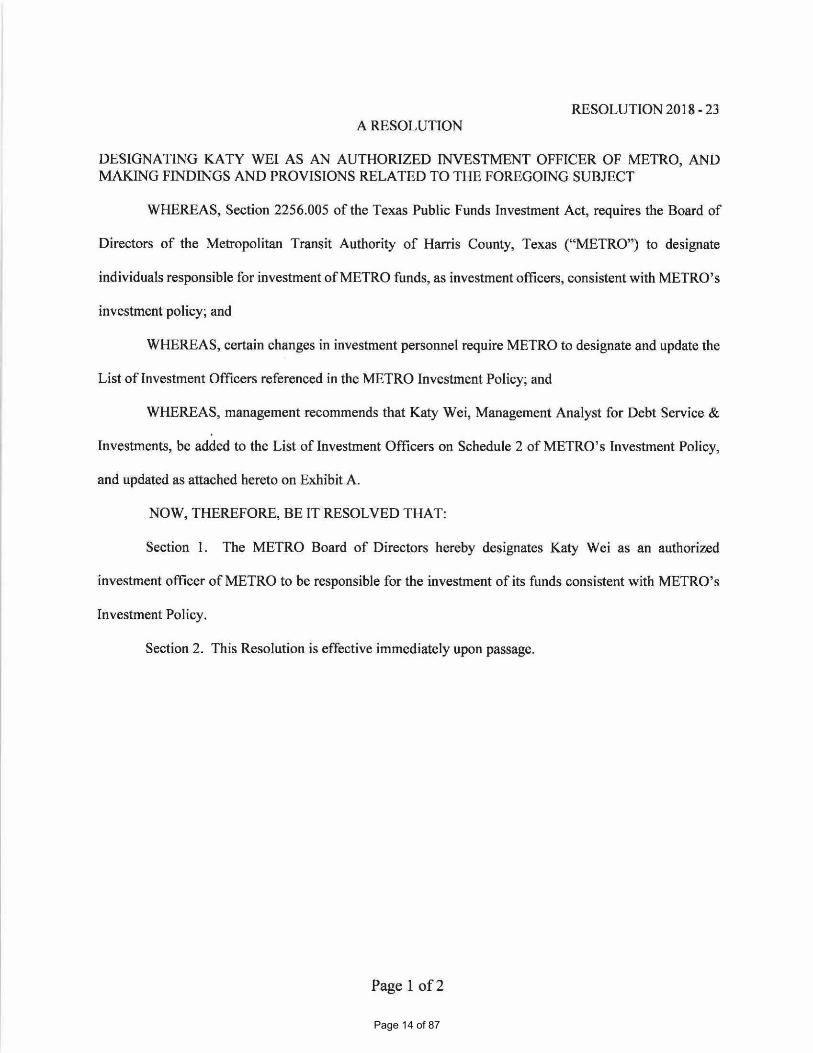
A RESOLUTION
RESOLUTION 2018 - 23
DESIGNATING KATY WEI AS AN AUTHORIZED INVESTMENT OFFICER OF METRO, ANDMAKING FINDINGS AND PROVISIONS RELATED TO THE FOREGOING SUBJECT
WHEREAS, Section 2256.005 of the Texas Public Funds Investment Act, requires the Board of
Directors of the Metropolitan Transit Authority of Harris County, Texas ("METRO") to designate
individuals responsible for investment of METRO funds, as investment officers, consistent with METRO's
investment policy; and
WHEREAS, certain changes in investment personnel require METRO to designate and update the
List of Investment Officers referenced in the METRO Investment Policy; and
WHEREAS, management recommends that Katy Wei, Management Analyst for Debt Service &
Investments, be added to the List of Investment Officers on Schedule 2 of METRO's Investment Policy,
and updated as attached hereto on Exhibit A.
NOW, THEREFORE, BE IT RESOLVED THAT:
Section 1. The METRO Board of Directors hereby designates Katy Wei as an authorized
investment officer of METRO to be responsible for the investment of its funds consistent with METRO's
Investment Policy.
Section 2. This Resolution is effective immediately upon passage.
Page 1 of 2
Page 14 of 87
..'14 1. vi:
ATTEST: .. n A/V
0. ..
14ca Perry \- 4Assistant Secretary .,.....s,.,-'
Page 2 of 2
I hereby certify that the above resolution isaccurate in describing the action herein of theBoard of Directors on the date below.
Cyd nipfairfax
Ex ive Vice President &-!15[2"Counsel
PASSED this 20th day of February, 2018APPROVED this 20th day of February, 2018
ORWAk,6/#'CO,JLKCarrin F. Patman
Chair
Page 15 of 87

Page 16 of 87
Page 17 of 87
Finance and Audit Committee
July 2018
Page 18 of 87
• Discretionary grant program sponsored by the Federal Transit Administration (FTA)
• Created to assist in the financing of capital projects to replace, rehabilitate, purchase or lease buses and related equipment, and to rehabilitate, purchase, construct or lease bus-related facilities
• Multiple project proposals are allowed
2
Page 19 of 87
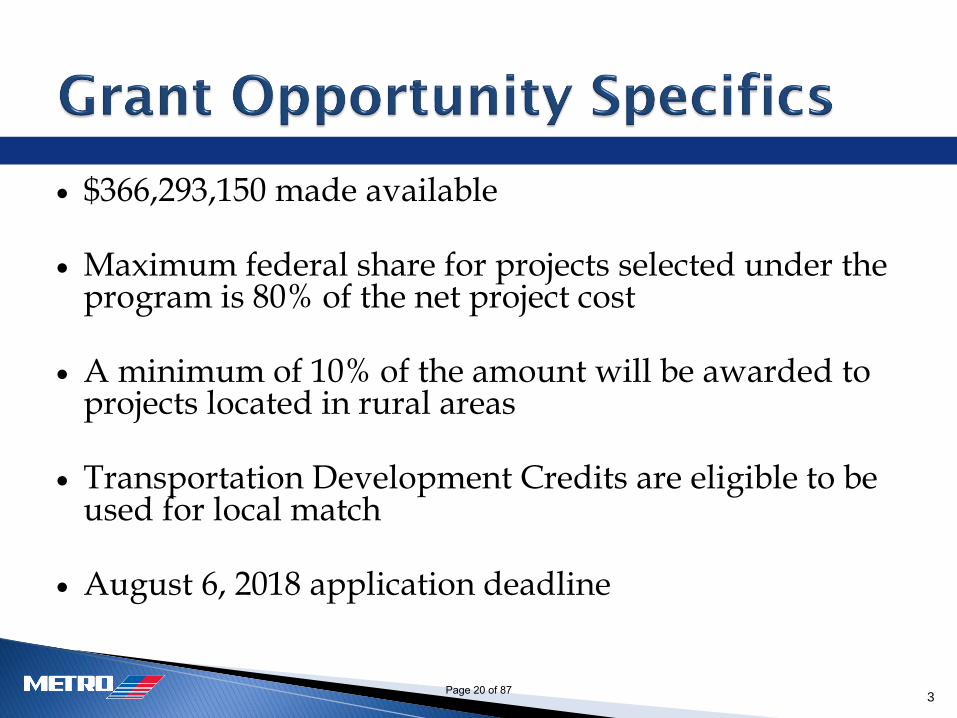
• $366,293,150 made available
• Maximum federal share for projects selected under the program is 80% of the net project cost
• A minimum of 10% of the amount will be awarded to projects located in rural areas
• Transportation Development Credits are eligible to be used for local match
• August 6, 2018 application deadline
3
Page 20 of 87
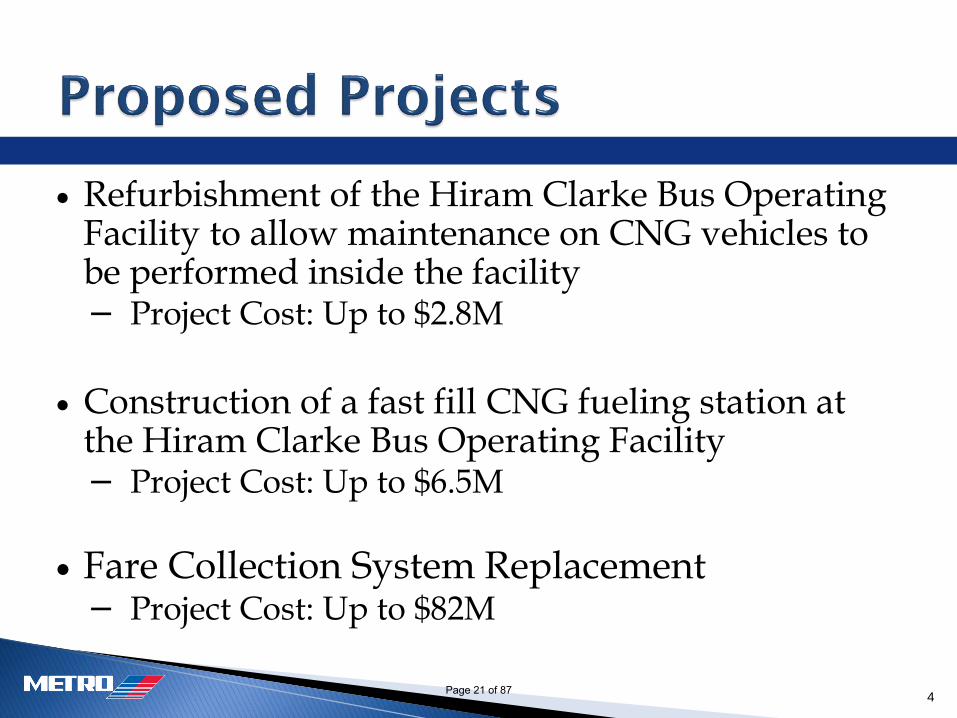
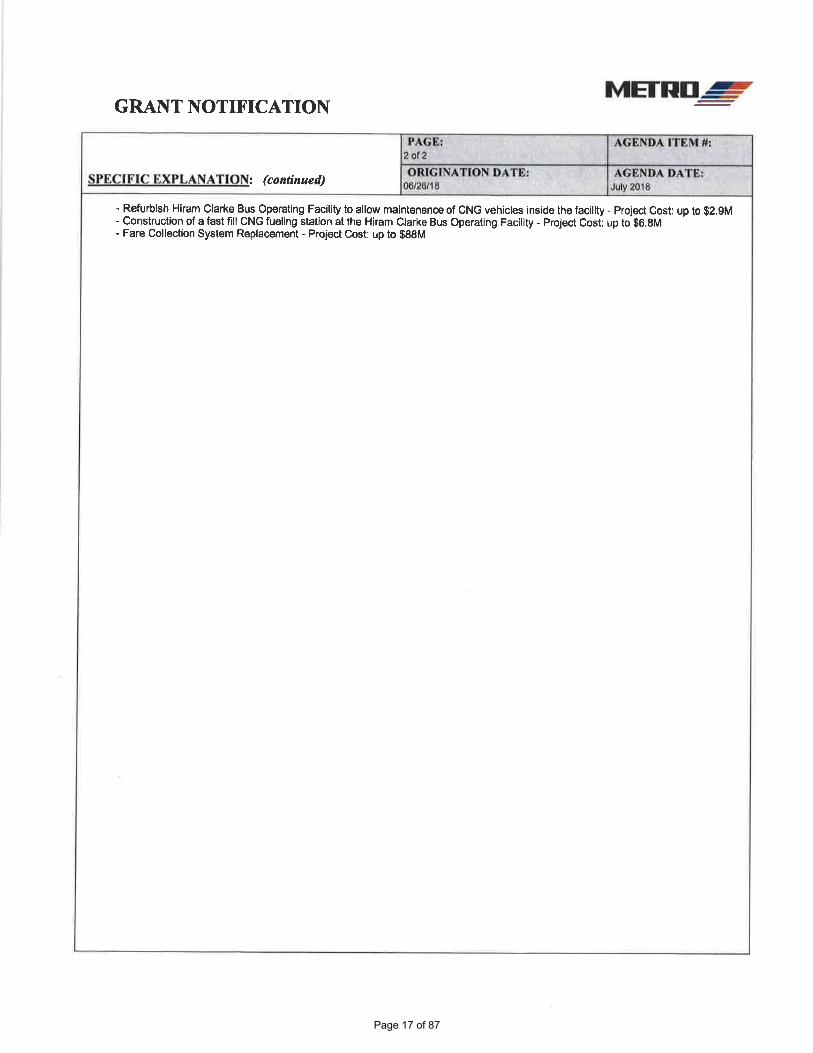
• Refurbishment of the Hiram Clarke Bus Operating Facility to allow maintenance on CNG vehicles to be performed inside the facility− Project Cost: Up to $2.8M
• Construction of a fast fill CNG fueling station at the Hiram Clarke Bus Operating Facility− Project Cost: Up to $6.5M
• Fare Collection System Replacement− Project Cost: Up to $82M
4
Page 21 of 87
Page 22 of 87

Page 23 of 87
REPORT NAME COMMENT NUMBER
RESPONSIBLE AREA
ORIGINAL DUE DATE
CURRENT DATE DUE ACTION REQUIRED
AUDIT DEPARTMENT
CORRECTIVE ACTION COMPLIANCE REPORT
AS OF June 30, 2018
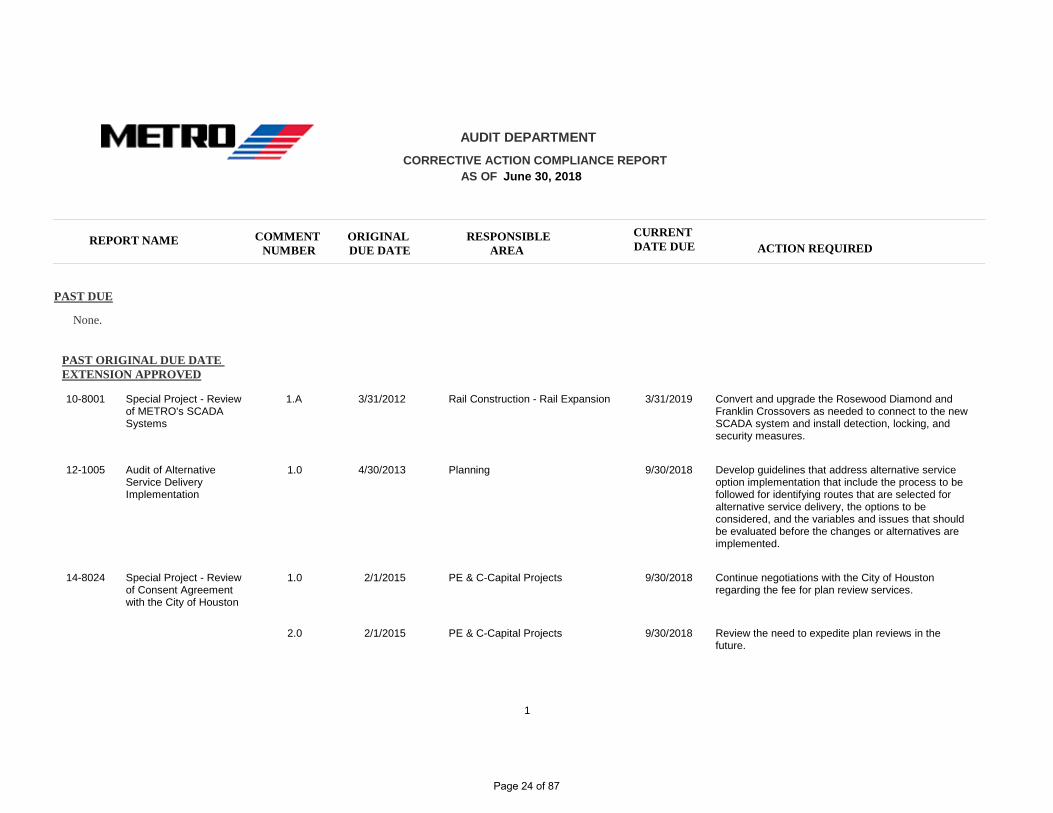
PAST DUE
None.
PAST ORIGINAL DUE DATE EXTENSION APPROVED
10-8001 Special Project - Review of METRO's SCADA Systems
3/31/2012 Convert and upgrade the Rosewood Diamond and Franklin Crossovers as needed to connect to the new SCADA system and install detection, locking, and security measures.
Rail Construction - Rail Expansion 3/31/20191.A
12-1005 Audit of Alternative Service Delivery Implementation
4/30/2013 Develop guidelines that address alternative service option implementation that include the process to be followed for identifying routes that are selected for alternative service delivery, the options to be considered, and the variables and issues that should be evaluated before the changes or alternatives are implemented.
Planning 9/30/20181.0
14-8024 Special Project - Review of Consent Agreement with the City of Houston
2/1/2015 Continue negotiations with the City of Houston regarding the fee for plan review services.
PE & C-Capital Projects 9/30/20181.0
2/1/2015 Review the need to expedite plan reviews in the future.
PE & C-Capital Projects 9/30/20182.0
1
Page 24 of 87
REPORT NAME COMMENT NUMBER
RESPONSIBLE AREA
ORIGINAL DUE DATE
CURRENT DATE DUE ACTION REQUIRED
AUDIT DEPARTMENT
CORRECTIVE ACTION COMPLIANCE REPORT
AS OF June 30, 2018
PAST ORIGINAL DUE DATE EXTENSION APPROVED
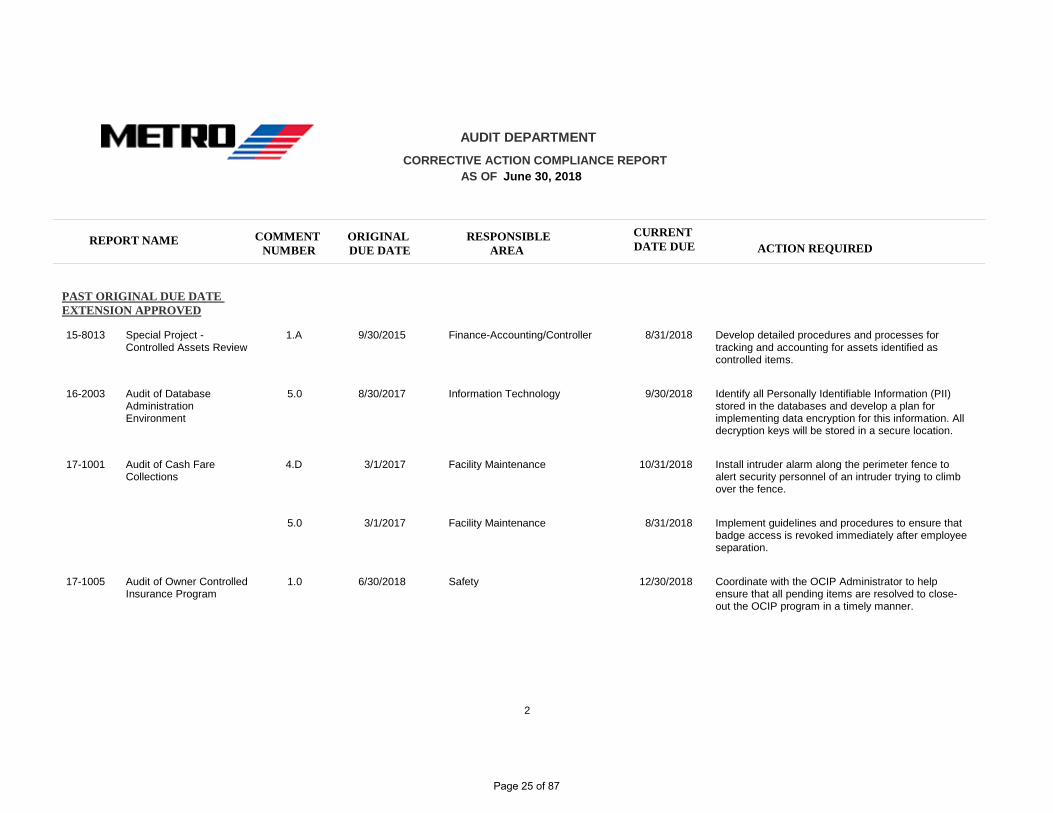
15-8013 Special Project - Controlled Assets Review
9/30/2015 Develop detailed procedures and processes for tracking and accounting for assets identified as controlled items.
Finance-Accounting/Controller 8/31/20181.A
16-2003 Audit of Database Administration Environment
8/30/2017 Identify all Personally Identifiable Information (PII) stored in the databases and develop a plan for implementing data encryption for this information. All decryption keys will be stored in a secure location.
Information Technology 9/30/20185.0
17-1001 Audit of Cash Fare Collections
3/1/2017 Install intruder alarm along the perimeter fence to alert security personnel of an intruder trying to climb over the fence.
Facility Maintenance 10/31/20184.D
3/1/2017 Implement guidelines and procedures to ensure that badge access is revoked immediately after employee separation.
Facility Maintenance 8/31/20185.0
17-1005 Audit of Owner Controlled Insurance Program
6/30/2018 Coordinate with the OCIP Administrator to help ensure that all pending items are resolved to close-out the OCIP program in a timely manner.
Safety 12/30/20181.0
2
Page 25 of 87

REPORT NAME COMMENT NUMBER
RESPONSIBLE AREA
ORIGINAL DUE DATE
CURRENT DATE DUE ACTION REQUIRED
AUDIT DEPARTMENT
CORRECTIVE ACTION COMPLIANCE REPORT
AS OF June 30, 2018
PAST ORIGINAL DUE DATE EXTENSION APPROVED
17-8023 Special Project - Rail and Bus Accident Corrective Action Tracking
12/31/2017 Enhance bus accident investigation process to capture all necessary accident data to assist Management with the analysis of accident data to identify and correct accident patterns and trends.
Safety 8/31/20183.0
17-8030 Special Project - Records Retention Controls Planning & Engineering
4/30/2018 Implement a periodic training program to ensure that all current and new employees are aware of the requirements of the Records Management Policy.
Legal 8/1/20181.0
17-9001 Compliance Review - Audit of Bus Operator Moving Violations
12/31/2017 Update Work Rules Code Book and METRO DWI/DUI Guideline to require CDL employees to report traffic citations or convictions to their supervisors within 30 days of conviction to comply with Code of Federal Regulations requirements.
Human Resources- Labor Relatio 9/30/20181.0
12/31/2017 Revise The DWI/DUI and Other Criminal Offense Guideline.
Human Resources- Labor Relatio 9/30/20185.A
3
Page 26 of 87
REPORT NAME COMMENT NUMBER
RESPONSIBLE AREA
ORIGINAL DUE DATE
CURRENT DATE DUE ACTION REQUIRED
AUDIT DEPARTMENT
CORRECTIVE ACTION COMPLIANCE REPORT
AS OF June 30, 2018
PAST ORIGINAL DUE DATE EXTENSION APPROVED
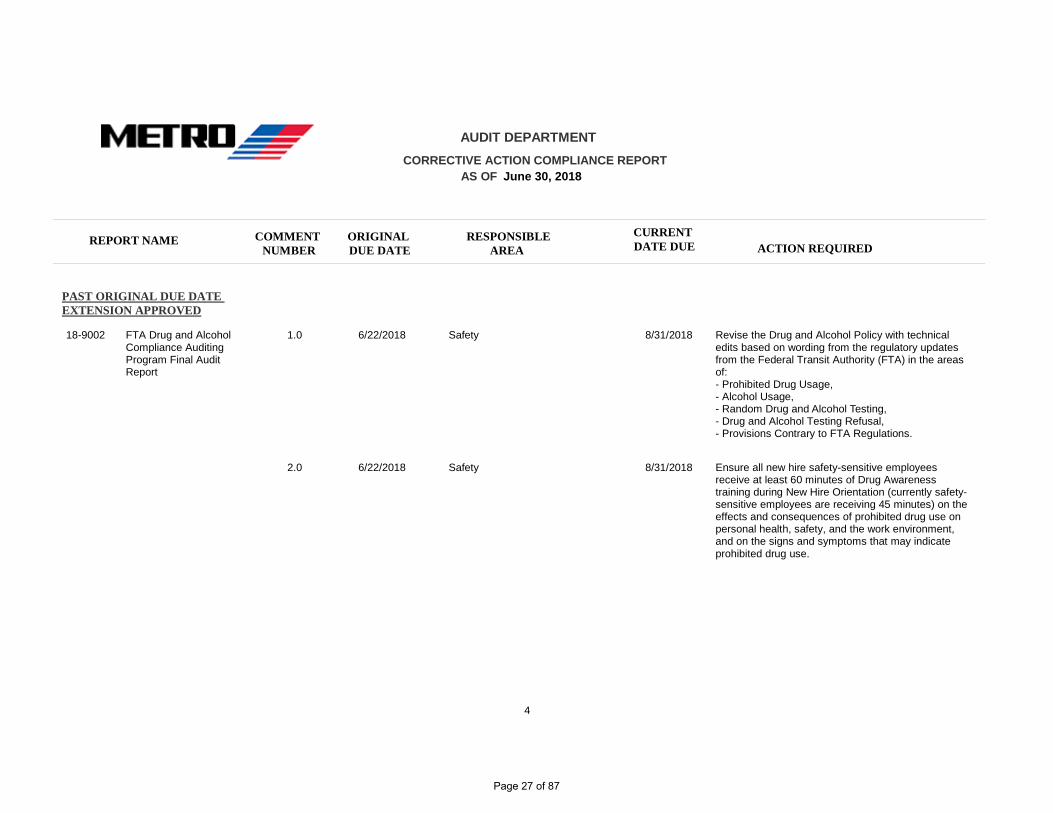
18-9002 FTA Drug and Alcohol Compliance Auditing Program Final Audit Report
6/22/2018 Revise the Drug and Alcohol Policy with technical edits based on wording from the regulatory updates from the Federal Transit Authority (FTA) in the areas of: - Prohibited Drug Usage,
- Alcohol Usage, - Random Drug and Alcohol Testing,
- Drug and Alcohol Testing Refusal,- Provisions Contrary to FTA Regulations.
Safety 8/31/20181.0
6/22/2018 Ensure all new hire safety-sensitive employees receive at least 60 minutes of Drug Awareness training during New Hire Orientation (currently safety-sensitive employees are receiving 45 minutes) on the effects and consequences of prohibited drug use on personal health, safety, and the work environment, and on the signs and symptoms that may indicate prohibited drug use.
Safety 8/31/20182.0
4
Page 27 of 87
REPORT NAME COMMENT NUMBER
RESPONSIBLE AREA
ORIGINAL DUE DATE
CURRENT DATE DUE ACTION REQUIRED
AUDIT DEPARTMENT
CORRECTIVE ACTION COMPLIANCE REPORT
AS OF June 30, 2018
PAST ORIGINAL DUE DATE EXTENSION APPROVED
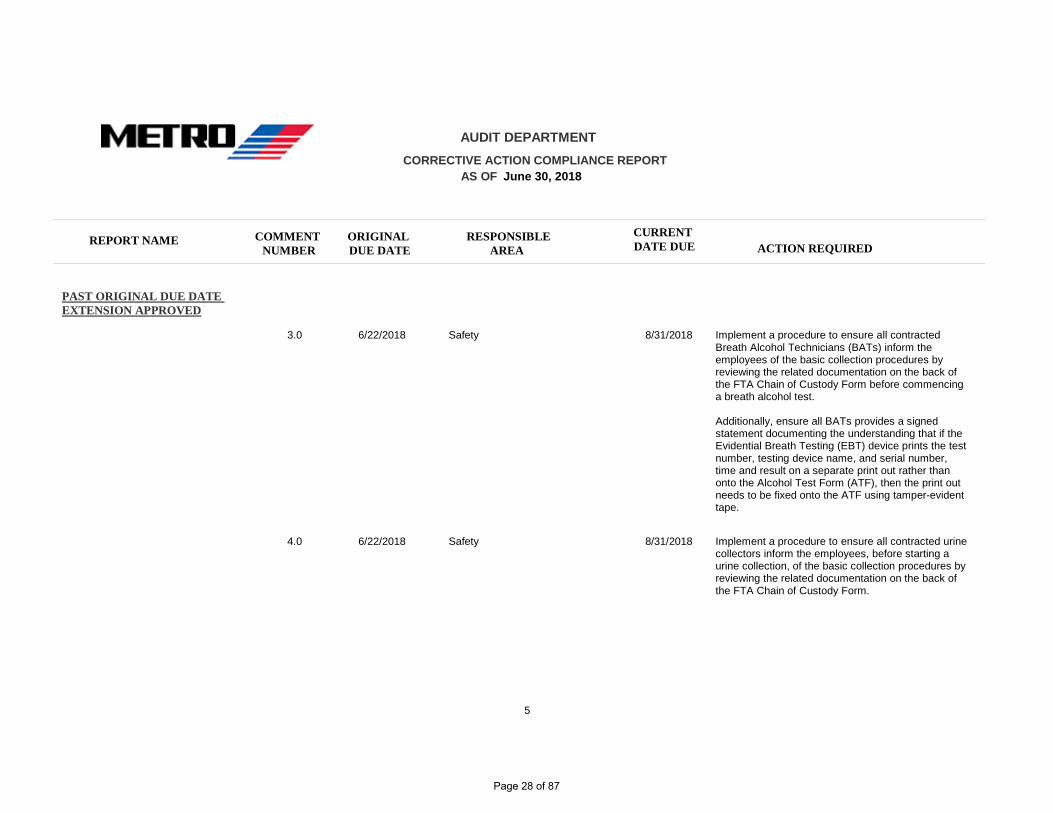
6/22/2018 Implement a procedure to ensure all contracted Breath Alcohol Technicians (BATs) inform the employees of the basic collection procedures by reviewing the related documentation on the back of the FTA Chain of Custody Form before commencing a breath alcohol test.
Additionally, ensure all BATs provides a signed statement documenting the understanding that if the Evidential Breath Testing (EBT) device prints the test number, testing device name, and serial number, time and result on a separate print out rather than onto the Alcohol Test Form (ATF), then the print out needs to be fixed onto the ATF using tamper-evident tape.
Safety 8/31/20183.0
6/22/2018 Implement a procedure to ensure all contracted urine collectors inform the employees, before starting a urine collection, of the basic collection procedures by reviewing the related documentation on the back of the FTA Chain of Custody Form.
Safety 8/31/20184.0
5
Page 28 of 87
REPORT NAME COMMENT NUMBER
RESPONSIBLE AREA
ORIGINAL DUE DATE
CURRENT DATE DUE ACTION REQUIRED
AUDIT DEPARTMENT
CORRECTIVE ACTION COMPLIANCE REPORT
AS OF June 30, 2018
PAST ORIGINAL DUE DATE EXTENSION APPROVED
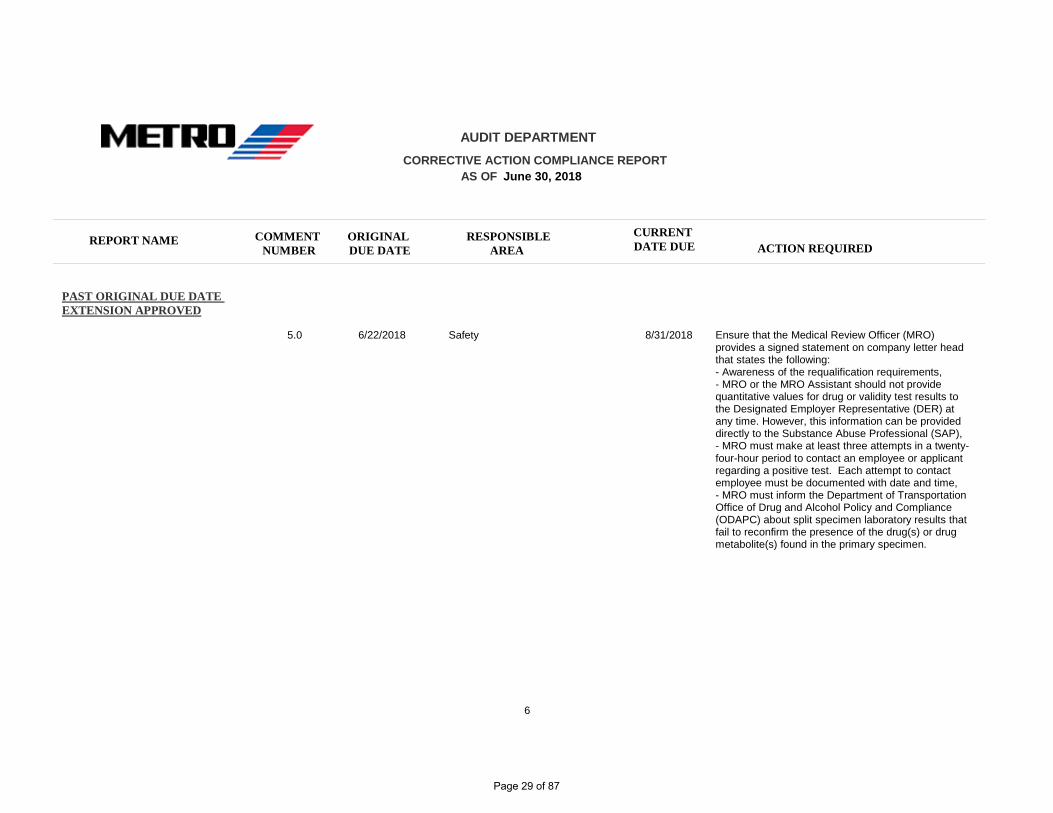
6/22/2018 Ensure that the Medical Review Officer (MRO) provides a signed statement on company letter head that states the following:
- Awareness of the requalification requirements,- MRO or the MRO Assistant should not provide quantitative values for drug or validity test results to the Designated Employer Representative (DER) at any time. However, this information can be provided directly to the Substance Abuse Professional (SAP),- MRO must make at least three attempts in a twenty-four-hour period to contact an employee or applicant regarding a positive test. Each attempt to contact employee must be documented with date and time,- MRO must inform the Department of Transportation Office of Drug and Alcohol Policy and Compliance (ODAPC) about split specimen laboratory results that fail to reconfirm the presence of the drug(s) or drug metabolite(s) found in the primary specimen.
Safety 8/31/20185.0
6
Page 29 of 87

REPORT NAME COMMENT NUMBER
RESPONSIBLE AREA
ORIGINAL DUE DATE
CURRENT DATE DUE ACTION REQUIRED
AUDIT DEPARTMENT
CORRECTIVE ACTION COMPLIANCE REPORT
AS OF June 30, 2018
PAST ORIGINAL DUE DATE EXTENSION APPROVED
6/22/2018 Update the Records Management process in the following areas to be in compliance with applicable FTA Rule Requirements:- Update Employment Application to include question(s) regarding previous positive pre-employment test,- Implement a process to ensure applicants are hired within 90-day pre-employment drug screens,
- Update the reasonable suspicion interviews process and related Reasonable Suspicions Form to ensure that additional narrative details are incorporated to document FTA/DOT testing and METRO Non-DOT testing,- Update the process to ensure that additional documentations are obtained for drug and alcohol testing that is not administered within required two-hour time period,- Provide re-training for all Service Supervisors responsible for making Post Accident Drug and Alcohol Test Determinations and implement a Quality Assurance process for all Post Accident Determination Forms to ensure consistency of
submitted information,- Ensure that related Drug and Alcohol personnel are up to date on various detail requirements of sections 40.267(c)(4) and 40.285(b) and submit a statement to FTA affirming the required action.
Safety 8/31/20186.0
7
Page 30 of 87
REPORT NAME COMMENT NUMBER
RESPONSIBLE AREA
ORIGINAL DUE DATE
CURRENT DATE DUE ACTION REQUIRED
AUDIT DEPARTMENT
CORRECTIVE ACTION COMPLIANCE REPORT
AS OF June 30, 2018
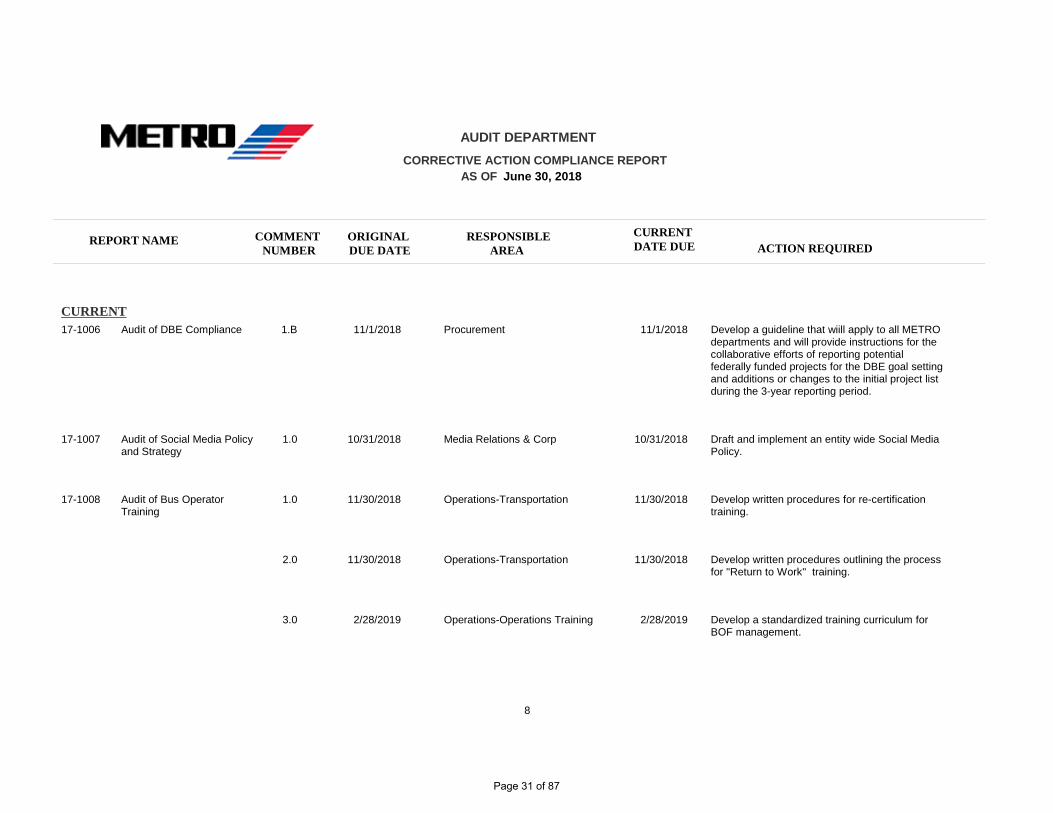
CURRENT17-1006 Audit of DBE Compliance 11/1/2018 Develop a guideline that wiill apply to all METRO
departments and will provide instructions for the collaborative efforts of reporting potential federally funded projects for the DBE goal setting and additions or changes to the initial project list during the 3-year reporting period.
Procurement 11/1/20181.B
17-1007 Audit of Social Media Policy and Strategy
10/31/2018 Draft and implement an entity wide Social Media Policy.
Media Relations & Corp 10/31/20181.0
17-1008 Audit of Bus Operator Training
11/30/2018 Develop written procedures for re-certification training.
Operations-Transportation 11/30/20181.0
11/30/2018 Develop written procedures outlining the process for "Return to Work" training.
Operations-Transportation 11/30/20182.0
2/28/2019 Develop a standardized training curriculum for BOF management.
Operations-Operations Training 2/28/20193.0
8
Page 31 of 87
REPORT NAME COMMENT NUMBER
RESPONSIBLE AREA
ORIGINAL DUE DATE
CURRENT DATE DUE ACTION REQUIRED
AUDIT DEPARTMENT
CORRECTIVE ACTION COMPLIANCE REPORT
AS OF June 30, 2018
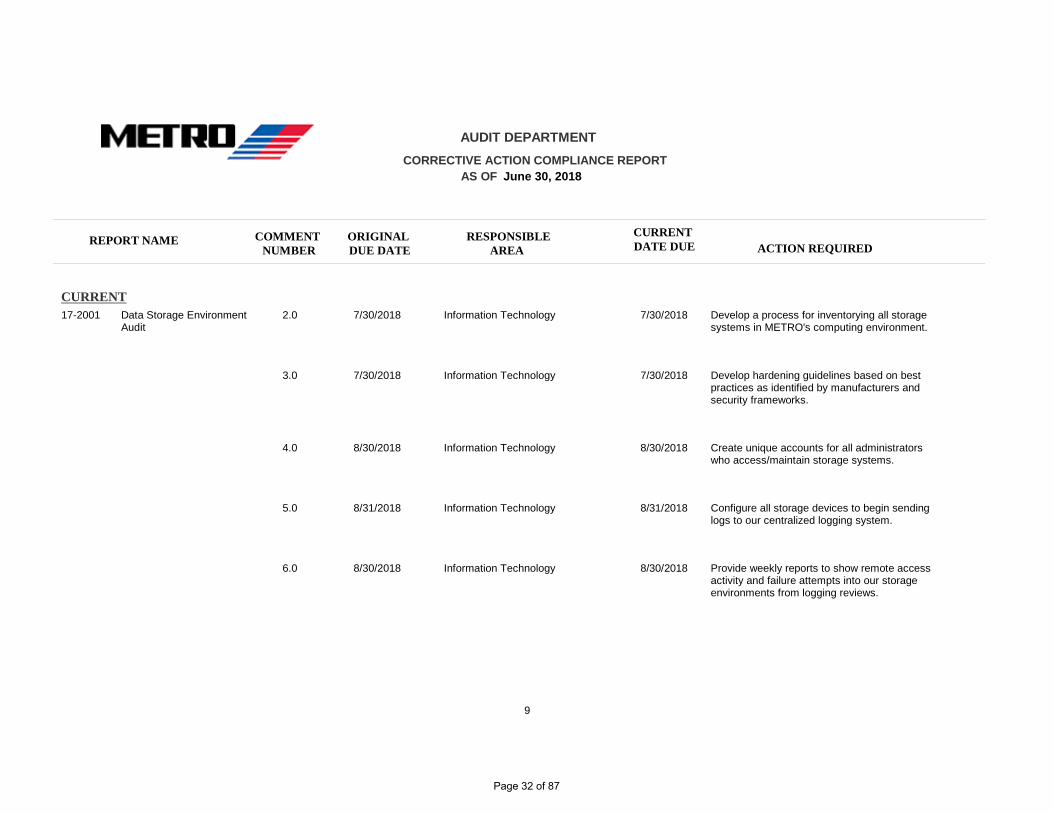
CURRENT17-2001 Data Storage Environment
Audit7/30/2018 Develop a process for inventorying all storage
systems in METRO's computing environment.Information Technology 7/30/20182.0
7/30/2018 Develop hardening guidelines based on best practices as identified by manufacturers and security frameworks.
Information Technology 7/30/20183.0
8/30/2018 Create unique accounts for all administrators who access/maintain storage systems.
Information Technology 8/30/20184.0
8/31/2018 Configure all storage devices to begin sending logs to our centralized logging system.
Information Technology 8/31/20185.0
8/30/2018 Provide weekly reports to show remote access activity and failure attempts into our storage environments from logging reviews.
Information Technology 8/30/20186.0
9
Page 32 of 87

REPORT NAME COMMENT NUMBER
RESPONSIBLE AREA
ORIGINAL DUE DATE
CURRENT DATE DUE ACTION REQUIRED
AUDIT DEPARTMENT
CORRECTIVE ACTION COMPLIANCE REPORT
AS OF June 30, 2018
CURRENT10/31/2018 Create a topology map to detail the storage
server connectivity to the network.Operations-Transportation 10/31/20187.0
10/31/2018 Create a data storage environment inventory for the ROC.
Operations-Transportation 10/31/20188.0
10/31/2018 Develop a storage device deployment checklist.Operations-Transportation 10/31/20189.0
10/31/2018 Establish a quarterly review of user accounts to ROC informattion technology (signal and communications) maintenance plan.
Operations-Transportation 10/31/201810.0
10/31/2018 Evaluate continued use of Solar-Winds to monitor the health of these servers.
Operations-Transportation 10/31/201811.0
10/31/2018 Implement a backup solution for the data stroage environment.
Operations-Transportation 10/31/201812.0
10
Page 33 of 87
REPORT NAME COMMENT NUMBER
RESPONSIBLE AREA
ORIGINAL DUE DATE
CURRENT DATE DUE ACTION REQUIRED
AUDIT DEPARTMENT
CORRECTIVE ACTION COMPLIANCE REPORT
AS OF June 30, 2018
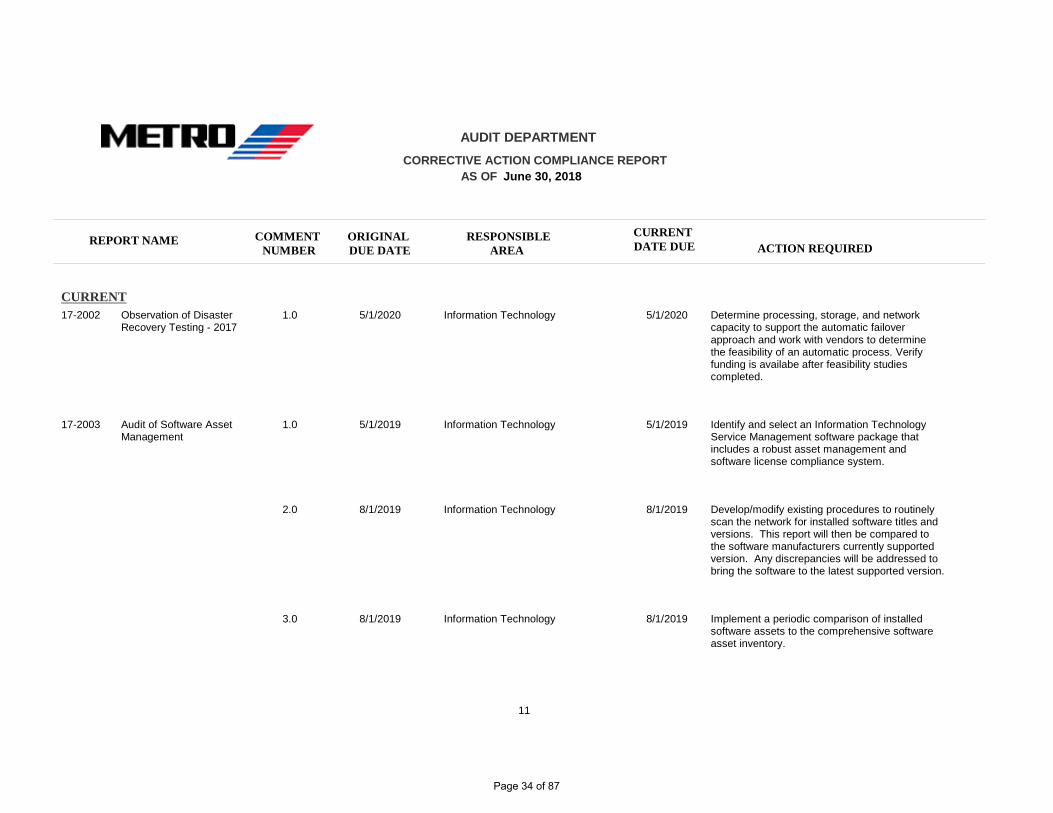
CURRENT17-2002 Observation of Disaster
Recovery Testing - 20175/1/2020 Determine processing, storage, and network
capacity to support the automatic failover approach and work with vendors to determine the feasibility of an automatic process. Verify funding is availabe after feasibility studies completed.
Information Technology 5/1/20201.0
17-2003 Audit of Software Asset Management
5/1/2019 Identify and select an Information Technology Service Management software package that includes a robust asset management and software license compliance system.
Information Technology 5/1/20191.0
8/1/2019 Develop/modify existing procedures to routinely scan the network for installed software titles and versions. This report will then be compared to the software manufacturers currently supported version. Any discrepancies will be addressed to bring the software to the latest supported version.
Information Technology 8/1/20192.0
8/1/2019 Implement a periodic comparison of installed software assets to the comprehensive software asset inventory.
Information Technology 8/1/20193.0
11
Page 34 of 87
REPORT NAME COMMENT NUMBER
RESPONSIBLE AREA
ORIGINAL DUE DATE
CURRENT DATE DUE ACTION REQUIRED
AUDIT DEPARTMENT
CORRECTIVE ACTION COMPLIANCE REPORT
AS OF June 30, 2018
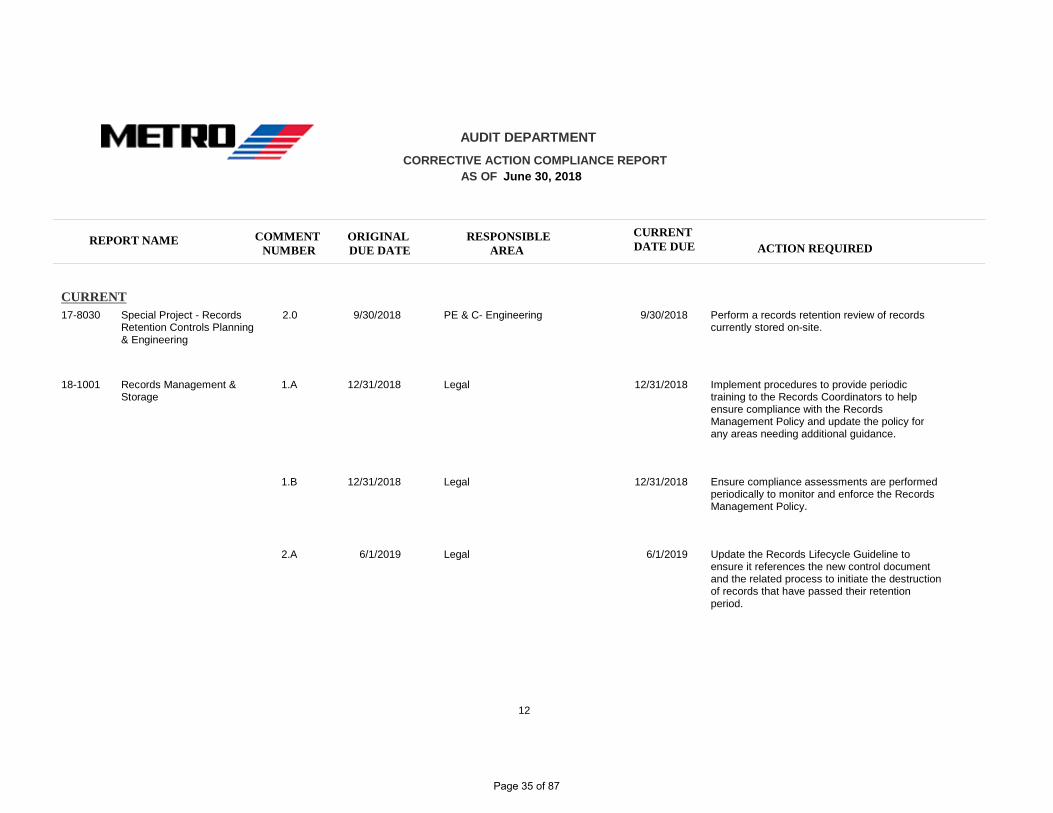
CURRENT17-8030 Special Project - Records
Retention Controls Planning & Engineering
9/30/2018 Perform a records retention review of records currently stored on-site.
PE & C- Engineering 9/30/20182.0
18-1001 Records Management & Storage
12/31/2018 Implement procedures to provide periodic training to the Records Coordinators to help ensure compliance with the Records Management Policy and update the policy for any areas needing additional guidance.
Legal 12/31/20181.A
12/31/2018 Ensure compliance assessments are performed periodically to monitor and enforce the Records Management Policy.
Legal 12/31/20181.B
6/1/2019 Update the Records Lifecycle Guideline to ensure it references the new control document and the related process to initiate the destruction of records that have passed their retention period.
Legal 6/1/20192.A
12
Page 35 of 87

REPORT NAME COMMENT NUMBER
RESPONSIBLE AREA
ORIGINAL DUE DATE
CURRENT DATE DUE ACTION REQUIRED
AUDIT DEPARTMENT
CORRECTIVE ACTION COMPLIANCE REPORT
AS OF June 30, 2018
CURRENT6/1/2019 Ensure all Records Coordinators are periodically
updated on the current process followed to dispose of records.
Legal 6/1/20192.B
6/1/2019 Implement procedures to help ensure that File Plans are complete/accurate, updated and reviewed on an annual basis by the assigned Records Coordinator.
Legal 6/1/20193.0
6/1/2019 Implement additional controls to help ensure compliance with the procedures established by the State regarding electronic records.
Legal 6/1/20194.A
6/1/2019 Perform a reconciliation to determine if all departments have documented their electronic records on their approved File Plan. Periodically peform a review of user access to restricted electronic folders to help prevent unauthorized access.
Legal 6/1/20194.B
13
Page 36 of 87

REPORT NAME COMMENT NUMBER
RESPONSIBLE AREA
ORIGINAL DUE DATE
CURRENT DATE DUE ACTION REQUIRED
AUDIT DEPARTMENT
CORRECTIVE ACTION COMPLIANCE REPORT
AS OF June 30, 2018
CURRENT12/31/2018 Update the Offsite Records Storage and
Retrieval Procedure to provide additional instructions regarding each field required on the form and require Records Management to stamp the date the form is received.
Legal 12/31/20185.0
18-9001 FY2017 KPMG Management Letter
8/1/2018 Require further training for staff and devote additional resources to ensure the full array of SAP capabilities are utilized.
Finance-Accounting/Controller 8/1/20181.0
8/1/2018 Evaluate the processes and systems currently utilized for preparing the National Transit Database (NTD) submissions.
Finance-Grant Programs 8/1/20182.0
18-9005 KPMG Single Audit 2017 7/31/2018 Implement an ongoing risk assessment process and document the risk assessment of each subrecipient at least annually.
Finance-Grant Programs 7/31/20181.0
14
Page 37 of 87
Monthly Financial Report
Finance Arthur C. Smiley III , Chief Financial Officer
- CFO's Summary- Sales Tax Report- Investment Report- Debt Report- Monthly Performance Report- Fuel Hedge Report
Page 38 of 87
Finance & Audit Committee
July 19, 2018
Page 39 of 87

2
YTD cash received is $619.6 million or ▪ $17.2 million (2.9%) more than budgeted ▪ $45.7 million (8.0%) more than FY2017
Cash received in July 2018 is $63.4 million or ▪ $4.9 million (8.4%) more than budgeted ▪ $7.3 million (13.0%) more than FY2017
July sales tax revenue is fromMay sales activity.
Page 40 of 87

3
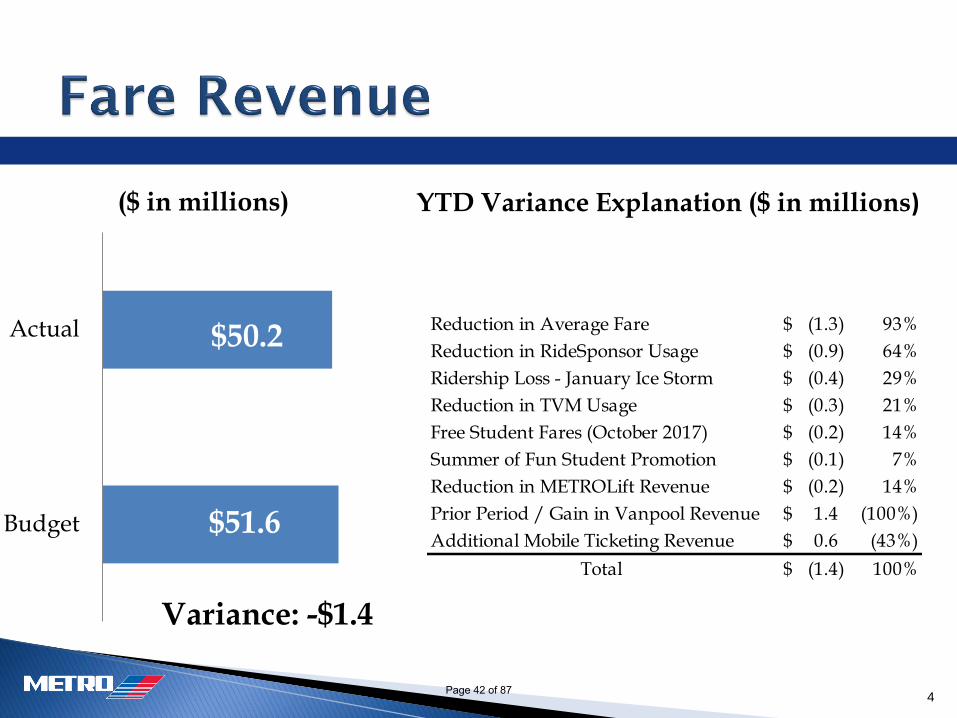
YTD Fare Revenue is $50.2 million or ▪ $1.4 million (2.7%) less than budgeted▪ $0.8 million (1.6%) less than FY2017
Fare Revenue in June 2018 is $5.0 million or▪ $0.6 million (10.7%) less than budgeted ▪ $1.0 million (16.7%) less than FY2017
Page 41 of 87
4
YTD Variance Explanation ($ in millions)
Variance: -$1.4
Reduction in Average Fare (1.3)$ 93%
Reduction in RideSponsor Usage (0.9)$ 64%
Ridership Loss - January Ice Storm (0.4)$ 29%
Reduction in TVM Usage (0.3)$ 21%
Free Student Fares (October 2017) (0.2)$ 14%
Summer of Fun Student Promotion (0.1)$ 7%
Reduction in METROLift Revenue (0.2)$ 14%
Prior Period / Gain in Vanpool Revenue 1.4$ (100%)
Additional Mobile Ticketing Revenue 0.6$ (43%)
Total (1.4)$ 100%
$51.6
$50.2
Budget
Actual
($ in millions)
Page 42 of 87
5
($ million)
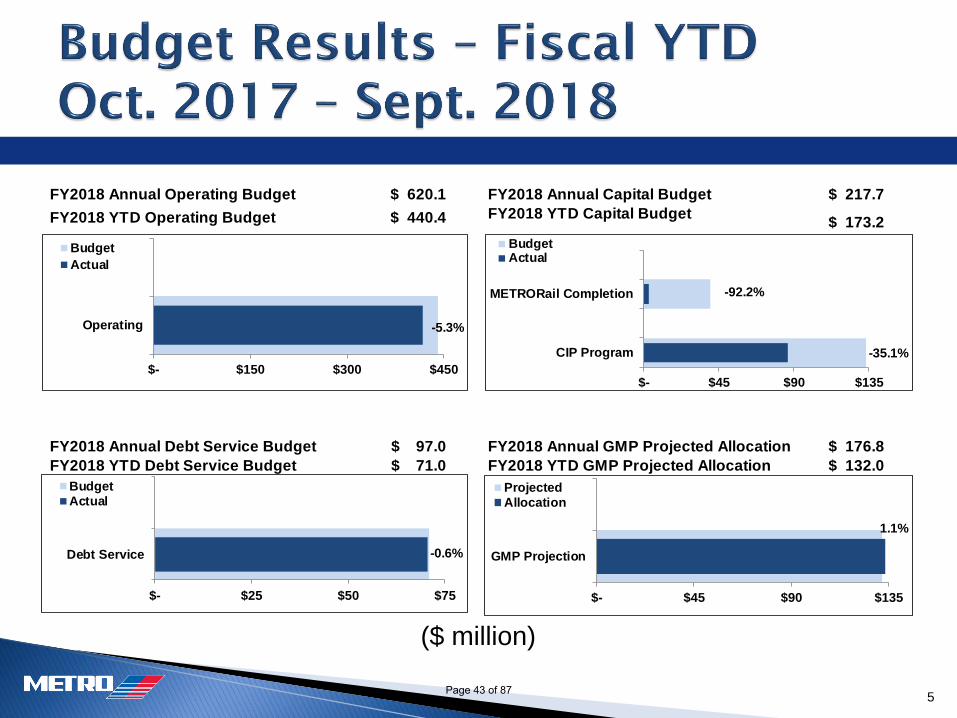
FY2018 Annual Operating Budget 620.1$ FY2018 Annual Capital Budget 217.7$
FY2018 YTD Operating Budget 440.4$ FY2018 YTD Capital Budget173.2$
FY2018 Annual Debt Service Budget 97.0$ FY2018 Annual GMP Projected Allocation 176.8$
FY2018 YTD Debt Service Budget 71.0$ FY2018 YTD GMP Projected Allocation 132.0$
-0.6%
$- $25 $50 $75
Debt Service
BudgetActual
-35.1%
-92.2%
$- $45 $90 $135
CIP Program
METRORail Completion
BudgetActual
1.1%
$- $45 $90 $135
GMP Projection
ProjectedAllocation
-5.3%
$- $150 $300 $450
Operating
Budget
Actual
Page 43 of 87
6
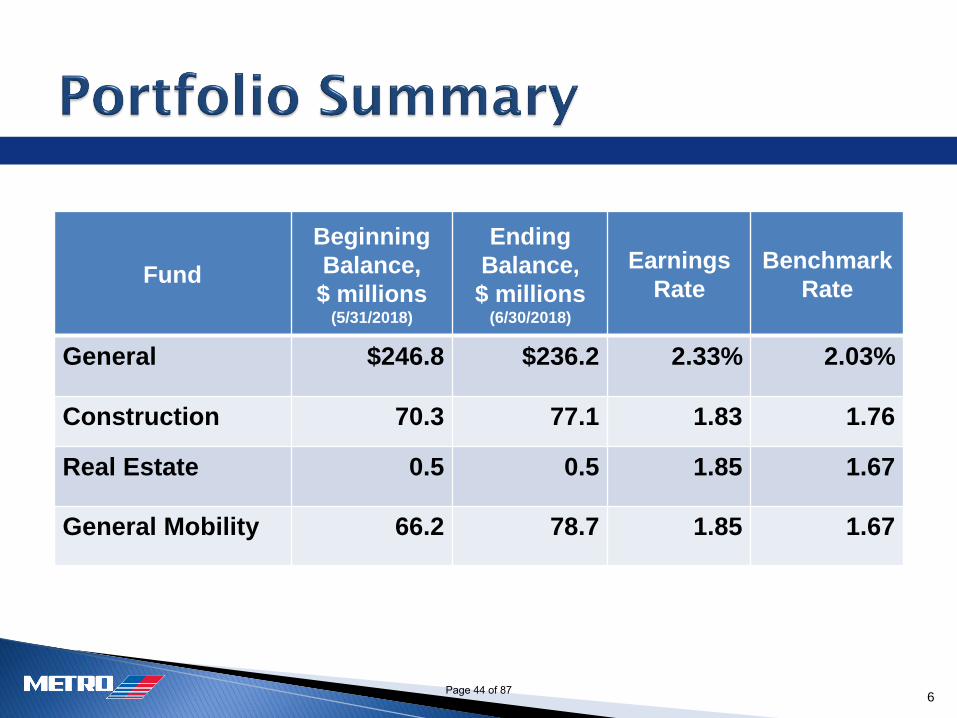
Fund
Beginning
Balance,
$ millions(5/31/2018)
Ending
Balance,
$ millions(6/30/2018)
Earnings
Rate
Benchmark
Rate
General $246.8 $236.2 2.33% 2.03%
Construction 70.3 77.1 1.83 1.76
Real Estate 0.5 0.5 1.85 1.67
General Mobility 66.2 78.7 1.85 1.67
Page 44 of 87
7
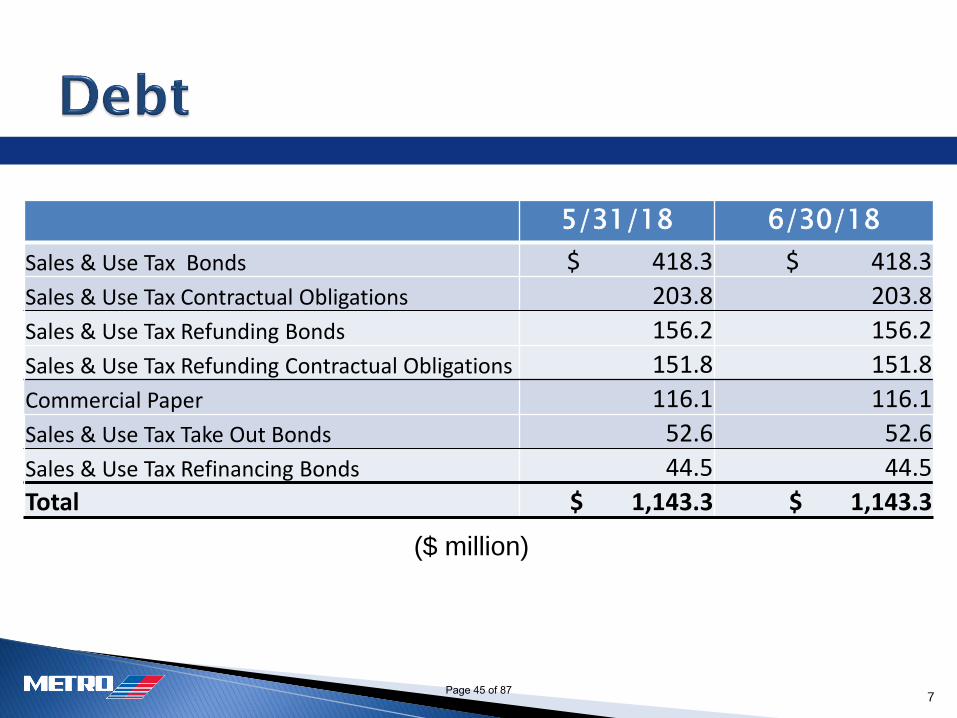
($ million)
5/31/18 6/30/18
Sales & Use Tax Bonds $ 418.3 $ 418.3
Sales & Use Tax Contractual Obligations 203.8 203.8
Sales & Use Tax Refunding Bonds 156.2 156.2
Sales & Use Tax Refunding Contractual Obligations 151.8 151.8
Commercial Paper 116.1 116.1
Sales & Use Tax Take Out Bonds 52.6 52.6
Sales & Use Tax Refinancing Bonds 44.5 44.5
Total $ 1,143.3 $ 1,143.3
Page 45 of 87

8
FY2017 FY2018
Local Bus 44,150,861 44,466,247 315,386 0.7%METRORail Service 14,114,395 14,242,982 128,587 0.9%Local Network 58,265,256 58,709,229 443,973 0.8%
Commuter Park & Ride 5,918,605 5,728,990 (189,615) (3.2%)Fixed Route 64,183,861 64,438,219 254,358 0.4%
Customized Service
METROLift 1,441,497 1,470,171 28,674 2.0%METROStar Vanpool 1,538,057 1,438,388 (99,669) (6.5%)
Change
Page 46 of 87
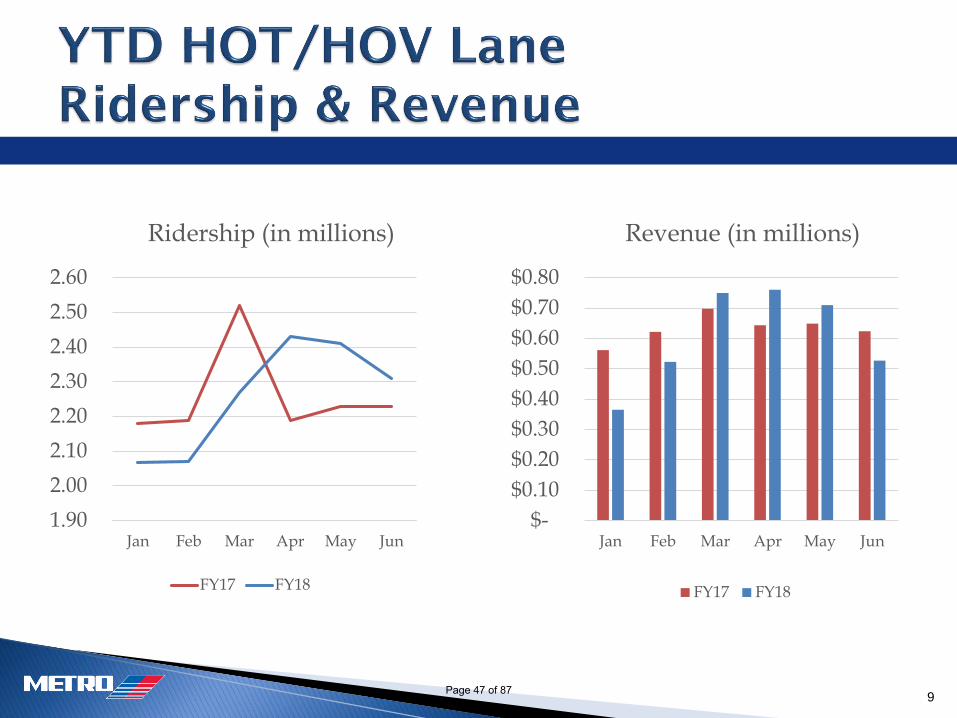
9
$-
$0.10
$0.20
$0.30
$0.40
$0.50
$0.60
$0.70
$0.80
Jan Feb Mar Apr May Jun
Revenue (in millions)
FY17 FY18
1.90
2.00
2.10
2.20
2.30
2.40
2.50
2.60
Jan Feb Mar Apr May Jun
Ridership (in millions)
FY17 FY18
Page 47 of 87
Metropolitan Transit AuthoritySales & Use Tax Report
July 2018
Treasury Services7/11/2018
Page 48 of 87
NET NET GROSS NETREC'D SALES RECEIPTS ESTIMATE RECEIPTS REBATES RECEIPTS
IN IN FY17 FY18 FY18 FY18 FY18 $ % $ %
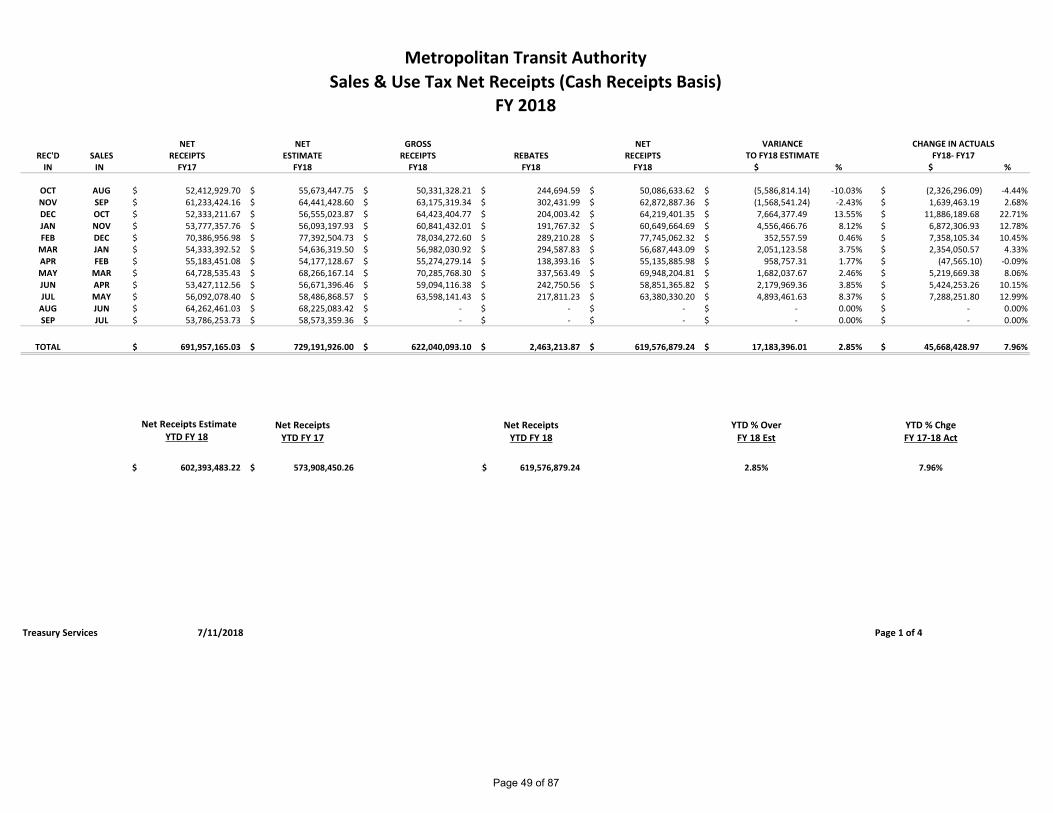
OCT AUG 52,412,929.70$ 55,673,447.75$ 50,331,328.21$ 244,694.59$ 50,086,633.62$ (5,586,814.14)$ -10.03% (2,326,296.09)$ -4.44%NOV SEP 61,233,424.16$ 64,441,428.60$ 63,175,319.34$ 302,431.99$ 62,872,887.36$ (1,568,541.24)$ -2.43% 1,639,463.19$ 2.68%DEC OCT 52,333,211.67$ 56,555,023.87$ 64,423,404.77$ 204,003.42$ 64,219,401.35$ 7,664,377.49$ 13.55% 11,886,189.68$ 22.71%JAN NOV 53,777,357.76$ 56,093,197.93$ 60,841,432.01$ 191,767.32$ 60,649,664.69$ 4,556,466.76$ 8.12% 6,872,306.93$ 12.78%FEB DEC 70,386,956.98$ 77,392,504.73$ 78,034,272.60$ 289,210.28$ 77,745,062.32$ 352,557.59$ 0.46% 7,358,105.34$ 10.45%
MAR JAN 54,333,392.52$ 54,636,319.50$ 56,982,030.92$ 294,587.83$ 56,687,443.09$ 2,051,123.58$ 3.75% 2,354,050.57$ 4.33%APR FEB 55,183,451.08$ 54,177,128.67$ 55,274,279.14$ 138,393.16$ 55,135,885.98$ 958,757.31$ 1.77% (47,565.10)$ -0.09%MAY MAR 64,728,535.43$ 68,266,167.14$ 70,285,768.30$ 337,563.49$ 69,948,204.81$ 1,682,037.67$ 2.46% 5,219,669.38$ 8.06%JUN APR 53,427,112.56$ 56,671,396.46$ 59,094,116.38$ 242,750.56$ 58,851,365.82$ 2,179,969.36$ 3.85% 5,424,253.26$ 10.15%JUL MAY 56,092,078.40$ 58,486,868.57$ 63,598,141.43$ 217,811.23$ 63,380,330.20$ 4,893,461.63$ 8.37% 7,288,251.80$ 12.99%
AUG JUN 64,262,461.03$ 68,225,083.42$ -$ -$ -$ -$ 0.00% -$ 0.00%SEP JUL 53,786,253.73$ 58,573,359.36$ -$ -$ -$ -$ 0.00% -$ 0.00%
TOTAL 691,957,165.03$ 729,191,926.00$ 622,040,093.10$ 2,463,213.87$ 619,576,879.24$ 17,183,396.01$ 2.85% 45,668,428.97$ 7.96%
Net Receipts Estimate Net Receipts Net Receipts YTD % Over YTD % ChgeYTD FY 18 YTD FY 17 YTD FY 18 FY 18 Est FY 17-18 Act
602,393,483.22$ 573,908,450.26$ 619,576,879.24$ 2.85% 7.96%
Treasury Services 7/11/2018
Metropolitan Transit Authority
Page 1 of 4
FY 2018Sales & Use Tax Net Receipts (Cash Receipts Basis)
VARIANCETO FY18 ESTIMATE
CHANGE IN ACTUALSFY18- FY17
Page 49 of 87
NET NET NET RECEIPTSREC'D SALES FISCAL RECEIPTS FISCAL RECEIPTS CHANGE AMOUNT
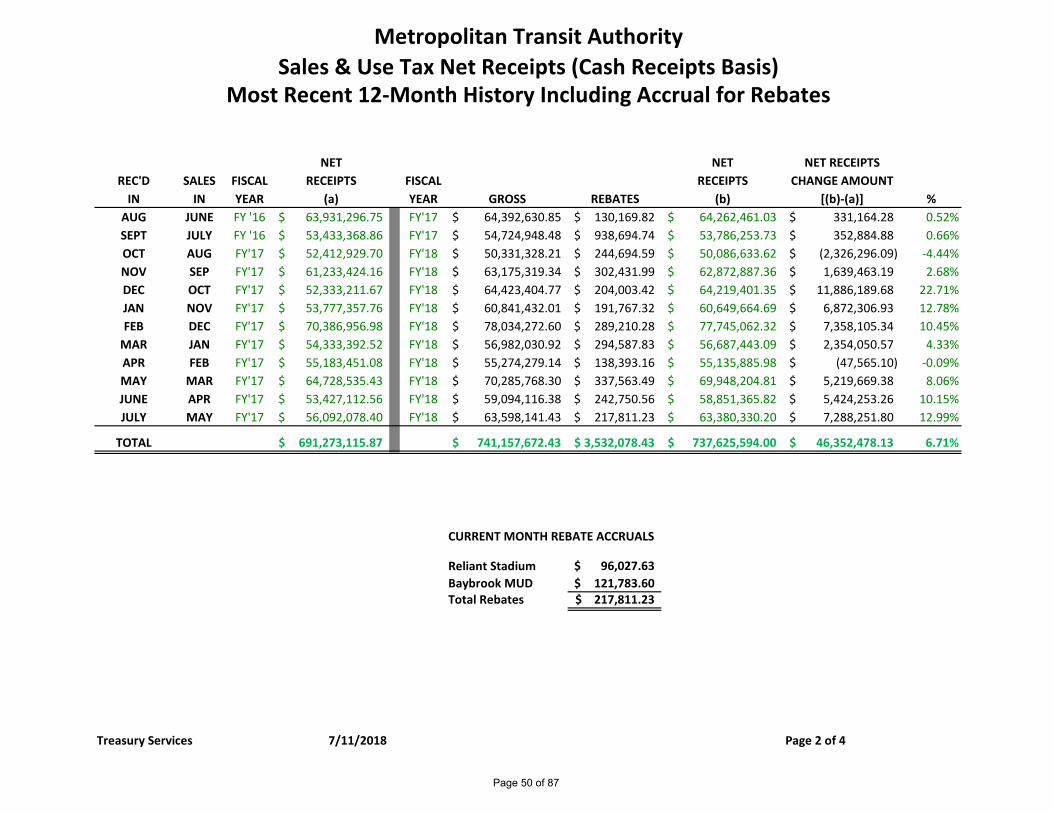
IN IN YEAR (a) YEAR GROSS REBATES (b) [(b)-(a)] %AUG JUNE FY '16 63,931,296.75$ FY'17 64,392,630.85$ 130,169.82$ 64,262,461.03$ 331,164.28$ 0.52%SEPT JULY FY '16 53,433,368.86$ FY'17 54,724,948.48$ 938,694.74$ 53,786,253.73$ 352,884.88$ 0.66%OCT AUG FY'17 52,412,929.70$ FY'18 50,331,328.21$ 244,694.59$ 50,086,633.62$ (2,326,296.09)$ -4.44%NOV SEP FY'17 61,233,424.16$ FY'18 63,175,319.34$ 302,431.99$ 62,872,887.36$ 1,639,463.19$ 2.68%DEC OCT FY'17 52,333,211.67$ FY'18 64,423,404.77$ 204,003.42$ 64,219,401.35$ 11,886,189.68$ 22.71%JAN NOV FY'17 53,777,357.76$ FY'18 60,841,432.01$ 191,767.32$ 60,649,664.69$ 6,872,306.93$ 12.78%FEB DEC FY'17 70,386,956.98$ FY'18 78,034,272.60$ 289,210.28$ 77,745,062.32$ 7,358,105.34$ 10.45%
MAR JAN FY'17 54,333,392.52$ FY'18 56,982,030.92$ 294,587.83$ 56,687,443.09$ 2,354,050.57$ 4.33%APR FEB FY'17 55,183,451.08$ FY'18 55,274,279.14$ 138,393.16$ 55,135,885.98$ (47,565.10)$ -0.09%MAY MAR FY'17 64,728,535.43$ FY'18 70,285,768.30$ 337,563.49$ 69,948,204.81$ 5,219,669.38$ 8.06%JUNE APR FY'17 53,427,112.56$ FY'18 59,094,116.38$ 242,750.56$ 58,851,365.82$ 5,424,253.26$ 10.15%JULY MAY FY'17 56,092,078.40$ FY'18 63,598,141.43$ 217,811.23$ 63,380,330.20$ 7,288,251.80$ 12.99%
TOTAL 691,273,115.87$ 741,157,672.43$ 3,532,078.43$ 737,625,594.00$ 46,352,478.13$ 6.71%
Reliant Stadium 96,027.63$ Baybrook MUD 121,783.60$ Total Rebates 217,811.23$
Treasury Services 7/11/2018
Metropolitan Transit Authority
Page 2 of 4
Most Recent 12-Month History Including Accrual for RebatesSales & Use Tax Net Receipts (Cash Receipts Basis)
CURRENT MONTH REBATE ACCRUALS
Page 50 of 87
Metropolitan Transit AuthoritySales & Use Tax Net Receipts (Cash Receipts Basis)
FY 2018
Reliant Stadium Baybrook MUD Total Rebates METRO General Mobility
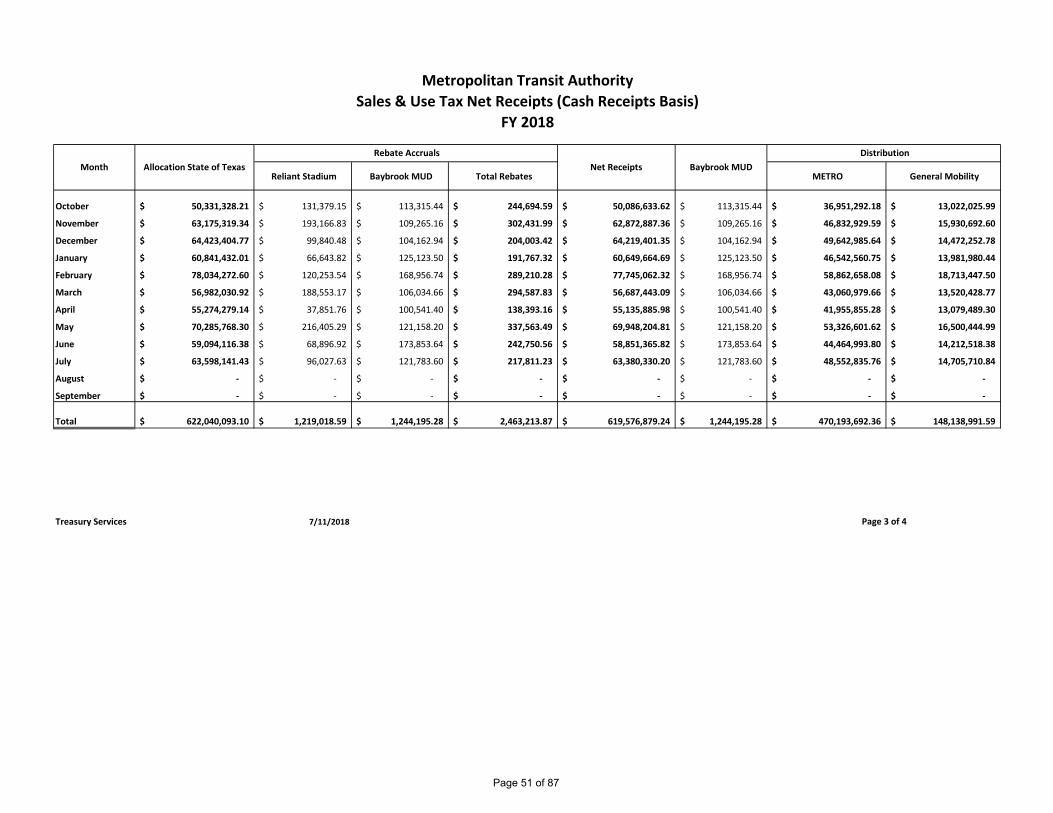
October 50,331,328.21$ 131,379.15$ 113,315.44$ 244,694.59$ 50,086,633.62$ 113,315.44$ 36,951,292.18$ 13,022,025.99$
November 63,175,319.34$ 193,166.83$ 109,265.16$ 302,431.99$ 62,872,887.36$ 109,265.16$ 46,832,929.59$ 15,930,692.60$
December 64,423,404.77$ 99,840.48$ 104,162.94$ 204,003.42$ 64,219,401.35$ 104,162.94$ 49,642,985.64$ 14,472,252.78$
January 60,841,432.01$ 66,643.82$ 125,123.50$ 191,767.32$ 60,649,664.69$ 125,123.50$ 46,542,560.75$ 13,981,980.44$
February 78,034,272.60$ 120,253.54$ 168,956.74$ 289,210.28$ 77,745,062.32$ 168,956.74$ 58,862,658.08$ 18,713,447.50$
March 56,982,030.92$ 188,553.17$ 106,034.66$ 294,587.83$ 56,687,443.09$ 106,034.66$ 43,060,979.66$ 13,520,428.77$
April 55,274,279.14$ 37,851.76$ 100,541.40$ 138,393.16$ 55,135,885.98$ 100,541.40$ 41,955,855.28$ 13,079,489.30$
May 70,285,768.30$ 216,405.29$ 121,158.20$ 337,563.49$ 69,948,204.81$ 121,158.20$ 53,326,601.62$ 16,500,444.99$
June 59,094,116.38$ 68,896.92$ 173,853.64$ 242,750.56$ 58,851,365.82$ 173,853.64$ 44,464,993.80$ 14,212,518.38$
July 63,598,141.43$ 96,027.63$ 121,783.60$ 217,811.23$ 63,380,330.20$ 121,783.60$ 48,552,835.76$ 14,705,710.84$
August -$ -$ -$ -$ -$ -$ -$ -$
September -$ -$ -$ -$ -$ -$ -$ -$
Total 622,040,093.10$ 1,219,018.59$ 1,244,195.28$ 2,463,213.87$ 619,576,879.24$ 1,244,195.28$ 470,193,692.36$ 148,138,991.59$ 50,331,328.21$ 131,379.15$ 113,315.44$ 244,694.59$ 50,086,633.62$ 113,315.44$ 37,479,988.63$ 6,246,664.77$
Treasury Services 7/11/2018
Month Allocation State of Texas
Page 3 of 4
Baybrook MUDNet Receipts Rebate Accruals Distribution
Page 51 of 87
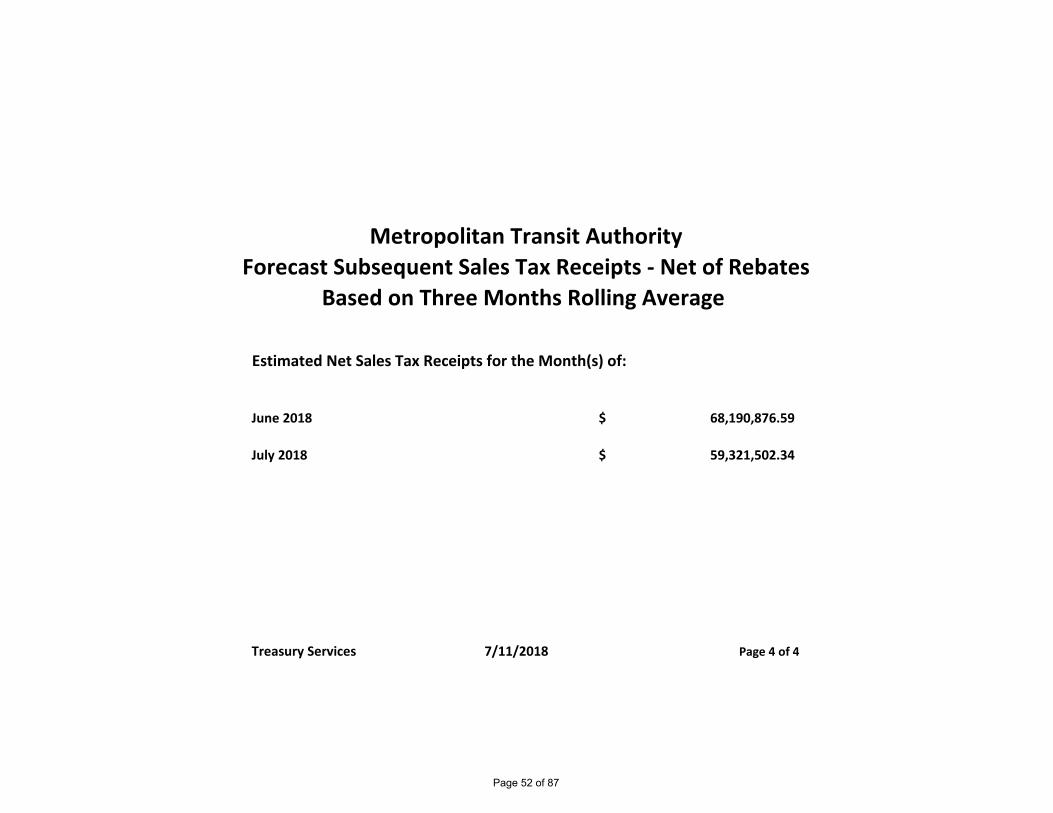
Estimated Net Sales Tax Receipts for the Month(s) of:
June 2018 68,190,876.59$
July 2018 59,321,502.34$
Treasury Services 7/11/2018 Page 4 of 4
Based on Three Months Rolling Average Forecast Subsequent Sales Tax Receipts - Net of Rebates
Metropolitan Transit Authority
Page 52 of 87
METRO
INVESTMENT REPORT
ALL FUNDS
June 2018
Page 53 of 87
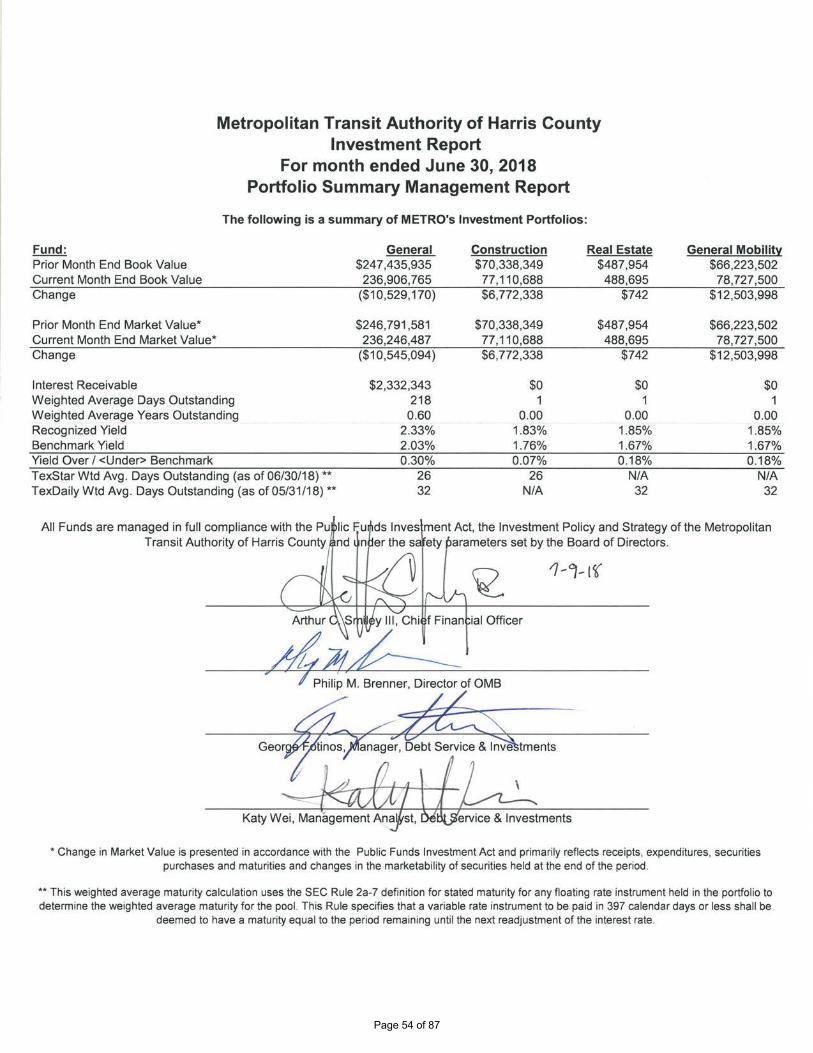
Metropolitan Transit Authority of Harris County
Investment Report
For month ended June 30, 2018
Portfolio Summary Management Report
The following is a summary of METRO's Investment Portfolios:
Fund: General Construction Real Estate General Mobilitll
Prior Month End Book Value $247,435,935 $70,338,349 $487,954 $66,223,502 Current Month End Book Value 236,906,765 77,110,688 488,695 78,727,500 Change ($10,529,170) $6,772,338 $742 $12,503,998
Prior Month End Market Value* $246,791,581 $70,338,349 $487,954 $66,223,502 Current Month End Market Value* 236,246,487 77,110,688 488,695 78,727,500 Change ($10,545,094) $6,772,338 $742 $12,503,998
Interest Receivable $2,332,343 $0 $0 $0 Weighted Average Days Outstanding 218 1 1 1 Weighted Average Years Outstanding 0.60 0.00 0.00 0.00 Recognized Yield 2.33% 1.83% 1.85% 1.85% Benchmark Yield 2.03% 1.76% 1.67% 1.67% Yield Over/ <Under> Benchmark 0.30% 0.07% 0.18% 0.18% TexStar Wtd Avg. Days Outstanding (as of 06/30/18) ** 26 26 N/A N/A
TexDaily Wtd Avg. Days Outstanding (as of 05/31/18) ** 32 N/A 32 32
All Funds are managed in full compliance with the Pu lie Fu ds lnves ment Act, the Investment Policy and Strategy of the Metropolitan Transit Authority of Harris County nd n er the s ety parameters set by the Board of Directors.
ial Officer
* Change in Market Value is presented in accordance with the Public Funds Investment Act and primarily reflects receipts, expenditures, securities purchases and maturities and changes in the marketability of securities held at the end of the period.
** This weighted average maturity calculation uses the SEC Rule 2a-7 definition for stated maturity for any floating rate instrument held in the portfolio to determine the weighted average maturity for the pool. This Rule specifies that a variable rate instrument to be paid in 397 calendar days or less shall be
deemed to have a maturity equal to the period remaining until the next readjustment of the interest rate.
Page 54 of 87

Maturity Purch
No. Description Coupon Rating Date Date Par Cost Price YTM Type 5/31/2018 6/30/2018 5/31/2018 6/30/2018
General Fund
Wells Fargo Master Account 7/1/2018 6/30/2018 5,134,938 5,134,938 100.00 NA DDA 5,900,498 5,134,938 5,900,498 5,134,938 Wells Fargo HOT Lanes Account 7/1/2018 6/30/2018 13,820 13,820 100.00 NA DDA 9,327 13,820 9,327 13,820 Wells Fargo Mobile Ticketing 7/1/2018 6/30/2018 82,572 82,572 100.00 NA DDA 53,782 82,572 53,782 82,572 Wells Fargo METROLift Online Account 7/1/2018 6/30/2018 800 800 100.00 NA DDA 825 800 825 800 TexStar Investment Pool AAAm 7/1/2018 6/30/2018 15,654,032 15,654,032 100.00 1.830% LGIP 16,626,413 15,654,032 16,626,413 15,654,032 TexDaily Investment Pool AAAm 7/1/2018 6/30/2018 23,282,739 23,282,739 100.00 1.850% LGIP 21,424,188 23,282,739 21,424,188 23,282,739 Wells Fargo Institutional Sweep 7/1/2018 6/30/2018 467,710 467,710 100.00 0.650% DSA 1,175,158 467,710 1,175,158 467,710
EWBCD21 East West Bank CD 1.100% Coll = Aaa 11/21/2018 11/21/2016 10,000,000 10,000,000 100.00 1.110% CD 10,000,000 10,000,000 10,000,000 10,000,000 4648 3133EGM69 / Federal Farm Credit Banks 1.100% AA+/Aaa 12/5/2018 1/23/2017 10,000,000 9,966,134 99.66 1.284% A 9,990,687 9,992,181 9,944,900 9,953,300 4651 3134G9UY1 / Freddie Mac 1.000% AA+/Aaa 6/29/2018 1/30/2017 5,000,000 4,994,320 99.89 1.081% A 4,999,691 Matured/Called 4,994,900 Matured/Called4652 3130A6X44 / Federal Home Loan Bank 1.250% AA+/Aaa 6/29/2018 2/15/2017 5,000,000 5,010,350 100.21 1.097% A 5,000,582 Matured/Called 4,997,650 Matured/Called4653 3130A4YA4 / Federal Home Loan Bank 1.050% AA+/Aaa 8/15/2018 2/15/2017 7,000,000 6,993,490 99.91 1.113% A 6,999,104 6,999,462 6,986,420 6,992,020 4654 3135G0E33 / Fannie Mae 1.125% AA+/Aaa 7/20/2018 2/15/2017 5,000,000 5,002,681 100.05 1.087% A 5,000,253 5,000,098 4,994,550 4,998,050 4655 3134GAGM0 / Freddie Mac 1.040% AA+/Aaa 8/24/2018 2/15/2017 5,000,000 4,992,500 99.85 1.139% A 4,998,863 4,999,269 4,989,250 4,993,350 4656 3134G9N60 / Freddie Mac 1.000% AA+/Aaa 7/27/2018 2/15/2017 5,000,000 4,993,750 99.88 1.087% A 4,999,335 4,999,691 4,992,750 4,996,750 4657 3134GAKF0 / Freddie Mac 1.110% AA+/Aaa 9/12/2018 2/22/2017 5,000,000 4,996,900 99.94 1.150% A 4,999,436 4,999,600 4,987,500 4,991,400 4658 3135G0YM9 / Fannie Mae 1.875% AA+/Aaa 9/18/2018 2/28/2017 5,000,000 5,060,210 101.20 1.092% A 5,011,595 5,008,404 4,997,600 4,999,050
EWBCD22 East West Bank CD 1.500% Coll = Aaa 3/14/2019 3/14/2017 10,000,000 10,000,000 100.00 1.510% CD 10,000,000 10,000,000 10,000,000 10,000,000 4659 313375K48 / Federal Home Loan Bank 2.000% AA+/Aaa 9/14/2018 6/14/2017 5,000,000 5,041,786 100.84 1.323% A 5,009,622 5,006,873 4,999,350 4,999,000 4660 880591EQ1 / Tennessee Valley Authority 1.750% AA+/Aaa 10/15/2018 7/18/2017 5,000,000 5,025,740 100.51 1.330% A 5,007,728 5,006,023 4,995,050 4,994,500 4661 3130AAM88 / Federal Home Loan Bank 1.625% AA+/Aaa 1/18/2019 7/18/2017 5,000,000 5,010,000 100.20 1.490% A 5,004,215 5,003,668 4,980,950 4,983,000 4662 3130A9AE1 / Federal Home Loan Bank 0.875% AA+/Aaa 10/1/2018 7/18/2017 5,000,000 4,973,450 99.47 1.321% A 4,992,622 4,994,436 4,980,150 4,985,700 4663 3130AAV62 / Federal Home Loan Bank 1.270% AA+/Aaa 2/27/2019 7/31/2017 5,000,000 4,993,700 99.87 1.351% A 4,997,031 4,997,359 4,964,900 4,967,950 4664 3133EHQF3 / Federal Farm Credit Banks 1.350% AA+/Aaa 1/7/2019 7/31/2017 5,000,000 5,000,950 100.02 1.336% A 5,000,399 5,000,344 4,977,400 4,978,750 4665 3137EADZ9 / Freddie Mac 1.125% AA+/Aaa 4/15/2019 8/16/2017 5,000,000 4,982,920 99.66 1.333% A 4,991,037 4,991,883 4,951,500 4,953,900 4666 3135G0J53 / Fannie Mae 1.000% AA+/Aaa 2/26/2019 8/16/2017 5,000,000 4,973,500 99.47 1.352% A 4,987,177 4,988,602 4,954,100 4,958,500 4667 3130ABQ25 / Federal Home Loan Bank 1.360% AA+/Aaa 3/29/2019 9/18/2017 5,000,000 4,997,450 99.95 1.394% A 4,998,620 4,998,757 4,963,450 4,965,000 4668 3133EHJG9 / Federal Farm Credit Banks 1.400% AA+/Aaa 5/15/2019 9/28/2017 5,000,000 4,993,555 99.87 1.480% A 4,996,218 4,996,544 4,959,550 4,959,850 4669 3133X72S2 / Federal Home Loan Bank 5.375% AA+/Aaa 5/15/2019 9/29/2017 5,000,000 5,312,400 106.25 1.475% A 5,183,641 5,167,809 5,145,450 5,128,950 4670 3133EHZF3 / Federal Farm Credit Banks 1.375% AA+/Aaa 6/19/2019 11/21/2017 5,000,000 4,972,000 99.44 1.736% A 4,981,317 4,982,780 4,952,550 4,951,550 4671 459058FC2 / World Bank 1.250% AA+/Aaa 4/26/2019 11/21/2017 5,000,000 4,962,150 99.24 1.788% A 4,976,053 4,978,236 4,951,650 4,953,300 4672 3137EAEB1 / Freddie Mac 0.875% AA+/Aaa 7/19/2019 11/21/2017 5,000,000 4,928,750 98.58 1.749% A 4,951,281 4,954,820 4,920,850 4,921,000 4673 3133EGFU4 / Federal Farm Credit Banks 1.210% AA+/Aaa 6/20/2019 11/21/2017 5,000,000 4,955,150 99.10 1.788% A 4,970,048 4,972,388 4,941,250 4,941,750 4674 3137EAEB1 / Freddie Mac 0.875% AA+/Aaa 7/19/2019 11/22/2017 5,000,000 4,924,586 98.49 1.802% A 4,948,348 4,952,100 4,920,850 4,921,000 4675 3135G0N33 / Fannie Mae 0.875% AA+/Aaa 8/2/2019 12/20/2017 5,000,000 4,920,600 98.41 1.877% A 4,942,438 4,946,483 4,916,800 4,916,900 4676 3130A8Y72 / Federal Home Loan Bank 0.875% AA+/Aaa 8/5/2019 1/3/2018 6,000,000 5,901,307 98.36 1.931% A 5,926,578 5,931,700 5,897,940 5,899,080 4677 912828F62 / US Treasury Note 1.500% AA+/Aaa 10/31/2019 2/13/2018 5,000,000 4,950,586 99.01 2.091% T 4,959,059 4,961,435 4,940,800 4,937,900 4678 459058FQ1 / World Bank 1.200% AA+/Aaa 9/30/2019 2/13/2018 6,000,000 5,910,696 98.51 2.133% A 5,926,810 5,931,328 5,904,060 5,901,300 4679 3133EJAK5 / Federal Farm Credit Banks 2.010% AA+/Aaa 9/25/2019 2/13/2018 5,000,000 4,993,750 99.88 2.089% A 4,994,887 4,995,206 4,980,000 4,974,000 4680 912828F62 / US Treasury Note 1.500% AA+/Aaa 10/31/2019 2/16/2018 4,000,000 3,954,531 98.86 2.184% T 3,962,146 3,964,343 3,952,640 3,950,320 4681 3135G0ZY2 / Fannie Mae 1.750% AA+/Aaa 11/26/2019 3/21/2018 5,000,000 4,953,600 99.07 2.316% A 4,958,965 4,961,233 4,956,800 4,950,700 4682 459058FS7 / World Bank 1.125% AA+/Aaa 11/27/2019 5/17/2018 5,000,000 4,889,850 97.80 2.606% A 4,892,614 4,898,536 4,902,200 4,900,600 4683 3130A0JR2 / Federal Home Loan Bank 2.375% AA+/Aaa 12/13/2019 5/16/2018 5,000,000 4,987,950 99.76 2.531% A 4,988,264 4,988,893 4,997,750 4,990,450 4684 3130A0JR2 / Federal Home Loan Bank 2.375% AA+/Aaa 12/13/2019 5/16/2018 4,710,000 4,698,790 99.76 2.529% A 4,699,083 4,699,667 4,707,881 4,701,004
Total General Fund 247,435,935 236,906,765 246,791,581 236,246,487
Notes: AAA is the highest long-term rating. A-1+ is the highest short term rating. MMA: Money Market Account DDA: Demand Deposit Account T: U. S. Treasuries LGIP: Local Government Investment Pool NA*: Implicit backing of the Federal Government DSA: FDIC-insured Sweep Account TPF: Trust Payment Fund (Cash) MB: Municipal Bond MCP: Municipal Commercial Paper CD: Certificate of Deposit A: U. S. Agency & Instrumentality Bond
Book Value Market Value
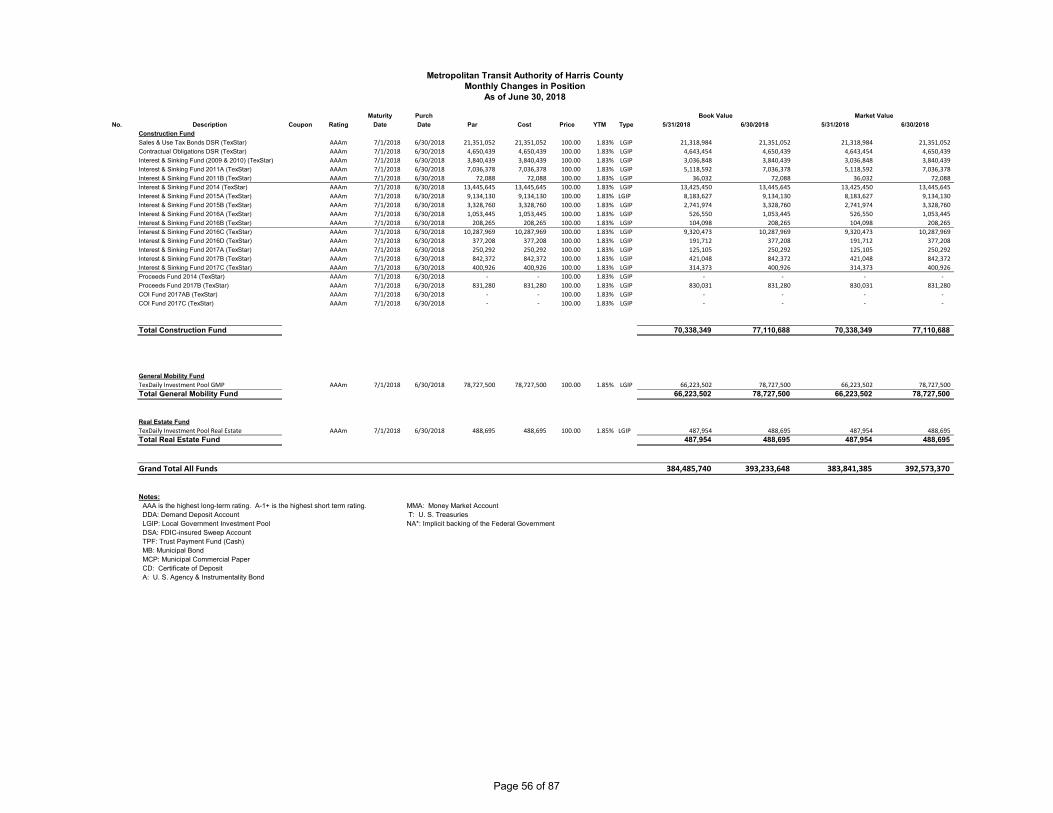
Metropolitan Transit Authority of Harris CountyMonthly Changes in Position
As of June 30, 2018
Page 55 of 87
Maturity Purch
No. Description Coupon Rating Date Date Par Cost Price YTM Type 5/31/2018 6/30/2018 5/31/2018 6/30/2018
Book Value Market Value
Metropolitan Transit Authority of Harris CountyMonthly Changes in Position
As of June 30, 2018
Construction Fund
Sales & Use Tax Bonds DSR (TexStar) AAAm 7/1/2018 6/30/2018 21,351,052 21,351,052 100.00 1.83% LGIP 21,318,984 21,351,052 21,318,984 21,351,052 Contractual Obligations DSR (TexStar) AAAm 7/1/2018 6/30/2018 4,650,439 4,650,439 100.00 1.83% LGIP 4,643,454 4,650,439 4,643,454 4,650,439 Interest & Sinking Fund (2009 & 2010) (TexStar) AAAm 7/1/2018 6/30/2018 3,840,439 3,840,439 100.00 1.83% LGIP 3,036,848 3,840,439 3,036,848 3,840,439 Interest & Sinking Fund 2011A (TexStar) AAAm 7/1/2018 6/30/2018 7,036,378 7,036,378 100.00 1.83% LGIP 5,118,592 7,036,378 5,118,592 7,036,378 Interest & Sinking Fund 2011B (TexStar) AAAm 7/1/2018 6/30/2018 72,088 72,088 100.00 1.83% LGIP 36,032 72,088 36,032 72,088 Interest & Sinking Fund 2014 (TexStar) AAAm 7/1/2018 6/30/2018 13,445,645 13,445,645 100.00 1.83% LGIP 13,425,450 13,445,645 13,425,450 13,445,645 Interest & Sinking Fund 2015A (TexStar) AAAm 7/1/2018 6/30/2018 9,134,130 9,134,130 100.00 1.83% LGIP 8,183,627 9,134,130 8,183,627 9,134,130 Interest & Sinking Fund 2015B (TexStar) AAAm 7/1/2018 6/30/2018 3,328,760 3,328,760 100.00 1.83% LGIP 2,741,974 3,328,760 2,741,974 3,328,760 Interest & Sinking Fund 2016A (TexStar) AAAm 7/1/2018 6/30/2018 1,053,445 1,053,445 100.00 1.83% LGIP 526,550 1,053,445 526,550 1,053,445 Interest & Sinking Fund 2016B (TexStar) AAAm 7/1/2018 6/30/2018 208,265 208,265 100.00 1.83% LGIP 104,098 208,265 104,098 208,265 Interest & Sinking Fund 2016C (TexStar) AAAm 7/1/2018 6/30/2018 10,287,969 10,287,969 100.00 1.83% LGIP 9,320,473 10,287,969 9,320,473 10,287,969 Interest & Sinking Fund 2016D (TexStar) AAAm 7/1/2018 6/30/2018 377,208 377,208 100.00 1.83% LGIP 191,712 377,208 191,712 377,208 Interest & Sinking Fund 2017A (TexStar) AAAm 7/1/2018 6/30/2018 250,292 250,292 100.00 1.83% LGIP 125,105 250,292 125,105 250,292 Interest & Sinking Fund 2017B (TexStar) AAAm 7/1/2018 6/30/2018 842,372 842,372 100.00 1.83% LGIP 421,048 842,372 421,048 842,372 Interest & Sinking Fund 2017C (TexStar) AAAm 7/1/2018 6/30/2018 400,926 400,926 100.00 1.83% LGIP 314,373 400,926 314,373 400,926 Proceeds Fund 2014 (TexStar) AAAm 7/1/2018 6/30/2018 ‐ ‐ 100.00 1.83% LGIP ‐ ‐ ‐ ‐ Proceeds Fund 2017B (TexStar) AAAm 7/1/2018 6/30/2018 831,280 831,280 100.00 1.83% LGIP 830,031 831,280 830,031 831,280 COI Fund 2017AB (TexStar) AAAm 7/1/2018 6/30/2018 ‐ ‐ 100.00 1.83% LGIP ‐ ‐ ‐ ‐ COI Fund 2017C (TexStar) AAAm 7/1/2018 6/30/2018 ‐ ‐ 100.00 1.83% LGIP ‐ ‐ ‐ ‐
Total Construction Fund 70,338,349 77,110,688 70,338,349 77,110,688
General Mobility Fund
TexDaily Investment Pool GMP AAAm 7/1/2018 6/30/2018 78,727,500 78,727,500 100.00 1.85% LGIP 66,223,502 78,727,500 66,223,502 78,727,500 Total General Mobility Fund 66,223,502 78,727,500 66,223,502 78,727,500
Real Estate Fund
TexDaily Investment Pool Real Estate AAAm 7/1/2018 6/30/2018 488,695 488,695 100.00 1.85% LGIP 487,954 488,695 487,954 488,695 Total Real Estate Fund 487,954 488,695 487,954 488,695
Grand Total All Funds 384,485,740 393,233,648 383,841,385 392,573,370
Notes: AAA is the highest long-term rating. A-1+ is the highest short term rating. MMA: Money Market Account DDA: Demand Deposit Account T: U. S. Treasuries LGIP: Local Government Investment Pool NA*: Implicit backing of the Federal Government DSA: FDIC-insured Sweep Account TPF: Trust Payment Fund (Cash) MB: Municipal Bond MCP: Municipal Commercial Paper CD: Certificate of Deposit A: U. S. Agency & Instrumentality Bond
Page 56 of 87
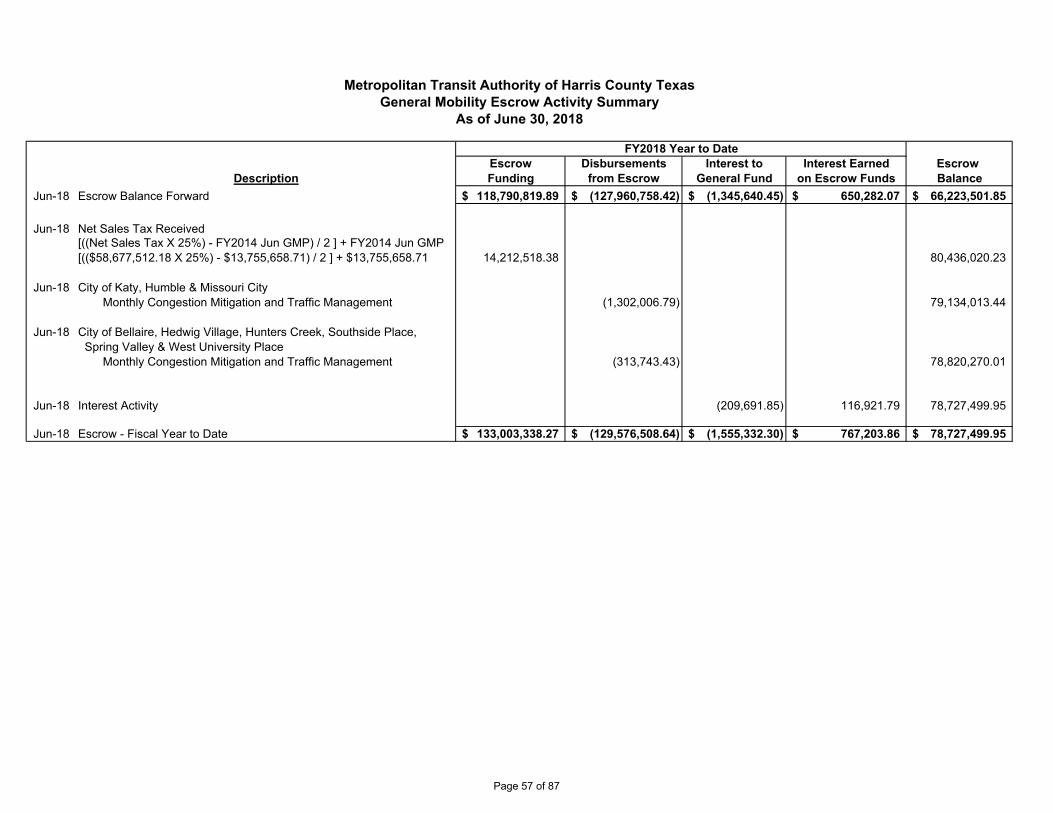
Escrow Disbursements Interest to Interest Earned Escrow Funding from Escrow General Fund on Escrow Funds Balance
Jun-18 Escrow Balance Forward 118,790,819.89$ (127,960,758.42)$ (1,345,640.45)$ 650,282.07$ 66,223,501.85$
Jun-18 Net Sales Tax Received[((Net Sales Tax X 25%) - FY2014 Jun GMP) / 2 ] + FY2014 Jun GMP[(($58,677,512.18 X 25%) - $13,755,658.71) / 2 ] + $13,755,658.71 14,212,518.38 80,436,020.23
Jun-18 City of Katy, Humble & Missouri CityMonthly Congestion Mitigation and Traffic Management (1,302,006.79) 79,134,013.44
Jun-18 City of Bellaire, Hedwig Village, Hunters Creek, Southside Place, Spring Valley & West University Place
Monthly Congestion Mitigation and Traffic Management (313,743.43) 78,820,270.01
Jun-18 Interest Activity (209,691.85) 116,921.79 78,727,499.95
Jun-18 Escrow - Fiscal Year to Date 133,003,338.27$ (129,576,508.64)$ (1,555,332.30)$ 767,203.86$ 78,727,499.95$
Metropolitan Transit Authority of Harris County TexasGeneral Mobility Escrow Activity Summary
As of June 30, 2018
FY2018 Year to Date
Description
Page 57 of 87
METRO
DEBT REPORT
June 2018
Page 58 of 87

Type of Debt Purpose Issued Par ValueAverage
RateIssuance Date Maturity / Term
Cost of Issuance
Interest Earned on Proceeds
Disbursements from Proceeds
Outstanding Balance
Commercial Paper General Mobility 169,402,000$ Wtd. Avg. 1.698%
Program Inception 10-Jan-06
Wtd. Avg. 54.53 days 7,014,204$ 241,452$ 169,402,000$ 95,502,000$
Certificates of Participation (COPS) Series 2008A
46 Orion HEV Buses 52 MCI HEV Buses
62,255,000$ 4.413% July 15, 2008 Defeased August 31, 2016 215,568$ 420,316$ 61,959,754$ -$
Certificates of Participation (COPS) Series 2008B
10 Signature Orions 50 MCI HEV
45,785,000$ 4.965% December 9, 2008 Defeased August 31, 2016 151,402$ 97,461$ 41,937,000$ -$
Sales & Use Tax Contractual Obligations Series 2009D
40 Orion HEV Buses 20 MCI HEV Buses
35,050,000$ 4.204% December 30, 2009 Defeased November 1, 2017 175,686$ 8,913$ 35,612,306$ -$
Sales & Use Tax Contractual Obligations Series 2010A
80 Orion HEV Buses 40,290,000$ 3.101% June 23, 2010Pre Refund: November 1, 2022 Post Refund: November 1, 2021
186,496$ 27,485$ 41,902,115$ 6,885,000$
Sales & Use Tax Contractual Obligations Series 2011B
100 Orion HEV Buses 49,405,000$ 2.320% September 28, 2011Pre Refund: November 1, 2023 Post Refund: November 1, 2022
93,614$ 7,784$ 53,007,784$ 9,575,000$
Sales & Use Tax Contractual Obligations Series 2014
70 Nova Articulated Buses 70 MCI Commuter Buses 40 NABI Transit Buses
97,953,750$ 2.893% April 22, 2014 November 1, 2029 881,445$ 11,381.00$ 106,690,895$ 60,448,750$
Sales & Use Tax Contractual Obligations Series 2015B
75 NABI Buses 50 NABI CNG Buses
25 MCI Commuter Buses62,485,000$ 2.392% August 28, 2015 November 1, 2028 500,949$ 8$ 72,789,714$ 54,475,000$
Sales & Use Tax Series 2015A CP Take Out 52,575,000$ 1.486% August 28, 2015 August 15, 2020 385,930$ -$ 60,000,000$ 52,575,000$
Sales & Use Tax Contractual Obligations Series 2016D
80 Nova 40' Transit Buses 20 60' Articulated Buses
44,445,000$ 2.530% December 1, 2016 November 1, 2028 575,919$ 49,230$ 49,580,273$ 44,445,000$
Sales & Use Tax Refunding Contractual Obligations Series 2017B
100 New Flyer 40' Transit Buses
45 45' MCI Commuter Buses Refunded:
$4,665,000 of Series 2009B, $13,520,000 of Series 2009D, $12,425,000 of Series 2010A,
$18,110,000 of Series 2011B, & $2,000,000 of Series 2014
100,950,000$ 1.950% October 18, 2017 November 1, 2029 826,213$ 152,729$ 68,519,170$ 100,950,000$
Sales & Use Tax Refunding Contractual Obligations Series 2017C
Refunded $21,315,000 of Series 2014
25,200,000$ 2.310% December 15, 2017 November 1, 2027 197,926$ 413$ 25,124,201$ 25,200,000$
Total Non-METRORail Expansion 785,795,750$ 2.125% 11,205,351$ 1,017,172$ 786,525,212$ 450,055,750$
Commercial PaperMETRORail Expansion
Real Estate20,598,000$
Wtd. Avg. 1.698%
Program Inception 10-Jan-06
Wtd. Avg. 54.53 days 852,967$ 29,362$ 20,598,000$ 20,598,000$
Sales & Use Tax Bonds Series 2009A
North and Southeast Corridor Expansion
94,465,000$ 4.963% June 11, 2009Pre Refund: November 1, 2029 Post Refund: November 1, 2018
560,859$ 145,597$ 96,577,321$ 4,195,000$
Sales & Use Tax Contractual Obligations Series 2009B
Rail Vehicles & Set-Up 42,780,000$ 4.476% June 11, 2009 Defeased November 1, 2017 253,994$ 83,868$ 42,161,735$ -$
Sales & Use Tax Bonds Series 2009C Build America Bonds
North and Southeast Corridor Expansion
82,555,000$ 4.559% June 11, 2009 November 1, 2038 440,193$ 222,578$ 77,116,267$ 82,555,000$
Sales & Use Tax Bonds Series 2011A
North and Southeast Corridor Expansion
461,010,000$ 4.264% September 28, 2011 November 1, 2041 869,366$ 285,759$ 461,301,403$ 331,575,000$
Sales & Use Tax Contractual Obligations Series 2014
10 East Corridor CAF Light Rail Vehicles
32,651,250$ 2.893% April 22, 2014 November 1, 2029 293,815$ 207,565$ 35,657,462$ 27,921,250$
Sales & Use Tax Refunding Bonds Series 2016A
Refunded $81,980,000 of Series 2011A & $54,000,000
of Series 2009A126,245,000$ 2.207% April 27, 2016 November 1, 2029 937,716$ 122$ 159,952,249$ 126,245,000$
Sales & Use Tax Refunding Contractual Obligations Series 2016B
Refunded $28,365,000 of Series 2009B
25,635,000$ 2.583% April 27, 2016 November 1, 2033 295,017$ 49$ 31,680,692$ 25,635,000$
Sales & Use Tax Bonds Series 2016C
Refinanced $29,910,000 of 2008A COPS & $26,525,000
of 2008B COPS55,330,000$ 1.601% August 31, 2016 August 1, 2021 179,849$ 27$ 59,844,643$ 44,505,000$
Sales & Use Tax Refunding Bonds Series 2017A
Refunded $23,280,000 of Series 2011A & $9,045,000
of Series 2009A29,995,000$ 1.692% October 18, 2017 November 1, 2025 332,004$ -$ 35,039,618$ 29,995,000$
Total METRORail Expansion 971,264,250$ 3.453% 5,015,780$ 974,927$ 1,019,929,390$ 693,224,250$
Total Debt 1,757,060,000$ 2.930% 16,221,132$ 1,992,100$ 1,806,454,602$ 1,143,280,000$
Metropolitan Transit Authority of Harris County TexasDebt Report
As of June 30, 2018
Page 59 of 87
METRO
Fiscal Year 2018
Monthly Performance Report
Revenue • Expense • Ridership • Performance
June 2018(Third Quarter Fiscal Year-to Date)
7/12/2018 Page 60 of 87
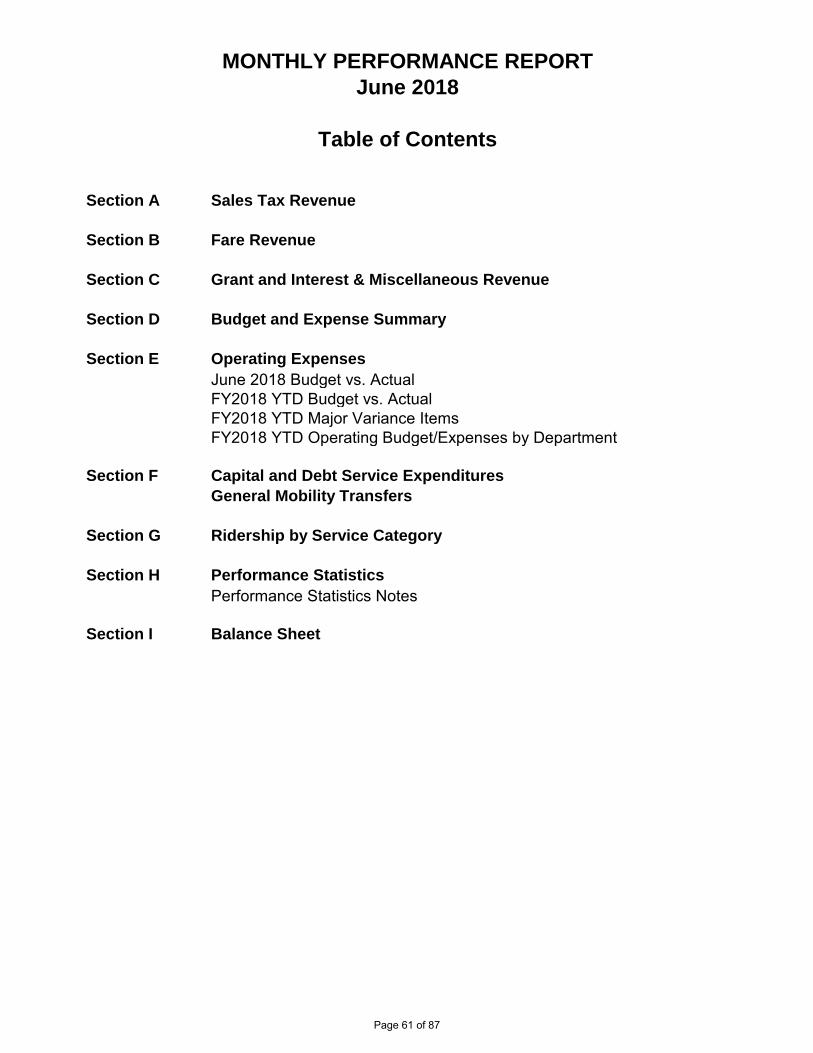
Section A Sales Tax Revenue
Section B Fare Revenue
Section C Grant and Interest & Miscellaneous Revenue
Section D Budget and Expense Summary
Section E Operating Expenses
June 2018 Budget vs. ActualFY2018 YTD Budget vs. ActualFY2018 YTD Major Variance ItemsFY2018 YTD Operating Budget/Expenses by Department
Section F Capital and Debt Service Expenditures
General Mobility Transfers
Section G Ridership by Service Category
Section H Performance Statistics
Performance Statistics Notes
Section I Balance Sheet
Section J Quarterly Budget Change Requests
June 2018
MONTHLY PERFORMANCE REPORT
Table of Contents
Page 61 of 87
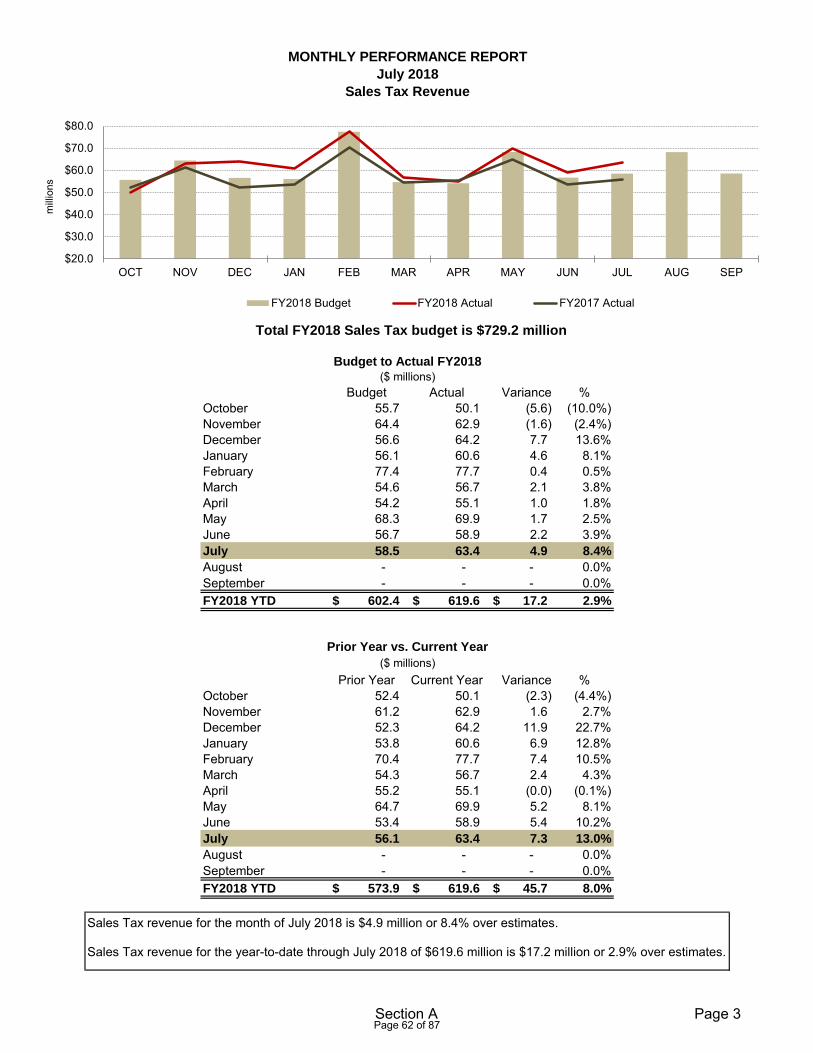
Budget Actual Variance %October 55.7 50.1 (5.6) (10.0%)November 64.4 62.9 (1.6) (2.4%)December 56.6 64.2 7.7 13.6%January 56.1 60.6 4.6 8.1%February 77.4 77.7 0.4 0.5%March 54.6 56.7 2.1 3.8%April 54.2 55.1 1.0 1.8%May 68.3 69.9 1.7 2.5%June 56.7 58.9 2.2 3.9%July 58.5 63.4 4.9 8.4%
August - - - 0.0%September - - - 0.0%FY2018 YTD 602.4$ 619.6$ 17.2$ 2.9%
Prior Year Current Year Variance %October 52.4 50.1 (2.3) (4.4%)November 61.2 62.9 1.6 2.7%December 52.3 64.2 11.9 22.7%January 53.8 60.6 6.9 12.8%February 70.4 77.7 7.4 10.5%March 54.3 56.7 2.4 4.3%April 55.2 55.1 (0.0) (0.1%)May 64.7 69.9 5.2 8.1%June 53.4 58.9 5.4 10.2%July 56.1 63.4 7.3 13.0%
August - - - 0.0%September - - - 0.0%FY2018 YTD 573.9$ 619.6$ 45.7$ 8.0%
MONTHLY PERFORMANCE REPORT
July 2018
Sales Tax Revenue
Sales Tax revenue for the month of July 2018 is $4.9 million or 8.4% over estimates.
Sales Tax revenue for the year-to-date through July 2018 of $619.6 million is $17.2 million or 2.9% over estimates.
Total FY2018 Sales Tax budget is $729.2 million
($ millions)Prior Year vs. Current Year
($ millions)Budget to Actual FY2018
$20.0
$30.0
$40.0
$50.0
$60.0
$70.0
$80.0
OCT NOV DEC JAN FEB MAR APR MAY JUN JUL AUG SEP
milli
ons
FY2018 Budget FY2018 Actual FY2017 Actual
Section A Page 3 Page 62 of 87
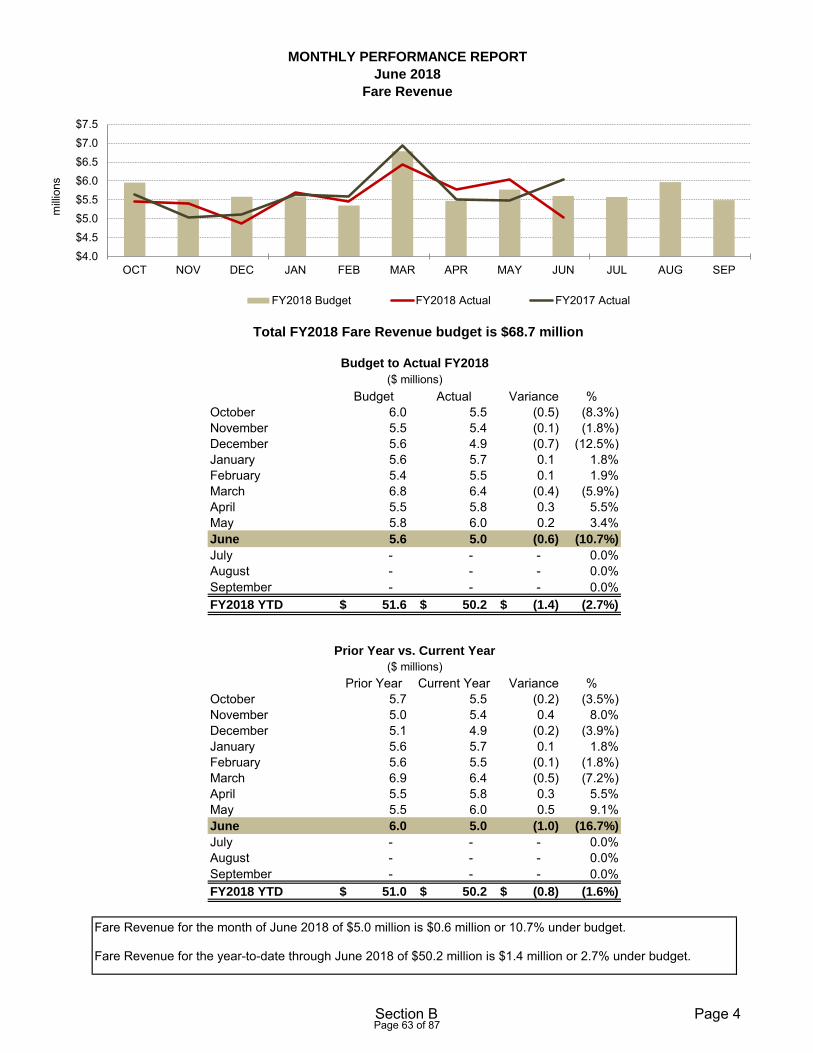
Budget Actual Variance %October 6.0 5.5 (0.5) (8.3%)November 5.5 5.4 (0.1) (1.8%)December 5.6 4.9 (0.7) (12.5%)January 5.6 5.7 0.1 1.8%February 5.4 5.5 0.1 1.9%March 6.8 6.4 (0.4) (5.9%)April 5.5 5.8 0.3 5.5%May 5.8 6.0 0.2 3.4%June 5.6 5.0 (0.6) (10.7%)
July - - - 0.0%August - - - 0.0%September - - - 0.0%FY2018 YTD 51.6$ 50.2$ (1.4)$ (2.7%)
Prior Year Current Year Variance %October 5.7 5.5 (0.2) (3.5%)November 5.0 5.4 0.4 8.0%December 5.1 4.9 (0.2) (3.9%)January 5.6 5.7 0.1 1.8%February 5.6 5.5 (0.1) (1.8%)March 6.9 6.4 (0.5) (7.2%)April 5.5 5.8 0.3 5.5%May 5.5 6.0 0.5 9.1%June 6.0 5.0 (1.0) (16.7%)
July - - - 0.0%August - - - 0.0%September - - - 0.0%FY2018 YTD 51.0$ 50.2$ (0.8)$ (1.6%)
Fare Revenue
June 2018
MONTHLY PERFORMANCE REPORT
Fare Revenue for the month of June 2018 of $5.0 million is $0.6 million or 10.7% under budget.
Fare Revenue for the year-to-date through June 2018 of $50.2 million is $1.4 million or 2.7% under budget.
Total FY2018 Fare Revenue budget is $68.7 million
Budget to Actual FY2018
($ millions)
($ millions)Prior Year vs. Current Year
$4.0$4.5$5.0$5.5$6.0$6.5$7.0$7.5
OCT NOV DEC JAN FEB MAR APR MAY JUN JUL AUG SEP
milli
ons
FY2018 Budget FY2018 Actual FY2017 Actual
Section B Page 4 Page 63 of 87

Budget Actual Variance %October 6.3 2.8 (3.5) (55.6%)November 6.3 0.8 (5.5) (87.3%)December 6.3 0.4 (5.9) (93.7%)January 6.3 0.4 (5.9) (93.7%)February 6.3 0.4 (5.9) (93.7%)March 6.3 0.5 (5.8) (92.1%)April 6.3 0.6 (5.7) (90.5%)May 6.3 0.5 (5.8) (92.1%)June 6.3 0.4 (5.9) (93.7%)
July - - - 0.0%August - - - 0.0%September - - - 0.0%FY2018 YTD 57.1$ 6.9$ (50.2)$ (87.9%)
Budget Actual Variance %October 3.4 0.2 (3.2) (94.1%)November 3.4 1.1 (2.3) (67.6%)December 3.4 0.9 (2.5) (73.5%)January 3.4 0.3 (3.1) (91.2%)February 3.4 0.3 (3.1) (91.2%)March 3.4 0.6 (2.8) (82.4%)April 3.4 (1.7) (5.1) (150.0%)May 3.4 0.9 (2.5) (73.5%)June 3.4 0.9 (2.5) (73.5%)
July - - - 0.0%August - - - 0.0%September - - - 0.0%FY2018 YTD 30.7$ 3.6$ (27.1)$ (88.3%)
Service Related Grant Revenue for the month of June 2018 of $0.4 million is $5.9 million or 93.7% under budget.
MONTHLY PERFORMANCE REPORT
June 2018
Service Related Grant Revenue
Total FY2018 Service Related Grant budget is $76.1 million($ millions)
Service Related Grant Revenue for the year-to-date through June 2018 of $6.9 million is $50.2 million or 87.9% under budget.
Capital Grant Revenue for the year-to-date through June 2018 of $3.6 million is $27.1 million under budget.
Total FY2018 Capital Grant budget is $52.2 million
($ millions)
Capital Grant Revenue
Section C Page 5 Page 64 of 87
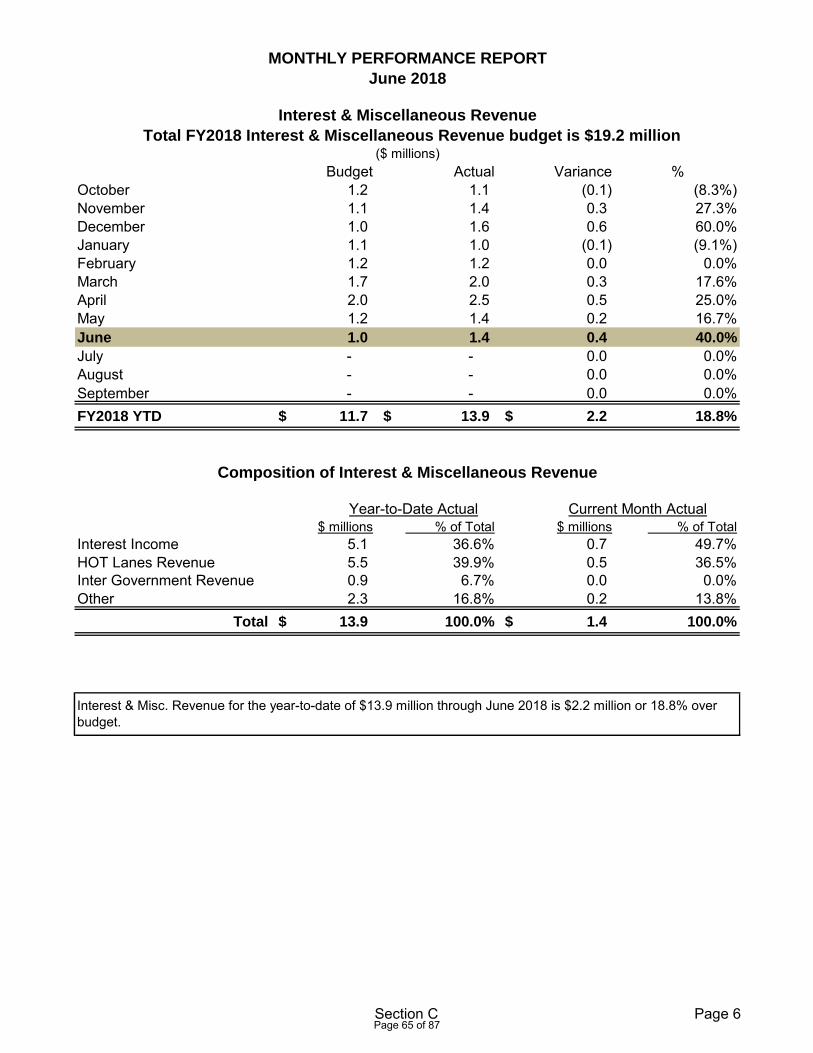
Budget Actual Variance %October 1.2 1.1 (0.1) (8.3%)November 1.1 1.4 0.3 27.3%December 1.0 1.6 0.6 60.0%January 1.1 1.0 (0.1) (9.1%)February 1.2 1.2 0.0 0.0%March 1.7 2.0 0.3 17.6%April 2.0 2.5 0.5 25.0%May 1.2 1.4 0.2 16.7%June 1.0 1.4 0.4 40.0%
July - - 0.0 0.0%August - - 0.0 0.0%September - - 0.0 0.0%FY2018 YTD 11.7$ 13.9$ 2.2$ 18.8%
$ millions % of Total $ millions % of TotalInterest Income 5.1 36.6% 0.7 49.7%HOT Lanes Revenue 5.5 39.9% 0.5 36.5%Inter Government Revenue 0.9 6.7% 0.0 0.0%Other 2.3 16.8% 0.2 13.8%
Total 13.9$ 100.0% 1.4$ 100.0%
Interest & Misc. Revenue for the year-to-date of $13.9 million through June 2018 is $2.2 million or 18.8% over budget.
($ millions)
Year-to-Date Actual Current Month Actual
Interest & Miscellaneous Revenue
MONTHLY PERFORMANCE REPORT
June 2018
Total FY2018 Interest & Miscellaneous Revenue budget is $19.2 million
Composition of Interest & Miscellaneous Revenue
Section C Page 6 Page 65 of 87
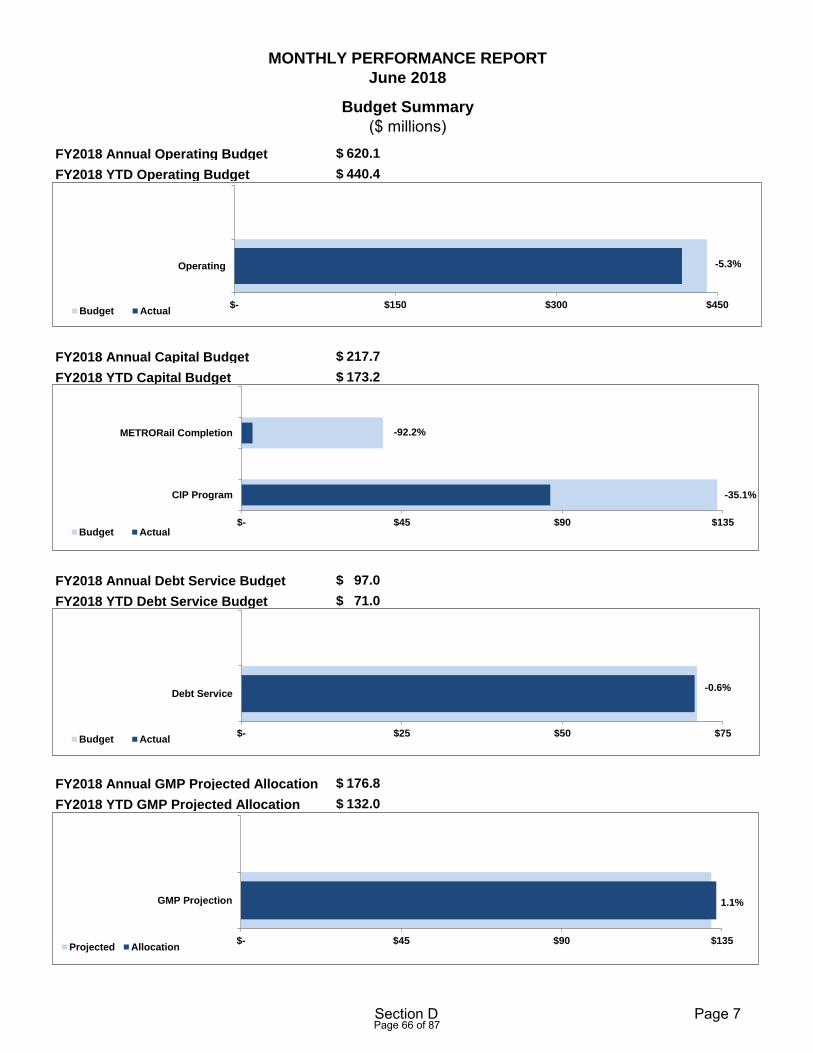
FY2018 Annual Operating Budget 620.1$
FY2018 YTD Operating Budget 440.4$
FY2018 Annual Capital Budget 217.7$
FY2018 YTD Capital Budget 173.2$
FY2018 Annual Debt Service Budget 97.0$
FY2018 YTD Debt Service Budget 71.0$
FY2018 Annual GMP Projected Allocation 176.8$
FY2018 YTD GMP Projected Allocation 132.0$
MONTHLY PERFORMANCE REPORT
June 2018
Budget Summary
($ millions)
-0.6%
$- $25 $50 $75
Debt Service
Budget Actual
-35.1%
-92.2%
$- $45 $90 $135
CIP Program
METRORail Completion
Budget Actual
1.1%
$- $45 $90 $135
GMP Projection
Projected Allocation
-5.3%
$- $150 $300 $450
Operating
Budget Actual
Section D Page 7 Page 66 of 87
Comparison of Budget to Actual for the Month (June 2018)
FY18 Annual June June $ Variance % Variance
Budget Budget Actual
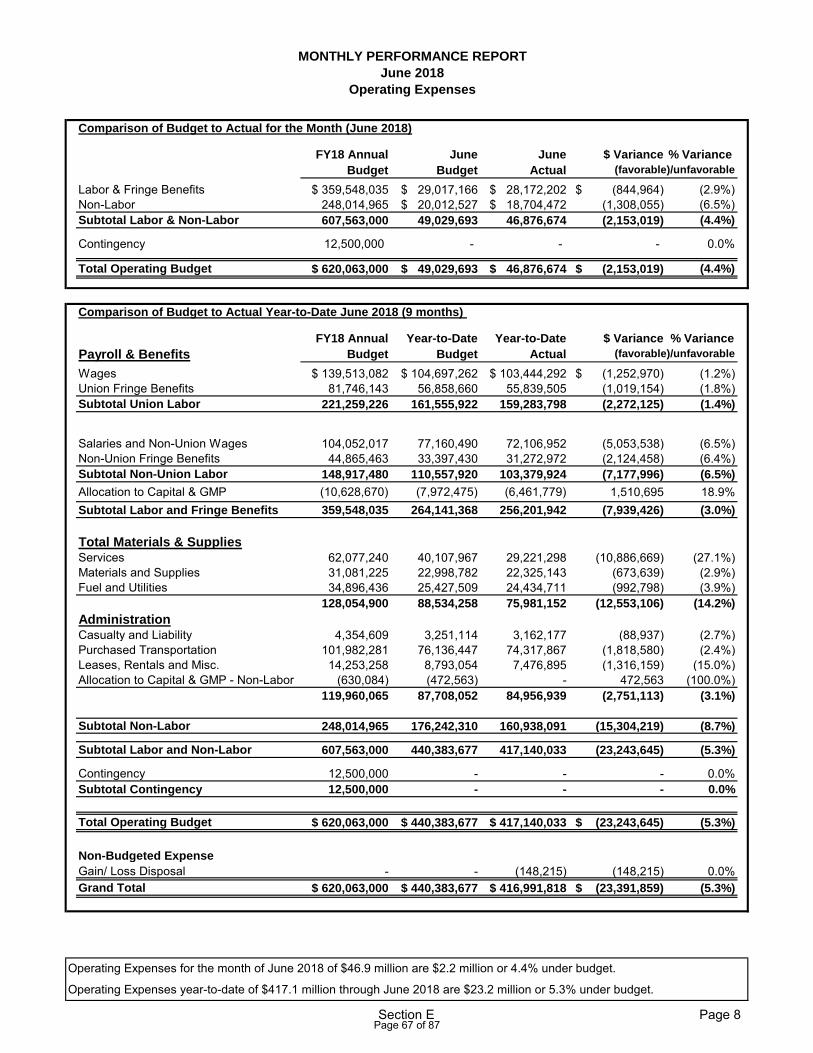
Labor & Fringe Benefits $ 359,548,035 $ 29,017,166 $ 28,172,202 $ (844,964) (2.9%)Non-Labor 248,014,965 $ 20,012,527 $ 18,704,472 (1,308,055) (6.5%)Subtotal Labor & Non-Labor 607,563,000 49,029,693 46,876,674 (2,153,019) (4.4%)
Contingency 12,500,000 - - - 0.0%
Total Operating Budget $ 620,063,000 $ 49,029,693 $ 46,876,674 $ (2,153,019) (4.4%)
Comparison of Budget to Actual Year-to-Date June 2018 (9 months)
FY18 Annual Year-to-Date Year-to-Date $ Variance % Variance
Payroll & Benefits Budget Budget Actual
Wages $ 139,513,082 $ 104,697,262 $ 103,444,292 $ (1,252,970) (1.2%)Union Fringe Benefits 81,746,143 56,858,660 55,839,505 (1,019,154) (1.8%)Subtotal Union Labor 221,259,226 161,555,922 159,283,798 (2,272,125) (1.4%)
Salaries and Non-Union Wages 104,052,017 77,160,490 72,106,952 (5,053,538) (6.5%)Non-Union Fringe Benefits 44,865,463 33,397,430 31,272,972 (2,124,458) (6.4%)Subtotal Non-Union Labor 148,917,480 110,557,920 103,379,924 (7,177,996) (6.5%)
Allocation to Capital & GMP (10,628,670) (7,972,475) (6,461,779) 1,510,695 18.9%Subtotal Labor and Fringe Benefits 359,548,035 264,141,368 256,201,942 (7,939,426) (3.0%)
Total Materials & SuppliesServices 62,077,240 40,107,967 29,221,298 (10,886,669) (27.1%)Materials and Supplies 31,081,225 22,998,782 22,325,143 (673,639) (2.9%)Fuel and Utilities 34,896,436 25,427,509 24,434,711 (992,798) (3.9%)
128,054,900 88,534,258 75,981,152 (12,553,106) (14.2%)
AdministrationCasualty and Liability 4,354,609 3,251,114 3,162,177 (88,937) (2.7%)
Purchased Transportation 101,982,281 76,136,447 74,317,867 (1,818,580) (2.4%)Leases, Rentals and Misc. 14,253,258 8,793,054 7,476,895 (1,316,159) (15.0%)Allocation to Capital & GMP - Non-Labor (630,084) (472,563) - 472,563 (100.0%)
119,960,065 87,708,052 84,956,939 (2,751,113) (3.1%)
Subtotal Non-Labor 248,014,965 176,242,310 160,938,091 (15,304,219) (8.7%)
Subtotal Labor and Non-Labor 607,563,000 440,383,677 417,140,033 (23,243,645) (5.3%)
Contingency 12,500,000 - - - 0.0%Subtotal Contingency 12,500,000 - - - 0.0%
Total Operating Budget $ 620,063,000 $ 440,383,677 $ 417,140,033 $ (23,243,645) (5.3%)
Non-Budgeted Expense
Gain/ Loss Disposal - - (148,215) (148,215) 0.0%Grand Total $ 620,063,000 $ 440,383,677 $ 416,991,818 $ (23,391,859) (5.3%)
(favorable)/unfavorable
Operating Expenses
June 2018
Operating Expenses for the month of June 2018 of $46.9 million are $2.2 million or 4.4% under budget.
Operating Expenses year-to-date of $417.1 million through June 2018 are $23.2 million or 5.3% under budget.
MONTHLY PERFORMANCE REPORT
(favorable)/unfavorable
Section E Page 8 Page 67 of 87
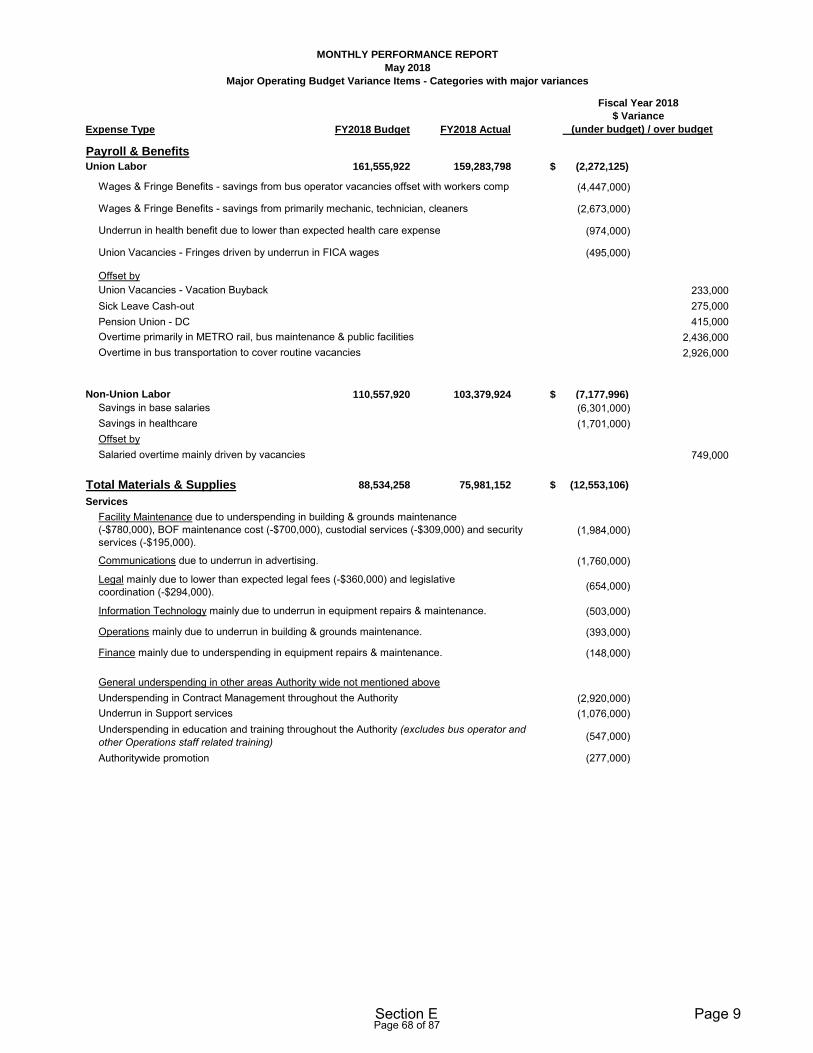
Expense Type FY2018 Budget FY2018 Actual
Payroll & Benefits
Union Labor 161,555,922 159,283,798 $ (2,272,125)
(4,447,000)
(2,673,000)
(974,000)
(495,000)
Offset by233,000
Sick Leave Cash-out 275,000 Pension Union - DC 415,000
2,436,000 2,926,000
Non-Union Labor 110,557,920 103,379,924 $ (7,177,996)
(6,301,000) (1,701,000)
749,000
Total Materials & Supplies 88,534,258 75,981,152 $ (12,553,106)
Services
(1,984,000)
(1,760,000)
(654,000)
(503,000)
(393,000)
(148,000)
(2,920,000) (1,076,000)
(547,000)
Authoritywide promotion (277,000)
Underspending in Contract Management throughout the AuthorityUnderrun in Support servicesUnderspending in education and training throughout the Authority (excludes bus operator and other Operations staff related training)
Communications due to underrun in advertising.
Information Technology mainly due to underrun in equipment repairs & maintenance.
Finance mainly due to underspending in equipment repairs & maintenance.
General underspending in other areas Authority wide not mentioned above
Operations mainly due to underrun in building & grounds maintenance.
Legal mainly due to lower than expected legal fees (-$360,000) and legislative coordination (-$294,000).
MONTHLY PERFORMANCE REPORT
May 2018
Major Operating Budget Variance Items - Categories with major variances
Fiscal Year 2018
$ Variance
Union Vacancies - Fringes driven by underrun in FICA wages
(under budget) / over budget
Wages & Fringe Benefits - savings from bus operator vacancies offset with workers comp
Wages & Fringe Benefits - savings from primarily mechanic, technician, cleaners
Underrun in health benefit due to lower than expected health care expense
Overtime primarily in METRO rail, bus maintenance & public facilities
Union Vacancies - Vacation Buyback
Overtime in bus transportation to cover routine vacancies
Savings in base salaries
Offset bySavings in healthcare
Facility Maintenance due to underspending in building & grounds maintenance (-$780,000), BOF maintenance cost (-$700,000), custodial services (-$309,000) and security services (-$195,000).
Salaried overtime mainly driven by vacancies
UpdatedUpdatedUpdatedUpdatedUpdatedUpdatedUpdatedUpdated
Section E Page 9 Page 68 of 87
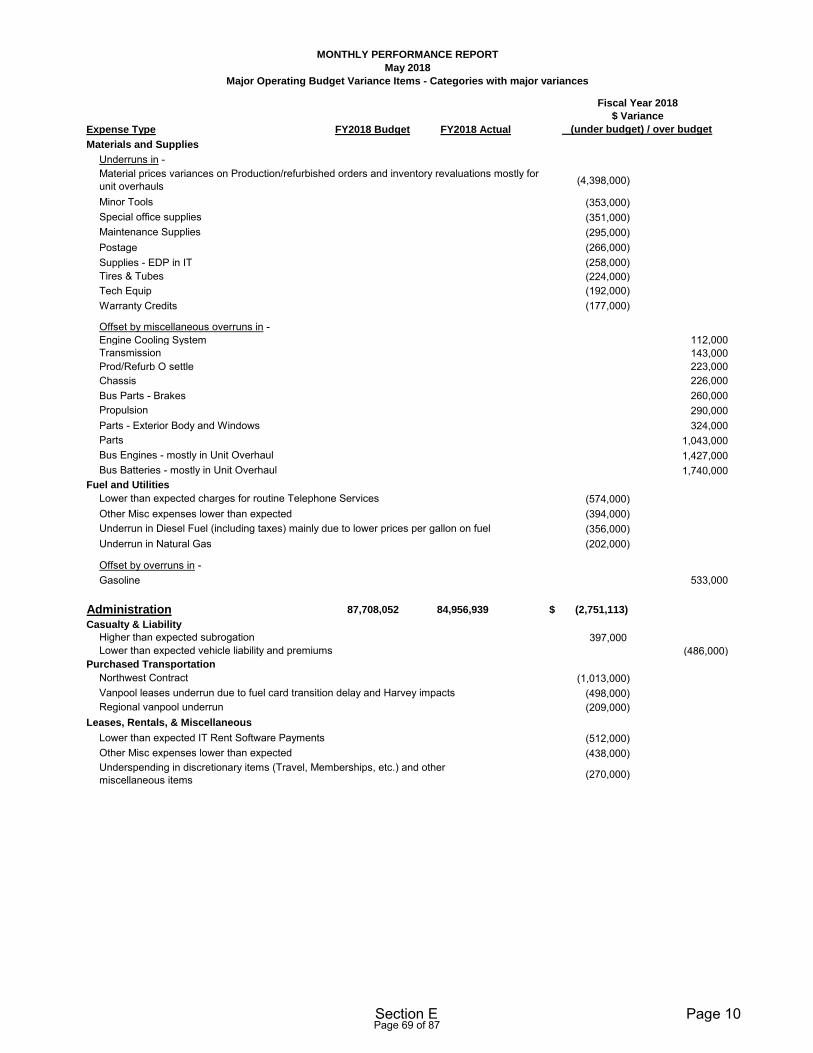
Expense Type FY2018 Budget FY2018 Actual
Materials and Supplies
Underruns in -
(4,398,000)
(353,000)(351,000)(295,000)
Postage (266,000)Supplies - EDP in IT (258,000)
(224,000)Tech Equip (192,000)Warranty Credits (177,000)
Offset by miscellaneous overruns in - Engine Cooling System 112,000
143,000 Prod/Refurb O settle 223,000 Chassis 226,000 Bus Parts - Brakes 260,000
290,000 Parts - Exterior Body and Windows 324,000
1,043,000 1,427,000 1,740,000
Fuel and Utilities
(574,000)Other Misc expenses lower than expected (394,000)
(356,000)Underrun in Natural Gas (202,000)
Offset by overruns in - Gasoline 533,000
Administration 87,708,052 84,956,939 $ (2,751,113)
Casualty & Liability
397,000 (486,000)
Purchased Transportation
(1,013,000)(498,000)(209,000)
Leases, Rentals, & Miscellaneous
(512,000)(438,000)
(270,000)
Higher than expected subrogation Lower than expected vehicle liability and premiums
Vanpool leases underrun due to fuel card transition delay and Harvey impacts Northwest Contract
Regional vanpool underrun
Other Misc expenses lower than expectedUnderspending in discretionary items (Travel, Memberships, etc.) and other miscellaneous items
Lower than expected IT Rent Software Payments
Bus Engines - mostly in Unit OverhaulBus Batteries - mostly in Unit Overhaul
Lower than expected charges for routine Telephone Services
Underrun in Diesel Fuel (including taxes) mainly due to lower prices per gallon on fuel
(under budget) / over budget
Special office supplies
Material prices variances on Production/refurbished orders and inventory revaluations mostly for unit overhauls
MONTHLY PERFORMANCE REPORT
May 2018
Major Operating Budget Variance Items - Categories with major variances
Fiscal Year 2018
$ Variance
Minor Tools
Tires & Tubes
Maintenance Supplies
Parts
Propulsion
Transmission
UpdatedUpdatedUpdatedUpdatedUpdatedUpdatedUpdatedUpdated
Section E Page 10 Page 69 of 87
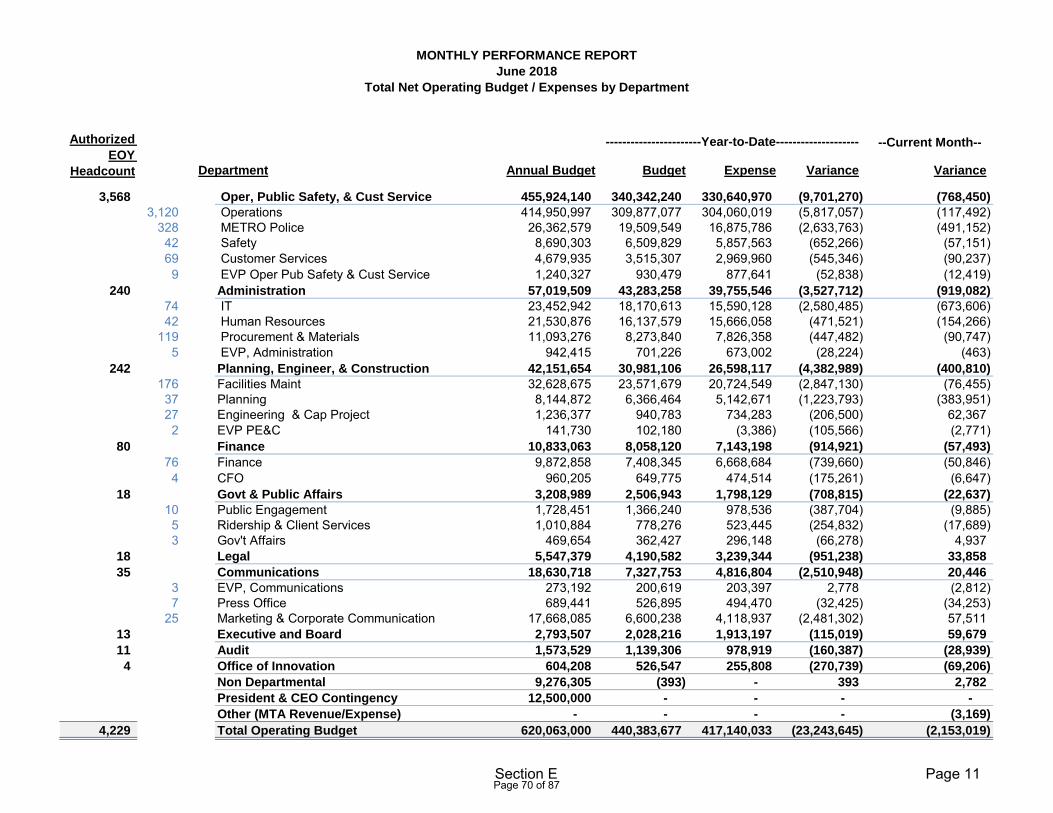
--Current Month--
Department Annual Budget Budget Expense Variance Variance
3,568 Oper, Public Safety, & Cust Service 455,924,140 340,342,240 330,640,970 (9,701,270) (768,450)
3,120 Operations 414,950,997 309,877,077 304,060,019 (5,817,057) (117,492) 328 METRO Police 26,362,579 19,509,549 16,875,786 (2,633,763) (491,152)
42 Safety 8,690,303 6,509,829 5,857,563 (652,266) (57,151) 69 Customer Services 4,679,935 3,515,307 2,969,960 (545,346) (90,237)
9 EVP Oper Pub Safety & Cust Service 1,240,327 930,479 877,641 (52,838) (12,419) 240 Administration 57,019,509 43,283,258 39,755,546 (3,527,712) (919,082)
74 IT 23,452,942 18,170,613 15,590,128 (2,580,485) (673,606) 42 Human Resources 21,530,876 16,137,579 15,666,058 (471,521) (154,266)
119 Procurement & Materials 11,093,276 8,273,840 7,826,358 (447,482) (90,747) 5 EVP, Administration 942,415 701,226 673,002 (28,224) (463)
242 Planning, Engineer, & Construction 42,151,654 30,981,106 26,598,117 (4,382,989) (400,810)
176 Facilities Maint 32,628,675 23,571,679 20,724,549 (2,847,130) (76,455) 37 Planning 8,144,872 6,366,464 5,142,671 (1,223,793) (383,951) 27 Engineering & Cap Project 1,236,377 940,783 734,283 (206,500) 62,367
2 EVP PE&C 141,730 102,180 (3,386) (105,566) (2,771) 80 Finance 10,833,063 8,058,120 7,143,198 (914,921) (57,493)
76 Finance 9,872,858 7,408,345 6,668,684 (739,660) (50,846) 4 CFO 960,205 649,775 474,514 (175,261) (6,647)
18 Govt & Public Affairs 3,208,989 2,506,943 1,798,129 (708,815) (22,637)
10 Public Engagement 1,728,451 1,366,240 978,536 (387,704) (9,885) 5 Ridership & Client Services 1,010,884 778,276 523,445 (254,832) (17,689) 3 Gov't Affairs 469,654 362,427 296,148 (66,278) 4,937
18 Legal 5,547,379 4,190,582 3,239,344 (951,238) 33,858
35 Communications 18,630,718 7,327,753 4,816,804 (2,510,948) 20,446
3 EVP, Communications 273,192 200,619 203,397 2,778 (2,812) 7 Press Office 689,441 526,895 494,470 (32,425) (34,253)
25 Marketing & Corporate Communication 17,668,085 6,600,238 4,118,937 (2,481,302) 57,511 13 Executive and Board 2,793,507 2,028,216 1,913,197 (115,019) 59,679
11 Audit 1,573,529 1,139,306 978,919 (160,387) (28,939)
4 Office of Innovation 604,208 526,547 255,808 (270,739) (69,206)
Non Departmental 9,276,305 (393) - 393 2,782
President & CEO Contingency 12,500,000 - - - -
Other (MTA Revenue/Expense) - - - - (3,169)
4,229 Total Operating Budget 620,063,000 440,383,677 417,140,033 (23,243,645) (2,153,019)
MONTHLY PERFORMANCE REPORT
June 2018
Total Net Operating Budget / Expenses by Department
Authorized
EOY
Headcount
-----------------------Year-to-Date--------------------
Section E Page 11 Page 70 of 87
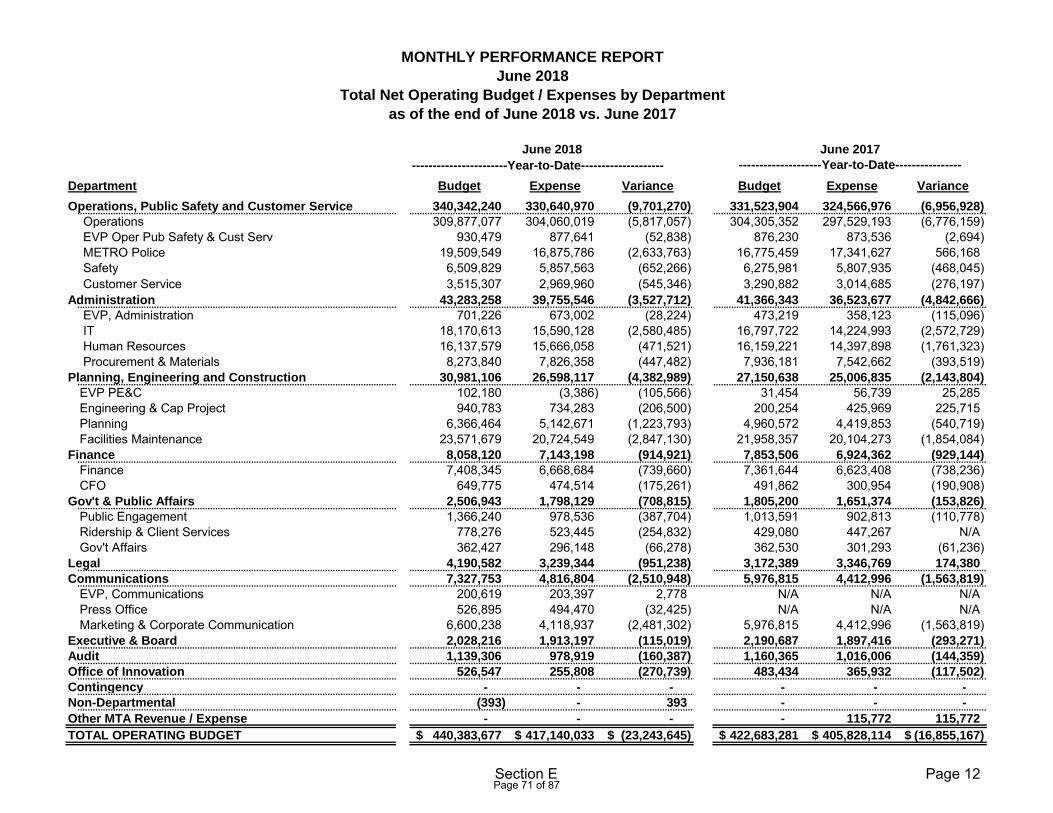
-----------------------Year-to-Date--------------------
Department Budget Expense Variance Budget Expense Variance
Operations, Public Safety and Customer Service 340,342,240 330,640,970 (9,701,270) 331,523,904 324,566,976 (6,956,928)
Operations 309,877,077 304,060,019 (5,817,057) 304,305,352 297,529,193 (6,776,159) EVP Oper Pub Safety & Cust Serv 930,479 877,641 (52,838) 876,230 873,536 (2,694) METRO Police 19,509,549 16,875,786 (2,633,763) 16,775,459 17,341,627 566,168 Safety 6,509,829 5,857,563 (652,266) 6,275,981 5,807,935 (468,045) Customer Service 3,515,307 2,969,960 (545,346) 3,290,882 3,014,685 (276,197)
Administration 43,283,258 39,755,546 (3,527,712) 41,366,343 36,523,677 (4,842,666)
EVP, Administration 701,226 673,002 (28,224) 473,219 358,123 (115,096) IT 18,170,613 15,590,128 (2,580,485) 16,797,722 14,224,993 (2,572,729) Human Resources 16,137,579 15,666,058 (471,521) 16,159,221 14,397,898 (1,761,323) Procurement & Materials 8,273,840 7,826,358 (447,482) 7,936,181 7,542,662 (393,519)
Planning, Engineering and Construction 30,981,106 26,598,117 (4,382,989) 27,150,638 25,006,835 (2,143,804)
EVP PE&C 102,180 (3,386) (105,566) 31,454 56,739 25,285 Engineering & Cap Project 940,783 734,283 (206,500) 200,254 425,969 225,715 Planning 6,366,464 5,142,671 (1,223,793) 4,960,572 4,419,853 (540,719) Facilities Maintenance 23,571,679 20,724,549 (2,847,130) 21,958,357 20,104,273 (1,854,084)
Finance 8,058,120 7,143,198 (914,921) 7,853,506 6,924,362 (929,144)
Finance 7,408,345 6,668,684 (739,660) 7,361,644 6,623,408 (738,236) CFO 649,775 474,514 (175,261) 491,862 300,954 (190,908)
Gov't & Public Affairs 2,506,943 1,798,129 (708,815) 1,805,200 1,651,374 (153,826)
Public Engagement 1,366,240 978,536 (387,704) 1,013,591 902,813 (110,778) Ridership & Client Services 778,276 523,445 (254,832) 429,080 447,267 N/AGov't Affairs 362,427 296,148 (66,278) 362,530 301,293 (61,236)
Legal 4,190,582 3,239,344 (951,238) 3,172,389 3,346,769 174,380
Communications 7,327,753 4,816,804 (2,510,948) 5,976,815 4,412,996 (1,563,819)
EVP, Communications 200,619 203,397 2,778 N/A N/A N/APress Office 526,895 494,470 (32,425) N/A N/A N/AMarketing & Corporate Communication 6,600,238 4,118,937 (2,481,302) 5,976,815 4,412,996 (1,563,819)
Executive & Board 2,028,216 1,913,197 (115,019) 2,190,687 1,897,416 (293,271)
Audit 1,139,306 978,919 (160,387) 1,160,365 1,016,006 (144,359)
Office of Innovation 526,547 255,808 (270,739) 483,434 365,932 (117,502)
Contingency - - - - - -
Non-Departmental (393) - 393 - - -
Other MTA Revenue / Expense - - - - 115,772 115,772
TOTAL OPERATING BUDGET 440,383,677$ 417,140,033$ (23,243,645)$ 422,683,281$ 405,828,114$ (16,855,167)$
--------------------Year-to-Date----------------
MONTHLY PERFORMANCE REPORT
June 2018
Total Net Operating Budget / Expenses by Department
as of the end of June 2018 vs. June 2017
June 2018 June 2017 Updated
Section E Page 12 Page 71 of 87
Capital BudgetFY2018
Annual
Budget Budget Actual $ % Budget Actual $ %
53.3$ 4.8$ 0.3$ (4.5)$ (93.8%) 39.7$ 3.1$ (36.6)$ (92.2%)164.4$ 12.4$ 2.0$ (10.4)$ (83.9%) 133.5$ 86.6$ (46.9)$ (35.1%)217.7$ 17.3$ 2.3$ (15.0)$ (86.7%) 173.2$ 89.7$ (83.5)$ (48.2%)
Debt Service Budget
FY2018
Annual
Budget Budget Actual $ % Budget Actual $ %
97.0$ 8.0$ 7.7$ (0.3)$ (3.8%) 71.0$ 70.6$ (0.4)$ (0.6%)
General Mobility Transfers
FY2018
Annual
Projection Projection Allocation $ % Projection Allocation $ %
176.8$ 14.0$ 14.2$ 0.2$ 1.4% 132.0$ 133.4$ 1.4$ 1.1%
Month of June 2018 Fiscal Year to Date
Month of June 2018 Fiscal Year to Date
Variance Variance
Variance Variance
Fiscal Year to Date
Variance
($ millions)
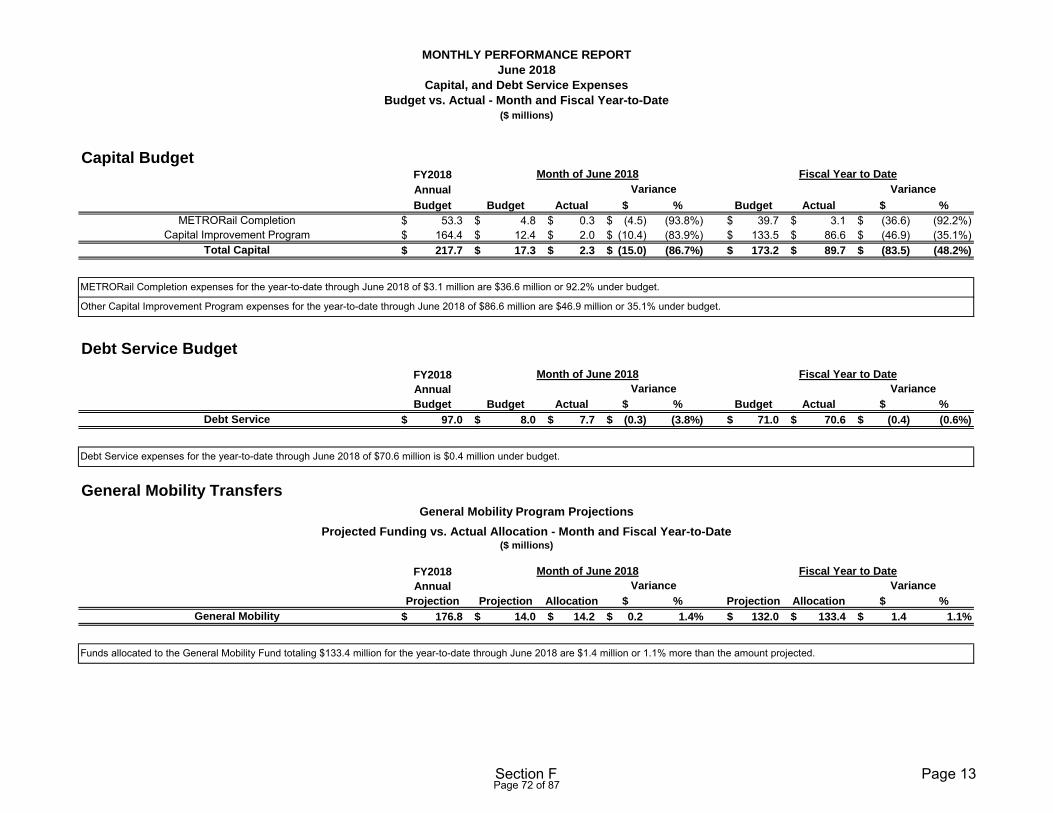
METRORail Completion expenses for the year-to-date through June 2018 of $3.1 million are $36.6 million or 92.2% under budget.
Other Capital Improvement Program expenses for the year-to-date through June 2018 of $86.6 million are $46.9 million or 35.1% under budget.
METRORail CompletionCapital Improvement Program
MONTHLY PERFORMANCE REPORT
June 2018
Capital, and Debt Service Expenses
Budget vs. Actual - Month and Fiscal Year-to-Date
($ millions)
Total Capital
Debt Service
General Mobility
General Mobility Program Projections
Projected Funding vs. Actual Allocation - Month and Fiscal Year-to-Date
Debt Service expenses for the year-to-date through June 2018 of $70.6 million is $0.4 million under budget.
Month of June 2018
Variance
Funds allocated to the General Mobility Fund totaling $133.4 million for the year-to-date through June 2018 are $1.4 million or 1.1% more than the amount projected.
Section F Page 13 Page 72 of 87
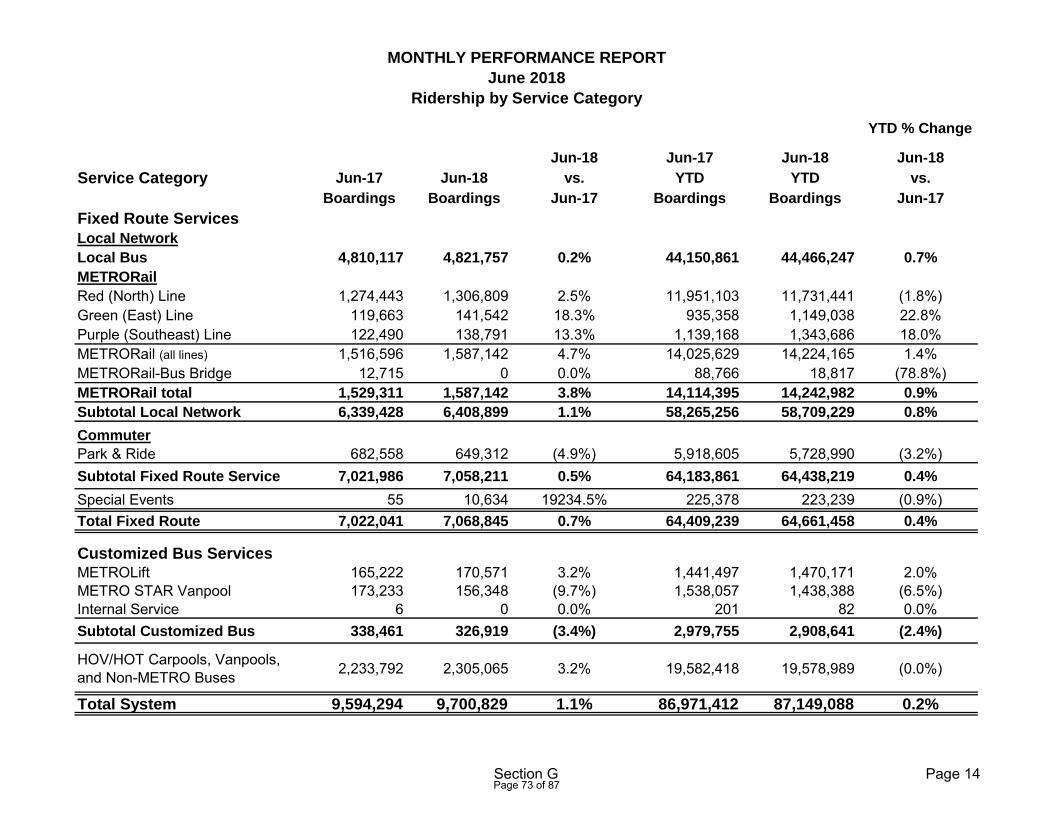
YTD % Change
Jun-18 Jun-17 Jun-18 Jun-18
Service Category Jun-17 Jun-18 vs. YTD YTD vs.
Boardings Boardings Jun-17 Boardings Boardings Jun-17
Fixed Route Services
Local Network
Local Bus 4,810,117 4,821,757 0.2% 44,150,861 44,466,247 0.7%
METRORail
Red (North) Line 1,274,443 1,306,809 2.5% 11,951,103 11,731,441 (1.8%)Green (East) Line 119,663 141,542 18.3% 935,358 1,149,038 22.8%Purple (Southeast) Line 122,490 138,791 13.3% 1,139,168 1,343,686 18.0%METRORail (all lines) 1,516,596 1,587,142 4.7% 14,025,629 14,224,165 1.4%METRORail-Bus Bridge 12,715 0 0.0% 88,766 18,817 (78.8%)METRORail total 1,529,311 1,587,142 3.8% 14,114,395 14,242,982 0.9%
Subtotal Local Network 6,339,428 6,408,899 1.1% 58,265,256 58,709,229 0.8%
Commuter
Park & Ride 682,558 649,312 (4.9%) 5,918,605 5,728,990 (3.2%)Subtotal Fixed Route Service 7,021,986 7,058,211 0.5% 64,183,861 64,438,219 0.4%
Special Events 55 10,634 19234.5% 225,378 223,239 (0.9%)Total Fixed Route 7,022,041 7,068,845 0.7% 64,409,239 64,661,458 0.4%
Customized Bus Services
METROLift 165,222 170,571 3.2% 1,441,497 1,470,171 2.0%METRO STAR Vanpool 173,233 156,348 (9.7%) 1,538,057 1,438,388 (6.5%)Internal Service 6 0 0.0% 201 82 0.0%Subtotal Customized Bus 338,461 326,919 (3.4%) 2,979,755 2,908,641 (2.4%)
HOV/HOT Carpools, Vanpools, and Non-METRO Buses 2,233,792 2,305,065 3.2% 19,582,418 19,578,989 (0.0%)
Total System 9,594,294 9,700,829 1.1% 86,971,412 87,149,088 0.2%
MONTHLY PERFORMANCE REPORT
June 2018
Ridership by Service Category
Section G Page 14 Page 73 of 87
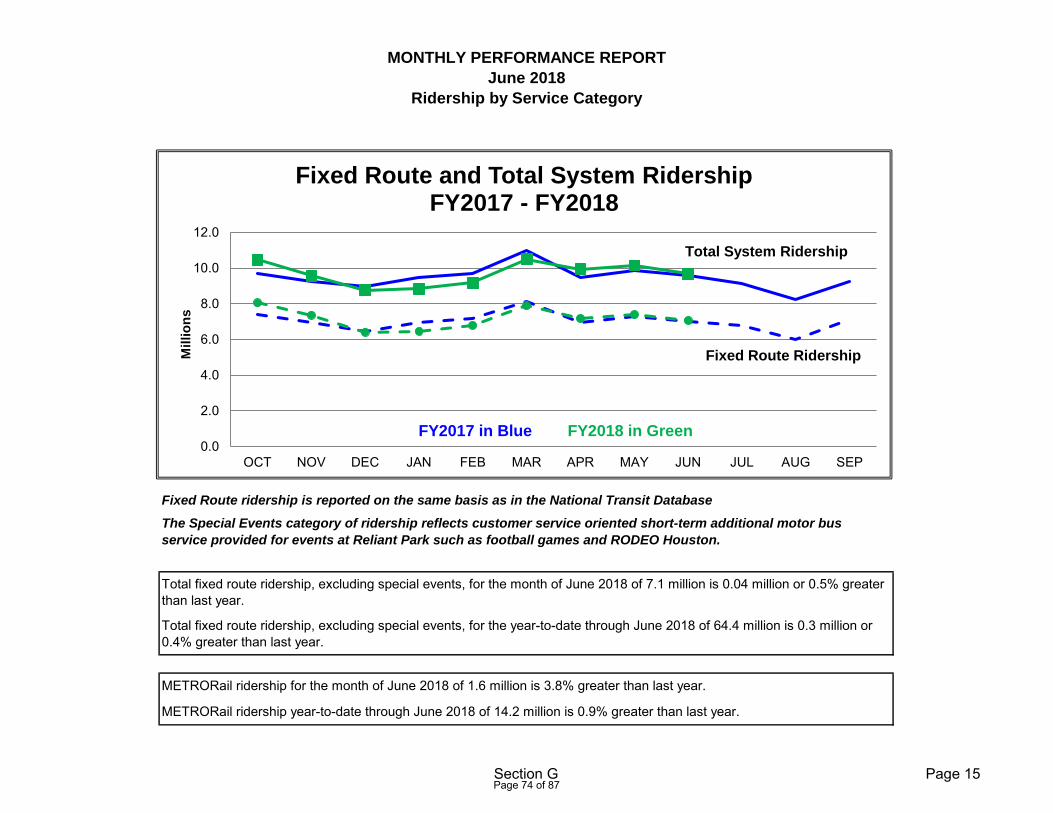
METRORail ridership year-to-date through June 2018 of 14.2 million is 0.9% greater than last year.
Fixed Route ridership is reported on the same basis as in the National Transit Database
MONTHLY PERFORMANCE REPORT
June 2018
Ridership by Service Category
The Special Events category of ridership reflects customer service oriented short-term additional motor bus
service provided for events at Reliant Park such as football games and RODEO Houston.
Total fixed route ridership, excluding special events, for the year-to-date through June 2018 of 64.4 million is 0.3 million or 0.4% greater than last year.
Total fixed route ridership, excluding special events, for the month of June 2018 of 7.1 million is 0.04 million or 0.5% greater than last year.
METRORail ridership for the month of June 2018 of 1.6 million is 3.8% greater than last year.
0.0
2.0
4.0
6.0
8.0
10.0
12.0
OCT NOV DEC JAN FEB MAR APR MAY JUN JUL AUG SEP
Millio
ns
Fixed Route and Total System RidershipFY2017 - FY2018
FY2017 in Blue FY2018 in Green
Fixed Route Ridership
Total System Ridership
Section G Page 15 Page 74 of 87
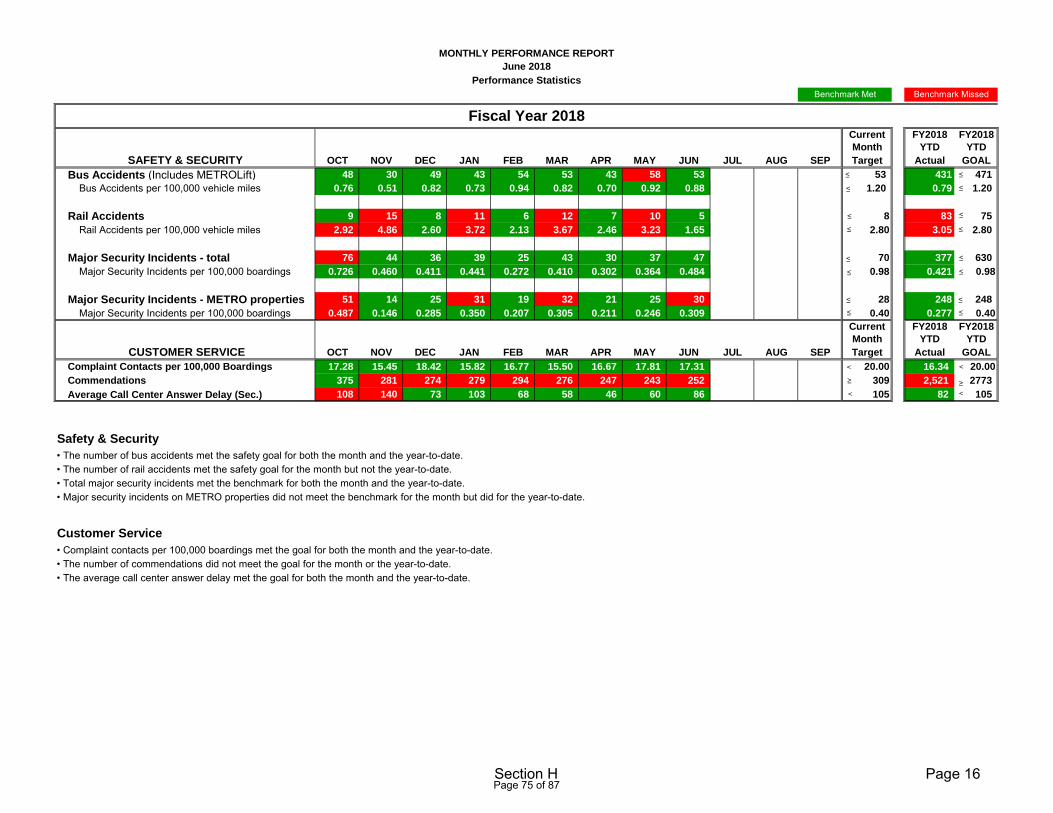
Current FY2018 FY2018
Month YTD YTD
SAFETY & SECURITY OCT NOV DEC JAN FEB MAR APR MAY JUN JUL AUG SEP Target Actual GOAL
Bus Accidents (Includes METROLift) 48 30 49 43 54 53 43 58 53 0 0 0 53 431 471
Bus Accidents per 100,000 vehicle miles 0.76 0.51 0.82 0.73 0.94 0.82 0.70 0.92 0.88 1.20 0.79 1.20
Rail Accidents 9 15 8 11 6 12 7 10 5 0 0 0 8 83 75
Rail Accidents per 100,000 vehicle miles 2.92 4.86 2.60 3.72 2.13 3.67 2.46 3.23 1.65 2.80 3.05 2.80
Major Security Incidents - total 76 44 36 39 25 43 30 37 47 0 0 0 70 377 630
Major Security Incidents per 100,000 boardings 0.726 0.460 0.411 0.441 0.272 0.410 0.302 0.364 0.484 0.98 0.421 0.98
Major Security Incidents - METRO properties 51 14 25 31 19 32 21 25 30 0 28 248 248
Major Security Incidents per 100,000 boardings 0.487 0.146 0.285 0.350 0.207 0.305 0.211 0.246 0.309 0.40 0.277 0.40
Current FY2018 FY2018
Month YTD YTD
CUSTOMER SERVICE OCT NOV DEC JAN FEB MAR APR MAY JUN JUL AUG SEP Target Actual GOAL
Complaint Contacts per 100,000 Boardings 17.28 15.45 18.42 15.82 16.77 15.50 16.67 17.81 17.31 0 0 0 20.00 16.34 20.00
Commendations 375 281 274 279 294 276 247 243 252 309 2,521 2773
Average Call Center Answer Delay (Sec.) 108 140 73 103 68 58 46 60 86 105 82 105
• Complaint contacts per 100,000 boardings met the goal for both the month and the year-to-date. • The number of commendations did not meet the goal for the month or the year-to-date. • The average call center answer delay met the goal for both the month and the year-to-date.
Safety & Security
MONTHLY PERFORMANCE REPORT
June 2018
Performance Statistics
Fiscal Year 2018
Benchmark MissedBenchmark Met
Customer Service
• The number of bus accidents met the safety goal for both the month and the year-to-date. • The number of rail accidents met the safety goal for the month but not the year-to-date. • Total major security incidents met the benchmark for both the month and the year-to-date. • Major security incidents on METRO properties did not meet the benchmark for the month but did for the year-to-date.
≤
≤
≤ ≤
≤
≤
≤
≤
≤
≤
≤
≤
≤
≤
≤
< <
< <
≥ ≥
≤
Section H Page 16 Page 75 of 87
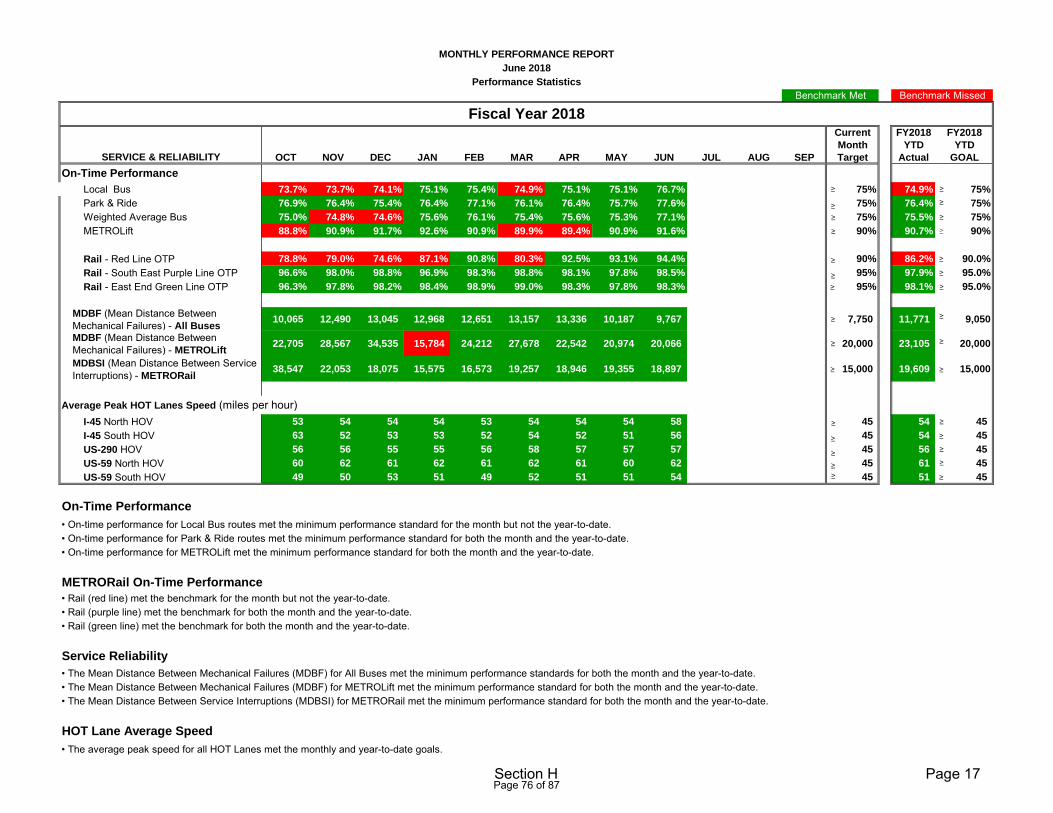
Current FY2018 FY2018
Month YTD YTD
SERVICE & RELIABILITY OCT NOV DEC JAN FEB MAR APR MAY JUN JUL AUG SEP Target Actual GOAL
On-Time Performance
Local Bus 73.7% 73.7% 74.1% 75.1% 75.4% 74.9% 75.1% 75.1% 76.7% 75% 74.9% 75%
Park & Ride 76.9% 76.4% 75.4% 76.4% 77.1% 76.1% 76.4% 75.7% 77.6% 0.0% 0.0% 0.0% 75% 76.4% 75%
Weighted Average Bus 75.0% 74.8% 74.6% 75.6% 76.1% 75.4% 75.6% 75.3% 77.1% 75% 75.5% 75%
METROLift 88.8% 90.9% 91.7% 92.6% 90.9% 89.9% 89.4% 90.9% 91.6% 0.0% 0.0% 0.0% 90% 90.7% 90%
Rail - Red Line OTP 78.8% 79.0% 74.6% 87.1% 90.8% 80.3% 92.5% 93.1% 94.4% 90% 86.2% 90.0%
Rail - South East Purple Line OTP 96.6% 98.0% 98.8% 96.9% 98.3% 98.8% 98.1% 97.8% 98.5% 95% 97.9% 95.0%
Rail - East End Green Line OTP 96.3% 97.8% 98.2% 98.4% 98.9% 99.0% 98.3% 97.8% 98.3% 95% 98.1% 95.0%
MDBF (Mean Distance Between Mechanical Failures) - All Buses
10,065 12,490 13,045 12,968 12,651 13,157 13,336 10,187 9,767 7,750 11,771 9,050
MDBF (Mean Distance Between Mechanical Failures) - METROLift
22,705 28,567 34,535 15,784 24,212 27,678 22,542 20,974 20,066 20,000 23,105 20,000
MDBSI (Mean Distance Between Service Interruptions) - METRORail
38,547 22,053 18,075 15,575 16,573 19,257 18,946 19,355 18,897 15,000 19,609 15,000
I-45 North HOV 53 54 54 54 53 54 54 54 58 45 54 45
I-45 South HOV 63 52 53 53 52 54 52 51 56 45 54 45
US-290 HOV 56 56 55 55 56 58 57 57 57 45 56 45
US-59 North HOV 60 62 61 62 61 62 61 60 62 45 61 45
US-59 South HOV 49 50 53 51 49 52 51 51 54 45 51 45
• The Mean Distance Between Service Interruptions (MDBSI) for METRORail met the minimum performance standard for both the month and the year-to-date.
METRORail On-Time Performance
Service Reliability
HOT Lane Average Speed
• The average peak speed for all HOT Lanes met the monthly and year-to-date goals.
• The Mean Distance Between Mechanical Failures (MDBF) for All Buses met the minimum performance standards for both the month and the year-to-date. • The Mean Distance Between Mechanical Failures (MDBF) for METROLift met the minimum performance standard for both the month and the year-to-date.
• Rail (green line) met the benchmark for both the month and the year-to-date.
• On-time performance for Local Bus routes met the minimum performance standard for the month but not the year-to-date. • On-time performance for Park & Ride routes met the minimum performance standard for both the month and the year-to-date. • On-time performance for METROLift met the minimum performance standard for both the month and the year-to-date.
• Rail (red line) met the benchmark for the month but not the year-to-date. • Rail (purple line) met the benchmark for both the month and the year-to-date.
On-Time Performance
MONTHLY PERFORMANCE REPORT
June 2018
Performance Statistics
Benchmark Met Benchmark Missed
Fiscal Year 2018
Average Peak HOT Lanes Speed (miles per hour)
≥
≥
≥
≥
≥
≥
≥
≥
≥ ≥
≥
≥ ≥
≥
≥≥
≥
≥
≥
≥
≥
≥
≥
≥≥
≥
≥
≥
≥
≥
Section H Page 17 Page 76 of 87
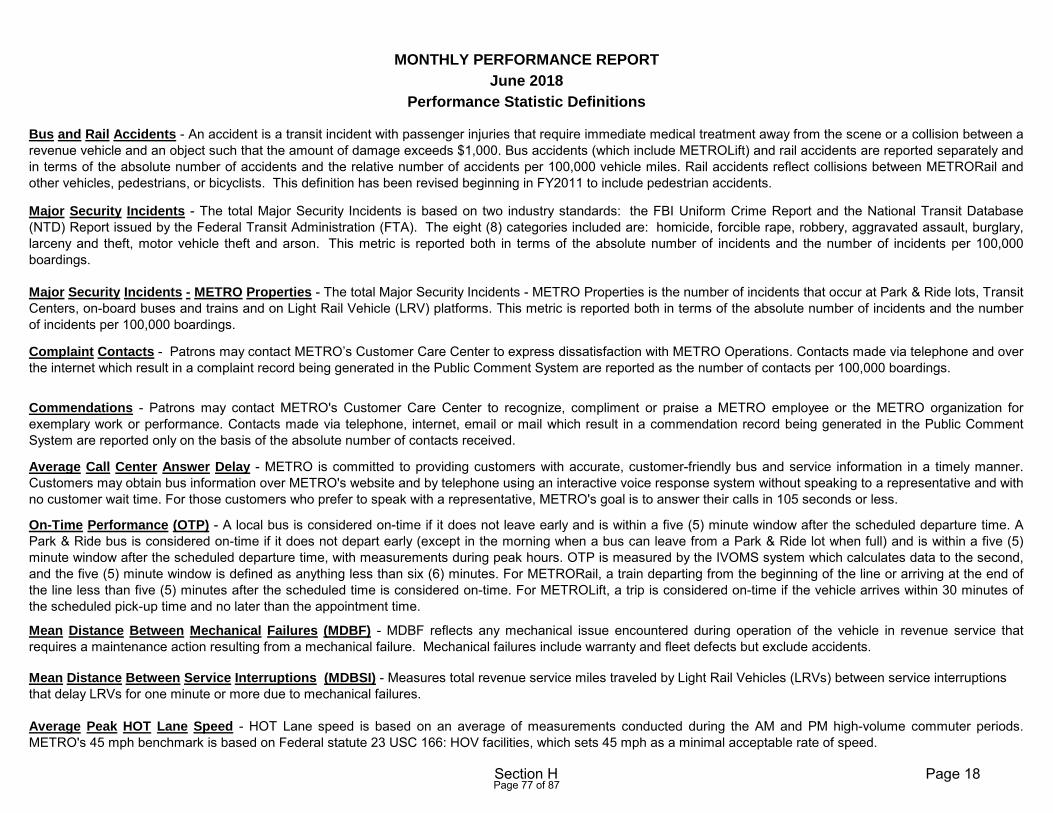
MONTHLY PERFORMANCE REPORT
June 2018
Performance Statistic Definitions
Bus and Rail Accidents - An accident is a transit incident with passenger injuries that require immediate medical treatment away from the scene or a collision between arevenue vehicle and an object such that the amount of damage exceeds $1,000. Bus accidents (which include METROLift) and rail accidents are reported separately andin terms of the absolute number of accidents and the relative number of accidents per 100,000 vehicle miles. Rail accidents reflect collisions between METRORail andother vehicles, pedestrians, or bicyclists. This definition has been revised beginning in FY2011 to include pedestrian accidents.
Major Security Incidents - The total Major Security Incidents is based on two industry standards: the FBI Uniform Crime Report and the National Transit Database(NTD) Report issued by the Federal Transit Administration (FTA). The eight (8) categories included are: homicide, forcible rape, robbery, aggravated assault, burglary,larceny and theft, motor vehicle theft and arson. This metric is reported both in terms of the absolute number of incidents and the number of incidents per 100,000boardings.
Major Security Incidents - METRO Properties - The total Major Security Incidents - METRO Properties is the number of incidents that occur at Park & Ride lots, TransitCenters, on-board buses and trains and on Light Rail Vehicle (LRV) platforms. This metric is reported both in terms of the absolute number of incidents and the numberof incidents per 100,000 boardings.
On-Time Performance (OTP) - A local bus is considered on-time if it does not leave early and is within a five (5) minute window after the scheduled departure time. APark & Ride bus is considered on-time if it does not depart early (except in the morning when a bus can leave from a Park & Ride lot when full) and is within a five (5)minute window after the scheduled departure time, with measurements during peak hours. OTP is measured by the IVOMS system which calculates data to the second,and the five (5) minute window is defined as anything less than six (6) minutes. For METRORail, a train departing from the beginning of the line or arriving at the end ofthe line less than five (5) minutes after the scheduled time is considered on-time. For METROLift, a trip is considered on-time if the vehicle arrives within 30 minutes ofthe scheduled pick-up time and no later than the appointment time.
Mean Distance Between Mechanical Failures (MDBF) - MDBF reflects any mechanical issue encountered during operation of the vehicle in revenue service thatrequires a maintenance action resulting from a mechanical failure. Mechanical failures include warranty and fleet defects but exclude accidents.
Average Peak HOT Lane Speed - HOT Lane speed is based on an average of measurements conducted during the AM and PM high-volume commuter periods.METRO's 45 mph benchmark is based on Federal statute 23 USC 166: HOV facilities, which sets 45 mph as a minimal acceptable rate of speed.
Mean Distance Between Service Interruptions (MDBSI) - Measures total revenue service miles traveled by Light Rail Vehicles (LRVs) between service interruptions that delay LRVs for one minute or more due to mechanical failures.
Complaint Contacts - Patrons may contact METRO’s Customer Care Center to express dissatisfaction with METRO Operations. Contacts made via telephone and overthe internet which result in a complaint record being generated in the Public Comment System are reported as the number of contacts per 100,000 boardings.
Commendations - Patrons may contact METRO's Customer Care Center to recognize, compliment or praise a METRO employee or the METRO organization forexemplary work or performance. Contacts made via telephone, internet, email or mail which result in a commendation record being generated in the Public CommentSystem are reported only on the basis of the absolute number of contacts received.
Average Call Center Answer Delay - METRO is committed to providing customers with accurate, customer-friendly bus and service information in a timely manner.Customers may obtain bus information over METRO's website and by telephone using an interactive voice response system without speaking to a representative and withno customer wait time. For those customers who prefer to speak with a representative, METRO's goal is to answer their calls in 105 seconds or less.
Section H Page 18 Page 77 of 87
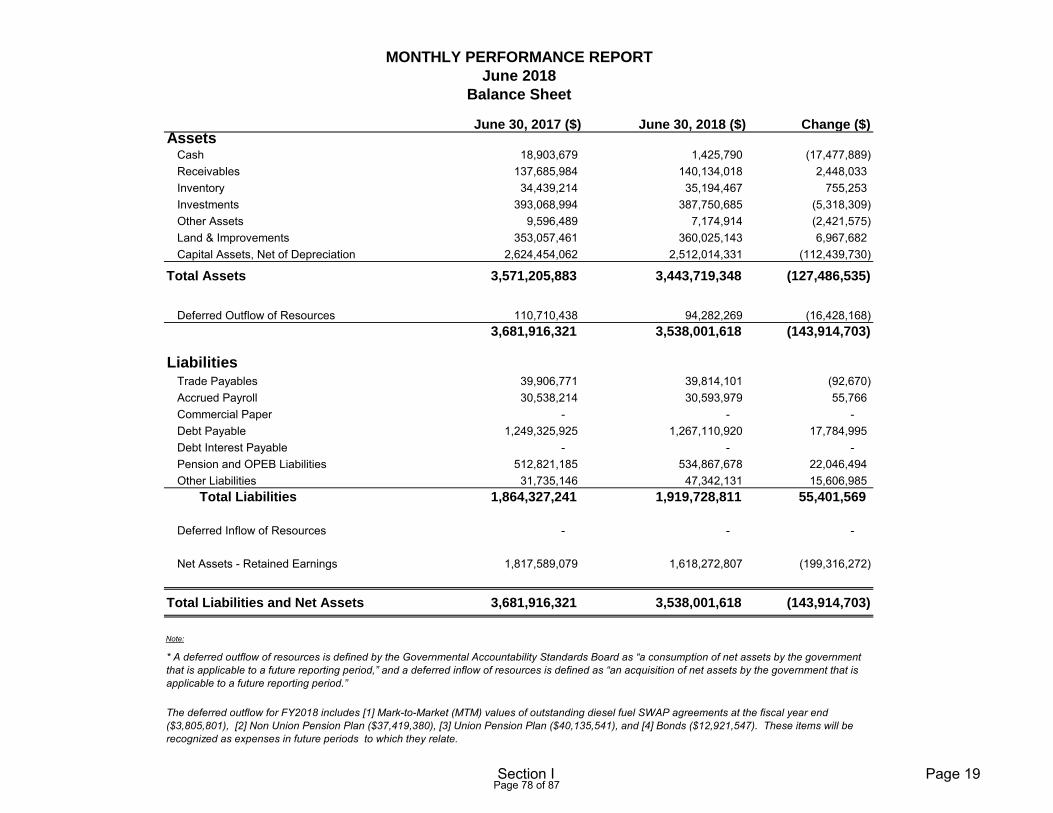
June 30, 2017 ($) June 30, 2018 ($) Change ($)Assets
Cash 18,903,679 1,425,790 (17,477,889) Receivables 137,685,984 140,134,018 2,448,033 Inventory 34,439,214 35,194,467 755,253 Investments 393,068,994 387,750,685 (5,318,309) Other Assets 9,596,489 7,174,914 (2,421,575) Land & Improvements 353,057,461 360,025,143 6,967,682 Capital Assets, Net of Depreciation 2,624,454,062 2,512,014,331 (112,439,730)
Total Assets 3,571,205,883 3,443,719,348 (127,486,535)
Deferred Outflow of Resources 110,710,438 94,282,269 (16,428,168) 3,681,916,321 3,538,001,618 (143,914,703)
LiabilitiesTrade Payables 39,906,771 39,814,101 (92,670) Accrued Payroll 30,538,214 30,593,979 55,766 Commercial Paper - - - Debt Payable 1,249,325,925 1,267,110,920 17,784,995 Debt Interest Payable - - - Pension and OPEB Liabilities 512,821,185 534,867,678 22,046,494 Other Liabilities 31,735,146 47,342,131 15,606,985
Total Liabilities 1,864,327,241 1,919,728,811 55,401,569
Deferred Inflow of Resources - - -
Net Assets - Retained Earnings 1,817,589,079 1,618,272,807 (199,316,272)
Total Liabilities and Net Assets 3,681,916,321 3,538,001,618 (143,914,703)
- - Note:
* A deferred outflow of resources is defined by the Governmental Accountability Standards Board as “a consumption of net assets by the government that is applicable to a future reporting period,” and a deferred inflow of resources is defined as “an acquisition of net assets by the government that is applicable to a future reporting period.”
The deferred outflow for FY2018 includes [1] Mark-to-Market (MTM) values of outstanding diesel fuel SWAP agreements at the fiscal year end ($3,805,801), [2] Non Union Pension Plan ($37,419,380), [3] Union Pension Plan ($40,135,541), and [4] Bonds ($12,921,547). These items will be recognized as expenses in future periods to which they relate.
MONTHLY PERFORMANCE REPORT
June 2018
Balance Sheet
Section I Page 19 Page 78 of 87
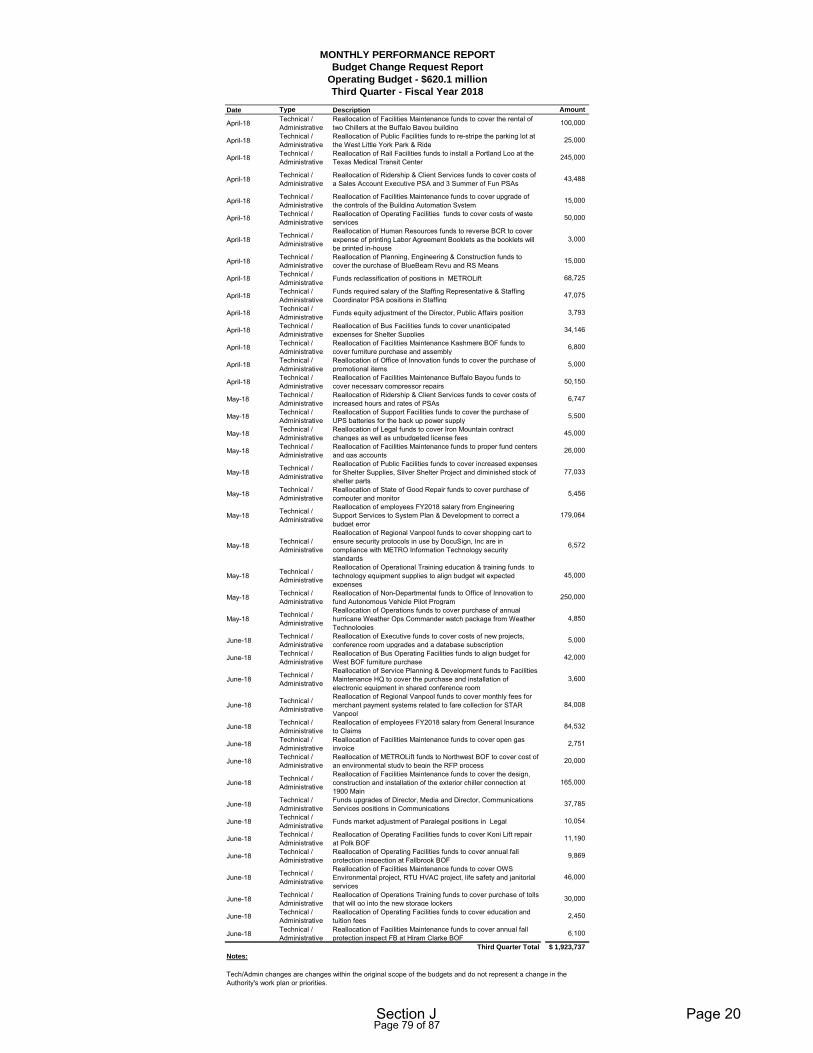
Date Type Description Amount
April-18 Technical / Administrative
Reallocation of Facilities Maintenance funds to cover the rental of two Chillers at the Buffalo Bayou building
100,000
April-18 Technical / Administrative
Reallocation of Public Facilities funds to re-stripe the parking lot at the West Little York Park & Ride
25,000
April-18 Technical / Administrative
Reallocation of Rail Facilities funds to install a Portland Loo at the Texas Medical Transit Center
245,000
April-18 Technical / Administrative
Reallocation of Ridership & Client Services funds to cover costs of a Sales Account Executive PSA and 3 Summer of Fun PSAs
43,488
April-18 Technical / Administrative
Reallocation of Facilities Maintenance funds to cover upgrade of the controls of the Building Automation System
15,000
April-18 Technical / Administrative
Reallocation of Operating Facilities funds to cover costs of waste services
50,000
April-18 Technical / Administrative
Reallocation of Human Resources funds to reverse BCR to cover expense of printing Labor Agreement Booklets as the booklets will be printed in-house
3,000
April-18 Technical / Administrative
Reallocation of Planning, Engineering & Construction funds to cover the purchase of BlueBeam Revu and RS Means
15,000
April-18 Technical / Administrative Funds reclassification of positions in METROLift 68,725
April-18 Technical / Administrative
Funds required salary of the Staffing Representative & Staffing Coordinator PSA positions in Staffing
47,075
April-18 Technical / Administrative Funds equity adjustment of the Director, Public Affairs position 3,793
April-18 Technical / Administrative
Reallocation of Bus Facilities funds to cover unanticipated expenses for Shelter Supplies
34,146
April-18 Technical / Administrative
Reallocation of Facilities Maintenance Kashmere BOF funds to cover furniture purchase and assembly
6,800
April-18 Technical / Administrative
Reallocation of Office of Innovation funds to cover the purchase of promotional items
5,000
April-18 Technical / Administrative
Reallocation of Facilities Maintenance Buffalo Bayou funds to cover necessary compressor repairs
50,150
May-18 Technical / Administrative
Reallocation of Ridership & Client Services funds to cover costs of increased hours and rates of PSAs
6,747
May-18 Technical / Administrative
Reallocation of Support Facilities funds to cover the purchase of UPS batteries for the back up power supply
5,500
May-18 Technical / Administrative
Reallocation of Legal funds to cover Iron Mountain contract changes as well as unbudgeted license fees
45,000
May-18 Technical / Administrative
Reallocation of Facilities Maintenance funds to proper fund centers and gas accounts
26,000
May-18 Technical / Administrative
Reallocation of Public Facilities funds to cover increased expenses for Shelter Supplies, Silver Shelter Project and diminished stock of shelter parts
77,033
May-18 Technical / Administrative
Reallocation of State of Good Repair funds to cover purchase of computer and monitor
5,456
May-18 Technical / Administrative
Reallocation of employees FY2018 salary from Engineering Support Services to System Plan & Development to correct a budget error
179,064
May-18 Technical / Administrative
Reallocation of Regional Vanpool funds to cover shopping cart to ensure security protocols in use by DocuSign, Inc are in compliance with METRO Information Technology security standards
6,572
May-18 Technical / Administrative
Reallocation of Operational Training education & training funds to technology equipment supplies to align budget wit expected expenses
45,000
May-18 Technical / Administrative
Reallocation of Non-Departmental funds to Office of Innovation to fund Autonomous Vehicle Pilot Program
250,000
May-18 Technical / Administrative
Reallocation of Operations funds to cover purchase of annual hurricane Weather Ops Commander watch package from Weather Technologies
4,850
June-18 Technical / Administrative
Reallocation of Executive funds to cover costs of new projects, conference room upgrades and a database subscription
5,000
June-18 Technical / Administrative
Reallocation of Bus Operating Facilities funds to align budget for West BOF furniture purchase
42,000
June-18 Technical / Administrative
Reallocation of Service Planning & Development funds to Facilities Maintenance HQ to cover the purchase and installation of electronic equipment in shared conference room
3,600
June-18 Technical / Administrative
Reallocation of Regional Vanpool funds to cover monthly fees for merchant payment systems related to fare collection for STAR Vanpool
84,008
June-18 Technical / Administrative
Reallocation of employees FY2018 salary from General Insurance to Claims
84,532
June-18 Technical / Administrative
Reallocation of Facilities Maintenance funds to cover open gas invoice
2,751
June-18 Technical / Administrative
Reallocation of METROLift funds to Northwest BOF to cover cost of an environmental study to begin the RFP process
20,000
June-18 Technical / Administrative
Reallocation of Facilities Maintenance funds to cover the design, construction and installation of the exterior chiller connection at 1900 Main
165,000
June-18 Technical / Administrative
Funds upgrades of Director, Media and Director, Communications Services positions in Communications
37,785
June-18 Technical / Administrative Funds market adjustment of Paralegal positions in Legal 10,054
June-18 Technical / Administrative
Reallocation of Operating Facilities funds to cover Koni Lift repair at Polk BOF
11,190
June-18 Technical / Administrative
Reallocation of Operating Facilities funds to cover annual fall protection inspection at Fallbrook BOF
9,869
June-18 Technical / Administrative
Reallocation of Facilities Maintenance funds to cover OWS Environmental project, RTU HVAC project, life safety and janitorial services
46,000
June-18 Technical / Administrative
Reallocation of Operations Training funds to cover purchase of tolls that will go into the new storage lockers
30,000
June-18 Technical / Administrative
Reallocation of Operating Facilities funds to cover education and tuition fees
2,450
June-18 Technical / Administrative
Reallocation of Facilities Maintenance funds to cover annual fall protection inspect FB at Hiram Clarke BOF
6,100
Third Quarter Total 1,923,737$
Notes:
Budget Change Request Report
Operating Budget - $620.1 million
Third Quarter - Fiscal Year 2018
Tech/Admin changes are changes within the original scope of the budgets and do not represent a change in the Authority's work plan or priorities.
MONTHLY PERFORMANCE REPORT
Section J Page 20 Page 79 of 87
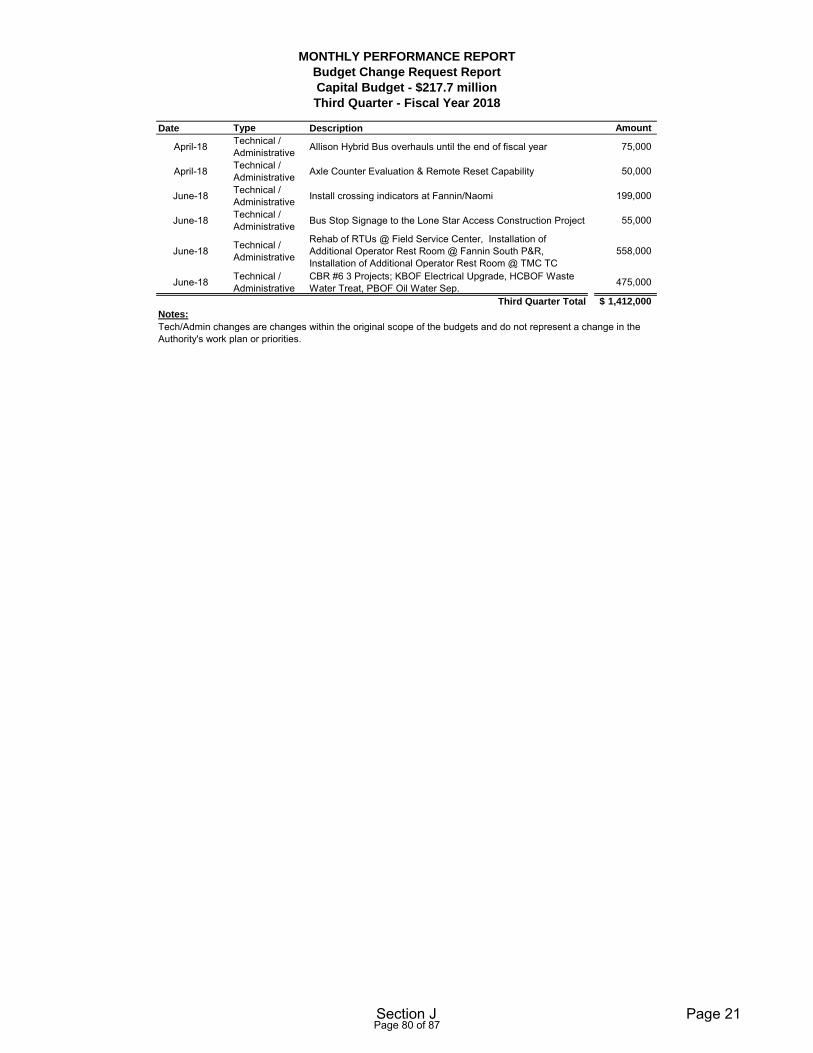
Date Type Description Amount
April-18 Technical / Administrative Allison Hybrid Bus overhauls until the end of fiscal year 75,000
April-18 Technical / Administrative Axle Counter Evaluation & Remote Reset Capability 50,000
June-18 Technical / Administrative Install crossing indicators at Fannin/Naomi 199,000
June-18 Technical / Administrative Bus Stop Signage to the Lone Star Access Construction Project 55,000
June-18 Technical / Administrative
Rehab of RTUs @ Field Service Center, Installation of Additional Operator Rest Room @ Fannin South P&R, Installation of Additional Operator Rest Room @ TMC TC
558,000
June-18 Technical / Administrative
CBR #6 3 Projects; KBOF Electrical Upgrade, HCBOF Waste Water Treat, PBOF Oil Water Sep. 475,000
Third Quarter Total 1,412,000$
Notes:
Budget Change Request Report
Capital Budget - $217.7 million
Third Quarter - Fiscal Year 2018
Tech/Admin changes are changes within the original scope of the budgets and do not represent a change in the Authority's work plan or priorities.
MONTHLY PERFORMANCE REPORT
Section J Page 21 Page 80 of 87

FUEL PRICE RISK MANAGEMENT POLICY REPORT
"FUEL HEDGE"
Jun-18
Page 81 of 87
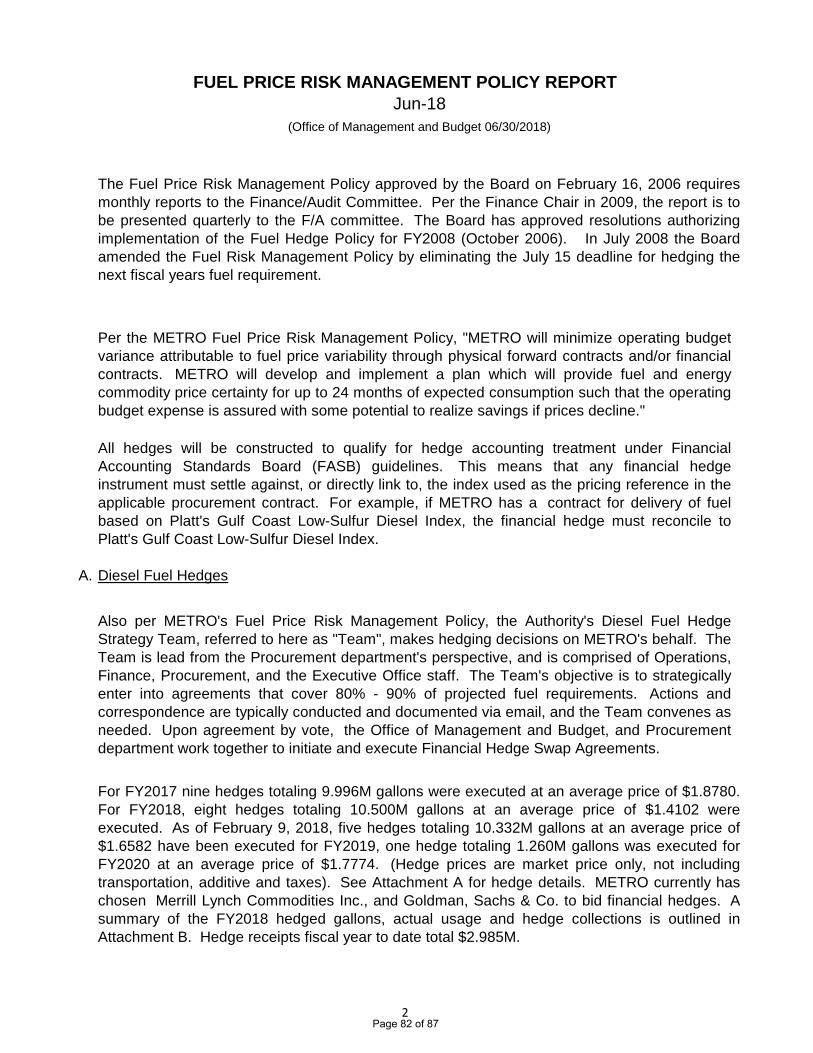
A. Diesel Fuel Hedges
FUEL PRICE RISK MANAGEMENT POLICY REPORT
Jun-18(Office of Management and Budget 06/30/2018)
The Fuel Price Risk Management Policy approved by the Board on February 16, 2006 requiresmonthly reports to the Finance/Audit Committee. Per the Finance Chair in 2009, the report is tobe presented quarterly to the F/A committee. The Board has approved resolutions authorizingimplementation of the Fuel Hedge Policy for FY2008 (October 2006). In July 2008 the Boardamended the Fuel Risk Management Policy by eliminating the July 15 deadline for hedging thenext fiscal years fuel requirement.
For FY2017 nine hedges totaling 9.996M gallons were executed at an average price of $1.8780.For FY2018, eight hedges totaling 10.500M gallons at an average price of $1.4102 wereexecuted. As of February 9, 2018, five hedges totaling 10.332M gallons at an average price of$1.6582 have been executed for FY2019, one hedge totaling 1.260M gallons was executed forFY2020 at an average price of $1.7774. (Hedge prices are market price only, not includingtransportation, additive and taxes). See Attachment A for hedge details. METRO currently haschosen Merrill Lynch Commodities Inc., and Goldman, Sachs & Co. to bid financial hedges. Asummary of the FY2018 hedged gallons, actual usage and hedge collections is outlined inAttachment B. Hedge receipts fiscal year to date total $2.985M.
Per the METRO Fuel Price Risk Management Policy, "METRO will minimize operating budgetvariance attributable to fuel price variability through physical forward contracts and/or financialcontracts. METRO will develop and implement a plan which will provide fuel and energycommodity price certainty for up to 24 months of expected consumption such that the operatingbudget expense is assured with some potential to realize savings if prices decline."
All hedges will be constructed to qualify for hedge accounting treatment under FinancialAccounting Standards Board (FASB) guidelines. This means that any financial hedgeinstrument must settle against, or directly link to, the index used as the pricing reference in theapplicable procurement contract. For example, if METRO has a contract for delivery of fuelbased on Platt's Gulf Coast Low-Sulfur Diesel Index, the financial hedge must reconcile toPlatt's Gulf Coast Low-Sulfur Diesel Index.
Also per METRO's Fuel Price Risk Management Policy, the Authority's Diesel Fuel HedgeStrategy Team, referred to here as "Team", makes hedging decisions on METRO's behalf. TheTeam is lead from the Procurement department's perspective, and is comprised of Operations,Finance, Procurement, and the Executive Office staff. The Team's objective is to strategicallyenter into agreements that cover 80% - 90% of projected fuel requirements. Actions andcorrespondence are typically conducted and documented via email, and the Team convenes asneeded. Upon agreement by vote, the Office of Management and Budget, and Procurementdepartment work together to initiate and execute Financial Hedge Swap Agreements.
2 Page 82 of 87
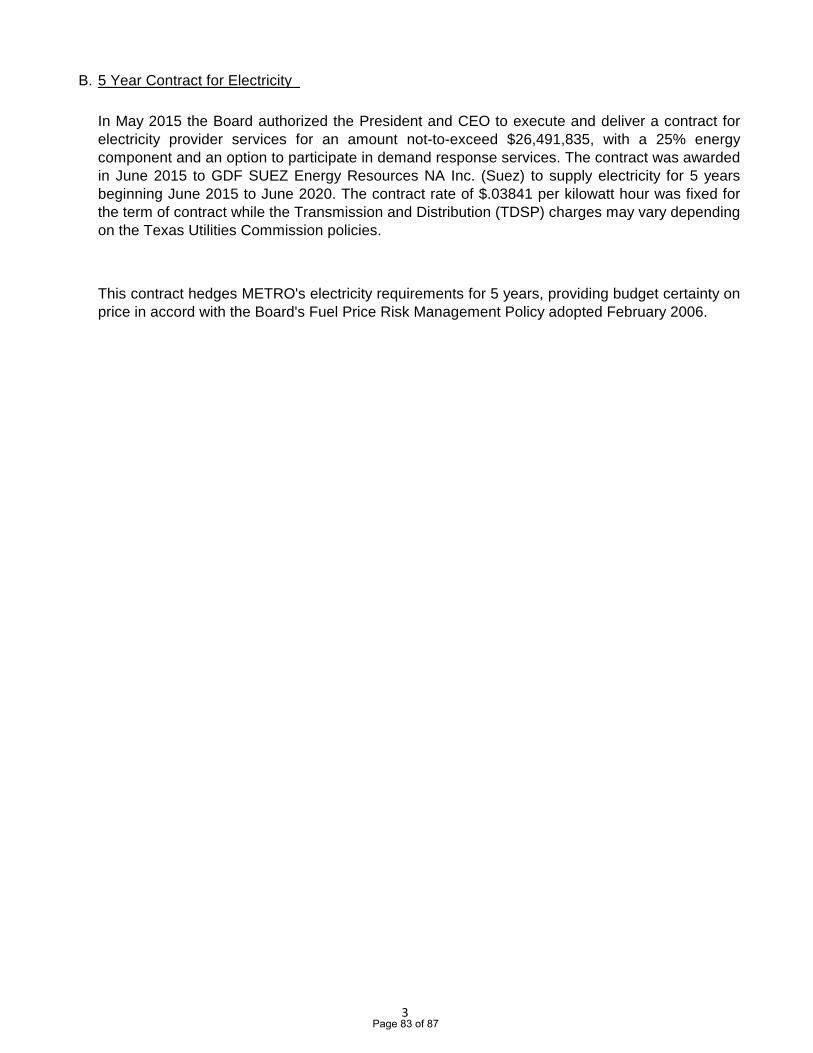
B. 5 Year Contract for Electricity
This contract hedges METRO's electricity requirements for 5 years, providing budget certainty onprice in accord with the Board's Fuel Price Risk Management Policy adopted February 2006.
In May 2015 the Board authorized the President and CEO to execute and deliver a contract forelectricity provider services for an amount not-to-exceed $26,491,835, with a 25% energycomponent and an option to participate in demand response services. The contract was awardedin June 2015 to GDF SUEZ Energy Resources NA Inc. (Suez) to supply electricity for 5 yearsbeginning June 2015 to June 2020. The contract rate of $.03841 per kilowatt hour was fixed forthe term of contract while the Transmission and Distribution (TDSP) charges may vary depending on the Texas Utilities Commission policies.
3 Page 83 of 87

ATTACHMENT A
Page 84 of 87
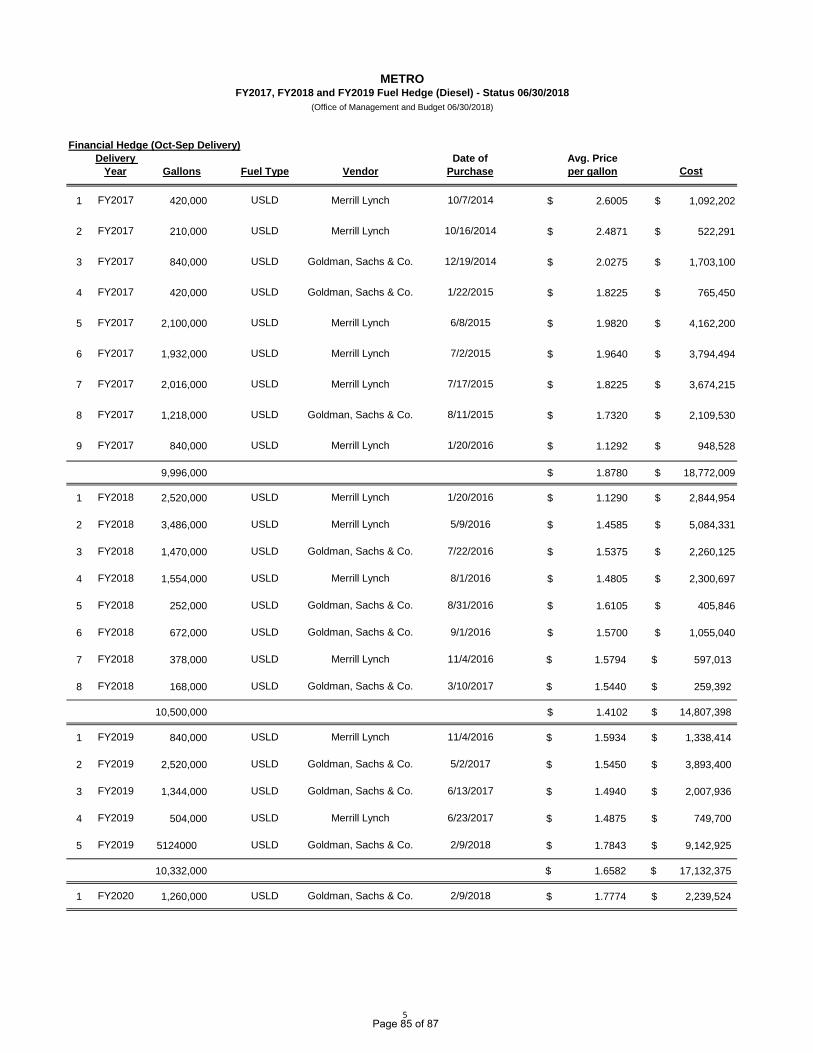
Financial Hedge (Oct-Sep Delivery)
Cost
1 420,000 $ 2.6005 $ 1,092,202
2 210,000 $ 2.4871 $ 522,291
3 840,000 $ 2.0275 $ 1,703,100
4 420,000 $ 1.8225 $ 765,450
5 2,100,000 $ 1.9820 $ 4,162,200
6 1,932,000 $ 1.9640 $ 3,794,494
7 2,016,000 $ 1.8225 $ 3,674,215
8 1,218,000 $ 1.7320 $ 2,109,530
9 840,000 $ 1.1292 $ 948,528
9,996,000 $ 1.8780 $ 18,772,009
1 2,520,000 $ 1.1290 $ 2,844,954
2 3,486,000 $ 1.4585 $ 5,084,331
3 1,470,000 $ 1.5375 $ 2,260,125
4 1,554,000 $ 1.4805 $ 2,300,697
5 252,000 $ 1.6105 $ 405,846
6 672,000 $ 1.5700 $ 1,055,040
7 378,000 1.5794$ 597,013$
8 168,000 1.5440$ 259,392$
10,500,000 $ 1.4102 14,807,398$
1 840,000 1.5934$ 1,338,414$
2 2,520,000 1.5450$ 3,893,400$
3 1,344,000 1.4940$ 2,007,936$
4 504,000 1.4875$ 749,700$
5 5124000 1.7843$ 9,142,925$
10,332,000 1.6582$ 17,132,375$
1 1,260,000 1.7774$ 2,239,524$
FY2019 USLD Goldman, Sachs & Co. 2/9/2018
FY2020 USLD Goldman, Sachs & Co. 2/9/2018
FY2019 USLD Merrill Lynch 11/4/2016
FY2019 USLD Goldman, Sachs & Co. 6/13/2017
FY2018 USLD Goldman, Sachs & Co. 3/10/2017
FY2019 USLD Merrill Lynch 6/23/2017
FY2017 USLD Merrill Lynch 1/20/2016
FY2018 USLD Goldman, Sachs & Co. 7/22/2016
Merrill Lynch 5/9/2016
FY2018 USLD
Goldman, Sachs & Co. 8/31/2016
FY2018 USLD Merrill Lynch 1/20/2016
FY2019 USLD
FY2017 USLD Goldman, Sachs & Co. 1/22/2015
FY2017 USLD Merrill Lynch 7/17/2015
FY2017 USLD Merrill Lynch 6/8/2015
Goldman, Sachs & Co. 5/2/2017
FY2017 USLD Goldman, Sachs & Co. 8/11/2015
FY2017 USLD
METROFY2017, FY2018 and FY2019 Fuel Hedge (Diesel) - Status 06/30/2018
(Office of Management and Budget 06/30/2018)
Delivery
Year Gallons Fuel Type Vendor
Date of
Purchase
Avg. Price
per gallon
FY2018 USLD
Merrill Lynch 11/4/2016
FY2018 USLD Goldman, Sachs & Co. 9/1/2016
FY2018 USLD Merrill Lynch 8/1/2016
FY2018 USLD
FY2017 USLD
Merrill Lynch 7/2/2015
Merrill Lynch 10/16/2014
FY2017 USLD Goldman, Sachs & Co. 12/19/2014
FY2017 USLD Merrill Lynch 10/7/2014
5 Page 85 of 87

ATTACHMENT B
Page 86 of 87
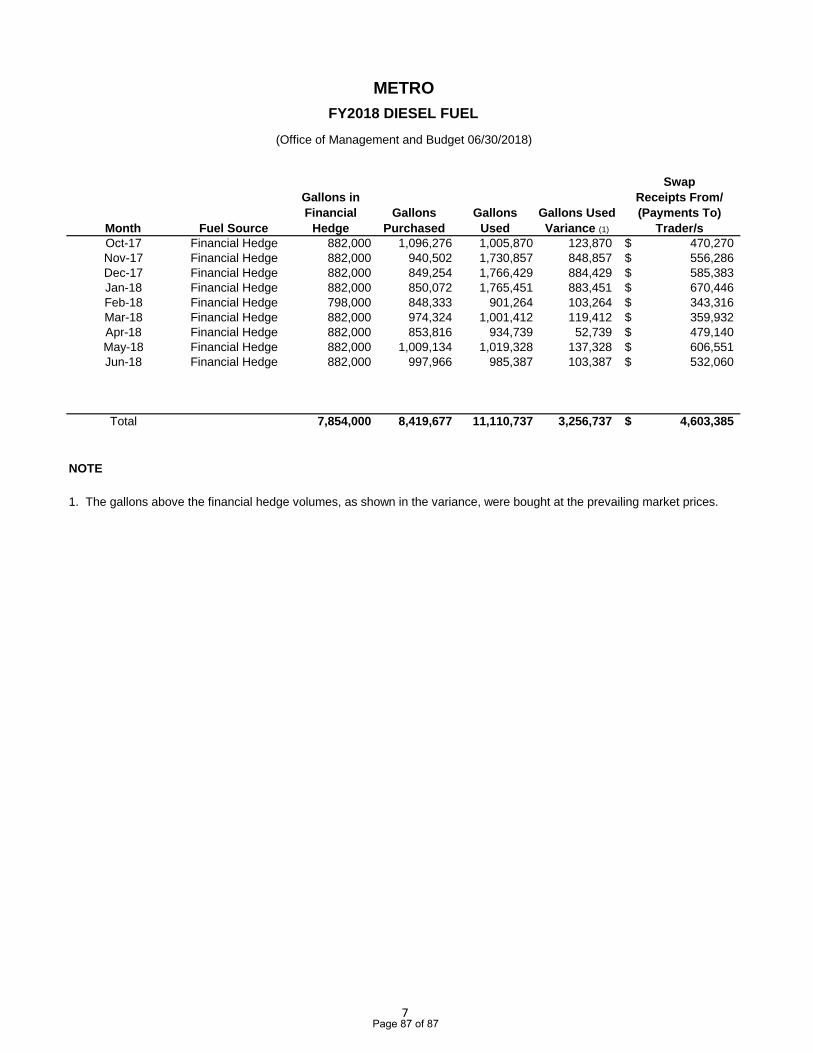
Month Fuel Source
Gallons in
Financial
Hedge
Gallons
Purchased
Gallons
Used
Gallons Used
Variance (1)
Swap
Receipts From/
(Payments To)
Trader/s
Oct-17 Financial Hedge 882,000 1,096,276 1,005,870 123,870 470,270$ Nov-17 Financial Hedge 882,000 940,502 1,730,857 848,857 556,286$ Dec-17 Financial Hedge 882,000 849,254 1,766,429 884,429 585,383$ Jan-18 Financial Hedge 882,000 850,072 1,765,451 883,451 670,446$ Feb-18 Financial Hedge 798,000 848,333 901,264 103,264 343,316$ Mar-18 Financial Hedge 882,000 974,324 1,001,412 119,412 359,932$ Apr-18 Financial Hedge 882,000 853,816 934,739 52,739 479,140$ May-18 Financial Hedge 882,000 1,009,134 1,019,328 137,328 606,551$ Jun-18 Financial Hedge 882,000 997,966 985,387 103,387 532,060$
Total 7,854,000 8,419,677 11,110,737 3,256,737 4,603,385$
NOTE
FY2018 DIESEL FUEL
1. The gallons above the financial hedge volumes, as shown in the variance, were bought at the prevailing market prices.
(Office of Management and Budget 06/30/2018)
METRO
7 Page 87 of 87