Embed Size (px)
Citation preview

This is the author’s version of a work that was submitted/accepted for pub-lication in the following source:
Mandal, Nirmal Kumar & Dhanasekar, Manicka(2013)Sub-modelling for the ratchetting failure of insulated rail joints.International Journal of Mechanical Sciences, 75, pp. 110-122.
This file was downloaded from: https://eprints.qut.edu.au/69097/
c© Copyright 2013 Elsevier
This is the author’s version of a work that was accepted for publication in Interna-tional Journal of Mechanical Sciences. Changes resulting from the publishing process,such as peer review, editing, corrections, structural formatting, and other quality controlmechanisms may not be reflected in this document. Changes may have been madeto this work since it was submitted for publication. A definitive version was subse-quently published in International Journal of Mechanical Sciences, [VOL 75, (2013)] DOI:10.1016/j.ijmecsci.2013.06.003
Notice: Changes introduced as a result of publishing processes such ascopy-editing and formatting may not be reflected in this document. For adefinitive version of this work, please refer to the published source:
https://doi.org/10.1016/j.ijmecsci.2013.06.003

1
Sub-modelling for the ratchetting failure of insulated rail joints
Nirmal Kumar Mandal*# and M. Dhanasekar** *Centre for Railway Engineering Central Queensland University Rockhampton 4702, Australia E-mail: [email protected]
** Professor of Infrastructure Engineering Civil Engineering and Built Environment School
Queensland University of Technology Brisbane 4001, Australia
E-mail: [email protected]
Submitted to: International Journal of Mechanical Sciences, Revised Version 12 Apr13 Abstract
Insulated rail joints are critical for train safety as they control electrical signalling systems;
unfortunately they exhibit excessive ratchetting of the railhead near the endpost insulators.
This paper reports a three-dimensional global model of these joints under wheel-rail contact
pressure loading, and a sub-model examining the ratchetting failures of the railhead. The sub-
model employs a nonlinear isotropic-kinematic elastic-plastic material model and predicts
stress/strain levels in the localised railhead zone adjacent to the endpost which is placed in
the air gap between the two rail ends at the insulated rail joint. The equivalent plastic strain
plot is utilised to capture the progressive railhead damage adequately. Associated field and
laboratory testing results of damage to the railhead material suggest that the simulation
results are reasonable.
Keywords: railhead, ratchetting, sub-modelling, finite element analysis, von Mises yield
criterion.
# corresponding author: Tel: + 617 4923 2064, Fax: + 617 4930 2984

2
1. Introduction
Insulated rail joints (IRJs) are part of the railway signalling system, helping detect the presence
of trains on specific sections of track through shorting the circuitry in which one of the rails passes a
low voltage current whilst the other rail acts as ground, and the wheelsets act as conductors between
the two running rails. Some railways also use track circuiting to detect broken rails. The endpost
insulators at the IRJs provide the electrical isolation of block sections of track for signalling. When
a wheelset passes an IRJ and enters a block section, it triggers a signal so that no other trains can
enter into that section. Ratchetting (Fig. 1) diminishes the reliability of the signalling system, thus
posing a threat to the safety of train operations. Further, the IRJs exhibit the lowest service life of all
railway track components; for example, in most heavy haul lines, IRJs fail on average around 200
million gross tonnes (MGT) of traffic throughput, whilst unjointed rails stay in service for
2000MGT.
Fig. 1: Material degradation and failure of railhead and endpost materials
Railhead material is loaded repeatedly due to cycles of passing wheels, leading to localised
progressive elastic-plastic deformation. For contact pressures above the plastic shakedown limit, the
hysteretic cycles cause unidirectional plastic flow, or ratchetting (Fig. 2).
Ratchetting is one of the primary modes of failure of IRJs [1]. Evaluation of several kinematic
hardening rules and identification of the effects of different modulii on ratchetting are detailed [2 -

3
7] for metallic materials under uniaxial and multiaxial stresses without reference to applications.
This paper deals with the localised ratchetting of railhead material close to the insulating gap.
Fig. 2: Ratchetting of metallic material
2. Studies on railhead stresses near the endpost of IRJs
Chen and Kuang [8] carried out a 3D finite element analysis on an insulated rail joint to
investigate the effect of rail joint parameters on the contact pressure distribution and contact stress
variation near wheel-rail contact zones. They indicated that, due to nonlinearity, traditional Hertzian
contact theory (HCT) was no longer sufficient to predict stress contours near insulated rail joints.
Chen [9] employed an elastic-plastic plane strain finite element method to investigate the effects
of the free rail end on the contact stress distribution. Chen and Chen [10] studied the effects of an
insulated joint on the wheel-rail contact stresses under the condition of partial slip. Both the wheel-
rail normal and tangential stress distributions were presented using 2D plane strain FE analysis
considering effects of contact distance from the end of the rail and different end post materials. It
was shown that, when a wheel rolled across the rail gap containing the endpost, an impact occurred.
Ratchetting
Strain
Stress

4
Contact-impact analyses of the rail joint using a dynamic finite element method were carried out
independently by Wen et al. [11], Pang [12] and Cai et al. [13]. Implicit and explicit FE methods
were coupled to simulate contact forces and the stresses and strains in the railhead. A linear
kinematic hardening material model was considered by Wen et al. [11] depicting the influences of
axle load and wheel speed, and a wider rail endpost gap of 15 mm was considered. Pang [12]
considered gaps of 5mm and 10mm consistent with the designs used in Australia at that time. Other
gap ranges reported in the literature varied from 4 mm to 8 mm [14-15].
Kabo et al. [14] showed that the railhead material deformed plastically up to a depth of 6mm
from the top of the rail surface; however, they did not investigate the change of plastic zone in the
railhead due to various wheel load cycles.
Sandstrom and Ekberg [15] studied the plastic deformation and fatigue due to impact and
captured the plastic strain accumulation. The range of endpost gap was taken as 4mm to 8mm.
Plaut et al. [16] analysed the behaviour of tapered, adhesively bonded joints using the finite
element and Rayleigh-Ritz methods to compute deflections, bending moments and stresses in rails
and joint bars. Several taper angles and a single static load at the centre of the joint were considered.
The results suggested that the tapered bonded joints exhibited a few advantages over conventional
square rail end joints such as smaller values of maximum deflection, bending moment in the rails
and joint bars and shear stress within the adhesive. A similar comparison between a square and an
inclined IRJ was recently performed by Dhanasekar and Bayissa [17] using field testing data from a
heavy haul coal railway and it was argued that there were no significant advantages of inclined IRJs
over square IRJs. The analysis of IRJs considering standard square joints was also carried out by
other authors [18, 19]. Using a finite element analysis (FEA), Himebaugh et al. [18] determined the

5
vertical displacement of the rail and the shear and peel stresses in the epoxy of the joint considering
both a static wheel load and a tensile load. The influences of design parameters of IRJs such as size
of sleepers and thickness and length of joint bars on stresses in rail and epoxy were presented. Ding
and Dhanasekar [19] on the other hand studied the looseness of the bolts at the joints and concluded
that the simulation results revealed that sufficient bolt tension was necessary to prevent the loss of
structural integrity of the joint due to bending load. The loss of bolt tightness increased the length of
separation of the contact surface that affected the behaviour of the joint under severe loading.
Nicoli et al. [20] performed laboratory tests on single lap joint and double cantilever beam
configurations of various combinations of adhesives, fibrous insulators and rail surface treatment to
investigate the potential for these to prolong the service life of IRJs for rail operations.
It can be stated that only limited studies on IRJs have been carried out to date. Knowledge of the
failure of railhead material in the vicinity of the rail endpost gap is essential to ensure the correct
tolerance design and a safe load limit for IRJs. Once the mechanisms of IRJ failure are clearly
understood, the effects of design and operational parameters on the IRJs can be assessed to enhance
their service life. A detailed stress and ratchetting analysis of IRJs is undertaken in this study.
3. Finite element model for stress analysis
3.1 Global rail model
This study reports a 3D finite element model (FEM) for the simulation of the failure of the
railhead in the vicinity of the endpost of an IRJ. An actual IRJ design as specified in [21] is shown
in cross-section in Fig. (3a); it consists of lots of interacting surfaces that are complex to model and
expensive to analyse. This IRJ profile was, therefore, simplified to focus on the localised failure of
the railhead; the simplified model considered the IRJ assembly as a single part (Fig. 3(b)) with
differing materials in perfect contact. In the simplified model, a slit was introduced to simulate the

6
gap between the bolt shank and other components of the IRJ. The rail was positioned with a 1/20
cant to match the profile of the conical wheel tread (Fig. 4).
Fig. 3: Idealisation of geometry of IRJ: (a) assembly of current design of IRJ, and (b) idealised IRJ
model with simplified geometry of homogeneous section
Fig. 4: Canted rail
One 2.4m long solid rail element incorporating the IRJ and two 4.8m long beam elements at
either end of this solid rail make up the 12m long global rail model. Similar lengths of rail are used
elsewhere when considering bending and reverse bending [22-23]. The two beam elements were
(a)
1/20
Wheel
Rail
Gauge side
Field side
Flange
(b)

7
connected to the solid rail element by equation constraints which ensured zero displacement and
rotation of beams and rail relative to one another. All the degrees of freedom (DOFs) were
transferred from the solid rail to the beam elements. The connection of the solid rail element to a
beam element is shown in Fig. 5.
Fig. 5: Interaction of solid rail element and beam element in the global model
In the simulation, the endpost was assumed to be fully bonded together with the rail ends using a
tie constraint. A tie constraint was also considered to bond the top part of the railhead (the fine
mesh area adjacent to the rail endpost gap as shown in Fig. 6) to the rest of the rail model.
Fig. 6: Fine mesh area at the top of railhead
Connection point
Beam element
Elastic-plastic zone with fine mesh
Elastic zone
Solid rail element

8
The directions indicated in Fig. 7 are in the global co-ordinate system directions of ‘1’, ‘2’ and
‘3’. The direction ‘3’ represents the longitudinal track direction, ‘2’ represents the vertical direction
which is perpendicular to the foot of the canted rail and ‘1’ gives the lateral track direction.
Analysis was carried out using two steps. All boundary conditions are placed along with the bolt
loads in step 1, and the wheel load (Fig. 8) is imposed in step 2. The bolt load bP was calculated
from the bolt torque T, the bolt diameter D and a coefficient bK ( bK =0.19-0.25) as shown in Eq.
(1):
bb
TP
K D (1)
Fig. 7: Global rail model of IRJ comprising of a solid rail element and two beam elements
A peak pressure of 2500MPa was input to enhance ratchetting, representing an ellipsoidal
contact pressure load on the railhead and endpost. For elastic-plastic analysis, a maximum peak
pressure of about 2000MPa was used elsewhere [9]. The ellipsoidal Hertzian pressure distribution
was idealised as a stepped pressure load on the railhead of the global model. It is just a numerical
approximation. In step 2, a cyclic dynamic wheel load (100 impacts) was applied. The peak

9
pressure load of 2500 MPa on the railhead causes a stress level above the yield stress of the
material.
Fig. 8: Support and loading conditions of rail with track
In the mesh module, eight-node fully integrated linear brick elements (C3D8) were considered
for all components in the solid modelling zone. This type of element was considered because, in
elastic-plastic material deformation, it does not suffer from volumetric locking. Therefore, the
incompressible nature of rail steel in plastic deformation creates no problem. The full global model
is presented in Fig. 7. High mesh density was introduced in the region close to the IRJ (Fig. 6).
Finally, in the job module, the simulation was completed to obtain the displacement DOFs at the
nodes of the global model which were then used to run a sub-model of rail separately as discussed
in the following section.
3.2 Rail sub-model
For localised damage analysis, it is necessary to model a critical region of the IRJ, close to the
ends of rail, with a finer mesh. It is not economical to use a fine mesh over the whole global rail
model. Instead, a small region, near to the endpost as shown in Fig. 9, can be analysed with higher
Wheel pressure load
700 mm
130 mm
Fixed sleeper support

10
mesh density – this is called sub-modelling. Using full integration by ABAQUS/Standard, it is
possible to obtain accurate stress/strain behaviours.
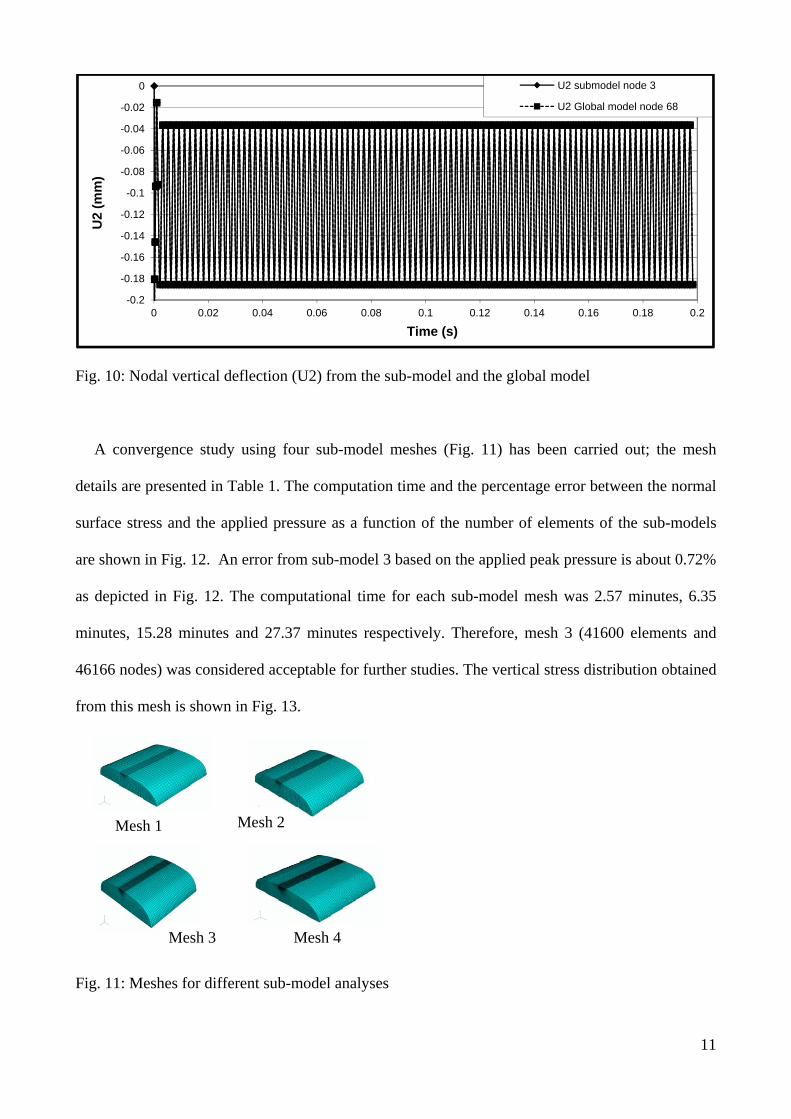
The sub-model was run after the global model. The time dependent variables (driven variables)
derived in the global analysis were transferred to the relevant boundary nodes of the sub-model
(Fig. 9). The variation of vertical deformation of rail top material from the global model and the
sub-model in both fully loaded and unloaded conditions is illustrated in Fig. 10 through 100 cycles
over a period of 0.2s. The deformation of the global model node and the deformation of the same
node in the sub-model have the same values. This ensures the input data to the sub-model is
transferred from the global model correctly.
Fig. 9: Position of sub-model in global rail model: (a) global model, and (b) sub model
Same edge Same edge
(a)
(b)
Endpost
16mm
61.25mm 70mm
11
Fig. 10: Nodal vertical deflection (U2) from the sub-model and the global model
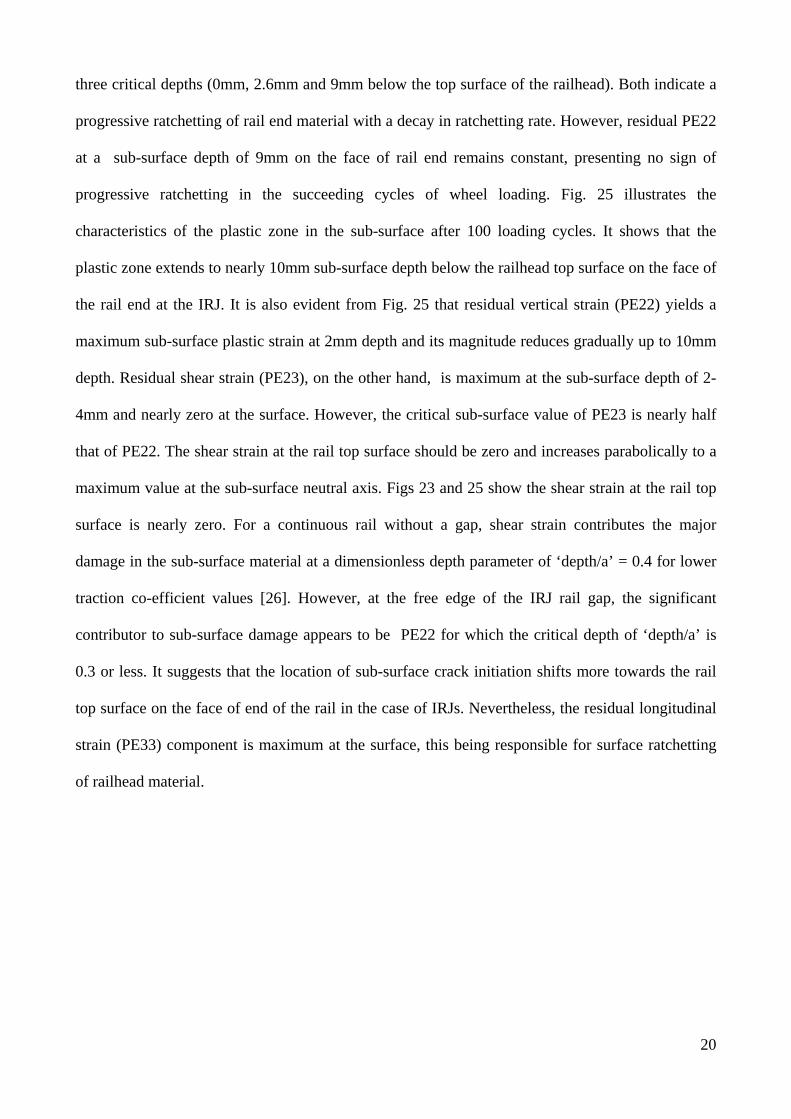
A convergence study using four sub-model meshes (Fig. 11) has been carried out; the mesh
details are presented in Table 1. The computation time and the percentage error between the normal
surface stress and the applied pressure as a function of the number of elements of the sub-models
are shown in Fig. 12. An error from sub-model 3 based on the applied peak pressure is about 0.72%
as depicted in Fig. 12. The computational time for each sub-model mesh was 2.57 minutes, 6.35
minutes, 15.28 minutes and 27.37 minutes respectively. Therefore, mesh 3 (41600 elements and
46166 nodes) was considered acceptable for further studies. The vertical stress distribution obtained
from this mesh is shown in Fig. 13.
Fig. 11: Meshes for different sub-model analyses
-0.2
-0.18
-0.16
-0.14
-0.12
-0.1
-0.08
-0.06
-0.04
-0.02
0
0 0.02 0.04 0.06 0.08 0.1 0.12 0.14 0.16 0.18 0.2
U2
(mm
)
Time (s)
U2 submodel node 3
U2 Global model node 68
Mesh 1 Mesh 2
Mesh 4 Mesh 3

12
Table 1: Node and element numbers of different meshes
Meshes Nodes Elements
Mesh 1 13,338 11,492
Mesh 2 29,376 26,180
Mesh 3 46,166 41,600
Mesh 4 90,240 83,444
Fig. 12: Convergence study and error estimation of sub-modelling [1]
Fig. 13: Vertical stress distribution from sub-modelling using Mesh 3 [1]
0
2
4
6
8
10
12
0 20000 40000 60000 80000 100000
No. of elements
Err
or
(%)
0
200
400
600
800
1000
1200
1400
1600
1800
Tim
e (s
)
Error %
Time (s)

13
3.3 Constitutive model
Material models are based on constitutive equations relating to stress or strain response of a
material for a given stress or strain history. When a material deforms elasto-plastically, many
plasticity models consider incremental theories in which the mechanical strain rate is decomposed
into an elastic part and a plastic part. These theories are formulated in terms of a yield surface, a
flow rule and evolution laws. A linear kinematic hardening model or a nonlinear isotropic/kinematic
hardening model is appropriate for materials subjected to cyclic loading. The latter is better for
many aspects: the plastic shakedown and Bauschinger effect and also ratchetting and relaxation of
mean stress. In this model, isotropic and kinematic hardening laws are coupled. This means that the
yield surface is free to change shape and size, and free to move in stress space. The isotropic
hardening law is also necessary to produce decay in the ratchetting rate.
The mathematical modelling of plasticity models is generally based on yield stress defined by a
von-Mises yield surface, associated plastic flow rules and kinematic hardening rules. It starts with a
simple linear kinematic hardening rule [24-25] to a more complex hardening rule [26]. The detailed
mathematical formulations of plasticity models are available in the literature [25, 27-34].
To capture progressive material degradations of the railhead in the vicinity of the rail joint gap of
the IRJ due to complex multi-axial loadings in wheel-rail contact, an appropriate material model
was utilised comprising a von-Mises yield surface in which the yield function is defined as:
3( , , ) | |
2
,| | :
dev y
dev dev dev dev dev dev
X K K
with X
(2)
where | |dev is the equivalent von-Mises stress, dev is the deviatoric stress tensor (defined as dev
=σ-pI, where σ is the stress tensor, p is the equivalent pressure stress and I is the identity tensor),
Xdev is the deviatoric part of the back stress tensor, σy is the yield stress, K is the drag stress and the
operator ‘:’ defines the contraction x:y = xijyij.

14
The non-linear hardening model used in this simulation includes both isotropic and kinematic
hardening. The isotropic hardening law can be stated as:
(1 )K
K bK
(3)
This law indicates decay in the ratchetting rate where λ is the plastic multiplier, b governs the
initial rate of isotropic hardening and K∞ is the saturated drag stress due to isotropic hardening.
Both b and K∞ are material parameters.
A non-linear kinematic hardening rule ensures the steady accumulation of plastic strain. The law
can be as in equation (4) where c and γ are material parameters:
2
( )3 devX c n X (4)
where | |
devdev
dev
n
.
The material constants used are: 207steelE GPa ; 0.3steel ; 4500fibreglassE MPa ;
0.19fibreglass ; 780y MPa ; 152K MPa ; 393c GPa ; 3.97b and 8.3 .
4. Simulation results and discussion
The results are presented from both the global and the sub models considering a load above the
shakedown limit to show ratchetting material behaviour and decay in ratchetting rate. Peak pressure
load, P0 and shear yield stress, k0 are the important parameters in shakedown analysis of plastic
deformation. It is established that the load required to cause repeated plastic deformations in a
kinematically hardening material must have an amplitude of more than twice the initial yield stress
of the material [25].

15
4.1 Deformation of railhead material
The permanent longitudinal deformation of the rail top surface adjacent to the rail gap is
indicated by the reduction of endpost thickness (Fig. 14). The metal flow direction is shown in Fig.
14. Dipping, on the other hand, is the permanent deformation of railhead material in the vicinity of
the endpost in the vertical direction (Fig. 15). Deformation of railhead material close to the endpost
at the IRJ due to the passage of a rolling wheel load are shown in Fig. 16 for the longitudinal
direction and in Fig. 17 for the vertical direction. The results of these plots were obtained after 100
loading cycles were applied.
The endpost material (epoxy fibreglass) deforms axially due to the longitudinal deformation of
rail end material of the IRJ. The combined longitudinal deformation from both rail ends at the IRJ
was 0.02159mm (Figs 14 and 16) for fully unloaded conditions which was 1/3.7 times less
compared to that for fully loaded conditions (Fig. 16). The residual vertical displacement at the
centre of the endpost was about 0.05374mm (Figs 15 and 17) which was 1/5 times less than that of
the vertical deformation due to presence of a wheel load after 100 loading cycles (Fig. 17).

16
Fig. 14: Longitudinal deformation of the end of the rail from the global rail model due to fully
unloaded conditions (deformation scale factor 20)
Fig. 15: Dipping of railhead material in the vicinity of the endpost of the IRJ from the global rail
model due to fully unloaded conditions (deformation scale factor 20)
endpost
endpost

17
Fig. 16: Longitudinal deformation of the railhead top surface across the endpost (loaded and
unloaded conditions)
Fig. 17: Vertical deformation of the railhead top surface across the endpost (loaded and unloaded
conditions)
-0.04
-0.03
-0.02
-0.01
0
0.01
0.02
0.03
0.04
0.05
0 10 20 30 40 50 60
Lo
ng
itu
din
al d
efo
rmat
ion
(m
m)
Distance across the joint (mm)
unloading
loading
-0.3
-0.25
-0.2
-0.15
-0.1
-0.05
0
0 10 20 30 40 50 60
Ver
tica
l def
orm
atio
n (
mm
)
Distance across the joint (mm)
unloading
loading
endpost
dipping
endpost
metal flow

18
4.2 Strain analysis
Plastic strain and equivalent plastic strain (PEEQ) are the measures for damage analysis. Plastic
strain represents a strain variation after one loading cycle. However, equivalent plastic strain yields
an accumulation of all plastic components throughout multiple cycles.
Fig. 18 shows equivalent plastic strain (PEEQ) for 100 cycles of wheel loads considering
integration points of a railhead top surface element in the vicinity of the endpost from sub-
modelling using Mesh 3. It shows an accumulation of strain components over cycles. It is also
important to note that ratchetting (progressive damage) gradually increases while ratchetting rate
decays (Fig. 19) [23]. Fig. 20 presents longitudinal stress and strain variation over 100 cycles. It
shows that strain due to wheel loads increases in each cycle, illustrating a ratchetting material
behaviour at the rail end material of the IRJ which is similar to that of the ratchetting material
behaviour established in the literature (Fig. 2).
Fig.18: Progressive damage (PEEQ): the railhead top surface from eight integration points

19
Fig. 19: Ratchetting rate in the longitudinal direction
Fig. 20: Cyclic longitudinal stress - longitudinal strain relationship
Figs 21 to 23 show cyclic vatiations of strains of railhead material in the vicinity of the endpost
of the IRJ over 100 cycles of loading. All these plots indicate progressive ratchetting of railhead
material with a decay in ratchetting rate similar to Fig.19 for railhead longitudinal strain (Fig. 21),
vertical strain (Fig. 22) and shear strain (Fig. 23). The residual vertical strain component (PE22) in
the sub-surface of the railhead of a rail end face over 100 cycles is shown in Fig. 24 considering
0
0.000001
0.000002
0.000003
0.000004
0.000005
0.000006
0 10 20 30 40 50 60 70 80 90 100
Lo
ng
. pla
stic
str
ain
rat
e
No. of cycles
-1800
-1600
-1400
-1200
-1000
-800
-600
-400
-200
0
0 0.001 0.002 0.003 0.004 0.005 0.006 0.007
Lo
ng
itu
din
al s
tres
s (M
Pa)
Longitudinal Strain
20
three critical depths (0mm, 2.6mm and 9mm below the top surface of the railhead). Both indicate a
progressive ratchetting of rail end material with a decay in ratchetting rate. However, residual PE22
at a sub-surface depth of 9mm on the face of rail end remains constant, presenting no sign of
progressive ratchetting in the succeeding cycles of wheel loading. Fig. 25 illustrates the
characteristics of the plastic zone in the sub-surface after 100 loading cycles. It shows that the
plastic zone extends to nearly 10mm sub-surface depth below the railhead top surface on the face of
the rail end at the IRJ. It is also evident from Fig. 25 that residual vertical strain (PE22) yields a
maximum sub-surface plastic strain at 2mm depth and its magnitude reduces gradually up to 10mm
depth. Residual shear strain (PE23), on the other hand, is maximum at the sub-surface depth of 2-
4mm and nearly zero at the surface. However, the critical sub-surface value of PE23 is nearly half
that of PE22. The shear strain at the rail top surface should be zero and increases parabolically to a
maximum value at the sub-surface neutral axis. Figs 23 and 25 show the shear strain at the rail top
surface is nearly zero. For a continuous rail without a gap, shear strain contributes the major
damage in the sub-surface material at a dimensionless depth parameter of ‘depth/a’ = 0.4 for lower
traction co-efficient values [26]. However, at the free edge of the IRJ rail gap, the significant
contributor to sub-surface damage appears to be PE22 for which the critical depth of ‘depth/a’ is
0.3 or less. It suggests that the location of sub-surface crack initiation shifts more towards the rail
top surface on the face of end of the rail in the case of IRJs. Nevertheless, the residual longitudinal
strain (PE33) component is maximum at the surface, this being responsible for surface ratchetting
of railhead material.

21
Fig. 21: Cyclic variation of longitudinal strain of the railhead in the vicinity of the endpost
Fig. 22: Cyclic variation of vertical strain of the railhead in the vicinity of the endpost
Fig. 23: Cyclic variation of shear strain of the railhead in the vicinity of the endpost
0.004
0.0042
0.0044
0.0046
0.0048
0.005
0.0052
0.0054
0 0.02 0.04 0.06 0.08 0.1 0.12 0.14 0.16 0.18 0.2
PE
33
Time (s)
-0.0046
-0.0044
-0.0042
-0.004
-0.0038
-0.0036
-0.0034
0 0.02 0.04 0.06 0.08 0.1 0.12 0.14 0.16 0.18 0.2
PE
22
Time (s)
0.00025
0.00026
0.00027
0.00028
0.00029
0.0003
0 0.02 0.04 0.06 0.08 0.1 0.12 0.14 0.16 0.18 0.2
Sh
ear
stra
in
Time (s)

22
Fig. 24: Cyclic variation of residual vertical strain on the face of a rail end at the IRJ for three
critical sub-surface depths
Fig. 25: Sub-surface residual strains on the face of a rail end at the IRJ at various sub-surface depths
after 100 load cycles.
4.3 Stress analysis
Like strains, stress fields yield valuable information regarding potential railhead ratchetting. The
von-Mises stress due to fully loaded and unloaded conditions is shown in Figures 26 and 27
respectively. The residual sub-surface von-Mises stress is well above the yield strength of the rail
material (780MPa) considered in this simulation as per AS 1085 [21].
-0.006
-0.005
-0.004
-0.003
-0.002
-0.001
0
0 10 20 30 40 50 60 70 80 90 100
Res
idu
al P
E22
Cycles
PE22 top
PE22 2.6mm depth
PE22 9mm depth
0
2
4
6
8
10
12
14
16
-0.006 -0.004 -0.002 -1E-17 0.002 0.004 0.006
Dep
th (
mm
)
Residual Strains
PE22
PE33
PE23

23
Fig. 26: The von-Mises stress distribution due to fully loaded conditions
Fig. 27: The von-Mises stress distribution due to fully unloaded conditions
The cyclic variation of stresses are presented in Figs 28 to 30. It is observed that, when the
loading is stabilised, the vertical stress (Fig. 28) corresponds to the applied peak pressure in the
loading zone, and the same value is maintained with no significant vertical residual stress locked in

24
the railhead material at the end of 100 loading cycles, suggesting that the sub-modelling analysis
results can be trusted.
It is also evident from Fig. 29 that the residual longitudinal stress gradually increases with load
cycles, showing a decay in ratchetting rate (slope) in subsequent cycles, a similar trend to that of
Fig. 19. Residual S33 stress is above the yield point (780MPa) of the material considered in this
study. Fig. 30 shows a cyclic variation of shear stress over 0.2s (100 loading cycles). It is seen that
the trend of the shear stress component differs, maintaing a near constant negligible (zero)
magnitude of strain throughout the cycles. A similar trend of zero strain at the rail top surface was
also noticed (Fig. 23).
Fig. 28: Cyclic variation of vertical stress of the top railhead in the vicinity of the endpost
-3000
-2500
-2000
-1500
-1000
-500
0
500
0 0.02 0.04 0.06 0.08 0.1 0.12 0.14 0.16 0.18 0.2
S22
(M
Pa)
Time (s)
25
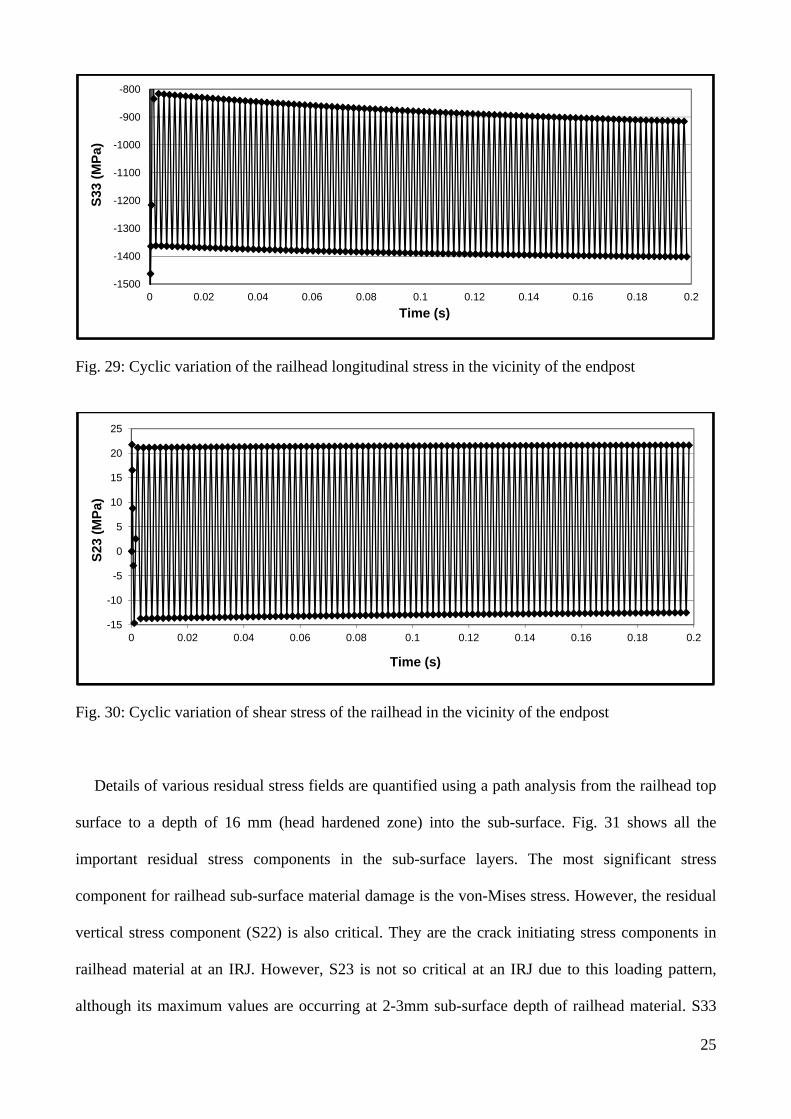
Fig. 29: Cyclic variation of the railhead longitudinal stress in the vicinity of the endpost
Fig. 30: Cyclic variation of shear stress of the railhead in the vicinity of the endpost
Details of various residual stress fields are quantified using a path analysis from the railhead top
surface to a depth of 16 mm (head hardened zone) into the sub-surface. Fig. 31 shows all the
important residual stress components in the sub-surface layers. The most significant stress
component for railhead sub-surface material damage is the von-Mises stress. However, the residual
vertical stress component (S22) is also critical. They are the crack initiating stress components in
railhead material at an IRJ. However, S23 is not so critical at an IRJ due to this loading pattern,
although its maximum values are occurring at 2-3mm sub-surface depth of railhead material. S33
-1500
-1400
-1300
-1200
-1100
-1000
-900
-800
0 0.02 0.04 0.06 0.08 0.1 0.12 0.14 0.16 0.18 0.2
S33
(M
Pa)
Time (s)
-15
-10
-5
0
5
10
15
20
25
0 0.02 0.04 0.06 0.08 0.1 0.12 0.14 0.16 0.18 0.2
S23
(M
Pa)
Time (s)

26
has a maximum value at the surface of the railhead. The values of residual stress components are
reduced gradually with depth, illustrating a sub-surface plastic zone extending to nearly 10~12mm
depth on the face of the rail end at the IRJ. Using the dimensionless depth parameter (depth/a), all
residual stresses except S33 are critical at a depth of 0.3 or less, a similar depth to that shown for
residual strain plots.
Fig. 31: Sub-surface residual stresses on the face of a rail end at the IRJ at various sub-surface
depths after 100 loading cycles
Fig. 32 presents the longitudinal variation of residual von-Mises stress. These are plotted at three
critical depths (0mm, 2mm and 16mm below the top surface of the railhead). Fig. 32 illustrates that
the residual component of stress reduces rapidly moving away from the end of the rail face in the
longitudinal direction; the residual stress is reduced nearly to zero within 3-4mm for the von-Mises
stress (Fig. 32). The residual contact stress is insignificant in the sub-surface at 16mm depth below
the top surface of the railhead regardless of closeness to the rail face at the joint.
0
2
4
6
8
10
12
14
16
18-1000 -800 -600 -400 -200 0 200 400 600 800 1000
Dep
th (
mm
)
Residual stresses (MPa)
von-Mises
S22
S33
S23

27
Fig. 32: Residual von-Mises stress in the longitudinal direction away from the end of the rail face
for different depths from the top surface of the railhead
5. Validation of FE results
5.1 Field testing
Part of the results of the FE simulation for damage analysis was validated using a field test
carried out by a team from the Centre for Railway Engineering (CRE) and Queensland Rail (QR). A
digital camera was used to regularly capture the damage of the railhead materials in the vicinity of
the endpost. Fig. 33 shows a picture of an IRJ approximately one month after installation. It
revealed that metal flow had taken place both in the vertical and in the longitudinal directions,
causing a dipping and contraction of the endpost.
Two digital image processing tools, Image Tool (IT) and Screen Calipers (SC) were used to
measure the thickness of the endpost at the same location where the scale was placed (Fig. 33) each
time the IRJ was photographed. Figs 34 and 35 show the screen shots of the image processing tools
SC and IT respectively. Both tools were calibrated prior to processing the railhead images. The
-100
0
100
200
300
400
500
600
700
800
900
1000
0 2 4 6 8 10 12 14
Res
idu
al v
on
-Mis
es s
tres
s (M
Pa)
Distance from the end of the rail face (mm)
Top surface
2mm depth from the top of the rail surface
16 mm depth from the top of the rail surface

28
original endpost thickness was 8.00 mm. The thickness of the endpost of the IRJ (Fig. 33) measured
by IT was 7.69 mm and by SC was 7.67 mm. The thickness measured by IT was compared with the
FEM results for permanent deformation of the ends of the rails (Fig. 14). From Fig. 14, it is
observed that, during fully unloaded conditions, a deformation of about 0.01098 mm has taken
place in the longitudinal direction at one end, suggesting a total compression of about 0.02 mm
from both rails on either side of the endpost.
FE modelling simulation results of longitudinal metal flow across the endpost (Fig. 14)
correlated well with the data measured by field testing (Fig. 33). Therefore, simulation results from
the FEM appear quite reasonable, as shown in Table 2.
Fig. 33: A square IRJ inserted in a track

29
Fig. 34: Screen shot of SC for measuring thickness of IRJ endposts
Fig. 35: Screen shot of IT for measuring thickness of eIRJ endpost
Table 2: Comparison of metal flow of field test and current simulation
Ratio of deformed endpost
thickness to original
endpost thickness
Field test Simulation Error (%)
0.961 0.996 3.5

30
5.2 Laboratory testing
Laboratory tests were carried out to validate the simulation results. The testing involved
measurement of strain fields in the railhead under vertical cyclic wheel load applied through a block
provided with a wheel profile. The load (Fig. 36) replicates the load used in the FE simulation. The
wheel patch radius was 425mm and the thickness of the endpost was 6mm. Fig. 37 shows strain
gauge locations.
Fig. 36: An IRJ suspended in between the sleepers containing longitudinal strain gauges
Fig. 37: Positioning of vertical strain gauges on the face of a rail end of the railhead

31
Measured and simulated vertical strains are shown in Fig. 38; reasonable correlation is evident.
Fig. 38: Vertical strain on the face of the rail end at 14mm sub-surface depth from laboratory testing
and simulation
6. Conclusions
A global model and a sub-model of an IRJ are presented; a wheel-rail contact scenario was
analysed with the value of P0/k0 being set above the shakedown limit. Some of the results of the FE
model were validated using field and laboratory experiments. Based on the observations, the
following conclusions are made:
A sub-modelling strategy provides appropriate estimates of stresses and strains under multi-
axial loading conditions as in the wheel-rail contact scenario.
A wheel load above the shakedown limit leads to progressive damage of railhead material.
The ratchetting rate follows a logical decay pattern.
The von-Mises and longitudinal residual stresses are good indicators for metal flow across
the rail joint.
The depth of plastic zone extends up to 10mm below the top surface of the railhead.
0
0.0002
0.0004
0.0006
0.0008
0.001
0.0012
0.0014
0.0016
0 2 4 6 8 10 12 14 16 18 20
Ver
tica
l str
ain
s
No. of cycles
Test
Simulation PE22
Simulation E22

32
Acknowledgment
The former Cooperative Research Centre for Railway Engineering and Technologies provided
funding via Project #75 – Development of Novel Insulated Rail Joints to the second author through
which the first author received a research scholarship and thanks go to Tim McSweeney, Centre for
Railway Engineering, Central Queensland University, Australia for his proof reading of this paper.
References
[1] N.K. Mandal, M. Dhanasekar, P. Boyd, Shakedown stress analysis of insulated rail joint
(IRJ), Proceedings of the 8th International Conference on Contact Mechanics and Wear of
Rail/Wheel System, Florence, Italy. (2009) 783-793.
[2] M. Abdel-Karim, Effects of elastic modulus variation during plastic deformation on uniaxial
and multiaxial ratchetting simulations, European Journal of Mechanics - A/Solids. 30 (2011)
11-21.
[3] M. Abdel-Karim, A. Khan, Cyclic multiaxial and shear finite deformation response of
OFHC Cu. Part II: An extension to the KHL model and simulations, International Journal of
Plasticity. 26 (2010) 758-773.
[4] M. Abdel-Karim, An evaluation of several kinematic hardening rules on prediction of
multiaxial stress-controlled ratchetting, International Journal of Plasticity. 26 (2010) 711-
730.
[5] M. Abdel-Karim, Modified kinematic hardening rules for simulations of ratchetting,
International Journal of Plasticity. 25 (2009) 1560-1587.
[6] Y. Liu, G. Kang, Q. Gao, A multiaxial stress-based fatigue failure model considering
ratchetting-fatigue interaction, International Journal of Fatigue. 32 (2010) 678-684.

33
[7] Q. Kan, G. Kang, Constitutive model for uniaxial transformation ratchetting of super-elastic
NiTi shape memory alloy at room temperature, International Journal of Plasticity. 26 (2010)
441-465.
[8] Y.C. Chen, J.H. Kuang, Contact stress variations near the insulated rail joints, Journal of
Rail and Rapid Transit. 216 (2002) 265-273.
[9] Y.C. Chen, The effect of proximity of a rail end in elastic-plastic contact between a wheel
and a rail, Journal of Rail and Rapid Transit. 217 (2003) 189-201.
[10] Y.C. Chen, L.W. Chen, Effects of insulated rail joint on the wheel/rail contact stresses under
the condition of partial slip, Wear. 260 (2006) 1267-1273.
[11] Z. Wen, X. Jin, W. Zhang, Contact-impact stress analysis of rail joint region using the
dynamic finite element method, Wear. 258 (2005) 1301-1309.
[12] T. Pang, Studies on Wheel/Rail Contact – Impact Forces at Insulated Rail Joints, Master of
Engineering Thesis, Centre for Railway Engineering, Central Queensland University,
Australia. (2007).
[13] W. Cai, Z. Wen, X. Jin, W. Zhai, Dynamic stress analysis of rail joint with height
difference, Engineering Failure Analysis. 14 (2007) 1488-1499.
[14] E. Kabo, J.C.O. Nielsen, A. Ekberg, Prediction of dynamic train-track interaction and
subsequent material deterioration in the presence of insulated rail joints, Vehicle System
Dynamics Supplement 1. 44 (2006) 718-729.
[15] J. Sandstrom, A. Ekberg, Numerical study of the deterioration of insulated rail joints,
Journal of Rail and Rapid Transit. 223 (2009) 265-273.
[16] R.H. Plaut, H.L. Busch, A. Eckstein, S. Lambrecht, D.A. Dillard, Analysis of tapered,
adhesively bonded, insulated rail joints, Journal of Rail and Rapid Transit. 221 (2007) 195-
204.
[17] M. Dhanasekar, W. Bayissa, Performance of square and inclined insulated rail joints based
on field strain measurements, Journal of Rail and Rapid Transit. 225 (2011) 140-154.
34
[18] A.K. Himebaugh, R.H. Plaut, D.A. Dillard, Finite element analysis of bonded insulated rail
joints, International Journal of Adhesion and Adhesives. 28 (2008) 142-150.
[19] K. Ding, M. Dhanasekar, Flexural behaviour of bonded bolted butt joints due to bolt
looseness, Advances in Engineering Software. 38 (8-9) (2007) 598-606.
[20] E. Nicoli, D.A. Dillard, J.G. Dillard, J. Campbell, D.D. Davis, A. Akhtar, Using standard
adhesion tests to characterize performance of material system options for insulated rail
joints, Journal of Rail and Rapid Transit. 225 (2011) 509-522.
[21] AS 1085, Railway Track Materials, Standards Australia. (2002).
[22] J. Igwemezie, and A. T. NguyenAnatomy of joint bar failure, Part I, Railway Track and
Structures, July, (2009) 31-37.
[23] T. Pang, and M. Dhanasekar, Dynamic finite element analysis of the wheel-rail interaction
adjacent to the insulated rail joints, Proc. of the 7th International Conference on Contact
Mechanics and Wear of wheel-rail systems, Brisbane, Australia, (2006) 509-516.
[24] A. F. Bower, Cyclic hardening properties of hard-drawn copper and rail steel. Journal of
Mechanics and Physics of Solids, 37, (1989) 455-470.
[25] A.F. Bower, K.L. Johnson, Shakedown, residual stress and plastic flow in repeated wheel-
rail contact, J.J. Kalker et al. (Eds.), Rail Quality and Maintenance for Modern Railway
Operation. (1993) 239-49.
[26] J. W. Ringsberg, Cyclic ratchetting and failure of a pearlitic rail steel. Fatigue and Fracture
of Engineering Materials and Structures, 23, (2000) 747-758.
[27] P. J. Armstrong and C. O. Frederick, A mathematical representation of the multiaxial
Bauchinger effect. C.E.G.B. report no. RD/B/N731, Berkeley, Gloucester, UK (1966).
[28] J. L. Chaboche, Constitutive equations for cyclic plasticity and cyclic viscoplasticity,
International Journal of Plasticity, 5(3), (1989) 247-302.
[29] J. Lemaitre and J. L. Chaboche Mechanics of Solid Materials. Cambridge University Press,
Cambridge, UK (1990).

35
[30] J. L. Chaboche, On some modifications of kinematic hardening to improve the description of
ratchetting effects, International Journal of Plasticity, 7(7), (1991) 661-678.
[31] Y. Jiang and H. Sehitoglu Modelling of cyclic ratchetting plasticity, Part I: development of
constitutive relations. ASME Journal of Applied Mechanics, 63, (1996a) 720-725.
[32] Y. Jiang and H. Sehitoglu Modelling of cyclic ratchetting plasticity, Part II: comparison of
model simulations with experiments. ASME Journal of Applied Mechanics, 63, (1996b)
726-733.
[33] J. L. Chaboche, A review of some plasticity and viscoplasticity constitutive theories,
International Journal of Plasticity, 24(10), (2008) 1642-1693.
[34] J. L. Chaboche, A. Gaubert, P. Kanoute, A Longuet, F. Azzouz and M. Maziere, Viscoplastic
constitutive equations of combustion chamber materials including cyclic hardening and
dynamic strain aging, International Journal of Plasticity (2013). (article in press).