Embed Size (px)
Citation preview
This is the author’s version of a work that was submitted/accepted for pub-lication in the following source:
Grundgeiger, Emily, Lim, Yet Hong, Frost, Ray L., Ayoko, Godwin A., & Xi,Yunfei(2015)Application of organo-beidellites for the adsorption of atrazine.Applied Clay Science, 105-106, pp. 252-258.
This file was downloaded from: https://eprints.qut.edu.au/82120/
c© Copyright 2015 Elsevier B.V.
NOTICE: this is the author’s version of a work that was accepted for publication in Ap-plied Clay Science. Changes resulting from the publishing process, such as peer review,editing, corrections, structural formatting, and other quality control mechanisms may notbe reflected in this document. Changes may have been made to this work since it wassubmitted for publication. A definitive version was subsequently published in Applied ClayScience, Volumes 105–106, (March 2015), DOI: 10.1016/j.clay.2015.01.003
Notice: Changes introduced as a result of publishing processes such ascopy-editing and formatting may not be reflected in this document. For adefinitive version of this work, please refer to the published source:
https://doi.org/10.1016/j.clay.2015.01.003
1
Application of organo-beidellites for the adsorption of atrazine
Emily Grundgeiger, Yet Hong Lim, Ray L. Frost, Godwin A. Ayoko, Yunfei Xi*
Nanotechnology and Molecular Science Discipline, Faculty of Science and Engineering,
Queensland University of Technology, 2 George Street, GPO Box 2434, Brisbane, QLD
4000, Australia
Abstract:
The surfaces of natural beidellite were modified with cationic surfactant octadecyl
trimethylammonium bromide at different concentrations. The organo-beidellite adsorbent
materials were then used for the removal of atrazine with the goal of investigating the
mechanism for the adsorption of organic triazine herbicide from contaminated water.
Changes on the surfaces and structure of beidellite were characterized by X-ray diffraction
(XRD), thermogravimetric analysis (TGA), Fourier transform infrared (FTIR), spectroscopy
scanning electron microscopy (SEM) and BET surface analysis. Kinetics of the adsorption
studies were also carried out which show that the adsorption capacity of the organoclays
increases with increasing surfactant concentration up until 1.0 CEC surfactant loading, after
which the adsorption capacity greatly decreases. TG analysis reveals that although the 2.0
CEC sample has the greatest percentage of surfactant by mass, most of it is present on
external sites. The 0.5 CEC sample has the highest proportion of surfactant exchanged into
the internal active sites and the 1.0 CEC sample accounts for the highest adsorption capacity.
The goodness of fit of the pseudo-second-order kinetic confirms that chemical adsorption,
rather than physical adsorption, controls the adsorption rate of atrazine.
Keywords: beidellite; atrazine; adsorption; organoclay.
2
* Corresponding author. Tel: +61 7 3138 1466
E-mail address: [email protected]
1. Introduction
Clean water is one of the most valuable resources on our planet, but it is extremely
vulnerable to contamination. Large volumes of contaminated water are generated from
industrial, agricultural and domestic practices and released into the environment. Some of
these contaminants and their biodegradation products are toxic and potentially carcinogenic.
They must be treated in order to maintain the quality of water sources. Herbicide
contaminants in water have become an important issue, which is brought about by various
industrial and agricultural activities. Atrazine is a type of triazine herbicide that has been
widely used in agriculture around the world for the last 50 years. Though it has been
progressively banned by European countries (Mendaš et al., 2012), atrazine is still in wide
use in some countries including the United States, where the US Environmental Protection
Agency has set the maximum contamination limit (MCL) for atrazine at 0.003 μg/L
(Cheremisinoff and Rosenfeld, 2011). Human atrazine exposure can occur through
occupational activities by workers at farms and in the manufacturing of the chemical and
through ingestion of contaminated local drinking water (Cheremisinoff and Rosenfeld, 2011).
So far, several physical, chemical and biological processes have evolved for the treatment of
contaminated water. Among them, adsorption has been proven to be an economic, effective
and attractive option (Abeysinghe et al., 2013; Brigatti et al., 2013; Corwin and Summers,
2010, 2011; Dubey et al., 2010; Guo et al., 2014; Teixido et al., 2013). Granular activated
carbon (GAC), due to its highly porous structure and large surface area, has proven to be an
efficient adsorbent at removing a wide range of aqueous pollutants. However, GAC has some
3
disadvantages, including high purchase and regeneration cost, and susceptibility to large
molecules (Beall, 2003). In this context, the use of clay minerals has obtained considerable
attention in the last few years. Clay minerals are suitable candidates to immobilise organic
contaminants from wastewater due to their wide availability, inexpensiveness, environmental
stability, and high adsorptive and ion exchange properties. However, these natural materials
are highly hydrophilic and consequently show very limited adsorption capacities for
hydrophobic organic contaminants. In contrast, when the surfaces of these materials are
modified by introducing long chain organic surfactants, higher adsorption of organic
molecules can be achieved (Bagherifam et al., 2014; Lee and Tiwari, 2012; Park et al.,
2013b; Park et al., 2014).
Among the clay minerals, montmorillonite (denoted as Mt) is one the most studied for
the adsorption of contaminants from water. There are numerous published papers on the
adsorption properties of modified Mt (Bergaya et al., 2013; Brigatti et al., 2013; Ghayaza et
al., 2011; Liu et al., 2014; Park et al., 2013a; Wu et al., 2012; Zhu et al., 2011; Zhu et al.,
2012). Though both Mt and beidellite (denoted as Bd) belong to the smectite group, the
potential use of the latter in contaminated water remediation has received less attention. In
common with Mt, Bd consists of 2:1 TOT layers with the ideal formula
Al . Si . Al . OH X . H O (Brigatti et al., 2013). The net negative surface
charge on Bd originates from the isomorphous substitution of Al3+ for Si4+ in the silicate
tetrahedral sheets (Brigatti et al., 2013) while the charge of Mt is from the octahedral
substitution of Al3+ by Mg2+. In addition, some Bd displays ribbon and rosette textures which
are about 2-3 µm in length and <0.2 µm wide (Coban and Ece, 1999). These properties have
made Bd a suitable candidate for organic modification and therefore a versatile material for
organic contaminants remediation.
4
To the best of our knowledge, compared to Mt, there are fewer studies on Bd and
there is a paucity of data on adsorption of atrazine by organically modified Bd. Hence, the
present study is aimed to examine the effectiveness of organically modified Bd in
immobilising atrazine from aqueous solution. Appropriate equilibrium time for adsorption is
standardised by carrying out batch experiments and the experimental data are evaluated
through kinetic adsorption models. This study is significant because it provides insights into
the understanding of the use of organically modified Bd in low cost remediation of herbicide-
contaminated water.
2. Materials and methods
2.1. Chemicals
The SBId-1 Bd, obtained from Clay Minerals Repository USA, has a cation exchange
capacity (CEC) of 129 meq / 100 g (Aggarwal et al., 2006). The surfactant selected for this
study, octadecyl trimethylammonium bromide (denoted as ODTMA, C21H46NBr, FW:
392.52) was obtained from Sigma-Aldrich. Atrazine (1-Chloro-3-ethylamino-5-
isopropylamino-2, 4, 6-triazine, C8H14ClN3, FW: 215.68) was also purchased from Sigma-
Aldrich. The molecular structure of atrazine is illustrated in Fig. 1. All materials were used as
received without purification.
2.2. Organo-Bd synthesis
Syntheses of surfactant-clay hybrids were undertaken by a procedure similar to that
described previously (Xi et al., 2010): the clarifying surfactant solution was obtained by
adding certain amount of surfactants (equivalent to 0.2, 0.5, 1.0 and 2.0 times the CEC of the
clay mineral) into hot Purelab Flex deionized water. Then Bd (10 g) was added into that
solution and the mixture was stirred, on a hotplate at 60 °C overnight, slightly avoiding the
yield of excess spume. The water/clay mineral mass ratio was 20. All organo-beidellites
(denoted as OBd) were washed with Purelab Flex deionized water and dried in an oven at
5
60 °C. The dried samples were ground in an agate mortar and stored in plastic sample
containers in a vacuum desiccator. The prepared ODTMA modified Bd, with surfactant
loadings corresponding to CEC values from 0.2 to 2.0, were denoted as 0.2CEC-OBd,
0.5CEC-OBd, 1.0CEC-OBd and 2.0CEC-OBd.
2.3. Adsorption of atrazine on OBd
Adsorption experiments were conducted by batch technique at room temperature (25
°C). In a typical experiment, certain amount of adsorbent material (0.1 – 0.8 g) was placed in
a 50 mL centrifuge tube with 40 mL of 10 mg/L atrazine solution, capped and placed on a
rotating shaker for about 18 hrs. The adsorbent was separated by centrifugation at 4000 rpm
for 15 minutes on a Pheonix Orbital 400 Clements Centrifuge, then about 1 mL of the
supernatant was carefully transferred from the tube into a HPLC vial using a glass Pasteur
pipette.
Adsorption kinetics was studied for all five samples, at room temperature using the
optimal ratio of adsorbent-solution determined in the initial adsorption tests. The general
method for this experiment was: 3 g of adsorbent was carefully added into a 250 mL beaker
containing 150 mL of atrazine solution (10 mg/L). The beaker was stirred on a magnetic
stirrer for 5 hours. At certain time intervals (10 – 300 mins), small volume samples (about 1.3
mL) were removed from the beaker to a small glass centrifuge tube. The samples were
centrifuged for about 6 minutes in a bench top centrifuge. After separation, a small amount of
the supernatant liquid (about 0.7 mL) was transferred to a HPLC vial using a glass Pasteur
pipette. The experiment was carried out simultaneously for all five adsorbents.
The concentration of the target atrazine was quantitatively analysed using an Agilent
HP1100 HPLC equipped with a Luna 5l C18 column and a UV absorbance detector. A
mobile phase of methanol–water (70:30) at a flow rate of 1 mL/min and 40 µL of injection
volume was used for this experiment and the analysis wavelength was 254 nm. The amount
6
of atrazine adsorbed by Bd/OBd was calculated from the difference between the initial and
final/equilibrium solution concentrations; solid-phase loading of atrazine, qe (mg/g) was
computed from the mass balance: qe = V(Ci – Ce)/M; where, Ci and Ce are total dissolved and
equilibrium liquid phase concentration (mg/L), respectively, and M is the dose of sorbent
(g/L), V is the volume of the solution (mL). All working solutions were prepared from
atrazine stock solution (1500 mg/L) diluted with Purelab Flex deionized water. All the
adsorption data for the batch experiments were obtained in duplicates.
2.4. Sample characterisation
Bd and ODTMA modified hybrid materials were pressed in stainless steel sample
holders. X-ray diffraction (XRD) patterns were recorded using CuKα radiation (n = 1.5418
Å) on a Panalytical X’Pert (PW3040) diffractometer operating at 40 kV and 40 mA between
2 and 50 ° (2θ) at a step size of 0.02 °.
Thermogravimetric analyses of the Bd, OBd and pure ODTMA surfactant samples
were performed using a TA Instruments Inc. Q500 high-resolution TGA operating at a ramp
of 2.5 ˚C/min with 6.0 ˚C resolution from room temperature to 1000 ˚C in a high purity
flowing nitrogen atmosphere (40 mL/min). Each analysis was obtained with approximately
25-40 mg of finely ground sample heated in an open platinum crucible.
Infrared (IR) spectra were obtained using a Nicolet Nexus 870 FTIR spectrometer
equipped with a diamond ATR accessory. Spectra over the 4000–650 cm−1 range were
obtained by the co-addition of 64 scans with a resolution of 4 cm−1 and a mirror velocity of
0.6329 cm/s.
A FEI Quanta 200 scanning electron microscope (SEM) with integrated energy
dispersive X-ray analyser (EDX) system was used for morphological studies. All samples
were dried at room temperature and coated with gold for the SEM studies.
7
Adsorption and desorption experiments using N2 were carried out at 77 K on a TriStar
II 3020 surface analyser. Prior to each measurement, the samples were degassed at 333 K
under vacuum on a Micrometrics Vacprep 061 degasser overnight. The N2 isotherms were
used to calculate the specific surface area (SA) with the multipoint BET method.
3. Results and discussion
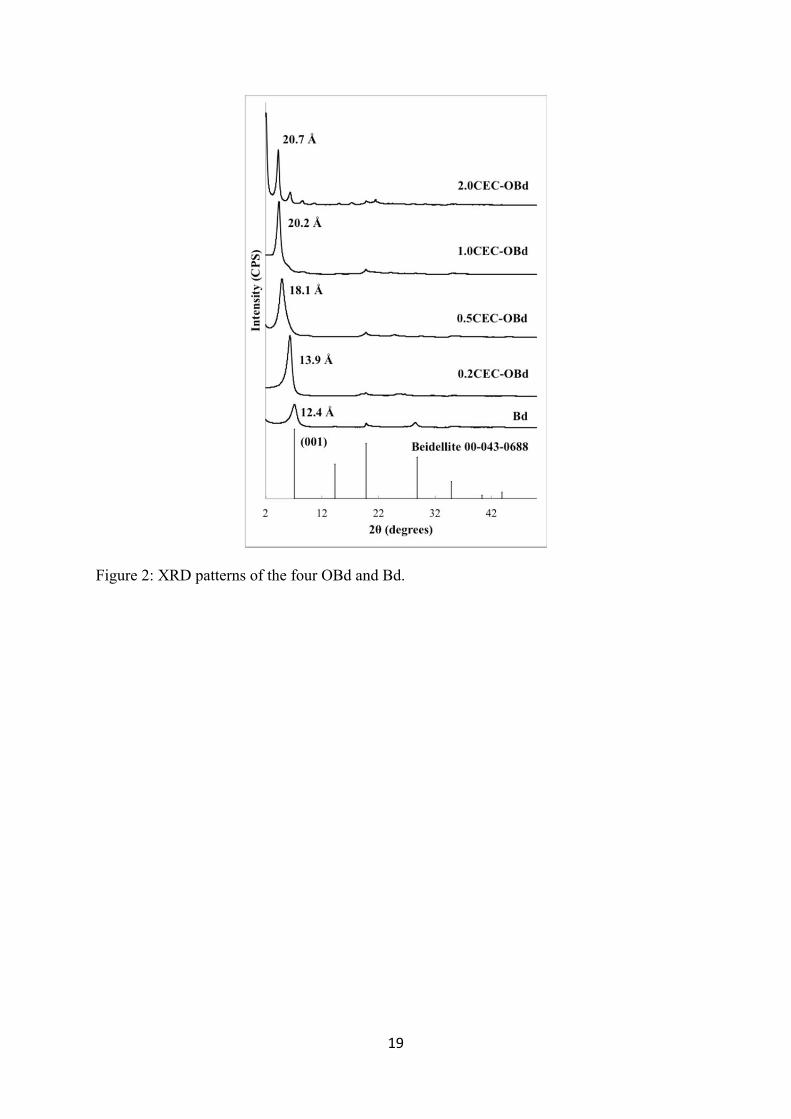
3.1. X-ray diffraction (XRD)
XRD patterns of Bd and four OBd prepared with different surfactant loadings are
presented in Fig. 2. In the case of Bd, the reflection observed at 12.4 Å is attributed to the
(001) plane. This XRD pattern has a very good match with ICDD 00-043-0688 which has the
same d-value. The XRD pattern for 0.2CEC-OBd reveals that the d-value increases to 13.9 Å
suggesting a lateral monolayer configuration of the intercalated quaternary ammonium
cations. With a greater surfactant loading of 0.5 CEC, the d-value increases again to 18.1 Å,
which is typical of a lateral bilayer configuration of intercalated surfactant. Similarly,
1.0CEC-OBd displays a further increase in d-value to 20.2 Å. However, there is only a small
increase in d-value, to 20.7 Å, for the 2.0 CEC ODTMA modified Bd. The d-values of
1.0CEC-OBd and 2.0CEC-OBd are indicative of a pseudo-trimolecular type arrangement of
surfactant molecules (He et al., 2006; Xi et al., 2004). In general, as the added surfactant
concentration increases, the d-value increases, up to 1.0CEC-OBd. Further increase of
surfactant concentration in the OBd, above 1.0 CEC of the clay mineral, does not lead to a
proportional increase in d-value.
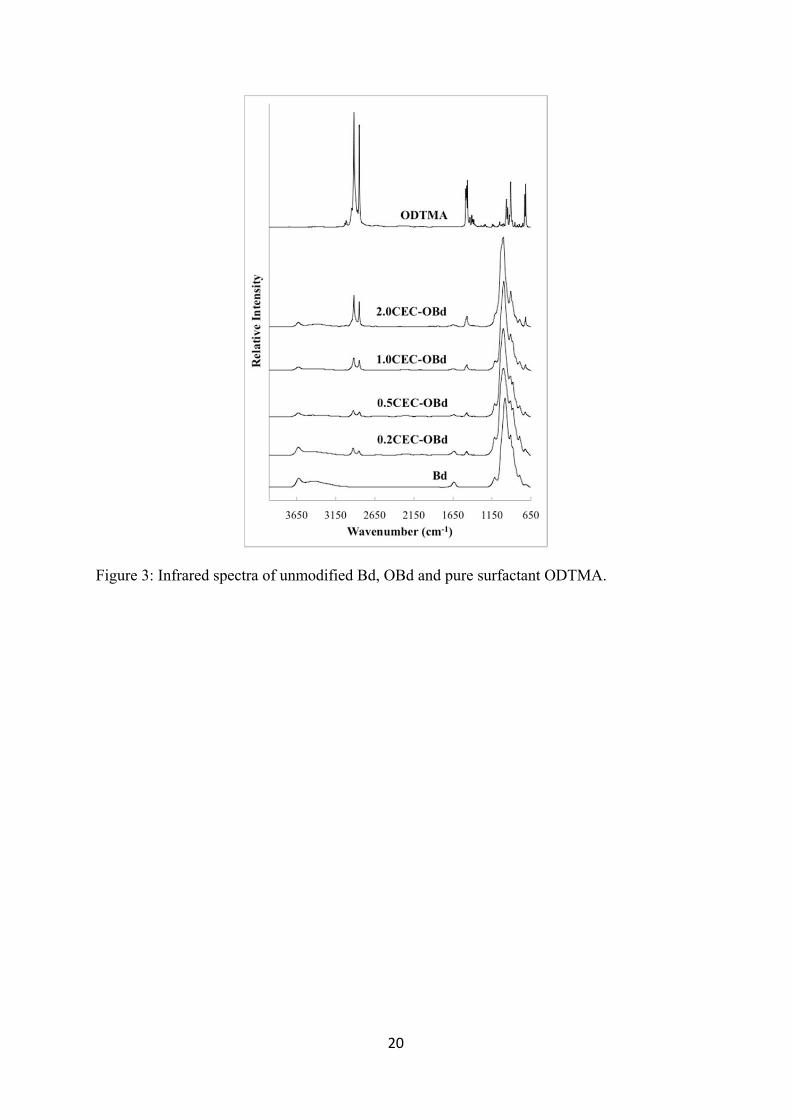
3.2. Infrared spectroscopy (IR)
Infrared spectra for OBd, Bd and the surfactant ODTMA are presented in Fig 3. The
spectra can be divided into five regions: the OH stretching region (~3750-3200 cm-1); CH
8
stretching region (~3050-2800 cm-1); HOH bending region (~1750-1600 cm-1); HCH bending
vibration region (~1550-1440 cm-1) (Park et al., 2011) and intense absorptions in the low
wavenumber region below 1250 cm-1 from vibrations in the clay mineral structure
overlapping with some absorptions from the surfactant. The band at about 3621 cm-1 of the
unmodified clay mineral is assigned as stretching vibrations of structural OH groups in the
clay mineral and the position of the band does not vary significantly in the spectra of the
OBd. The broad band at 3550-3200 cm-1 in the spectra of the unmodified clay mineral
decreases in intensity as surfactant concentration increases in the OBd spectra and is due to
OH stretching vibrations of adsorbed water; the decrease of intensities are due to the more
hydrophobic property of OBd with the increase of surfactant amount. Similarly, the small
sharp band at 1635 cm-1 in the unmodified clay mineral, due to HOH bending vibrations from
adsorbed water also decreases in intensity with increase in surfactant concentration.
Previous studies have proposed that the frequency of CH2-stretching mode of amine
chains is extremely sensitive to the conformational ordering of the chains (Xi et al., 2005; Xi
et al., 2007). The bands at ∼2930 and ∼2850 cm−1 are attributed to CH2 antisymmetric
stretching vibration, νas (CH2) and symmetric stretching vibration, νs (CH2), respectively.
They are sensitive to the changes in the gauche/trans conformer ratio and the chain–chain
interactions. The most obvious difference in the spectra of the four OBd is the increase in
relative intensity of these two bands. In the spectra of the pure surfactant these bands occur at
2916 cm-1 and 2848 cm-1. In the 0.2 CEC OBd these two bands are observed at 2926 cm-1 and
2854 cm-1, as surfactant concentration increases the relative intensity increases markedly and
the wavenumber changes slightly until the 2.0 CEC OBd, where the bands are at 2916 cm-1
and 2848 cm-1, the same position as in the pure ODTMA.
The weak sharp band at 1476 cm-1 in the spectra of the 0.2 CEC OBd is due to the
CHC bending vibrations of the intercalated ODTMA. These absorptions increase in relative
9
intensity with an increase in concentration of surfactant. The presence of this band in the pure
surfactant sample and absence in the unmodified clay mineral is further confirmation the
band is due to the surfactant. Intense absorption bands in the low wavenumber region below
1250 cm-1 can be attributed to the Si-O stretching vibrations in the clay mineral (Xi et al.,
2005).
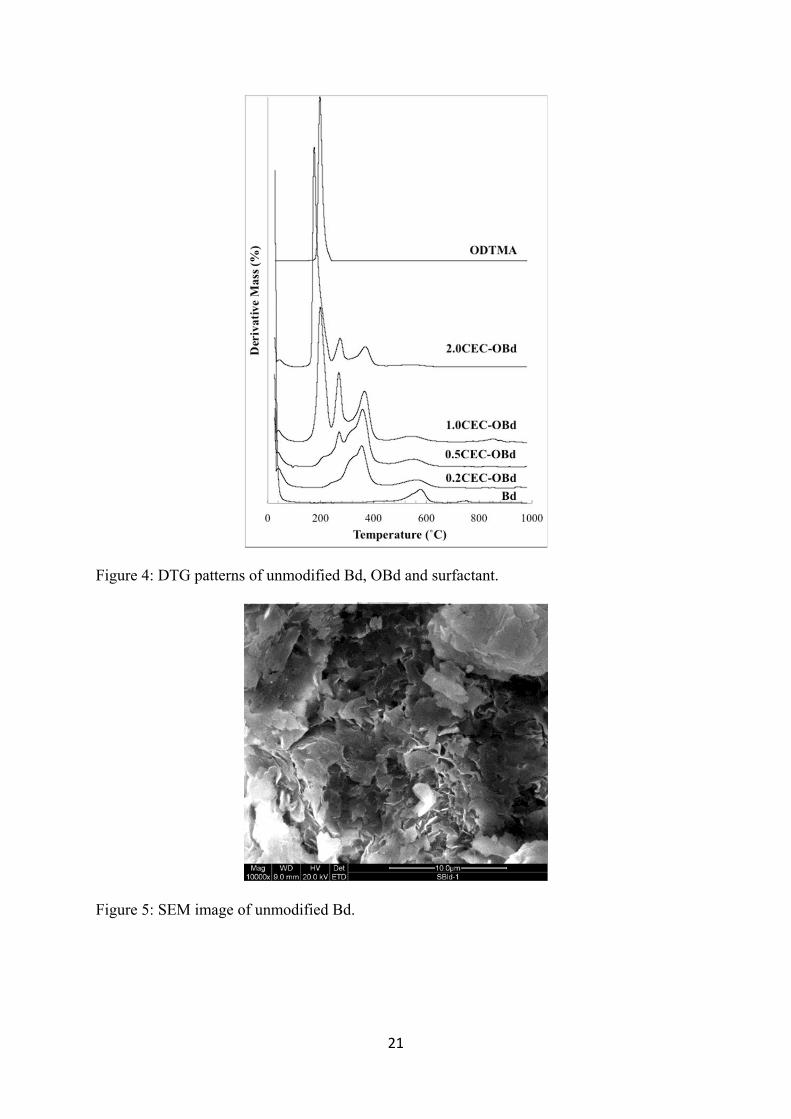
3.3. Thermogravimetric analysis (TGA)
Derivative thermogravimetric (DTG) curves for Bd, the four OBd and the pure
ODTMA surfactant are presented in Figure 4. There are three main mass loss steps observed
for the OBd. The first mass loss occurring from room temperature to about 110 ˚C is related
to the loss of adsorbed water. The second mass loss, in the temperature range 150 ˚C to 450
˚C, corresponds to the loss of ODTMA surfactant. The third mass loss at around 540 ˚C to
580 ˚C is due to dehydroxylation of the structural OH units in the clay mineral. The position
of surfactant decomposition temperature in the curves for the OBd is confirmed by
comparison with the DTG curve for the pure surfactant which shows a single intense peak at
197 ˚C. The decomposition temperature and related % mass loss data from the
thermogravimetric analysis are summarized in Table 1.
In Fig. 4, there is more than one peak for the surfactant decomposition process
because the surfactant is present in different environments within the OBd sample. The 1.0
and 2.0 CEC OBd show three distinct peaks for the surfactant decomposition process but
these peaks are not fully resolved on the DTG curves for the 0.2 CEC and 0.5 CEC OC. The
surfactant present on the surface of the clay mineral is least thermally stable and is the first to
be decomposed. The surfactant in this external environment corresponds to the mass loss at
the lower temperature in the surfactant decomposition region. The next mass loss of
surfactant is due to ODTMA present internally, but only weakly held there by intermolecular
10
attractions between the long alkyl chains of the surfactant. The third mass loss in the
surfactant decomposition process is from the exchanged ODTMA actually adsorbed on the
internal active sites of the clay mineral which has the highest decomposition temperature. The
dehydroxylation temperature was shown to decrease with increase in surfactant
concentration, from 578 ˚C in Bd to 543 ˚C in the 2.0 CEC OBd.
The percentage mass of surfactant in different environments in each OBd sample
based on mass of total surfactant loading is presented in Table 2. The surfactant, actually
bound to exchangeable sites, is the most thermally stable. The 0.5CEC-OBd sample shows
the highest proportion of exchanged cations (71.95 %). The proportion of internal exchanged
surfactant in the 1.0CEC-OBd sample (31.69 %) is about half that of 0.5CEC-OBd and the
2.0CEC-OBd sample (15.79 %) is slightly less than half that of 1.0CEC-OBd. At low
surfactant concentration, a higher percentage of surfactant molecules is intercalated into the
interlayer spaces of Bd.
An estimate of the real adsorption concentration (in units of CEC of the clay mineral)
of ODTMA onto Bd was made for each OBd using TG data on the mass loss % of surfactant
and the equation reported previously (Xi et al., 2007) which gives theoretical maximum and
minimum values of the real adsorption amount of surfactant onto the clay mineral. The
results from these calculations are presented in Table 3.
The estimated real surfactant loading calculated by this method is slightly greater than
the amount of surfactant added during preparation of the OBd. This may be explained by
comparing the mass loss % of water in Bd with the percent of water lost for the OBd. The
untreated clay mineral displays a mass loss of 9.4 % due to dehydration, significantly more
than in the OBd, which typically lost only 1.5 % to 4 % due to dehydration. The equation
used for calculation of the real adsorption amount does not take into account the mass loss of
water or inorganic exchange cations. Consequently the mass of clay mineral weighed out to
11
prepare the OBd was about 9.4 % water, by mass, so the actual amount of adsorbent used was
less than expected, making the ratio of adsorbent: surfactant used in the synthesis of the OBd
greater than intended. A more complex calculation would need to be done to determine the
actual loading of the surfactant on this Bd. However, a comparison of estimated real loadings
calculated by this method (Table 3) can still be made between the four OBd. An increase in
the surfactant amount added leads to a comparable increase in the estimated real loading. For
example, the estimated real loading for 0.5CEC-OBd was between 0.505 and 0.634 CEC and
by doubling the added amount of surfactant to 1.0 CEC the real surfactant loading doubled
also to the 1.015 to 1.275 range. For 2.0CEC-OBd, the real surfactant loading was between
2.202 to 2.766. As discussed above, an increase of surfactant concentration in the OBd from
1.0 CEC to 2.0 CEC of the clay mineral, did not lead to a proportional increase in d-value.
Surfactant molecules over 1.0 CEC will not intercalate into Bd interlayers. These molecules
are most likely attached to the external surface.
3.4. Scanning electron microscopy (SEM)
Generally, there are no significant morphological differences between Bd and OBd,
unmodified Bd (Fig. 5) shows morphology with massive and aggregated small flakes which
are different compared to that described in the literature (Coban and Ece, 1999).
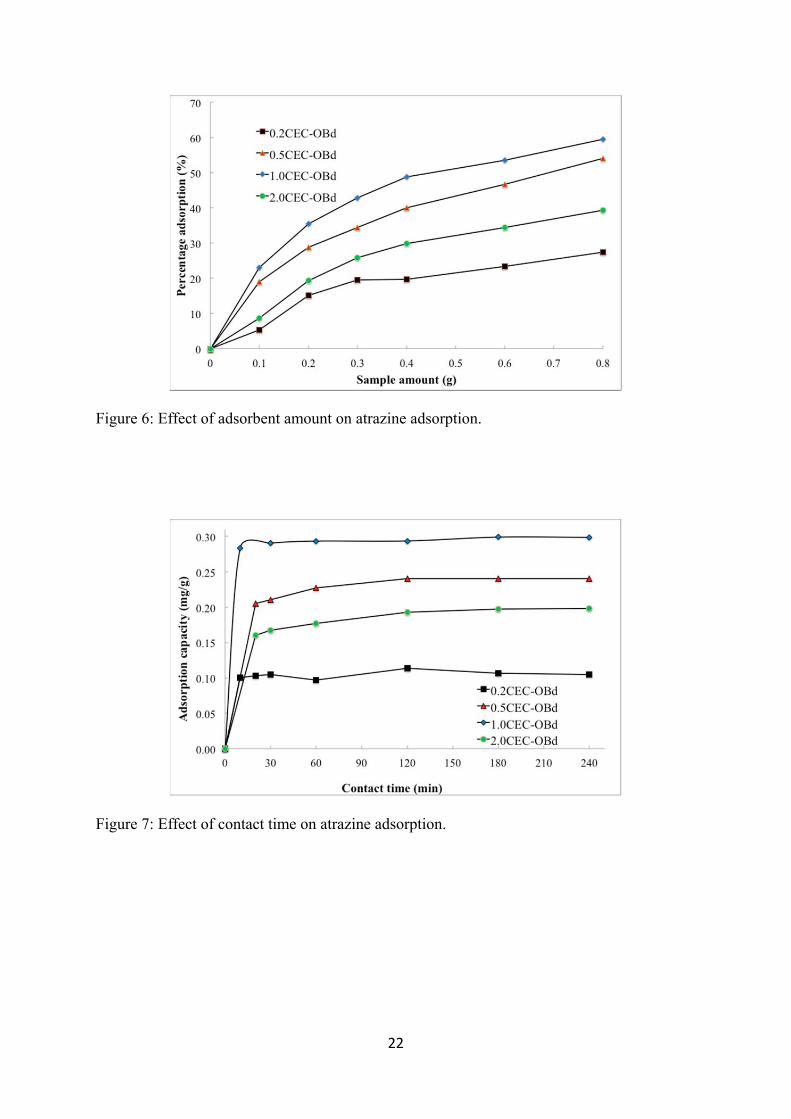
3.4. Atrazine adsorption on OBd
In order to optimise the amount of adsorbent materials required for most efficient and
economic removal of atrazine from aqueous solution, a series of experiments have been
undertaken with varying solid concentrations in the reaction mixtures containing 40 mL of 10
mg/L atrazine solution (Fig. 6). The atrazine concentration has been tested after 24 hours of
shaking at 25°C to achieve maximum adsorption. Amount of atrazine adsorbed on the
centrifuge tubes is found to be negligible. Adsorption content (%) increases with increased
12
amount of adsorbent added in all cases. Bd and 0.2CEC-OBd are able to adsorb the smallest
amounts of atrazine (about 27-29 % / 0.8 g, curve not shown). Adsorption rates of atrazine on
0.8 g of 1.0CEC-OBd and 0.5CEC-OBd can reach up to 60 % and 54 %, respectively, which
correspond to 0.3 mg/g and 0.27 mg/g of atrazine when expressed as the atrazine adsorption
amount by those two materials.
Interestingly, with the increase of surfactant amount, the adsorption % of atrazine is
only about 39 % for 2.0CEC-OBd. As the adsorption % increases with increase in the amount
of sample, the final amount of material for all the samples was decided to be 0.8 g / 40 ml (20
g / 1000 ml), as the economic impact on the dosage should also be considered.
As shown in Fig. 7, the four prepared OBd were all used for the equilibrium time
study of the adsorption of atrazine (10 mg/L) from water at predetermined optimum ratio of
adsorbent (g) to atrazine solution (L) at 20:1. 1.0CEC-OBd is the most effective adsorbent,
which can remove up to 0.3 mg of atrazine per g of adsorbent. This removal capacity is
higher than that obtained by using hexadecyl trimethylammonium bromide (HDTMA)
modified Mt (Brigatti et al., 2013). Equilibrium adsorption was reached at about 30 minutes.
The time taken by 0.5CEC-OBd and 2.0CEC-OBd samples to reach equilibrium was slower,
taking about 2 hours.
The adsorption capacity of the OBd increases with increase in the concentration of the
surfactant from 0.2 to 1.0 CEC of the clay mineral. However, 2.0CEC-OBd removed less
atrazine than 0.5CEC-OBd and 1.0CEC-OBd, which is very different to the adsorption
behaviours of OMt which showed that montmorillonite modified with surfactant at higher
concentration usually had higher adsorption capacity towards atrazine (Park et al., 2014).
This result may be attributed to the pore-blocking effect; i.e. when the amounts of ODTMA
increase, the pore space is more densely packed, which may inhibit the migration of atrazine
through the pores. The origin of the net positive charge (from tetrahedral layer in Bd) may
13
also account for this observation and this would require further investigation. Table 4
summarises the results of specific surface area (SBET) and pore volume (Vp). The specific
surface areas (SBET) are in an order of: Bd (70.2 m2/g) > 0.2CEC-OBd (8.5 m2/g) > 0.5CEC-
OBd (4.7 m2/g) > 1.0CEC-OBd (4.3 m2/g) > 2.0CEC-OBd (1.7 m2/g). SBET drops
significantly from Bd to organo-beidellites, which might be due to the surfactant molecules
blocked the pores/tunnels and thus decreased the penetration of N2. It can also be observed
that untreated beidellite has the largest pore volume at 0.084 cm3 g-1, while 2.0CEC-OBd has
the smallest pore volume at 0.011 cm3 g-1.
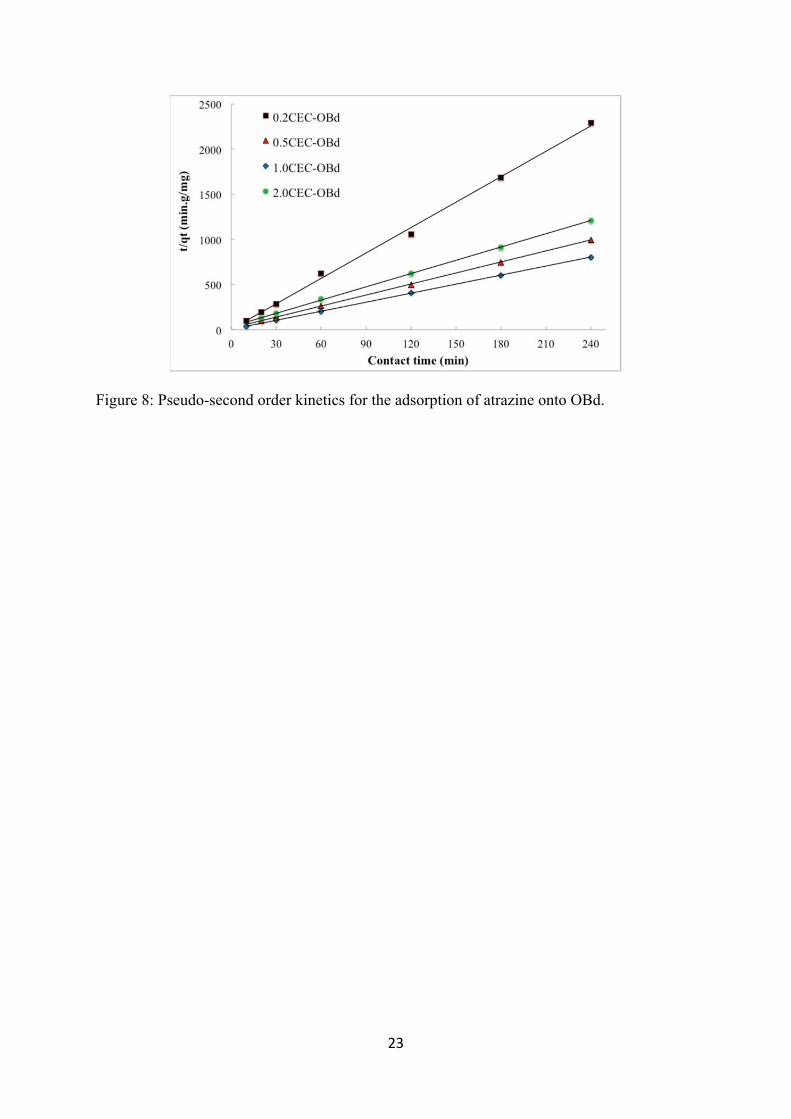
The pseudo-second order model (Bagherifam et al., 2014; Ho and McKay, 1998) was
used to analyse the adsorption kinetics of this experiment.
Where, qe and qt are the amount of atrazine adsorbed at equilibrium and at time t (mg/g), k is
the kinetic constant (g mg-1min-1). From the linear plot of t/qt versus t (Fig. 7), qt and k were
calculated. The kinetic constants, amount of atrazine adsorbed at equilibrium and the
regression coefficients (R2) are listed in Table 5. The pseudo-second order model showed
perfect fit (with R2 = 1) for 1.0CEC-OBd and 2.0CEC-OBd, and very good fit for 0.2CEC-
OBd and 0.5CEC-OBd (with R2 > 0.998). The rate constant, k, is 3.620 min-1 for the 1.0CEC-
OBd, 0.675 min-1 for 0.2CEC-OBd and 0.630 min-1 for the 2.0CEC-OBd consistent with what
was observed (Fig 8) with regard to the relative reaction rates of the adsorbents. The
goodness of fit of the pseudo-second-order kinetic confirms that chemical adsorption, rather
than physical adsorption, controls the adsorption rate of atrazine.
4. Conclusions
In this study, the adsorption of a triazine herbicide - atrazine onto natural and
modified Bd has been investigated in detail. X-ray diffraction (XRD), TG, FTIR,SEM and
14
BET have been used to characterize and compare the differences between unmodified and
modified Bd. The d-value is increased with increase in surfactant concentration, however
adsorption test indicates that at higher concentration of ODTMA the cation exchange is less
efficient. The 1.0CEC-OBd sample has the highest adsorption capacity for atrazine and TGA
results shows that it does in fact have more surfactant exchanged with interlayer adsorption
sites compared to 2.0CEC-OBd where the majority of the surfactant is weakly adsorbed onto
the surface thus blocking the access of atrazine to the interlayers. The mass of the surfactant
in the different environments of the clay mineral’s surface appears to be responsible for the
adsorption capacities of the OBd prepared. The order of increasing adsorption capacities of
the samples is: 0.2CEC-OBd < 2.0CEC-OBd < 0.5CEC-OBd < 1.0CEC-OBd. The adsorption
can be well represented by the pseudo-second-order kinetic model. In conclusion, this study
has shown that ODTMA modified Bd can be used efficient materials for the removal of this
organic herbicide from water.
Acknowledgements
The corresponding author thanks the Queensland University of Technology’s Vice
Chancellor’s research grant.
References
Abeysinghe, S., Corum, K.W., Neff, D.L., Mason, S.E., Forbes, T.Z., 2013. Contaminant Adsorption on Nanoscale Particles: Structural and Theoretical Characterization of Cu2+ Bonding on the Surface of Keggin-Type Polyaluminum (Al30) Molecular Species. Langmuir 29, 14124-14134. Aggarwal, V., Li, H., Teppen, B.J., 2006. Triazine adsorption by saponite and beidellite clay minerals. Environ. Toxicol. Chem. 25, 392-399. Bagherifam, S., Komarneni, S., Lakzian, A., Fotovat, A., Khorasani, R., Huang, W., Ma, J., Hong, S., Cannon, F.S., Wang, Y., 2014. Highly selective removal of nitrate and perchlorate by organoclay. Appl. Clay Sci. 95, 126-132. Beall, G.W., 2003. The use of organo-clays in water treatment. Appl. Clay Sci. 24, 11-20. Bergaya, F., Lagaly, G., Editors, 2013. Handbook of Clay Science, Second Edition: Volume 5B: Developments in Clay Science. Elsevier Ltd.
15
Brigatti, M.F., Galan, E., Theng, B.K.G., 2013. Structure and mineralogy of clay minerals. Dev. Clay Sci. 5, 21-81. Cheremisinoff, N.P., Rosenfeld, P., 2011. 4 - Atrazine, Handbook of Pollution Prevention and Cleaner Production: Best Practices in the Agrochemical Industry. William Andrew Publishing, Oxford, pp. 215-231. Coban, F., Ece, O.I., 1999. Fe3+-rich montmorillonite-beidellite series in Ayvacik bentonite deposit, Biga Peninsula, northwest Turkey. Clays Clay Miner. 47, 165-173. Corwin, C.J., Summers, R.S., 2010. Scaling Trace Organic Contaminant Adsorption Capacity by Granular Activated Carbon. Environ. Sci. Technol. 44, 5403-5408. Corwin, C.J., Summers, R.S., 2011. Adsorption and desorption of trace organic contaminants from granular activated carbon adsorbers after intermittent loading and throughout backwash cycles. Water Res. 45, 417-426. Dubey, S.P., Dwivedi, A.D., Sillanpaeae, M., Gopal, K., 2010. Artemisia vulgaris-derived mesoporous honeycomb-shaped activated carbon for ibuprofen adsorption. Chem. Eng. J. (Amsterdam, Neth.) 165, 537-544. Ghayaza, M., Le Forestier, L., Muller, F., Tournassat, C., Beny, J.-M., 2011. Pb(II) and Zn(II) adsorption onto Na- and Ca-montmorillonites in acetic acid/acetate medium: Experimental approach and geochemical modeling. J. Colloid Interf. Sci. 361, 238-246. Guo, H., Ma, W.-F., Ye, J.-D., Kou, C.-J., 2014. Study on wastewater contaminant removal efficiency by carbon fiber ecological grass. Adv. Mater. Res. (Durnten-Zurich, Switz.) 838-841, 2300-2305. He, H., Frost, R.L., Bostrom, T., Yuan, P., Duong, L., Yang, D., Xi, Y., Kloprogge, J.T., 2006. Changes in the morphology of organoclays with HDTMA+ surfactant loading. Appl. Clay Sci. 31, 262-271. Ho, Y.S., McKay, G., 1998. A Comparison of Chemisorption Kinetic Models Applied to Pollutant Removal on Various Sorbents. Process Saf. Environ. Prot. 76, 332-340. Lee, S.M., Tiwari, D., 2012. Organo and inorgano-organo-modified clays in the remediation of aqueous solutions: An overview. Appl. Clay Sci. 59-60, 84-102. Liu, B., Lu, J., Xie, Y., Yang, B., Wang, X., Sun, R., 2014. Microwave-assisted modification on montmorillonite with ester-containing Gemini surfactant and its adsorption behavior for triclosan. J. Colloid Interf. Sci. 418, 311-316. Mendaš, G., Vuletić, M., Galić, N., Drevenkar, V., 2012. Urinary metabolites as biomarkers of human exposure to atrazine: Atrazine mercapturate in agricultural workers. Toxicol. Lett. 210, 174-181. Park, Y., Ayoko, G.A., Frost, R.L., 2011. Characterisation of organoclays and adsorption of p-nitrophenol: environmental application. J. Colloid Interf. Sci. 360, 440-456. Park, Y., Ayoko, G.A., Horvath, E., Kurdi, R., Kristof, J., Frost, R.L., 2013a. Structural characterisation and environmental application of organoclays for the removal of phenolic compounds. J. Colloid Interf. Sci. 393, 319-334. Park, Y., Ayoko, G.A., Kurdi, R., Horvath, E., Kristof, J., Frost, R.L., 2013b. Adsorption of phenolic compounds by organoclays: Implications for the removal of organic pollutants from aqueous media. J. Colloid Interf. Sci. 406, 196-208. Park, Y., Sun, Z., Ayoko, G.A., Frost, R.L., 2014. Removal of herbicides from aqueous solutions by modified forms of montmorillonite. J. Colloid Interf. Sci. 415, 127-132. Teixido, M., Hurtado, C., Pignatello, J.J., Beltran, J.L., Granados, M., Peccia, J., 2013. Predicting Contaminant Adsorption in Black Carbon (Biochar)-Amended Soil for the Veterinary Antimicrobial Sulfamethazine. Environ. Sci. Technol. 47, 6197-6205. Wu, P., Dai, Y., Long, H., Zhu, N., Li, P., Wu, J., Dang, Z., 2012. Characterization of organo-montmorillonites and comparison for Sr(II) removal: Equilibrium and kinetic studies. Chem. Eng. J. 191, 288-296.
16
Xi, Y., Ding, Z., He, H., Frost, R.L., 2004. Structure of organoclays—an X-ray diffraction and thermogravimetric analysis study. J. Colloid Interf. Sci. 277, 116-120. Xi, Y., Ding, Z., He, H., Frost, R.L., 2005. Infrared spectroscopy of organoclays synthesized with the surfactant octadecyltrimethylammonium bromide. Spectrochim. Acta A 61, 515-525. Xi, Y., Frost, R.L., He, H., 2007. Modification of the surfaces of Wyoming montmorillonite by the cationic surfactants alkyl trimethyl, dialkyl dimethyl, and trialkyl methyl ammonium bromides. J. Colloid Interf. Sci. 305, 150-158. Xi, Y., Mallavarapu, M., Naidu, R., 2010. Adsorption of the herbicide 2,4-D on organo-palygorskite. Appl. Clay Sci. 49, 255-261. Zhu, J., Qing, Y., Wang, T., Zhu, R., Wei, J., Tao, Q., Yuan, P., He, H., 2011. Preparation and characterization of zwitterionic surfactant-modified montmorillonites. J. Colloid Interf. Sci. 360, 386-392. Zhu, R., Hu, W., You, Z., Ge, F., Tian, K., 2012. Molecular dynamics simulation of TCDD adsorption on organo-montmorillonite. J. Colloid Interf. Sci. 377, 328-333. Figure captions
Figure 1: Chemical structure of atrazine. Molar mass 215.68 g / mol. Solubility in water: 33
mg/L at 25 °C.
Figure 2: XRD patterns of the four OBd and Bd.
Figure 3: Infrared spectra of unmodified Bd, OBd and pure surfactant ODTMA.
Figure 4: DTG patterns of unmodified Bd, OBd and surfactant.
Figure 5: SEM image of unmodified Bd.
Figure 6: Effect of adsorbent amount on atrazine adsorption.
Figure 7: Effect of contact time on atrazine adsorption.
Figure 8: Pseudo-second order kinetics for the adsorption of atrazine onto OBd.
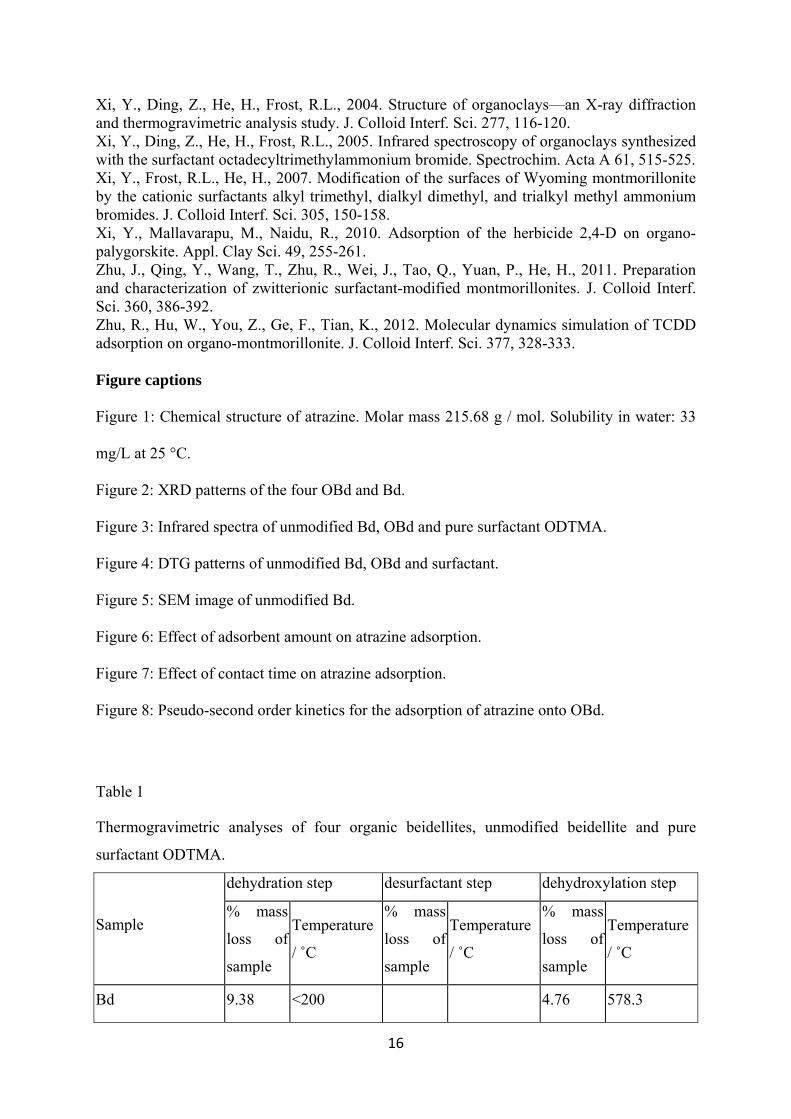
Table 1
Thermogravimetric analyses of four organic beidellites, unmodified beidellite and pure
surfactant ODTMA.
Sample
dehydration step desurfactant step dehydroxylation step
% mass
loss of
sample
Temperature
/ ˚C
% mass
loss of
sample
Temperature
/ ˚C
% mass
loss of
sample
Temperature
/ ˚C
Bd 9.38 <200 4.76 578.3
17
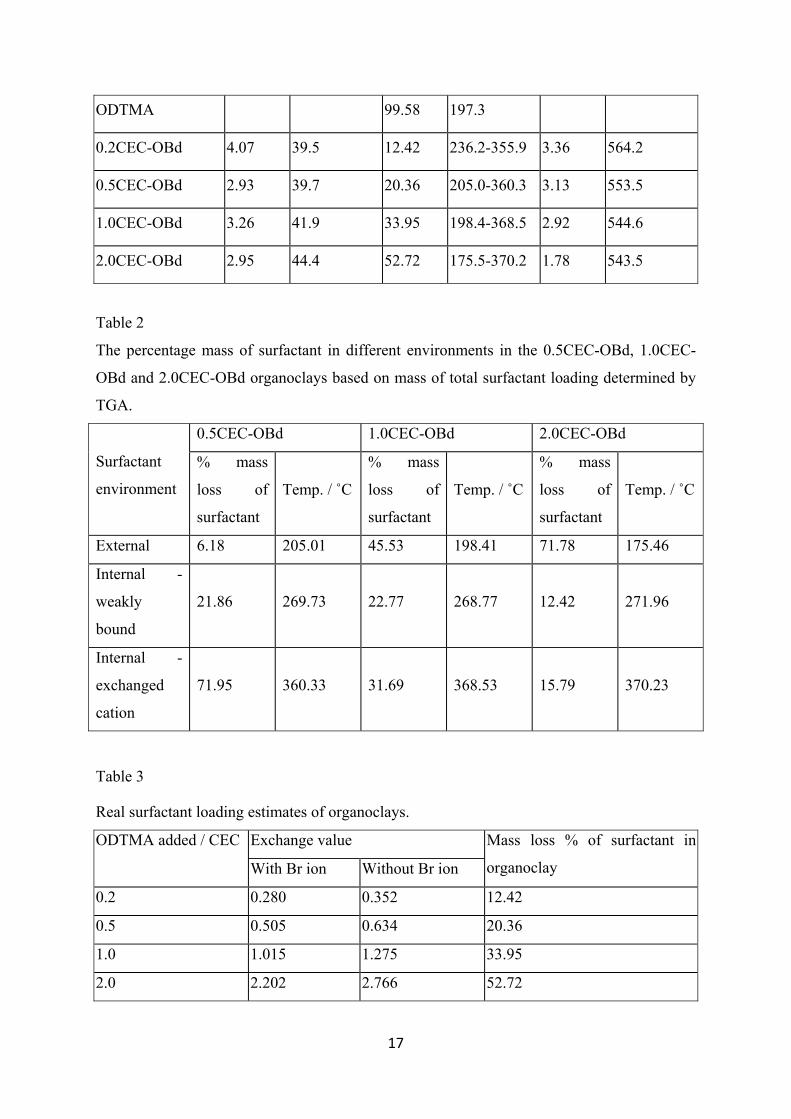
ODTMA 99.58 197.3
0.2CEC-OBd 4.07 39.5 12.42 236.2-355.9 3.36 564.2
0.5CEC-OBd 2.93 39.7 20.36 205.0-360.3 3.13 553.5
1.0CEC-OBd 3.26 41.9 33.95 198.4-368.5 2.92 544.6
2.0CEC-OBd 2.95 44.4 52.72 175.5-370.2 1.78 543.5
Table 2
The percentage mass of surfactant in different environments in the 0.5CEC-OBd, 1.0CEC-
OBd and 2.0CEC-OBd organoclays based on mass of total surfactant loading determined by
TGA.
Surfactant
environment
0.5CEC-OBd 1.0CEC-OBd 2.0CEC-OBd
% mass
loss of
surfactant
Temp. / ˚C
% mass
loss of
surfactant
Temp. / ˚C
% mass
loss of
surfactant
Temp. / ˚C
External 6.18 205.01 45.53 198.41 71.78 175.46
Internal -
weakly
bound
21.86 269.73 22.77 268.77 12.42 271.96
Internal -
exchanged
cation
71.95 360.33 31.69 368.53 15.79 370.23
Table 3
Real surfactant loading estimates of organoclays.
ODTMA added / CEC Exchange value Mass loss % of surfactant in
organoclay With Br ion Without Br ion
0.2 0.280 0.352 12.42
0.5 0.505 0.634 20.36
1.0 1.015 1.275 33.95
2.0 2.202 2.766 52.72
18
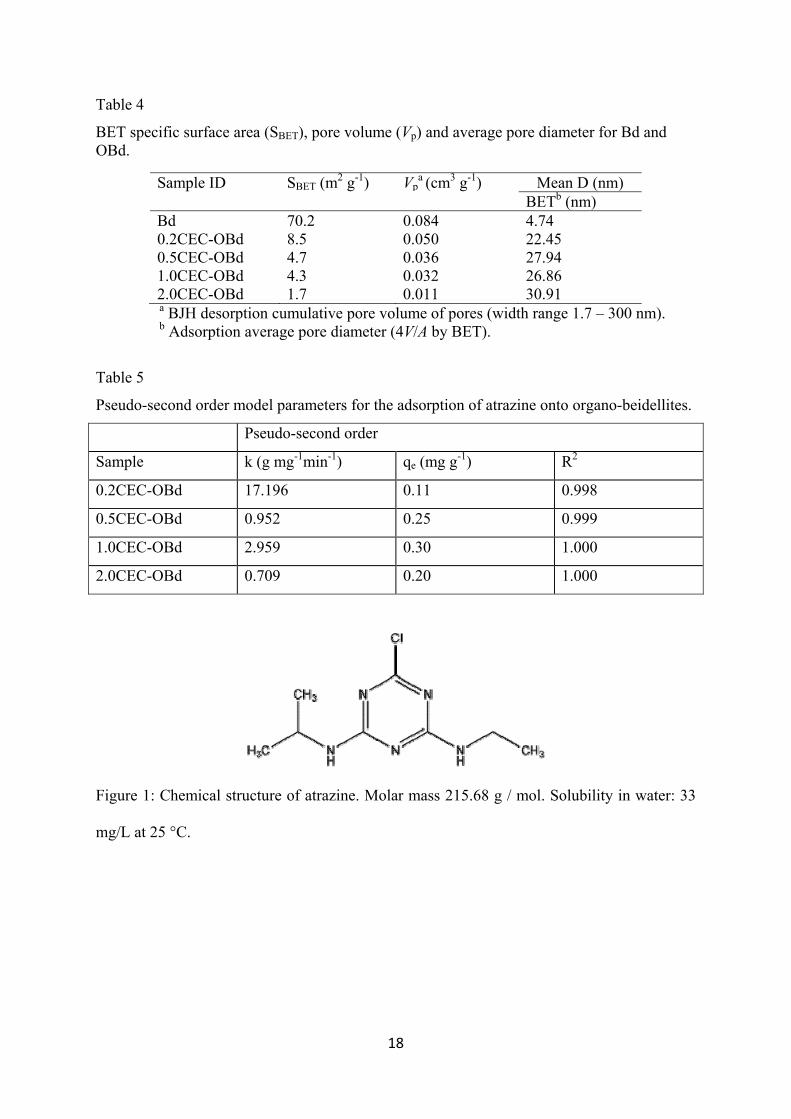
Table 4
BET specific surface area (SBET), pore volume (Vp) and average pore diameter for Bd and OBd.
Sample ID SBET (m2 g-1) Vpa (cm3 g-1) Mean D (nm)
BETb (nm) Bd 70.2 0.084 4.74 0.2CEC-OBd 8.5 0.050 22.45 0.5CEC-OBd 4.7 0.036 27.94 1.0CEC-OBd 4.3 0.032 26.86 2.0CEC-OBd 1.7 0.011 30.91
a BJH desorption cumulative pore volume of pores (width range 1.7 – 300 nm). b Adsorption average pore diameter (4V/A by BET).
Table 5
Pseudo-second order model parameters for the adsorption of atrazine onto organo-beidellites.
Pseudo-second order
Sample k (g mg-1min-1) qe (mg g-1) R2
0.2CEC-OBd 17.196 0.11 0.998
0.5CEC-OBd 0.952 0.25 0.999
1.0CEC-OBd 2.959 0.30 1.000
2.0CEC-OBd 0.709 0.20 1.000
Figure 1: Chemical structure of atrazine. Molar mass 215.68 g / mol. Solubility in water: 33
mg/L at 25 °C.
19
Figure 2: XRD patterns of the four OBd and Bd.
20
Figure 3: Infrared spectra of unmodified Bd, OBd and pure surfactant ODTMA.
21
Figure 4: DTG patterns of unmodified Bd, OBd and surfactant.
Figure 5: SEM image of unmodified Bd.
22
Figure 6: Effect of adsorbent amount on atrazine adsorption.
Figure 7: Effect of contact time on atrazine adsorption.
23
Figure 8: Pseudo-second order kinetics for the adsorption of atrazine onto OBd.


![Monodisperse Samarium and Cerium Orthovanadate ... représentatifs... · taining a cationic phase-transfer reagent ([CH3(CH2)7]4NBr or TOABr, 0.87 g) ... (λ=1.5418 A˚). The XPS](https://img.pdfslide.net/doc/110x75/5c5bafbe09d3f236368c2f35/monodisperse-samarium-and-cerium-orthovanadate-representatifs-taining.jpg)