Embed Size (px)
Citation preview
FINAL REPORTNO-TILL USAGE SURVEY
Submitted to:
Dennis ClarkeDepartment of Environment and Natural Resources
Angela EhlersSouth Dakota Association of Conservation Districts, Inc.
June 1, 2001Dr. Meredith Redlin
South Dakota State University
2
TABLE OF CONTENTS
Listing of tables . . . . . . . . . . . . . . . . . . . . . . . . . . . . . . . . . . . . . . . . . . . . . . . . . . . . . . . . . . . . . . . .3
Abstract . . . . . . . . . . . . . . . . . . . . . . . . . . . . . . . . . . . . . . . . . . . . . . . . . . . . . . . . . . . . . . . . . . . . . . 4
Introduction . . . . . . . . . . . . . . . . . . . . . . . . . . . . . . . . . . . . . . . . . . . . . . . . . . . . . . . . . . . . . . . . . . . 5
Method . . . . . . . . . . . . . . . . . . . . . . . . . . . . . . . . . . . . . . . . . . . . . . . . . . . . . . . . . . . . . . . . . . . . . . . 5
Summary of survey results . . . . . . . . . . . . . . . . . . . . . . . . . . . . . . . . . . . . . . . . . . . . . . . . . . . . . . . 6Farm operation by item . . . . .. . . . . . . . . . . . . . . . . . . . . . . . . . . . . . . . . . . . . . . . . . . . . . . .6Attitude scales by item . . . . . . . . . . . . . . . . . . . . . . . . . . . . . . . . . . . . . . . . . . . . . . . . . . . . .9Ranking of factors in decision making . . . . . . . . . . . . . . . . . . . . . . . . . . . . . . . . . . . . . . . . .13Farmer and farm family profile by item . . . . . . . . . . . . . . . . . . . . . . . . . . . . . . . . . . . . . . . . 16Qualitative comments (selected) . . . . . . . . . . . . . . . . . . . . . . . . . . . . . . . . . . . . . . . . . . . . . .18
Cross Tabulation Analysis . . . . . . . . . . . . . . . . . . . . . . . . . . . . . . . . . . . . . . . . . . . . . . . . . . . . . . . . .24Farm location by region and ranking categories . . . . . . . . . . . . . . . . . . . . . . . . . . . . . . . . . .25Attitudes and cattle/crop operations . . . . . . . . . . . . . . . . . . . . . . . . . . . . . . . . . . . . . . . . . . . .27Attitudes by 1999 net farm income . . . . . . . . . . . . . . . . . . . . . . . . . . . . . . . . . . . . . . . . . . . .29Attitudes by number of crops grown . . . . . . . . . . . . . . . . . . . . . . . . . . . . . . . . . . . . . . . . . . .30
Conclusion . . . . . . . . . . . . . . . . . . . . . . . . . . . . . . . . . . . . . . . . . . . . . . . . . . . . . . . . . . . . . . . . . . . . 31
Appendix A: Variable recoding guidelines . . . . . . . . . . . . . . . . . . . . . . . . . . . . . . . . . . . . . . . . . . . .32
Appendix B: Qualitative comments (full text) . . . . . . . . . . . . . . . . . . . . . . . . . . . . . . . . . . . . . . . . . .35
3
LISTING OF TABLES
Table 1:Attitude scales (compressed into agree/disagree percentages) . . . . . . . . . . . . . . . . . . . 10
Table 2:Ranking importance by defined categories of use. . . . . . . . . . . . . . . . . . . . . . . . . . . . . .14
Table 3:Why start to use no-till/Why continue to use no-till (rankings) by region. . . . . . . . . . . 26
Table 4: Why start to use no-till/Why stopped use of no-till (rankings) by region . . . . . . . . . . . 26
Table 5: Why haven’t used no-till/why would use no-till (rankings) by region . . . . . . . . . . . . . . 26
Table 6:% agree by have cattle . . . . . . . . . . . . . . . . . . . . . . . . . . . . . . . . . . . . . . . . . . . . . . . . . . . . .28
Table 7:% agree by 1999 net farm income . . . . . . . . . . . . . . . . . . . . . . . . . . . . . . . . . . . . . . . . . . .29
Table 8:% agreement by number of crops grown . . . . . . . . . . . . . . . . . . . . . . . . . . . . . . . . . . . . . .30
4
ABSTRACT
The number of farmers switching to no-till is increasing nation-wide. Not all of these farmerscontinue with no-till usage, however, and some farmers still choose not to adopt it. This reportdocuments opinions and attitudes of farmers regarding the adoption or nonadoption of no-till systemsin their farming operations in the state of South Dakota. The findings in this report are based on aself-administered questionnaire, distributed to a stratified random sample of South Dakota farmersin the spring of 2001. The survey questionnaire contained four sections for analysis including (i) acomposite profile of farm operations, (ii) a scale of attitudinal statements about multiple issuesassociated with no-till usage and support, (iii) a ranking of reasons for adoption, nonadoption orcessation of use, and (iv) demographic information on farmers and their families, inclusive of off-farm work and off-farm income dependence. In addition, optional open-ended questions invitingqualitative comments concluded the survey. The results demonstrate (i)continuing concerns abouteconomic planning and outlays associated with the adoption of no-till, (ii) broad consensus on theconnection between soil health and use of no-till, yet the presence of farmer hesitation aboutincreased chemical use and water and human health, (iii) variation in adoption and continued use ofno-till in relation to crop diversity and combined crop and livestock operations, and (iv) variationin adoption and continued use of no-till in relation to off-farm work and off-farm incomedependence. One notable issue found to be of little significance in farmers’ adoption of no-till wasthe presence of state and federal financial and technical support programs.
5
Introduction
This report summarizes data received from respondents to a self-administered questionnaire
dealing with the use or nonuse of no-till methods in farm operations in the state of South Dakota.
The intent of the study was to identify what factors were of import to farmers in making this choice,
with the potential use of such information to be for future program planning. Understanding
farmers’ attitudes towards and opinions about no-till methods could aid in both the content and the
focus of future conservation projects. Questions guiding the research and the composition of the
research instrument included:
--Would more farmers switch to no-till methods with the presence of a state or federal
financial assistance program?
--Do farmers perceive no-till methods to have environmental benefits? Environmental
detriments?
--Do farmers perceive no-till methods to have economic benefits? Economic detriments?
--Are there differences in attitudes about no-till that are reflected in difference in farm
operation or farm family lifestyle?
In order of discussion, this report will cover: 1) methodology of the research; 2) a summary
of survey results by section and item; and 3) four cross tabular analyses examining impact of specific
variables. In conclusion, two broad-based points are drawn regarding elements of future
programming.
Method
The survey instrument contained 37 questions, divided into 5 sections, four quantitative and
6
one qualitative. The first section of the survey offered a series of questions from which a farm
operations profile would be elicited. The second section contained 14 attitudinal statements with
which respondents were asked to agree or disagree. Section three contained a series of items which
may be influential to farmer decision-making, and respondents were asked to rank them by degree
of importance. The fourth section asked a series of questions pertaining to farmer and farm family
demographics to elicit possible lifestyle influences and/or constraints on farming choices. The final
section contained three open-ended questions pertaining to economic, environmental, and
unmentioned issues related to the farmers’ decision to use or not use no-till methods.
There was only one survey mailing to 1000 farmers throughout the state of South Dakota,
as selected through a random stratified sample conducted by the Agricultural Statistical Service in
Sioux Falls, South Dakota. A reminder postcard was issued one week later, but no other follow up
was involved. The end return rate of 21.7% was comparable to past return rates from this
population. While the return rate leaves open to question any general conclusions about the total
population, it does provide basis for insight into the multiple factors taken into account by farmers
in running their diverse operations.
Summary of survey results
Farm operation by item
Elements of farm operations represented in the survey were compiled through questions
concerning the county of residence, total farm acreage and acreage owned, amount of acreage rented
and whether public or private land, use of irrigation and number of acres, variety of crops grown,
whether cattle were included in the operation, how many and what kind (dairy or beef), whether
7
other livestock were included in the operation, how many and what kind, and a description of the
tillage system used in the operation. Drawing from median measures, the majority profile of the
respondent to this survey:
-- was from the eastern part of the state,
--farmed about 1200 acres and owned 640 acres,
--rented 540 acres of private land,
--did not irrigate,
--grew 3 or fewer crop varieties,
--had 100 head of beef cattle in a cow/calf operation and no other livestock,
--and used mainly conventional tillage.
Overall, 43.7% of respondents were from the southeastern region of the state, and another
33.5% were from the northeastern region.1 Only 10.7% of respondents were from the northwestern
region, and 12.2% were from the southwestern region.2 37.5% survey respondents farmed 320 acres
or less, and 30% farmed 340 to 1120 acres total. The remaining 32.5% reported total farming
operations of 1200 to 11000 acres. Owned acreage ranged from 6 acres to 7500 acres, and rental
acreage ranged from 10 to 10000 acres. 87.3% of rented acreage was private land rental, 3% was
state land, and an additional 4.5% was a combination of tribal land and private land. Only 7.5% of
1 For determination of counties of residence, see Appendix A specifying counties in each
region.
2 Ibid.
8
respondents used irrigation, 53.3% of whom irrigated 126 acres or less. No farms reported irrigating
more than 420 acres.
Of the farm operations represented in this survey, 35.1% raised only two crop varieties with
a clear majority indicating corn and soybeans. An additional 31.6% of respondents raised three crop
varieties, again with corn and soybeans in rotation with wheat as the clear majority. 16.7% reported
growing four different crops; 8% of the total sample reported growing five or more different crops.
Only 8.6% of respondents indicated growing only one crop.
Livestock operations comprised 61.1% of the total responses, and 95% of those were beef
operations. Herd sizes ranged from 4 to 1800. Other livestock operations comprised only 20.4%
of the total responses, with 44.7% of those operations being sheep and 21.1% being horses.
Operations raising both sheep and horses accounted for another 7.9% of total responses. Hogs
comprised another 10.5% of the total, and in combination with sheep and turkeys comprise an
additional 5.3%. Total numbers of additional livestock reflected both hobby and confinement
operations in reporting the number of other livestock--the number of other livestock ranged from 2
animals (horses) to 30000 (hens).
Respondents reported many and diverse forms of overall farm operation categories, which
were recoded in terms of tillage method identified.3 25.7% of respondents identified themselves as
currently using mostly or exclusively no-till methods, and 6.9% described using mostly or
exclusively minimum tillage. 48% of respondents reported using conventional tillage, although an
additional 10.9% reported using both conventional and either minimum till or no-till methods.
3 See Appendix A for description of recoding process.
9
To assess the representativeness of the survey respondents statewide, some of these results
can be compared to 1997 agricultural census measures. Jim Satterlee (2001) reports an average farm
size of 1418 acres in the state of South Dakota which is slightly larger than the median size reported
here. However, this same report reflects the predominance of average farm sizes under 1100 acres
in the eastern and central counties of the state, which would, of course, be reflected in the number
of survey responses from those counties and therefore in the overall slightly smaller size of farms
represented in this survey. Additionally, 1997 Agricultural census numbers4 for the state of South
Dakota report only 5% of farms as irrigated, compared to 6.5% in this report, a difference which may
again be explained by the predominance of eastern and central county respondents. 85% of state
cattle operations are beef cattle, compared with 95% in this report which is, again, fairly close for
representative purposes. The census also shows that 46% of cow/calf operations in the state have
fewer than 99 head, which complements the median herd size of 100 head found in this report. Only
3% of farms, respectively, raise sheep or hogs, which is similar to the proportion found here. 40%
of farms in the 1997 census are listed as cattle and farming operations, and 47% are listed as grain
growing operations. Due to differences in categorization between the census and this document, the
representativeness of the survey is not able to be directly compared for all measures. However, the
respondents to this survey appear to be close to state averages on available and comparable farm
operation measures.
Attitude scales by item
For ease of representation and reporting, attitude scale response are summarized item by item
4 Percentage totals calculated from raw data reports by this researcher.
10
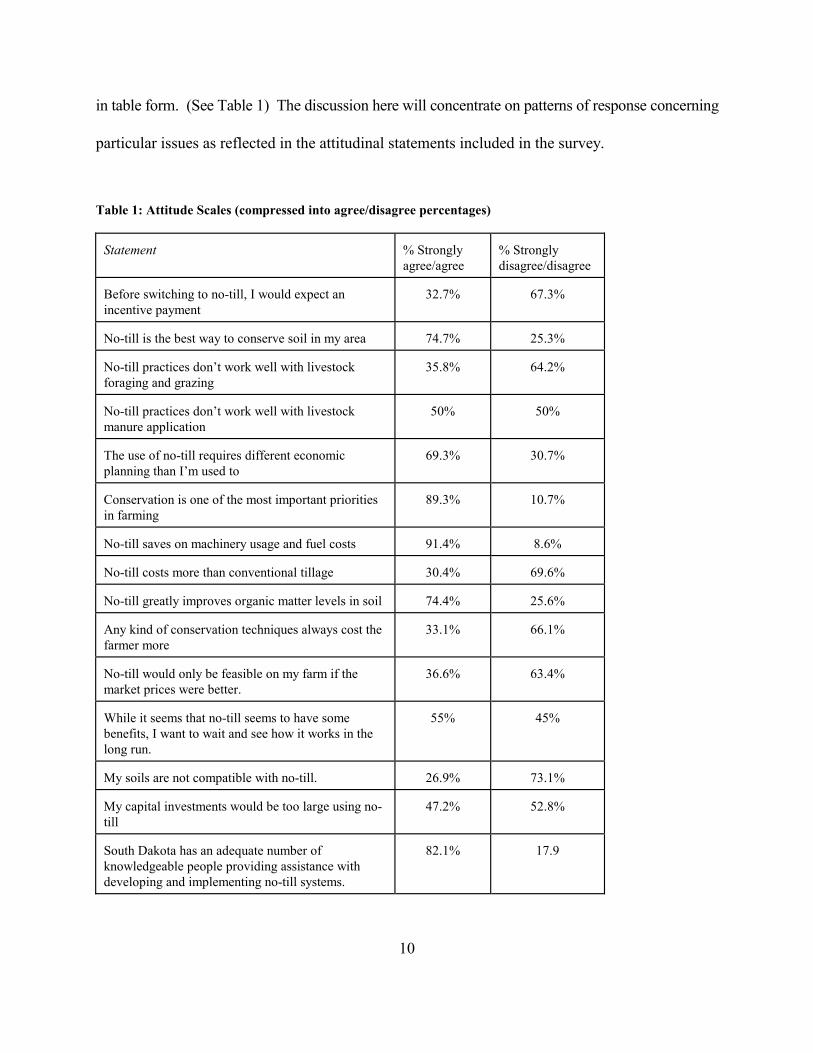
in table form. (See Table 1) The discussion here will concentrate on patterns of response concerning
particular issues as reflected in the attitudinal statements included in the survey.
Table 1: Attitude Scales (compressed into agree/disagree percentages)
Statement % Stronglyagree/agree
% Stronglydisagree/disagree
Before switching to no-till, I would expect anincentive payment
32.7% 67.3%
No-till is the best way to conserve soil in my area 74.7% 25.3%
No-till practices don’t work well with livestockforaging and grazing
35.8% 64.2%
No-till practices don’t work well with livestockmanure application
50% 50%
The use of no-till requires different economicplanning than I’m used to
69.3% 30.7%
Conservation is one of the most important prioritiesin farming
89.3% 10.7%
No-till saves on machinery usage and fuel costs 91.4% 8.6%
No-till costs more than conventional tillage 30.4% 69.6%
No-till greatly improves organic matter levels in soil 74.4% 25.6%
Any kind of conservation techniques always cost thefarmer more
33.1% 66.1%
No-till would only be feasible on my farm if themarket prices were better.
36.6% 63.4%
While it seems that no-till seems to have somebenefits, I want to wait and see how it works in thelong run.
55% 45%
My soils are not compatible with no-till. 26.9% 73.1%
My capital investments would be too large using no-till
47.2% 52.8%
South Dakota has an adequate number ofknowledgeable people providing assistance withdeveloping and implementing no-till systems.
82.1% 17.9
11
From overall responses to these statements, three primary points arise:
-respondents are concerned about conservation and are aware of no-till’s benefits
in that area, particularly as they relate to soil conservation;
--respondents remain concerned about economic planning and cost issues of
no-till; and
--respondents consider current state support systems for no-till adequate
and reject the importance of an incentive program.
As both positives and negatives are reflected in these patterns, a slim majority (55%) of South
Dakota farmers report that they are willing to “wait and see” before implementing no-till. This
discrepancy indicates that some opinions may not be reflected in the statements offered which are
influential in farmer decision-making. (This point will be discussed further in consideration of
qualitative comments.)
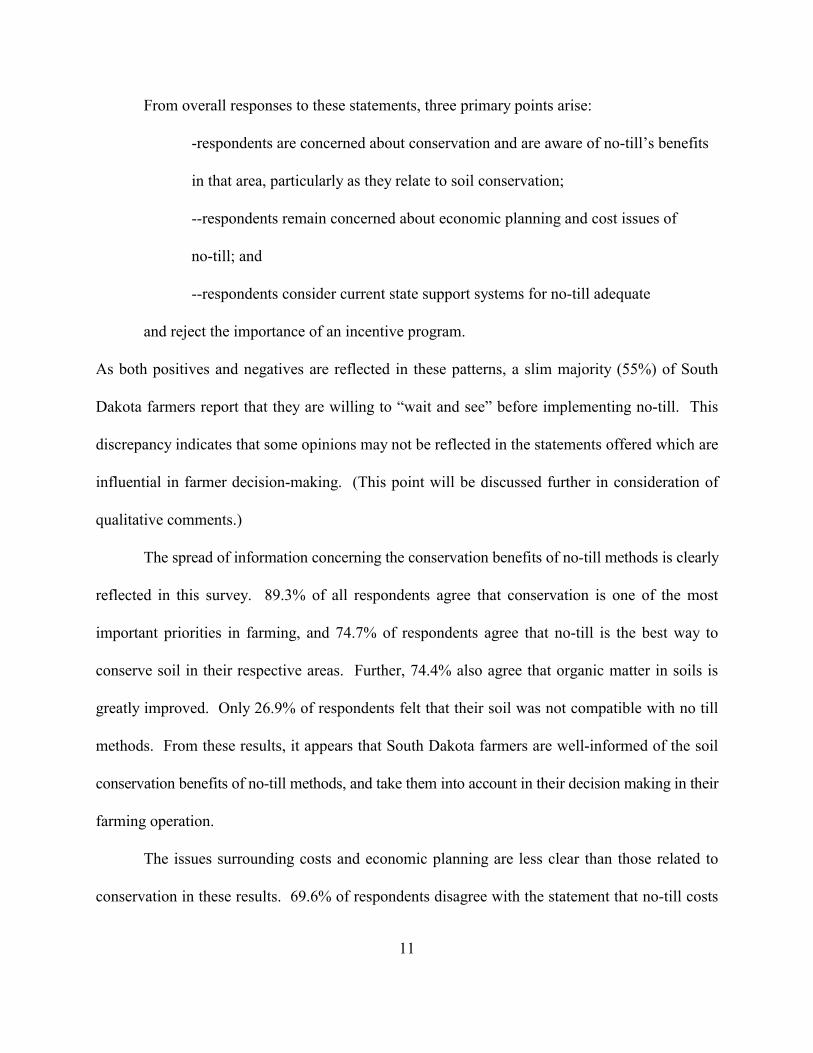
The spread of information concerning the conservation benefits of no-till methods is clearly
reflected in this survey. 89.3% of all respondents agree that conservation is one of the most
important priorities in farming, and 74.7% of respondents agree that no-till is the best way to
conserve soil in their respective areas. Further, 74.4% also agree that organic matter in soils is
greatly improved. Only 26.9% of respondents felt that their soil was not compatible with no till
methods. From these results, it appears that South Dakota farmers are well-informed of the soil
conservation benefits of no-till methods, and take them into account in their decision making in their
farming operation.
The issues surrounding costs and economic planning are less clear than those related to
conservation in these results. 69.6% of respondents disagree with the statement that no-till costs
12
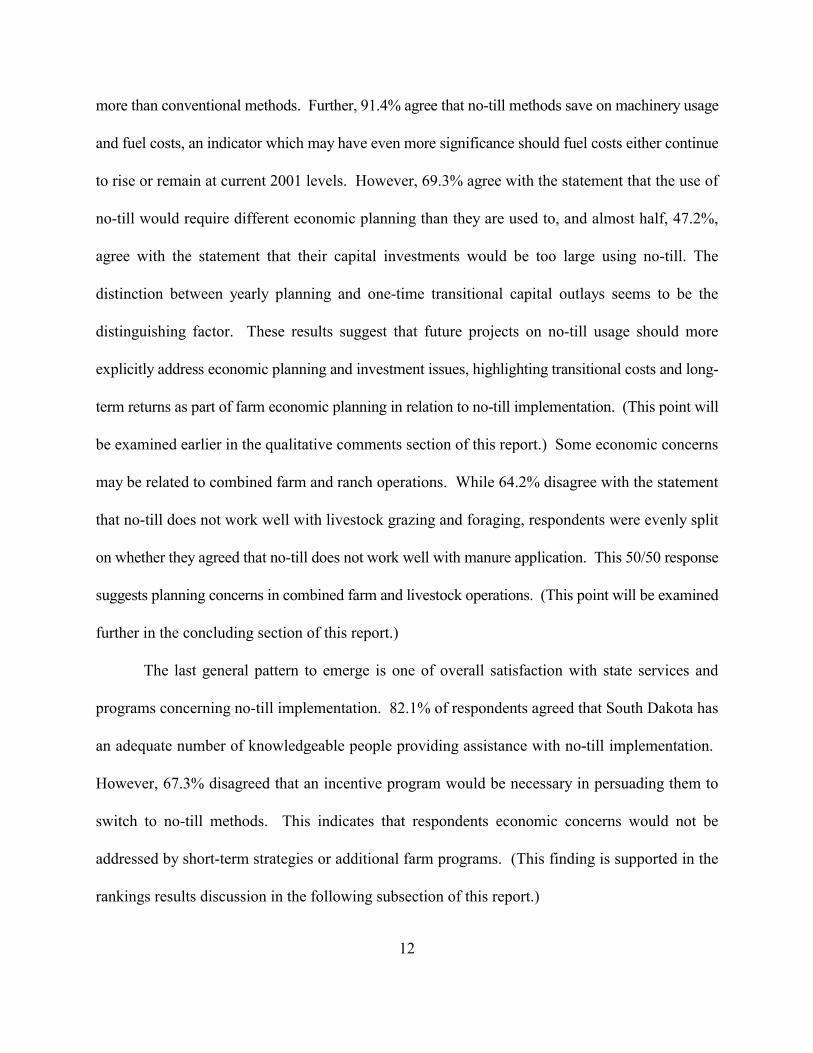
more than conventional methods. Further, 91.4% agree that no-till methods save on machinery usage
and fuel costs, an indicator which may have even more significance should fuel costs either continue
to rise or remain at current 2001 levels. However, 69.3% agree with the statement that the use of
no-till would require different economic planning than they are used to, and almost half, 47.2%,
agree with the statement that their capital investments would be too large using no-till. The
distinction between yearly planning and one-time transitional capital outlays seems to be the
distinguishing factor. These results suggest that future projects on no-till usage should more
explicitly address economic planning and investment issues, highlighting transitional costs and long-
term returns as part of farm economic planning in relation to no-till implementation. (This point will
be examined earlier in the qualitative comments section of this report.) Some economic concerns
may be related to combined farm and ranch operations. While 64.2% disagree with the statement
that no-till does not work well with livestock grazing and foraging, respondents were evenly split
on whether they agreed that no-till does not work well with manure application. This 50/50 response
suggests planning concerns in combined farm and livestock operations. (This point will be examined
further in the concluding section of this report.)
The last general pattern to emerge is one of overall satisfaction with state services and
programs concerning no-till implementation. 82.1% of respondents agreed that South Dakota has
an adequate number of knowledgeable people providing assistance with no-till implementation.
However, 67.3% disagreed that an incentive program would be necessary in persuading them to
switch to no-till methods. This indicates that respondents economic concerns would not be
addressed by short-term strategies or additional farm programs. (This finding is supported in the
rankings results discussion in the following subsection of this report.)
13
Therefore, it is apparent from these results that although a majority of these farmers are
concerned with soil conservation and are informed on the benefits of no-till methods in this regard,
many are either not as informed about, or have unaddressed concerns pertaining to, economic
planning and capital investment issues. As they are pleased with the service from existent state
programs and staff, perhaps future emphasis could be placed on these economic issues. The balance
between the clearly positive attitudes towards practicing conservation methods and towards no-till
and soil conservation, and the more hesitant attitudes towards economics suggest the presence of
other significant factors in the “wait and see” outcome indicated in these results.
Ranking of factors in decision-making
To determine some of the influences in farmer decision-making about use or nonuse of no
till methods, respondents were asked to indicate which of eight items on a list were operative in their
personal choices. The list included:
--cost savings (or not);
--soil conservation and health
--crop flexibility;
--the presence or absence of state programs
--the presence or absence of federal programs;
--neighbor’s experience (positive or negative);
--greater or lesser profit margins; and
--respondent identified “other” reasons.
Lists were categorized into three divisions representing majority patterns of use and nonuse. The
14
first category explored influential factors for respondents who started using no-till methods and have
continued use. The second category explored influential factors for respondents who started using
no-till methods but stopped using them. The third category explored influential factors for
respondents who have never used no till methods and what factor would influence a change in their
decision-making.
Table 2: Ranking importance by defined categories of use
Category Cost Soil Flexibility StatePrograms
FederalPrograms
Neighbor’suse
Profit
Started use 2 1 4* 7 6 4* 3
Continueduse
2 1 4 7 5 6 3
Started use 1 2 4 7 6 3 5
Stoppeduse
2 4* 3 4* 4* 4* 1
Haven’tused
1 6 3* 7 5 2 3*
Would use 2* 1 5* 7 5* 4 2** designates equal number of responses in determining ranking
Calculation of factor importance was conducted for each subcategory and, for ease of
discussion and representation, were ranked by total number of respondent indicators. (See Table 2)
For those who have started and continued use of no till methods, the most important factor in their
decision to implement no till was soil conservation. Of second and third importance, respectively,
in decision-making for this category were cost savings and increased profit margins. While a
neighbor’s use of no till was fourth in importance in deciding to implement no till, it dropped to sixth
as a factor in continuing that practice, clearly indicating the importance of personal experience. Crop
flexibility remained constant at a ranking of fourth, both as a reason for beginning use of no till and
in continuing its use. Federal programs were rated sixth in importance in the decision to start using
15
no till, but went up slightly to fifth in the decision to continue use. The presence of state financial
and technical programs was listed last in both subcategories. Respondent identified other reasons
for starting use of no till methods included “speed of planting” and “less labor intensive.” Other
reasons for continuing use were “moisture conservation,” “less labor intensive,” “speed of planting,”
and “it worked well.”
For those who started to use no till but stopped its use, the primary factors are more varied.
The most important factor in the decision to begin use of no till was cost savings; the primary factor
in stopping use of no till was the lack of profit margins. While soil conservation was the second
factor in starting use of no till, it dropped to a broad tie for fourth (lowest ranking in this
subcategory) in the decision to stop use. This seems to indicate either unsatisfactory soil outcomes
or the practical experience that soil conservation was not adequately offset by financial returns. A
neighbor’s experience was rated third in influencing the decision to start no till, but dropped to a
broad tie for last in the decision to stop. Again, this reflects the importance of personal experience
for continued use of no till methods. Crop flexibility was rated third in influencing the decision to
stop use of no till, but was considered less important (fourth) in the decision to start. Rated least
important in decision-making for both starting and stopping no till implementation were the presence
of state and federal financial and technical support programs. One other factor involved in the
decision to implement no till was “more free time.” For stopping use of no till, the other reason
given was that the “ground got too hard.”
Those who have never implemented no till methods indicated that cost was the primary
factor in their decision-making. A neighbor’s experience is listed as the second factor in deciding
not to use no till, and profit margins and crop flexibility tied as the third factor. Federal technical
16
and financial support programs and soil conservation were ranked fifth and sixth, respectively, with
state financial and technical support programs again ranking as least in importance in the decision
to not use no till methods. The other reason given for nonuse of no till was “soil type.” In identifying
what would influence them to begin use of no till, respondents ranked soil conservation as number
one, echoing the ranking of those who have started and continued use of no till methods. Also
similar to that other category, cost savings and increased profit margins were tied in their ranking
of second most important. A neighbor’s success is ranked third in influence, and crop flexibility and
the presence of federal financial and technical support systems were tied for fourth in influence.
State programs, again, were considered of least importance in influence in reconsidering no till use.
The only other reason identified which would influence a decision to implement no till was
“moisture savings” in soil.
Overall, the rankings indicate the primary importance of cost savings and profit margins as
an outcome of implementation and continuation of no till methods in farming operations. Those who
stopped using no till also indicated cost and profit margins as key factors in that decision. While
soil conservation was a key factor for those who were satisfied with economic outcomes and was
influential in decision-making to start use of no till, it dropped in importance both as a reason why
no till hadn’t been used and why no till use was stopped. The delicate balancing act which today’s
farmers engage in between conservation and economic return is clearly operative in their decision
making, and reflects the attitude outcomes found in the previous section.
Farmer and Farm Family Profile by item
In order to identify lifestyle factors which may be involved in use or nonuse of no till
17
methods, the concluding quantitative section collected farmer and farm family demographic
information. The items included:
-- age, gender, race and marital status of the respondent;
--age of spouse and number of dependents;
--respondent participation in off-farm work, what kind of work and the number of hours
per week worked off-farm;
--spouse’s participation in off-farm work, what kind of work and the number of hours per
week worked off-farm; and
--net 1999 farm and off-farm income.
Age of respondent ranged from 27 years to 87 years of age, with a median age of 50 years
which is slightly less than the national average for this population. 94.1% of respondents were male,
and 97.8% were white. 81.8% were married, and spouses’ ages ranged from 23 to 86 years of age,
with a median age of 47 years. While the number of dependents, not including the spouse, ranged
from 0 to 14, the median number of dependents was 1. 42.1% of respondents reported 0 dependents,
not counting their spouse, which would suggest that many had grown children who were no longer
living at home.
36% of respondents worked off-farm, with the majority of off-farm positions being those
which would complement farm schedules. “Sales,” “trucking,” “construction,” and “mechanic” were
the most commonly identified kind of work, although there were 43 kinds of work identified in the
total sample. Hours per week worked off-farm ranged from 4 hours to 77.5 hours, with a median
measure of 40 hours. 15.8% reported off-farm weekly work hours of 50, however, which was the
second largest single item percentage.
18
60.1% reported off-farm work by spouse, highlighting the crucial role spouse income plays
for many current farm families. The kinds of off-farm positions reported for spouses reflected
gender norms, including “secretary,” “teacher,” “nurse,” and “banker.” 44 different kinds of work
were identified in the sample total. The hours per week worked by spouse ranged from 10 to 60
hours, with a median measure, again, of 40 hours. Also similar to farm operator off-farm work, the
second largest single category of hours worked was 50 hours per week at 9.1%.
Net farm income for 1999 ranged from 0 dollars to 500,000 dollars, with a median measure
of $23,000. The mode for farm income was $30,000, followed by $10,000 as the next most
commonly occurring response. Net off-farm income also ranged from 0 dollars to 500,000 dollars,
with a median measure of $15,000. The median measure in this category may reflect both part-time
work and pay levels in rural areas for gender specific jobs obtained by spouses. The mode for this
item was $25,000, however, and with incomes of $10,000, $12,000, and $60,000 as the next most
commonly occurring responses. In general, both income measures, in combination with off-farm
work measures, indicate the present importance of off-farm income in farming operations. This
finding complements the clear influence of economics in decision-making and attitudes discussed
in previous sections. It also suggests the importance of time savings as influential, however, given
the number of hours worked both on and off-farm.
Qualitative comments
45% of respondents provided additional comments to the open-ended questions which ended
the survey instrument. The majority of these comments were single sentences in response to only
one of the three questions, although the variety of responses provided multiple comments to each
19
question. Three major patterns emerge here, which help to elucidate data patterns from previous
sections: 1) a more specific discussion of economic investment as a detriment to the adoption of no-
till; 2) a more thorough discussion of conservation attitudes and opinions, which identifies the
balance between soil conservation and water purity and human health issues due to chemical use;
and 3) the influences on decision-making for farmers reflected by larger familial, political, and
experiential factors. Representative quotes are used in the following discussion. (See Appendix B
for full listing of transcribed responses.)
First, the overwhelming response to the question “Are there financial concerns that you have
about using no-till that aren’t reflected in the questions here?” was the cost involved in additional
machinery needed for no till. One respondent noted:
The biggest item is the cost of the machinery to do the no-till. Otherwise, if I wouldn’t have had to change machinery I’d probably be no-till farming.
This was echoed in multiple comments by others:
You have to buy all new equipment that is too high priced for what you get.
The only reason anyone can do anything is because it is profitable. It doesn’t make senseto spend hundreds of thousands of dollars on equipment just because something becomesthe latest fad, if what you already have gets the job done.
It takes special equipment. This would be a financial burden for some.
Respondents also noted a relation between machinery costs and farm size:
Cost of new equipment for a small acreage isn’t economical. Not much used no-tillequipment on the market.
Cost of new equipment is prohibitive in an operation of my size to be able to try new no-till systems.
And several respondents also noted the difficultly of both affording new machinery and trying
20
new methods in the current agricultural market:
[No-till] has a cost for machinery that has to be bought new or almost new. Financially,a lot of guys don’t know how they are even going to stay farming, let alone think aboutchanging everything.
Investment startup versus profit return. More debt? Who wants that at this time withcrop prices as they are?As long as you receive a crop hopefully it will make up in yield from the increased costs.
But when you lose the crop, it’s all the more dollars you’re exposed to lose.
A smaller number commented briefly on “the cost factor for chemicals and fertilizer,” emphasizing
that savings on long-term machinery and fuel savings may be offset by the increased costs for
chemicals and new machinery.
Second, the strong attitudes concerning conservation as a priority in farming are reflected in
responses to the open-ended question, “Are there environmental concerns that you have about using
no-till that aren’t reflected in the questions asked here?” Again, a clear majority shared a similar
approach to their response, highlighting concerns about increased chemical use with no-till and its
effects on the environment:
I doubt whether the verdict is really in on whether no-till and heavy chemical use is goodfor the land and for long-term human health.
On no-till, the big concern seems to be soil conservation but what I’ve seen with no-till isthe extra use of chemicals which are very bad for our environment. So on the one handyou’re saving soil but on the other hand you may be polluting our water supply.
Too many chemicals have to be used for no-till.
Two respondents connected these concerns to specific concern over increased chemical use on
their own health:
I don’t like the increased exposure [to chemicals] I have, even though I think I’m careful. Also, I see a great concern over spray drift when or if everyone were to switch over to it. We have had a lot of problems with our young shelter belt trees getting nipped from off-
21
target spray drift, especially from airplanes.
You are exposed to chemicals every time you use them and there is no way you can keepfrom getting them on you. I don’t care if you wear a space suit.. They are always in theground and eventually in the water.
One other mentioned concerns related to increased chemical use and “an increasingly chemically
conscious marketing environment.” Last, a few respondents listed their concerns about soil
compaction and run-off as also an environmental concern that needed to be addressed:
Too much run-off in wet conditions. Heavy soils directly south of Aberdeen...haveshown excessive ponding since no-till has been used on all acres. These soils need to beaerated by tillage from time to time. My soil tests show excellent organic matter in soils. I believe these low spots will continue to grow in size because of compaction.
Root worms, and the ground gets so tight it will not grow.
It seems the no-till beans blow really bad.
However, several respondents advocated the use of no-till as an environmentally
beneficial system, particularly for wildlife shelter:
My concern is that not enough people no-till and THAT is an environmental issue.
There seems to be an outstanding side benefit of no-till and that is cover (wheat stubble)for wildlife, mainly pheasants. The only concern I have is if the government overregulates pesticide use.
I think the environment improves with no-till. I see improvement in the pheasants by just going narrow row in the beans.
Overall, comments by respondents highlight the balance farmers are working to find between
multiple conservation issues and multiple farming methods.
Last, many different issues were presented in response to the final open-ended questions,
“What haven’t you had the chance to tell us? Are there other constraints or reasons you have for not
using no-till?” Some respondents emphasized the strong power of convention in farming choices:
22
I farm with older family members and they still like to see a well worked field (seed bed)before the planter enters the field.
When things work, don’t change them.
We have been using no-till for 12-15 years. Seems this survey is a little behind thetimes....Most of the problem with farmers not switching to no-till is because of the age offarmers. In our area, most of the young farmers use no-till. The old farmers have usedtillage for so many years they probably wouldn’t change if the seed, equipment and workwas done for them using no-till. Look at the average [age] of farmers today.
Too old to change.
Other farmers commented more extensively on their and neighbors’ personal experiences with
no-till as a reason not to switch for the varied reasons of soil composition, crop wash out, soil
compaction, and excess moisture:
One neighbor had trouble in wet years. I have some farm land that is sandy and hilly,there no-till would work good. But I also farm river bottom land that floods a lot and isalways on the wet side. On this heavy soil deep tillage in the fall works the best. So inmy operation, if I went no till, I would need two types of equipment.
Neighbor’s field of corn planted on soybean ground had so much corn wash out hethought he was going to have to replant. My corn planted across the road the same day onsoybean ground lost no corn and VERY little washing. I mean very little washing. No-till has too much cover to wash away, like corn stalks.
I know people in Gettysburg who no-till, but plow a quarter of land every 3 years becauseof trash and compaction. Do not say earthworms will keep the soil aerated enough. Itdoesn’t show up in south Brown county....Worms are good, but I think their role in no-tillis over-rated.
No-till is not the magic bullet for everyone. Our land is poorly drained and this createswater ponding in wet conditions that delay planting. For me, it is not conducive tocovering large areas in short amounts of time. For well drained land, I believe it makesmore sense.
However, personal experiences were also the basis for strong support and satisfaction with no till
systems, as noted by other respondents:
23
The switch to no-till was a necessity. We farm as a family and three of us farm ~8500acres crop ground. We don’t have manpower for ANY other system. Now that we’veswitched to 100% no-till and see the profits...we couldn’t afford any other system.
The initial start up is difficult based on peer pressure to till, but in less than 5 continuousyears in my records on my ground has surpassed my neighbors’ yields and I own lessequipment along with reduced chemical needs.No-till holds moisture better and really increases yields in dry years--10 bushel more onbeans.
Some respondents expressed the necessity to retain both no till and conventional tillage systems:
I farm in NE South Dakota. No-till works great planting soybeans in corn residue. Oursoils stay too cool, too long for no-till corn and wheat. I have seen wheat losses due tosoil micro-organisms overpowering weak wheat plants.
I do no-till on about one third to one half of my acres. I would like to see some commonground between the two systems. Each has its own advantages. If we would be able todrain cropland, this would change my attitude greatly, but this I see as almost impossibleat this time.
And finally, several respondents felt that no till systems were reflective of broader political issues
surrounding agriculture in America today:
Farming is now geared for the big guy, not afraid to borrow big money.
It makes it possible to farm too big for the good of the country. Too many farmers arebeing displaced.
No-till makes it possible for one man to farm more acres since simply spraying on achemical covers more acres in less time. So this encourages bigger and bigger farmoperations, and, of course, less people on active farms....This has a profound impact onour churches, schools and towns. The introduction of chemicals is probably the mainfactor in the population decline in rural America....Tillage may have drawbacks, but sodoes chemical dependence. Chemical farming is pushed by the big money interests(chemical companies especially)....They don’t push chemical farming because they knowit to be best for human health, for our rural communities, and for our environment. Theydo it for THEIR bottom line profit picture....The Extension departments live on theirresearch grants and give poor advice to farmers.
Overall, the additional comments provided by respondents draw a clearer picture concerning
24
responses in previous sections. The decision of whether to implement no-till methods or not is made
within multiple considerations of economics, family tradition, the environment, farm location, soils,
weather, and political influences. Some of these considerations may be addressed by expanded
information about no-till and its environmental impacts, for example through dissemination of
information about long term chemical impacts on water, human and soil health. Other
considerations may be addressed through time, for example, a broader availability of used no till
equipment may appear on the market. Other considerations, such as family practice and tradition,
farm size and political perspectives, suggest the continuing need to examine soil conservation
methods which are viable alternatives to no-till that serve the economic and social ends of
predominantly small farmers. Last, considerations of farm location, kind of farm operation and
lifestyle factors can be further investigated (in a preliminary fashion) by cross-item analysis of
variables in this survey. This is the topic of the concluding section.
Cross Tabulation Analysis
In order to more specifically identifying factors in attitudes towards no-till methods, four
cross item analyses were conducted.
1) The influence of county of residence on ranking of the importance of particular
factors in the decision to use no-till. Different locations within the state of South
Dakota have broadly differing amounts of moisture, of soil types, numbers of acres, and
variety of crops, and all of these may demonstrate regional patterns of adoption or
nonadoption based on regional characteristics.
2) The impact of cattle in farmer decision making about no-till in regard to four attitude
25
statements concerning the integration of no-till with grazing and/or manure application, as
well as statements referring to economic planning and capital investment.
3) Impacts of 1999 net farm income to attitudes toward no-till incorporation. Farm
income may have the most impact on whether or not programming options such as
financial incentives would be beneficial.
4) Impact of crop diversity on attitudes towards no-till incorporation. Multiple crops may
already mean higher capital investment in machinery, fuel, and other outlays, which could
result in less willingness to adopt no-till practices.
1) Farm location by region and ranking categories
This analysis explores farmers’ reasoning to use or not use no-till methods based on their
farm location. Given previous evidence of soil and moisture differences, farm location may be a
determining factor. For those who started and continued use of no-till (see table 3), minimal
differences are apparent by region. The reduction in sample size results in equal numbers of
responses, so rankings, particularly in the western regions, are less differentiated. However, two
issues of note are clear. First, soil and cost are consistently highly ranked above all other categories
in all regions, with the exception of expected profit margins as a reason to start use in the southwest
counties. Second, state and federal financial and technical assistance programs are clearly ranking
lowest across all regions.
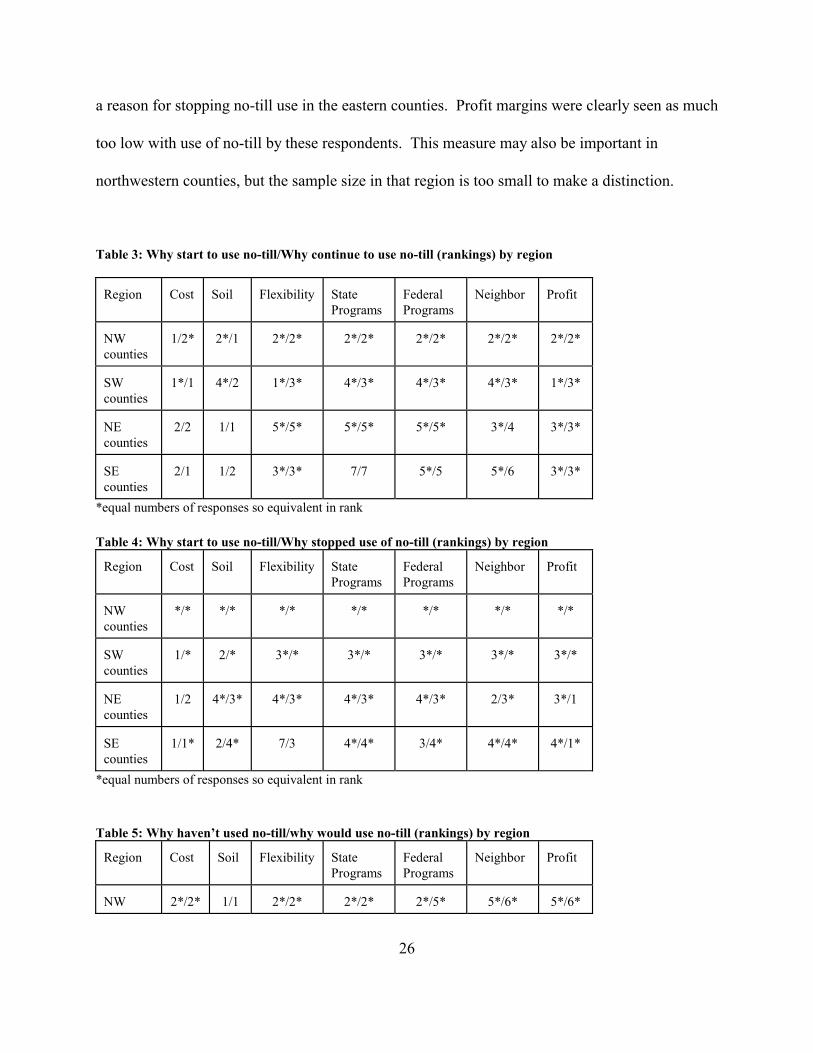
For those who started using no-till methods and stopped (see table 4), few differences were
found across region in reasons for starting use of no-till; cost savings and soil conservation
remain the primary factors. One exception to previous patterns is found in the ranking of profit as
26
a reason for stopping no-till use in the eastern counties. Profit margins were clearly seen as much
too low with use of no-till by these respondents. This measure may also be important in
northwestern counties, but the sample size in that region is too small to make a distinction.
Table 3: Why start to use no-till/Why continue to use no-till (rankings) by region
Region Cost Soil Flexibility StatePrograms
FederalPrograms
Neighbor Profit
NWcounties
1/2* 2*/1 2*/2* 2*/2* 2*/2* 2*/2* 2*/2*
SWcounties
1*/1 4*/2 1*/3* 4*/3* 4*/3* 4*/3* 1*/3*
NEcounties
2/2 1/1 5*/5* 5*/5* 5*/5* 3*/4 3*/3*
SEcounties
2/1 1/2 3*/3* 7/7 5*/5 5*/6 3*/3*
*equal numbers of responses so equivalent in rank
Table 4: Why start to use no-till/Why stopped use of no-till (rankings) by region
Region Cost Soil Flexibility StatePrograms
FederalPrograms
Neighbor Profit
NWcounties
*/* */* */* */* */* */* */*
SWcounties
1/* 2/* 3*/* 3*/* 3*/* 3*/* 3*/*
NEcounties
1/2 4*/3* 4*/3* 4*/3* 4*/3* 2/3* 3*/1
SEcounties
1/1* 2/4* 7/3 4*/4* 3/4* 4*/4* 4*/1*
*equal numbers of responses so equivalent in rank
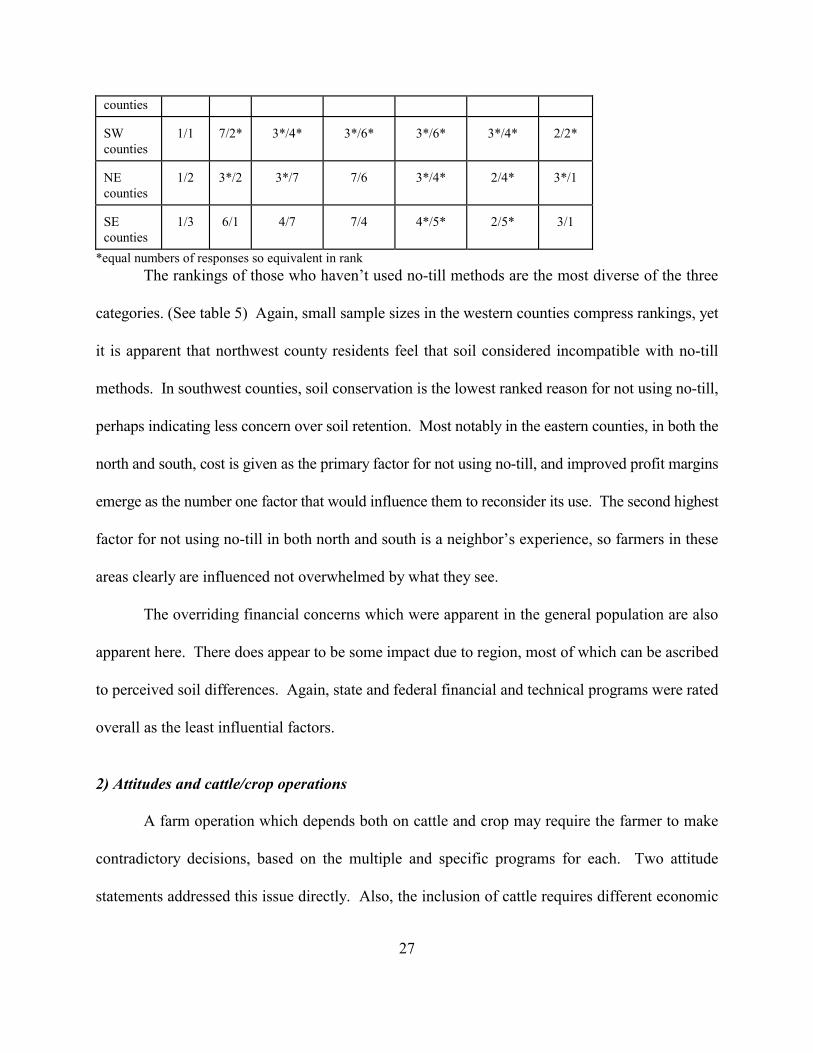
Table 5: Why haven’t used no-till/why would use no-till (rankings) by region
Region Cost Soil Flexibility StatePrograms
FederalPrograms
Neighbor Profit
NW 2*/2* 1/1 2*/2* 2*/2* 2*/5* 5*/6* 5*/6*
27
counties
SWcounties
1/1 7/2* 3*/4* 3*/6* 3*/6* 3*/4* 2/2*
NEcounties
1/2 3*/2 3*/7 7/6 3*/4* 2/4* 3*/1
SEcounties
1/3 6/1 4/7 7/4 4*/5* 2/5* 3/1
*equal numbers of responses so equivalent in rankThe rankings of those who haven’t used no-till methods are the most diverse of the three
categories. (See table 5) Again, small sample sizes in the western counties compress rankings, yet
it is apparent that northwest county residents feel that soil considered incompatible with no-till
methods. In southwest counties, soil conservation is the lowest ranked reason for not using no-till,
perhaps indicating less concern over soil retention. Most notably in the eastern counties, in both the
north and south, cost is given as the primary factor for not using no-till, and improved profit margins
emerge as the number one factor that would influence them to reconsider its use. The second highest
factor for not using no-till in both north and south is a neighbor’s experience, so farmers in these
areas clearly are influenced not overwhelmed by what they see.
The overriding financial concerns which were apparent in the general population are also
apparent here. There does appear to be some impact due to region, most of which can be ascribed
to perceived soil differences. Again, state and federal financial and technical programs were rated
overall as the least influential factors.
2) Attitudes and cattle/crop operations
A farm operation which depends both on cattle and crop may require the farmer to make
contradictory decisions, based on the multiple and specific programs for each. Two attitude
statements addressed this issue directly. Also, the inclusion of cattle requires different economic
28
planning and differing capital investments. Two attitude statements also address these issues. These
four statements were examined in relation to whether the farm included cattle or not (see table 6) to
explore for impacts due to combined animal/crop operations.
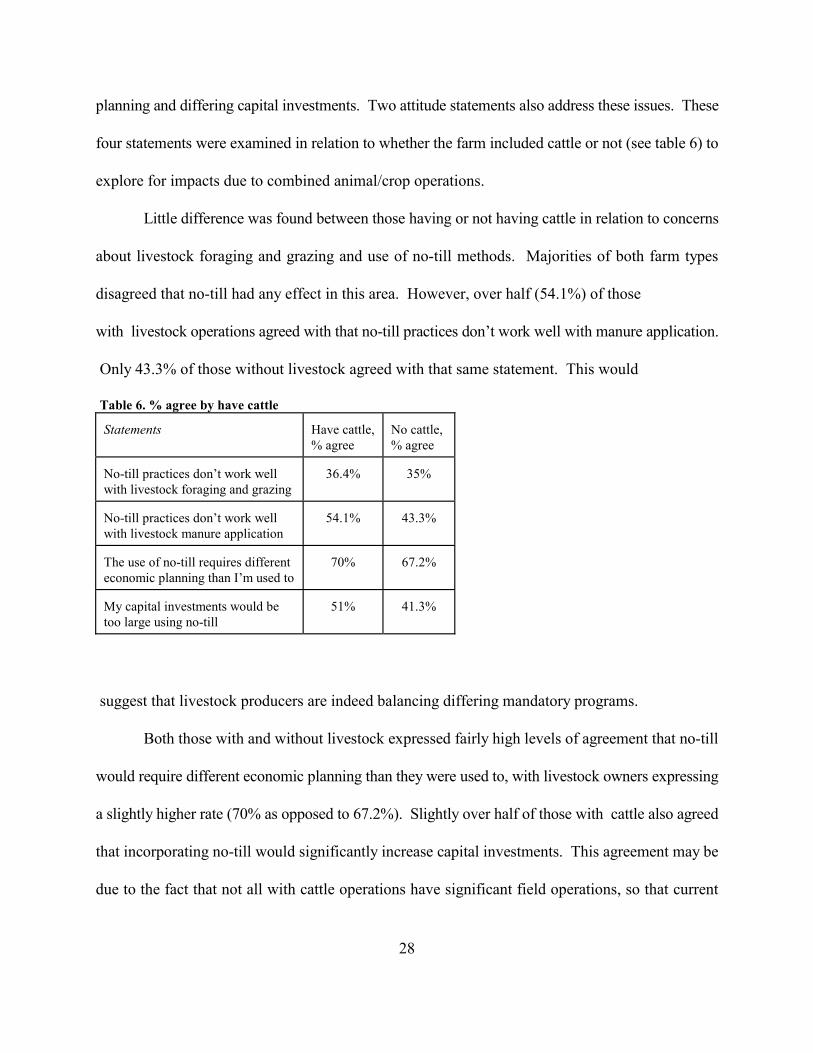
Little difference was found between those having or not having cattle in relation to concerns
about livestock foraging and grazing and use of no-till methods. Majorities of both farm types
disagreed that no-till had any effect in this area. However, over half (54.1%) of those
with livestock operations agreed with that no-till practices don’t work well with manure application.
Only 43.3% of those without livestock agreed with that same statement. This would
Table 6. % agree by have cattle
Statements Have cattle,% agree
No cattle, % agree
No-till practices don’t work wellwith livestock foraging and grazing
36.4% 35%
No-till practices don’t work wellwith livestock manure application
54.1% 43.3%
The use of no-till requires differenteconomic planning than I’m used to
70% 67.2%
My capital investments would betoo large using no-till
51% 41.3%
suggest that livestock producers are indeed balancing differing mandatory programs.
Both those with and without livestock expressed fairly high levels of agreement that no-till
would require different economic planning than they were used to, with livestock owners expressing
a slightly higher rate (70% as opposed to 67.2%). Slightly over half of those with cattle also agreed
that incorporating no-till would significantly increase capital investments. This agreement may be
due to the fact that not all with cattle operations have significant field operations, so that current
29
capital investment in machinery, seed, chemicals, etc. is lower at the outset.
Overall, some influence can be seen due to the presence or absence of cattle in the farming
operation. That influence, however, seems to be most prominent in relation to manure incorporation
and capital investment, rather than grazing or planning concerns.
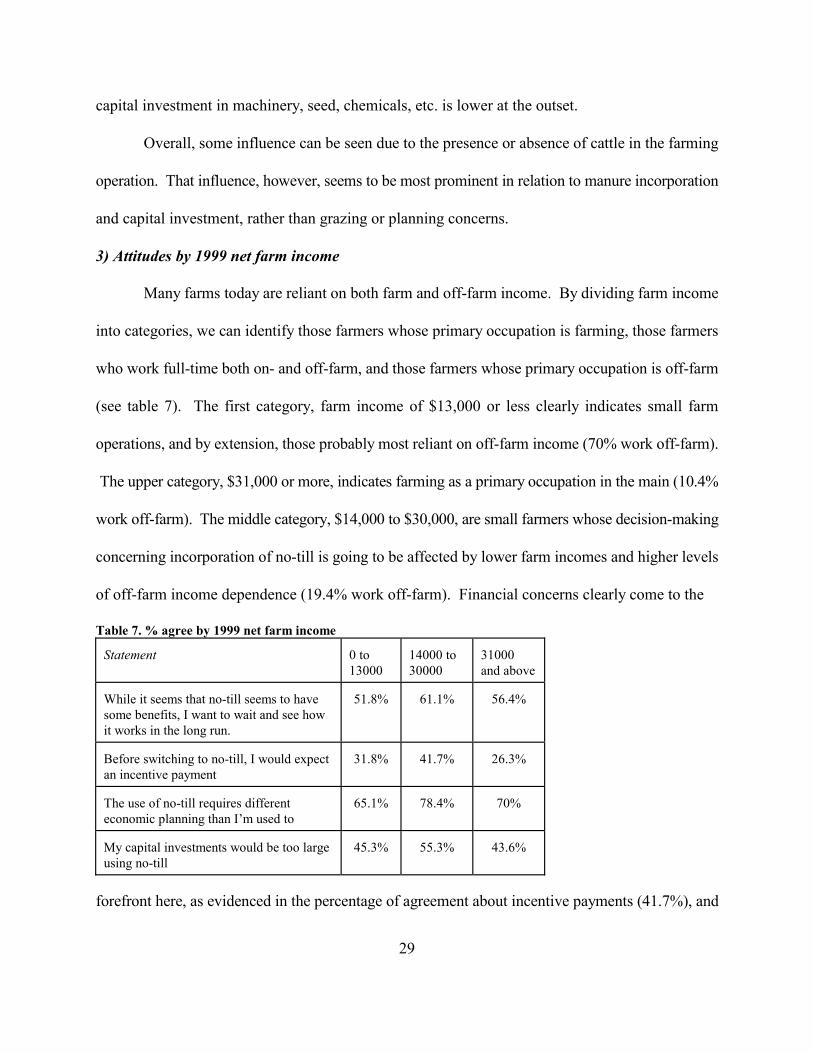
3) Attitudes by 1999 net farm income
Many farms today are reliant on both farm and off-farm income. By dividing farm income
into categories, we can identify those farmers whose primary occupation is farming, those farmers
who work full-time both on- and off-farm, and those farmers whose primary occupation is off-farm
(see table 7). The first category, farm income of $13,000 or less clearly indicates small farm
operations, and by extension, those probably most reliant on off-farm income (70% work off-farm).
The upper category, $31,000 or more, indicates farming as a primary occupation in the main (10.4%
work off-farm). The middle category, $14,000 to $30,000, are small farmers whose decision-making
concerning incorporation of no-till is going to be affected by lower farm incomes and higher levels
of off-farm income dependence (19.4% work off-farm). Financial concerns clearly come to the
Table 7. % agree by 1999 net farm income
Statement 0 to13000
14000 to30000
31000and above
While it seems that no-till seems to havesome benefits, I want to wait and see howit works in the long run.
51.8% 61.1% 56.4%
Before switching to no-till, I would expectan incentive payment
31.8% 41.7% 26.3%
The use of no-till requires differenteconomic planning than I’m used to
65.1% 78.4% 70%
My capital investments would be too largeusing no-till
45.3% 55.3% 43.6%
forefront here, as evidenced in the percentage of agreement about incentive payments (41.7%), and
30
the clear concern over change in economic planning (78.4%). These farmers with low to middle net
farm incomes are also clearly feeling more constrained in relation to capital investment (55.3%) and
more aware of a perceived necessary change in economic planning (78.4%). For these farmers, no-
till incorporation may seem a significant economic burden without some form of financial support.
It is important to note, however, that less than half of these farmers favor such a program.
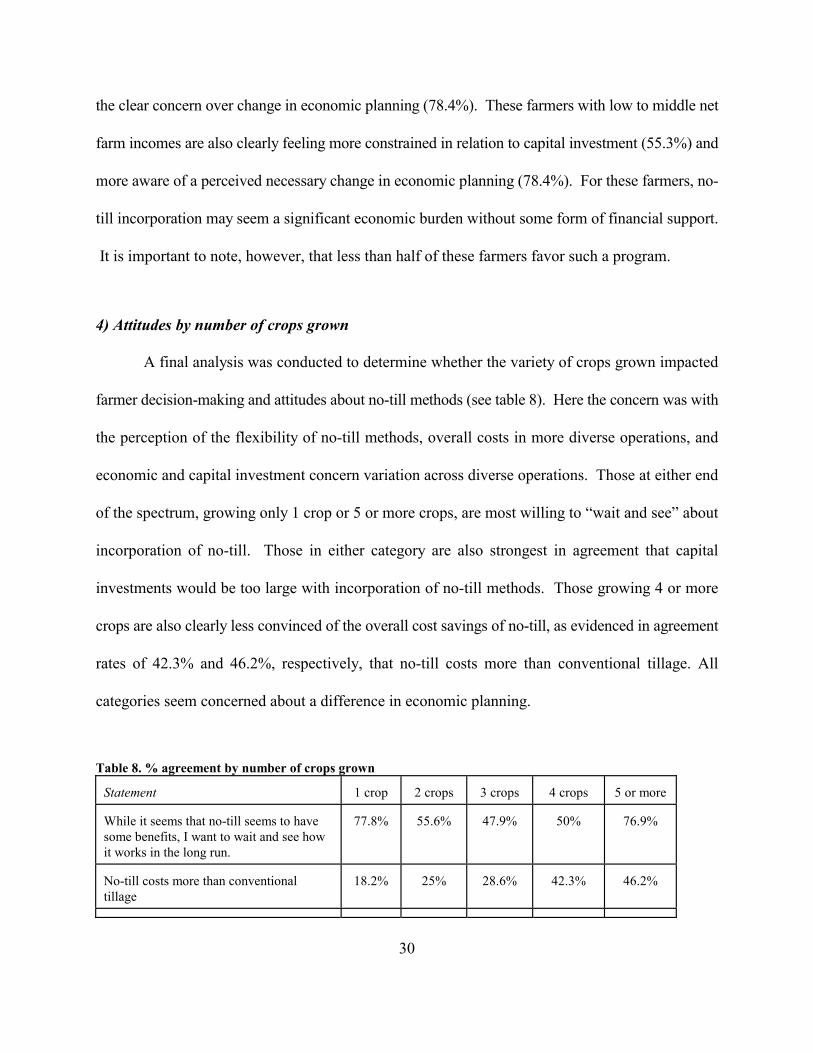
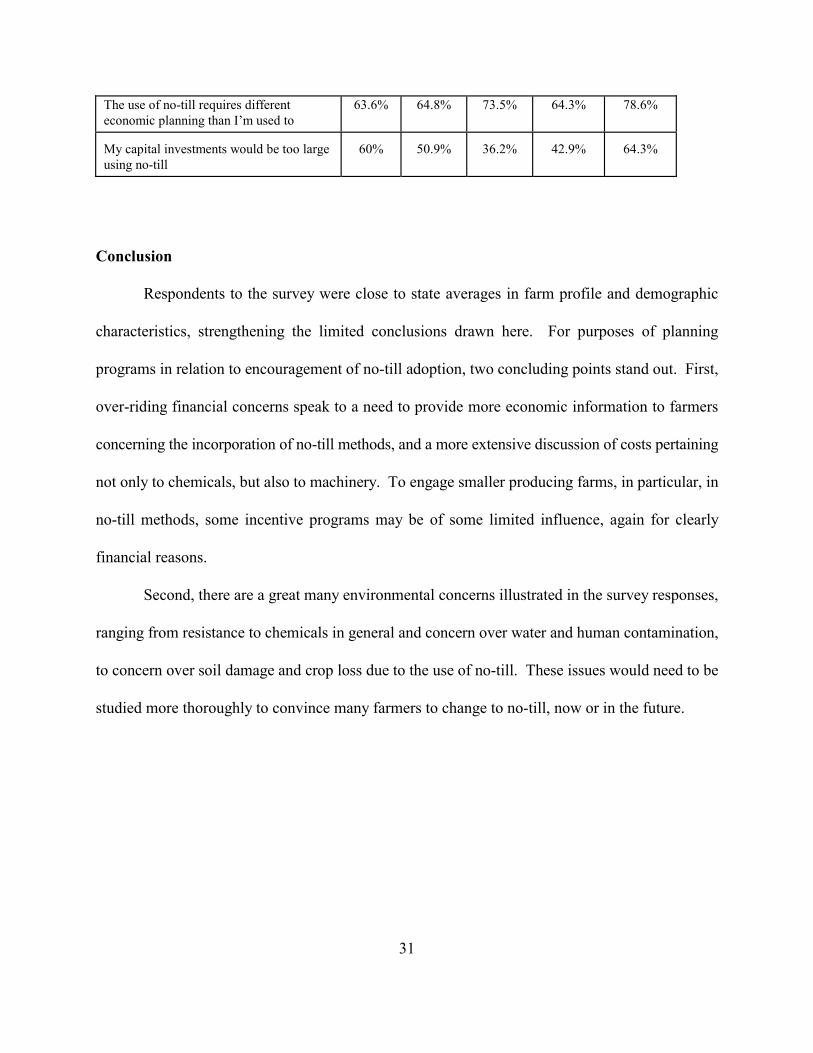
4) Attitudes by number of crops grown
A final analysis was conducted to determine whether the variety of crops grown impacted
farmer decision-making and attitudes about no-till methods (see table 8). Here the concern was with
the perception of the flexibility of no-till methods, overall costs in more diverse operations, and
economic and capital investment concern variation across diverse operations. Those at either end
of the spectrum, growing only 1 crop or 5 or more crops, are most willing to “wait and see” about
incorporation of no-till. Those in either category are also strongest in agreement that capital
investments would be too large with incorporation of no-till methods. Those growing 4 or more
crops are also clearly less convinced of the overall cost savings of no-till, as evidenced in agreement
rates of 42.3% and 46.2%, respectively, that no-till costs more than conventional tillage. All
categories seem concerned about a difference in economic planning.
Table 8. % agreement by number of crops grown
Statement 1 crop 2 crops 3 crops 4 crops 5 or more
While it seems that no-till seems to havesome benefits, I want to wait and see howit works in the long run.
77.8% 55.6% 47.9% 50% 76.9%
No-till costs more than conventionaltillage
18.2% 25% 28.6% 42.3% 46.2%
31
The use of no-till requires differenteconomic planning than I’m used to
63.6% 64.8% 73.5% 64.3% 78.6%
My capital investments would be too largeusing no-till
60% 50.9% 36.2% 42.9% 64.3%
Conclusion
Respondents to the survey were close to state averages in farm profile and demographic
characteristics, strengthening the limited conclusions drawn here. For purposes of planning
programs in relation to encouragement of no-till adoption, two concluding points stand out. First,
over-riding financial concerns speak to a need to provide more economic information to farmers
concerning the incorporation of no-till methods, and a more extensive discussion of costs pertaining
not only to chemicals, but also to machinery. To engage smaller producing farms, in particular, in
no-till methods, some incentive programs may be of some limited influence, again for clearly
financial reasons.
Second, there are a great many environmental concerns illustrated in the survey responses,
ranging from resistance to chemicals in general and concern over water and human contamination,
to concern over soil damage and crop loss due to the use of no-till. These issues would need to be
studied more thoroughly to convince many farmers to change to no-till, now or in the future.

32
33
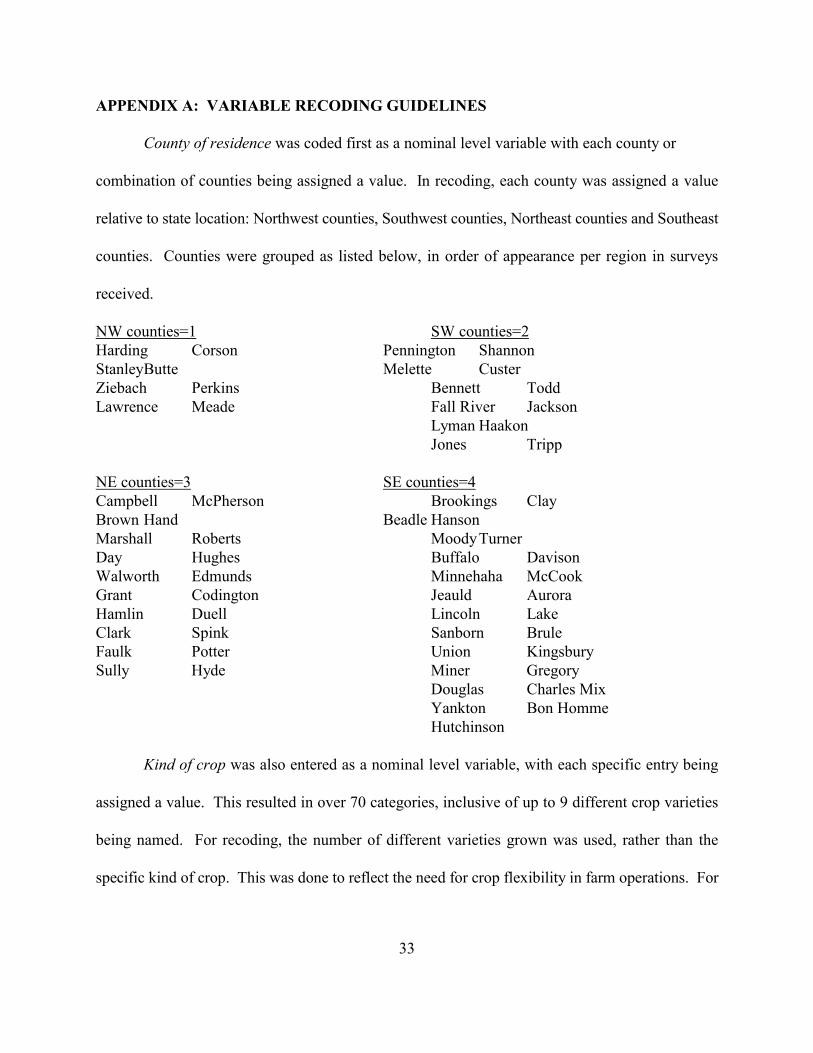
APPENDIX A: VARIABLE RECODING GUIDELINES
County of residence was coded first as a nominal level variable with each county or
combination of counties being assigned a value. In recoding, each county was assigned a value
relative to state location: Northwest counties, Southwest counties, Northeast counties and Southeast
counties. Counties were grouped as listed below, in order of appearance per region in surveys
received.
NW counties=1 SW counties=2Harding Corson Pennington ShannonStanleyButte Melette CusterZiebach Perkins Bennett ToddLawrence Meade Fall River Jackson
Lyman HaakonJones Tripp
NE counties=3 SE counties=4Campbell McPherson Brookings ClayBrown Hand Beadle HansonMarshall Roberts MoodyTurnerDay Hughes Buffalo DavisonWalworth Edmunds Minnehaha McCookGrant Codington Jeauld AuroraHamlin Duell Lincoln LakeClark Spink Sanborn BruleFaulk Potter Union KingsburySully Hyde Miner Gregory
Douglas Charles MixYankton Bon HommeHutchinson
Kind of crop was also entered as a nominal level variable, with each specific entry being
assigned a value. This resulted in over 70 categories, inclusive of up to 9 different crop varieties
being named. For recoding, the number of different varieties grown was used, rather than the
specific kind of crop. This was done to reflect the need for crop flexibility in farm operations. For
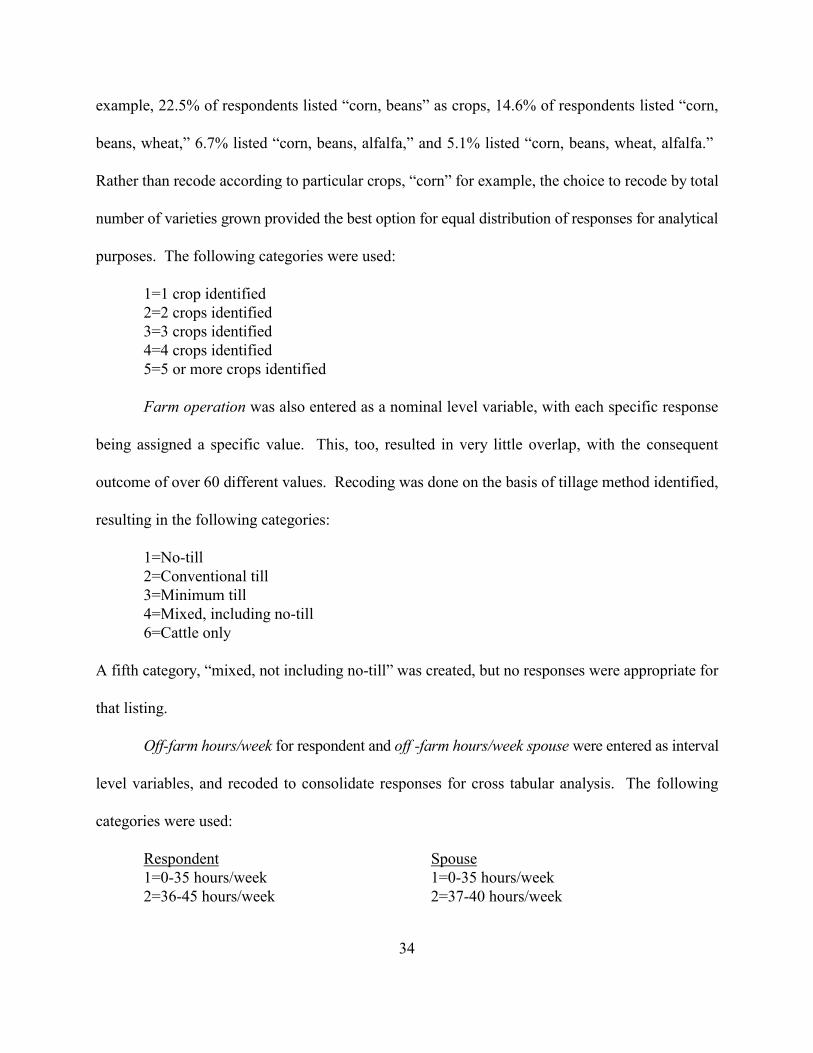
34
example, 22.5% of respondents listed “corn, beans” as crops, 14.6% of respondents listed “corn,
beans, wheat,” 6.7% listed “corn, beans, alfalfa,” and 5.1% listed “corn, beans, wheat, alfalfa.”
Rather than recode according to particular crops, “corn” for example, the choice to recode by total
number of varieties grown provided the best option for equal distribution of responses for analytical
purposes. The following categories were used:
1=1 crop identified2=2 crops identified3=3 crops identified4=4 crops identified5=5 or more crops identified
Farm operation was also entered as a nominal level variable, with each specific response
being assigned a specific value. This, too, resulted in very little overlap, with the consequent
outcome of over 60 different values. Recoding was done on the basis of tillage method identified,
resulting in the following categories:
1=No-till 2=Conventional till3=Minimum till4=Mixed, including no-till6=Cattle only
A fifth category, “mixed, not including no-till” was created, but no responses were appropriate for
that listing.
Off-farm hours/week for respondent and off -farm hours/week spouse were entered as interval
level variables, and recoded to consolidate responses for cross tabular analysis. The following
categories were used:
Respondent Spouse1=0-35 hours/week 1=0-35 hours/week2=36-45 hours/week 2=37-40 hours/week
35
3=47.5-77.5 hours/week 3=45-60 hours/week
Farm Income and Off-farm Income were also entered as interval level variables, and recoded
to provide consolidated responses for cross tabular analysis. The following categories were used:
Farm Income Off-Farm Income1=0-13,000 1=0-8,0002=14,000 to 30,000 2=9,000 to 25,0003=31,000 to 500,000 3=26,000 to 500,000
36
APPENDIX B: QUALITATIVE RESPONSES BY QUESTION (FULL TEXT)
Are there financial concerns that you have about using no-till that aren’t reflected in thequestions here?
It takes special equipment. This would be a financial burden for some.
No, input costs are high whichever way you do things. What we need is better prices for what wehave to sell. Cost of the chemical.
If no-till returns more money per acre that would be a poor reason to do it.
Cost to update equipment.
The only reason anyone can do anything is because it is profitable. It doesn’t make sense to spendhundreds of thousands of dollars on equipment just because something becomes the latest fad, ifwhat you already have gets the job done.
Some of the people you see that no till have a huge expense in converting planters and cuts to workin no till residue, and this expense is hard to justify to convert.
You have to fallow to get a crop of wheat. No-till the ground gets too hard. You have to use toomuch fertilizer, the seeds are a lot higher for no till.
You have to buy all new equipment that is too high priced for what you get.
Chemical fertilizer costs can get quite high.
Yes, for my size of operation the costs of complete change to no till is prohibitive. I hire the beanscustom planted.
Why don’t you ask if the geographic area is suitable for no-till?
Yes, about the high cost of machinery and maintenance.
Cost of new equipment for a small acreage isn’t economical. Not much used no-till equipment onthe market.
Cost of new equipment is prohibitive in an operation of my size to be able to try new no-till systems.
37
Cost of no-till equipment. I currently lease for custom hire due to cost of equipment. For three years, the only herbicide that worked was roundup that I applied myself. All otherherbicides I used and had my local co-op apply did NOT work. The manufacturer of the herbicidethat checked the herbicide did not return my money and the co-op that applied it would not returnmy money. Weather conditions were favorable. There was proper rain after application. I now doNOT do business with either company.
Cost of equipment is too high.
Machinery costs.
Investment startup versus profit return. More debt? Who wants that at this time with crop pricesas they are.
Cost of no-till planters are too high to justify on my ranch.
The cost to switch equipment.
I think no-till should be mandatory for everyone!
Time savings when trying to farm, my long time dream, and feed myself and kids.
Storage for grain is a concern, since we are increasing volume of grain in this system.
In my area we have heavy clay soils combined with dryness and no crops would survive with no till. That is why farmers use fallow.
With farm prices where they’re at it isn’t feasible to make the switch to no-till cost wise, to switchequipment.
I hire custom no-tilling done. Started no-till in the late 80s.
The cost factor of chemicals and fertilizer.
The reason I quit no-till is because I could not afford another crop disaster. 3 years in a row of poorsoybeans. I did better with conventional.
As long as you receive a crop hopefully it will make-up in yield from the increased costs. But whenyou lose the crop, it’s all the more dollars you’re exposed to loss.
I hope to convert everything to no-till except irrigated land.
My neighbors’ experience and mine have been going from raising above average wheat, to raising
38
10 bushel wheat and just about bankrupting the farm.
Start up costs. Purchasing machinery necessary for no-till is our biggest draw back.
Cost of equipment.
The biggest item is the cost of the machinery to do the no-till. Otherwise, if I wouldn’t have had tochange machinery I’d probably be no-till farming.
I can’t afford my own drill and if you hire someone else, you have to wait until they can come.
Wet soils as a result of high water tables that cause us to resort to modified tillage to dry out the topsoil and crop residues so that no till planters will work properly.
Not enough profit to retool new equipment. Struggle to stay going.
Cost of a different planter, drill and sprayer.
Yes, it costs too much. Example: $80,000 to $200,000 for a planter alone not to mention a 400 hptractor to pull the planter.
I see increased chemical costs offset savings in machine and fuel costs. Also, machinery costs aremuch higher.
Financial concerns pertaining to poorer crop stands from planting into cold soils, as opposed to lighttillage in spring to warm up soil. Breaking open the ground in fall helps moisture to better penetratethe soil profile.
It has a cost for machinery that has to be brought new or almost new. Financially a lot of guys don’tknow how they are even going to stay farming, let along think about changing everything.
I have a nice line of equipment, have tried it a few times on beans. My conventional beans werealways better. It is faster to plant, but you get what you put into it in return.
Price of chemicals.
Are there environmental concerns that you have about using no-till that aren’t reflected in thequestions asked here?
Yes, I think the chemical companies are recommending too much chemical per acre. I also think wemay be heading for a “Roundup” shipwreck as I have done with Pursuit. ALS resistance. I wasn’tup on the wheat and soy herbs that had ALS action, so unfortunately my different custom alliesdidn’t keep track or warn me either.
39
There must be a huge run off of chemicals on to neighbors who are concerned about pure water andsoil contamination.
No till works even where you wouldn’t think it would. We have gumbo ground that we just neverthought it would work well on, but it does if you’re patient.
Too much chemical is used on the land already. Yes, I doubt whether the verdict is really in on whether no till and heavy chemical use is good forthe land and for long-term human health.
It seems the best chemicals are pre-plant incorporated and this is also the easy way to incorporatefertilizer and it kills all the weeds just before planting. No till requires more expensive chemicalsto kill weeds and runs the risk of resistance.
Yes, concerns about chemicals used in close proximity to residential areas, rivers, lakes, recreationalareas. Also, residual effects of repeated chemical use to control weeds over a long term period.
No, I think the environment improves with no till. I see improvement in the pheasants by just goingnarrow row in the beans.
My concern is that not enough people no-till and THAT is an environmental issue.
Chemical over-use is as much of a concern as RESPONSIBLE tillage.
Yes, am concerned about impact of environment due to the use of spray for weed control.
More spray.
The fertilizer and mainly the chemicals (such as atrazine) can be harmful to the environment.
Yes, too much run-off in wet conditions. Heavy soils directly south of Aberdeen 4-8 miles and 4-5miles east have shown excessive ponding since no-till has been used on all acres. These soils needto be aerated by tillage from time to time. My soil tests show excellent organic matter in soils. Ibelieve these low spots will continue to grow in size because of compaction.
Don’t care for the chemicals in an increasingly chemically conscious marketing environment. Equipment that seeds and turns under a cover crop may be on the market, but I’m not aware of any.
The excessive amounts of spray and fertilizer used.
The extreme use of chemicals for weed control.
40
Some say that residue increases to the point that tillage is needed, why not in my case?
YES. More spraying required instead of conventional tillage for weed control. The trade off maysave soil, BUT the chemicals in our food chain are and will continue to be influenced by $$$ NOTthe safety issues.
Too many chemicals have to be used for no-till.
On no-till the big concern seems to be soil conservation but what I’ve seen with no-till is the extrause of chemicals which are very bad for our environment, so on one hand you’re saving soil but onthe other hand you may be polluting our water supply.
I feel there is a too strong influence of chemicals, i.e. sprays, with no-till.
The extra amount of chemical needed to control weeds costs a lot and I’m afraid it might get in theground water.
I don’t like chemicals, hence, weeds are a problem.
There seems to be an outstanding side benefit of no-till and that is cover (wheat stubble) for wildlife,mainly pheasants. The only concern I have is if the government over regulates pesticide use.
I have seen 60 miles per hour wind blow soil on fallow that have too wide of strips. I believe in 20acre wide strip farming. I experienced a big field blow into my hay ground and covered my grasscrowns.
The proper use of chemicals.
Yes, I don’t like the increased exposure I have even though I think I’m careful. Also, I see a greatconcern over spray drift when or if everyone were to switch over to it. We have had a lot ofproblems with our young shelter belt trees getting nipped from off-target spray drift, especially fromairplanes.
It seems the no-till beans really blow bad.
You are exposed to chemicals every time you use them and there is no way you can keep fromgetting them on you. I don’t care if you wear a space suit. They are always in the ground andeventually in the water.
We do have concerns about applying all the herbicides necessary in a no-till operation.
Yes, I think the long term effects of overuse of chemical in farming practices has yet to be revealed.
41
Conservation of soil to me also includes protection of ground water and surface water from runoffand leaching of these numerous chemicals and fertilizers.
Root worms, and the ground gets so tight it will not grow.
Need to use more chemicals and gene altered seed.
Proper use of herbicides and insecticides.
Nothing was said about the increased use of chemicals required with no till.
I’m concerned about soil compaction. I hope fewer trips across the fields will lessen compaction.Worried about providing a haven for insects to survive through the winter because of extra trash left. Hope to eventually use fewer herbicides in the future.
Carbon storage programs.
Yes, the extreme high rates of chemicals like Nitrogen fertilizer used in no-till will contaminate ourwater, kill and poison soil and any crop grown with soil, or water, and destroy ozone layer causingglobal warming, causing death of all life on planet Earth.
NO, I am tired of hearing about environmental concerns, I don’t have highly erodible ground.
Tillage is necessary on heavy soils. No till can’t be used continuously.
What haven’t you had the chance to tell us? Are there other constraints or reasons you havefor not using no-till?
I farm with older family members and they still like to see a well worked field (seed bed) before theplanter enters the field.
It makes it possible to farm too big for the good of the country. Too many farmers are beingdisplaced.
When things work don’t change them.
I think the most important reason for using it is the cost savings--less fuel, less trips over. I do thinkthat it is a good conservation practice too but lately farmers have to do what makes the besteconomic sense, because if you don’t, you won’t be farming long. There are vast amounts ofinformation to read to give us ideas--but one of the best no-till publications that I like to read is No-Till Farmer, editor is Frank Lassiter.
The price of the chemical is one thing; Our soil in our county is already bathed in chemical; Health
42
reason’s are of big concern. Where I have not used no-till, I had better crops right along side.
No-till makes it possible for one man to farm more acres since simply spraying on a chemical coversmore acres in less time. So--this encourages bigger and bigger farm operations, and of course lesspeople on active farms. We see farm after farm dozed down and buried for good. This has aprofound impact on our churches, schools, and towns. The introduction of chemicals is probablythe main factor in the population decline in rural America. MANY believe it is also at least a factorin high cancer rates across the country. A labor and machinery intensive method of farming wouldbe better for this country from a sociological perspective. To say that no till is so good for the landmakes me very uneasy. Last year, I saw the corn and bean fields by my no-till friends were hard andpacked and the rains did not soak in easily. Cultivated fields absorbed the rain much moreeffectively. Tillage may have drawbacks but so does chemical dependence. Chemical farming ispushed by the big money interests (chemical companies especially). They make the big profitsotherwise we would not hear and see their high priced chemical ads for months. They don’t pushchemical farming because they know it to be best for human health, for our rural communities, andfor our environment. They do it for THEIR bottom line profit picture. They think the farmers willfall for THEIR line and they are pretty much correct in that. The Extension departments live on theirresearch grants and give poor advice to farmers.
Some of our ground is very black and heavy. We need some black on top to help dry in spring sowe can get across to plant.
Look at the amount of water that has accumulated in Northeast South Dakota from the 80s until now. Potholes are overflowing, lakes are swollen and roads are still underwater. Trash covered mudwon’t dry out. The only way is to let the sun hit black soil.
One neighbor had trouble in wet years. I have some farm land that is sandy and hilly, there no-tillwould work good. But I also farm river bottom land that floods a lot and is always on the wet side. On this heavy soil deep tillage in the fall works best. So in my operation if I went no till I wouldneed 2 types of equipment.
What will years of non-incorporating crop residue do the productive [capability] of the soil? Especially since many of the chemicals needed to make no-till work are so detrimental to necessarysoil organisms?
Finding ways to no till without having to invest so much in a planter to get started. I tried no tillbeans last year and hope to do more this year.
Didn’t address compaction problems and periodic tillage.
I quit using no till because the ground gets too hard.
43
The switch to no-till was a necessity. We farm as a family and 3 of us farm ~8,500 acres cropground. We don’t have manpower for ANY other system. Now that we’ve switched to 100% no-tilland see the profits...we couldn’t afford any other system.
No-till may have a place in South Dakota’s future but in the last 8 years with excess precipitationit hasn’t profited at all in our area. The concept that the earthworms will alleviate your saturatedsoils is bull. We tried for 2 years in a row and could afford to keep on experiment. With 180 bushelcorn the trash problems with corn on corn was also too much to overcome. No till works ok in drysituations and if the trash is manageable. It has its place but is NOT THE ANSWER TOIMPROVING EVERYONE’S BOTTOM LINE. Will work in dry years and save money andmoisture when it gets dry again.
Having the right equipment for no-till and the cost of it. Having effective herbicides for no-till.
I am a hobby farmer. I am 78 years old so I have been around awhile. Birds know enough to pushtheir young out of the nest. We have spoiled our so-called farmers (chemical spreaders) and theyare doing a good job of farming Uncle Sam. Any other business when the lots or shelves are full,they shut down and quit producing. The chemical companies are the only one’s getting rich off theland.
Weed control, on my soils lower yield. Water standing in low areas, we started to see more alkalinespots in the lower areas.
The farmers are all going broke and I don’t think the government really cares, because they want toown it all and then we will have to work for them for NOTHING.
I feel weeds such as bindweed and thistle can be harder to control in continuous crop.
In our area if you leave all that stubble untouched in the fall, you don’t farm in the spring. We lostthree crops because we couldn’t work our ground in 93, 94, 95 and part of 97 and 98.
I believe minimum till works best on my heavy clay soil. Also, I believe its very important tominimize herbicide.
I know people in Gettysburg who no-till, but plow a quarter of land every 3 years because of trashand compaction. Do not say earthworms will keep the soil aerated enough. It doesn’t show up inSouth Brown county. On my land wherever I find lumpy-wet ground there are earthworms. Thefiner ground never shows any. This has been going on for years. Worms are good, but I think theirrole in no-till is over-rated.
I haven’t the right equipment for no-till.
Excess moisture in the spring is the biggest drawback. Also finding out what and having studies
44
done to help a person combat this, short of working the field to dry it out. Also, what attachmentswork better for the corn planter, without doing all the experimenting yourself.
Equipment still does not meet the demand to be able to no till corn successfully. Also, heavy corncrop residues simply do not decompose enough over winter to really make no-till work.
The initial start up is difficult based on peer pressure to till but in less than 5 continuous years in myrecords on my ground has surpassed my neighbors’ yields and I own less equipment along withreduced chemical needs.
Farm chemicals are over-priced and chemical companies should not own seed companies.
Neighbors’ field of corn planted on soybean ground had so much corn wash out he thought he wasgoing to have to replant. My corn planted across the road the same day on soybean ground lost nocorn and VERY little washing. I mean very little washing. No-till has too much cover wash away,like corn stalks.
From what I’ve read no-till works ok for a couple years, then compaction and other related factorsbegin to reduce yields.
Too much chemical put into the land which goes into the water system.
In this area, the only winter wheat that came up last fall was on summer fallow. The no-till landstubble back was too dry and the soil baked too hard.
Yield lag in start-up years, dealing with livestock, compaction and manure.
In reference to farm prices above, I don’t know if the investment is worth it with the uncertainty ofbeing in the business 5-10 years from now.
I love no-till, but wheat stubble on wet ‘springs’ can be unplantable.
The 2 years that I did no-till, the rain didn’t come at the proper times and I don’t have the properequipment to incorporate chemicals or rescue the plant if rain doesn’t activate chemicals.
Cost of machinery and chemicals and prices received for farm commodities.
I lived in western South Dakota during the 30s when people did not use fallow as production wasvery little. Now better machinery allows fallow use but strictly manages wind erosion. Only fallowallows 40-50 bushel per acre of wheat. Demand that strips be drawn east and west to counternorthwest winds.
Cost is way too high for return for me. I’ve tried highering /hiring my no-till without success.
45
We have been using no-till for 12-15 years. Seems this survey is a little behind the times. Enoughinformation is out there for people to use no-till. People should not have to be “assisted” financiallyfor that. Most of the problem with farmers not switching to no-till is because of the age of farmers. In our area, most of the young farmers use no-till. The old farmers have used tillage for so manyyears they probably wouldn’t change if the seed, equipment, and work was done for them using no-till. Look at the average of farmers today.
Too old to change.
No-till is not the magic bullet for everyone. Our land is poorly drained and this creates waterponding in wet conditions that delay planting. For me it is not conducive to covering large areas inshort amounts of time. For well drained land I believe it makes more sense.
I do no-till on about 1/3 to ½ my acres. I would like to see some common ground between the twosystems. Each has its own advantages. If we would be able to drain cropland this would change myattitude greatly. But this I see as almost impossible at this time.
No till holds moisture better and really increases yields in dry years--10 bushel more on beans.
“No-till” isn’t the proper term that applies to us--”minimum till” is the correct term. We spray withfallow master in the spring, then use conventional tillage after that, then spray the wheat, then spotspray the stubble.
The soil in our area is a dense clay. It sticks with you when it is wet and will set up like cementwhen left alone. It needs to be worked up and with some power to open it up so the wheat can growdown through. The trick is to accomplish that without losing all of the cover and MINIMUM TILLhelps accomplish this.
My reasons for not using no-till in our operation: 1) No-till requires row crops for rotation,investment in row crop machinery and no-till drills is not feasible, we have neither. 2) Fallow isnecessary in our county due to average rainfall. I have questions about no-till fallow (diseaseproblems, scab, tanspot, etc.). I feel our practice of minimum till fallow (chemical and machine)plus strips, plus alfalfa rotations has done well conserving our soil. I am not convinced no till willbetter it.
The type of soil I have and the cost of new equipment.
I have been told no till doesn’t work on our type of ground. You also have to depend on chemicalsto control all weeds and grass. It puts small farmers out for the cost of machinery. The guys over60 years old aren’t considering change. The guys just hanging in there can’t afford to switch. Thatleaves a small number of people who would consider the change.The people paying rent for land don’t know if they can keep it because of higher rent and due to the
46
death of a landlord.The government payments are all that keep a farmer going. If that changes, it’s going to put a lot ofpeople out of business. The younger guys are considering other things to do than buy machinerysince the number of farmers is going down.
The ground doesn’t warm up fast enough in the spring for no-tilling. The weeds seem to heat thecrops up. But it’s still the big cost of the machinery you need to no-till. If I was operating bigger,it wouldn’t be so bad.
Farming is now geared for the big guy, not afraid to borrow big money.
Did not want to buy more equipment for short term. What I can’t handle alone is rented out, whichis all no till.
I think on a dry year the no till system shines. On a wet year the ground doesn’t dry out and you haveto buy other equipment to dry the ground out.
Sometimes it’s too wet and mucky to no till. I’ve found there is not a yield advantage.
Tillage results in an excellent seed bed and gives the best emergence of more of the seed.
We no-till corn into soybean stubble. We disc cornstalks once in the spring before planting soybeanswith a no-till drill.
Wet heavy soils warm better, and can be planted earlier for higher yielding corn and beans ifconventional tilled.
I don’t like that idea that the no-till system mandates an increased usage of chemicals.
The past three years, the winter wheat stubble was too wet to plant.
I farm in NE South Dakota. No-till works great planting soybeans in corn residue. Our soils staytoo cool, too long for no-till corn and wheat. I have seen wheat losses due to soil microorganismsover powering weak wheat plants.
They put industrial wastes into fertilizer because it’s so toxic and so much of it: 600 companies in44 states shipped 69 kinds of toxic wastes like methanol, lead, cadmium, arsenic and dioxin tofertilizer companies! 271 million pounds from 1990-1995 alone! It’s probably a lot more pounds anda lot more toxic now than a decade ago! By forcing (cramming down our throats) your agenda (no-till) you DENR and SCACD are pushing more salt and highly toxic wastes into our soil, our water,our air, our food and our children! WHY? I answered your questions. I wish you would answermine.