Embed Size (px)
Citation preview
Nov 18, 2020 WTI Crude (CL) Weekly MACD Trying to Positively Cross Join the world's largest asset manager and 2 of the world's 5 largest (and 5 of the 10 largest) hedge funds by AUM as daily readers of Tradable Patterns' technical analysis. As seen on Bloomberg, Refinitiv, Factset and Interactive Brokers, readers include global top 10 investment banks. If you represent an institutional investor or potential distribution partner, write to [email protected] to request Bloomberg, Refinitiv and Factset readership reports. As seen on
Posted by Darren Chu, CFA Founder Tradable Patterns
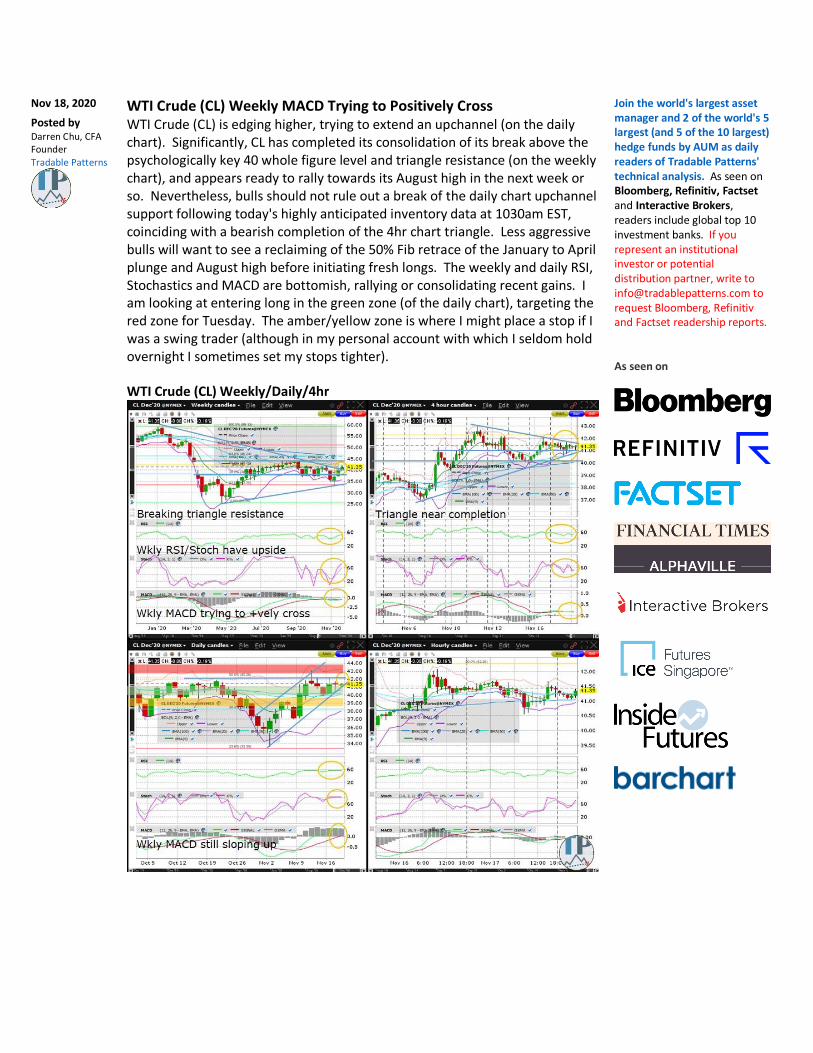
WTI Crude (CL) is edging higher, trying to extend an upchannel (on the daily chart). Significantly, CL has completed its consolidation of its break above the psychologically key 40 whole figure level and triangle resistance (on the weekly chart), and appears ready to rally towards its August high in the next week or so. Nevertheless, bulls should not rule out a break of the daily chart upchannel support following today's highly anticipated inventory data at 1030am EST, coinciding with a bearish completion of the 4hr chart triangle. Less aggressive bulls will want to see a reclaiming of the 50% Fib retrace of the January to April plunge and August high before initiating fresh longs. The weekly and daily RSI, Stochastics and MACD are bottomish, rallying or consolidating recent gains. I am looking at entering long in the green zone (of the daily chart), targeting the red zone for Tuesday. The amber/yellow zone is where I might place a stop if I was a swing trader (although in my personal account with which I seldom hold overnight I sometimes set my stops tighter). WTI Crude (CL) Weekly/Daily/4hr

Silver (SI) Weekly/Daily/4hr Silver (SI) is edging lower going into the European morning, increasingly vulnerable as it tests triangle support (on the 4hr chart). Significantly, SI appears poised to retest upchannel support (on the weekly chart) and the 38.2% Fib retrace of the March to August rally. Before bulls get excited, they'll want to see SI reclaim the November high. Congratulations to readers who heeded the warning August 5th of SI's overbought conditions. The weekly MACD and daily Stochastics are still downsloping, weighing on the weekly RSI and Stochastics, and suggesting any rally will have a difficult time extending more than a day. I am looking at entering long in the green zone (of the daily chart), targeting the red zone for Tuesday. The amber/yellow zone is where I might place a stop if I was a swing trader (although in my personal account with which I seldom hold overnight I sometimes set my stops tighter).

GBPUSD Weekly/Daily/4hr The GBPUSD is trying to form its 4th straight green daily candle, testing ascending triangle resistance (on the 4hr chart). Significantly, any clean break above the 4hr chart ascending triangle resistance would suggest a retest of last Friday's Gravestone and last week's weekly Gravestone high in the several days that follow. Although some USD pairs within my Watchlist (with the USD in the numerator) have shown early efforts in recent weeks at forming a multi-month bottom, the GBPUSD continues to exhibit momentum hinting of a retest of the 2020 high before year end. The weekly, daily and 4hr RSI, Stochastics and MACD are bottomish, rallying or consolidating recent gains. I will look to go long in the green zone (of the daily chart), targeting the red zone for Tuesday. The amber/yellow zone is where I might place a stop if I was a swing trader (although in my personal account with which I seldom hold overnight I sometimes set my stops tighter).
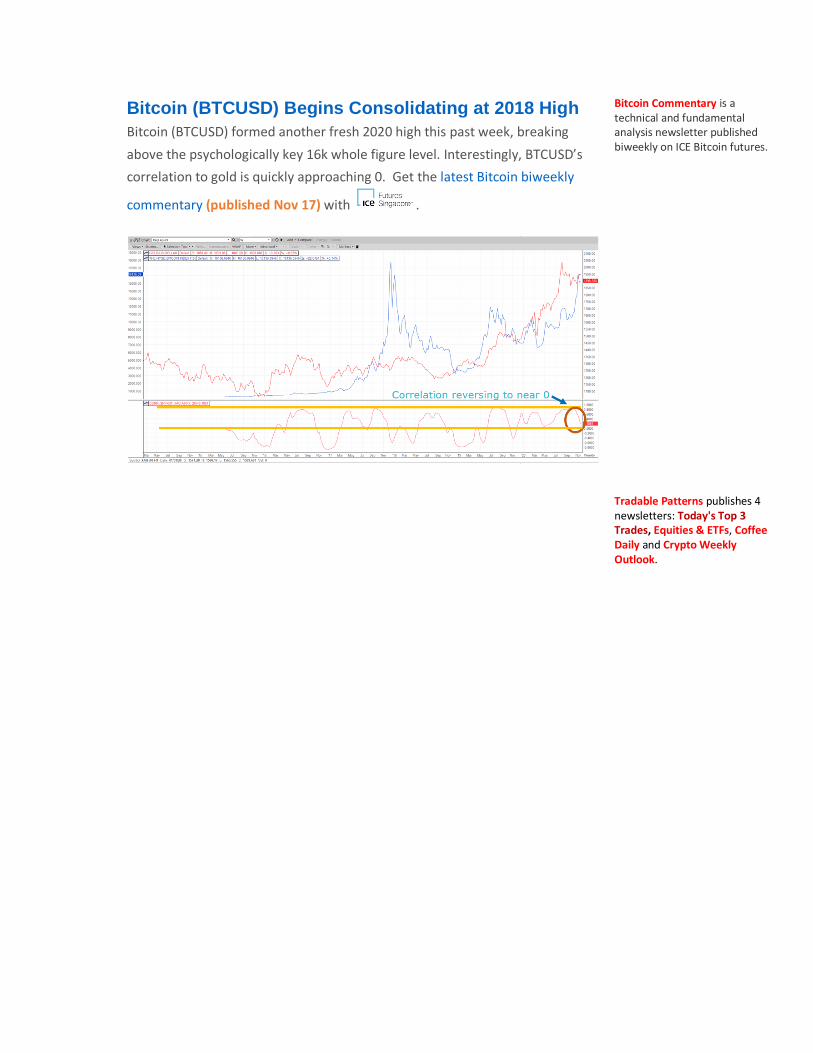
Bitcoin (BTCUSD) Begins Consolidating at 2018 High
Bitcoin (BTCUSD) formed another fresh 2020 high this past week, breaking
above the psychologically key 16k whole figure level. Interestingly, BTCUSD’s
correlation to gold is quickly approaching 0. Get the latest Bitcoin biweekly
commentary (published Nov 17) with .
Bitcoin Commentary is a technical and fundamental analysis newsletter published biweekly on ICE Bitcoin futures.
Tradable Patterns publishes 4 newsletters: Today's Top 3 Trades, Equities & ETFs, Coffee Daily and Crypto Weekly Outlook.

Cross Asset Year End Technical Analysis Webinar
Date: Dec 1, 2020 Tues 10am EST
Host: Interactive Brokers
As this eventful year comes to an end, traders are looking ahead to 2021 with
some economies expected to reopen, while others remain closed. Given some
financial industry titans were caught off guard in 2020 by not anticipating the
March global equities selloff, and more than a few missing the record breaking
gains since, traders have increasingly asked how they could have better
predicted either move. To cut through some of the media noise around the
impact of Covid-19, Tradable Patterns’ Darren Chu will comment on potential
trend reversal and momentum opportunities going into the new year. Darren
will apply technical analysis to the monthly and weekly charts of the most
widely traded markets in his futures and FX Watchlist, as well as to Bitcoin and
a basket of US mid and large cap equities. The audience will have an assumed
intermediate level understanding for technical analysis, futures, FX, Bitcoin and
equities.
Free Registration

Bitcoin/DeFi Webinar Now Available
Honoured to share the stage with Apollo Capital and Intercontinental Exchange
in discussing what DeFi’s tremendous growth means for Bitcoin and
broader crypto adoption.

Crypto Weekly Outlook
Free Subscribers have access to content like Sep 20, 2020’s 26 pg report preview
Crypto Weekly Outlook covers crypto industry fundamentals and technicals/fundamentals Sundays on Bitcoin, Ethereum and Ripple.

Today’s Top 3 Trades
Free Subscribers have access to content like Sep 1, 2020’s report’s preview
Today's Top 3 Trades offers technical analysis on a subset of 3 CME/ICE commodity/index futures or spot FX markets (with coverage for 2 markets from a designated asset class(es) for each weekday as seen in the Watchlist), plus the top trade idea for the day from any asset class. All 3 markets covered are selected based on their likelihood to exhibit trend reversal or continuation during the week that begins on the day of coverage, based on technical analysis and news flow. For instance, Monday coverage is on 2 Agris (and potentially 1 Index), while Tuesdays are devoted to 2 Indices (and potentially 1 Soft).

Equities & ETFs Latest trades published for Premium Members Nov 11th.
Equities & ETFs has taken on a new format where it is now an Entries/Exits service inspired by technical analysis on a collection of equities and ETFs. The 25 equities and ETFs initially profiled for their beaten down, trend reversal potential, between April 17 to May 22, 2020, have mostly ran up tremendously since then, and are assumed to be closed trades as of June 10th using the day's opening price. Congratulations to all Premium Members who profited from these long equity/ETF ideas soon after they were initially profiled. I will look to explore new long/short trade ideas on Equities & ETFs with Premium Members with a target of 5 multi-week to multi-month swing trades each month. Premium Members also have access to monthly and weekly chart technical analysis for 5 Equity/ETF markets each Saturday.

Coffee Daily
Get your coffee today? You can now
enjoy your brew with Coffee Daily -
Tradable Patterns' Arabica and
Robusta Coffee Futures technical
analysis newsletter, published
Monday to Friday before the London
open. Write
to [email protected] for
pricing details and sample reports as
of the July 13 launch, illustrating how
the massive moves since were
hinted through pattern recognition.
Coffee Daily is a technical analysis newsletter published weekdays on ICE Arabica & Robusta Coffee futures.
For less experienced traders, tutorials and workshops are offered online and throughout Southeast Asia. Tradable Patterns content does not constitute an advisory and does not make recommendations, but can supplement your own analysis. Please do your own due diligence ahead of any trades.


![What's the difference between WTI and Brent Crude Oil? [PPT]](https://img.pdfslide.net/doc/110x75/589ff76a1a28ab46598b5a77/whats-the-difference-between-wti-and-brent-crude-oil-ppt.jpg)