Embed Size (px)
DESCRIPTION
asd
Citation preview
lable at ScienceDirect
Journal of Food Engineering 183 (2016) 9e15
Contents lists avai
Journal of Food Engineering
journal homepage: www.elsevier .com/locate/ j foodeng
Novel 2D and 3D imaging of internal aerated structure ofultrasonically treated foams and cakes using X-ray tomography andX-ray microtomography
M.C. Tan a, N.L. Chin a, *, Y.A. Yusof a, J. Abdullah b
a Department of Process and Food Engineering, Faculty of Engineering, Universiti Putra Malaysia, 43400 UPM Serdang, Selangor, Malaysiab Plant Assessment Technology Group, Malaysian Nuclear Agency (Nuclear Malaysia), Bangi, 43000 Kajang, Selangor, Malaysia
a r t i c l e i n f o
Article history:Received 20 August 2015Received in revised form5 March 2016Accepted 20 March 2016Available online 21 March 2016
Keywords:X-ray microtomographyX-ray tomography2D image3D imageAerated foamCake
* Corresponding author.E-mail address: [email protected] (N.L. Chin).
http://dx.doi.org/10.1016/j.jfoodeng.2016.03.0080260-8774/© 2016 The Authors. Published by Elsevier
a b s t r a c t
The aerated structure of ultrasound treated foams and its resulted cake structures were examined usingX-ray tomography and X-ray microtomography, leading to highly contrasted two-dimensional (2D) andthree-dimensional (3D) images. Through these imaging techniques and software approaches, the effectof ultrasound treatment on the bubble size distribution was distinguished clearly. Microbubbles in foamwhich were in the size range of 0e0.00125 mm3 and in cakes which were in the range of 0e1 mm2
increased by 48% and 29% respectively after ultrasonic treatment at a frequency of 20 kHz.© 2016 The Authors. Published by Elsevier Ltd. This is an open access article under the CC BY-NC-ND
license (http://creativecommons.org/licenses/by-nc-nd/4.0/).
1. Introduction
Imaging is one of the direct methods to visualize and analyzebubbles or cells matrix in food products. Traditionally, bubble sizesin cake batter have been examined by taking photographs ofaerated batter spread out on a thin film using microscope-linkedcamera (Niranjan and Silva, 2008; Sahi and Alava, 2003) or tintedcross sections of cake samples at 5 mm thickness with black oil-based ink delineating pore walls using a digital camera (Barrettand Ross, 1990; Kocer et al., 2007; Lange et al., 1994; Smolarzet al., 1989). The photographs were analyzed using imaging soft-ware. The three-dimensional structure was then drawn based onthe assumed symmetrical two-dimensional images. This imagingtechnique is a destructive method and it also arises problems ingenerating a sharp image due to inaccurate measurement of thewalls and curvature effects (Niranjan and Sahu, 2009; Niranjan andSilva, 2007). As such, bubble size distribution is difficult to bemeasured and analyzed (Niranjan and Silva, 2007), especially withthe traditional imaging method. The poorly understood aerated
Ltd. This is an open access article u
foods' structures, however, did not stop the evolutionary foodmanufacturers from seeking to exploit the versatility of bubbles as afood ingredient (Campbell and Mougeot, 1999). Air is an importantingredient in aerated foods such as beverages, baked, dairy, egg andconfectionery products to enhance the appearance, texture, anddigestibility of the food products (Campbell and Mougeot, 1999).For bakery products, air attribution has a significant influence onthe quality of the final product because the cells in the final prod-ucts are originated as bubbles in the batter during the mixing stage,and that integrity of air cells would determine the volume of thefinal products (Edoura-Gaena et al., 2007).
The rapid developments in technology have improved thosetraditional imaging methods into more effective and accurate ones.Today, information about microstructure of food products and in-gredients can be obtained using various imaging techniques such asbright-field, polarizing and fluorescence light microscopy, confocalscanning laser microscopy and electron microscopy. A relativelynew technique, X-ray tomography and more advanced X-raymicrotomography can probe the microstructure of samples non-invasively up to a few millimeters and down to few micrometersof resolution, the advantages also include observations underenvironmental conditions without sample-disturbing preparationswhich occur in the fluorescence light microscopy and electron
nder the CC BY-NC-ND license (http://creativecommons.org/licenses/by-nc-nd/4.0/).
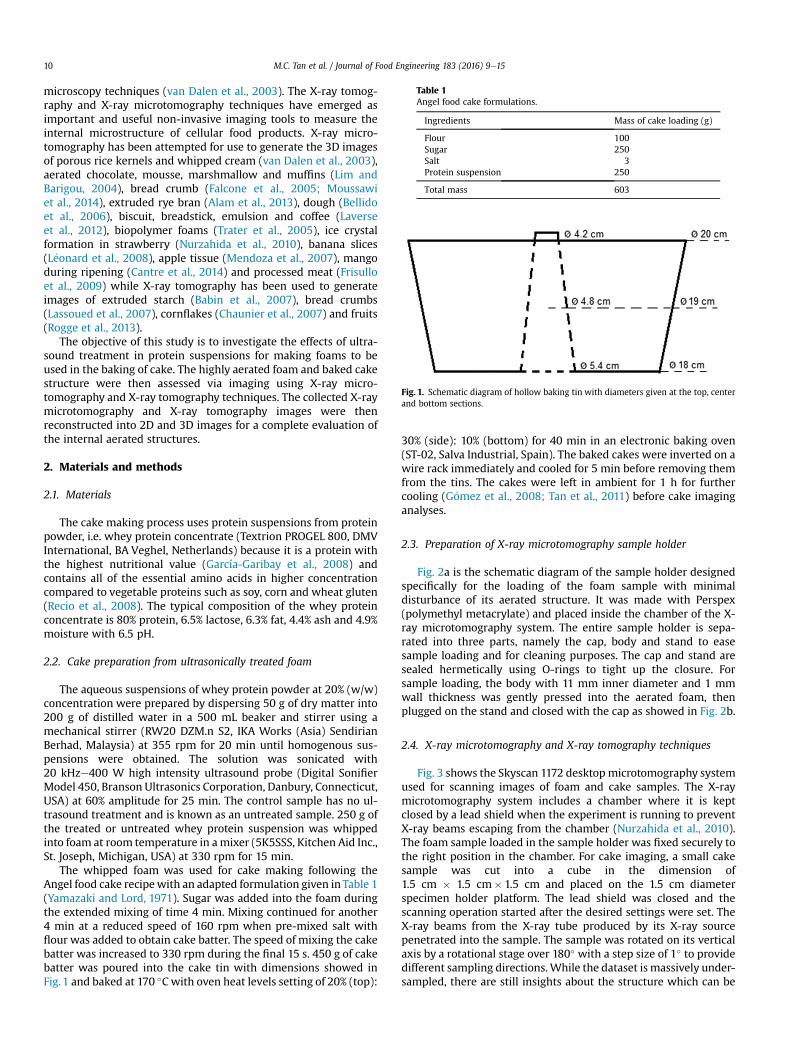
Table 1Angel food cake formulations.
Ingredients Mass of cake loading (g)
Flour 100Sugar 250Salt 3Protein suspension 250
Total mass 603
Fig. 1. Schematic diagram of hollow baking tin with diameters given at the top, centerand bottom sections.
M.C. Tan et al. / Journal of Food Engineering 183 (2016) 9e1510
microscopy techniques (van Dalen et al., 2003). The X-ray tomog-raphy and X-ray microtomography techniques have emerged asimportant and useful non-invasive imaging tools to measure theinternal microstructure of cellular food products. X-ray micro-tomography has been attempted for use to generate the 3D imagesof porous rice kernels and whipped cream (van Dalen et al., 2003),aerated chocolate, mousse, marshmallow and muffins (Lim andBarigou, 2004), bread crumb (Falcone et al., 2005; Moussawiet al., 2014), extruded rye bran (Alam et al., 2013), dough (Bellidoet al., 2006), biscuit, breadstick, emulsion and coffee (Laverseet al., 2012), biopolymer foams (Trater et al., 2005), ice crystalformation in strawberry (Nurzahida et al., 2010), banana slices(L�eonard et al., 2008), apple tissue (Mendoza et al., 2007), mangoduring ripening (Cantre et al., 2014) and processed meat (Frisulloet al., 2009) while X-ray tomography has been used to generateimages of extruded starch (Babin et al., 2007), bread crumbs(Lassoued et al., 2007), cornflakes (Chaunier et al., 2007) and fruits(Rogge et al., 2013).
The objective of this study is to investigate the effects of ultra-sound treatment in protein suspensions for making foams to beused in the baking of cake. The highly aerated foam and baked cakestructure were then assessed via imaging using X-ray micro-tomography and X-ray tomography techniques. The collected X-raymicrotomography and X-ray tomography images were thenreconstructed into 2D and 3D images for a complete evaluation ofthe internal aerated structures.
2. Materials and methods
2.1. Materials
The cake making process uses protein suspensions from proteinpowder, i.e. whey protein concentrate (Textrion PROGEL 800, DMVInternational, BA Veghel, Netherlands) because it is a protein withthe highest nutritional value (García-Garibay et al., 2008) andcontains all of the essential amino acids in higher concentrationcompared to vegetable proteins such as soy, corn and wheat gluten(Recio et al., 2008). The typical composition of the whey proteinconcentrate is 80% protein, 6.5% lactose, 6.3% fat, 4.4% ash and 4.9%moisture with 6.5 pH.
2.2. Cake preparation from ultrasonically treated foam
The aqueous suspensions of whey protein powder at 20% (w/w)concentration were prepared by dispersing 50 g of dry matter into200 g of distilled water in a 500 mL beaker and stirrer using amechanical stirrer (RW20 DZM.n S2, IKA Works (Asia) SendirianBerhad, Malaysia) at 355 rpm for 20 min until homogenous sus-pensions were obtained. The solution was sonicated with20 kHze400 W high intensity ultrasound probe (Digital SonifierModel 450, Branson Ultrasonics Corporation, Danbury, Connecticut,USA) at 60% amplitude for 25 min. The control sample has no ul-trasound treatment and is known as an untreated sample. 250 g ofthe treated or untreated whey protein suspension was whippedinto foam at room temperature in amixer (5K5SSS, Kitchen Aid Inc.,St. Joseph, Michigan, USA) at 330 rpm for 15 min.
The whipped foam was used for cake making following theAngel food cake recipewith an adapted formulation given in Table 1(Yamazaki and Lord, 1971). Sugar was added into the foam duringthe extended mixing of time 4 min. Mixing continued for another4 min at a reduced speed of 160 rpm when pre-mixed salt withflour was added to obtain cake batter. The speed of mixing the cakebatter was increased to 330 rpm during the final 15 s. 450 g of cakebatter was poured into the cake tin with dimensions showed inFig. 1 and baked at 170 �Cwith oven heat levels setting of 20% (top):
30% (side): 10% (bottom) for 40 min in an electronic baking oven(ST-02, Salva Industrial, Spain). The baked cakes were inverted on awire rack immediately and cooled for 5 min before removing themfrom the tins. The cakes were left in ambient for 1 h for furthercooling (G�omez et al., 2008; Tan et al., 2011) before cake imaginganalyses.
2.3. Preparation of X-ray microtomography sample holder
Fig. 2a is the schematic diagram of the sample holder designedspecifically for the loading of the foam sample with minimaldisturbance of its aerated structure. It was made with Perspex(polymethyl metacrylate) and placed inside the chamber of the X-ray microtomography system. The entire sample holder is sepa-rated into three parts, namely the cap, body and stand to easesample loading and for cleaning purposes. The cap and stand aresealed hermetically using O-rings to tight up the closure. Forsample loading, the body with 11 mm inner diameter and 1 mmwall thickness was gently pressed into the aerated foam, thenplugged on the stand and closed with the cap as showed in Fig. 2b.
2.4. X-ray microtomography and X-ray tomography techniques
Fig. 3 shows the Skyscan 1172 desktop microtomography systemused for scanning images of foam and cake samples. The X-raymicrotomography system includes a chamber where it is keptclosed by a lead shield when the experiment is running to preventX-ray beams escaping from the chamber (Nurzahida et al., 2010).The foam sample loaded in the sample holder was fixed securely tothe right position in the chamber. For cake imaging, a small cakesample was cut into a cube in the dimension of1.5 cm � 1.5 cm� 1.5 cm and placed on the 1.5 cm diameterspecimen holder platform. The lead shield was closed and thescanning operation started after the desired settings were set. TheX-ray beams from the X-ray tube produced by its X-ray sourcepenetrated into the sample. The sample was rotated on its verticalaxis by a rotational stage over 180� with a step size of 1� to providedifferent sampling directions.While the dataset is massively under-sampled, there are still insights about the structure which can be
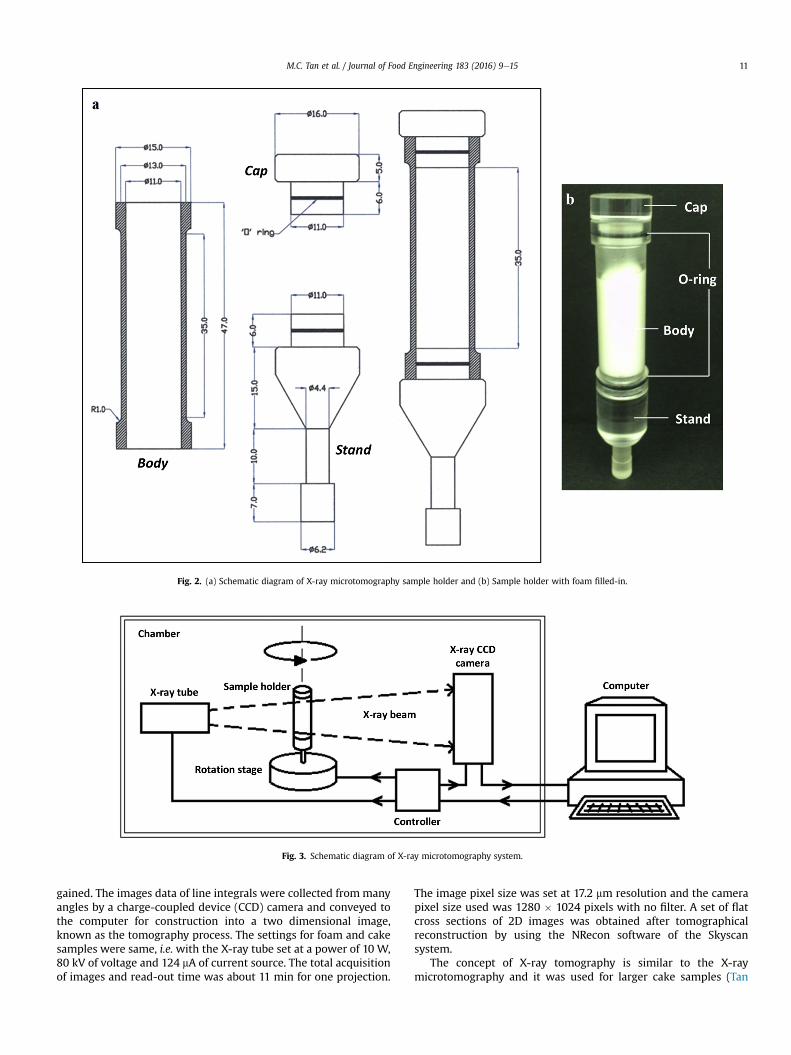
Fig. 2. (a) Schematic diagram of X-ray microtomography sample holder and (b) Sample holder with foam filled-in.
Fig. 3. Schematic diagram of X-ray microtomography system.
M.C. Tan et al. / Journal of Food Engineering 183 (2016) 9e15 11
gained. The images data of line integrals were collected frommanyangles by a charge-coupled device (CCD) camera and conveyed tothe computer for construction into a two dimensional image,known as the tomography process. The settings for foam and cakesamples were same, i.e. with the X-ray tube set at a power of 10 W,80 kV of voltage and 124 mA of current source. The total acquisitionof images and read-out time was about 11 min for one projection.
The image pixel size was set at 17.2 mm resolution and the camerapixel size used was 1280 � 1024 pixels with no filter. A set of flatcross sections of 2D images was obtained after tomographicalreconstruction by using the NRecon software of the Skyscansystem.
The concept of X-ray tomography is similar to the X-raymicrotomography and it was used for larger cake samples (Tan
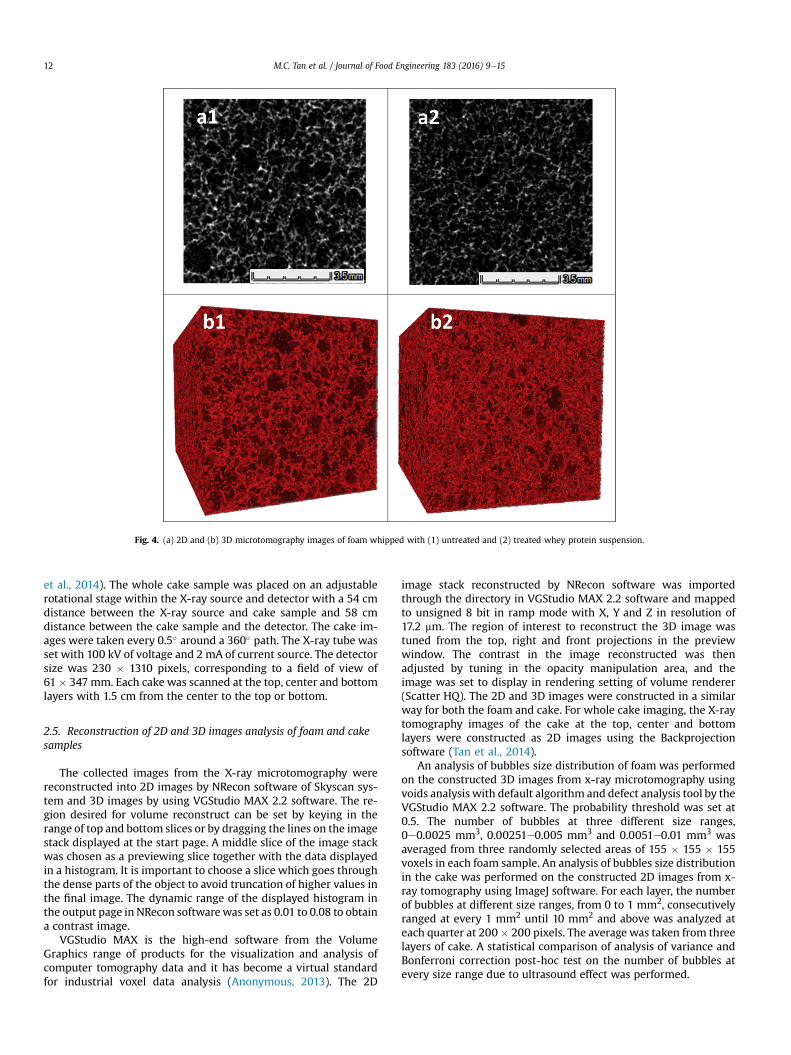
Fig. 4. (a) 2D and (b) 3D microtomography images of foam whipped with (1) untreated and (2) treated whey protein suspension.
M.C. Tan et al. / Journal of Food Engineering 183 (2016) 9e1512
et al., 2014). The whole cake sample was placed on an adjustablerotational stage within the X-ray source and detector with a 54 cmdistance between the X-ray source and cake sample and 58 cmdistance between the cake sample and the detector. The cake im-ages were taken every 0.5� around a 360� path. The X-ray tube wasset with 100 kV of voltage and 2 mA of current source. The detectorsize was 230 � 1310 pixels, corresponding to a field of view of61� 347 mm. Each cake was scanned at the top, center and bottomlayers with 1.5 cm from the center to the top or bottom.
2.5. Reconstruction of 2D and 3D images analysis of foam and cakesamples
The collected images from the X-ray microtomography werereconstructed into 2D images by NRecon software of Skyscan sys-tem and 3D images by using VGStudio MAX 2.2 software. The re-gion desired for volume reconstruct can be set by keying in therange of top and bottom slices or by dragging the lines on the imagestack displayed at the start page. A middle slice of the image stackwas chosen as a previewing slice together with the data displayedin a histogram. It is important to choose a slice which goes throughthe dense parts of the object to avoid truncation of higher values inthe final image. The dynamic range of the displayed histogram inthe output page in NRecon softwarewas set as 0.01 to 0.08 to obtaina contrast image.
VGStudio MAX is the high-end software from the VolumeGraphics range of products for the visualization and analysis ofcomputer tomography data and it has become a virtual standardfor industrial voxel data analysis (Anonymous, 2013). The 2D
image stack reconstructed by NRecon software was importedthrough the directory in VGStudio MAX 2.2 software and mappedto unsigned 8 bit in ramp mode with X, Y and Z in resolution of17.2 mm. The region of interest to reconstruct the 3D image wastuned from the top, right and front projections in the previewwindow. The contrast in the image reconstructed was thenadjusted by tuning in the opacity manipulation area, and theimage was set to display in rendering setting of volume renderer(Scatter HQ). The 2D and 3D images were constructed in a similarway for both the foam and cake. For whole cake imaging, the X-raytomography images of the cake at the top, center and bottomlayers were constructed as 2D images using the Backprojectionsoftware (Tan et al., 2014).
An analysis of bubbles size distribution of foam was performedon the constructed 3D images from x-ray microtomography usingvoids analysis with default algorithm and defect analysis tool by theVGStudio MAX 2.2 software. The probability threshold was set at0.5. The number of bubbles at three different size ranges,0e0.0025 mm3, 0.00251e0.005 mm3 and 0.0051e0.01 mm3 wasaveraged from three randomly selected areas of 155 � 155 � 155voxels in each foam sample. An analysis of bubbles size distributionin the cake was performed on the constructed 2D images from x-ray tomography using ImageJ software. For each layer, the numberof bubbles at different size ranges, from 0 to 1 mm2, consecutivelyranged at every 1 mm2 until 10 mm2 and above was analyzed ateach quarter at 200� 200 pixels. The average was taken from threelayers of cake. A statistical comparison of analysis of variance andBonferroni correction post-hoc test on the number of bubbles atevery size range due to ultrasound effect was performed.
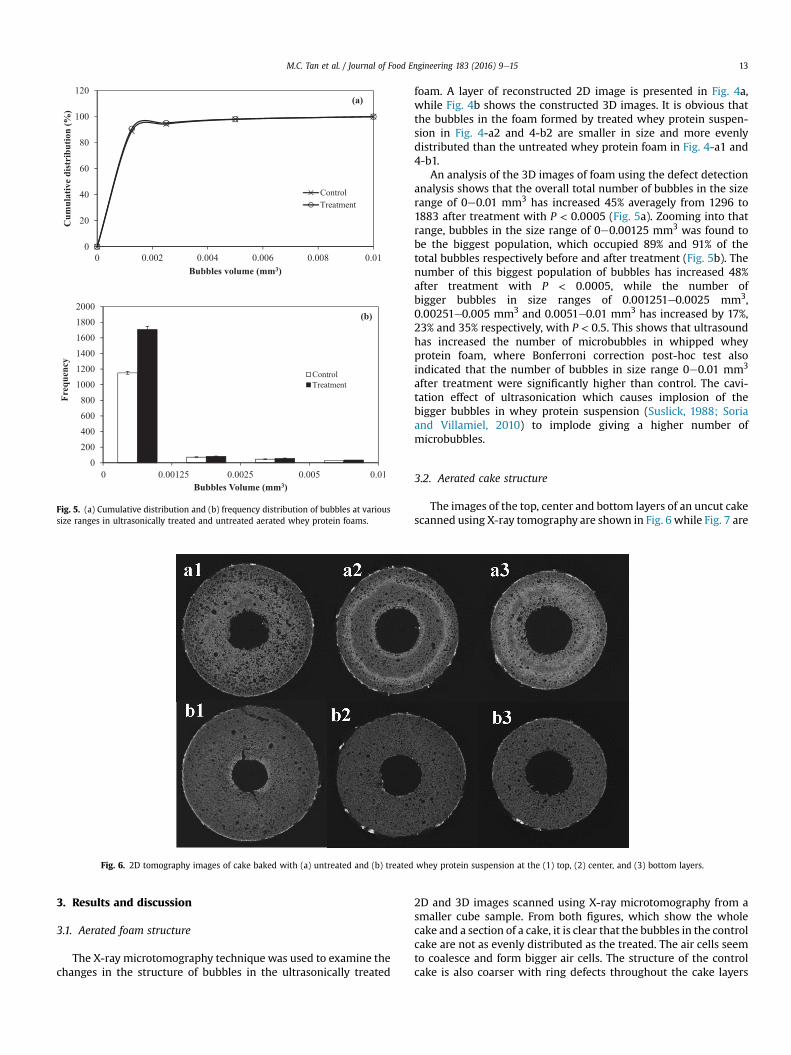
Fig. 5. (a) Cumulative distribution and (b) frequency distribution of bubbles at varioussize ranges in ultrasonically treated and untreated aerated whey protein foams.
Fig. 6. 2D tomography images of cake baked with (a) untreated and (b) treated whey protein suspension at the (1) top, (2) center, and (3) bottom layers.
M.C. Tan et al. / Journal of Food Engineering 183 (2016) 9e15 13
3. Results and discussion
3.1. Aerated foam structure
The X-ray microtomography technique was used to examine thechanges in the structure of bubbles in the ultrasonically treated
foam. A layer of reconstructed 2D image is presented in Fig. 4a,while Fig. 4b shows the constructed 3D images. It is obvious thatthe bubbles in the foam formed by treated whey protein suspen-sion in Fig. 4-a2 and 4-b2 are smaller in size and more evenlydistributed than the untreated whey protein foam in Fig. 4-a1 and4-b1.
An analysis of the 3D images of foam using the defect detectionanalysis shows that the overall total number of bubbles in the sizerange of 0e0.01 mm3 has increased 45% averagely from 1296 to1883 after treatment with P < 0.0005 (Fig. 5a). Zooming into thatrange, bubbles in the size range of 0e0.00125 mm3 was found tobe the biggest population, which occupied 89% and 91% of thetotal bubbles respectively before and after treatment (Fig. 5b). Thenumber of this biggest population of bubbles has increased 48%after treatment with P < 0.0005, while the number ofbigger bubbles in size ranges of 0.001251e0.0025 mm3,0.00251e0.005 mm3 and 0.0051e0.01 mm3 has increased by 17%,23% and 35% respectively, with P < 0.5. This shows that ultrasoundhas increased the number of microbubbles in whipped wheyprotein foam, where Bonferroni correction post-hoc test alsoindicated that the number of bubbles in size range 0e0.01 mm3
after treatment were significantly higher than control. The cavi-tation effect of ultrasonication which causes implosion of thebigger bubbles in whey protein suspension (Suslick, 1988; Soriaand Villamiel, 2010) to implode giving a higher number ofmicrobubbles.
3.2. Aerated cake structure
The images of the top, center and bottom layers of an uncut cakescanned using X-ray tomography are shown in Fig. 6 while Fig. 7 are
2D and 3D images scanned using X-ray microtomography from asmaller cube sample. From both figures, which show the wholecake and a section of a cake, it is clear that the bubbles in the controlcake are not as evenly distributed as the treated. The air cells seemto coalesce and form bigger air cells. The structure of the controlcake is also coarser with ring defects throughout the cake layers
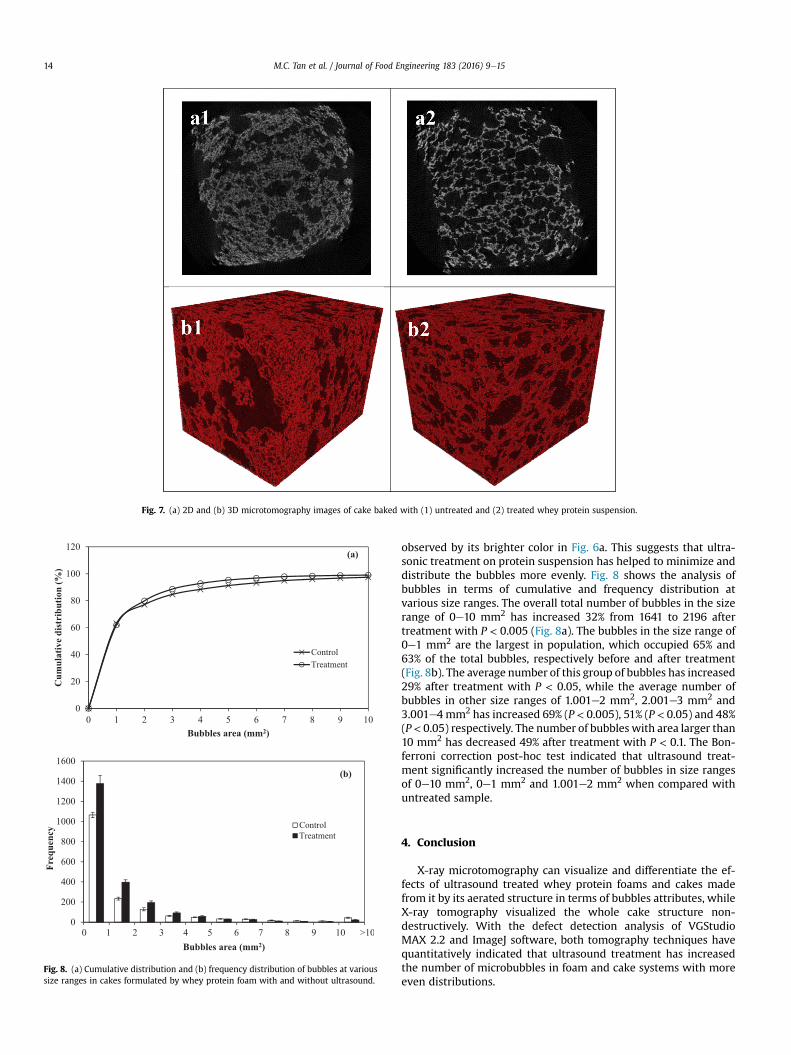
Fig. 7. (a) 2D and (b) 3D microtomography images of cake baked with (1) untreated and (2) treated whey protein suspension.
Fig. 8. (a) Cumulative distribution and (b) frequency distribution of bubbles at varioussize ranges in cakes formulated by whey protein foam with and without ultrasound.
M.C. Tan et al. / Journal of Food Engineering 183 (2016) 9e1514
observed by its brighter color in Fig. 6a. This suggests that ultra-sonic treatment on protein suspension has helped to minimize anddistribute the bubbles more evenly. Fig. 8 shows the analysis ofbubbles in terms of cumulative and frequency distribution atvarious size ranges. The overall total number of bubbles in the sizerange of 0e10 mm2 has increased 32% from 1641 to 2196 aftertreatment with P < 0.005 (Fig. 8a). The bubbles in the size range of0e1 mm2 are the largest in population, which occupied 65% and63% of the total bubbles, respectively before and after treatment(Fig. 8b). The average number of this group of bubbles has increased29% after treatment with P < 0.05, while the average number ofbubbles in other size ranges of 1.001e2 mm2, 2.001e3 mm2 and3.001e4mm2 has increased 69% (P < 0.005), 51% (P < 0.05) and 48%(P< 0.05) respectively. The number of bubbles with area larger than10 mm2 has decreased 49% after treatment with P < 0.1. The Bon-ferroni correction post-hoc test indicated that ultrasound treat-ment significantly increased the number of bubbles in size rangesof 0e10 mm2, 0e1 mm2 and 1.001e2 mm2 when compared withuntreated sample.
4. Conclusion
X-ray microtomography can visualize and differentiate the ef-fects of ultrasound treated whey protein foams and cakes madefrom it by its aerated structure in terms of bubbles attributes, whileX-ray tomography visualized the whole cake structure non-destructively. With the defect detection analysis of VGStudioMAX 2.2 and ImageJ software, both tomography techniques havequantitatively indicated that ultrasound treatment has increasedthe number of microbubbles in foam and cake systems with moreeven distributions.

M.C. Tan et al. / Journal of Food Engineering 183 (2016) 9e15 15
Acknowledgements
This work was supported by the Ministry of Education (MOE),Malaysia, through the Fundamental Research Grant Scheme (FRGS/2/2013/TK05/UPM/02/5). The authors would like to thank AlexCorporation (M) Sendirian Berhad, Selangor (Malaysia) forproviding VGStudio MAX 2.2 software for this research.
References
Alam, S.A., J€arvinen, J., Kirjoranta, S., Jouppila, K., Poutanen, K., Sozer, N., 2013. In-fluence of particle size reduction on structural and mechanical properties ofextruded rye bran. Food Bioprocess Technol. 1e13.
Anonymous. (2013). Volume Graphics. http://www.volumegraphics.com/en/products/vgstudio-max.html. (accessed 23.10.13).
Babin, P., Della Valle, G., Dendievel, R., Lourdin, D., Salvo, L., 2007. X-ray tomographystudy of the cellular structure of extruded starches and its relations withexpansion phenomenon and foam mechanical properties. Carbohydr. Polym. 68(2), 329e340.
Barrett, A.H., Ross, E.W., 1990. Correlation of extrudate infusibility with bulkproperties using image analysis. J. Food Sci. 55 (5), 1378e1379.
Bellido, G.G., Scanlon, M.G., Page, J.H., Hallgrimsson, B., 2006. The bubble size dis-tribution in wheat flour dough. Food Res. Int. 39 (10), 1058e1066.
Campbell, G.M., Mougeot, E., 1999. Creation and characterisation of aerated foodproducts. Trends Food Sci. Technol. 10 (9), 283e296.
Cantre, D., Herremans, E., Verboven, P., Ampofo-Asiama, J., Nicolai, B.M., 2014.Characterization of the 3-D microstructure of mango (Mangifera indica L. cv.Carabao) during ripening using X-ray computed microtomography. Innov. FoodSci. Emerg. Technol. http://dx.doi.org/10.1016/j.ifset.2013.12.008.
Chaunier, L., Della Valle, G., Lourdin, D., 2007. Relationships between texture, me-chanical properties and structure of cornflakes. Food Res. Int. 40 (4), 493e503.
Edoura-Gaena, R.B., Allais, I., Trystram, G., Gros, J.B., 2007. Influence of aerationconditions on physical and sensory properties of aerated cake batter and bis-cuits. J. Food Eng. 79 (3), 1020e1032.
Falcone, P.M., Baiano, A., Zanini, F., Mancini, L., Tromba, G., Dreossi, D.,Nobile, M.A.D., 2005. Three-dimensional quantitative analysis of bread crumbby X-ray microtomography. J. Food Sci. 70 (4), E265eE272.
Frisullo, P., Laverse, J., Marino, R., Nobile, M.D., 2009. X-ray computed tomographyto study processed meat microstructure. J. Food Eng. 94 (3), 283e289.
García-Garibay, M., Jim�enez-Guzm�an, J., Hern�andez-S�anchez, H., 2008. Whey pro-teins: bioengineering and health. In: Gutierrez-Lopez, G.F., Barbosa-Canovas, G.V., Welti-Chanes, J., Parada-Arias, E. (Eds.), Food Engineering: Inte-grated Approaches. Springer Science þ Business Media, LCC, New York, USA,pp. 415e430.
G�omez, M., Oliete, B., Rosell, C.M., Pando, V., Fern�andez, E., 2008. Studies on cakequality made of wheat-chickpea flour blends. LWT e Food Sci. Technol. 41 (9),1701e1709.
Kocer, D., Hicsasmaz, Z., Bayindirli, A., Katnas, S., 2007. Bubble and pore formation ofthe high-ratio cake formulation with polydextrose as a sugar- and fat-replacer.J. Food Eng. 78 (3), 953e964.
Lange, D.A., Jennings, H.M., Shah, S.P., 1994. Image analysis techniques for charac-terization of pore structure of cement-based materials. Cem. Concr. Res. 24 (5),841e853.
Lassoued, N., Babin, P., Della Valle, G., Devaux, M.F., R�eguerre, A.L., 2007. Gran-ulometry of bread crumb grain: contributions of 2D and 3D image analysis at
different scale. Food Res. Int. 40 (8), 1087e1097.Laverse, J., Frisullo, P., Conte, A., Nobile, M.A., 2012. X-ray microtomography for food
quality analysis. Food Ind. Process.-Methods Equip. 339e362.L�eonard, A., Blacher, S., Nimmol, C., Devahastin, S., 2008. Effect of far-infrared ra-
diation assisted drying on microstructure of banana slices: an illustrative use ofX-ray microtomography in microstructural evaluation of a food product. J. FoodEng. 85 (1), 154e162.
Lim, K.S., Barigou, M., 2004. X-ray micro-computed tomography of cellular foodproducts. Food Res. Int. 37 (10), 1001e1012.
Mendoza, F., Verboven, P., Mebatsion, H.K., Kerckhofs, G., Wevers, M., Nicolai, B.,2007. Three-dimensional pore space quantification of apple tissue using X-raycomputed microtomography. Planta 226 (3), 559e570.
Moussawi, A., Xu, J., Nouri, H., Guessasma, S., Lubineau, G., 2014. Volume digitalimage correlation to assess displacement field in compression loaded breadcrumb under X-ray microtomography. Innov. Food Sci. Emerg. Technol. http://dx.doi.org/10.1016/j.ifset.2014.02.002.
Niranjan, K., Silva, S.F.J., 2007. Bubble-containing foods. In: Aguilera, J.M., Lillford, P.J.(Eds.), Food Materials Science: Principle and Practice. Springer Science þBusiness Media, LCC, New York, USA, pp. 281e303.
Niranjan, K., Silva, S.F.J., 2008. Bubbles in foods: creating structure out of thin air. In:Gutierrez-Lopez, G.F., Barbosa-Canovas, G.V., Welti-Chanes, J., Parada-Arias, E.(Eds.), Food Engineering: Integrated Approaches. Springer Science þ BusinessMedia, LCC, New York, USA, pp. 183e192.
Niranjan, K., Sahu, J.K., 2009. Gas-liquid mixing. In: Cullen, P.J. (Ed.), Food Mixing:Principle and Applications. Wiley-Blackwell, USA, pp. 230e252.
Nurzahida, M.Z., Mimi Sakinah, A.M., Abdullah, J., 2010. Influence of thickness on icecrystal formation in strawberry during freeze-drying. J. Appl. Sci. 10 (21),2741e2744.
Recio, I., Ramos, M., Pilosof, A.M.R., 2008. Engineered food/protein structure andbioactive proteins and peptides from whey. In: Gutierrez-Lopez, G.F., Barbosa-Canovas, G.V., Welti-Chanes, J., Parada-Arias, E. (Eds.), Food Engineering: Inte-grated Approaches. Spinger Science þ Business Media, LCC, New York, USA,pp. 399e414.
Rogge, S., Beyene, S.D., Herremans, E., Hertog, M.L., Defraeye, T., Verboven, P.,Nicolai, B.M., 2013. A geometrical model generator for quasi-axisymmetricbiological products. Food Bioprocess Technol. 7 (6), 1783e1792.
Sahi, S.S., Alava, J.M., 2003. Functionality of emulsifiers in sponge cake production.J. Sci. Food Agric. 83 (14), 1419e1429.
Smolarz, A., Van Hecke, E., Bouvier, J.M., 1989. Computerized image analysis andtexture of extruded biscuits. J. Texture Stud. 20 (2), 223e234.
Soria, A.C., Villamiel, M., 2010. Effect of ultrasound on the technological propertiesand bioactivity of food: a review. Trends Food Sci. Technol. 21 (7), 323e331.
Suslick, K., 1988. Ultrasound: its Chemical, Physical and Biological Effects. VCHPublishers, New York.
Tan, M.C., Chin, N.L., Yusof, Y.A., 2011. Power ultrasound aided batter mixing forsponge cake batter. J. Food Eng. 104 (3), 430e437.
Tan, M.C., Chin, N.L., Yusof, Y.A., Taip, F.S., Abdullah, J., 2014. Improvement of egglesscake structure using ultrasonically treated whey protein. Food BioprocessTechnol. 1e10.
Trater, A.M., Alavi, S., Rizvi, S.S.H., 2005. Use of non-invasive X-ray micro-tomography for characterizing microstructure of extruded biopolymer foams.Food Res. Int. 38 (6), 709e719.
van Dalen, G., Blonk, H., van Aalst, H., Hendriks, C.L., 2003. 3-D imaging of foodsusing X-ray microtomograpghy. GIT Imaging Microsc. 3, 18e21.
Yamazaki, W.T., Lord, D.D., 1971. Soft wheat flour products. In: Pomeranz, Y. (Ed.),Wheat Chemistry Technology. American Association of Cereal Chemists,Incorporated, USA, pp. 743e776.