Embed Size (px)
Citation preview

Washington University in St. Louis Washington University in St. Louis
Washington University Open Scholarship Washington University Open Scholarship
Engineering and Applied Science Theses & Dissertations McKelvey School of Engineering
Winter 12-15-2015
Novel Applications of Electrostatic Precipitators in Coal - Biomass Novel Applications of Electrostatic Precipitators in Coal - Biomass
Combustion Systems Combustion Systems
He Jing Washington University in St. Louis
Follow this and additional works at: https://openscholarship.wustl.edu/eng_etds
Part of the Engineering Commons
Recommended Citation Recommended Citation Jing, He, "Novel Applications of Electrostatic Precipitators in Coal - Biomass Combustion Systems" (2015). Engineering and Applied Science Theses & Dissertations. 130. https://openscholarship.wustl.edu/eng_etds/130
This Dissertation is brought to you for free and open access by the McKelvey School of Engineering at Washington University Open Scholarship. It has been accepted for inclusion in Engineering and Applied Science Theses & Dissertations by an authorized administrator of Washington University Open Scholarship. For more information, please contact [email protected].

WASHINGTON UNIVERSITY IN ST. LOUIS
School of Engineering and Applied Science
Department of Energy, Environmental and Chemical Engineering
Dissertation Examination Committee:
Pratim Biswas, Chair
Richard Axelbaum
John Gleaves
Jung-Tsung Shen
Brent Williams
Ye Zhuang
Novel Applications of Electrostatic Precipitators in Coal - Biomass Combustion Systems
By
He Jing
A dissertation presented to the
Graduate School of Arts & Sciences
of Washington University in
partial fulfillment of the
requirements for the degree
of Doctor of Philosophy
December 2015
St. Louis, Missouri

© 2015, He Jing

ii
Contents
LIST OF FIGURES ...................................................................................................................... v
LIST OF TABLES ........................................................................................................................ x
ACKNOWLEDGMENTS ........................................................................................................... xi
ABSTRACT OF THE DISSERTATION................................................................................. xiv
CHAPTER 1. INTRODUCTION ................................................................................................ 1
1.1 Electricity generation based on coal combustion and pollutant emission from coal
combustion .............................................................................................................................. 2
1.2 Applications of electrostatic precipitators and other corona discharged based
technologies for exhaust gas treatment in coal combustion systems .................................... 10
1.3 Particle sampler based on electrostatic precipitation ...................................................... 13
1.4 Dissertation outlines........................................................................................................ 13
1.5 Reference ........................................................................................................................ 15
CHAPTER 2. ELEMENTAL MERCURY OXIDATION IN AN ELECTROSTATIC
PRECIPITATOR WITH IN SITU SOFT X-RAY IRRADIATION ...................................... 24
Abstract ................................................................................................................................. 25
2.1 Introduction ..................................................................................................................... 26
2.2 Experimental Section ...................................................................................................... 28
2.3 Results and Discussion ................................................................................................... 33
2.4 Conclusions ..................................................................................................................... 50
2.5 Nomenclature .................................................................................................................. 51
2.6 References ....................................................................................................................... 53
CHAPTER 3. SECONDARY AEROSOLS GENERATION IN AN ELECTROSTATIC
PRECIPITATOR DURING FLUE GAS TREATMENT ....................................................... 61
Abstract ................................................................................................................................. 62
3.1 Introduction ..................................................................................................................... 63

iii
3.2 Experimental Section ...................................................................................................... 64
3.3 Results and Discussion ................................................................................................... 69
3.4 Conclusions ..................................................................................................................... 81
3.5 References ....................................................................................................................... 83
CHAPTER 4. CAPTURE OF SUBMICROMETER PARTICLES WITH A
PRESSURIZED ELECTROSTATIC PRECIPITATOR ....................................................... 88
Abstract ................................................................................................................................. 89
4.1 Introduction ..................................................................................................................... 90
4.2 Experimental Section ...................................................................................................... 91
4.3 Results and Discussion ................................................................................................... 94
4.4 Conclusions ................................................................................................................... 111
4.5 References ..................................................................................................................... 113
CHAPTER 5. DEVELOPMENT OF A COMPACT ELECTROSTATIC
NANOPARTICLE SAMPLER FOR OFFLINE AEROSOL CHARACTERIZATION ... 117
Abstract ............................................................................................................................... 118
5.1 Introduction ................................................................................................................... 119
5.2 Sampler Design ............................................................................................................. 122
5.3 Experimental Setup and Data Analysis......................................................................... 123
5.4 Results and Discussion ................................................................................................. 128
5.5 Conclusions ................................................................................................................... 143
5.6 References ..................................................................................................................... 146
CHAPTER 6. CHARACTERIZATION OF SUBMICROMETER PARTICLES FROM
SAWDUST/COAL CO-FIRING IN A DROP-TUBE FURNACE ....................................... 150
Abstract ............................................................................................................................... 151
6.1 Introduction ................................................................................................................... 152
6.2 Experimental Section .................................................................................................... 154

iv
6.3 Results and Discussion ................................................................................................. 160
6.4 Conclusions ................................................................................................................... 172
6.5 References ..................................................................................................................... 174
CHAPTER 7. CONCLUSIONS ............................................................................................... 180
7.1 Elemental mercury oxidation in an electrostatic precipitator enhanced with in situ soft
X-ray irradiation (Chapter 2) .............................................................................................. 181
7.2 Secondary aerosols generation in an electrostatic precipitator during flue gas treatment
(Chapter 3) .......................................................................................................................... 182
7.3 Capture of submicrometer particles with a pressurized electrostatic precipitator (Chapter
4) ......................................................................................................................................... 182
7.4 Development of a compact electrostatic nanoparticle sampler for offline aerosol
characterization (Chapter 5)................................................................................................ 183
7.5 Characterization of submicrometer particles from sawdust/coal co-firing in a drop-tube
furnace (Chapter 6) ............................................................................................................. 184
7.6 Future work ................................................................................................................... 185
APPENDIX I. SUPPORTING MATERIALS FOR CHAPTER 2 ....................................... 187
APPENDIX II. SUPPORTING MATERIALS FOR CHAPTER 3 ..................................... 207
APPENDIX III. SUPPORTING MATERIALS FOR CHAPTER 4 .................................... 214
APPENDIX IV. SUPPORTING INFORMATION ON DETERMINATION OF THE
DESIGN PARAMETERS OF THE LAB-SCALE ESP ........................................................ 223
APPENDIX V. LIST OF PUBLICATIONS ........................................................................... 223
APPENDIX VI. LIST OF COURSES TAKEN...................................................................... 223

v
LIST OF FIGURES
Figure 1.1 Major ash particle formation mechanisms during coal combustion (adopted from Xu
et. al, 2011)...................................................................................................................................... 5
Figure 1.2 Proposed formation mechanisms of organic aerosols from coal combustion (adopted
from Wang et al. 2013) ................................................................................................................... 7
Figure 1.3 Principle of operation of the soft X-ray enhanced ESP for particle charging and
capture (adapted from Kulkarni et al., 2002) ................................................................................ 12
Figure 2.1 (a) Simulated flue gas experimental system (for experiments Set I to III). (b) Drop-
tube furnace experimental system (for experiments Set IV)......................................................... 30
Figure 2.2 Elemental mercury conversion efficiencies under various ESP voltages, with soft X-
ray corona (SXC) off and on (gas combination: 0.04 lpm O2, 0.12 lpm CO2, 0.84 lpm N2)........ 34
Figure 2.3 Schematic of ion and electron generation and movement in ESP coupled with soft X-
rays [the serial numbers correspond to the steps discussed in the text; (a) is for positive case, and
(b) is for negative case] ................................................................................................................. 37
Figure 2.4 Ozone generation from ESP under base condition (0.04 lpm O2, 0.12 lpm CO2, 0.84
lpm N2) .......................................................................................................................................... 39
Figure 2.5 Mercury conversion efficiencies by ESP and soft X-rays under single gas
environments (total flow rate: 1 lpm, ESP currents for various cases are above the bars, gas
combination: 4% O2, 12% CO2, 84% N2) ..................................................................................... 40
Figure 2.6 Electron density distributions in ESP at +10 kV and -10 kV, with and without soft X-
rays ................................................................................................................................................ 44
Figure 2.7 Particle size distributions of PRB coal combustion downstream of the ESP .............. 48
Figure 2.8 Elemental mercury conversion efficiencies by ESP and soft X-rays in practical flue
gas from coal combustion, with KI addition (200 ppm KI in China S03 coal) ............................ 49
Figure 3.1 Schematic of experimental setups: (a) ACERF pilot-scale combustion system and
particulate matter measurement instruments; (b) drop-tube furnace system (figure adapted from
Wang et al., 2013); (c) simulated flue gas system ........................................................................ 67
Figure 3.2 Penetrations of fly ash particles through ESP at ACERF pilot-scale system (for -10 kV
and +10 kV ESP voltages) ............................................................................................................ 71

vi
Figure 3.3 Particle size distributions of secondary aerosols formulated in the ESP during flue gas
treatment........................................................................................................................................ 73
Figure 3.4 Average mass spectra for particulate matter generated in the ESP: (a) mass spectrum
of secondary aerosols; (b) High resolution spectrum of organics................................................. 76
Figure 3.5 Schematic of the secondary aerosol formation process in the ESP ............................. 78
Figure 3.6 Size distributions of secondary aerosols under various conditions (a: SA size
distributions under different SO2 concentrations; b: SA size distributions under different water
contents; c: SA size distributions under different ESP voltages; d: SA size distributions under
different flow rates)....................................................................................................................... 79
Figure 4.1 Schematic of the experimental setup ........................................................................... 92
Figure 4.2 The relationship between ESP voltage and current under different gas pressures ...... 95
Figure 4.3 Particle penetrations through the ESP for NaCl particles of various sizes under
different gas pressures: (a) negative ESP; (1 atm case: ESP voltage -12.9 kV, current -500 μA; 2
atms case: voltage -16.7 kV, current -200 μA; 3 atms case: voltage -16.7 kV, current -20 μA;) (b)
positive ESP; (1 atm case: ESP voltage +12.9 kV, current +500 μA; 3 atms case: voltage +16.7
kV, current +20 μA) ...................................................................................................................... 98
Figure 4.4 Particle penetrations through the ESP for NaCl particles of various sizes under
different gas pressures but a fixed current: (a) negative ESP; (1 atm case: ESP voltage -8.9 kV,
current -20 μA; 2 atms case: voltage -12.9 kV, current -20 μA; 3 atms case: voltage -16.7 kV,
current -20 μA); (b) positive ESP; (1 atm case: ESP voltage +8.9 kV, current +20 μA; 2 atms
case: voltage +12.9 kV, current +20 μA; 3 atms case: voltage +16.7 kV, current +20 μA) ....... 100
Figure 4.5 The relationship between measured NaCl particle removal efficiencies and the
calculated values of the non-dimensional group from the modified Deutsch-Anderson equation:
(a) negative polarity; (b) positive polarity .................................................................................. 105
Figure 4.6 Charge indices of particles of various sizes under 1 atm, 2 atms, and 3 atms .......... 107
Figure 4.7 Particle penetrations through the ESP for fly ash particles of various sizes under
different gas pressures: (a) negative ESP; (1 atm case: ESP voltage -8.6 kV, current -20 μA; 2
atms case: voltage -12.8 kV, current -20 μA; 3 atms case: voltage -15.7 kV, current -20 μA;) (b)
positive ESP; (1 atm case: ESP voltage +8.3 kV, current +20 μA; 2 atms case: voltage +13.2 kV,
current +20 μA; 3 atms case: voltage +16.8 kV, current +20 μA) ............................................. 110
Figure 5.1 Schematic diagram of prototype compact electrostatic sampler ............................... 123
Figure 5.2 Experiment setup for the charger evaluation, measurement of particle collection
efficiency, and the fluorescence experiments ............................................................................. 124

vii
Figure 5.3 Collection efficiencies of neutralized and steady-state charge distribution NaCl
particles (aerosol/ion carrier flow rate ratio of 1.0; total flow rate of 1 lpm; collection stage
voltage of 4.5 kV) ....................................................................................................................... 129
Figure 5.4 Intrinsic and extrinsic charging efficiencies of NaCl particles (aerosol/ion carrier flow
rate ratio of 1.0; total flow rate of 1 lpm).................................................................................... 130
Figure 5.5 Collection efficiencies of NaCl particles at different aerosol/ion carrier flow rate ratio
(total flow rate of 1 lpm; collection stage voltage of 4.5 kV) ..................................................... 132
Figure 5.6 Collection efficiencies of NaCl particles at different total flow rates (aerosol/ion
carrier flow rate ratio of 1.0; collection stage voltage of 4.5 kV)............................................... 134
Figure 5.7 Collection efficiencies of NaCl particles at different collection stage voltages
(aerosol/ion carrier flow rate ratio of 1.0; total flow rate of 3 lpm)............................................ 135
Figure 5.8 (a) Collection efficiencies of NaCl particles at different collection stage voltages; (b)
Electrical mobility of NaCl particle (aerosol/ion carrier flow rate ratio of 1.0; total flow rate of 1
lpm) ............................................................................................................................................. 137
Figure 5.9 Particle deposition in the sampler.............................................................................. 138
Figure 5.10 Collection efficiencies of NaCl particles, oleic acid particles and PSL particles
(aerosol/ion carrier flow rate ratio of 1.0; total flow rate of 1 lpm; collection stage voltage of 4.5
kV) .............................................................................................................................................. 140
Figure 5.11 (a) Intrinsic and extrinsic charging efficiencies of oleic acid particles and NaCl
particles; (b) Average charges of oleic acid particles and NaCl particles (aerosol/ion carrier flow
rate ratio of 1.0; total flow rate of 1 lpm).................................................................................... 142
Figure 6.1 Schematic of the drop-tube furnace system and particulate matter measurement
instruments .................................................................................................................................. 155
Figure 6.2 Characterizations of particles from co-firing of PRB coal with sawdust, dedicated coal
and sawdust combustion: (a) size distribution; (b) elemental analysis; (c) average mass spectrum
..................................................................................................................................................... 162
Figure 6.3 Characterizations of particles from co-firing of Illinois No.6 coal with sawdust,
dedicated coal and sawdust combustion: (a) size distribution; (b) average mass spectrum ....... 166
Figure 6.4 Characterizations of particles from co-firing of PRB coal with sawdust (mass ratio:
85/15) under various temperatures: (a) size distribution; (b) average mass spectrum ............... 169

viii
Figure 6.5 Characterizations of particles from co-firing of PRB coal with sawdust (mass ratio:
85/15) under various sawdust moisture contents: (a) size distribution; (b) average mass spectrum
..................................................................................................................................................... 172
Figure A1.1 Configuration of studied electrostatic precipitator ................................................. 188
Figure A1.2 Current-voltage characteristics of ESP under base condition (0.04 lpm O2, 0.12 lpm
CO2, 0.84 lpm N2) ....................................................................................................................... 189
Figure A1.3 Mercury speciation of mercury treated by ESP and soft X-rays (gas combination:
0.04 lpm O2, 0.12 lpm CO2, 0.84 lpm N2) .................................................................................. 190
Figure A1.4 Ozone concentrations downstream of ESP in pure N2, CO2, or O2 ........................ 191
Figure A1.5 Elemental mercury conversions under various O2 concentrations (solid symbol,
mercury conversion; open symbol, current) (total flow rate: 1 lpm; CO2 flow rate: 0.12 lpm;
balanced with N2)........................................................................................................................ 192
Figure A1.6 Ozone concentrations downstream of the ESP under various O2 concentrations .. 193
Figure A1.7 Model geometry (cross section of ESP) ................................................................. 194
Figure A1.8 Particle size distributions of SiO2 particles downstream of the ESP: (a) SiO2; (b)
TiO2; (c) KI (high concentration case, 189.0 ppm atomization solution); (d) KI (low
concentration case, 18.9 ppm atomization solution)................................................................... 200
Figure A1.9 Elemental mercury conversions under two different residence time ..................... 201
Figure A1.10 Elemental mercury conversions with HCl in flue gas (gas combination: 0.04 lpm
O2, 0.12 lpm CO2, 0.84 lpm N2, 10 ppm HCl)............................................................................ 203
Figure A1.11 Elemental mercury conversions with SO2 in flue gas (gas combination: 0.04 lpm
O2, 0.12 lpm CO2, 0.84 lpm N2) ................................................................................................. 204
Figure A2.1 Configuration of the studied ESP ........................................................................... 207
Figure A2.2 Size distribution of the fly ash particles that challenged the studied ESP (ACERF
system, 6% O2 in the flue gas) .................................................................................................... 209
Figure A2.3 Size distribution of the secondary aerosols in the drop-tube furnace system (ESP
voltage -10 kV) ........................................................................................................................... 211
Figure A2.4 Average mass spectrum of aerosols downstream ESP with coal feeding but with
ESP off ........................................................................................................................................ 212
Figure A2.5 Current-voltage characteristics of the studied ESP (using air as feeding gas) ....... 213

ix
Figure A3.1 Configuration of the studied ESP ........................................................................... 214
Figure A3.2 Size distribution of the NaCl particles generated using atomizer under various
pressures...................................................................................................................................... 216
Figure A3.3 The relationship between measured NaCl particle removal efficiencies and the
calculated values of the non-dimensional group from Deutsch-Anderson equation: (a) negative
polarity; (b) positive polarity ...................................................................................................... 218
Figure A3.4 Relations between calculated penetration and voltage under different pressures (dp =
50, 100, 200, 300, 400, 500 nm, positive polarity case) ......................................................... 22019
Figure A3.5 Size distribution of the fly ash particles from the drop-tube furnace under various
pressures...................................................................................................................................... 220

x
LIST OF TABLES
Table 2.1 Test plan........................................................................................................................ 32
Table 2.2 Elemental mercury conversion efficiencies under SiO2, TiO2, and KI particle injection
(gas combination: 0.04 lpm O2, 0.12 lpm CO2, 0.84 lpm N2) ...................................................... 45
Table 3.1 Summary of the experiments performed ...................................................................... 69
Table 4.1 Summary of the experiments performed ...................................................................... 93
Table 6.1 Proximate and ultimate analysis of coals and sawdust ............................................... 157
Table 6.2 Summary of experimental conditions ......................................................................... 159
Table A1.1 Analysis of PRB coal and Chinese S03 ................................................................... 189
Table A1.2 Summary of electron- impact reaction and chemical reactions in the model ........... 195
Table A2.1 Proximate and ultimate analysis of coals and sawdust ............................................ 208
Table A2.2 Flue gas compositions of the studied cases.............................................................. 210
Table A4.1 Comparison of the average electrical field strengths and current densities between the
lab-scale ESP and a typical full-scale ESP ................................................................................. 208
Table A4.2 Key parameters and scale-down terms of the lab-scale ESP and full-scale ESP..... 208

xi
ACKNOWLEDGMENTS
I would like to express my deepest and most sincere gratitude to Pro fessor Pratim Biswas, my
PhD advisor, for his great guidance and endless support on my research. Professor Biswas
always tries to inspire me, which helps me come up with good research ideas. He gives me a lot
of freedom and lets me explore new possibilities in research, but also keeps a close eye on me to
make sure I am in the right direction. What I appreciate most is that Professor Biswas is
extremely considerate and ready to help me anytime, which makes the research work much
easier and also fun. Professor Biswas is a role model to me. I am sure that my entire life will
benefit a lot from what I learned from him.
I also would like to thank other committee members for serving on my dissertation committee
and providing important and valuable comments and suggestions to improve this dissertation.
Especially, I want to thank Professor Axelbaum for providing me suggestions, not only from a
point of view of scientific research, but also from a point of view of practical coal combustion in
the industry. I would like to thank Professor Gleaves for helping me find key scientific questions
in my research, Professor Shen for teaching me how to justify the importance of my study, and
Professor Williams for the valuable discussion, as well as guidance and support on using the
measuring techniques such as AMS. Additionally, I would like to thank Dr. Zhuang (from
Beijing Guodian Longyuan Environmental Engineering Co.) for sharing with me his experiences
in performing the coal combustion study and his industrial experiences.
Also I would like to express my gratitude to Professor Da-Ren Chen for bringing me into the
field of aerosol science and technology, and teaching me how to do aerosol research. I thank

xii
Professor Kumfer on his suggestion and the valuable discussion on my research, and his great
help on our ACERF test and pressurized ESP study.
I want to thank the funding agency Consortium for Clean Coal Utilization (CCCU) for
supporting me to do the coal combustion and ESP research. I also appreciate the support from
ENVIRSAN Scholarship from EECE Department.
I want to thank my colleagues in the Aerosol & Air Quality Research Laboratory for providing
their help and assistance, and most importantly a super great work environment. Special thanks
go to my collaborators on the coal projects: Dr. Wei-Ning Wang and Dr. Xiaofei Wang for the
help and guidance, especially in the period when I started the coal combustion study. I thank
Zhichao, Yang, and Yuqi for their collaboration and tremendous help on the coal projects.
I also want to thank LACER members for the collaboration and help on the ACERF test.
Especially I would like to thank Dr. Dhungel for the support of our test and George for the great
help on the setup and ESP design. I also would like to thank colleagues in ACT lab for the help
on aerosol measurements, especially Dhruv, for his coordination and help on the ozone
measurement, and Michael, for his help on the AMS analysis. I also want to thank former
Particle Lab members for their help, in particularly, Dr. He, Dr. Ou, and Dr. Hsiao, in the
sampler study.
I would like to thank Jim from the Chemistry Department machine shop for building the sampler
and Todd from the Physics Department machine shop for building the pressurized ESP. I would
also like to thank Mr. Ballard from the Engineering Communication Center for helping with my
manuscript editing.
Finally, many thanks also go to my friends and staff in the EECE department.

xiii
He Jing
Washington University in St. Louis
December 2015

xiv
ABSTRACT OF THE DISSERTATION
Novel Applications of Electrostatic Precipitators in Coal - Biomass Combustion Systems
by
He Jing
Doctor of Philosophy in Energy, Environmental & Chemical Engineering
Washington University in St. Louis, 2015
Professor Pratim Biswas, Chair
Pulverized coal combustion is an important source of electricity production worldwide. However,
it is also a primary air pollution emission (particulate matters, mercury, etc.) source. Electrostatic
precipitators (ESPs) are widely used in coal- fired power plants to control particulate matters.
This dissertation contributes in the study of the pollution formation from coal combustion
processes and pollution control based on ESPs in the following three aspects: (1) explore novel
applications of ESPs in particulate matters and mercury removal; (2) develop and evaluate an
compact electrostatic precipitator for sampling purpose, which can support o ffline fly ash
particle analysis; (3) study the submicrometer particle formation during co-firing of coal with
sawdust.
Part.1. Three new topics in flue gas treatment using ESPs were studied: (1) elemental mercury
(Hg0) oxidation by a soft X-ray irradiation enhanced ESP; (2) secondary aerosol formation in the
ESP during flue gas treatment; (3) submicrometer particle capture by a pressurized ESP.
In the first study, in-situ soft X-rays were coupled to a DC (direct current) corona-based (ESP).
The device showed Hg0 oxidation efficiency of 49.0% without soft X-rays and soft X-rays could
enhance the oxidation to an efficiency of 65.6%. Hg0 was oxidized by the oxidizing radicals

xv
formed due to corona discharge and soft X-ray irradiation. Detailed mechanisms of radical
formations and Hg0 oxidation were proposed and discussed based on ozone generation
measurements and Hg0 oxidation behavior observations in single gas environments (O2, N2, and
CO2). The effects of flue gas compositions and particulate matters on the performance of the
studied device were also evaluated.
The second study reported the new aerosol formation (or secondary aerosol formation) in the
ESP during flue gas treatment for the first time. The size distributions and chemical
compositions of the secondary aerosols were characterized. It is very likely that they were H2O-
H2SO4 aerosols with a unimodal size distribution and a peak diameter around 20 nm. They were
formed through the following pathway: (1) SO2 in the flue gas was oxidized by the oxidizing
radicals, reacted with H2O in the ESP, and eventually formed H2SO4 (vapor); (2) H2O-H2SO4
SAs were firstly formed through ion- induced nucleation; (3) SAs grew through condensation and
nucleation. During the particle formation, organics were also absorbed on SAs. The effects of
SO2 concentration, water content in the flue gas, ESP voltage, and flow rate through the ESP on
the new aerosol formation were also evaluated.
In the third study, the performance of the pressurized ESP, a promising particle control solution
for pressurized coal combustion, was studied. The ESP was operated under 1 atm, 2 atms, and 3
atms, respectively. Current-voltage characteristics of the ESP show that ionization was more
difficult with higher gas pressure. Under the same ESP voltage, higher gas pressure resulted in
less particle capture due to insufficient particle charging. However, under the same ESP current,
the ESP with higher gas pressure worked better. A modified Deutsche-Anderson (D-A) equation
was developed and the experimental data fitted well with the estimated particle capture
efficiencies from the modified D-A equation. The capture of fly ash particles by the pressurized

xvi
ESP was also studied. The charging status of fly ash particles greatly influenced the capture
efficiencies.
Part.2. In order to characterize the fly ash particles, proper particle sampling is needed. In this
part, an electrostatic nanoparticle sampler was developed. It is a two-stage ESP. A parametric
study was first performed to identify the optimal operating condition of the sampler. Under the
optimized conditions, the sampler achieved a collection efficiency of more than 90% for particles
ranging from 50 to 500 nm, and 57% to 78% of the particles were collected on the SEM stub in
the sampler. The collection efficiencies of oleic acid particles were lower than those of NaCl
particles in the size range from 50 to 150 nm, due to lower charging efficiencies of oleic acid
particles.
Part.3. Co-firing of coal with biomass for electricity generation has economic and environmental
benefits, which makes it a promising alternative of coal combustion. To better understand this
process, submicrometer particle formation during co-firing of coal with sawdust was studied in
this part. Particle size distributions, elemental compositions, and organic compositions of
particles were analyzed in detail. Coal contributed more than sawdust in submicrometer particle
formation and the formation of organic part of the particles was closely related with the
formation of inorganic part. Higher sulfur content in coal and higher combustion temperature
resulted in higher concentrations of submicrometer particles and organics. Higher moisture
content resulted in lower overall particle concentrations but higher particle concentrations in the
size range between 80 nm to 500 nm and more organics in the particles.

1
CHAPTER 1. INTRODUCTION

2
1.1 Electricity generation based on coal combustion and pollutant emission from coal
combustion
Pulverized coal combustion is a major source of electricity generation in the world. 40% of the
world’s electricity is provided by coal combustion (EIA 2009). This number varies among
different countries. In developing countries such as India and China, greater than 70% of the
electricity was produced by coal combustion (Biswas et al., 2011). However, even in developed
country such as U.S., coal combustion also provides 45% of the electricity. It is estimated that in
2030, coal combustion will still be the most important source of electricity and it will account for
43% of the global electricity generation then (EIA 2009). Although the shale gas revolution
resulted in an increased natural gas usage in electricity generation (providing 30% electricity in
U.S., EIA 2015), the important role of coal in electricity generation did not change. It is
projected that even in 2040 natural gas will still account for 30% of U.S. electricity generation,
which is still lower than the percentage of the contribution of coal combustion (EIA 2015).
Several factors have important influence on the roles of coal and gas in electricity production,
such as the price volatility of natural gas (Macmillan et al., 2013).
Environmental consideration is another affecting factor of coal’s role in power generation. Coal
combustion is a major source of many air pollutants, including particulate matters (fly ash), SO 2,
NOx, mercury, etc. Recently, CO2 became considered as a type of pollutant as well because it is
major greenhouse gas. Coal combustion is the most important provider of the CO2 emission.
To control those air pollutions, stricter air emission regulations for coal- fired power plants are
being set all over the world. U.S. is at the leading place to restrict the power plant emission.
USEPA has recently finalized several air emission regulations and is on the way to establish
other new regulation. Cross-State Air Pollution Rule (CSAPR) aims to reduce SO2 emissions by

3
73% and NOx emissions by 54% from 2005 levels in the CSAPR region, and Mercury and Air
Toxics Standards (MATS), which will result in reducing 90% of mercury emissions, 88% of acid
gas emissions, 41% of SO2 emissions beyond the reductions expected from CSAPR, as well as
reduction of non-mercury metals and dioxins and furans emissions. In order to reduce the CO2
emissions, currently EPA is also developing carbon pollution standards for power plants under
the Clean Air Act. To meet these regulations and reduce the pollution from coal- fired power
plant, new flue gas treatment technologies are urgently needed for a cost-effective and reliable
pollution reduction.
At the same time, the advanced combustion technologies are under study and some of them have
the advantage in reducing pollution from the pulverized coal combustion. To name a few, oxy-
combustion results in a higher concentration of CO2 in the exhaust from the combustion, which
benefits the following carbon capture process, besides, without N2 in the system, less NOx will
be generated (Chen et al., 2012); pressurized combustion is more effective than the atmosphere
pressure coal combustion due to recoverable latent heat, which means less pollution emission for
the same amount of power generation (Gopan et al., 2014); co-firing of coal with biomass
generates less pollution than the dedicated coal combustion because biomass has lower contents
of nitrogen, sulfur, mercury than coal (Sami et al., 2001; Wooldridge 2001; Saidur et al., 2011;
Williams et al., 2012).
In this thesis, the emphasis is put on the particulate matter and mercury control. Thus, these two
topics are discussed below in detail.

4
1.1.1 Particle formation during coal combustion process and control technologies
The coal combustion is one of the major sources of the airborne particulate matters all over the
world. For example, the electric utility coal combustion accounted for 570,000 tons per year of
PM2.5 emission in the U.S. in 2001 (Davidson et al., 2005). In China the PM emission from coal-
fired power plants totals 3.81 million tons per year, accounting for 44.6% of the total PM (Yao et
al., 2010).
The particulate matters primarily originated from the mineral matter in coal, including included
minerals (intimately associated with coal matrix, eg. organically-bound element) and excluded
minerals (little or no association with carbonaceous materials). The major processes governing
ash particles formation have been summarized by Xu et al. (2011) and are shown in Figure 1.1.
The particles can be classified into two categories: residual ash particles (typically larger
particles) and vaporized particles (typically smaller particles). The residual particles are formed
through particles fragmentation and mineral coalescence, while the vaporized particles are
formed from the inorganic vapor through nucleation, coagulation, and agglomeration (Xu et al.,
2011). Beside the formation of particles from minerals, which is a dominate particle formation
pathway in coal combustion, there are also other pathways. For example, the soot particles can
be formed from tar during the coal combustion (Olmez et al., 1988; Bond et al., 2004; Cho et al.,
2009).

5
Figure 1.1 Major ash particle formation mechanisms during coal combustion (adopted from
Xu et. al., 2011)
Among all the particles, the submicrometer particles are of special interest because they can
penetrate into the alveolar regions of the lungs upon inhalation cause more adverse health
problems (Biswas and Wu, 2005). As discussed in the previous paragraph, they are mainly
formed from inorganic through nucleation, condensation and coagulation. The general formation
pathway has been well developed (Quann and Sarofim, 1982; Quann et al., 1982; Linak and
Wendt, 1994; Biswas and Wu 1998). Beside the general formation pathway, submicrometer soot
particles may also been produced from tar during the coal combustion. Tar vapors from coal
pyrolysis may lose H and O atoms to form soot (Olmez et al., 1988; Bond et al., 2004; Cho et al.,
2009). Thus, the main composition of submicrometer particles is inorganic substance, including
SiO2, MgO, Fe2O3, elemental carbon, and trace species, such as Pb, Hg and Se (Linak and Wendt,
1994).

6
At the same time, the coal fly ash particles also contain organic matters. Zhang et al. (2008)
analyzed the chemical composition of particulate matter from both industrial boilers and
residential stoves, and found that the main components of the organic part were alkanes, aliphatic
acids, aromatic acids, and PAHs. Wang et al. (2013, 2015) has proposed the pathway of the
formation of organic part of the coal fly ash particles, as shown in Figure 1.2. The organic
species from coal pyrolysis condensed on the inorganic particles during its growth and form the
organic part.

7
Figure 1.2 Proposed formation mechanisms of organic aerosols from coal combustion
(adopted from Wang et al., 2013)
The most widely used particle control systems in coal- fired power plants are electrostatic
precipitators (ESPs) and fabric filters. They are both reliable and with high particle capture
efficiencies (exceed 99%) (Huang and Chen, 2002; Moretti et al., 2012). ESPs electrically charge
fly ash particles and then collect and remove them in an electrical field. They have the
advantages of low pressure drop through the system, resistance to high moisture and temperature,
and low maintenance (Robinson 1971). Fabric filters collects the dry particulate matter as the
flue gas passes through the filter material, and the main mechanisms include inertial impaction,
diffusion, and direct interception. The advantages of fabric filters include high collection

8
efficiency throughout the particle size range, little impact of ash chemical constituents on
performance, and resistance to flow changes (Moretti 2012). Wet scrubbers in coal- fired power
plants are primarily for SO2 and other acid gas removal. However, they also contribute in particle
removal, relying on direct and irreversible contact of a liquid (droplets, foam, or bubbles) with
the PM.
1.1.2 Mercury emission from coal combustion and control technologies
Coal combustion is also a dominant source of anthropogenic mercury emission. In U.S., 50% of
the anthropogenic mercury emission is from coal- fired power plants (Senior et al., 2000a and
2000b). In the flue gas, there are four types of mercury compounds, Hg0, Hg2+X (X can be O, Cl2,
SO4, etc), Hg22+X, and CH3Hg. Among them, Hg2
2+X is usually unstable, and the amount of
CH3Hg is little. Thus, the dominant species are Hg0(g), HgCl2(g), HgO(s,g), and HgSO4(s)
(Galbreath and Zygarlicke, 1996). In other words, mercury is usually present in three forms: (a)
Hg0(g); (b) Hg2+(g); (c) Hg(s). Hg2+(g) can be absorbed by water, so they can be easily removed
by wet scrubber; while Hg(s) can be removed by fabric filters or ESPs along the particles
(Zhuang et al., 2004). The main challenge of mercury control is to remove Hg0(g) (Pavlish et al.,
2003) and previous measurements show that the amount of Hg0(g) is significant, which usually
took up around 50% of the total mercury (Galbreath and Zygarlicke, 1996). There are two
strategies: (a) directly capture Hg0(g) or (b) oxidize it into Hg2+.
Several methods have been developed to control Hg0(g). The most widely used methods are:
activated carbon injection (ACI) and halogen injection. Besides, SCR (selective catalytic
reaction), which was first developed to control NOx, also contributes a lot in Hg0(g) oxidation. In

9
addition, recently, hot injection of sorbent has also been used to control mercury (Biswas and
Wu, 1998).
During ACI, the powdered activated carbon particles (usually several to around fifty micrometer)
are injected into the flue gas ductwork and absorb the Hg0 and the activated carbon particles are
then removed by particle control units. Usually a 5,000-100,000:1 carbon mercury (mass based)
ratio is needed to reach a removal efficiency over 90% (His et al, 1998; Pavlish et al., 2003). The
disadvantage of ACI is the high cost. Besides, the collected fly ash can be reused as cement
replacement, and the carbon in the fly ash will adversely affect the quality of the cement
replacement (Pflughoeft-Hassett et al., 2009).
During halogen injection, the halogen can oxidize the Hg0(g) to Hg2+, which leads to a better
mercury removal. Bromine is the most widely used halogen (Liu et al., 2007). At the same time,
chlorine (Senior et al., 2000b) and iodine can also oxidize Hg0(g) (Li et al., 2009a). The
disadvantage of halogen injection is that it may cause corrosion of the equipment (Zhuang et al.
2009). The mechanism of the SCR on mercury removal is catalytic oxidation of Hg0(g). The
detailed mechanisms of various catalysts have been extensively studied (Gao et al., 2013).
Hot injection of sorbent is a technique to reduce the toxic metal emissions from coal combustion
(Gale and Wendt, 2005; Yoo et al., 2005; Wendt and Lee, 2010). Submicrometer particles
containing toxic metal may penetrate through particle control device and are emitted from stack.
However, with sorbent injected into the furnace, toxic metal tends to go through the nucleation,
condensation, and coagulation process together with the vapor of sorbent and form larger
particles, which can be easily captured by the particle control device. As a result, the emission of
toxic metal decreases. Experiments show that TiO2 (Suriyawong et al., 2009), V2O5, CuO, and

10
Fe2O3 sorbents can capture mercury. Among them, V2O5 worked best, which may be due to the
additional catalytic effect (Wang 2014).
1.2 Applications of electrostatic precipitators and other corona discharged based
technologies for exhaust gas treatment in coal combustion systems
1.2.1 Electrostatic precipitators
Electrostatic precipitators are the most widely used particle control systems in coal- fired power
plants because of its economic and performance advantages. Its working mechanism can be
summarized into the following steps: (1) ion generation due to DC (direct current) corona
discharge, which is mainly caused by collisions of electrons and gas molecules and the “electron
avalanche”; (2) fly ash particles charging by the ions through diffusion charging (dominant
mechanism for small particles) and field charging (dominant mechanism for large particles); (3)
charged particles migrate following the electric field and eventually collected on the collection
electrode (Robinson 1971).
The submicrometer particle capture capability of ESPs have been specifically studied on both
bench-scale ESPs with synthetic particles (Yoo et al., 1997; Zhuang et al., 2000; Huang and
Chen, 2002; Jing et al., 2013) and ESPs with particles and flue gas from real combustion systems
((McCain et al., 1975; Ylätalo and Hautanen, 1998; Suriyawong et al., 2006; Li et al., 2009b).
Two phenomena were observed. Firstly, there was minimum collection efficiency in the 0.1-1
μm size range, which was due to the combination effect of diffusion charging and field charging.
Secondly, the collection efficiency became lower as the size was smaller in the ultrafine size

11
range. One of the reasons was that the particle charging efficiency decreased dramatically as the
particle size became smaller.
1.2.2 Treatment of other pollutants with corona discharge technologies
Other than DC corona discharge, which is the key mechanism of electrostatic precipitators, there
are also other types of corona discharge, including AC (alternative current) corona discharge and
pulsed corona discharge. All of them have been applied into treatment of other pollutants from
coal combustion. Rather than utilizing the electric properties of the ions generated from corona
discharge, the mechanism here is chemical reaction. During the corona discharge, oxidizing
radicals, for instance, ∙O, ∙OH, O3, are formed in the reactor and can oxidize the pollutants,
which leads to the removal of those pollutants (Yan 2001; Kim 2004).
It has been reported that corona discharge can oxidize SO2 to SO3, and eventually formed H2SO4
particles. The H2SO4 particles were then charged and collected in the corona discharge particles.
As a result, some of the SO2 was removed from flue gas (Matteson et al., 1972; Kuroki et al.,
2002; Mok and Nam, 2002; Dong et al., 2003). Similarly, NOx can be removed in the form of
HNO3 particles or NH4NO3 particles with the presence of NH3 in the flue gas (Kuroki et al.,
2002; Mok and Nam, 2002). Corona discharge can also oxidize Hg0(g) and contribute in mercury
removal (Urabe et al., 1988; Chen et al., 2006; Ko et al., 2008; Wang et al., 2011). In addition,
the corona discharge technology can also be applied in VOCs degradation (Marotta et al., 2007;
Schiorlin et al., 2009). Most of the above are still in the lab study phase, and only few pilot
studies have been done (Chang et al., 2003).

12
1.2.3 Soft X-ray enhanced electrostatic precipitation technology
Soft X-ray irradiation is firstly introduced to enhance the performance of ESP in 2002 (Kulkarni
et al., 2002). Soft X-rays interact with particles, electrodes, and gas molecules to emit electrons,
thereby generating positively charged particles and ions (as shown in Figure 1.3). As a result, the
particle changing is enhanced and this helps increase the submicrometer particle capture
efficiency of ESP (Kulkarni et al., 2002; Hogan et al., 2004). The effectiveness of soft X-ray
enhanced electrostatic precipitation on fly ash particles capture has been verified on a pilot-scale
coal combustion system (Li et al., 2009b). The soft X-rays irradiation can also enhance the
performance of DC corona discharge on toluene oxidation (Namiki et al., 2005).
Figure 1.3 Principle of operation of the soft X-ray enhanced ESP for particle charging and
capture (adapted from Kulkarni et al., 2002)

13
1.3 Particle sampler based on electrostatic precipitation
As discussed above, electrostatic precipitation is an efficient method for particle collection. Thus,
it has also been extensively utilized as an approach of particle sampling. Many particle samplers
have been developed based on electrostatic precipitation (Dixkens and Fissan, 1999; Fierz et al.,
2007; Li et al., 2010; Miller et al., 2010). They are made to support offline analysis of particles,
such as analyses of particle morphology, chemical composition, and biological properties.
However, the current samples still have some shortcomings, including low collection efficiencies
(Fierz et al., 2007), requiring external charging component (Li et al., 2010), and possible damage
of particles by corona discharge (Miller et al., 2010).
1.4 Dissertation outlines
This dissertation has three main objectives:
1) To investigate several novel applications of electrostatic precipitators in particulate matters
and mercury control from coal combustion exhaust and understand the mechanisms (Chapters 2-
4);
2) To develop an electrostatic particle sampler (a two-stage electrostatic precipitator) and
investigate the submicrometer particle charging and collection process in the sampler (Chapter 5);
and
3) To investigate the submicrometer particle formation during co-firing of coal with sawdust
(Chapter 6).

14
The three objectives are studied and described in five chapters (Chapters 2-6) of the dissertation.
This dissertation is organized such that each chapter is self-contained with an introduction,
experimental section, results, discussion, and conclusions. Chapter 2 reports the study of mercury
removal using a new technology, ESP enhanced with soft X-ray irradiations. Chapter 3
elucidates the secondary particle formation in the ESP during flue gas treatment, which is
previously observed but unclear problem. Chapter 4 studies the performance of a pressurized
ESP on submicrometer particle capture. In Chapter 5, an electrostatic precipitator for particle
sampling was developed and evaluated. The mechanism submicrometer particle charging and
collection is also discussed in detail. Chapter 6 provides a systematic study of the characteristics
of submicrometer particles from co-firing of coal with sawdust. At last, Chapter 7 concludes the
dissertation.

15
1.5 Reference
Biswas, P., W.-N. Wang, and W.-J. An. 2011. The energy-environment nexus: aerosol science
and technology enabling solutions. Front. Environ. Sci. En. 5(3):299-312.
Biswas, P., and C.-Y. Wu. 2005. Nanoparticles and the environment. J. Air Waste Manage.
55(6):708-746.
Biswas, P., and C.-Y. Wu. 1998. Control of toxic metal emissions from combustors using
sorbents: a review. J. Air Waste Manage. 48(2):113-127.
Bond, T.C., D.G. Streets, K.F. Yarber, S.M. Nelson, J.H. Woo, and Z. Klimont. 2004. A
technology-based global inventory of black and organic carbon emissions from
combustion. J. Geophys. Res-Atmos 109(D14).
Chang, J.-S., K. Urashima, Y.X. Tong, W.P. Liu, H.Y. Wei, F.M. Yang, and X.J. Liu. 2003.
Simultaneous removal of NOx and SO2 from coal boiler flue gases by DC corona
discharge ammonia radical shower systems: pilot plant tests. J. Electrostat. 57(3):313-
323.
Chen, L., S.Z. Yong, and A.F. Ghoniem. 2012. Oxy-fuel combustion of pulverized coal:
Characterization, fundamentals, stabilization and CFD modeling. Prog. Energ. Combust.
38(2):156-214.
Chen, Z., D.P. Mannava, and V.K. Mathur. 2006. Mercury oxidization in dielectric barrier
discharge plasma system. Ind. Eng. Chem. Res. 45(17):6050-6055.
Cho, S.-H., J.-I. Yoo, A.T. Turley, C.A. Miller, W.P. Linak, J.O.L. Wendt, F.E. Huggins, and M.I.
Gilmour. 2009. Relationships between composition and pulmonary toxicity of prototype

16
particles from coal combustion and pyrolysis. P. Combust. Inst. 32(2):2717-2725.
Davidson, C.I., R.F. Phalen, and P.A. Solomon. 2005. Airborne particulate matter and human
health: a review. Aerosol Science and Technology 39(8):737-749.
Dixkens, J., and H. Fissan. 1999. Development of an electrostatic precipitator for off-line particle
analysis. Aerosol Sci. Tech. 30(5):438-453.
Dong, L.M., Z. Wu, J.X. Yang, and X.C. Chi. 2003. Chemical kinetics model for sulfur dioxide
removal in flue gas using corona discharge. Paper presented at Conference on Electrical
Insulation and Dielectric Phenomena, Albuquerque, NM, USA, October 19-22, 2003.
EIA. 2009. International Energy Outlook. Washington, DC: DOE.
EIA. 2015. Annual Energy Outlook. Washington, DC: DOE.
Fierz, M., R. Kaegi, and H. Burtscher. 2007. Theoretical and experimental evaluation of a
portable electrostatic TEM sampler. Aerosol Sci. Tech. 41(5):520-528.
Galbreath, K.C., and C.J. Zygarlicke. 1996. Mercury speciation in coal combustion and
gasification flue gases. Environ. Sci. Tech. 30(8):2421-2426.
Gale, T.K, and J.O.L. Wendt. 2005. In-furnace capture of cadmium and other semi-volatile
metals by sorbents. P. Combust. Inst. 30(2):2999-3007.
Gao, Y., Z. Zhang, J. Wu, L. Duan, A. Umar, L. Sun, Z. Guo, and Q. Wang. 2013. A critical
review on the heterogeneous catalytic oxidation of elemental mercury in flue gases.
Environ. Sci. Tech. 47(19):10813-10823.
Gopan, A., B.M. Kumfer, J. Phillips, D. Thimsen, R. Smith, and R.L. Axelbaum. 2014. Process

17
design and performance analysis of a Staged, Pressurized Oxy-Combustion (SPOC)
power plant for carbon capture. Appl. Energ. 125:179-188.
Hogan, C.J., M.-H. Lee, and P. Biswas. 2004. Capture of viral particles in soft X-raye-nhanced
corona systems: charge distribution and transport characteristics. Aerosol Sci. Tech.
38(5):475-486.
Hsi, H.-C., S. Chen, M Rostam-Abadi, M.J. Rood, C.F. Richardson, T.R. Carey, and R. Chang.
1998. Preparation and evaluation of coal-derived activated carbons for removal of
mercury vapor from simulated coal combustion flue gases. Energ. Fuels 12(6):1061-
1070.
Huang, S.-H., and C.-C. Chen. 2002. Ultrafine aerosol penetration through electrostatic
precipitators. Environ. Sci. Tech. 36(21):4625-4632.
Jing, H., S. He, Q. Ou, T.-C. Hsiao, and D.-R. Chen. 2013. Development of a Compact
Electrostatic Nanoparticle Sampler for Offline Aerosol Characterization. Mapan-J.
Metrol. Soc. I. 28(3):217-226.
Kim, H.-H. 2004. Nonthermal plasma processing for air-pollution control: a historical review,
current issues, and future prospects. Plasma Process. Polym. 1(2):91-110.
Ko, K.B., Y. Byun, M. Cho, W. Namkung, I.P. Hamilton, D.N. Shin, D.J. Koh, and K.T. Kim.
2008. Pulsed corona discharge for oxidation of gaseous elemental mercury. Appl. Phys.
Lett. 92(25):251503.
Kulkarni, P., N. Namiki, Y. Otani, and P. Biswas. 2002. Charging of particles in unipolar coronas
irradiated by in-situ soft X-rays: Enhancement of Capture Efficiency of Ultrafine

18
Particles. J. Aerosol Sci. 33(9):1279-1296.
Kuroki, T., M. Takahashi, M. Okubo, and T. Yamamoto. 2002. Single-stage plasma-chemical
process for particulates, NOx, and SOx simultaneous removal. IEEE T. Ind. Appl.
38(5):1204-1209.
Li, C., S. Liu, and Y. Zhu. 2010. Determining ultrafine particle collection efficiency in a
nanometer aerosol sampler. Aerosol Sci. Tech. 44(11):1027-1041.
Li, Y., Michael D., A. Suriyawong, and P. Biswas. 2009a. Mercury emissions control in coal
combustion systems using potassium iodide: bench-scale and pilot-scale studies. Energ.
Fuels 23 (1):236-243.
Li, Y., A. Suriyawong, M. Daukoru, Y. Zhuang, and P. Biswas. 2009b. Measurement and capture
of fine and ultrafine particles from a pilot-scale pulverized coal combustor with an
electrostatic precipitator. J. Air Waste Manag. 59(5):553.
Linak, W.P., and J.O.L. Wendt. 1994. Trace metal transformation mechanisms during coal
combustion. Fuel Processing Tech. 39 (1):173-198.
Liu, S.-H., N.-Q. Yan, Z.-R. Liu, Z. Qu, H.P. Wang, S.-G. Chang, and C. Miller. 2007. Using
bromine gas to enhance mercury removal from flue gas of coal-fired power plants.
Environ. Sci. Tech. 41(4):1405-1412.
Macmillan, S., Antonyuk, A., Schwind, H. 2013. Gas to Coal Competition in the U.S. Power
Sector. IEA Insights Series 2013. Paris, France: International Energy Agency.
Marotta, E., A. Callea, M. Rea, and C. Paradisi. 2007. DC corona electric discharges for air
pollution control. Part 1. Efficiency and products of hydrocarbon processing. Environ.
19
Sci. Tech. 41(16):5862-5868.
Matteson, M.J, H.L. Stringer, and W.L. Busbee. 1972. Corona discharge oxidation of sulfur
dioxide. Environ. Sci. Tech. 6(10):895-901.
McCain, J.D., J.P. Gooch, and W.B. Smith. 1975. Results of field measurements of industrial
particulate sources and electrostatic precipitator performance. JAPCA J. Air Waste Ma.
25(2):117-121.
Miller, A., G. Frey, G. King, and C. Sunderman. 2010. A handheld electrostatic precipitator for
sampling airborne particles and nanoparticles. Aerosol Science and Technology
44(6):417-427.
Mok, Y.S., and I.-S. Nam. 2002. Modeling of pulsed corona discharge process for the removal of
nitric oxide and sulfur dioxide. Chem. Eng. J. 85(1):87-97.
Moretti, A.L., C.S. Jones. 2012. Advanced Emissions Control Technologies for Coal-Fired Power
Plants. Babcock & Wilcox Power Generation Group, BR-1886.
Namiki, N., K. Cho, P. Fraundorf, and P. Biswas. 2005. Tubular reactor synthesis of doped
nanostructured titanium dioxide and its enhanced activation by coronas and soft X-rays.
Ind. Eng. Chem. Res. 44(14):5213-5220.
EC/R Incorporated. 1998. Stationary Source Control Techniques Document for Fine Particulate
Matter. EPA Contract No. 68-D-98-026.
Olmez, I., A.E. Sheffield, G.E. Gordon, J.E. Houck, L.C. Pritchett, J.A. Cooper, T.G. Dzubay,
and R.L. Bennett. 1988. Compositions of particles from selected sources in Philadelphia
for receptor modeling applications. JAPCA J. Air Waste Ma. 38 (11):1392-1402.

20
Pavlish, J.H., E.A. Sondreal, M.D. Mann, E.S. Olson, K.C. Galbreath, D.L. Laudal, and S.A.
Benson. 2003. Status review of mercury control options for coal-fired power plants. Fuel
Processing Tech. 82(2):89-165.
Pflughoeft-Hassett, D.F., D.J. Hassett, T.D. Buckley, L.V. Heebink, and J.H. Pavlish. 2009.
Activated carbon for mercury control: Implications for fly ash management. Fuel
Processing Tech. 90(11):1430-1434.
Quann, R.J., M. Neville, M. Janghorbani, C.A. Mims, and A.F. Sarofim. 1982. Mineral matter
and trace-element vaporization in a laboratory-pulverized coal combustion system.
Environ. Sci. Tech. 16(11):776-781.
Quann, R.J., and A.F. Sarofim. 1982. Vaporization of refractory oxides during pulverized coal
combustion. Paper presented at 19th Symposium (international) on combustion,
Pittsburgh, PA, USA.
Robinson, M. 1971. Electrostatic precipitation. In Air pollution control. New York: John Wiley.
Saidur, R., E.A. Abdelaziz, A. Demirbas, M.S. Hossain, and S. Mekhilef. 2011. A review on
biomass as a fuel for boilers. Renew. Sust. Energ. Rev. 15(5):2262-2289.
Sami, M., K. Annamalai, and M. Wooldridge. 2001. Co-firing of coal and biomass fuel blends.
Prog. Energ. Combust. 27(2):171-214.
Schiorlin, M., E. Marotta, M. Rea, and C. Paradisi. 2009. Comparison of toluene removal in air
at atmospheric conditions by different corona discharges. Environ. Sci. Tech.
43(24):9386-9392.
Senior, C.L., J.J. Helble, and A.F. Sarofim. 2000a. Emissions of mercury, trace elements, and

21
fine particles from stationary combustion sources. Fuel Processing Tech. 65:263-288.
Senior, C.L., A.F. Sarofim, T. Zeng, J.J. Helble, and R. Mamani-Paco. 2000b. Gas-phase
transformations of mercury in coal-fired power plants. Fuel Processing Tech. 63(2):197-
213.
Suriyawong, A., M. Gamble, M.-H. Lee, R. Axelbaum, and P. Biswas. 2006. Submicrometer
particle formation and mercury speciation under O2-CO2 coal combustion. Energ. Fuels
20(6):2357-2363.
Suriyawong, A., M. Smallwood, Y. Li, Y. Zhuang, and P. Biswas. 2009. Mercury capture by
nano-structured titanium dioxide sorbent during coal combustion: lab-scale to pilot-scale
studies. Aerosol Air Qual. Res. 9(4):394-403.
Urabe, T., Y. Wu, T. Nagawa, and S. Masuda. 1988. Study on Hg, NOx, SOx behavior in
municipal refuse incinerator furnace and removal of those by pulse corona discharge.
Seiso Giho 13:12-29.
Wang, M., T. Zhu, H. Luo, H. Wang, and W. Fan. 2011. Effects of reaction conditions on
elemental mercury oxidation in simulated flue gas by DC nonthermal plasma. Ind. Eng.
Chem. Res. 50 (10):5914-5919.
Wang, X., B.J. Williams, Y. Tang, Y. Huang, L. Kong, X. Yang, and P. Biswas. 2013.
Characterization of organic aerosol produced during pulverized coal combustion in a drop
tube furnace. Atmos. Chem. Phys. 13(21):10919-10932.
Wang, X.. 2014. Fine Particle and Mercury Formation and Control during Coal Combustion.
Ph.D. Thesis, Washington University in St. Louis, USA.

22
Wang, X., E. Cotter, K.N. Iyer, J. Fang, B.J. Williams, and P. Biswas. 2015. Relationship
between pyrolysis products and organic aerosols formed during coal combustion. P.
Combust. Inst. 35(2):2347-2354.
Wendt, J.O.L., and S.J. Lee. 2010. High-temperature sorbents for Hg, Cd, Pb, and other trace
metals: Mechanisms and applications. Fuel 89(4):894-903.
Williams, A, J.M. Jones, L. Ma, and M. Pourkashanian. 2012. Pollutants from the combustion of
solid biomass fuels. Prog. Energ. Combust 38(2):113-137.
Xu, M., D. Yu, H. Yao, X. Liu, and Y. Qiao. 2011. Coal combustion-generated aerosols:
Formation and properties. P. Combust. Inst. 33(1):1681-1697.
Yan, K. 2001. Corona plasma generation. Ph.D. Thesis, Technische Universiteit Eindhoven,
Netherlands
Yao, Q., S.-Q. Li, H.-W. Xu, J.-K. Zhuo, and Q. Song. 2010. Reprint of: Studies on formation
and control of combustion particulate matter in China: A review. Energy 35(11):4480-
4493.
Ylätalo, S.I., and J.Hautanen. 1998. Electrostatic precipitator penetration function for pulverized
coal combustion. Aerosol Sci. Tech. 29(1):17-30.
Yoo, J.-I., T. Shinagawa, J.P. Wood, W.P. Linak, D.A. Santoianni, C.J. King, Y.-C. Seo, and
J.O.L. Wendt. 2005. High-temperature sorption of cesium and strontium on dispersed
kaolinite powders. Environ. Sci. Tech. 39(13):5087-5094.
Yoo, K.H., J.S.Lee, and M.D. Oh. 1997. Charging and collection of submicron particles in two -
stage parallel-plate electrostatic precipitators. Aerosol Sci. Tech. 27(3):308-323.

23
Zhang, Y., J.J. Schauer, Y. Zhang, L. Zeng, Y. Wei, Y. Liu, and M. Shao. 2008. Characteristics
of particulate carbon emissions from real-world Chinese coal combustion. Environ. Sci.
Tech. 42(14):5068-5073.
Zhuang, Y., C. Chen, R. Timpe, and J. Pavlish. 2009. Investigations on bromine corrosion
associated with mercury control technologies in coal flue gas. Fuel 88(9):1692-1697.
Zhuang, Y., Y.J. Kim, T.G. Lee, and P. Biswas. 2000. Experimental and theoretical studies of
ultra-fine particle behavior in electrostatic precipitators. J Electrostat 48(3):245-260.
Zhuang, Y., J.S. Thompson, C.J. Zygarlicke, and J.H. Pavlish. 2004. Development of a mercury
transformation model in coal combustion flue gas. Environ. Sci. Tech. 38(21):5803-5808.

24
CHAPTER 2. ELEMENTAL MERCURY OXIDATION IN AN ELECTROSTATIC
PRECIPITATOR WITH IN SITU SOFT X-RAY IRRADIATION
The results of this chapter has been published in Jing, H.; Wang, X.; Wang, W.-N.; Biswas, P., Elemental Mercury Oxidation in an Electrostatic Precipitator Enhanced with In Situ Soft X-ray
Irradiation. Journal of the Air & Waste Management Association, 2015, 65, 455-465
Supplementary materials are available in Appendix I

25
Abstract
Corona discharge based techniques are promising approaches for oxidizing elemental mercury
(Hg0) in flue gas from coal combustion. In this study, in-situ soft X-rays were coupled to a DC
(direct current) corona-based electrostatic precipitator (ESP). The soft X-rays significantly
enhanced Hg0 oxidation, due to generation of ion-electron pairs from photoionization of gas
molecules and the ESP electrode materials. This coupling technique worked better in the positive
corona discharge mode because more electrons were in the high energy region near the electrode.
Detailed mechanisms of Hg0 oxidation are proposed and discussed based on ozone generation
measurements and Hg0 oxidation behavior observations in single gas environments (O2, N2, and
CO2). The effect of O2 concentration in flue gas, as well as the effects of particles (SiO2, TiO2,
and KI) was also evaluated. In addition, the performance of a soft X-ray coupled ESP in Hg0
oxidations was investigated in a lab-scale coal combustion system. With the ESP voltage at +10
kV, soft X-ray enhancement, and KI addition, mercury oxidation was maximized.

26
2.1 Introduction
Mercury (Hg) pollution is arousing increasing attention due to its toxicity. Coal-fired power
plants are the primary emission sources of anthropogenic releases of mercury, and accounted for
53% of the total mercury emission in United States in 2005 (U.S. Environmental Protection
Agency, EPA, 2011). In 2011, the EPA finalized the first U.S. national standards to regulate
mercury emission from coal-fired power plants.
In flue gas from coal- fired power plants, mercury is usually present in ionic, particulate, and
elemental states (Korpiel and Vidic, 1997; Fujiwara et al., 2002). Due to its high solubility in
water, the ionic state of mercury can be removed by treatments such as wet scrubbers. Particulate
mercury can be removed by particle treatment facilities such as electrostatic precipitators (ESPs)
or a fabric filter baghouse. However, elemental mercury (Hg0) that is present as vapor is hard to
capture.
Several types of approaches have been proposed to treat Hg0 in flue gas, including activated
carbon injection (ACI) (Sjostrom et al., 2010), non-carbon sorbent injection (Worathanakul et al.,
2008; Suriyawong et al., 2009), addition of oxidizing chemicals, like chlorine (Richardson et al.,
2003), and selective catalytic reaction (SCR) (Gao et al., 2013). Among them, ACI and SCR are
already commercially available. ACI is the most commonly used technique, but it has limitations,
such as high cost and a low applicable temperature range. The activated carbon also affects the
reuse of the fly ash. The oxidation effect of SCR was quite variable and appears to be coal-
specific and catalyst-specific (Feeley et al., 2003).
Corona discharge has been proven to oxidize Hg0 (Urabe et al., 1988), and its operation cost is
much lower than that of ACI. There are three types of corona discharge: alternating current (AC),

27
direct current (DC), and pulsed. Dielectric barrier discharge (DBD), a type of AC corona
discharge, has been well studied as a Hg0 oxidation technique (Chen et al., 2006; Jeong and
Jurng, 2007; Byun et al., 2008; Ko et al., 2008a; Lin et al., 2010; Wang et al., 2010; Byun et al.,
2011a; Byun et al., 2011b; Jiang et al., 2012). Similarly, DC corona discharge (Liang et al., 2002;
Wang et al., 2009; Wang et al., 2011a; Wang et al., 2013a) and pulsed corona discharge (Liang
et al., 1998; Ko et al., 2008b; Ko et al., 2008c; Xu et al., 2009) have also been used to oxidize
Hg0. Notably corona discharge has additional beneficial effects other than Hg0 oxidation. DBD,
pulsed corona discharge, and the system based on DC corona discharge by Wang et al. (2013a)
can also oxidize NOx and SOx. The corona-based ESP developed by Liang et al. (2002) can
remove both Hg0 and zinc-rich fly ash particles.
Although the process of Hg0 oxidation by corona discharge has been studied for years, its role in
Hg0 oxidation by DC-energized ESPs in practical flue gas treatment is not clear. Hg0 could be
captured and partially oxidized in ESPs at coal- fired power plants. In pilot-scale and full-scale
ESPs, 8%-58% Hg0 concentration reductions have been reported (Xie et al., 2002; Wang et al.,
2008; Hu et al., 2009; Yang et al., 2013). However, the Hg0 oxidation in such processes was
attributed to oxidizing compounds in the flue gas, such as hydrogen chloride (HCl). The effect of
corona discharge was not investigated.
Soft X-ray radiation has been coupled with ESP to enhance its ability to collect particulate matter
(Kulkarni et al., 2002; Hogan et al., 2004; Kettleson et al., 2009; Li et al., 2009a; Kettleson et al.,
2013). Collection efficiency is enhanced when X-rays interact with particles, electrodes, and gas
molecules to emit electrons, thereby generating positively charged particles and ions, which then
increase particle charging. Considering this, soft X-ray radiation may also be able to enhance

28
Hg0 oxidation in ESPs, based on the higher ionization environment in ESPs and also the potential
interactions between soft X-rays and Hg atoms.
This study first evaluated the effect of a DC corona discharge-based ESP with in situ soft X-ray
irradiation on mercury oxidation, considering both DC corona discharge alone and the combined
effect of corona discharge and soft X-rays. In addition, the effects of flue gas compositions and
representative fly ash and sorbent particles in flue gas were evaluated in synthetic flue gas.
Finally, mercury oxidation by ESP and soft X-rays was tested in a flue gas from coal combustion
in a drop-tube furnace.
2.2 Experimental Section
2.2.1 Experimental Setup
A cylinder-wire ESP was used in this study. The configuration of the ESP and the coupling of
the ESP and the photoionizer are shown in Figure A1.1 of the supplemental materials. A DC
power supply (Glassman High Voltage Inc., series EL) provided the voltage. The current through
the ESP was monitored with a microamp meter (Nishizawa, U-120, class 1.5). The soft X-rays
were generated by a photoionizer (Hamamatsu Photonics Ltd., Japan, Model C7114-01, 3.5-9.5
keV).
Two experimental systems were used. In the simulated flue gas system (Figure 2.1a), flue gas
was obtained by mixing different types of gases (O2, CO2, and N2). Their flow rates were
regulated by mass flow controllers (OMEGA; FMA 5510, FMA 5512). The total flow rate was
kept at 1 lpm. Mercury was generated at 12 ng/min by a mercury permeation tube (Dynacal,
Valco Instruments Co. Inc. and VICI AG, Houston, Texas, USA). The effects of silicon dioxide

29
(SiO2, Snowtex-o, Nissan Chemical), titanium dioxide (TiO2, Aerodisp-W740X, Evonic
industries), and potassium iodide (KI, Mallinckrodt Chemicals) particles were studied. Particles
were generated by an atomizer (TSI model 3076). Gases and particles were mixed in a c lean
quartz tube (61.0 cm L, 1.9 cm ID). The ESP was set downstream of the tube. Hg0 concentration
and submicron particle size distribution were measured by a mercury analyzer (Nippon
Instruments Corporation, Japan, WA-4) and scanning mobility particle sizer (SMPS, TSI, model
3080), respectively. The ozone concentration was measured by an ozone analyzer (Thermo,
Model 49i). An EPA method using a sampling train was used to measure both Hg0 and Hg2+
concentrations (Hedrick et al., 2001).
In the second system (Figure 2.1b), coal was combusted in a drop-tube furnace
(ThermoElectronCorp., USA, Lindberg/Blue) (Zhuang and Biswas, 2001; Suriyawong et al.,
2006; Wang et al., 2013b). Pulverized PRB (Powder River Basin) sub-bituminous coal (supplied
by Ameren UE, St. Louis, MO) was used in the experiment without KI addition, while Chinese
S03 coal was used in the KI addition case. The composition of the coals used is in Table A1.1.
They were fed by a coal feeder (Quann et al., 1982) at 1 g/hr. The coal was carried by a 0.5 lpm
air flow, and another 0.5 lpm air flow was directly injected into the ceramic tube. The ESP was
again set downstream of the furnace, and the same measurements were taken as in the simulated
flue gas system. A cascade impactor (Pollution Control Systems Corp., Seattle, WA, Mark III)
was set before the SMPS to remove particles larger than 1 μm.

30
(a)
(b)
Figure 2.1 (a) Simulated flue gas experimental system (for experiments Set I to III). (b) Drop-
tube furnace experimental system (for experiments Set IV)

31
2.2.2 Experimental design
The experimental plan is summarized in Table 2.1. The effects of corona discharge and X-rays
on elemental mercury oxidation were first evaluated (in Set I). Then, the effects of two factors on
this process were evaluated, namely (1) the flue gas composition effect (pure O2, CO2, and N2, in
Set II) and (2) the particle effect (in Set III). Finally, in Set IV the effects of corona discharge
and X-rays on elemental mercury oxidation were tested on practical flue gas from coal
combustion.

32
Table 2.1 Test plan
Set Purpose Particle ESP operation Gas composition
I Test effects of
corona discharge
and soft X-ray
No particles Corona -10kV, -8kV,
+8kV, +10kV, soft X-
ray off; Corona -10kV,
-8kV, 0kV, +8kV,
+10kV, soft X-ray on
4%O2-12%CO2-
84%N2
II Test effects of O2,
CO2, and N2 in the
flue gas
No particles Corona +10kV, soft X-
ray off and on
100%CO2,
100%N2, and
100%O2,
respectively
III Test effect of
particles in flue
gas
SiO2 particles; TiO2
particles; KI particles
Corona +10kV, soft X-
ray off and on
4%O2-12%CO2-
84%N2
IV Test mercury
oxidation by ESP
and soft X-ray in
flue gas from coal
combustion
Fly ash particles from
drop tube furnace;
particles removed by
HEPA filter; fly ash
particles from drop
tube furnace with KI
addition
Corona +10kV, soft X-
ray off and on
Gas from drop
tube furnace

33
2.3 Results and Discussion
2.3.1 Effects of corona discharge and soft X-rays
Based on previous studies (Kulkarni et al., 2002; Namiki et al., 2005; Suriyawong et al., 2008)
and industrial ESP operation (Parker, 2003), -10 kV, -8 kV, 0 kV, +8 kV, and +10 kV were
selected as the test conditions. Hg0 conversion was used as the indicator of mercury oxidation.
The conversion efficiency was calculated using the following equation:
Hg0 conversion efficiency = 0,
0,
(1 ) 100%Hg on
Hg off
c
c (2.1)
Figure 2.2 shows that at +10 kV, conversion efficiencies of 49.0% without soft X-rays and 65.6%
with soft X-rays were reached; while at -10 kV, the conversion efficiencies were lower, 24.1%
and 31.5% for ESP and ESP with soft X-rays. In contrast to the +10 kV and -10 kV cases, the
conversion was not significant (below 4.8%) under other applied voltages, due to low electron
concentrations in the ESP, which can be inferred from current-voltage characteristics (Figure
A1.2). The phenomenon of higher Hg0 conversion at +10 kV than that at -10 kV could be
explained by the electron density distribution, which will be modeled in a following section.

34
0kV, SXC
+8kV
+8kV, SXC
+10kV
+10kV, SXC
-8kV
-8kV, SXC
-10kV
-10kV, SXC
0
20
40
60
80
100E
lem
en
tal M
erc
ury
Co
nve
rsio
n E
ffic
ien
cy (
%)
Figure 2.2 Elemental mercury conversion efficiencies under various ESP voltages, with soft
X-ray corona (SXC) off and on (gas combination: 0.04 lpm O2, 0.12 lpm CO2, 0.84 lpm N2)
2.3.2 Possible Mercury Oxidation Mechanisms
In the soft X-ray coupled ESP, a possible Hg0 oxidation mechanism can be summarized in four
steps. In step 1, energetic photons from corona discharges and soft X-rays (if applied) ionize gas
molecules or electrodes in the ESP and form positive ion-electron pairs (Goldman et al., 1985;
Chen, 2002; Kulkarni et al., 2002). In step 2, the newly generated high energy electrons collide
with gas molecules and the electrodes, which may result in four outcomes: a) a gas molecule
absorbs energy from the collision and dissociates into a positive ion and a new electron, b) a new

35
electron is released from the electrode after the collision between an electron and the electrode, c)
the gas molecule absorbs energy from the collision and dissociates into atoms, and d) the gas
molecule absorbs energy from the collision and transforms to the excited state. As a result of
processes a) and b), a great number of electrons are generated, and they initiate more collisions.
The processes occurring in steps 1 and 2 are summarized in Figure 3. The positive voltage case
(Figure 2.3a) and negative case (Figure 2.3b) have two major differences: the drifting directions
of ions are opposite between the two cases, so are the drifting direction of electrons; and the
process 2b) just happens in the negative voltage case. In step 3, non-electron species generated in
step 2 take part in further chemical reactions. The detailed reactions and produced species
depend on the gas composition in the ESP, will be discussed in later sections. In step 4, the
oxidizing radicals generated in steps 2 and 3 react with and oxidize Hg0. For example, oxygen
atoms (O) and ozone molecules (O3) oxidize Hg0 in the following pathways (Van Veldhuizen,
2000; Wang et al., 2009):
Hg O HgO (2.2)
3 2Hg O HgO O (2.3)
Production of Hg2+ was confirmed with mercury speciation measurement (Figure A1.3).
Applying soft X-rays resulted in more electron production in step 1, which promoted the electron
impact reactions and chemical reactions in steps 2 and 3. Consequently, more radicals were
formed and resulted in a high Hg0 oxidation rate. However, under soft X-rays alone only an
insignificant amount of Hg0 was oxidized, as shown in Figure 2.2. There are two possible
reasons. First, without an electric field in the ESP, the energy of electrons generated by
photoionization due to X-rays was too low to initiate the chain reactions, and finally could not

36
oxidize Hg0. Second, when the electric field was off, there was no force driving electrons to
move. Therefore, the possibility of collisions between electrons and gas molecules was much
lower than when the ESP was on, which resulted in fewer reactions. For these reasons, soft X-ray
alone was not used as a test condition in the experiments discussed in the following sections.
(a)

37
(b)
Figure 2.3 Schematic of ion and electron generation and movement in ESP coupled with soft X-
rays [the serial numbers correspond to the steps discussed in the text; (a) is for positive case, and
(b) is for negative case]
The O3 generated by an ESP is an active chemical species that oxidizes mercury. O3 generations
under various voltages with soft X-ray on or off are shown in Figure 2.4. In the voltage range
from -8.8 kV to +10 kV, under the same voltage, the concentration of O3 was slightly higher
when the soft X-ray was on than when it was off. However, when the voltage was between -10
kV and -8.8 kV, X-rays reduced O3 generation. Comparing the O3 generation with the Hg0
conversion result in Figure 2.2, a higher O3 concentration was obtained under -10 kV than under
+10 kV; however, Hg0 conversion was higher under +10 kV. Therefore, O3 might not be the

38
most important species in oxidizing Hg0. This conclusion matches the theoretical calculation.
The reduction of Hg0 concentration due to reactions with O3 in the ESP was calculated using:
0, 0 3 3 0
a bHg Hg O O Hgc kc c t (2.4)
Kinetic parameters for this reaction have been reported in the literature ( k is 2.1×10⁻¹⁸
cm3molec-1s-1, a is 1.0, and b is 0.8, Hall, 1995; k is 7.5×10⁻¹⁹ cm3molec-1s-1, a is 1.0, and b
is 1.0, Pal and Ariya, 2004). With these kinetic parameters, the estimated Hg0 conversion
efficiency due to reactions with O3 is at least one order of magnitude lower than the Hg0
conversion efficiencies for the experimental cases. Thus, it can be inferred that the reaction
between Hg0 and O3 might not be the key mechanism of Hg0 conversion, and that O radicals
contribute most in Hg0 oxidation in the system.

39
-10 -8 -6 -4 -2 0 2 4 6 8 10
0
20
40
60
80
100
soft X-ray corona off
soft X-ray corona on
Ozo
ne
Co
nce
ntr
atio
n (
pp
m)
Voltage (kV)
Figure 2.4 Ozone generation from ESP under base condition (0.04 lpm O2, 0.12 lpm CO2,
0.84 lpm N2)
The above-mentioned results showed that a positive ESP voltage created better Hg0 oxidation
than a negative one. Hence, a voltage of +10 kV was applied to the ESP in subsequent
experiments.
2.3.3 Effect of flue gas compositions
To further elucidate the mechanism, especially how gas composition determines radical
formation (step 3 in the mechanism), Hg0 conversion was measured under pure O2, CO2, and N2,
respectively. The Hg0 conversions and current measurements are shown in Figure 2.5 with

40
simulated flue gas scenarios as reference, and O3 generations in those cases are shown in Figure
A1.4.
O2, +10kV
O2, +10kV, S
XC
N2, +10kV
N2, +10kV, S
XC
CO2, +10kV
CO2, +10kV, S
XC
Simulated, +
10kV
Simulated, +
10kV, SXC
0
20
40
60
80
100
SImulated Flue Gas
Scenario
as Reference
Ele
me
nta
l M
erc
ury
Co
nve
rsio
n E
ffic
ien
cy (
%)
Single Gas Scenarios
84.0 µA45.0 µA
75.0 µA82.0 µA
0 µA
41.5 µA
53.7 µA46.3 µA
Figure 2.5 Mercury conversion efficiencies by ESP and soft X-rays under single gas
environments (total flow rate: 1 lpm, ESP currents for various cases are above the bars, gas
combination: 4% O2, 12% CO2, 84% N2)
Under pure O2, O and O3 radicals were formed in the following reactions (Chen and Davidson,
2002):
2e O O O e (2.5)

41
2 3O O M O M (2.6)
where M is a gas molecule. ESP currents and Hg0 conversions are both high under ESP alone
and ESP with soft X-rays. One noteworthy phenomenon is that the current was lower when the
soft X-ray was on. The reason might be that electrons produced by corona discharge reached an
extremely high concentration in the ionization area due to high concentration of O2 and the
drifting effect shown in Figure 2.3a, and the bipolar charging due to soft X-ray photoionization
actually neutralized the electrons. However, the Hg0 conversions were at the same level in both
cases. Perhaps the radical concentrations were high enough that they were no longer limiting
factors of Hg0 oxidation reactions in both cases.
When N2, is used, soft X-ray and UV radiations as well as high energy electrons were present in
the system, but there was no source for O radicals. In this case, Hg0 conversion was below 5%.
These results verify that radicals generated from oxygen are the main cause of Hg0 oxidation
rather than direction reactions between Hg0 molecule and high energy radiations or electrons.
The slight Hg0 conversion may be due to ionization of excited Hg atoms in the presence of N 2
(Sibata et al., 1979).
Under pure CO2, no Hg0 was oxidized by ESP alone, and no current was detected. This result
agrees with the previous understanding that CO2 plays a role in stabilizing the discharge process
(Wang et al., 2009). However, when soft X-ray was added, a current of 41.5 μA and an Hg0
conversion of 49.1% were reached. The main reaction involved is as follows (Skalny et al.,
2008a, 2008b):
2e CO e O CO (2.7)

42
This reaction leads to generation of O radicals. However, the extent of reaction was extremely
low under corona discharge alone, because the electron- impact dissociation rate of CO2 is 4-5
orders of magnitude lower than that of O2 (Li et al., 1995; Wang et al., 2011). On the other hand,
soft X-ray ionization can generate electrons, which promote the chain reactions and eventually
result in a high concentration of radicals. ESP current measurements support this mechanism. No
current was observed under ESP alone. However, when soft X-rays were on, a current of 41.5
μA was observed. The Hg0 conversion result indicates that soft X-ray enhancement has great
potential in Hg0 oxidation by ESP when high concentrations of CO2 are present in flue gas, such
as in the oxy-combustion case.
The effect of O2 concentrations on Hg0 oxidation by ESP and soft X-rays was also investigated
in simulated flue gas (Figure A1.5). When ESP alone was used, the mercury conversion
efficiency significantly increased as the oxygen concentration increased, because O2 is the major
source for generation of chemically active species. However, when ESP and soft X-rays were
both applied, the Hg0 conversion was relative stable, because CO2 is also an important source for
generation of chemically active species in this condition. The O3 concentrations under various O2
concentrations are shown in Figure A1.6.
2.3.4 Modeling of electron density in an ESP
Based on the above discussed mechanisms and reaction pathways, a model for predicting
electron density distribution was built. The simulation results can explain why the ESP coupled
with soft X-rays oxidized Hg0 better under positive voltages than negative ones. Considering the

43
configuration of the ESP, a 1D axisymmetric model was used to represent a cross section of the
ESP. Its schematic diagram is shown in Figure A1.7.
Shown in eq2.8-eq2.10, the drift-diffusion equation, multicomponent diffusion equations, and
Gauss’ Law are the governing equations for electron density, non-electron species densities, and
the electric field.
( ) [ ( ) ]e e e e e en n E D n Rt
(2.8)
( ) ( )i i i iw u w j Rt
(2.9)
0 E s (2.10)
The generation rates of species were calculated based on 12 electron impaction reactions and 11
chemical reactions (Table A1.2). The ionization rate due to soft X-ray radiation was estimated
based on data from Kulkarni et al. (2002).
Electron density distributions under +10 kV and -10 kV with and without soft X-rays are shown
in Figure 2.6. The number of electrons that were close to the electrode, where the electrons had
higher energies, was higher for the positive voltage cases than negative voltage cases. Electrons
having higher energy were more likely to trigger reactions, such as in eq2.5 and eq2.7, through
which O radicals were produced. This effect can explain our experimental observation that the
Hg0 oxidation rate was higher under positive voltage. Meanwhile, with soft X-rays, the number
of electrons was higher, which resulted in a higher Hg0 oxidation rate.

44
0.1 110
3
104
105
106
107
108
109
1010
1011
1012
1013
1014
1015
1016
1017
20.01656
Ele
ctr
on
Nu
mb
er
Co
nce
ntr
atio
n (
m-3)
Distance from Center (cm)
+10 kV
-10 kV
+10 kV, SXC
-10 kV, SXC
Figure 2.6 Electron density distributions in ESP at +10 kV and -10 kV, with and without soft X-
rays
2.3.5 Effect of particles in flue gas
Flue gas usually contains high concentrations of particulate matter. The particles may participate
in and influence the process of Hg0 oxidation by ESP and soft X-rays in various ways. The
effects of three kinds of particles were studied in this section, including SiO2, TiO2, and KI
particles. SiO2, a chemically inert substance, is one of the main components of fly ash particles.
TiO2 is a well-known and widely applied photocatalyst which can be activated under UV light
and catalyze many reactions (Wold 1993; Wang 2011b, 2012). It has been reported that
oxidation of Hg0 in flue gas by oxygen takes place in the presence of nanostructured TiO2

45
particles and UV light (Wu et al., 1998). KI particles were reported to have the ability to oxidize
Hg0 in flue gas (Li et al., 2009b).
Table 2.2 summarizes Hg0 conversions in the ESP with particle injection. The size distributions
of the particles are shown in Figure A1.8. The SiO2 particles had no significant influence on Hg0
conversion. The slight decrease might be due to a small amount of electrons attaching to the
particles instead of participating in the chain reactions.
Table 2.2 Elemental mercury conversion efficiencies under SiO2, TiO2, and KI particle injection
(gas combination: 0.04 lpm O2, 0.12 lpm CO2, 0.84 lpm N2)
Conversion when ESP
and soft X-rays were
both off
Conversion when just
ESP was on
Conversion when ESP
and soft X-rays were
both on
SiO2 0 53.7%±1.3% 60.3%±1.5%
TiO2 0 14.0%±0.8% 17.3%±0.1%
KI (high
concentration)
92.5%±2.2% 87.1%±2.8% 90.4%±1.1%
KI (low concentration) 19.4%±1.3% 66.1%±3.2% 70.0%±2.5%
The TiO2 particles significantly reduced Hg0 conversion. UV photons from corona discharge and
soft X-rays had energies higher than 3.0 eV, which is the band gap of TiO2. In this case, UV
photons and soft X-rays were absorbed by TiO2 particles, and they excited electrons from TiO2
particles. The generated electron-hole pairs reacted with electron donors or acceptors adsorbed
on the surface of TiO2 particles (Chen and Mao, 2007; Yates, 2009). Thus, the decrease of Hg0

46
conversion might be because both soft X-rays and UV light from corona discharge were partially
absorbed by TiO2 particles. As a result, the extent of gas molecule ionization was reduced, and
eventually fewer radicals were produced. On the other hand, the amount of Hg0 that absorbed on
the surface of TiO2 particles was low, so the contribution of the TiO2 photocatalytic pathway on
Hg0 oxidation was insignificant. Overall, TiO2 particle injection in this test reduced the Hg0
conversion. However, it has been reported that TiO2 particles fixed in a DBD reactor can react
with corona discharge in the reactor and enhance mercury oxidation (Yang et al., 2012a; Yang et
al., 2012b), which is contrary to the results of this study. The explanation is that in the specific
experimental conditions of Yang et al. (2012a, 2012b) active sites containing OH functional
groups were formed on the surface of TiO2 under UV radiation, which resulted in Hg0 oxidation.
KI particles increased the Hg0 conversion by introducing a new pathway for Hg0 oxidation (Li et
al., 2009b):
2 2 24 2 2O KI I K O (2.11)
2 2Hg I HgI (2.12)
Considering the corona discharge and soft X-ray radiation environment, the following reactions
were likely to form I2 radicals:
2 22O KI I K O (2.13)
3 2 2 22O KI I K O O (2.14)
It should be noted that most of the KI particles were quickly deposited on the collection electrode
of the ESP once they flew in, and the chance that they could participate in the reaction was much
lower. This is evidenced by the comparison of Hg0 conversions under different operating

47
conditions with a high concentration of KI particles. When the ESP and soft X-rays were off,
Hg0 conversion of 92.5% was achieved; however, when the ESP was turned on or they were both
turned on, the conversion decreased by 5.4% and 2.1%. Another issue is that reaction between
KI and Hg0 at room temperature was observed in this study. However, in a previous study (Li et
al., 2009b), no conversion was observed. The difference may be due to the longer reside nce time
of the flue gas in the system in this study (30.0 sec compared to 5.8 sec).
2.3.6 Mercury oxidation in flue gas from coal combustion
In this section, mercury oxidation by ESP and soft X-rays was tested in flue gas from coal
combustion in a drop-tube furnace (Figure 2.1b). The particle size distribution in the flue gas
from PRB coal combustion is shown in Figure 2.7. The size distribution is typical for coal
combustion (Zhuang and Biswas, 2001; Suriyawong et al., 2006; Li et al., 2009a; Wang et al.,
2013b). Figure 2.7 also shows that the ESP can remove at least 99.7% of the fly ash particles.
For flue gas with particles, no clear Hg0 conversions were observed (conversion efficiencies
were 1.1%±0.1% with ESP alone, and 1.5%±0.2% with both ESP and soft X-rays).
To compare the flue gas from drop-tube furnace with the simulated gas used in experiment set I;
the composition of the former one is more complicated and contains water vapor, SO2, HCl, and
NOx. Water vapor can enhance Hg0 oxidation due to ∙OH radical generation under corona
discharge (Ko et al., 2008b; Wang et al, 2009; Yang et al. 2012b). SO2 and HCl also can enhance
Hg0 conversion (Figure A1.10 and Figure A1.11). NO interferes Hg0 oxidation because they
compete with Hg0 on reacting with oxidizing radicals (Jeong and Jurng, 2007; Ko et al., 2008a;
Ko et al., 2008b; Wang et al., 2009).

48
Based on the above discussion and the results presented in the last section, two factors, NO and
particles in the flue gas, are known to alter Hg0 oxidation. However, Hg0 conversions in particle-
free flue gas (particles were filtered out by a HEPA filter before flying into the ESP) were still
extremely low (conversion efficiencies were 0 with ESP alone, and 3.9%±0.4% with both ESP
and soft X-rays). Therefore, particles are not the main reason for the conversion reduction. NO in
the flue gas is the cause of the conversion reduction.
10 10010
-1
100
101
102
103
104
105
106
107
108
Corona voltage 0 kV, SXC off
Corona voltage +10 kV, SXC off
Corona voltage +10 kV, SXC on
500400300
Pa
rtic
le N
um
be
r C
on
ce
ntr
atio
n d
N/d
log
Dp (
#/c
m3)
Particle Diameter Dp (nm)
200
Figure 2.7 Particle size distributions of PRB coal combustion downstream of the ESP
Figure 2.8 shows the conversions in the cases where 200 ppm KI was mixed into the coal before
combustion. Higher conversions were observed when the ESP and soft X-rays were turned on,

49
which evidences that Hg0 can be oxidized by ESP and soft X-rays in this condition. If the Hg0
concentration in the flue gas with ESP and soft X-rays off was used as baseline, the conversions
due to ESP and to ESP with soft X-rays were 21.5% and 27.7%, respectively, which are 43.9%
and 42.3% of the values for synthetic flue gas. One explanation might be that with I2 in flue gas
working as an oxidizer in the ESP, the radicals generated by the ESP and soft X-rays were in
excess after the preferred reaction with NO, and they oxidized the Hg0.
KI KI, +10kV KI, +10kV, SXC0
20
40
60
80
100
Ele
menta
l M
erc
ury
Convers
ion E
ffic
iency (
%)
Figure 2.8 Elemental mercury conversion efficiencies by ESP and soft X-rays in practical flue
gas from coal combustion, with KI addition (200 ppm KI in China S03 coal)

50
2.4 Conclusions
The process of Hg0 oxidation by ESP and soft X-rays was investigated. Studies were first
conducted in synthetic flue gas. Hg0 was oxidized under +10 kV and -10 kV voltages of the ESP,
and +10 kV had the better effect. Soft X-rays enhanced the oxidation. A mechanism for Hg0
oxidation was proposed: electrons were emitted due to photoionization caused by UV radiation
from corona discharge and by soft X-ray radiation in the ESP, and then they initiated chain
reactions that produced electrons, intermediate species, and other products. Radicals, such as O
and O3, were produced in the chain reactions, and they oxidized Hg0. A model simulating the
plasma processes was built for predicting the electron distribution in the ESP.
Oxidation mechanisms were further demonstrated by experiments conducted under single gas
environments. Especially, in pure CO2 soft X-ray photoionization showed significant
enhancement on Hg0 oxidation. SiO2 particles did not have a significant effect on Hg0 oxidation
process; TiO2 particles absorbed photons from corona discharge and soft X-rays and inhibited
the Hg0 oxidation; KI particles enhanced Hg0 oxidation, because I- could be oxidized into I2
radicals.
In practical flue gas from coal combustion, the effects of ESP and soft X-rays on Hg0 oxidation
were not significant, which might be due to interference from NO. With KI addition to the coal,
beneficial effects of ESP and soft X-rays on Hg0 oxidation could be observed. With the ESP
voltage at +10 kV, soft X-ray enhancement, and KI addition, mercury oxidation was maximized.

51
2.5 Nomenclature
a = order of reaction between elemental mercury and ozone with respect to ozone
b = order of reaction between elemental mercury and ozone with respect to elemental mercury
c = concentration
c = average concentration in the ESP
c = change of concentration
D = diffusivity
E = intensity of electric field
j = diffusive flux vector
k = reaction rate constant
n = number concentration
R = generation rate
s = space charge density
t = time
u = mass averaged fluid velocity vector
w = mass fraction
52
Greek Letters
= permittivity
= electric mobility
= density
Subscripts
e = electron
0Hg = elemental mercury
0 3Hg O = reaction between elemental mercury and ozone
i = species i
3O = ozone
off = ESP is off
on = ESP is on
0 = reference index (represent vacuum in eq10)
53
2.6 References
Byun, Y., K.B. Ko, M. Cho, W. Namkung, D.N. Shin, J.W. Lee, D.J. Koh, and K. T. Kim. 2008.
Oxidation of elemental mercury using atmospheric pressure non-thermal plasma.
Chemosphere 72:652-658.
Byun, Y., D.J. Koh, and D.N. Shin. 2011a. Removal mechanism of elemental mercury by using
non-thermal plasma. Chemosphere 83:69-75.
Byun, Y., D.J. Koh, D.N. Shin, M. Cho, and W. Namkung. 2011b. Polarity effect of pulsed
corona discharge for the oxidation of gaseous elemental mercury. Chemosphere 84:1285-
1289.
Chen, J. 2002. Direct-current corona enhanced chemical reactions. Ph.D. Thesis, University of
Minnesota, USA.
Chen, J., and J.H. Davidson. 2002. Ozone production in the positive DC corona discharge:
Model and comparison to experiments. Plasma Chem. Plasma P. 22(4):495-522.
Chen, X., and S.S. Mao. 2007. Titanium dioxide nanomaterials: synthesis, properties,
modifications, and applications. Chem. Rev. 107:2891-2959.
Chen, Z., D.P. Mannava, and V.K. Mathur. 2006. Mercury oxidization in dielectric barrier
discharge plasma system. Ind. Eng. Chem. Res. 45:6050-6055.
Feeley, T.J., L.A. Brickett, J.T. Murphy. 2003. Evaluation of the effect of SCR NOx control
technology on mercury speciation.
http://www.netl.doe.gov/technologies/coalpower/ewr/pubs/SCRHgPaperFinal030503.pdf
(accessed December 21, 2013)

54
Fujiwara, N., Y. Fujita, K. Tomura, H. Moritomi, T. Tuji, S. Takasu, S. Niksa. 2002. Mercury
transformations in the exhausts from lab-scale coal flames. Fuel 81:2045-2052.
Gao, Y., Z. Zhang, J. Wu, L. Duan, A. Umar, L. Sun, Z. Guo, and Q. Wang. 2013. A critical
review on the heterogeneous catalytic oxidation of elemental mercury in flue gases.
Environ. Sci. Tech. 47, 10813-10823.
Hall, B. 1995. The gas phase oxidation of elemental mercury by ozone. Water Air Soil Poll.
80:301-315.
Hedrick, E., T.G. Lee, P. Biswas, and Y. Zhuang. 2001. The development of iodine based
impinger solutions for the efficient capture of Hg0 using direct injection nebulization-
inductively coupled plasma mass spectrometry analysis. Environ. Sci. Eng. 35:3764-3773.
Hogan, C.J., Jr., M.H. Lee, and P. Biswas. 2004. Capture of viral particles in soft X-ray–
enhanced corona systems: charge distribution and transport characteristics. Aerosol Sci.
Tech. 38:475-486.
Hu, C.X., J.S. Zhou, S. He, L. Zhang, J.M. Zhang, Z.Y. Luo, K.F. Cen. 2009. Influence and
control of electrostatic precipitators and wet flue gas desulfurization systems on the
speciation of mercury in flue gas. J. Power Eng. 29(4):400-404.
Jeong, J., and J. Jurng. 2007. Removal of gaseous elemental mercury by dielectric barrier
discharge. Chemosphere 68:2007-2010.
Jiang, Y., J. An, K. Shang, D. Jiang, J. Li, N. Wu, and Y. Lu. 2013. Oxidation efficiency of
elemental mercury in two DBD plasma reactors. JPCS 418:012118.

55
Kettleson, E.M., B. Ramaswami, C.J. Hogan, Jr., M.H. Lee, G.A. Statyukha, P. Biswas, and L.T.
Angenent. 2009. Airborne virus capture and inactivation by an electrostatic particle
collector. Environ. Sci. Eng. 43:5940-5946.
Kettleson, E.M., J.M. Schriewer, R.M.L. Buller, and P. Biswas. 2013. Soft-X-ray-enhanced
electrostatic precipitation for protection against inhalable allergens, ultrafine particles,
and microbial infections. Appl. Environ. Microb. 79(4):1333-1341..
Ko, B.K., Y. Byun, M. Cho, W. Namkung, D.N. Shin, D.J. Koh, and K.T. Kim. 2008a. Influence
of HCl on oxidation of gaseous elemental mercury by dielectric barrier discharge process.
Chemosphere 71:1674-1682.
Ko, B.K., Y. Byun, M. Cho, W. Namkung, I.P. Hamilton, D.N. Shin, D.J. Koh, and K.T. Kim.
2008b. Pulsed corona discharge for oxidation of gaseous elemental mercury. Appl. Phys.
Lett. 92:251503.
Ko, B.K., Y. Byun, M. Cho, W. Namkung, I.P. Hamilton, D.N. Shin, D.J. Koh, and K.T. Kim.
2008c. Influence of gas components on the oxidation of elemental mercury by positive
pulsed corona discharge. Main Group Chem. 7(3):191-204.
Korpiel, J.A., and R.D. Vidic. 1997. Effect of sulfur impregnation method on activated carbon
uptake of gas-phase mercury. Environ. Sci. Eng. 31(8):2319-2325.
Kuikarni, P., N. Namiki, Y. Otani, and P. Biswas. 2002. Charging of particles in unipolar
coronas irradiated by in-situ soft X-rays: enhancement of capture efficiency of ultrafine
particles. J. Aerosol Sci. 33:1279-1296.
Li, J., W. Sun, B. Pashaie, and S.K. Dhali. 1995. Streamer discharge simulation in flue gas. IEEE
T. Plasma Sci. 23(4):672-678.

56
Li, Y., A. Suriyawong, M. Daukoru, Y. Zhuang, and P. Biswas. 2009a. Measurement and capture
of fine and ultrafine particles from a pilot-scale pulverized coal combustor with an
electrostatic precipitator. J. Air & Waste Manage. Assoc. 59:553-559.
Li, Y., M. Daukoru, A. Suriyawong, and P. Biswas. 2009b. Mercury emissions control in coal
combustion systems using potassium iodide: bench-scale and pilot-scale studies. Energ.
Fuel. 23:236-243.
Liang, X., S. Jayaram, P. Looy, A. Berezin, and J.S. Chang. Pulse Corona Application for the
Collection of Mercury from Flue Gas. Paper presented at 1998 IEEE International
Symposium on Electrical Insulation, Arlington, VA, June 7-10, 1998.
Liang, X., P.C. Looy, S. Jayaram, A.A. Berezin, M.S. Mozes, and J.S. Chang. 2002. Mercury
and other trace elements removal characteristics of DC and pulse-energized electrostatic
precipitator. IEEE T. Ind. Appl. 38(1):69-76.
Lin, W., B. Zhang, W. Hou, Q. Zhou, and H. Yang. 2010. Enhanced oxidation of elemental
mercury in simulated flue gas by non-thermal plasma. Proc. CSEE 30(2):72-76.
Namiki, N., K. Cho, P. Fraundorf, and P. Biswas. 2005. Tubular reactor synthesis of doped
nanostructured titanium dioxide and its enhanced activation by coronas and soft X-rays.
Ind. Eng. Chem. Res. 44:5213-5220.
Pal, B., and P.A. Ariya. 2004. Studies of ozone initiated reactions of gaseous mercury: kinetics,
product studies, and atmospheric implications. Phys. Chem. Chem. Phys. 6:572-579.
Parker, K.R. 2003. Electrical Operation of Electrostatic Precipitators. London: The Institution of
Electrical Engineers.

57
Qunn, R.J., M. Neville, M. Janghorbani, C.A. Mims, and A.F. Sarofim. 1982. Mineral matter and
trace-element vaporization in a laboratory-pulverized coal combustion system. Environ.
Sci. Eng. 16(11):776-781.
Richardson, C., T. Machalek, B. Marsh, S. Miller, M. Richardson, R. Chang, M. Strohfus, S.
Smokey, T. Hagley, G. Juip, and R. Rosvold. Chemical addition for mercury control in
flue gas derived from western coals. Joint EPRI DOE EPA Combined Utility Air
Pollution Control Symposium, The Mega Symposium, Washington, D.C., May 19-22,
2003.
Sibata, A., M. Takahasi, H. Mikuni, H. Horiguchi, and S. Tsuchiya. 1979. Chemi- ionization of
excited mercury atom with 253.7 nm irradiation in the presence of N2 and CH4. B. Chem.
Soc. Jpn. 52(1):15-20.
Sjostrom, S., M. Durham, C.J. Bustard, and C. Martin. 2010. Activated carbon injection for
mercury control: Overview. Fuel 89(6):1320-1322.
Skalny, J.D., S. Matejcik, J. Orszagh, R. Vladoiu, and N.J. Mason. 2008a. A study of the
physical and chemical processes active in corona discharges fed by carbon dioxide.
Ozone-Sci. Eng. 30:145-151.
Skalny, J.D., A. Stoica, J. Orszagh, R. Vladoiu, and N.J. Mason. 2008b. Positive and negative
corona discharges in flowing carbon dioxide. J. Phys. D: Appl. Phys. 41:175211.
Suriyawong, A., M. Gamble, M.H. Lee, R. Axelbaum, and P. Biswas. 2006. Submicrometer
particle formation and mercury speciation under O2-CO2 coal combustion. Energ. Fuel.
20:2357-2363.

58
Suriyawong, A., C.J. Hogan, Jr., J. Jiang, and P. Biswas. 2008. Charged fraction and electrostatic
collection of ultrafine and submicrometer particles formed during O2-CO2 coal
combustion. Fuel 87:673-682.
Suriyawong, A., M. Smallwood, Y. Li, Y. Zhuang, and P. Biswas. 2009. Mercury capture by
nano-structured titanium dioxide sorbent during coal combustion: lab-scale to pilot-scale
studies. Aerosol Air Qual. Res. 9(4):394-403.
Urabe, T., Y. Wu, T. Nagawa, and S. Masuda. 1988. Study on Hg, NOx, SOx behavior in
municipal refuse incinerator furnace and removal of those by pulse corona discharge.
Seiso Giho 13:12-29.
U.S. Environmental Protection Agency. 2011. Cleaner power plants.
http://www.epa.gov/mats/powerplants.html (accessed July 2013).
Van Veldhuizen, E.M. 2000. Electrical Discharges for Environmental Purpose: Fundamentals
and Applications. New York: Nova Science Publishers.
Wang, M., T. Zhu, H. Luo, P. Tang, and H. Li. 2009. Oxidation of gaseous elemental mercury in
a high voltage discharge reactor. J. Environ. Sci.-China 21:1652-1657.
Wang, M., T. Zhu, H. Luo, H. Wang, and W. Fan. 2011a. Effects of reaction conditions on
elemental mercury oxidation in simulated flue gas by DC nonthermal plasma. Ind. Eng.
Chem. Res. 50:5914-5919.
Wang, M., Y. Sun, and T. Zhu. 2013a. Removal of NOx, SO2, and Hg from simulated flue gas by
plasma–absorption hybrid system. IEEE T. Plasma Sci. 41(2):312-318.

59
Wang, W.N., J. Park, and P. Biswas. 2011b. Rapid synthesis of nanostructured Cu-TiO2-SiO2
composites for CO2 photoreduction by evaporation driven self-assembly. Catal. Sci. Tech.
1(4):593-600.
Wang, W.N., W.J. An, B. Ramalingam, S. Mukherjee, D.M. Niedzwiedzki, S. Gangopadhyay,
and P. Biswas. 2012. Size and structure matter: enhanced CO2 photoreduction efficiency
by size-resolved ultrafine Pt nanoparticles on TiO2 single crystals. J. Am. Chem. Soc.
134(27):11276-11281.
Wang, X., S.M. Daukoru, S. Torkamani, W.N. Wang, and P. Biswas. 2013b. Role of exhaust gas
recycle on submicrometer particle formation during oxy-coal combustion. P. Combust.
Inst. 34:3479-3487.
Wang, Y.J., Y.F. Duan, L.G. Yang, S.L. Meng, Z.J. Huang, C.J. Wu, and Q. Wang. 2008.
Experimental study on mercury removal by combined wet flue gas desulphurization with
electrostatic precipitator. Proc. CSEE 28(29):64-69.
Wang, Z.H., S.D. Jiang, Y.Q. Zhu, J.S. Zhou, J.H. Zhou, Z.S. Li, and K.F. Cen. 2010.
Investigation on elemental mercury oxidation mechanism by non-thermal plasma
treament. Fuel. Process. Technol. 91:1395-1400.
Wold, A. 1993. Photocatalytic Properties of TiO2. Chem. Mater. 5:280-283.
Worathanakul, P., P. Kongkachuichay, J.D. Noel, A. Suriyawong, D.E. Giammar, and P. Biswas.
2008. Evaluation of nanostructured sorbents in differential bed reactors for elemental
mercury capture. Environ. Eng. Sci. 25(7):1061-1070.

60
Wu, C.Y., T.G. Lee, G. Tyree, E. Arar, and P. Biswas. 1998. Capture of mercury in combustion
systems by in situ-generated titania particles with UV irradiation. Environ. Eng. Sci.
15(2):137-148.
Xie, R., Y. Duan, Y. Cao, L.C. Li, S. Kellie, W.P. Pan, J.T. Riley, K. Ho, P. Chu, and A. Metha.
2002. Mercury speciation and concentration at ESP in a 100 MWth coal- fired power
plant. Abstr. Pap. Am. Chem. S. 224:U574.
Xu, F., Z. Luo, W. Cao, P. Wang, B. Wei, X. Gao, M. Fang, and K. Cen. 2009. Simultaneous
oxidation of NO, SO2 and Hg0 from flue gas by pulsed corona discharge. J. Environ. Sci.-
China 21:328-332.
Yang, H., W. Hou, H. Zhang, and L. Zhou. 2012. Oxidation of elemental mercury with non-
thermal plasma coupled with photocatalyst. J. Adv. Oxid. Technol. 15(2):321-327.
Yang, H., H. Liu, H. Wu, and M. Wang. 2012. Photochemical removal of gaseous elemental
mercury in a dielectric barrier discharge plasma reactor. Plasma Chem. Plasma P.
32:969-977.
Yang, L., X. Fan, D. Feng, and Y. Wang. Mercury removal characteristics of coal- fired power
plants. Paper presented at 2013 Third International Conference on Intelligent System
Design and Engineering Applications, Hong Kong, China, January 16-18, 2013.
Yates, J.T., Jr.. 2009. Photochemistry on TiO2 : Mechanisms behind the surface chemistry. Surf.
Sci. 609:1605-1612.
Zhuang, Y., and P. Biswas. 2001. Submicrometer particle formation and control in a bench-scale
pulverized coal combustor. Energ. Fuel. 15:510-516.
61
CHAPTER 3. SECONDARY AEROSOLS GENERATION IN AN ELECTROSTATIC
PRECIPITATOR DURING FLUE GAS TREATMENT
The results of this chapter will be compiled as a paper for submission to Energy & Fuels (authors: He Jing, Xiaofei Wang, Wei-Ning Wang, Bhupesh Dhungel, Benjamin M. Kumfer, Richard L.
Axelbaum, Brent J. Williams, Pratim Biswas).
Supplementary materials are available in Appendix II

62
Abstract
Electrostatic precipitators (ESPs) are widely used to control fly ash particulate matter in flue gas
treatment for coal combustion processes. This study reports a mechanistic understanding of
formation of secondary aerosols concurrenting in an ESP, secondary aerosols could be formed at
the same time. The newly formed aerosols were mostly ultrafine (< 100 nm) particles, with a
unimodal size distribution (GMD = 20 nm). Their chemical composition, as characterized by a
HR-Tof-AMS (aerosol mass spectrometer), shows that the secondary aerosols contained high
concentrations of sulfates and organics, which is very likely from sulfuric acid (H2SO4) and
various organics. The most probable aerosol formation mechanisms are: first, H2SO4 vapor is
produced from reactions among sulfur dioxide (SO2), water (H2O) in the flue gas, and the
oxidizing radicals generated by the corona discharge in the ESP. Following this, H2O-H2SO4
aerosols are formed through ion- induced nucleation, and grow by condensation and coagulation;
concurrently, organic compounds are absorbed on the particles. The role of SO2 concentration,
the water content in the flue gas, the ESP voltage, and the flow rate on the H2O-H2SO4 secondary
aerosol formation was evaluated.

63
3.1 Introduction
Currently, 38.7% of U.S. electricity is provided by coal- fired power plants (Hankey 2015).
570,000 tons of PM2.5 are produced annually from U.S. coal- fired power plants (Davidson et al.,
2005). To control such particle emissions, electrostatic precipitators (ESPs) are effectively used,
with high overall mass-based collection efficiencies exceeding 99%.
Fine (<2.5 μm) and ultrafine (<0.1 μm) aerosols have received special attention because they can
penetrate into the alveolar regions of the lungs upon inhalation, and create more severe health
hazards for human beings (Biswas and Wu, 2005). Thus, the fine particle capture capability of
ESPs has been specifically studied on both bench-scale ESPs with synthetic particles (Yoo et al.,
1997; Zhuang et al., 2000; Jing et al., 2013; Huang and Chen, 2002) and ESPs with particles and
flue gas from combustion systems (McCain et al., 1975; Ylätalo and Hautanen, 1998;
Suriyawong et al., 2008). Two phenomena were commonly observed. (1) A minimum collection
efficiency was observed for the 0.1-1 μm size range; due to the combined effects of diffusion
charging, which increases with decreased particle sizes, and field charging, which increases with
increased particle sizes. (2) In the ultrafine size range below 100 nm, the collection efficiency
decreased with decreasing size. A key reason for this was that the particle charging efficiency
decreased dramatically as the particle size became smaller (Kulkarni et al., 2002).
However, in previous fine particles collection studies (Li et al., 2009), the important factor, new
particle formation in the ESP operation process has rarely been taken into account, such
formation might be the reason for the extremely high penetration in the low particle size range
(below 30 nm). Theoretically, new particle formation, which can be referred to as secondary
aerosol (SA) generation in this case, is possible under DC (direct current) corona discharge (the
main ion generation mechanism of the ESP) in the presence of gaseous pollutants such as SO2,

64
NO, and VOCs in the flue gas. Two mechanisms may contribute to particle formation. First,
corona discharge in the ESP produces oxidizing radicals, such as ·O and O3, in the presence of
O2 (Jing et al., 2015). These radicals may react with the aforementioned volatile compounds and
produce semi- or non-volatile compounds, which further form particles through gas-solid phase
partitioning (Nagato 2009). Second, ion- induced nucleation may take place under corona
discharge and promote particle formation (Wilhelm et al., 2004; Sorokin et al., 2006; Nagato,
2009; Lapshin et al., 2012; Hvelplund et al., 2013). However, to the best of our knowledge, there
is no report on SA particle formation in the ESP during flue gas treatment.
In this study, the SA formation in the ESP was first verified and characterized with a slip stream
exhaust gas from a pilot-scale combustion system. The SA chemical composition was
determined using an aerosol mass spectrometer (AMS) on a lab-scale drop-tube furnace
combustion system to unravel the mechanistic pathway. Finally, the effects of ESP operating
conditions, flow rate through the ESP, and gas compositions in flue gas on SA formation were
evaluated on a simulated flue gas system.
3.2 Experimental Section
3.2.1 Experimental system
A bench-scale DC corona-based wire-cylinder type ESP was used and was described in previous
studies (Jing et al., 2015). The ESP configuration is shown in Figure A2.1 in supporting
information. The experiments were conducted on three experimental systems of different scales.
The first system was a 1 MW capacity pilot-scale coal combustor with a boiler in the Advanced
Coal and Energy Research Facility (ACERF) at Washington University in St. Louis (Figure 3.1a).

65
West Elk bituminous coal was combusted. The proximate and ultimate analyses are shown in
Table A2.1. For the air- fired combustion cases, the facility was operated at 400 kW thermal
power; for the oxy-combustion case, the facility was operated at 270 kW power. A slipstream of
gases was drawn after the boiler, passed through a cascade impactor (1 μm cut-off size; Mark III,
Pollution Control Systems Corp., Seattle, WA), and then introduced into the ESP. A scanning
mobility particle sizer (SMPS, TSI, model 3080, Shoreview, MN) was used to measure the fly
ash particle size distribution. In the ESP efficiency test, the particle penetration for each size was
determined by:
P(𝑑𝑝) =𝑁𝑜𝑢𝑡 (𝑑𝑝)
𝑁𝑖𝑛 (𝑑𝑝), (3.1)
where P is the particle penetration, Nout and Nin are the particle concentrations downstream and
upstream from the ESP, and dp is the particle diameter. For direct measurement of the secondary
aerosols, a HEPA (High-efficiency particulate arrestance) filter (Pall Corporation, Port
Washington, NY) was placed before the ESP to remove all particles to ensure that the particles
detected were from new particle formation processes. During all of the above experiments, the
flow rate through the ESP was 10 LPM.
The drop-tube furnace system is shown in Figure 3.1b. The configuration and parameters have
been discussed in previous papers (Wang et al., 2013a; Wang et al., 2015). Illinois No.6 coal
(proximate and ultimate analyses shown in Table A2.1) was fed at a rate of 2.5 g/hr. A high-
resolution time-of-flight aerosol mass spectrometer (HR-Tof-AMS, Aerodyne Research Inc,
Billerica, MA) was used to analyse the SA chemical composition. In order to increase the
particles size of SAs beyond the critical particle diameter required by AMS (lower size limit: 40
nm), particles were grown with water vapor in a bubbler before they entered the AMS. In the

66
simulated flue gas system (Figure 3.1c), air was mixed with SO2 and water vapor to mimic the
flue gas. The water vapor was introduced by passing air through a water bubbler. In both lab-
scale systems, HEPA filters were placed before the ESP. The flow rate through the ESP was 15
LPM unless noted.
(a)

67
(b)
(c)
Figure 3.1 Schematic of experimental setups: (a) ACERF pilot-scale combustion system and
particulate matter measurement instruments; (b) drop-tube furnace system (figure adapted from
Wang et al., 2013); (c) simulated flue gas system

68
3.2.2 High-resolution time-of-flight aerosol mass spectrometer (HR-Tof-AMS)
In this study, a HR-Tof-AMS (Aerodyne Research Inc, Billerica, MA) was used to determine the
chemical compositions of the aerosols. Aerosols were introduced into the instrument through an
aerodynamic lens and focused into a narrow beam, and then the sizes of the aerosols were
determined by their velocities through a time of flight chamber. After that, the particles were
impacted on a 600 oC vaporizer for chemical analysis. The non-refractory portion of the particles
was vaporized and immediately ionized through electron impact ionization, resulting ions were
analysed by the time-of-flight mass spectrometer.
3.2.3 Experimental design
This study was conducted in three steps. In the first step, SA formation was verified in a pilot-
scale setting (1 MW combustion system). The particle size distribution was characterized.
Second, the chemical composition was determined on the drop-tube furnace system with AMS.
Last, parameter studies were conducted to study the SA formation. The detailed experimental
design is shown in Table 3.1.

69
Table 3.1 Summary of the experiments performed
Set Objective Flue gas Measurement
I To verify the secondary
aerosol formation in
ESP
Slipstream from the boiler
of ACERF pilot-scale
combustion system
Size distributions of secondary
aerosols by SMPS
II To characterize the
chemical composition
of secondary aerosols
Flue gas from coal
combustion in the drop-
tube furnace system
Size distributions of secondary
aerosols by SMPS;
Chemical compositions of
secondary aerosols by AMS
II To evaluate the effects
of SO2 concentration,
water content, ESP
voltage, and flow rate
through ESP on the
secondary aerosols
formation
Gas mixture of air, SO2,
and water vapor
Size distributions of secondary
aerosols by SMPS
3.3 Results and Discussion
3.3.1 Observation of SA formation and particle size distribution measurement
The fly ash particles introduced from the combustor into the ESP were submicrometer aerosols
with a unimodal distribution (Figure A2.2). Such fly ash aerosol size distribution is typical for
coal combustion (Zhuang and Biswas, 2001; Suriyawong et al., 2006; Wang et al., 2013b). The
flue gas compositions corresponding to different runs are summarized in Table A2.2. The ESP

70
demonstrated high collection efficiencies for particles larger than 30 nm, with both positive and
negative voltages, as shown in Figure 3.2. However, for particles smaller than 30 nm, the
penetration increased dramatically as the particle size decreased, which is in agreement with the
findings of Li et al. (Li et al., 2009) from a pilot-scale ESP. This penetration increase may be
partially due to the decrease in the charging efficiency of ultrafine particles, especially sub-50
nm (Yoo et al., 1997; Zhuang et al., 2000; Huang and Chen, 2002; Jing et al., 2013). However,
as particle size dropped below 20 nm, we observed that penetration exceeded one which could
only be explained by new particle formation.

71
10 1001E-5
1E-4
1E-3
0.01
0.1
1
10
100
ESP voltage
-10 kV
+10 kV
Pe
ne
tra
tio
n
Particle Diameter (nm)
200
Figure 3.2 Penetrations of fly ash particles through ESP at ACERF pilot-scale system (for -10
kV and +10 kV ESP voltages)
Previously, new particle formation in ESP-type indoor air cleaners and WESPs (wet ESPs) has
been reported. Waring et al. (Waring et al., 2008) observed SA generation from VOCs in an
ESP-type indoor air cleaner. Recently, formation of hydrobromic and hygrochloric acid (HBr
and HCl) aerosols (Sinanis et al., 2013), as well as sulfuric acid (H2SO4) aerosols (Mertens et al.,
2014; Anderlohr et al., 2015) in a WESP have been reported. Closely related to this topic, it has
been reported that corona discharge reactors can initiate reactions with SO2 and NO to form
H2SO4 and HNO3 particles (Matteson et al., 1972; Kuroki et al., 2002; Mok and Nam, 2002;
Dong et al., 2003), and the particles were expected to be collected in the reactors. A penetration,

72
P > 1, observed in this study (Figure 3.2) clearly indicates that new particles can be formed in a
dry ESP and penetrate through during exhaust gas treatment.
In order to directly measure the size distribution of newly formed SAs, particles were removed
with a HEPA filter before they entered the ESP. In coal- fired power plants, ESPs are usually
operated under negative polarity in order to achieve higher ion concentrations and capture
efficiency, so the test ESP was fixed in negative voltage mode in all following experiments.
Three combustion conditions were tested ([1] air- fired with 2% O2 in the flue gas, [2] air-fired
with 4% O2 in the flue gas, and [3] 40% O2/60% air as oxidizer). The flue gas compositions and
flow rates are summarized in Table A2.2. Figure 3.3 shows that the SAs leaving the ESP had a
unimodal size distribution, which is an outcome of two competing processes, the formation of
SAs and the simultaneous capture of newly formed SAs in the ESP. The SAs formed through
nucleation and condensation typically has a unimodal size distribution (Hinds 1999), which
greatly determined the size distribution of SAs exiting the ESP. At the same time, ESPs have
lower capture efficiency for smaller particles. Previous studies have shown that the efficiency of
ESPs dropped dramatically when the particle size was below 30 nm (Hogan et al., 2004). This
drop could explain why in all the three studied cases with different flue gas compositions, the
peak of the size distributions remained at 20 nm. It is important to note that with fly ash present,
the size distribution of newly formed aerosols might be slightly different from that shown in
Figure 3, because some of the secondary aerosol precursor molecules might condense on the fly
ash particles instead of forming new particles.

73
10 10010
2
103
104
105
106
107
200 300
-10kV, Air-firing, 2% O2 in flue gas
-10kV, Air-firing, 4% O2 in flue gas
-10kV,Oxy-combustion, 40% O2 in the inflow
dN
/dlo
gD
p
Particle Diameter (nm)
400
Figure 3.3 Particle size distributions of secondary aerosols formed in the ESP during flue gas
treatment
3.3.2 Chemical compositions and formation mechanism of SAs
In order to measure the chemical composition of the SAs, formation in an ESP was repeated on a
lab-scale drop-tube (Figure 3.1b). As in the pilot-scale system test, the SAs had a unimodal size
distribution with a peak size of 22 nm (Figure A2.3). The mass spectrum of SAs is shown in
Figure 3.4a. The main compositions of SAs were sulfate ions and organics.

74
Significant sulfate fragment peaks are observed at m/z 48 (SO+), 64 (SO2+), 80 (SO3
+), and 98
(H2SO4+), which shows that the SAs contained a significant amount of SO4
2-. Considering the
compositions of the flue gas and possible reactions, as well as that there were limited ammonium
or other metal cations in the particles; the main component of the SAs was expected to be
sulfuric acid (H2SO4). To be specific, the newly formed aerosols are likely to be H2O-H2SO4
aerosols (Van Dingenen and Raes, 1991). The formation of those aerosols can be divided into
two steps: (1) H2SO4 vapor is produced from SO2 through oxidation reactions; (2) H2SO4 vapor
then forms H2O-H2SO4 particles through gas-solid partitioning in the presence of water vapor.
For step 1, the mechanism of H2SO4 vapor production under corona discharge is well known
(Mok and Nam, 2002): (1a) The oxidizing radicals, such as O∙, OH∙, and O3, are formed in the
ESP under corona discharge; (1b) The radicals react with SO2 and finally produce H2SO4. The
key reactions for step 1b are summarized below:
𝑆𝑂2 + 𝑂 → 𝑆𝑂3 (3.2)
𝑆𝑂2 + 𝑂𝐻 → 𝐻𝑆𝑂3 (3.3)
𝑆𝑂2 + 𝑂3 → 𝑆𝑂3 +𝑂2 (3.4)
𝐻𝑆𝑂3 + 𝑂𝐻 → 𝐻2𝑆𝑂4 (3.5)
𝑆𝑂3 + 𝐻2𝑂 → 𝐻2𝑆𝑂4 (3.6)
In step 2, nuclei are formed through ion- induced nucleation. Ion charge reduces the nucleation
barrier and the size of the critical cluster, and thus helps to form new particles more efficiently
(Lovejoy et al., 2004). Based on previous studies (Nagato, 2009; Hvelplund et al., 2013), the
clusters that could form in this condition include H+(H2SO4)(H2O)n, HSO5-(H2O)n, and SO4
-

75
(H2O)n. After nucleation, the aerosols grow through condensation and coagulation (Stauffer et al.,
1973; Hamill 1975; Hinds 1999). The pathways discussed above are shown in Figure 5 (the right
part of the schematic diagram).
In the mass spectrum of SAs (Figure 3.4a), major peaks are also observed at several m/z values,
which shows the presence of organics in the particles. Especially, the peaks at m/z 44, 60, 73
indicate the presence of carboxylic acids. The peak at 57 is likely to be hydrocarbon- like
fragments (CxHy+) (Canagaratna et al., 2007). Aldehydes and alcohols (m/z 27, 29, 31, 41, 43, 55,
56, 57, 70) were also major organics in the SAs. Peaks at m/z 77 and 91 are not significant,
suggesting there was almost no aromatic compounds in the SA (Ng et al., 2010; McLafferty and
Tureek, 1993). A possible pathway for the formation of the organic components: start with
organic vapor in the flue gas. Inside the ESP, the molecules of organic compounds are adsorbed
by the sulfuric particles as they grow (physical/chemical adsorption), and as a result the SAs
have a significant amount of organics. This pathway is also shown in Figure 3.5.
The evolution of the composition of organic species in the SAs is further supported by the high
resolution of the AMS spectrum (Figure 3.4b). Hydrocarbon (CH)- like species were the main
organic species, which suggests that it is unlikely that they were formed through oxidation and
nucleation. Instead, probably H2O-H2SO4 particles absorbed these organics from the gas phase
directly. Other than CH-like species, CxHyO+ and CxHyOz+ ion series also contribute a significant
fraction to the total organics.

76
(a)
(b)
Figure 3.4 Average mass spectra for particulate matter generated in the ESP: (a) mass spectrum
of secondary aerosols; (b) High resolution spectrum of organics

77
It should be noted that AMS measurements have also been done under control conditions: with
coal feeding but with ESP off. The corresponding mass spectrum, in Figure A2.4, shows that no
significant sulfate or organic chemical signals were found. This observation confirms that the SA
formation was due to the corona discharge in the ESP.
Figure 3.5 is the schematic diagram of the SA formation in the ESP. Besides the mechanisms of
aerosol formation discussed above, the capture of newly formed aerosols by the ESP is also
taken into account. The left part of the schematic diagram shows the fate of the aerosols in the
ESP. While exhaust gases go through the ESP, aerosols are formed, and then grow (process 1);
simultaneously, some of the newly formed aerosols are captured by the ESP (process 2). As
shown in the left part of Figure 3.5, the difference between the newly formed aerosols and the
captured aerosols are the SAs that can be observed downstream of the ESP (part 3 in the left side
of Figure 3.5). Similar simultaneous aerosol formation and deposition process has been well
described in previous studies (Borra 2006, 2008). The aerosol formation (process 1) is governed
by the kinetics of vapor phase H2SO4 formation and the dynamics of aerosols; while the capture
of aerosols (process 2) is determined by the kinematics of the aerosols in the ESP, which is
influenced the flow and electric fields, and the particle charging. To better understand the SA
formation process and assist in predicting the SA emission from an ESP under practical
operating conditions, the critical parameters of chemical kinetics, aerosol dynamics, and the
growth dynamics of aerosols influence the whole process were investigated.

78
Figure 3.5 Mechanistic description of the secondary aerosol formation process in the ESP
3.3.3 Effects of SO2 concentration, humidity, ESP voltage, and flow rate on H2SO4 SA formation
In the last section, it was proposed that formation of H2O-H2SO4 aerosols is the key pathway of
SA formation. A parametric study was performed on a simulated flue gas system to evaluate the
effects of SO2 concentration, the water content in the gas phase, the ESP voltage, and the flow
rate through the ESP on H2O-H2SO4 SA formation. The size distributions of SAs that exit the
ESP under various conditions are shown in Figure 3.6.

79
10 15 20 25 30 35 40 45 5010
3
104
105
106
107
16.7ppm
20ppm
25ppm
50ppm
100ppm
200ppm
400ppm
800ppm
dN
/dlo
gD
p (
#/c
m3
)
Particle size (nm)
Increasing
SO2 concentration
(a) effect of SO2 concentration
10 15 20 25 30 35 40 45 5010
3
104
105
106
107
RH20%
RH99%
dN
/dlo
gD
p (
#/c
m3
)
Particle size (nm)
(b) effect of water content
10 15 20 25 30 35 40 45 5010
6
107
Increasing ESP voltage ESP voltage
-10 kV
-9 kV
-8 kV
-7 kV
-6 kV
-5 kV
dN
/dlo
gD
p (
#/c
m3
)
Particle size (nm)
(c) effect of ESP voltage
10 15 20 25 30 35 40 45 5010
6
107
5 LPM
10 LPM
15 LPM
20 LPM
25 LPM
dN
/dlo
gD
p (
#/c
m3
)
Particle Diameter (nm)
(d) effect of flow rate through ESP
Figure 3.6 Size distributions of secondary aerosols under various conditions (a: SA size
distributions under different SO2 concentrations; b: SA size distributions under different water
contents; c: SA size distributions under different ESP voltages; d: SA size distributions under
different flow rates)
As shown in Figure 3.6a, in the SO2 concentration range between 16.7 ppm to 200 ppm, higher
SO2 concentrations resulted in higher SA concentrations and larger particle sizes. Conversely,
when the SO2 concentration exceeded 200 ppm, the size distribution of SAs remained the same.
The reactions among SO2, oxidizing radicals, and H2O played an important role in this set of
tests. While the SO2 concentration varied, the concentrations of H2O and oxidizing radicals were

80
kept the same. When the SO2 concentration was below 200 ppm, SO2 was the limiting factor of
those reactions; while when its concentration exceeded 200 ppm, H2O or oxidizing radicals
became the limiting factor. A similar phenomenon has been observed on other DC corona
reactors (Matteson et al., 1972). In their study, when the initial SO2 concentration was larger than
500 ppm, the SO2 reaction rate was not influenced by the initial SO2 concentration. In a typical
coal combustor exhaust, the SO2 concentration varies between 500 ppm (low sulfur coal) to 3000
ppm (high sulfur coal) (Lowell et al., 1971).
Water content in the flue gas promoted the formation of SAs, as shown in Figure 3.6b, because
the presence of H2O resulted in ∙OH radical formation, as well as contributed in the reaction to
form H2SO4 (eq3.6). At the same time, water molecules participate in forming the SA nuclei
(Nagato 2009; Hvelplund et al., 2013) and in SA growth (Stauffer et al., 1973; Wilhelm et al.,
2004; Sorokin et al., 2006), as discussed in the previous section. With increasing ESP voltage,
the SA concentration and peak size first decreased (from -5 kV to -8 kV), and then increased
(from –8 kV to -10 kV), as shown in Figure 3.6c. Figure 3.6d shows that at higher simulated gas
flow rate, the SA concentration was higher and the peak size was larger.
ESP voltages and the gas flow rate are two factors that can influence both SA formation (process
1 in Figure 3.5) and the capture of newly formed SAs (process 2 in Figure 3.5). Higher voltage
(resulted in a higher extent of ionization) promotes SA formation by increasing the ion- induced
nucleation and oxidizing radical generation. However, higher voltages also enhance particle
capture by increasing the particle charging efficiencies and providing a high- intensity electric
field for collection. Before the voltage reached the corona initiation voltage (-8 kV in this system,
as shown in Figure A2.5), gas molecule ionizations occasionally occurred. Under this condition,
oxidation of SO2, ion- induced nucleation, and consequent particle growth could happen.

81
However, the ion concentration is low for particle charging purposes, which made the capture of
SAs more sensitive to a change in voltage. As a result, the SA concentration and peak size first
decreased from -5 kV to -8 kV as the capture efficiency became higher. On the other hand, once
the voltage reached the corona initiation voltage (-8 kV), the ion concentration increased
dramatically. At this ion concentration level and within -8 kV to -10 kV, the particle capture
efficiencies were comparable. In this case, the impact of ESP voltage on SA formation is
stronger. Thus, as the voltage changed from -8 kV to -10 kV, the SA concentration and peak size
increased.
Higher flow rates resulted in lower residence times for both flue gas and particles, which reduced
both the SA formation and ESP capture efficiency. The impact on the ESP capture efficiency
was higher. Thus, as the flow rate increased, SA concentration was higher and the peak size was
larger.
3.4 Conclusions
In this study, the phenomenon of secondary aerosol formation in an ESP when treating flue gas
was first demonstrated on a 1 MW scale coal combustion system. The secondary aerosol had a
unimodal size distribution with a peak size of 20 nm. The chemical composition of SAs was
characterized with an AMS. It was found that the aerosols generated in the ESP were a mixture
of H2SO4, H2O, and organics. H2O-H2SO4 SAs were formed through the following pathway: (1)
SO2 in the exhaust gas was oxidized by radicals, reacted with H2O in the ESP, and eventually
formed H2SO4 (vapor); (2) H2O-H2SO4 SAs were first formed through ion- induced nucleation; (3)
SAs grew by condensation and coagulation. It is proposed that during this process, organic

82
compounds also were absorbed by the aerosols. Concurrently, some of the newly formed
particles were captured by the ESP. The effects of SO2 concentration, the water content in the
feeding gas, the ESP voltage, and the flow rate through the ESP on H2O-H2SO4 SA formation
were investigated. The SA concentration and peak size increased with higher SO2 concentrations,
higher water content, and higher flow rates through ESP. With increasing ESP voltage, the SA
concentration and peak size first went down (from -5 kV to -8 kV), and then increased (from –8
kV to -10 kV).

83
3.5 References
Anderlohr, C., L. Brachert, J. Mertens, and K. Schaber. 2015. Collection and Generation of
Sulfuric Acid Aerosols in a Wet Electrostatic Precipitator. Aerosol Sci. Tech. 49:144-151.
Biswas, P., and C.-Y. Wu. 2005. Nanoparticles and the environment. J. Air Waste Manag. 55
(6):708-746.
Davidson, C.I., R.F. Phalen, and P.A. Solomon. 2005. Airborne particulate matter and human
health: a review. Aerosol Sci. Tech. 39 (8):737-749.
Dong, L.M., Z. Wu, J.X. Yang, and X.C. Chi. 2003. Chemical kinetics model for sulfur dioxide
removal in flue gas using corona discharge. Paper presented at Conference on Electrical
Insulation and Dielectric Phenomena, Albuquerque, NM, USA, October 19-22, 2003.
Hamill, P. 1975. The time dependent growth of H2O-H2SO4 aerosols by heteromolecular
condensation. J. Aerosol Sci. 6(6):475-482.
Hankey, R. 2015. Electric Power Monthly with Data for January 2015. U.S. Energy Information
Administration.
Hinds, W.C. 1999. Aerosol technology: properties, behavior, and measurement of airborne
particles.New York: John Wiley & Sons.
Hogan, C.J., M.-H. Lee, and P. Biswas. 2004. Capture of viral particles in soft X-ray-enhanced
corona systems: charge distribution and transport characteristics. Aerosol Sci. Tech.
38(5):475-486.
Huang, S.-H., and C.-C. Chen. 2002. Ultrafine aerosol penetration through electrostatic
precipitators. Environ. Sci. Tech. 36(21):4625-4632.

84
Hvelplund, P., J.O.P. Pedersen, K. Støchkel, M.B. Enghoff, and T. Kurtén. 2013. Experimental
studies of the formation of cluster ions formed by corona discharge in an atmosphere
containing SO2, NH3, and H2O. Int. J. Mass Spectrom. 341:1-6.
Jing, H., S. He, Q. Ou, T.-C. Hsiao, and D.-R. Chen. 2013. Development of a compact
electrostatic nanoparticle sampler for offline aerosol characterization. MAPAN-J. Metrol.
Soc. I. 28 (3):217-226.
Jing, H., X. Wang, W.-N. Wang, and P. Biswas. 2015. Elemental mercury oxidation in an
electrostatic precipitator enhanced with in situ soft X-ray irradiation. J. Air Waste Manag.
65 (4):455-465.
Kuroki, T.; Takahashi, M.; Okubo, M.; Yamamoto, T. 2002. Single-stage plasma-chemical
process for particulates, NOx, and SOx simultaneous removal. IEEE T. Ind. Appl. 38
(5):1204-1209.
Lapshin, V.B., A.A. Paley, A.V. Balyshev, I.A. Boldyrev, S.N. Dubtsov, and L.I. Tolpygin. 2012.
Evolution of nanometer-size aerosol in dry and humid environment under the influence of
corona discharge. Atmos. Ocean. Opt. 25(2):171-175.
Li, Y., A. Suriyawong, M. Daukoru, Y. Zhuang, and P. Biswas. 2009. Measurement and capture
of fine and ultrafine particles from a pilot-scale pulverized coal combustor with an
electrostatic precipitator. J Air Waste Manag. 59(5):553.
Matteson, M.J., H.L. Stringer, and W.L. Busbee. 1972. Corona discharge oxidation of sulfur
dioxide. Environ. Sci. Tech. 6(10):895-901.
McCain, J.D., J.P. Gooch, and W.B. Smith. 1975. Results of field measurements of industrial

85
particulate sources and electrostatic precipitator performance. JAPCA J. Air Waste Ma.
25(2):117-121.
Mertens, J., C. Anderlohr, P. Rogiers, L. Brachert, P. Khakharia, E. Goetheer, and K. Schaber.
2014. A wet electrostatic precipitator (WESP) as countermeasure to mist formation in
amine based carbon capture. Int. J. Greenh. Gas Con. 31:175-181.
Mok, Y.S., and I.-S. Nam. 2002. Modeling of pulsed corona discharge process for the removal of
nitric oxide and sulfur dioxide. Chem. Eng. J. 85(1):87-97.
Nagato, K. 2009. Charged particle formation by the ionization of air containing sulfur dioxide.
Int. J. Mass Spectrom. 285(1):12-18.
Sinanis, S., A. Wix, and K. Schaber. 2013. Formation of Hydrobromic and Hydrochloric Acid
Aerosols in Wet Flue Gas Cleaning Processes. Chem. Eng. Commun. 200(6):748-763.
Sorokin, A., F. Arnold, and D. Wiedner. 2006. Formation and growth of sulfuric acid–water
cluster ions: Experiments, modelling, and implications for ion-induced aerosol formation.
Atmos. Environ. 40(11):2030-2045.
Stauffer, D., V.A. Mohnen, and C.S. Kiang. 1973. Heteromolecular condensation theory applied
to particle growth. J. of Aerosol Sci. 4(6):461-471.
Suriyawong, A., M. Gamble, M.-H. Lee, R. Axelbaum, and P. Biswas. 2006. Submicrometer
particle formation and mercury speciation under O2-CO2 coal combustion. Energy. Fuel.
20(6):2357-2363.
Suriyawong, A., C.J. Hogan, J. Jiang, and P. Biswas. 2008. Charged fraction and electrostatic
collection of ultrafine and submicrometer particles formed during O2-CO2 coal

86
combustion. Fuel 87(6):673-682.
Van Dingenen, R., and F. Raes. 1991. Determination of the condensation accommodation
coefficient of sulfuric acid on water-sulfuric acid aerosol. Aerosol Sci. Tech. 15(2):93-
106.
Wang, X., B.J. Williams, Y. Tang, Y. Huang, L. Kong, X. Yang, and P. Biswas. 2013a.
Characterization of organic aerosol produced during pulverized coal combustion in a drop
tube furnace. Atmos. Chem. Phys. 13(21):10919-10932.
Wang, X., E. Cotter, K.N. Iyer, J. Fang, B.J. Williams, and P. Biswas. 2015. Relationship
between pyrolysis products and organic aerosols formed during coal combustion. P.
Combust. Inst. 35(2):2347-2354.
Wang, X., S.M. Daukoru, S. Torkamani, W.-N. Wang, and P. Biswas. 2013b. Role of exhaust gas
recycle on submicrometer particle formation during oxy-coal combustion. P. Combust.
Inst. 34 (2):3479-3487.
Waring, M.S., J.A. Siegel, and R.L. Corsi. 2008. Ultrafine particle removal and generation by
portable air cleaners. Atmos Environ 42(20):5003-5014.
Wilhelm, S., S.Eichkorn, D. Wiedner, L. Pirjola, and F. Arnold. 2004. Ion-induced aerosol
formation: new insights from laboratory measurements of mixed cluster ions
HSO4−(H2SO4)a(H2O)w and H+(H2SO4)a(H2O)w. Atmos. Environ. 38(12):1735-1744.
Ylätalo, S.I., and J. Hautanen. 1998. Electrostatic precipitator penetration function for pulverized
coal combustion. Aerosol Sci. Tech. 29(1):17-30.
Yoo, K.H., J.S. Lee, and M.D. Oh. 1997. Charging and collection of submicron particles in two-

87
stage parallel-plate electrostatic precipitators. Aerosol Sci. Tech. 27(3):308-323.
Zhuang, Y., and P. Biswas. 2001. Submicrometer particle formation and control in a bench-scale
pulverized coal combustor. Energ. Fuel. 15(3):510-516.
Zhuang, Y., Y.J. Kim, T.G. Lee, and P. Biswas. 2000. Experimental and theoretical studies of
ultra-fine particle behavior in electrostatic precipitators. J. Electrostat. 48(3):245-260.

88
CHAPTER 4. CAPTURE OF SUBMICROMETER PARTICLES WITH A
PRESSURIZED ELECTROSTATIC PRECIPITATOR
The results of this chapter will be compiled as a paper for submission to Aerosol Science & Technology (authors: He Jing, Zhichao Li, Pratim Biswas).
Supplementary materials are available in Appendix III

89
Abstract
In this study, the influence of gas pressure on the performance of an electrostatic precipitator
(ESP) in submirometer particle capture was investigated. The ESP was operated under 1 atm, 2
atms, and 3 atms, respectively. Current-voltage characteristics of the ESP were studied under
various pressures. Fundamental study on the particle capture was performed with NaCl particles.
With a similar voltage, the particle capture efficiency became lower with a higher pressure, due
to a lower ion concentration in the ESP. With the same current, the particle capture efficiency
became higher with a higher pressure, which was mainly determined by the transport of charged
particles. A modified Deutsch-Anderson (D-A) equation was developed. The estimation particle
capture efficiency results from the modified D-A equation match the NaCl capture data well. The
capture of fly ash particles from a drop-tube furnace in the pressurized ESP was also studied.
The charge status of the fly ash particles played an important role in this process. As a result,
with the same current, the particle capture efficiency became lower with a higher pressure.

90
4.1 Introduction
Aiming at providing reliable and low-cost energy, advanced technologies, such as gasification
(Minchener 2005), pressurized fluidized bed combustion (Schemenau 1993), and pressurized
oxy-combustion (Gopan et al., 2014) are considered to be promising alternative energy
generation processes. The feasibility of those systems is not just determined by the energy
generation processes themselves, but also greatly depends on the performance of their ancillary
equipment. Particle control equipment is one important component of those systems.
Electrostatic precipitators (ESPs) are widely used in particle control from various emission
sources because of their high capture efficiency and low operation cost, and their ability of
working under the extreme environment (high temperature and high pressure) have been proven
(Brown and Walker, 1971; Bush et al., 1979; Rinard et al, 1987; Villot et al., 2012), which made
them a good candidate of particle control equipment in gasification and pressurized combustion
systems. It has been reported that corona discharge (main mechanism of ESP) can be obtained
under a pressure up to 3.5 MPa and temperature up to 1700 oF (Brown and Walker, 1971).
However, the capture efficiency of the ESP under high pressure and high temperature, and how
the capture behaves as the pressure increases or temperature increases are not well understood.
Especially, no size-dependable capture efficiency has been reported.
Among various particle size ranges, the submicrometer range (particle sizes smaller than 1μm)
requires the special attention because they have more severe adverse health effect to human
(Biswas and Wu, 2005). Extensive studies have been done on the capture of submicrometer
particles with ESPs (under atmosphere pressure). On one hand, fundamental studies have been
done on bench-scale ESPs with synthetic particles (Yoo et al., 1997; Zhuang et al., 2000; Jing et
al. 2013; Huang and Chen, 2002); on the other hand, studies have been carried out on ESPs with

91
particles and flue gas from real combustion systems (McCain et al., 1975; Ylätalo and Hautanen,
1998; Li et al., 2009). It is of great interests how pressure influences the submicrometer particle
capture capability of ESPs, which has not been investigated yet.
In this study, fundamental studies were firstly done to evaluate the effects of pressure on current-
voltage (I-V) characteristics and capture efficiencies of submicrometer particles (NaCl particles)
of the ESP. Afterwards, the capture of submicrometer fly ash particles with an ESP under
various pressures were investigated on a pressurized drop-tube furnace system.
4.2 Experimental Section
4.2.1 Experimental system
The ESP used in this study is a bench-scale DC corona-based wire-cylinder type ESP, which has
been used and described in early studies. The ESP configuration is shown in Figure A3.1. A
Bertan (model 230) power supply was used to provide the high voltage for the ESP. The
experiment system is shown in Figure 4.1. Two types systems were used to generate test
particles. NaCl particles were generated by an atomizer (TSI model 3076). A Po-210 radioactive
source was used to neutralize the charges on the NaCl particles from the atomizer, and a
diffusion dryer was used to dry and remove water vapor from the particles. Fly ash particles were
generated with a pressurized drop-tube furnace. The configuration and operation parameters of
the furnace have been described in previous papers (Suriyawong et al. 2006; Wang et al., 2013a,
2013b, 2015). PRB (Powder River Basin) coal was used and the coal feeding rate is 1.5 g/hr. The
drop-tube furnace was operated up to 3 atms in this study. An addition air flow was added to the
system to adjust the total flow rate through the ESP. The current through the ESP was measured

92
with a microammeter meter (Simpson Model 17424). A scanning mobility particle sizer (SMPS,
TSI model 3080) was used to measure the particle size distribution.
Figure 4.1 Schematic of the experimental setup
4.2.2 Calculation of particle penetration through ESP and charges on particles from the furnace
The particle penetration through the ESP for each size was determined by eq4.1:
penetration =𝑁𝑜𝑓𝑓
𝑁𝑜𝑛 (4.1)
where Noff and Non are particle number concentrations downstream from the ESP for a certain
size bin when the ESP was off and on, respectively.
A method adapted from Suriyawong et al. (2008) was applied to estimate the charges on the
particles from the drop-tube furnace. The particles were introduced to the DMA (differential
mobility analyser) of SMPS through two routes, respectively: (1) directly introduced to the DMA;

93
(2) passing through a Po-210 radioactive source, which gave the particles a known charge
distributions, and then introduced to the DMA. The concentrations of particle penetrating
through the DMA were measured with the CPC (condensation particle counter) of the SMPS.
The DMA was operated under both a negative and positive applied voltage to determine the
charges of particles with positive and negative charges, respectively. With the concentration
measurements, a charge index can be calculated using eq4.2 to indicate the charge status of the
particles:
𝐼𝐶 =𝑁𝐶
𝑁𝐶𝑒𝑞𝐶𝑓𝑒𝑞1 (4.2)
where IC is the charge index, NC is the number concentration of charged particles of diameter dp,
NCeq is the number concentration of charged particles of diameter dp measured after charge
neutralization, and Cfeq1 the equilibrium charge fraction for particles of diameter dp with one unit
charge calculated as described by Wiedensohler (Wiedensohler 1988). The physical meaning of
the charge index is the charge fraction of particles with the assumption that all the particles are
singly charged (with +1 or -1 unit charge). However, it should be noted that multiple charged
particles (particles with the same electrical mobility with the singly charged particles of the
concerned size) also contribute to this index.
4.2.3 Experimental design
In this study, the operation of the pressurized ESP was first studied fundamentally, including the
study of the current-voltage characteristics (Set I) and the study of capture efficiency with NaCl
particles with Boltzmann charge distributions (Set II). A modified Deutsch-Anderson equation
was also developed to predict the capture efficiency of the pressurized ESP under various gas

94
pressures and ESP voltages (Set III). In the second step, the capture of fly ash particles from a
drop-tube furnace in the pressurized ESP was investigated (Set V). In this study, the furnace was
operated under the same gas pressure with the ESP for each run. To better elucidate the capture
of fly ash particles, the charging status of the particles from the drop-tube furnace under various
pressures were also studied (Set IV). The summary of experimental conditions is shown in Table
4.1.

93
Table 4.1 Summary of the experiments performed
Set Objective Particles Gas
compositions
ESP
operation
Gas pressure Flow rate Measurements
I To investigate the I-V
characteristics of the ESP
N/A Air -20 kV to
+20 kV
1 atm, 2 atms,
3 atms
15 LPM ESP current
II To investigate the capture
efficiency of the NaCl
particles
NaCl particles Air (1) ±16.7
kV (±12.7
kV for 1
atm);
(2) ±20 μA
1 atm, 2 atms,
3 atms
15 LPM Particle size distribution
downstream the ESP
when the ESP off and on
respectively
III To develop an equation to
predict the performance
of the pressurized ESP
N/A N/A N/A N/A N/A N/A (data from Set II is
used)
IV To investigate the charge
status of the fly ash
particles from the drop-
tube furnace
Fly ash
particles from
drop-tube
furnace
Flue gas from
drop-tube
furnace
N/A 1 atm, 2 atms,
3 atms
8 LPM Concentration of particles
(passing through the
radioactive sources or
directly to the DMA)
through the DMA
V To investigate the capture
efficiency of the fly ash
particles
Fly ash
particles from
drop-tube
furnace
Flue gas from
drop-tube
furnace
±20 μA 1 atm, 2 atms,
3 atms
25 LPM Particle size distribution
downstream the ESP
when the ESP off and on
respectively

94
4.3 Results and Discussion
4.3.1 Current-voltage characteristics of the pressurized ESP
The I-V characteristics provide the information of the corona working range, at the same time,
the current also indicates the ion concentration in the ESP. Figure 4.2 shows the I-V
characteristics of the studied ESP under three pressures, 1 atm, 2 atms, and 3 atms. Results
show that for both the positive and negative polarities, as the pressure increased, the corona
on-set voltage increased. Under the same voltage, the ESP current was lower with a higher
pressure. These observations can be explained by the mechanism of the corona formation. To
form the corona discharge, a certain amount of ions and electrons are needed. Most of the
ions and electrons are generated from the ionization process due the impaction between the
gas molecules and high energy electrons. Important to note that in order to initiate the
ionization, an electron should have a kinetic energy that is above a critical value (an energy
that is high enough for the electron to knock out a secondary electron from a gas molecule).
With higher pressure, the mean free path inside the ESP decreases. Thus, there is a higher
chance that the electron hit a gas molecule before being accelerated to have the critical
kinetic energy. This hinders the ionization process (Robinson 1971). Previous studies also
established an empirical relationship between the ESP onset voltage and the gas pressure in
the ESP (Robinson 1967). The equation is shown in the supplemental materials.

95
-20 -15 -10 -5 0 5 10 15 20
0
100
200
300
400
500
600
1 atm
2 atm
3 atm
Cu
rre
nt
(A
)
Voltage (kV)
Figure 4.2 The relationship between ESP voltage and current under different gas pressures
4.3.2 Capture of the NaCl particles with a Boltzmann charge distribution
In order to perform a fundamental study on the pressurized ESP, NaCl particles generated
using atomization methods were used to evaluate the capture efficiencies of the ESP. The
particles passed through a Po-210 radioactive radiation source, which gave them a Boltzmann
charge distribution. The size distributions of particles generated by atomization under
different gas pressures are shown in Figure A3.2.
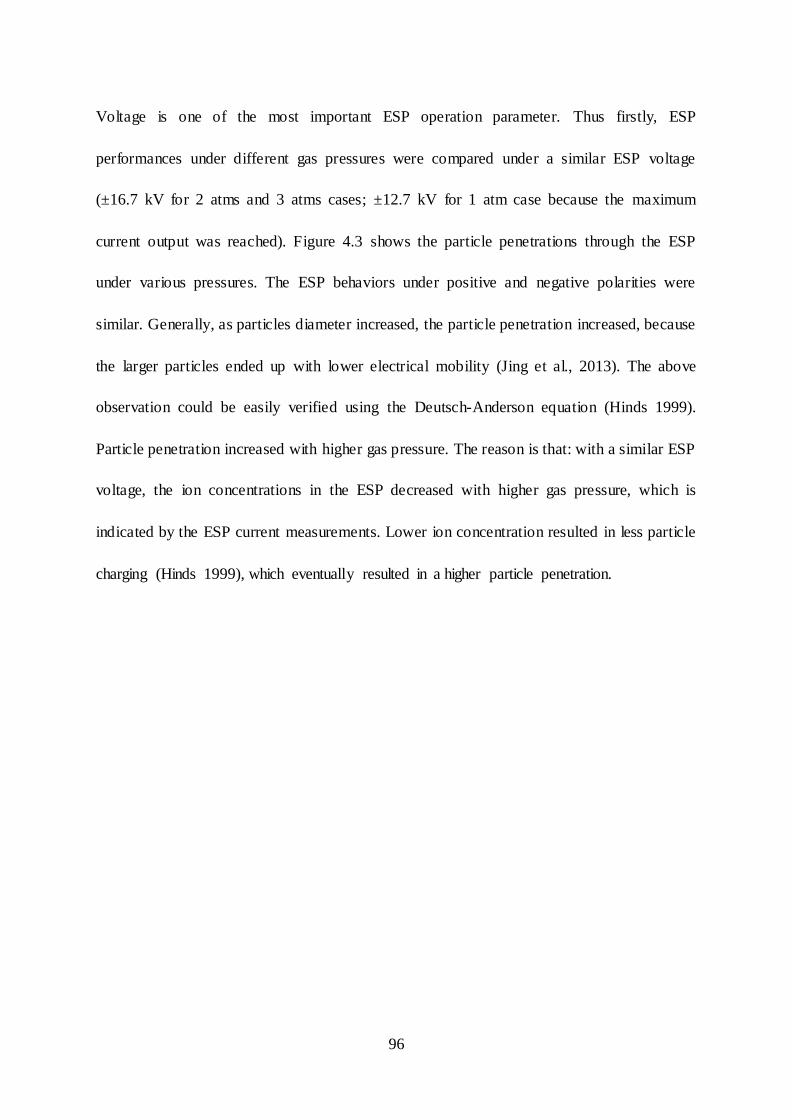
96
Voltage is one of the most important ESP operation parameter. Thus firstly, ESP
performances under different gas pressures were compared under a similar ESP voltage
(±16.7 kV for 2 atms and 3 atms cases; ±12.7 kV for 1 atm case because the maximum
current output was reached). Figure 4.3 shows the particle penetrations through the ESP
under various pressures. The ESP behaviors under positive and negative polarities were
similar. Generally, as particles diameter increased, the particle penetration increased, because
the larger particles ended up with lower electrical mobility (Jing et al., 2013). The above
observation could be easily verified using the Deutsch-Anderson equation (Hinds 1999).
Particle penetration increased with higher gas pressure. The reason is that: with a similar ESP
voltage, the ion concentrations in the ESP decreased with higher gas pressure, which is
indicated by the ESP current measurements. Lower ion concentration resulted in less particle
charging (Hinds 1999), which eventually resulted in a higher particle penetration.

97
(a)
10 10010
-5
10-4
10-3
10-2
1 atm
2 atms
3 atms
500400300
Pa
rtic
le p
en
etr
atio
n
Particle diameter (nm)
200

98
(b)
10 10010
-5
10-4
10-3
10-2
1 atm
3 atms
Pa
rtic
le p
en
etr
atio
n
Particle diameter (nm)
500400300200
Figure 4.3 Particle penetrations through the ESP for NaCl particles of various sizes under
different gas pressures: (a) negative ESP; (1 atm case: ESP voltage -12.9 kV, current -500
μA; 2 atms case: voltage -16.7 kV, current -200 μA; 3 atms case: voltage -16.7 kV, current -
20 μA;) (b) positive ESP; (1 atm case: ESP voltage +12.9 kV, current +500 μA; 3 atms case:
voltage +16.7 kV, current +20 μA)
To further investigate the influence of factors other than the ion concentration on the particle
capture, ESP performances under different gas pressures were compared under the same
current (20 μA), and it is assumed that the ion concentrations were the same in those
conditions. Figure 4.4 shows the particle penetration through the ESP under 1 atm, 2 atms,
and 3 atms, respectively. Similar with the results from Figure 4.3, the ESP behaviors under

99
positive and negative polarities were similar, and the penetration increased with particle
diameter. The particle penetrations of 1 atm case were higher than those of 2 atms and 3 atms
cases, and the penetrations for the latter two cases were similar. In this set of experiments,
particle capture was mainly determined by the transport of the charged particles in the ESP,
and this result is an outcome of the combined effect of three factors: (1) lower particle
velocity along the direction of gas flow with higher pressure; (2) lower particle migration
velocity to the collecting electrode with higher pressure; and (3) higher electrical field
strength with higher voltage (higher gas pressure). Factor (1) and (3) enhance the particle
capture with increasing gas pressure, while factor (2) weakens the particle capture with
increasing gas pressure.
(a)
10 10010
-5
10-4
10-3
10-2
10-1
1 atm
2 atms
3 atms
Pa
rtic
le p
en
etr
atio
n
Particle diameter (nm)
500400300200

100
(b)
10 10010
-5
10-4
10-3
10-2
10-1
1 atm
2 atms
3 atms
Pa
rtic
le p
en
etr
atio
n
Particle diameter (nm)
500400300200
Figure 4.4 Particle penetrations through the ESP for NaCl particles of various sizes under
different gas pressures but a fixed current: (a) negative ESP; (1 atm case: ESP voltage -8.9
kV, current -20 μA; 2 atms case: voltage -12.9 kV, current -20 μA; 3 atms case: voltage -16.7
kV, current -20 μA); (b) positive ESP; (1 atm case: ESP voltage +8.9 kV, current +20 μA; 2
atms case: voltage +12.9 kV, current +20 μA; 3 atms case: voltage +16.7 kV, current +20
μA)

101
4.3.3 Capture efficiency data fitting with modified Deutsch-Anderson equation
In order to predict the performance of the pressurized ESP under other operation conditions
(gas pressure, ESP voltage, etc.), an equation or a model for particle capture efficiency
estimation is needed. Deutsch-Anderson (D-A) equation (Anderson 1919) is widely used to
estimate the particle capture efficiency in ESP design and analysis, and it is adapted here.
The D-A equation is as below:
𝜂 = 1− exp(−𝐴𝑐𝑣𝑇𝐸
𝑄) (4.3)
in which η is the particle capture efficiency (1 - penetration), Ac is the area of collection
surface, Q is the volumetric flow rate through ESP, and vTE is the particle migration velocity
which is determined using eq4.4:
𝑣𝑇𝐸 =𝑛𝑒𝐸𝐶𝑐
3𝜋𝜇𝑑𝑝 (4.4)
in which n is the number of elementary charge on the particle, e is the elementary charge, E is
the average electric filed in the ESP, Cc is the Cunningham correction factor, μ is the
viscosity of air, and dp is the particle diameter. The number of charge on the particle is
estimated following a method used in Lin et al. (2012), as shown in eq4.5:
𝑛 = 𝑛𝑑𝑖𝑓𝑓 +𝑛𝑓𝑖𝑒𝑙𝑑 (4.5)
in which ndiff is the number of elementary charge from diffusion charging, and nfield is the
number of elementary charge from field charging. They are calculated using Fuchs’ equation
(Fuchs 1947) and Moreau-Hanot equation (Pauthenier and Moreau-Hanot, 1932),
respectively:
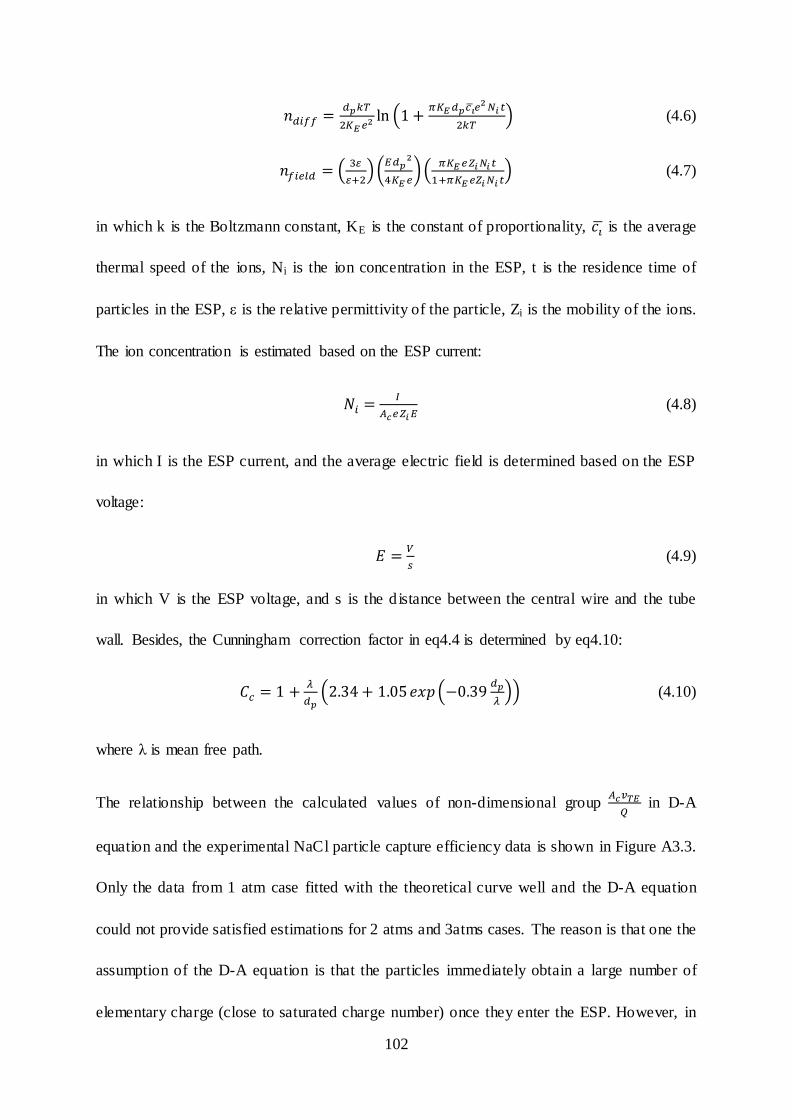
102
𝑛𝑑𝑖𝑓𝑓 =𝑑𝑝𝑘𝑇
2𝐾𝐸𝑒2 ln (1 +
𝜋𝐾𝐸𝑑𝑝𝑐�̅�𝑒2𝑁𝑖 𝑡
2𝑘𝑇) (4.6)
𝑛𝑓𝑖𝑒𝑙𝑑 = (3
+2)(
𝐸𝑑𝑝2
4𝐾𝐸𝑒)(
𝜋𝐾𝐸𝑒𝑍𝑖𝑁𝑖 𝑡
1+𝜋𝐾𝐸𝑒𝑍𝑖𝑁𝑖 𝑡) (4.7)
in which k is the Boltzmann constant, KE is the constant of proportionality, 𝑐�̅� is the average
thermal speed of the ions, Ni is the ion concentration in the ESP, t is the residence time of
particles in the ESP, ε is the relative permittivity of the particle, Zi is the mobility of the ions.
The ion concentration is estimated based on the ESP current:
𝑁𝑖 =𝐼
𝐴𝑐𝑒𝑍𝑖𝐸 (4.8)
in which I is the ESP current, and the average electric field is determined based on the ESP
voltage:
𝐸 =𝑉
𝑠 (4.9)
in which V is the ESP voltage, and s is the d istance between the central wire and the tube
wall. Besides, the Cunningham correction factor in eq4.4 is determined by eq4.10:
𝐶𝑐 = 1 +𝜆
𝑑𝑝(2.34 + 1.05𝑒𝑥𝑝(−0.39
𝑑𝑝
𝜆)) (4.10)
where λ is mean free path.
The relationship between the calculated values of non-dimensional group 𝐴𝑐𝑣𝑇𝐸
𝑄 in D-A
equation and the experimental NaCl particle capture efficiency data is shown in Figure A3.3.
Only the data from 1 atm case fitted with the theoretical curve well and the D-A equation
could not provide satisfied estimations for 2 atms and 3atms cases. The reason is that one the
assumption of the D-A equation is that the particles immediately obtain a large number of
elementary charge (close to saturated charge number) once they enter the ESP. However, in
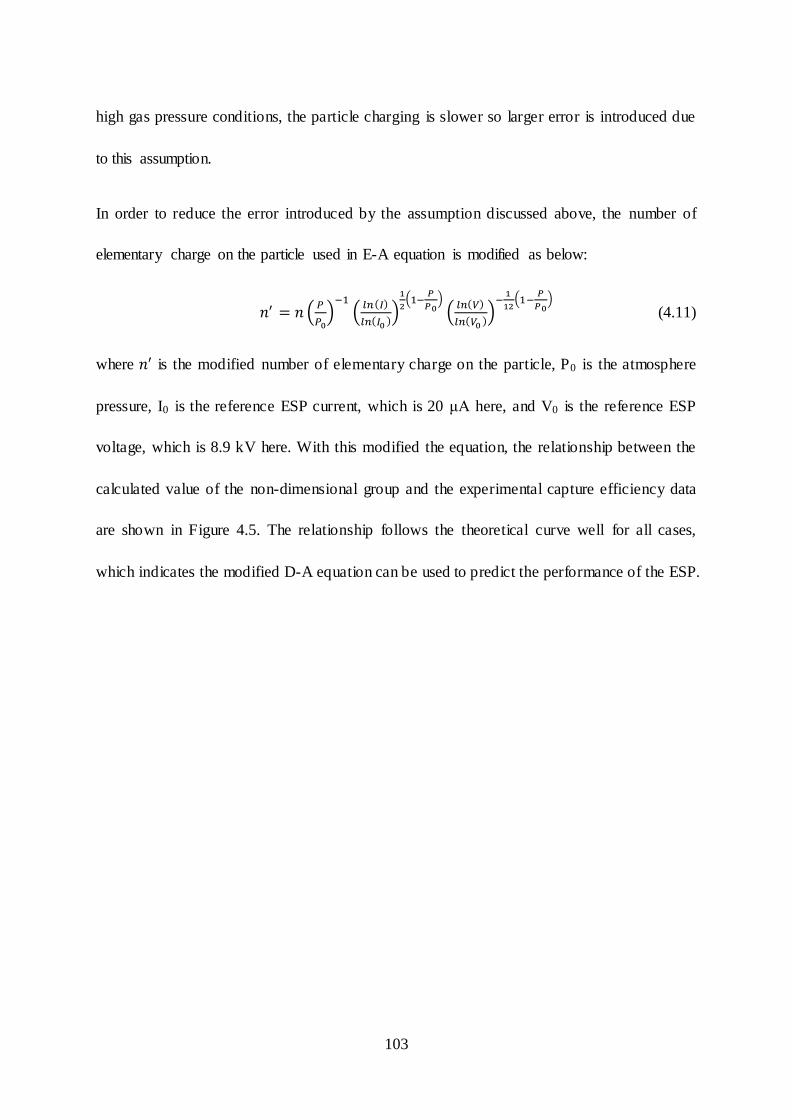
103
high gas pressure conditions, the particle charging is slower so larger error is introduced due
to this assumption.
In order to reduce the error introduced by the assumption discussed above, the number of
elementary charge on the particle used in E-A equation is modified as below:
𝑛′ = 𝑛 (𝑃
𝑃0)−1
(𝑙𝑛(𝐼)
𝑙𝑛(𝐼0 ))
1
2(1−
𝑃
𝑃0)
(𝑙𝑛(𝑉)
𝑙𝑛(𝑉0 ))−1
12(1−
𝑃
𝑃0)
(4.11)
where 𝑛′ is the modified number of elementary charge on the particle, P0 is the atmosphere
pressure, I0 is the reference ESP current, which is 20 μA here, and V0 is the reference ESP
voltage, which is 8.9 kV here. With this modified the equation, the relationship between the
calculated value of the non-dimensional group and the experimental capture efficiency data
are shown in Figure 4.5. The relationship follows the theoretical curve well for all cases,
which indicates the modified D-A equation can be used to predict the performance of the ESP.

104
(a)
3 10 1000.980
0.985
0.990
0.995
1.000
1 atm (20mA, -8.9kV)
1 atm (500mA, -12.9kV)
2 atm (20mA, -12.9kV)
2 atm (200mA, -16.7kV)
3 atm (20mA, -16.7kV)
Theoretical curve
Re
mo
va
l e
ffic
ien
cy (
exp
eri
me
nta
l d
ata
)
(Acv
TE/Q)
modi (calculated value)

105
(b)
3 10 100
0.975
0.980
0.985
0.990
0.995
1.000
1 atm (20mA, +8.6kV)
1 atm (500mA, +13.7kV)
2 atm (20mA, +12.5kV)
2 atm (270mA, +17.4kV)
3 atm (20mA, +17.4kV)
Theoretical curveRe
mo
va
l e
ffic
ien
cy (
exp
eri
me
nta
l d
ata
)
(Acv
TE/Q)
modi
Figure 4.5 The relationship between measured NaCl particle removal efficiencies and the
calculated values of the non-dimensional group from the modified Deutsch-Anderson
equation: (a) negative polarity; (b) positive polarity
With the modified capture efficiency estimation equation, the relationship between particle
penetration and the ESP voltage under different pressures were analyzed, as shown in Figure
A3.4.
4.3.4 Characterization of fly ash particle charging status
In order to evaluate the performance of pressurized ESP in an actual combustion conditions, a
drop-tube furnace system was used to generate fly ash particles to test the ESP. The fly ash

106
particle size distributions were shown in Figure A3.4. Because the initial charging status of
particles (fraction of charged particles, number of charges on the particles, etc.) could
influence how many of them would penetrate the ESP, a characterization of the charging
status is needed.
In this section, the charging statuses of fly ash particles from the drop-tube furnace operated
under various gas pressures were discussed. A charge index was used to indicate the charging
status, and it was calculated based on the method described in the experimental section. The
charge indices of the particles with diameters of 20 nm, 30 nm, 40 nm, 60 nm, 100 nm, 200
nm for the 1 atm, 2 atm, and 3 atms conditions are shown in Figure 4.6. The indices of the
smaller particle diameters (20 nm, 30 nm) under 3 atms (positive) case are higher than 1,
which is strong evidence that part of fly ash particles were multiply and positively charged
under the 3 atms combustion. It is also highly possible that in 3 atms case the chance that the
fly ash were multiply charged was higher. Considering the main charging mechanism of the
particles inside the drop-tube furnace is diffusion charging (Burtscher et al., 1986; Burtscher
1992), it also means that the charge fraction of particles from the 3 atms combustion was
higher.

107
10 1000.0
0.2
0.4
0.6
0.8
1.0
1.2
1.4
1.6
1.8
1 atm (+1)
1 atm (-1)
2 atm (+1)
2 atm (-1)
3 atm (+1)
3 atm (-1)
1 atm (+1) equilibrium
1 atm (-1) equilibrium
Ch
arg
e in
dic
es
Particle diameter (nm)
Figure 4.6 Charge indices of particles of various sizes under 1 atm, 2 atms, and 3 atms
Based on the above discussion, it is hypothesized that with a higher gas pressure in the coal
combustor, for the particles of each size the charge fraction and number of the average charge
on the particles are both larger when the particles exit the combustor. This hypothesis is
correct theoretically. With a higher gas pressure, the residence time of the submicrometer
particles in the drop-tube furnace is higher, which results in both a larger charge fraction and
a larger number of the average charge based on the theory of diffusion charging (Hinds 1999).
A longer residence time also enhances the direct thermoionization and photoionization of
particles, which contribute in increasing the charge fraction and number of charge as well
although their effects are secondary to the diffusion charging (Burtscher 1992). At the same
time, the results that with a higher gas pressure the charge indices for smaller particles (20

108
nm, 30 nm, and 40 nm) are larger, and those for larger particles (60 nm, 100 nm, 200 nm) are
smaller (Figure 5) also support the hypothesis that with higher gas pressure in the combustor,
the particles exiting the combustor have a larger chance to be multiply charged.
4.3.5 Capture of fly ash particles from the pressurized ESP
In the fly ash particle capture study, the absolute value of the ESP current was kept the same
(+20 μA for positive polarity case and -20 μA for negative polarity case). The particle
penetration for various gas pressures are shown in Figure 4.7. For the negative ESP case
(Figure 4.7a), the penetration still increased with the particle size. However, the particle
penetration was higher for a higher gas pressure, which is exactly opposite with the
conclusion drawn from the second test of experiment set II (results shown in Figure 4.4), in
which the ESP operation was almost the same as in the test of this section (currents were the
same; voltages were slightly different because the gas compositions affected the I-V
characteristics). The reason might be that the charging status played an important role here. In
the NaCl particle test, all the particles were with a Boltzmann charge distribution, however,
in the fly ash particle test, the charging statuses varied for studies with different gas pressure.
From the discussion of the previous section, it is very likely that there were a higher
percentage of multiply positively charged particles from combustion under higher gas
pressure. Those multiply charged particles caused an overall higher penetration.

109
(a)
10 10010
-5
10-4
10-3
10-2
10-1
1 atm
2 atms
3 atms
Pa
rtic
le p
en
etr
atio
n
Particle diameter (nm)
500400300200

110
(b)
10 10010
-5
10-4
10-3
10-2
10-1
100
1 atm
2 atms
3 atms
Pa
rtic
le p
en
etr
atio
n
Particle diameter (nm)
500400300200
Figure 4.7 Particle penetrations through the ESP for fly ash particles of various sizes under
different gas pressures: (a) negative ESP; (1 atm case: ESP voltage -8.6 kV, current -20 μA; 2
atms case: voltage -12.8 kV, current -20 μA; 3 atms case: voltage -15.7 kV, current -20 μA;)
(b) positive ESP; (1 atm case: ESP voltage +8.3 kV, current +20 μA; 2 atms case: voltage
+13.2 kV, current +20 μA; 3 atms case: voltage +16.8 kV, current +20 μA)
For the positive ESP case (Figure 4.7b), there was a peak at 30 nm for each of the three
penetration curves, which is because the formation of secondary H2SO4-H2O aerosols, a
result of the oxidation reaction of SO2 from the flue gas, and following nucleation,
condensation, and coagulation inside the ESP. The formation of secondary aerosols in the
ESP has been well discussed in another paper. The reason why the particle formation was not

111
observed in the negative case is that negative ESP has higher capture efficiency for the
concerned particles than positive ESP. The secondary particle penetration of the 1 atm case
was higher than that of the 2 atms case, and the penetration of the 3 atms case was even lower.
This might be because higher residence time in the ESP resulted in higher capture efficiency
of the secondary aerosols. Other than the secondary formation and penetration, the
penetration curves of the positive ESP cases had the same pattern with those of negative ESP
cases. Important to noted that the voltages that provided the ±20 μA currents in this section
were slightly different with those in the second test of experiment set II (results shown in
Figure 4), which might be due to the minor change in the gas composition.
4.4 Conclusions
In this study, the effect of gas pressure on the performance of an ESP was examined. The
corona on-set voltage increased with the gas pressure, and under the same voltage, the ESP
current was lower with higher gas pressure, because the higher gas density hindered the
ionization process. Effect of gas pressure on the submicrometer particle capture in the ESP
was firstly with NaCl particles. Under a similar operating voltage, particle penetration was
lower for a lower gas pressure due to that the ion concentration was higher with lower gas
pressure. To investigate the effect of factors other than ion concentration, the ESP current
was fixed. With the same current, the particle penetration was higher for a lower gas pressure,
which was an outcome of the combined effect of higher particle velocity along the gas flow,
higher particle migration velocity, and lower electrical field strength.

112
A modified Deutsch-Anderson equation, which accounts for all the factors discussed above,
was developed to predict the particle capture efficiency in the pressurized ESP. The
estimations from the modified D-A equation matched the experimental results of NaCl
particle capture well.
To investigate the capture of fly ash particles in the pressurized ESP, a drop-tube furnace was
used to generate fly ash particles. With higher gas pressure, the particles from the furnace
tended to have higher charge fraction and average number of charge, which made the
penetration of fly ash particles through the ESP increased with increasing gas pressure under
the same ESP current.

113
4.5 References
Anderson, E. 1919. Unpublished rept. Los Angeles, CA: Western Precipitation Co.
Biswas, P., and C.-Y. Wu. 2005. Nanoparticles and the environment. J. Air Waste Manage.
55(6):708-746.
Brown, R.F., and A.B. Walker. 1971. Feasibility demonstration of electrostatic precipitation
at 1700 F. JAPCA J. Air Waste Ma. 21(10):617-620.
Burtscher, H., A. Reis, and A. Schmidt-Ott. 1986. Particle charge in combustion aerosols. J.
Aerosol Sci. 17(1):47-51.
Burtscher, H. 1992. Measurement and characteristics of combustion aerosols with special
consideration of photoelectric charging and charging by flame ions. J. Aerosol Sci.
23(6):549-595.
Bush, J.R., P.L. Feldman, and M. Robinson. 1979. High temperature, high pressure
electrostatic precipitation. JAPCA J. Air Waste Ma. 29(4):365-371.
Fuchs, N.A. 1947. The Charges on the Particles of Aerocolloids. Izv. Akad. Nauk. SSSR. Ser.
Geogr. Geofiz. 11:341-348.
Gopan, A., B.M. Kumfer, J. Phillips, D. Thimsen, R. Smith, and R.L. Axelbaum. 2014.
Process design and performance analysis of a Staged, Pressurized Oxy-Combustion
(SPOC) power plant for carbon capture. Appl. Energ. 125:179-188.
Hinds, W.C. 1999. Aerosol technology: properties, behavior, and measurement of airborne
particles. New York: John Wiley & Sons.
114
Huang, S.-H., and C.-C. Chen. 2002. Ultrafine aerosol penetration through electrostatic
precipitators. Environ. Sci. Tech. 36(21):4625-4632.
Jing, H., S. He, Q. Ou, T.-C. Hsiao, and D.-R. Chen. 2013. Development of a Compact
Electrostatic Nanoparticle Sampler for Offline Aerosol Characterization. Mapan-J.
Metrol. Soc. I. 28(3):217-226.
Li, Y., A. Suriyawong, M. Daukoru, Y. Zhuang, and P. Biswas. 2009. Measurement and
capture of fine and ultrafine particles from a pilot-scale pulverized coal combustor
with an electrostatic precipitator. J. Air Waste Manag. 59(5):553.
Lin, G.Y., Chen, T.M., Tsai, C.J. 2012 A Modified Deutsch-Anderson Equation for Predicting
the Nanoparticle Collection Efficiency of Electrostatic Precipitators. Aerosol Air
Qual. Res. 12:697-706.
McCain, J.D., J.P. Gooch, and W.B. Smith. 1975. Results of field measurements of industrial
particulate sources and electrostatic precipitator performance. JAPCA J. Air Waste
Ma. 25(2):117-121.
Minchener, A.J. 2005. Coal gasification for advanced power generation. Fuel 84(17):2222-
2235.
Pauthenier, M., and M. Moreau-Hanot. 1932. Charging of Spherical Particles in an Ionizing
Field. J. Phys. Radium 3:590-613.
Rinard, G., D.E. Rugg, and T. Yamamoto. 1987. High-temperature high-pressure electrostatic
precipitator electrical characterization and collection efficiency. IEEE T. Ind. Appl.
(1):114-119.

115
Robinson, M. 1967. The corona threshold for coaxial cylinders in air at high pressures. IEEE
T. Power Ap. Syst. (2):185-189.
Robinson, M. 1971. Electrostatic precipitation. In Air pollution control. New York: John
Wiley.
Schemenau, W. 1993 Pressurized fluidized-bed combustion is advanced coal usage for
electricity-genericity-generation with operational experience. Brennstoff-Warme-Kraft
45 (1-2):23-26.
Suriyawong, A., M. Gamble, M.-H. Lee, R. Axelbaum, and P. Biswas. 2006. Submicrometer
particle formation and mercury speciation under O2-CO2 coal combustion. Energ.
Fuel. 20(6):2357-2363.
Suriyawong, A., C.J. Hogan, J. Jiang, and P. Biswas. 2008. Charged fraction and electrostatic
collection of ultrafine and submicrometer particles formed during O2-CO2 coal
combustion. Fuel 87(6):673-682.
Villot, A., Y. Gonthier, E. Gonze, A. Bernis, S. Ravel, M. Grateau, and J. Guillaudeau. 2012.
Separation of particles from syngas at high -temperatures with an electrostatic
precipitator. Sep. Purif. Technol. 92:181-190.
Wang, X., B.J. Williams, Y. Tang, Y. Huang, L. Kong, X. Yang, and P. Biswas. 2013a.
Characterization of organic aerosol produced during pulverized coal combustion in a
drop tube furnace. Atmos. Chem. Phys. 13(21):10919-10932.
Wang, X., E. Cotter, K.N. Iyer, J. Fang, B.J. Williams, and P. Biswas. 2015. Relationship

116
between pyrolysis products and organic aerosols formed during coal combustion. P.
Combust. Inst. 35(2):2347-2354.
Wang, X., S.M. Daukoru, S. Torkamani, W.-N. Wang, and P. Biswas. 2013. Role of exhaust
gas recycle on submicrometer particle formation during oxy-coal combustion. P.
Combust. Inst. 34(2):3479-3487.
Wiedensohler, A. 1988. An approximation of the bipolar charge distribution for particles in
the submicron size range. J. Aerosol Sci. 19(3):387-389.
Ylätalo, S.I., and J. Hautanen. 1998. Electrostatic precipitator penetration function for
pulverized coal combustion. Aerosol Sci. Tech. 29(1):17-30.
Yoo, K.H., J.S.Lee, and M.D. Oh. 1997. Charging and collection of submicron particles in
two-stage parallel-plate electrostatic precipitators. Aerosol Sci. Tech. 27(3):308-323.
Zhuang, Y., Y.J. Kim, T.G. Lee, and P. Biswas. 2000. Experimental and theoretical studies of
ultra-fine particle behavior in electrostatic precipitators. J Electrostat 48(3):245-260.

117
CHAPTER 5. DEVELOPMENT OF A COMPACT ELECTROSTATIC
NANOPARTICLE SAMPLER FOR OFFLINE AEROSOL CHARACTERIZATION
The results of this chapter has been published in Jing, H.; He, S.; Ou, Q.; Hsiao, T.C.; Chen,
D.R., Development of a Compact Electrostatic Nanoparticle Sampler for Offline Aerosol
Characterization. Journal of Metrology Society of India (JMSI), 2013, 28, 217-226

118
Abstract
A compact electrostatic nanoparticle sampler has been developed to support the offline
analysis of nanoparticles via electron microscopy. The basic operational principle of the
sampler is to electrically charge particles by mixing nanoparticles and unipolar ions produced
by DC corona discharge, and then electrostatically collecting charged particles. A parametric
study was first performed to identify the optimal operating condition of the sampler: a total
flow rate (i.e., the sum of the particle and ion carrier flow rates) of 1.0 lpm, an aerosol/ion
carrier flow rate ratio of 1.0, and a collection voltage of 4.5 kV. Under the above condition,
the sampler achieved a collection efficiency of more than 90% for particles ranging from 50
to 500 nm. The effect of particle material on the sampler’s performance was also studied. The
prototype had lower collection efficiencies for oleic acid particles than for sodium chloride
(NaCl) particles in the size range from 50 to 150 nm, while achieving a comparable
efficiency in the size range large than 150 nm. The effect of particle diameter, particle
material, and total flow rate on the sampler’s collection efficiency is explained by the particle
charging data, i.e., charging efficiencies and mean charges per particle.

119
5.1 Introduction
For two reasons, much attention has recently been given to investigation of particles in the
nanometer size range. First, nanoparticles have been reported in exhausts of various
combustion sources, chemical processes, and aerosol reactors (Kaupplnen and Pakkanen,
1990; Biswas and Wu, 2005). Such nanosized particulates are considered environmental
pollution because of the potential toxicity attributed to their small size and large surface area
(Warheit 2004). Secondly, nanoparticles are considered as building blocks for
nanotechnology and are widely utilized, such as in biomedical, optical, and electronic
applications (Katz and Willner, 2004; Al-Jamal and Kostarelos, 2007). Most of the
nanoparticles mentioned above are airborne. For either the pollution control or industrial
applications, they must be well characterized.
To characterize the physical properties of airborne nanoparticles, a scanning mobility particle
sizer (SMPS) (Wang and Flagan, 1990) has been developed to measure the size distribution
of particles in the submicrometer range. A nanoparticle surface area monitor (NSAM) for in
situ measurement of the surface area of nanoparticles deposited in certain regions of human
lungs has also been built (Shin et al., 2007). However, some features of nanoparticles, such as
their morphology and chemical composition, cannot be measured online by these instruments.
Nanoparticles’ morphology is an important feature as it can significantly influence their
transport behaviour and functions. Real-world nanoparticles are mostly in agglomerate form
because of the high number concentration of nanoparticles produced in various sources.
Nanoparticle morphology is best investigated via offline electron microscopy (Ito et al., 2004;

120
Liu 2005). In offline characterization, particles first need to be collected and then analysed
offline by instruments such as scanning/transmission electron microscopes (SEM/TEM).
Several nanoparticle samplers for supporting electron microscopy are commercially available.
The TEM sampler offered by FHNW (Fachhochschule Nordwestschweiz) shares a similar
configuration with that designed by Dixkens and Fissan (Dixkens and Fissan, 1999),
including a unipolar diffusion charging component and an electrostatic deposition component.
However, it has limited collection efficiency ranging from 11% for 20 nm particles to 3% for
320 nm particles (Fierz et al., 2007). The operation of the nanometer aerosol sampler (NAS;
TSI Model 3089) is based on the electrostatic precipitation principle. It has been successfully
applied in studying atmospheric aerosols (Hinkley et al., 2008; Barone and Zhu, 2008).
However, the TSI sampler is commercialized as an accessary to SMPSs, requiring sampled
particles to be electrically charged prior to entering the sampler (Li et al., 2010). Moreover,
the samplers are portable but not especially compact (FHNW TEM sampler: 35 cm × 25 cm
× 15 cm, and NAS: 20.3 cm × 25.6 cm × 22.8 cm, respectively). The design of the ESPnano
Model 100 (DASH Connector Technology, Inc.) is also basically an electrostatic precipitator
in the “point-to-plate” configuration, in which particles are charged and collected at the same
time. The ESPnano can efficiently collect nanoparticles on a TEM grid and is compact
enough for use for studying nanoparticles in work environments (Miller et al., 2010).
However, for a sampler using the “point-to-plate” design, aerosol contacts with the high
energy zone of a corona discharge, which is not recommended in practice (Stommel and
Riebel, 2005).

121
The corona charger is the key component of a sampler. Recent studies on chargers have
provided supports to the development of new samplers. The corona ionizer developed by
Hernandez-Sierra et al. (2011) can achieve charging efficiencies of 30% for 10 nm particles
under both positive and negative coronas. The unipolar corona charger developed by
Laschober et al. (2006) can yield three to five times of singly charged particles compared to
bipolar charging under optimal corona settings.
A compact nanoparticle sampler based on the principles of DC corona charging and
electrostatic precipitation is proposed in this study. The proposed sampler can be easily
applied in collecting nanoparticles for SEM/TEM and EDX (energy-dispersive X-ray
spectroscopy) analysis. Various experiments were conducted to evaluate and optimize the
performance of this prototype sampler. The effects of operational parameters, including the
total flow rate, aerosol/ion carrier flow rate ratio, and collection voltage, were first
investigated by using the particle collection efficiency as an index. The obtained results were
also used to determine the optimal working parameters for the sampler. The percentage of
particles deposited on different surfaces in the sampler was then characterized. The results
from this deposition experiment gave an accurate value for the percentage of particles
actually captured on the collection surface of the SEM stub in the proposed sampler. Finally,
to better understand the sampler’s performance in real-world applications, the collection
efficiency curves in the optimal operation were characterized for both solid and liquid
particles as well as PSL standard particles.

122
5.2 Sampler Design
A schematic diagram of the compact electrostatic sampler is shown in Figure 5.1. It consists
of two chambers: one for particle charging and the other for particle collection. The particle
charging chamber in the configuration is the same as that used in the NSAM (Shin et al.
2007). To produce unipolar ions, a pointed corona needle is used in the discharge
compartment, physically separated from the charging zone. Unipolar ions are then
transported by an ion carrier flow (free of particles) to the particle charging zone. By using
clean air as the ion carrier flow, the corona tip is well protected (i.e., free of contamination)
for long-term operation. The carrier flow and sampled aerosol stream are well mixed in the
particle charging zone via the opposing flow arrangement, and particles acquire electrical
charges during the mixing. The particles are then carried to the collection chamber, in which
a SEM stub is placed and electrically insulated from the ground. Within the electrically
grounded collection chamber wall, the electrified SEM stub is the collection stage of the
sampler. Several TEM grids can be fixed on the SEM stub if needed. Particles not collected
finally follow the total flow (i.e, the sum of the aerosol and ion carrier flows) and exit the
sampler via the outlet. Thus, two gas flows are inputs to the sampler (one an ion carrier flow
and the other an aerosol flow) while only one gas flow exits the particle collection chamber.
To operate the prototype sampler, two high voltage supplies are needed (one for corona
discharge and the other for charged particle collection).

123
Corona needle
(H.V.)
SEM stub (collection
stage; H.V.)
Ion carrier flow
Aerosol flow Total flow
Delrin material
Figure 5.1 Schematic diagram of prototype compact electrostatic sampler
5.3 Experimental Setup and Data Analysis
5.3.1 Experimental setup
Figure 2 is a schematic diagram of the experimental setup for evaluating the electrostatic
nanoparticle sampler. The sampler was tested with laboratory generated particles ranging
from 10 nm to 1000 nm (i.e., 10 nm to 500 nm for NaCl particles, 60 nm to 500 nm for oleic
acid particles, 100 nm to 1000 nm for PSL particles, and 60 nm to 400 nm for fluorescent
sodium particles). Monodisperse NaCl and oleic acid test particles in the sizes ranging from
60 nm to 500 nm were produced and selected by atomization-DMA (differential mobility
analyzer)-classification (Liu and Pui, 1974). To obtain particles with diameters less than 60

124
nm, monodisperse NaCl particles were generated by evaporation-condensation-DMA-
classification (Scheibel and Porstendörfer, 1983). Monodisperse PSL particles were dispersed
in air by spraying the PSL particle suspension (prepared from the dilution of concentrated
PSL particle suspensions purchased from Duke Scientific Corporation). Then they were
classified in a DMA. After the DMA classification, all the classified particles were
electrically charged. Particles with a steady-state charge distribution were obtained by
passing DMA-classified particles through a Po210 charge neutralizer. Electrically neutral
particles were further obtained by passing particles with a steady-state charge distribution
through a homemade electrostatic particle precipitator.
Figure 5.2 Experiment setup for the charger evaluation, measurement of particle collection
efficiency, and the fluorescence experiments
To measure the charge fraction of particles, a second electrostatic precipitator was applied to
remove the charged portion of particles exiting the particle charging chamber. The number

125
concentrations of particles upstream and downstream of the sampler were measured by a
UCPC (TSI Model 3025) operated in low flow mode (i.e., 0.3 lpm). The electrical charges on
particles after the particle charging chamber were measured with a sensitive electrometer
(Keithley Model 6514) connected to a homemade aerosol Faraday cage.
In this investigation the voltage applied on the corona needle was set at 2.7 kV in order to
obtain an operational current of 2.0 A. The particle collection voltage was varied from 1.5 to
4.5 kV in order to find the optimal collection voltage for the sampler. The ion carrier and
aerosol flow rates were varied from 0.33 to 1.50 lpm.
Fluorescence experiments were performed to characterize the percentage of particles actually
collected on the collection surface of the stage and other surfaces inside the sampler.
Monodisperse fluorescent sodium test particles were produced by the same technique used to
produce monodisperse NaCl particles. The spray solutions were prepared by dissolving
fluorescent sodium salt (Uranine; Sigma-Aldrich) in iso-propanol (CHROMASOLV® Plus,
for HPLC, 99.9%; Sigma-Aldrich). A filter holder with HEPA (high-efficiency particulate air)
filter medium was placed downstream of the sampler to collect particles in the exit stream. A
brief summary of the procedure in this part of experiment is given in the section 5.3.2c.
5.3.2 Experimental procedure and data analysis
(a) Measuring the particle collection efficiency of the sampler
The collection efficiency of the sampler at a specific particle size was calculated by eq5.1:

126
Collection efficiency = 1
2
1-N
N (5.1)
where N1 and N2 were the measured particle number concentrations downstream from the
sampler when particle charging was on and the collection voltage was off.
(b) Measuring the charging efficiency and average charge of the particles in the sampler
The intrinsic particle charging efficiency of the charger for a given size was calculated by the
method of Romay and Pui (1992), using eq5.2:
Intrinsic charge efficiency = 3
4
1N
N (5.2)
where N3 and N4 are the particle number concentrations measured downstream from the
second electrostatic precipitator with the applied voltage turned on and off, respectively. Note
that, in this part of experiment, the particle charging of the sampler was on, and the collection
stage voltage was off.
The extrinsic charging efficiency for particles of a specific size was evaluated using the
method described by Chen and Pui (1999):
Extrinsic charge efficiency = 5 3
6
/1 ecN N P
N
(5.3)
where N5 and N6 are the particle number concentration measured downstream and upstream
of the sampler, respectively. Pec is the penetration of neutral particles through the 2nd

127
electrostatic precipitator. The voltage applied to the corona needle was on, and the particle
collection voltage was off.
The average charge of the particles was calculated by eq5.4:
Average charge = 6
6
/I e
N Q (5.4)
where I6 is the aerosol current measured downstream from the sampler by the aerosol Faraday
cage electrometer, Q was the flow rate sampled into the cage electrometer; and e was the
elementary charge, 1.60×10⁻¹⁹C. In this measurement, the voltage on the corona needle was
on and the voltage to the collection stage was off.
(c) Determining the percentage of particles deposited at various surfaces in the sampler
Fluorescence experiments were performed to investigate the percentage of particles deposited
on various surfaces in the sampler. The detailed procedure for the experiments can be found
in the literature, such as the work of Chen and Pui (1995). Monodisperse fluorescent sodium
particles were the test particles. Each experimental run took two hours. After each run,
particles deposited on various surfaces in the sampler were recovered by multiple wiping
with cotton swabs wetted with aqueous solutions of 0.001 N NH4OH and then immersed in
beakers with 25 ml of the same solution. The solutions were then measured by a fluorometer
(Modulus Luminometer, Turner BioSystems). The fluorescence of each beaker solution
represented the mass of particles deposited at the designated surface in the sampler.

128
The percentage of particles of a given size on each designated surface was then calculated by
eq5.5:
Percentage of particles depositing on the surface i =
1
i
n
j
j
A
A
(5.5)
where Ai is the fluorescence of the beaker solution containing the particles recovered from the
surface i in the sampler, and n was the total number of inner surfaces studied.
5.4 Results and Discussion
5.4.1 Optimization of the sampler performance
(a) The effect of particles’ pre-charge condition and the particle charging
DMA-classified NaCl particles were selected as test particles to evaluate the particle charging
performance of the sampler, measured for particles having either neutralized or steady-state
charge distributions. The test operational conditions were 0.5 lpm aerosol flow, 0.5 lpm ion
carrier flow, and 4.5 kV for collection stage voltage. Figure 5.3 shows the particle collection
efficiency of the sampler when challenged with electrically neutral particles or particles
having steady-state charge distribution. It should be noted that the particle size in the figure
referred to the equivalent mobility size diameter, and this applies to the following figures. In
general, for particles having either pre-charge conditions, the efficiency of the sampler
increased as the particle size increased. The figure further evidences that the difference in
collection efficiencies for both pre-charge conditions are minor, ranging from 0.1% to 5.4%
when the particle size was varied from 50 to 500 nm. To better simulate typical conditions,

129
particles with a steady-state charge distribution were selected for the following collection
efficiency test.
9 10
20
30
40
50
60
70
80
90
100
200
300
400
500
600
700
800
900
1000
0
20
40
60
80
100
Neutralized particles
Particles with a steady-state charge distribution
Co
llectio
n E
ffic
ien
cy (
%)
Particle Size (nm)
Figure 5.3 Collection efficiencies of neutralized and steady-state charge distribution NaCl
particles (aerosol/ion carrier flow rate ratio of 1.0; total flow rate of 1 lpm; collection stage
voltage of 4.5 kV)
The particle charging performance was further evaluated to better understand the observed
trend in particle collection efficiency. Figure 5.4 shows the measured intrinsic and extrinsic
efficiencies of particle charging in the sampler at an aerosol/ion carrier flow rate ratio of 1.0
and a total flow rate of 1 lpm. The collection stage voltage was off. It is evident that both
charging efficiencies increased as the particle size increased, and the efficiencies reached
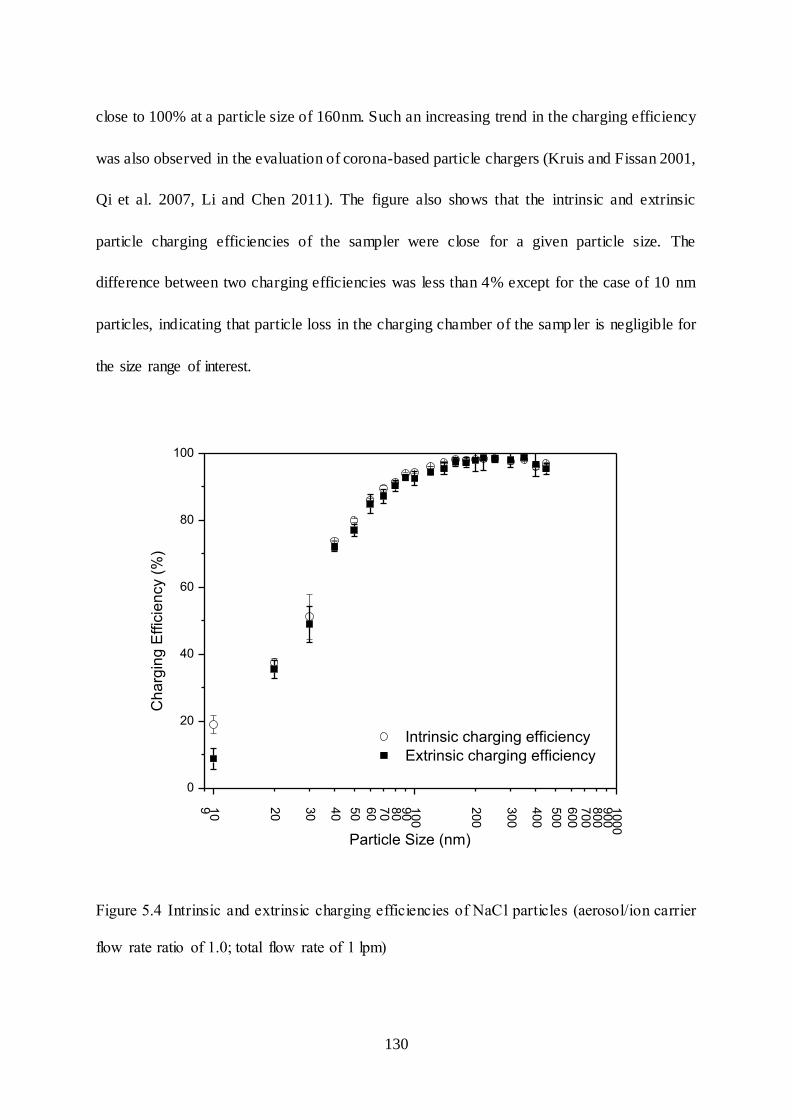
130
close to 100% at a particle size of 160nm. Such an increasing trend in the charging efficiency
was also observed in the evaluation of corona-based particle chargers (Kruis and Fissan 2001,
Qi et al. 2007, Li and Chen 2011). The figure also shows that the intrinsic and extrinsic
particle charging efficiencies of the sampler were close for a given particle size. The
difference between two charging efficiencies was less than 4% except for the case of 10 nm
particles, indicating that particle loss in the charging chamber of the samp ler is negligible for
the size range of interest.
9 10
20
30
40
50
60
70
80
90
100
200
300
400
500
600
700
800
900
1000
0
20
40
60
80
100
Intrinsic charging efficiency
Extrinsic charging efficiency
Ch
arg
ing
Effic
ien
cy (
%)
Particle Size (nm)
Figure 5.4 Intrinsic and extrinsic charging efficiencies of NaCl particles (aerosol/ion carrier
flow rate ratio of 1.0; total flow rate of 1 lpm)

131
(b) Effect of aerosol and ion carrier flow rate ratio
In this part of test, the total flow rate and the collection stage voltage were kept at 1.0 lpm
and 4.5 kV, respectively. Figure 5.5 shows the particle collection efficiencies of the sampler
at the various flow rate ratios. The efficiency remained nearly the same when the ion carrier
flow rate was higher than the aerosol flow, but collection efficiency was lower when the
aerosol flow rate was higher than the ion carrier flow rate (i.e., an aerosol/ion ca rrier rate
ratio of 3.0), especially for the particles smaller than 100 nm. The above observation can be
explained as follows: When the aerosol flow was dominant, more particles were carried into
the sampler while fewer ions were carried out by the low ion carrier flow, leading to low
particle charging efficiency. Compared with those for other test flow rate ratio cases, it
reduced particle collection efficiencies by 4.1% to 9.2% for particles ranging from 60 nm to
100 nm. The effect was not significant for particles larger than 100 nm, because the ion
concentration remained sufficient to charge such relatively large particles. The efficiency of
particle charging in the sampler (as shown in Figure 5.4) was 92.5% to 99.0% for particles
larger than 100 nm in diameter. It can further be expected that the sampler collection
efficiencies of particles with the sizes larger than 100 nm would decrease if the flow rate ratio
was further increased.

132
9 10
20
30
40
50
60
70
80
90
100
200
300
400
500
600
700
800
900
1000
0
20
40
60
80
100
Flow rate ratio: 1/3
Flow rate ratio: 1/2
Flow rate ratio: 1.0
Flow rate ratio: 3.0
Co
llectio
n E
ffic
ien
cy (
%)
Particle Size (nm)
Figure 5.5 Collection efficiencies of NaCl particles at different aerosol/ion carrier flow rate
ratio (total flow rate of 1 lpm; collection stage voltage of 4.5 kV)
(c) Effect of total flow rate
The effect of total flow rate (i.e., the sum of the aerosol and ion carrier flow rates) on the
sampler performance was investigated at an aerosol/ion carrier flow rate ratio of 1.0 and
collection stage voltage of 4.5 V. Figure 5.6 shows the collection efficiencies of the sampler
operated at total flow rates of 1.0, 2.0, and 3.0 lpm. Over the entire test particle size range,
the particle collection efficiency decreased as the total flow rate increased. This observation
is attributed to the reduction of residence time for particle charging and collection in the

133
sampler as total flow rate increased (Hinds 1999). In single stage electrostatic precipitator,
particles flow through the charging and precipitation zone in high intensity electrical field.
Under the influence of the electric field, charged particles drift toward the co llection
stage/substrate. High aerosol flow velocity results in a quick passage through the
precipitation zone, and consequently a short drifting distance and lower collection efficiency.
Moreover, for particles larger than 100 nm in diameter, the collection efficiency of the
studied sampler slightly decreased as the particle size increased, especially for the case of 3
lpm total flow rate. The above observation is attributed to the shorter time for particle
charging and lower charges on large particles (leading to the reduction of particle electrical
mobility) as compared to those at low total flow rates.

134
9 10
20
30
40
50
60
70
80
90
100
200
300
400
500
600
700
800
900
1000
0
20
40
60
80
100
Total flow rate: 1 lpm
Total flow rate: 2 lpm
Total flow rate: 3 lpm
Co
llectio
n E
ffic
ien
cy (
%)
Particle Size (nm)
Figure 5.6 Collection efficiencies of NaCl particles at different total flow rates (aerosol/ion
carrier flow rate ratio of 1.0; collection stage voltage of 4.5 kV)
(d) Effect of collection voltage
The effect of collection voltage on the sampler was studied at an aerosol/ion carrier flow rate
ratio of 1.0 and total flow rate of 3 lpm. The 3 lpm total flow rate was selected because the
particle charging time and the residence time of particles in the collection chamber were
limited, leading to more noticeable variation in the sampler collection efficiency when the
collection stage voltage was varied. Figure 5.7 gives the efficiency at the collection stage for
1.5, 3.0, and 4.5 kV. Accordingly, the electric field intensities between the aerosol inlet of the

135
collection chamber and the front surface of the collection stage were 9.4 kV/cm, 18.9 kV/cm,
and 28.3 kV/cm. The figure shows that the collection efficiency decreased as the collection
voltage decreased, over the entire tested particle size range. The above result is expected
because the weak electrical field at the low collection stage voltage setting resulted in shorter
drifting distance of charged particles, leading to less collection efficiency.
9 10
20
30
40
50
60
70
80
90
100
200
300
400
500
600
700
800
900
1000
0
20
40
60
80
100
Electric field intensity: 9.4 kV/cm
Electric field intensity: 18.9 kV/cm
Electric field intensity: 28.3 kV/cm
Co
llectio
n E
ffic
ien
cy (
%)
Particle Size (nm)
Figure 5.7 Collection efficiencies of NaCl particles at different collection stage voltages
(aerosol/ion carrier flow rate ratio of 1.0; total flow rate of 3 lpm)
Figure 5.7 also shows that the particle collection efficiency decreased as the particle diameter
increased for a given collection stage voltage. The electrical mobility of particles was reduced

136
as their sizes increased. Figure 8a gives the measured average charges on particles varying
from 10 to 500 nm, at a 1.0 aerosol/ion carrier flow rate ratio and 1 lpm total flow rate. Figure
8b provides the calculated electrical mobility of particles based on the average charges
measured for a given size (Hinds 1999). The electrical mobility of particles decreased
significantly as the particle diameter increased. The low electrical mobility of large particles
requires high electrical field intensity in order to precipitate them, thus there is less particle
deposition on the collection stage.
(a)
9 10
20
30
40
50
60
70
80
90
100
200
300
400
500
600
700
800
900
1000
0
5
10
15
20
25
Me
an
Ch
arg
e p
er
Pa
rtic
le
Particle Size (nm)

137
(b)
9 10
20
30
40
50
60
70
80
90
100
200
300
400
500
600
700
800
900
1000
0.0
1.0x10⁻⁶
2.0x10⁻⁶
3.0x10⁻⁶
Ele
ctr
ica
l M
ob
ility
[m
2/(
Vs
)]
Particle Size (nm)
Figure 5.8 (a) Collection efficiencies of NaCl particles at different collection stage voltages;
(b) Electrical mobility of NaCl particle (aerosol/ion carrier flow rate ratio of 1.0; total flow
rate of 1 lpm)
(e) Optimal operational conditions of the studied sampler
Based on the data present above, we concluded that the prototype sampler achieved the
highest particle collection efficiency at a total flow rate of 1.0 lpm (with the aerosol/ion
carrier flow rate ratio of 1.0) and a collection stage voltage of 4.5 kV.

138
5.4.2 Particle deposition in the sampler
Fluorescence experiments were performed to characterize the percentage of particles
deposited on various surfaces inside the sampler as a function of particle size. The results of
these experiments are given in Figure 5.9, indicating that 57% to 78% of the particles
deposited on the front surface of the collection stage (i.e., the SEM stub) for particles with the
diameters varying from 60 nm to 400 nm.
Figure 5.9 Particle deposition in the sampler
In addition to the collection surface of the SEM stub, noticeable particle deposition occurred
on the inner surface of the collection chamber (9.8% to 25.2%). After entering the collection
chamber, particles that were not deposited on the collection surface of the SEM stub moved
outward to the stub edge, turned 90o and moved through the annular gap at the stub’s outer
0%
10%
20%
30%
40%
50%
60%
70%
80%
90%
100%
0%
10%
20%
30%
40%
50%
60%
70%
80%
90%
100%
Co
lle
cti
on
Eff
icie
nc
y B
as
ed
on
Pa
rtic
le
Nu
mb
er
Co
nc
en
tra
tio
n
Flu
ore
sc
en
t F
rac
tio
n
1: particles exiting thesampler
2: inner wall ofcollection chamber
3: side wall of collectionstage
4: inner wall of chargingchamber
5: front surface ofcollection stage
collection efficiencybased on number
comcentration

139
edge prior to exiting. The sharp flow turn generally resulted in flow recirculation at the corner,
facilitating particle deposition on the inner wall of collection chamber.
Note that particles that escaped from the sampler were collected on the HEPA filter in each
experimental run. By fluorescence measurement, between 4.7 to 12.2% of particles in test
sizes of 400, 200, 100, and 60 nm were not collected by the sampler. This set of data is
consistent with the calculated penetration of particles with designated particle sizes (based on
particle number concentration measurement). The calculated penetration data are also
presented in Figure 5.9 for the reference.
5.4.3 Effect of particle material
To investigate the effect of particle material on the particle collection efficiency, oleic acid
particles and PSL particles were selected. PSL particles were used because they are standard
research particles (Gombocz et al., 1987; Li and Lindsay, 1991). The collection efficiency
measurements are shown in Figure 5.10. The collection efficiency data for NaCl particles
under the optimal operation condition is also given in the same plot for comparison. As
discussed previously, the collection efficiency of NaCl particles increased as the particle size
increased, due to the increase in charging efficiency. The sampler had more than 90%
collection efficiency for particles larger than 60 nm. Similarly, the sampler had a collection
efficiency higher than 90% for PSL particles with diameters varying from 100 to 900 nm.

140
9 10
20
30
40
50
60
70
80
90
100
200
300
400
500
600
700
800
900
1000
0
20
40
60
80
100
NaCl particles
Oleic acid particles
PSL particles
Co
llectio
n E
ffic
ien
cy (
%)
Particle Size (nm)
Figure 5.10 Collection efficiencies of NaCl particles, oleic acid particles and PSL particles
(aerosol/ion carrier flow rate ratio of 1.0; total flow rate of 1 lpm; collection stage voltage of
4.5 kV)
For oleic acid particles, the collection efficiency of the sampler increased, as the particle size
increased as expected. However, the efficiency was higher than 90% at sizes larger than 150
nm, a higher value than those for the cases of NaCl and PSL particles. The collection
efficiencies for oleic acid particles were in general lower than those for NaCl particles in the
particle size range from 50 to 150 nm.
The trend of a collection efficiency increase with increasing particle size, and the low
collection efficiency for oleic acid particles as compared to the cases of NaCl and PSL

141
particles ranging from 50 to 150 nm can both be explained by the charging efficiency and
average charges on particles (shown in Figure 5.11). For comparison, the data for NaCl
particles are also re-plotted. The increasing trend of the collection efficiency is due to the
increase of charging efficiency with increasing particle size. However, the charging
efficiency of an oleic acid particle is lower than that of a NaCl particle in the same size range
(shown in Figure 5.11a).
(a)
9 10
20
30
40
50
60
70
80
90
100
200
300
400
500
600
700
800
900
1000
0
20
40
60
80
100
Intrinsic charging efficiency of oleic acid particles
Extrinsic charging efficiency of oleic acid particles
Intrinsic charging efficiency of NaCl particles
Extrinsic charging efficiency of NaCl particles
Ch
arg
ing
Effic
ien
cy (
%)
Particle Size (nm)

142
(b)
9 10
20
30
40
50
60
70
80
90
100
200
300
400
500
600
700
800
900
1000
0
5
10
15
Oleic acid particles
NaCl particles
Me
an
Ch
arg
e p
er
Pa
rtic
le
Particle Size (nm)
Figure 5.11 (a) Intrinsic and extrinsic charging efficiencies of oleic acid particles and NaCl
particles; (b) Average charges of oleic acid particles and NaCl particles (aerosol/ion carrier
flow rate ratio of 1.0; total flow rate of 1 lpm)
As shown in Figure 5.11b, the average charges on oleic acid particles are close to those on
NaCl particles in the same diameters. Consistent with the finding of Shin et al. (2009),
particles made of materials with different dielectric constants had similar mean charge per
particle values in unipolar diffusion charging. The similar mean charges per particle for NaCl
and oleic acid particles resulted in similar transport behavior in the collection chamber of the
studied sampler.

143
5.5 Conclusions
An electrostatic nanoparticle sampler in a compact package has been developed for offline
analysis of nanoparticles via electron microscopy. The prototype sampler basically consists of
two chambers: one chamber is for particle charging and the other for particle collection. For
charging particles, unipolar ions are produced in a separate compartment via DC corona
discharge and carried to the particle charging chamber via a particle-free gas flow. The
charging process prevents the corona needle (especially the needle tip) from becoming
contaminated by particles. Particles are sampled into the charging chamber of the prototype
via the inlet and electrically charged by mixing them with an ion carrier flow (in an opposing
flow arrangement). After the electrical charging, particles are directed into the collection
chamber via a straight nozzle connecting the two chambers. A nozzle-to-plate configuration
is used in the collection chamber for collecting charged particles on the collection stage (i.e.,
the SEM stub) by a separate electrical field established between the no zzle and collection
stage. Particles that escape collection exit the sampler through the outlet.
A parametric study, including the effect of total flow rate, the ratio of the aerosol/ion carrier
flow rates, and collection voltage, was performed to optimize the performance of the
prototype. The collection efficiency of lab-generated NaCl particles with sizes from 50 nm to
500 nm was measured in this part of the study. The optimal working conditions for the
prototype were found to be a total flow rate of 1.0 lpm, an aerosol/ion carrier flow rate ratio
of 1.0, and a collection voltage of 4.5 kV. Under the above working conditions, the particle
collection efficiency of the sampler varied from 90.5% to 99.3% for particles in the sizes
ranging from 50 to 500 nm. Because of the increase in charging efficiency, the particle

144
collection efficiency of the sampler in general increased as the particle diameter increased. It
was further found that, at a total flow rate higher than 3.0 lpm, the sampler’s collection
efficiency showed a decreasing trend as the particle diameter increased, because of the
decrease in particle electrical mobility and particle residence time in the particle charging
chamber.
Fluorescence experiments were also performed to characterize the percentage of particles
actually collected on the collection stage of the sampler. It was concluded that 57% to 78% of
fluorescent sodium particles ranging from 60 to 400 nm were collected on the front surface of
the collection stage (i.e., the SEM stub). The remaining particles were either deposited on the
inner wall of the collection chamber or exited the sampler.
Monodisperse PSL and oleic acid particles were used to investigate the effect of particle
material on the sampler performance. High collection efficiencies of 98.1% to 99.6% for PSL
particles with sizes from 100 nm to 900 nm were obtained. For oleic acid particles ranging
from 50 to 150 nm, the sampler had lower collection efficiencies (from 75.6% to 93.8%) than
for NaCl particles in the same size range. The sampler had comparable collection efficiency
(from 96.7% to 97.7%) for oleic acid and NaCl particles larger than 150 nm. The above
observation was attributed to the lower charging efficiency for oleic acid particles in the size
range from 50 nm to 150 nm and the comparable charging efficiency in the size range from
150 nm to 500 nm, when compared with that in the case of NaCl particles. It was further
found that the prototype had a collection efficiency ranging from 5.0% to 83.1% for 10 to 50
nm NaCl particles. For particles in all three test materials, the collection efficiency of the
sampler in general increased as the particle diameter increased. This result can be explained

145
by the low charging efficiency of single digit nanoparticles and the increase of the charging
efficiency as the particle size increases.

146
5.6 References
Al-Jamal, W.T., and K. Kostarelos. 2007. Liposome Nanoparticle Hybrids for Multimodal
Diagnostic and Therapeutic Applications. Nanomedicine 2:85-98.
Barone, T.L., and Y. Zhu. 2008. The Morphology of Ultrafine Particles on and near Major
Freeways. Atmos. Environ. 42:6749-6758.
Biswas, P., and C.-Y. Wu. 2005. Nanoparticles and the environment. J. Air Waste Manage.
55(6):708-746.
Chen, D.-R., and D.Y.H. Pui. 1995. Numerical and Experimental Studies of Particle
Deposition in a Tube with Conical Contraction-Laminar Flow Regime. J. Aerosol Sci.
26:563-574.
Chen, D.-R., and D.Y.H. Pui. 1999. A High Efficiency, High Throughput Unipolar Aerosol
Charger for Nanoparticles. J. Nanopart. Res. 1:115-126.
Dixkens, J., and H. Fissan. 1999. Development of an Electrostatic Precipitator for Off-Line
Particle Analysis. Aerosol Sci. Tech. 30:438-453.
Fierz, M., R. Kaegi, and H. Burtscher. 2007. Theoretical and Experimental Evaluation of a
Portable Electrostatic TEM Sampler. Aerosol Sci. Tech. 41:520-528.
Gombocz, E., D. Tietz, S.S. Hurtt, and A. Chrambach. 1987. Polystyrene Latex Particles as
Size Standards in Quantitative Agarose Gel Electrophoresis: Application to Three
Plant Viruses. Electrophoresis 8:261-271.
Hernandez-Sierra, A., F.J. Alguacil, and M. Alonso. 2011. Unipolar Charging of Nanometer

147
Aerosol Particles in a Corona Ionizer. J. Aerosol Sci. 34:733-745.
Hinds, W.C. 1999. Aerosol technology: properties, behavior, and measurement of airborne
particles. New York: John Wiley & Sons.
Hinkley, J.T., H.A. Bridgman, B.J.P. Buhre, R.P. Gupta, P.F. Nelson and T.F. Wall. 2008.
Semi-Quantitative Characterisation of Ambient Ultrafine Aerosols Resulting from
Emissions of Coal Fired Power Stations. Sci. Total Environ. 391:104-113.
Ito, K., L. Sun, M.A. Bevan, and R.M. Crooks. 2004. Comparison of Nanoparticle Size and
Electrophoretic Mobility Measurements Using a Carbon-Nanotube-Based Coulter
Counter, Dynamic Light Scattering, Transmission Electron Microscopy, and Phase
Analysis Light Scattering. Langmuir 20:6940-6945.
Katz, E., and I. Willner. 2004. Integrated Nanoparticle–Biomolecule Hybrid Systems:
Synthesis, Properties, and Applications. Angew. Chem. Int. Ed. 43:6042-6108.
Kaupplnen, E.I., and T.A. Pakkanen, 1990. Coal Combustion Aerosols: A Field Study.
Environ. Sci. Tech. 24:1811-1818.
Kruis, F.E., and H. Fissan. 2001. Nanoparticle Charging in a Twin Hewitt Charger. J.
Nanopart. Res. 3:39-50.
Laschober, C., S.L. Kaufman, G. Reischl, G. Allmaier, and W.W. Szymanski. 2006.
Comparison between an Unipolar Corona Charger and a Polonium-Based Bipolar
Neutralizer for the Analysis of Nanosized Particles and Biopolymers. J. Nanosci.
Nanotechno. 6:1474-1481.

148
Li, L., and D.-R. Chen. 2011. Performance Study of a DC-Corona-Based Particle Charger for
Charge Conditioning. J. Aerosol Sci. 42:87-99.
Li, Y., and S.M. Lindsay. 1991. Polystyrene Latex Particles as a Size Calibration for the
Atomic Force Microscope. Rev. Sci. Instrum. 62:2630-2633.
Li, C., S. Liu, and Y. Zhu. 2010. Determining Ultrafine Particle Collection Efficiency in a
Nanometer Aerosol Sampler. Aerosol Sci. Tech. 44:1027-1041.
Liu, J. 2005. Scanning Transmission Electron Microscopy and Its Application to the Study of
Nanoparticles and Nanoparticle Systems. J. Electron Microsc. 54:251-278.
Liu, B.Y.H., and D.Y.H. Pui. 1974. A Submicron Aerosol Standard and the Primary,
Absolute Calibration of the Condensation Nuclei Counter. J. Colloid Interface Sci.
47:155-171.
Miller, A., F. Garrett, G. King, and C. Sunderman. 2010. A Handheld Electrostatic
Precipitator for Sampling Airborne Particles and Nanoparticles. Aerosol Sci. Tech.
44:417-427.
Qi, C., D.-R. Chen, and D.Y.H. Pui. 2007. Experimental Study of a New Corona-Based
Unipolar Aerosol Charger. J. Aerosol Sci. 38:775-792.
Romay, F.J., and D.Y.H. Pui. 1992. On the Combination Coefficient of Positive Ions with
Ultrafine Neutral Particles in the Transition and Free-Molecule Regimes. Aerosol Sci.
Tech. 17:134–147.
H.G., Scheibel, and J. Porstendörfer. 1983. Generation of Monodisperse Ag- and NaCl-

149
Aerosols with Particle Diameters between 2 and 300 nm. J. Aerosol Sci. 14:113-126.
Shin, W.G., D.Y.H. Pui, H. Fissan, S. Neumann, and A. Trampe. 2007. Calibration and
Numerical Simulation of Nanoparticle Surface Area Monitor (TSI Model 3550
NSAM). J. Nanopart. Res. 9:61-69.
Shin, W.G., C. Qi, J. Wang, H. Fissan, and D.Y.H. Pui. 2009. The Effect of Dielectric
Constant of Materials on Unipolar Diffusion Charging of Nanoparticles. J. Aerosol
Sci. 40:463-468.
Stommel, Y.G., and U. Riebel. 2005. A Corona-Discharge-Based Aerosol Neutralizer
Designed for Use with the SMPS-System. J. Electrostat. 63:917-921.
Wang, S.C., and R.C. Flagan. 1990. Scanning Electrical Mobility Spectrometer. Aerosol Sci.
Tech. 13:230-240.
Warheit, D.B. 2004. Nanoparticles: Health Impacts. Mater. Today 7:32-35.

150
CHAPTER 6. CHARACTERIZATION OF SUBMICROMETER PARTICLES FROM
SAWDUST/COAL CO-FIRING IN A DROP-TUBE FURNACE
The results of this chapter will be compiled as a paper for submission to Bioresource Technology
(authors: He Jing, Xiaofei Wang, Sijia Li, Brent J. Williams, and Pratim Biswas).

151
Abstract
Co-firing of coal with biomass for electricity generation is a promising alternative of coal
combustion, considering its economic and environmental benefits. However, many aspects of
co-firing are still not well known, for example, the fine particle formation from co-firing. In
this study, the submicrometer particles from co-firing of coal with sawdust in a drop-tube
furnace were studied. Particle size distributions, elemental compositions, and organic
compositions of particles were analyzed in detail. Results show that coal contributed more in
the submicrometer particle formation than sawdust. With higher amount of sawdust in the
blended fuel, there were less fine particles generated. It was also found that high sulfur coal
resulted in more particle formations during the co-firing, which subsequently resulted in more
organics in the particles. Higher combustion temperature promoted the submicrometer
particle formation and also resulted in higher organic concentrations in the particles. With
higher moisture content in the sawdust, the total number concentration of particles decreased,
however, the particle growth was enhanced and the particle concentrations in the size range
of 80 nm to 500 nm increased. The organic particle concentration was also higher with higher
moisture, indicating that most of the organics were in the larger particles (> 80 nm).
152
6.1 Introduction
Pulverized coal combustion is a major source for electricity generation in U.S.. In 2014, 38.7%
of the electricity is provided by coal- fired power plants (Hankey 2015). Meanwhile, coal
combustion has a significant environmental impact due to its pollution emissions. In order to
control the air pollution emissions, recently USEPA has finalized several rules and standards
to reduce power plant emissions, including Cross-State Air Pollution Rule (CSAPR) aiming
to reduce SO2 emissions by 73% and NOx emissions by 54% from 2005 levels in the CSAPR
region, and Mercury and Air Toxics Standards (MATS), which will result in reducing 90% of
mercury emissions, 88% of acid gas emissions, 41% of SO2 emissions beyond the reductions
expected from CSAPR, as well as reduction of non-mercury metals and dioxins and furans
emissions. Nowadays, CO2, the primary greenhouse gas, is considered as a gas pollutant as
well. Fossil fuel- fired power plants are the largest source of U.S. CO2 emissions. In order to
reduce the CO2 emissions, currently EPA is also developing carbon pollution standards for
power plants under the Clean Air Act.
Co-firing of coal and biomass for electric generation is an attractive biomass-to-energy
approach because of its economic and environmental benefits. It has been demonstrated,
tested, and proved in all boiler types commonly used by electric utilities (Dai et al., 2008;
Sami et al., 2001). Co-firing can help reduce the pollutant emissions. Firstly, most biomass
fuels have low sulfur contents; besides, alkaline ash from biomass combustion can capture
SO2, so co-firing generates less SO2 than coal combustion. Secondly, most of the nitrogen in
biomass is converted into NH radicals, which reacts with NO; meanwhile, woody biomass
contains lower amount of nitrogen than coal, thus, co-firing reduces NOx emissions. It will

153
reduce the mercury emissions as well due to the low mercury content in the biomass.
Moreover, biomass is considered CO2-neutral, so co-firing directly reduces CO2 emissions
from power plants (Saidur et al., 2011; Sami et al., 2001; Williams et al., 2012).
As other fossil fuel combustion process, co-firing also generates fly ash particles. Among
them, the submicrometer particles are of special interests because they could penetrate into
the alveolar regions of the lungs upon inhalation, thus have more significant adverse health
effects (Biswas and Wu, 2005). Previously researches have been done on characterization of
submicrometer particles from co-firing of coal with orujillo (Jiménez and Ballester, 2005),
switchgrass (Blevins and Cauley, 2005), rice husk (Chao et al., 2008; Mantananont et al.,
2012), bamboo (Chao et al., 2008), and bagasse (Mantananont et al., 2012). However, more
studies are needed, because the compositions of different types of biomass vary (Sami et al.,
2001; Dai et al., 2008; Williams et al., 2012; Saidur et al., 2011) and it will influence the
physical and chemical properties of the emitted submicrometer ash particles. Among the
previous studies, only one has looked into the chemical composition of submicrometer ash
particles (Jiménez and Ballester, 2005). Moreover, the organic composition of submicrometer
particles has not been investigated.
Sawdust is a major by-product of cutting, grinding, drilling, sanding, or pulverizing wood. Its
abundance and heat value (commonly 8440-18991 kj/kg) (Bartok 2004) make sawdust a good
biomass candidate for the co-firing. It has been proven experimentally that co-firing of coal
and sawdust may have lower NOx emission than the dedicated coal combustion (Skeen et al.,
2010), as well as less SO2 (Kazagic and Smajevic, 2009; Zuwala and Sciazko, 2010) and CO
(Zuwala and Sciazko, 2010) emission. Besides, the sawdust could enhance ignition
154
characteristics of low rank coals (Gani et al., 2005). Furthermore, an investigation shows that
co-firing of coal with pine-sawdust did not have operational problems due to slagging and
fouling (Abreu et al., 2010). Sawdust may be a good option as biomass fuel in the co-firing
with coal in the future and currently studies on improve the co-firing performance is
undergoing (Sarkar et al., 2014). Considering the potential developments and applications of
co-firing of coal with sawdust, the study on submicrometer particles from this co-combustion
process is urgently needed.
In this study, the submicrometer particles from coal/sawdust co-firing in a drop-tube furnace
were characterized, including the particle size distribution, elemental analysis, and organic
composition analysis. Both low sulfur and high sulfur content coals were used. The effects of
combustion temperature and moisture content in sawdust on the particle formation were also
studied.
6.2 Experimental Section
6.2.1 Drop-tube furnace system
The drop-tube furnace system for coal/sawdust combustion is shown in Figure 6.1. The drop-
tube furnace consists of a furnace (Lindberg/Blue M Model HTF55342C, ThermoElectron
Corp., USA) and an alumina tube (5.72 cm ID, 121.92 cm long) inside it. The coal/sawdust
blend was fed by a coal feeder with a mass flow rate of 2.5 g/hr. A total of 3 LPM of air was
introduced into the furnace as oxidizer, in which 0.5 LPM of air passed through the coal
feeder and carried the coal/sawdust blend, and the other 2.5 LPM was introduced directly into

155
the furnace. Downstream the furnace, 5 LPM air was introduced to dilute the flue gas. A
cascade impactor (Mark III, Pollution Control System Corp, Seattle, WA) was used to
remove the particles with diameter larger than 1 μm.
Figure 6.1 Schematic of the drop-tube furnace system and particulate matter measurement
instruments
6.2.2 Particle characterization methods
The on- line instruments are also shown in Figure 6.1. The size distributions of submicrometer
fly ash particles were measured with a scanning mobility particle sizer (SMPS, TSI Inc.,
Shoreview, MN, USA). For elemental analysis, the particle samples were collected on Teflon
filters and then analyzed with X-ray fluorescence (XRF) offline.
A high-resolution time-of-flight aerosol mass spectrometer (HR-Tof-AMS, Aerodyne
Research, MA) was used to characterize the organic compositions of particles. Its operation

156
mechanism can be summarized as: during the measurements, particles were introduced in the
instrument through an aerodynamic lens, which focus the particles into a narrow beam, and
the sizes of particles were determined by their velocities across a time of flight chamber at the
exit of the lens. The particles were then impacted on a 600 oC vaporizer where their non-
fraction fraction got vaporized. After that, the vapors were immediately ionized with electron
impact ionization and analyzed by time-of-flight mass spectrometry. More detailed
description of this instrument could be found in previous reports (Allan et al., 2003;
Canagaratna et al., 2007; DeCarlo et al., 2006; Jimenez et al. 2003).
6.2.3 Properties of coal and sawdust
Two types of coal are used in this study, including the PRB (Powder River Basin) sub-
bituminous coal and Illinois No.6 high sulfur bituminous coal. The proximate and ultimate
analysis of coal and sawdust are shown in Table 6.1. The coal and biomass were pulverized
into particles with sizes smaller than 45 μm before use. For the blends samples, the coal and
sawdust were well mixed with a shaker before use.

157
Table 6.1 Proximate and ultimate analysis of coals and sawdust
Illinois No. 6
coal
PRB coal Sawdust
Proximate analysis (%wt)
Volatile matter1 42 48.3 81.1
Fixed carbon1 48 42.9 16.55
Ash1 10 8.0 1.03
Moisture2 13.5 27.7 9.0
Ultimate analysis (%wt)
Carbon 71 67.3 49.55
Nitrogen 1.3 0.96 0.16
Hydrogen 5 4.58 5.70
Oxygen 9.13 19.9 N/A
Sulfur 3.47 0.57 0.023
Chlorine 0.11 0.01 N/A
Fluorine N/A 0.796 N/A
1Dry weight basis
2As-received basis
6.2.4 Experimental design
This study was conducted in four parts. Firstly, the chemical compositions and size
distributions of submicrometer particles from PRB coal/sawdust co-firing were characterized;
then, Illinois No.6 coal was used instead of PRB coal to investigate the effect of using a high

158
sulfur coal on particle formation during co-firing; thirdly, size distributions and organic
compositions of particles generated under three different combustion temperatures were
compared to study the temperature effect; lastly, the effect of moisture content in the sawdust
on submicrometer particle formation was evaluated. The detailed experimental design is
shown in Table 6.2. The selected blend ratios were 15% biomass and 30% biomass because
they are in the best range for blended coal/biomass fuel in terms of maximum energy output
with minimum pollutant emissions (Chao et al., 2008).

159
Table 6.2 Summary of experimental conditions
Set Objective Fuel Moisture
content in
sawdust
Furnace set
temperature
Measurements
I To characterize the
submicrometer
particles from co-
firing in general
PRB
coal/sawdust
(0/100, 70/30,
85/15, 100/0)
0 1376 K Particle size
distribution
(SMPS); elemental
analysis (XRF);
organics
concentrations
(AMS)
II To evaluate the
effect of sulfur in
coal on
submicrometer
particle formation
Illinois No.6
coal/sawdust
(0/100, 70/30,
85/15, 100/0)
0 1376 K SMPS; AMS
III To evaluate the
effect of combustion
temperature on
submicrometer
particle formation
PRB
coal/sawdust
(85/15)
0 1376 K;
1326 K;
1276 K
SMPS; AMS
IV To evaluate the
effect of combustion
temperature on
submicrometer
particle formation
PRB
coal/sawdust
(85/15)
0, 20%,
40%
1376 K SMPS; AMS

160
6.3 Results and Discussion
6.3.1 Characterization of submicormeter particle formation from PRB coal/sawdust co-firing
The size distributions of submicrometer particles from co-firing (15% sawdust and 30%
sawdust), dedicated PRB coal combustion, and sawdust combustion are shown in Figure 6.2a.
They all had a unimodal distribution, because they were formed through a pathway of
nucleation/condensation of volatilized mineral matter. This pathway is well-known for coal
combustion (Flagan 1978; Xu et al., 2011; Zhuang and Biswas, 2001; Suriyawong et al.,
2006; Wang et al., 2013a), and there is a general agreement on the fact that the formation of
fine particles from biomass combustion follows the same pathway (Bryers 1996, Jiménez and
Ballester 2005). The size distribution of 15% sawdust case had a peak at 43 nm, and the peak
size of the distribution of 30% sawdust case was 53 nm. Generally, with increasing sawdust
content in the fuel, fewer particles were formed. It indicates that there were less volatilized
minerals in sawdust than in PRB coal (Xu et al., 2011). Elemental analysis results in Figure
6.2b are also good support to this point. The elemental composition of the fine particles from
co-firing was similar to that of the particles from coal combustion, and particles from co-
firing did not have high alkaline metal content (calcium and potassium from the sawdust
combustion) as particles from biomass combustion. Thus, coal was the main contributor of
submicrometer particles in this case.

161
(a)
10 10010
2
103
104
105
106
107
500400300
dN
/dlo
gD
p (
#/c
m3)
Particle diameter (nm)
PRB coal
15% dried sawdust + PRB coal
30% dried sawdust + PRB coal
Pure sawdust
200
(b)

162
(c)
Figure 6.2 Characterizations of particles from co-firing of PRB coal with sawdust, dedicated
coal and sawdust combustion: (a) size distribution; (b) elemental analysis; (c) average mass
spectrum
In previous co-firing studies, it was found that orujillo, rice husk, and bamboo contributed
more than coal in submicrometer formation (Jiménez and Ballester, 2005; Chao et al., 2008);
switchgrass combustion dominated the particles formation in the range between 10 nm to 150
nm (Blevins and Cauley, 2005). Compared to them, the sawdust used in this study is a better
biofuel for co-firing application in terms of submicrometer particle emissions. Moreover, the
proximate analysis in Table 6.1 shows that the sawdust has a very low ash content, which
results in low total ash production.

163
Although the main components of submicrometer particles are inorganic substances (Linak
and Wendt, 1994; Jiménez and Ballester, 2005), it has been found that there are organics in
fine particles from both biomass combustion (Hays et al., 2002) and pulverized coal
combustion (Wang et al., 2013b; Wang et al., 2015). The currently proposed mechanism
organic aerosol formation from coal combustion is shown in Figure 1.2. Coal combustion
usually occurs in three steps: (a) pyrolysis of coal; (b) burning of tar; and (c) burning of char
(Warnatz 2006). A small fraction of organic volatiles from coal pyrolysis are not oxidized or
just partially oxidized and absorbed by the inorganic ash partic les, resulting in presence of
organic parts in the submicrometer particles (Wang et al., 2013b; Wang et al. 2015). The
organic aerosol formation from biomass combustion is expected to occur in the same route.
The AMS organic mass spectra of submicrometer particles from co-firing, and dedicated
PRB coal and sawdust combustion are shown in Figure 6.2c. Many significant organic peaks
(such as m/z 43, 44, 55, 57, and 69) are observed from the co-firing samples. The large peak
at m/z 44 indicates the presence of carboxylic acids, and the peak at m/z 69 indicates
aromatic compounds (Dall'Osto and Harrison, 2012). They are two major organic compounds
in the submicrometer particles from co-firing. With higher sawdust mixing ratio, organic
concentration is lower. It seems contradictory to the fact that sawdust has much higher
volatile matter (VM) content than PRB coal. However, the reaction characteristics time of
VM played a more important role than VM concentration here, which resulted in a reduction
of particle organic concentration when sawdust mixing ratio increased. The VM combustion
time scale in biomass was in the order of a few milliseconds while coal took a few seconds to
finish the combustion (Sami et al., 2001). Thus the VM from sawdust will be combusted

164
more completely than VM form coal during the same residence time (~62.6 seconds for the
studied drop-tube furnace system). Previous study has also showed that biomass could reduce
the PAH concentration in the fly ash particles (Chao et al., 2008).
6.3.2 Characterization of submicormeter particle formation from Illinois No.6 coal/sawdust
co-firing
In this section, Illinois No.6 coal was used in the co-firing with sawdust to investigate the
effect of sulfur content in coal on submicrometer particles formation during co-firing. The
particle size distributions for the cases in Illinois No.6 coal co-firing study are shown in
Figure 6.3a. The particle concentrations from co-firing were much higher than when PRB
coal was used (Figure 6.2a), because Illinois No.6 coal has a higher sulfur content (3.47%
compared to 0.57% in PRB coal, as shown in Table 6.1) and the combustion produced a large
amount of sulfate particles. When PRB coal was used, the concentration of particles from co-
firing was much lower than that from dedicated coal combustion for the 80 nm to 500 nm
size range. However, in the Illinois No.6 coal cases, particle concentrations in that range were
almost the same for co-firing and dedicated coal combustion. Previous studies have hinted
that the relatively increase of particle concentrations from co-firing resulted from the reaction
between the alkali metal species and SO2 in the flue gas (Christensen et al., 1998; Christensen
and Livbjerg, 2000; Iisa et al., 1999; Jiménez and Ballester, 2005). Burning of high sulfur
Illinois No.6 coal resulted in high SO2 concentration. The high SO2 concentration resulted in
higher extent sulfation reactions of alkali chlorides and hydroxides (calcium and potassium
species in the sawdust case), which were mainly from sawdust.

165
(a)
10 10010
2
103
104
105
106
107
dN
/dlo
gD
p (
#/c
m3)
Particle diameter (nm)
ILL#6 coal
15% dried sawdust + ILL#6 coal
30% dried sawdust + ILL#6 coal
Pure sawdust
500400300200

166
(b)
Figure 6.3 Characterizations of particles from co-firing of Illinois No.6 coal with sawdust,
dedicated coal and sawdust combustion: (a) size distribution; (b) average mass spectrum
The organic particle concentrations from sawdust/Illinois No.6 co-firing (Figure 6.3b) were
much higher than those from sawdust/PRB coal co-firing (Figure 6.2c) as well (almost two
orders of magnitudes higher). This is because the organic particle formation is closely
correlated with the inorganic particle formation, as shown in Figure 1.2. Firstly, total surface
area of particles, which is determined by the total amount of inorganic compositions in the
particles, greatly influences how much volatile organics absorbs on the particles; secondly,
the inorganic compounds in the particles can protect organics in the particles from further
oxidation (Wang et al., 2013b; Wang et al., 2015). Thus higher amount of inorganic particles
from co-firing of sawdust/Illinois No.6 resulted in a high concentration of organic aerosols.

167
The concentrations of organics from co-firing were still lower than those from the dedicated
coal combustion. However, unlike in the co-firing of PRB coal with sawdust (Figure 6.2c),
more organic aerosols were formed in the 30% sawdust case than in the 15% sawdust case. It
is hypothesized that submicrometer particles grew more rapidly in the co-firing of Illinois
No.6 coal with sawdust, which provided better protection to organic matters that were
absorbed on the particles and prevent them from being further oxidized; in the 30% sawdust
case, more VM was generated and absorbed on the particles, which led to a higher organic
concentrations in the particles from the co-combustion.
6.3.3 Effects of temperature on submicrometer particles formation during co-firing
In order to evaluate the effect of combustion temperature on particle formation, 15% sawdust
and 85% PRB coal were co-fired under 1276 K, 1326 K, and 1376 K, respectively. Figure
6.4a shows that with lower combustion temperature, particle formation was suppressed,
because lower temperature resulted in less quantity of metal species that were volatilized,
which subsequently engendered less fine particle formation (Zhang et al., 2006; Zhang et al.,
2007; Sui et al. 2007).

168
(a)
10 10010
2
103
104
105
106
107
dN
/dlo
gD
p (
#/c
m3)
Particle diameter (nm)
Furnace Temperature:
1376 K
1326 K
1276 K
500400300200

169
(b)
Figure 6.4 Characterizations of particles from co-firing of PRB coal with sawdust (mass ratio:
85/15) under various temperatures: (a) size distribution; (b) average mass spectrum
Influenced by the suppressed formation of fine particles, the concentration of organics in
particles decreased under lower temperature, as shown in Figure 6.4b. It should be noted that
a lower combustion temperature also slows down oxidation of VM, which results in an
increase of organic concentration. However, the AMS mass spectra results indicate that this
factor was less important than the influence of total fine particle formation in this case.
6.3.4 Effects of moisture in the sawdust on submicrometer particle formation during co-firing
Typically fresh biomass contains significant amount of moisture, present as bound and free
water, and even after considerable drying the moisture content can still be high (eg. 15-20%

170
for woods) (Williams et al., 2012). Biomass moisture content plays a significant role in the
combustion process. In this section, the effect of moisture in the sawdust on fine particle
formation was evaluated.
The size distributions of fine particles from co-firing with sawdust with different moisture
contents are shown in Figure 6.5a. Particle concentrations were higher in no moisture case for
10 nm to 80 nm particles, while for particles larger than 80 nm part icles, the number
concentrations were higher in 20% and 40% moisture case than in no moisture case. Two
factors may contribute to this result. Firstly, with high moisture content, part of the heat was
transferred to the latent heat of vaporization during combustion and hence overall
temperature was reduced (Chao et al., 2008), which resulted in less vaporization of metal
species from the fuel (Zhang et al., 2006; Zhang et al., 2007; Sui et al., 2007). This explains
why the total particle number concentration and peak concentration were much lower in the
high moisture cases than in 0% moisture content case. Secondly, high moisture content in the
sawdust caused high water content in the gas phase. The water vapor could low down the
energy barrier to convert vapors of metal species into submicrometer particles, thus greatly
enhance the growth of nuclei (Kulmala and Laaksonen, 1990). This factor resulted in a shift
of particle size distribution to the larger particle side with more moisture content, as shown in
Figure 5a. The size distributions were similar for 20% and 40% moisture cases. It may be
because an equilibrium condition was researched.

171
(a)
10 10010
2
103
104
105
106
dN
/dlo
gD
p (
#/c
m3)
Particle diameter (nm)
Moisture content
0
20%
40%
500400300200

172
(b)
Figure 6.5 Characterizations of particles from co-firing of PRB coal with sawdust (mass ratio:
85/15) under various sawdust moisture contents: (a) size distribution; (b) average mass
spectrum
Figure 6.5b shows that when moisture content increased, the organic mass concentration
increased as well. Comparing this result with the size distributions in Figure 6.5a, we could
imply that larger particles played a more important role in the formation of organic particles.
6.4 Conclusions
In this study, the size distributions and chemical compositions of submicrometer particles
from co-firing of sawdust and coal in a drop-tube furnace were studied, with a focus on
elucidating the formation of the organic part of those fine particles. The fine particles had a

173
unimodal size distribution, implying a formation pathway of nucleation/condensation of
volatilized mineral matter. With higher amount of sawdust in the blended fuel, there were less
fine particles generated. At the same time, particles from co-firing had an elemental
composition more similar to that of particles from coal combustion. It indicates that the
sawdust contributed less in submicrometer particle formation since the sawdust had lower
content of volatilized mineral. AMS analysis shows that carboxylic acids and aromatic
compounds were two major organic compounds in the submicrometer particles from co-firing.
With higher sawdust mixing ratio in the fuel, the organic concentrations were lower, due to a
smaller reaction characteristics time of volatile matters from sawdust.
With higher sulfur content in the coal, the concentration of fine particles increased because of
formation of sulfates. This increase also promoted the organic particle formations due to an
increase of organic absorption on the particles and better protection of organics from being
oxidized. Higher combustion temperature resulted in high concentrations of submicrometer
particles and organics. Higher moisture content resulted in lower overall particle
concentrations but a higher organic particle concentration, which may be related with the
higher particle concentrations in the larger (> 80 nm) particle size range.

174
6.5 References
Abreu, P., C. Casaca, and M. Costa. 2010. Ash deposition during the co-firing of bituminous
coal with pine sawdust and olive stones in a laboratory furnace. Fuel 89(12):4040-
4048.
Allan, J.D., J.L. Jimenez, P.I. Williams, M.R. Alfarra, K.N. Bower, J.T. Jayne, H. Coe, and
D.R. Worsnop. 2003. Quantitative sampling using an Aerodyne aerosol mass
spectrometer 1. Techniques of data interpretation and error analysis. J. Geophys. Res.
Atmos. 108(D3).
Bartok, J.W. 2004. Approximate Heating Value of Common Fuels. University of Connecticut,
USA.
Biswas, P., and C.-Y. Wu. 2005. Nanoparticles and the environment. J. Air Waste Manag. 55
(6):708-746.
Blevins, L.G., and T.H. Cauley. 2005. Fine particulate formation during switchgrass/coal
cofiring. J. Eng. Gas Turb. Power 127(3):457-463.
Bryers, R.W. 1996. Fireside slagging, fouling, and high-temperature corrosion of heat-
transfer surface due to impurities in steam-raising fuels. Prog. Energ. Combust.
22(1):29-120.
Canagaratna, M.R., J.T. Jayne, J.L. Jimenez, J.D. Allan, M.R. Alfarra, Q. Zhang, T.B.
Onasch, F. Drewnick, H. Coe, and A. Middlebrook. 2007. Chemical and
microphysical characterization of ambient aerosols with the aerodyne aerosol mass

175
spectrometer. Mass Spectrom. Rev. 26(2):185-222.
Chao, C.Y.H., P.C.W. Kwong, J.H. Wang, C.W. Cheung, and G. Kendall. 2008. Co-firing
coal with rice husk and bamboo and the impact on particulate matters and associated
polycyclic aromatic hydrocarbon emissions. Bioresource Technol. 99(1):83-93.
Christensen, K.A., and H. Livbjerg. 2000. A plug flow model for chemical reactions and
aerosol nucleation and growth in an alkali-containing flue gas. Aerosol Sci. Tech.
33(6):470-489.
Christensen, K.A., M. Stenholm, and H. Livbjerg. 1998. The formation of submicron aerosol
particles, HCl and SO2 in straw-fired boilers. J. Aerosol Sci. 29(4):421-444.
Dai, J., S. Sokhansanj, J.R. Grace, X. Bi, C.J. Lim, and S. Melin. 2008. Overview and some
issues related to co-firing biomass and coal. Can. J. Chem. Eng. 86(3):367-386.
Dall'Osto, M., and R.M. Harrison. 2012. Urban organic aerosols measured by single particle
mass spectrometry in the megacity of London. Atmos. Chem. Phys. 12(9):4127-4142.
DeCarlo, P.F., J.R. Kimmel, A. Trimborn, M.J. Northway, J.T. Jayne, A.C. Aiken, M. Gonin,
K. Fuhrer, T. Horvath, and K.S. Docherty. 2006. Field-deployable, high-resolution,
time-of-flight aerosol mass spectrometer. Anal. Chem. 78(24):8281-8289.
Flagan, R.C., and S.K. Friedlander. 1978. Particle formation in pulverized coal combustion-a
review. In Recent Developments in Aerosol Science, edited by David T Shaw. New
York: Wiley.
Gani, A., K. Morishita, K. Nishikawa, and I. Naruse. 2005. Characteristics of co-combustion

176
of low-rank coal with biomass. Energ. Fuel. 19(4):1652-1659.
Hankey, R. 2015. Electric Power Monthly with Data for January 2015. U.S. Energy
Information Administration.
Hays, M.D., C.D. Geron, K.J. Linna, N.D. Smith, and J.J. Schauer. 2002. Speciation of gas-
phase and fine particle emissions from burning of foliar fuels. Environ. Sci. Tech.
36(11):2281-2295.
Iisa, K., Y. Lu, and K. Salmenoja. 1999. Sulfation of potassium chloride at combustion
conditions. Energ. Fuel. 13(6):1184-1190.
Jimenez, J.L., J.T. Jayne, Q. Shi, C.E. Kolb, D.R. Worsnop, I. Yourshaw, J.H. Seinfeld, R.C.
Flagan, X. Zhang, and K.A. Smith. 2003. Ambient aerosol sampling using the
aerodyne aerosol mass spectrometer. J. Geophys. Res. Atmos. 108(D7).
Jiménez, S., and J. Ballester. 2005. Effect of co-firing on the properties of submicron aerosols
from biomass combustion. P. Combust. Inst. 30(2):2965-2972.
Kazagic, A., and I. Smajevic. 2009. Synergy effects of co-firing wooden biomass with
Bosnian coal. Energy 34(5):699-707.
Kulmala, M., and A. Laaksonen. 1990. Binary nucleation of water-sulfuric acid system:
Comparison of classical theories with different H2SO4 saturation vapor pressures. J.
Chem. Phys. 93(1):696-701.
Linak, W.P., and J.O.L. Wendt. 1994. Trace metal transformation mechanisms during coal
combustion. Fuel Process. Technol. 39(1):173-198.

177
Mantananont, N., S. Garivait, and S. Patumsawad. 2012. Characterisation of Particulate
Matter Emitted from Cofiring of Lignite and Agricultural Residues in a Fixed-Bed
Combustor. Scientific World J. 2012:702451.
Saidur, R., E.A. Abdelaziz, A. Demirbas, M.S. Hossain, and S. Mekhilef. 2011. A review on
biomass as a fuel for boilers. Renew. Sust. Energ. Rev. 15(5):2262-2289.
Sami, M., K. Annamalai, and M. Wooldridge. 2001. Co-firing of coal and biomass fuel
blends. Prog. Energ. Combust. 27(2):171-214.
Sarkar, P., S.G. Sahu, A. Mukherjee, M. Kumar, A.K. Adak, N. Chakraborty, and S. Biswas.
2014. Co-combustion studies for potential application of sawdust or its low
temperature char as co-fuel with coal. Appl. Therm. Eng. 63(2):616-623.
Skeen, S.A., B.M. Kumfer, and R.L. Axelbaum. 2010. Nitric oxide emissions during coal and
coal/biomass combustion under air-fired and oxy-fuel conditions. Energ. Fuel.
24(8):4144-4152.
Sui, J.C., M.H. Xu, Y.G. Du, Y. Liu, and G.Z. Yin. 2007. Emission characteristics and
elemental partitioning of submicron particulate matter during combustion of
pulverised bituminous coal. J. Energy Inst. 80(1):22-28.
Suriyawong, A., M. Gamble, M.-H. Lee, R. Axelbaum, and P. Biswas. 2006. Submicrometer
particle formation and mercury speciation under O2-CO2 coal combustion. Energ.
Fuel. 20(6):2357-2363.
Wang, X., S.M. Daukoru, S. Torkamani, W.-N. Wang, and P. Biswas. 2013a. Role of exhaust

178
gas recycle on submicrometer particle formation during oxy-coal combustion. P.
Combust. Inst. 34(2):3479-3487.
Wang, X., B.J. Williams, Y. Tang, Y. Huang, L. Kong, X. Yang, and P. Biswas. 2013b.
Characterization of organic aerosol produced during pulverized coal combustion in a
drop tube furnace. Atmos. Chem. Phys. 13(21):10919-10932.
Wang, X., E. Cotter, K.N. Iyer, J. Fang, B.J. Williams, and P. Biswas. 2015. Relationship
between pyrolysis products and organic aerosols formed during coal combustion. P.
Combust. Inst. 35(2):2347-2354.
Warnatz, J., U. Maas, and R.W. Dibble. 2006. Combustion: Physical and Chemical
Fundamentals, Modeling and Simulation, Experiments, Pollutant Formation. 4th ed.
Berlin: Springer.
Williams, A., J.M. Jones, L. Ma, and M. Pourkashanian. 2012. Pollutants from the
combustion of solid biomass fuels. Prog. Energ. Combust. 38(2):113-137.
Xu, M., D. Yu, H. Yao, X. Liu, and Y. Qiao. 2011. Coal combustion-generated aerosols:
Formation and properties. P. Combust. Inst. 33(1):1681-1697.
Zhang, L., M. Masui, H. Mizukoshi, Y. Ninomiya, and C. Kanaoka. 2007. Formation of
submicron particulates (PM1) from the oxygen-enriched combustion of dried sewage
sludge and their properties. Energ. Fuel. 21(1):88-98.
Zhang, L., Y. Ninomiya, and T. Yamashita. 2006. Formation of submicron particulate matter
(PM1) during coal combustion and influence of reaction temperature. Fuel

179
85(10):1446-1457.
Zhuang, Y., and P. Biswas. 2001. Submicrometer particle formation and control in a bench-
scale pulverized coal combustor. Energ. Fuel. 15(3):510-516.
Zuwala, J., and M. Sciazko. 2010. Full-scale co-firing trial tests of sawdust and bio-waste in
pulverized coal-fired 230t/h steam boiler. Biomass Bioenerg. 34(8):1165-1174.

180
CHAPTER 7. CONCLUSIONS

181
The major findings of this study are summarized in the following sections. Some future work
related with this study is discussed in the last section.
7.1 Elemental mercury oxidation in an electrostatic precipitator enhanced with in situ
soft X-ray irradiation (Chapter 2)
The DC corona based ESP can oxidize elemental mercury (under ±10 kV in the studied ESP),
and soft X-ray irradiation can enhance this process. The proposed mechanism is: electrons
were emitted due to photoionization caused by UV radiation from corona discha rge and by
soft X-ray radiation in the ESP, and then they initiated chain reactions that produced
electrons, intermediate species, and other products. Radicals, such as ∙O and O3, were
produced in the chain reactions, and they oxidized Hg0. Positive ESP worked better in
oxidizing Hg0 due to the presence of more high energy electrons. The enhancement was more
significant when the O2 concentration was low.
Particles may influence the performance of this methodology, depending on the chemical
properties of particles. SiO2 particles did not have a significant effect on Hg0 oxidation
process; TiO2 particles absorbed inhibited the Hg0 oxidation; KI particles enhanced Hg0
oxidation. The NO in the practical flue gas totally inhibited the Hg0 oxidation, and with
addition of KI in the coal, the oxidation by ESP with soft X-rays was partially restored.

182
7.2 Secondary aerosols generation in an electrostatic precipitator during flue gas
treatment (Chapter 3)
Secondary aerosols may be formed in the ESP during flue gas treatment. In this study, the
secondary aerosols were found to be H2O-H2SO4 aerosols with a unimodal size distribution
and a peak size of 20 nm. They were formed through the following pathway: (1) SO2 in the
flue gas was oxidized by the oxidizing radicals, reacted with H2O in the ESP, and eventually
formed H2SO4 (vapor); (2) H2O-H2SO4 SAs were firstly formed through ion- induced
nucleation; (3) SAs grew through condensation and nucleation. At the same time, part of the
newly formed aerosols were captured by the ESP.
The SA concentration and peak size increased with higher SO2 concentration, higher water
content and higher flow rate through ESP. With the ESP voltage increasing, the SA
concentration and peak size firstly went down (from -5 kV to -8 kV), and then increased
(from -8 kV to -10 kV).
7.3 Capture of submicrometer particles with a pressurized electrostatic precipitator
(Chapter 4)
In the pressurized ESP, the corona on-set voltage increased with the gas pressure, and under
the same voltage, the ESP current was lower with higher gas pressure, because the higher gas
density hindered the ionization process. Under a similar operating voltage, the penetration of
submicrometer NaCl particle was lower for a lower gas pressure due to the increasing ion
concentration with decreasing gas pressure. With the same current, the NaCl particle

183
penetration was higher for a lower gas pressure, which was an outcome of the combined
effect of higher particle velocity along the gas flow, higher particle migration velocity, and
lower electrical filed strength.
A modified Deutsch-Anderson equation, which accounts for all the factors discussed above,
was developed to predict the particle capture efficiency in the pressurized ESP. The
estimations from the modified D-A equation matched the experimental results of NaCl
particle capture well.
In the fly ash particle capture test, pressurized ESP is under the same gas pressure with the
coal combustor. With a higher gas pressure in the coal combustor (longer residence time), the
particles had higher charge fraction and average number of charge. This charging status
greatly influenced the particle penetration through the pressurized ESP. As a result, under the
same current, the particle penetration increased with the gas pressure.
7.4 Development of a compact electrostatic nanoparticle sampler for offline aerosol
characterization (Chapter 5)
A nanoparticle sampler with a configuration of two-stage ESP was developed. Its optimal
working conditions were found to be a total flow rate of 1.0 lpm, an aerosol/ion carrier flow
rate ratio of 1.0, and a collection voltage of 4.5 kV. Particle collection efficiency increased
with the particle diameter due to the change of particle charging efficiency. Under the
optimized conditions, collection efficiencies over 90% were achieved with for NaCl particles
with the sizes ranging from 50 to 500 nm. For the size ranging from 60 nm to 400 nm, 57% to

184
78% of the particles were collected on the SEM stub in the sampler. The collection efficiency
depended on the material of the particles. The collection efficiencies of oleic acid particles
were lower than those of NaCl particles in the size range from 50 to 150 nm, due to lower
charging efficiencies of oleic acid particles.
7.5 Characterization of submicrometer particles from sawdust/coal co-firing in a drop-
tube furnace (Chapter 6)
The fine particles from co-firing of coal with sawdust had a unimodal size distribution,
implying a major formation pathway of nucleation/condensation of volatilized mineral matter.
With higher amount of sawdust in the blended fuel, there were less fine particles generated.
Particles from co-firing had an elemental composition more similar to that of particles from
coal combustion. It indicates that the sawdust had lower content of volatilized mineral and
thus contributed less in submicrometer particle formation. Carboxylic acids and aromatic
compounds were two major organic compounds in the submicrometer particles. With higher
sawdust mixing ratio in the fuel, the organic concentrations were lower, due to a smaller
reaction characteristics time of volatile matters from sawdust.
With higher sulfur content in the coal, the concentration of fine particles increased because of
formation of sulfates. This increase also promoted the organic particle formations due to an
increase of organic absorption on the particles and better protection of organics from being
oxidized. Higher combustion temperature resulted in high concentrations of submicrometer
particles and organics. Higher moisture content resulted in lower overall particle

185
concentrations but higher particle concentrations in the size range between 80 nm to 500 nm.
The organic particle concentration was also higher with higher moisture, indicating that most
of the organics were in the larger particles (> 80 nm).
7.6 Future work
This study can be expanded in the following directions.
The soft X-ray enhanced ESP showed high mercury oxidation efficiency in the lab test. It will
be interesting and beneficial to test this methodology on a pilot-scale or full-scale coal
combustion system, and do modification on the device accordingly and eventually make it
applicable to practical coal combustion system.
The secondary aerosol formation has been well studied here. Future work can be put on
developing strategies to prevent the formation of secondary aerosols or control the secondary
aerosols. Besides, further study can also be conducted on developing model to predict the
concentration and size distribution of secondary aerosols from ESP. Previous studies have
been on modeling the H2SO4 concentration in the corona discharge reactor, modeling the
H2SO4-H2O aerosol formations, and modeling the particle collection efficiencies of the ESP.
By combining those three models, we could obtain a model to predict the formation of
secondary aerosols.
A good fundamental study has been done on the pressurized ESP. However, in order to
support the practical application, the performance of this ESP under higher gas pressure (10
atms) and various gas compositions should be studied. Moreover, the pressurized ESP should

186
be tested on a pilot-scale or full-scale coal combustion system. At the time, the gas pressure
influences the ionization, particle charging, and particle transport processes in the ESP
simultaneously, and it is difficult to evaluate the combined effect. To better analyze the
pressurized ESP, numerical study is needed. A coupled model can be established to simulate
ionization, particle charging, and particle transport processes, which will benefit this research
a lot.
The electrostatic particle sampler has high collection efficiency of the submicrometer
particles. A further study may be done to investigate the flow pattern in the sampler, which
can help in suggesting modification of the sampler to reduce the particle loss on the surface
other than the top of the SEM stub.
The formation of the submicrometer particles was well studied here and it was proposed that
organic matters were mixed with the inorganic matters. It will be interesting to know how the
organics mix with inorganics. High resolution TEM can be used to perform this observation.
It will also be interesting to measure the VOC concentrations and speciation in the flue gas
and investigate the relationship between the VOC and organic matters in the particles.

187
APPENDIX I. SUPPORTING MATERIALS FOR CHAPTER 2
-- Elemental Mercury Oxidation in an Electrostatic Precipitator Enhanced with In Situ Soft
X-ray Irradiation
Configuration of the electrostatic precipitator
Figure A1.1 shows the details of the ESP. The case of the ESP was made of PVC. The
aerosol inlet was placed at the upper end, and the outlet was placed at the lower end. The
discharge electrode was a 0.323 mm diameter stainless steel wire placed in the center. The
collecting electrode was a tube enclosed by the PVC case. It was also made of stainless steel,
and was 25.4 cm in length and 4.8 cm in diameter. Excess length of the discharge electrode
was sheathed using an insulating material. The X-rays from the photoionizer entered the
system through a circular hole (1.7 cm in diameter) in the middle of the collecting electrode
and the PVC case. A thin polyamide film (Kapton® 30HN, DuPont Corp., 30 μm thick) was
used to keep the ESP system airtight. The penetrability of soft X-rays through the polyamide
film was estimated to be about 90%.

188
Figure A1.1 Configuration of studied electrostatic precipitator

189
Analysis of coals
Table A1.1 Analysis of PRB coal and Chinese S03
Coal
name
Proximate Analysis Ultimate Analysis Qnet,d
MJ/kg
Hg
ppb
ASTM
Rank Moisturead Ashd VMd FCd Sd Cd Hd Od
PRB 27.70 8.00 48.30 42.90 0.57 67.30 4.58 19.92 28.04 50 Sub-bit.
S03 0.71 26.43 16.06 57.51 2.30 62.6 3.23 4.59 24.67 489 Sub-bit.
VM – Volatile Matter; FC – Fixed Carbon; ad – air-dried; d - dry

188
V-I characteristics curve
By comparing the conversions in Figure 2 with the voltage-current (V-I) characteristics in Figure
A1.2, it is found that on either the positive side or negative side, high conversions were reached
when the currents were high, such as at +10 kV and -10 kV. In contrast, low conversions were
related to low currents. The corona discharge did not reach or just reached the inception voltage
at -8 kV, 0 kV, +8 kV. This result matches the understanding that for ESP the current conducting
mechanisms are fundamentally interconnected with chemical processes (Thomson, 1893).
Besides, current was always higher with soft X-rays.

189
-10 -8 -6 -4 -2 0 2 4 6 8 10
0
20
40
60
80
100
120
140
160
180
200C
urr
en
t (µ
A)
Voltage (kV)
soft X-ray corona off
soft X-ray corona on
Figure A1.2 Current-voltage characteristics of ESP under base condition (0.04 lpm O2, 0.12 lpm
CO2, 0.84 lpm N2)
Mercury speciation
Figure A1.3 shows the mercury speciation after treatment with ESP alone at +10 kV voltage and
with ESP coupled with soft X-rays. The speciation patterns for those two cases were similar,
which indicates the same mechanism. Only 5.8%-10.4% oxidized Hg escaped from the ESP. The
other oxidized mercury might have deposited on the inner surface of ESP in the form of HgO(s),

190
which has been observed in Hg0 oxidation by dielectric barrier discharge (Byun et al., 2011).
+10kV +10kV, SXC0
20
40
60
80
100
Hg
sp
ecia
tio
n (
%)
Treatment
Hg2+
Hg0
Figure A1.3 Mercury speciation of mercury treated by ESP and soft X-rays (gas combination:
0.04 lpm O2, 0.12 lpm CO2, 0.84 lpm N2)
Ozone generation by the ESP in pure N2, CO2, or O2 environments
Ozone generation by the ESP in pure N2, CO2, or O2 is shown in Figure A1.4. In the pure CO2
case, similar to the current measurements, no O3 generation was observed under ESP alone.
However, when soft X-rays were on, O3 generation was observed. Under pure O2, soft X-rays
also showed an effect on reducing O3 generation.

191
N2, +10kV
N2, +10kV, S
XC
CO2, +10kV
CO2, +10kV, S
XC
O2, +10kV
O2, +10kV, S
XC
0
10
20
30
40
50
Ozo
ne
co
nce
ntr
atio
n (
pp
m)
Figure A1.4 Ozone concentrations downstream of ESP in pure N2, CO2, or O2
Effects of O2 concentrations
Depending on the coal feeding rate and efficiency of the combustion, the O2 composition in flue
gas varies. To investigate the performance of ESP and soft X-rays on Hg0 oxidation under those
varying conditions, Hg0 conversion was measured under O2 percentages at 0%, 2%, 4%, and 6%,
with the CO2 percentage fixed to 12% and the rest balanced with N2. Results are shown in Figure
A1.5. When ESP alone was used, the mercury conversion increased from 9.0% to 64.4% as the
oxygen concentration increased. This is because O2 is an important source for generation of
chemically active species. On the other hand, when ESP and soft X-rays were both applied, the

192
Hg0 conversion was relative stable and varied just between 67.1% and 77.1%. Soft X-ray
photoionization significantly enhanced the production of electrons and led to a very high electron
concentration, which resulted in high production of radicals, even in the case when the O 2
concentration was low. The O3 concentration measurements are shown in Figure A1.6. Based on
the discussion for single gas studies, the possible explanation why Hg0 could still be achieved
under 88% N2 and 12% CO2 condition is: CO2 were the sources of O, and electrons and excited
N2 from ionization of N2 accelerate the generation of O and O3.
0 2 4 6
0
20
40
60
80
100
Corona voltage +10 kV, SXC off
Corona voltage +10 kV, SXC on
O2 concentration (%)
Ele
me
nta
l m
erc
ury
co
nve
rsio
n (
%)
0
20
40
60
80
100
Cu
rren
t (µA
)
Figure A1.5 Elemental mercury conversions under various O2 concentrations (solid symbol,
mercury conversion; open symbol, current) (total flow rate: 1 lpm; CO2 flow rate: 0.12 lpm;
balanced with N2)

193
Ozone generation by ESP under various O2 concentrations
O3 concentration measurements are shown in Figure A1.6. The O3 concentration increased with
the increase of O2 percentage, when ESP alone was on; while under ESP and soft X-rays
together, the O3 concentration remained between 73.5 ppm and 75 ppm with various O2
percentages.
0 3 6
0
25
50
75
100
Corona voltage 10 kV + SXC off
Corona voltage 10 kV + SXC on
Ozo
ne
Co
nce
ntr
atio
n (
pp
m)
O2 Concentration (%)
Figure A1.6 Ozone concentrations downstream of the ESP under various O2 concentrations

194
Modeling of electrons distribution in the ESP
In this model, a cross section of our lab-scale ESP was studied, as shown in Figure A1.7.
Considering that the cross section is axisymmetric, the simulation domain was simplified into an
interval.
Figure A1.7 Model geometry (cross section of ESP)
The electron impact reactions and chemical reactions considered in this model were summarized
in Table A1.2. The rate constants of chemical reactions were obtained from Mikoviny et al.
(2004) and Wu et al. (2012)

195
Table A1.2 Summary of electron-impact reaction and chemical reactions in the model
Reaction Reaction rate constant
2e CO e CO O -*
2e CO O CO -
2 2e CO e -
2 22e N e N -
2 2e O e O -
2 2 22e O O O -
2 2e O O -
2 22e O e O -
3 2e O O O -
3 2e O O O -
2 2 32CO O CO CO 32616360 m6/(s∙mol2)
2 2 2 42CO O CO CO 3624040 m6/(s∙mol2)
2 3 22O O O O 212 m6/(s∙mol2)
2 2 3 2O O CO O CO 656 m6/(s∙mol2)
2 2 22O CO O CO 3769 m6/(s∙mol2)
2 22O CO CO CO 3.97 m6/(s∙mol2)
2 2 2 2O N N O 36146745 m3/(s∙mol)
2 2 2 23O O O O 7.25E10 m6/(s∙mol2)

196
2 2 2 2 22N O O O N 7.25E10 m6/(s∙mol2)
2 2 2 2 22CO O O O CO 7.25E10 m6/(s∙mol2)
2 2 3 2O O N O N 90.6 m6/(s∙mol2)
*Reaction rates of electron- impact reactions were calculated based on the impact cross section
data. The data was from electron database LXcat.
Size distributions of injected SiO2, TiO2, and KI particles
Figure A1.8 shows the particle size distribution (PSD) at the ESP outlet under three different
operations: 1) ESP and soft X-ray both off, 2) ESP on and soft X-ray off, and 3) ESP and soft X-
ray both on. The PSD under the first situation indicates the PSD upstream of the ESP during all
the tests. Comparing the PSDs under the four particle feeding conditions showed they all had
typical atomization single-modal distribution patterns. The total number concentrations and peak
sizes of the four cases (SiO2, TiO2, low concentration KI, and high concentration KI) were
comparable, respectively. Total number concentrations in the four cases were 2.94×10⁵ #/cm3,
2.12×10⁵ #/cm3, 4.01×10⁵ #/cm3, and 2.36×10⁶ #/cm3, successively. Their mean sizes were 127.5
nm, 134.2 nm, 54.8 nm, and 71.7 nm. PSDs under the second and third operating conditions
show that the ESP removed at least 99.1% of the particles.

197
(a)
10 100 100010
-1
100
101
102
103
104
105
106
Corona voltage 0 kV, SXC off
Corona voltage +10 kV, SXC off
Corona voltage +10 kV, SXC on
dN
/dlo
gD
p (
#/c
m3)
Dp (nm)
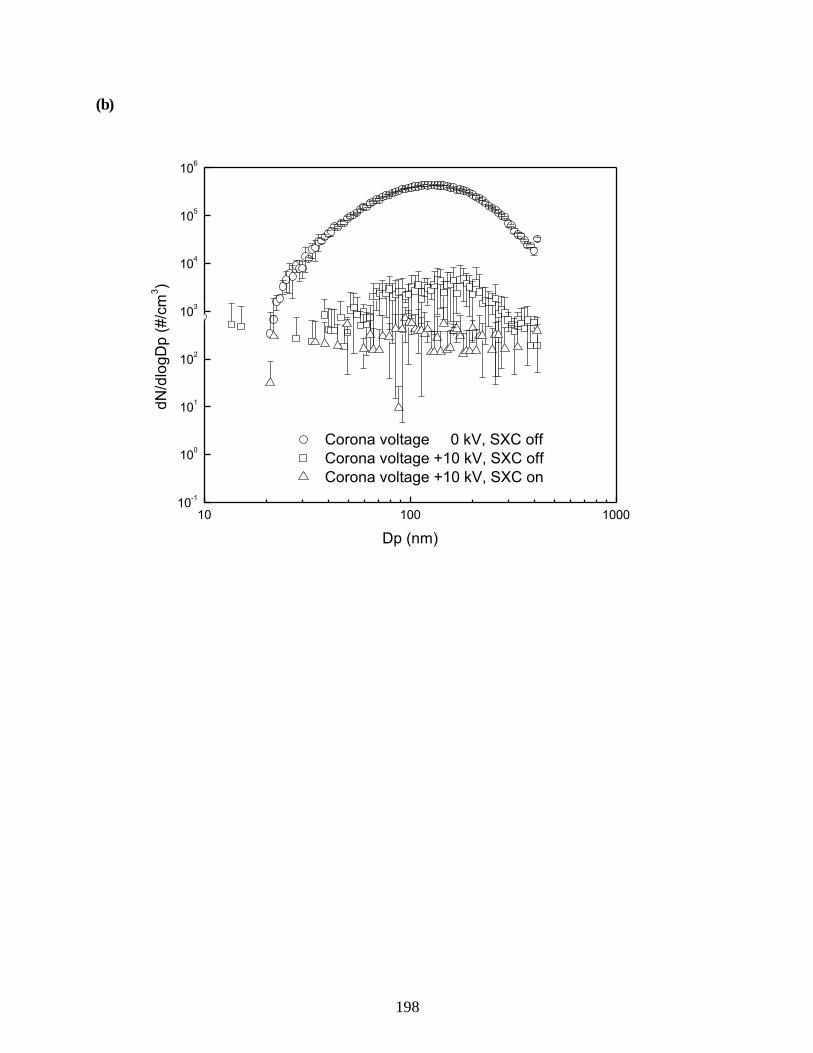
198
(b)
10 100 100010
-1
100
101
102
103
104
105
106
Corona voltage 0 kV, SXC off
Corona voltage +10 kV, SXC off
Corona voltage +10 kV, SXC on
dN
/dlo
gD
p (
#/c
m3)
Dp (nm)

199
(c)
10 100 100010
-1
100
101
102
103
104
105
106
107
Corona voltage 0 kV, SXC off
Corona voltage +10 kV, SXC off
Corona voltage +10 kV, SXC on
dN
/dlo
gD
p (
#/c
m3)
Dp (nm)

200
(d)
10 100 100010
-1
100
101
102
103
104
105
106
107
Corona voltage 0 kV + SXC off
Corona voltage +10 kV + SXC off
Corona voltage +10 kV + SXC on
dN
/dlo
gD
p (
#/c
m3)
Dp (nm)
Figure A1.8 Particle size distributions of SiO2 particles downstream of the ESP : (a) SiO2; (b)
TiO2; (c) KI (high concentration case, 189.0 ppm atomization solution); (d) KI (low
concentration case, 18.9 ppm atomization solution)

201
Effect of gas residence time on the mercury oxidation efficiency
0.25 0.30 0.35 0.40 0.45 0.500
10
20
30
40
50
60
70
80
90
100
Corona voltage 10 kV + SXC off
Corona voltage 10 kV + SXC on
Ele
me
nta
l m
erc
ury
co
nve
rsio
n (
%)
Residence time (min)
Figure A1.9 Elemental mercury conversions under two different residence time
Effects of HCl and SO2 Concentrations in Flue Gas
HCl and SO2 are usually present in flue gas. The effects of those gases are discussed in this
section. The flow rates of O2, N2, and CO2 were kept at 0.04 lpm, 0.84 lpm, and 0.12 lpm,
respectively. Figure A1.10 shows the effect of HCl. With 10 ppm HCl in the flue gas, Hg0
conversions of 98.5% and 99.2% were achieved under ESP alone and ESP coupled with soft X-
rays, respectively. The enhancement can be explained by two mechanisms. First, HCl can

202
directly react with Hg0 even without corona discharge, as seen in the result in Figure A1.7. This
result is consistent with previous observations in coal combustion systems (Hall et al., 1991;
Zhou et al., 2007). The proposed overall reaction equation for this process is (Hall et al., 1991):
2 2 22 4 2 2Hg HCl O HgCl H O (A1.1)
Moreover, with the electrons generated by ESP and soft X-rays, generation of radicals like Cl
and Cl2 was enhanced. Radicals were formed following these reactions (Ko et al., 2008a; Ko et
al., 2008b):
e HCl e H Cl (A1.2)
*
2 2N HCl H Cl N (A1.3)
2H HCl H Cl (A1.4)
2Cl Cl M Cl M (A1.5)
The Cl and Cl2 radicals can oxidize Hg0; the related reactions are shown below (Zhou et al., 2007;
Ko et al., 2008a; Ko et al., 2008b):
0Hg Cl M HgCl M (A1.6)
2HgCl Cl M HgCl M (A1.7)
0
2Hg Cl HgCl Cl (A1.8)
2 2HgCl Cl HgCl Cl (A1.9)
0
2 2Hg Cl HgCl (A1.10)

203
HCl HCl, +10kV HCl, +10kV, SXC0
20
40
60
80
100
Ele
me
nta
l m
erc
ury
co
nve
rsio
n (
%)
Figure A1.10 Elemental mercury conversions with HCl in flue gas (gas combination: 0.04 lpm
O2, 0.12 lpm CO2, 0.84 lpm N2, 10 ppm HCl)
Figure A1.11 shows that SO2 significantly enhanced Hg0 conversion for both ESP alone and ESP
coupled with soft X-rays. Conversions of 88.9% and 92.6% were achieved for ESP alone and
ESP coupled with soft X-rays, respectively, under 800 ppm SO2. The enhancement was likely
due to the following pathway (Wang et al., 2010):
2 3SO O SO (A1.11)
0
3 4Hg SO O HgSO (A1.12)

204
This additional pathway speeded up Hg0 conversion, compared to the case without SO2 injection.
The stoichiometric molar ratio of Hg0 and SO2 in the oxidation process is 1:1. However, the SO2
molar concentration in the study condition was more than thousand times higher than the Hg0
concentration, and the SO2 oxidation was highly promoted in the corona discharge environment
(Mizuno et al., 1986). As a result, sufficient SO3 was generated to participate in the Hg0
oxidation process.
0 400 800
0
20
40
60
80
100
Corona voltage +10 kV, SXC off
Corona voltage +10 kV, SXC on
Ele
me
nta
l m
erc
ury
co
nve
rsio
n (
%)
SO2 concentration (ppm)
Figure A1.11 Elemental mercury conversions with SO2 in flue gas (gas combination: 0.04 lpm
O2, 0.12 lpm CO2, 0.84 lpm N2)

205
Reference
Byun, Y., D.J. Koh, and D.N. Shin. 2011a. Removal mechanism of elemental mercury by using
non-thermal plasma. Chemosphere 83:69-75. doi: 10.1016/j.chemosphere.2010.12.003.
Hall, B., P. Schager, K. Tomura, and O. Lindqvist. 1991. Chemical reactions of mercury in
combustion flue gases. Water Air Soil Poll. 56(1):3-14. doi: 10.1007/BF00342256.
Hedrick, E., T.G. Lee, P. Biswas, and Y. Zhuang. 2001. The development of iodine based
impinger solutions for the efficient capture of Hg0 using direct injection nebulization-
inductively coupled plasma mass spectrometry analysis. Environ. Sci. Eng. 35:3764-
3773. doi: 10.1021/es010648r.
Ko, B.K., Y. Byun, M. Cho, W. Namkung, D.N. Shin, D.J. Koh, and K.T. Kim. 2008a. Influence
of HCl on oxidation of gaseous elemental mercury by dielectric barrier discharge
process. Chemosphere. 71:1674-1682. doi: 10.1016/j.chemosphere.2008.01.015.
Ko, B.K., Y. Byun, M. Cho, W. Namkung, I.P. Hamilton, D.N. Shin, D.J. Koh, and K.T. Kim.
2008b. Pulsed corona discharge for oxidation of gaseous elemental mercury. Appl.
Phys. Lett. 92:251503. doi: 10.1063/1.2952496.
Mikoviny, T., M. Kocan, S. Matejcik, N.J. Mason, and J.D. Skalny. 2004. Experimental study of
negative corona discharge in pure carbon dioxide and its mixtures with oxygen. J. Phys.
D: Appl. Phys. 37:64-73. doi: 10.1088/0022-3727/37/1/011.
Mizuno, A., J.S. Clements, and R.H. Davis. 1986. A method for the removal of sulfur dioxide
from exhaust gas utilizing pulsed streamer corona for electron energization. IEEE T.
Ind. Appl. 22(3):516-522. doi: 10.1109/TIA.1986.4504752.

206
Thomson, J.J. 1893. Recent Researches in Electricity and Magnetism. London: Oxford Univ.
Press.
Wang, Z.H., S.D. Jiang, Y.Q. Zhu, J.S. Zhou, J.H. Zhou, Z.S. Li, and K.F. Cen. 2010.
Investigation on elemental mercury oxidation mechanism by non-thermal plasma
treament. Fuel. Process. Technol. 91:1395-1400. doi: 10.1016/j.fuproc.2010.05.012.
Wu, F., R. Liao, X. Liu, F. Yang, L. Yang, Z. Zhou, and Y. Luo. Numerical simulation of DC
positive corona discharge under atmospheric environment. Paper presented at 2012
International Conference on High Voltage Engineering and Application, Shanghai,
China, September 17-20, 2012.
Zhou, J., Z. Luo, C. Hu, and K. Cen. 2007. Factors impacting gaseous mercury speciation in
postcombustion. Energ. Fuel. 21:491-495. doi: 10.1021/ef060406i.

207
APPENDIX II. SUPPORTING MATERIALS FOR CHAPTER 3
-- Secondary Aerosols Generation in Electrostatic Precipitator during Flue Gas Treatment
Figure A2.1 Configuration of the studied ESP

208
Table A2.1 Proximate and ultimate analysis of coals and sawdust
West Elk coal Illinois No. 6 coal
Proximate analysis (%wt)
Volatile matter1 38.9 42
Fixed carbon1 51.4 48
Ash1 9.5 10
Moisture2 10.43 13.5
Ultimate analysis (%wt)
Carbon 74.14 71
Nitrogen 1.53 1.3
Hydrogen 5.08 5
Oxygen 9.27 9.13
Sulfur 0.52 3.47
Chlorine 0.012 0.11
1Dry weight basis
2As-received basis

209
10 10010
2
103
104
105
106
107
400 500300300
dN
/dlo
gD
p (
#/c
m3)
Particle Diameter (nm)
200
Figure A2.2 Size distribution of the fly ash particles that challenged the studied ESP (ACERF
system, 6% O2 in the flue gas)

210
Table A2.2 Flue gas compositions of the studied cases
Case O2 CO2 H2Oa SO2
-10 kV, 6% O2 (Figure 3.2) 5.8% 14.9% 0.37%
~248 ppm
+10 kV, 6% O2 (Figure 3.2) 5.8% 14.9% 0.37%
-10 kV, 2% O2 (Figure 3.3) 1.7% 17.9% 0.47%
-10 kV, 4% O2 (Figure 3.3) 4.2% 14.4% 0.41%
-10 kV, Oxy-combustion (Figure 3.3) 13% 14.2% 0.47%
aEstimated based on ultimate analysis of coal
bAverage concentration along the experiments
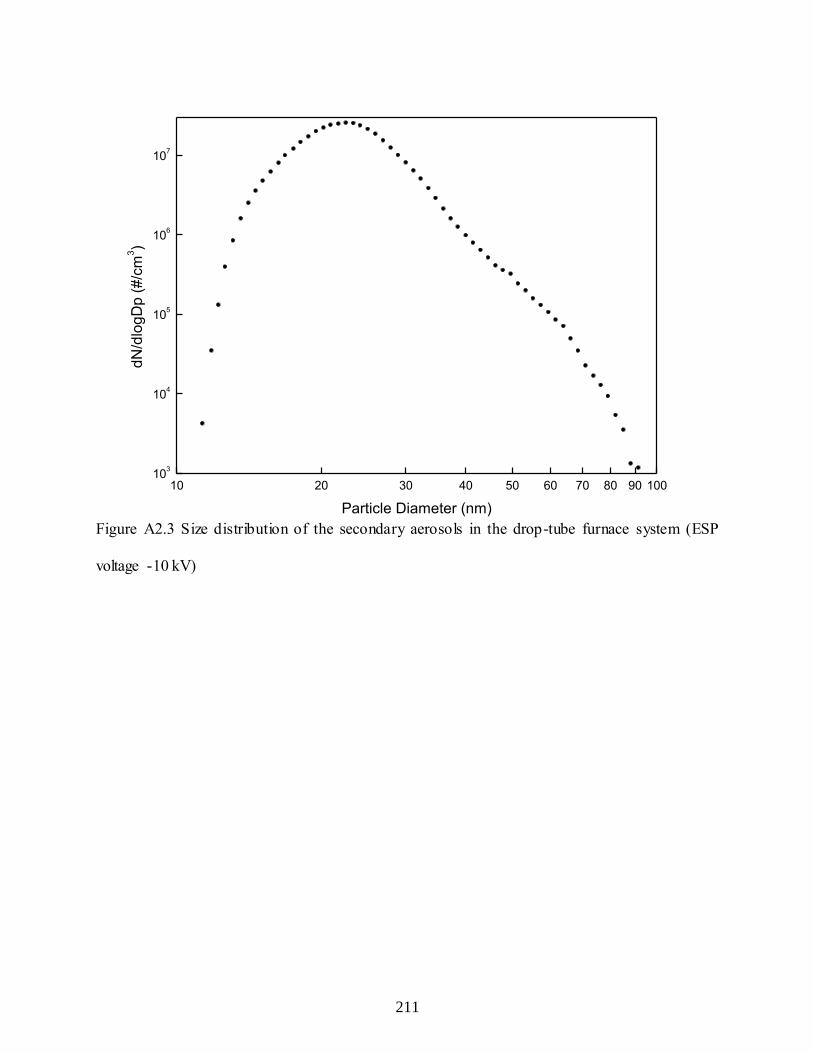
211
10 20 30 40 50 60 70 80 90 10010
3
104
105
106
107
dN
/dlo
gD
p (
#/c
m3)
Particle Diameter (nm)
Figure A2.3 Size distribution of the secondary aerosols in the drop-tube furnace system (ESP
voltage -10 kV)

212
(a)
20 40 60 80 100
0.0
2.0x10⁻⁴
4.0x10⁻⁴
6.0x10⁻⁴
8.0x10⁻⁴
1.0x10⁻³
1.2x10⁻³
1.4x10⁻³
1.6x10⁻³
1.8x10⁻³
2.0x10⁻³
Co
nce
ntr
atio
n (g
/m3)
m/z
Sulfates
(b)
20 40 60 80 1000.000
0.002
0.004
0.006
0.008
0.010
0.012
0.014
0.016
0.018
0.020
Co
nce
ntr
atio
n (g
/m3)
m/z
Organics
Figure A2.4 Average mass spectra of aerosols downstream ESP with coal feeding but with ESP
off: (a) mass spectrum of sulfates; (b) mass spectrum of organics

213
-14 -12 -10 -8 -6 -4 -2 0 2 4 6 8 10 12 14
0
100
200
300
400
500
600
Cu
rre
nt
(A
)
Voltage (kV)
Figure A2.5 Current-voltage characteristics of the studied ESP (using air as feeding gas)

214
APPENDIX III. SUPPORTING MATERIALS FOR CHAPTER 4
-- Capture of Submicrometer Particles with a Pressurized Electrostatic Precipitator
Figure A3.1 Configuration of the studied ESP

215
𝐸𝐶
𝛿′= 𝐴𝑔 +
𝐵𝑔
(𝑟0𝛿′)1/2 (A3.1)
in which
EC --- corona on-set field
δ’ --- relative gas density (relative gas pressure)
Ag, Bg --- constants that are related with the gas type
r0 --- radius of the discharge wire
E𝑐 =𝑉𝐶
𝑟0ln(𝑟1/𝑟0) (A3.2)
in which
VC --- corona on-set voltage
r1 --- radius of the collection tube

216
10 10010
2
103
104
105
500400300
1 atm
2 atms
3 atms
Pa
rtic
le c
on
ce
ntr
atio
n (
#/c
m3
)
Particle diameter (nm)
200
Figure A3.2 Size distribution of the NaCl particles generated using atomizer under various
pressures
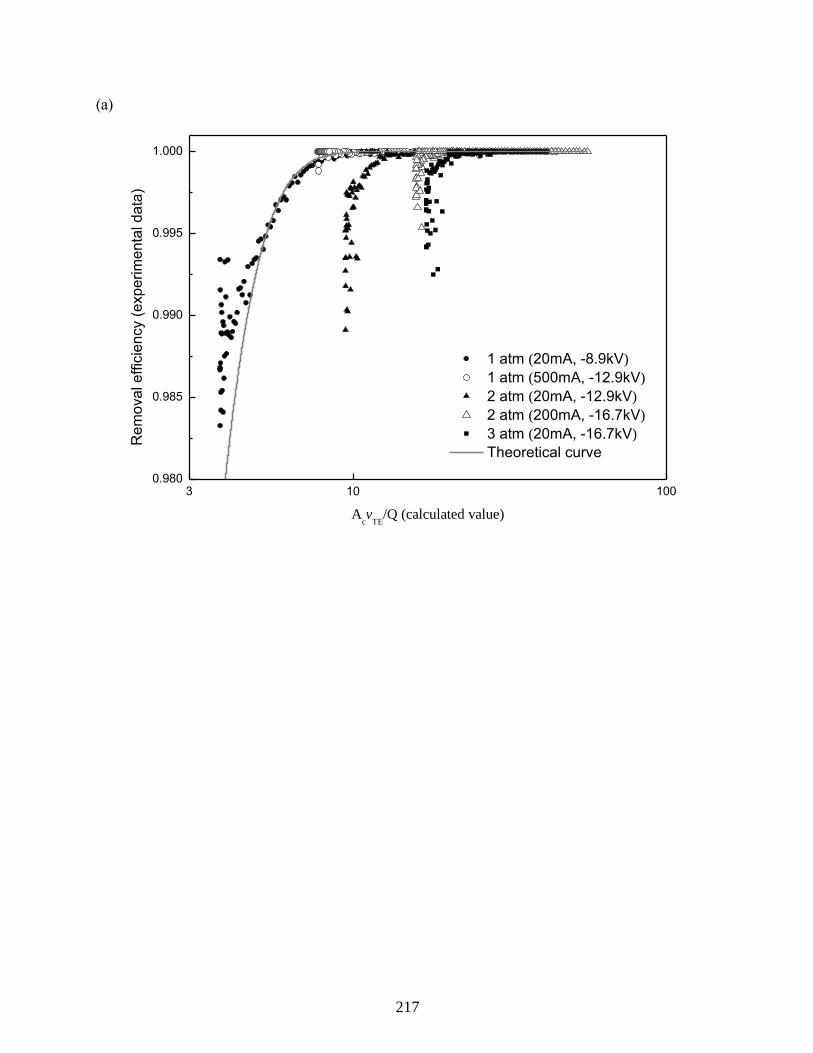
217
(a)
3 10 1000.980
0.985
0.990
0.995
1.000
1 atm (20mA, -8.9kV)
1 atm (500mA, -12.9kV)
2 atm (20mA, -12.9kV)
2 atm (200mA, -16.7kV)
3 atm (20mA, -16.7kV)
Theoretical curve
Re
mo
va
l e
ffic
ien
cy (
exp
eri
me
nta
l d
ata
)
Acv
TE/Q (calculated value)

218
(b)
3 10 100
0.975
0.980
0.985
0.990
0.995
1.000
1 atm (20mA, +8.6kV)
1 atm (500mA, +13.7kV)
2 atm (20mA, +12.5kV)
2 atm (270mA, +17.4kV)
3 atm (20mA, +17.4kV)
Theoretical curveRe
mo
va
l e
ffic
ien
cy (
exp
eri
me
nta
l d
ata
)
Acv
TE/Q (calculated value)
Figure A3.3 The relationship between measured NaCl particle removal efficiencies and the
calculated values of the non-dimensional group from Deutsch-Anderson equation: (a) negative
polarity; (b) positive polarity

219
(a)
(b)
(c)
(d)
(e)
(f)
Figure A3.4 Relations between calculated penetration and voltage under different pressures (dp =
50, 100, 200, 300, 400, 500 nm, positive polarity case)

220
10 10010
2
103
104
105
106
107
108
500400300
1 atm
2 atms
3 atms
dN
/dlo
gD
p (
#/c
m3)
Particle diameter (nm)200
Figure A3.5 Size distribution of the fly ash particles from the drop-tube furnace under various
pressures

221
APPENDIX IV. SUPPORTING INFORMATION ON DETERMINATION OF THE
DESIGN PARAMETERS OF THE LAB-SCALE ESP
Here we compare the lab-scale ESP used in this study with a typical full-scale ESP, in order to
justify the representative of the lab-scale ESP. Table A4.1 compares their average electrical field
strengths and current densities.
Table A4.1 Comparison of the average electrical field strengths and current densities between the
lab-scale ESP and a typical full-scale ESP
ESP scale Average electrical field strength Current density
Full-scale 70 kV/20 cm = 3.50 kV/cm 10 kV/2.4 cm = 4.16 kV/cm
Lab-scale ~860 μA/m2 50 μA/0.038 m2 = 1306 μA/m2
The table shows that the field strengths and current densities of the two scales of ESP are
comparable. Based on eq4.4-eq4.8, we could see that the particle migration velocities for a
certain particle diameter are almost the same for the two scales of ESPs.
To further discuss whether the lab-scale ESP can represent the particle capture in a real ESP, we
use the below scale-down term, because it equals to the ratio between the particle travel time and
particle settling time:
𝑆𝑐𝑎𝑙𝑒 − 𝑑𝑜𝑤𝑛𝑡𝑒𝑟𝑚 =𝑣𝑇𝐸𝐿
𝑣𝑓𝑙𝑜𝑤𝐻=
𝑡𝑡𝑟𝑎𝑣𝑒𝑙
𝑡𝑠𝑒𝑡𝑡𝑙𝑒 (A4.1)
The key parameters and scale-down terms of the two ESPs are shown in Table A4.2.

222
Table A4.2 Key parameters and scale-down terms of the lab-scale ESP and full-scale ESP
Parameters Value for a typical full-scale ESP Value for the lab-scale ESP
Migration velocity vTE Almost the same for two ESPs
Length of collection board L 12 m 25.4 cm
Gap between boards H 20 cm 2.4 cm
Flow velocity vflow 1.2 m/s 0.138 m/s
Scale-down term 𝑣𝑇𝐸𝐿
𝑣𝑓𝑙𝑜𝑤𝐻 50vTE 77vTE
The above results show that the two ESPs are comparable, so it is valid to use the lab-scale ESP
to represent a real ESP. The typical parameters of the real ESP are obtained from the materials of
2015 Neundorfer precipitator tutorial.

223
APPENDIX V. LIST OF PAPERS AND PRESENTATIONS
PAPERS
1. Jing, H.; Wang, X.; Wang, W.N.; Biswas, P., Elemental Mercury Oxidation in an
Electrostatic Precipitator Enhanced with In Situ Soft X-ray Irradiation. Journal of the Air &
Waste Management Association, 2015, 65, 455-465.
2. Jing, H.; He, S.; Ou, Q.; Hsiao, T.C.; Chen, D.R., Development of a Compact Electrostatic
Nanoparticle Sampler for Offline Aerosol Characterization. Journal of Metrology Society of
India, 2013, 28, 217-226.
3. Jing, H.; Wang, X.; Wang, W.N.; Dhungel, B.; Kumfer, B.M.; Axelbaum, R.L.; Williams,
B.J.; Biswas, P., Secondary Aerosols Generation in an Electrostatic Precipitator during Flue
Gas Treatment. To be submitted
4. Jing, H.; Wang, X.; Li, S.; Williams, B.J.; Biswas, P., Characterization of Submicrometer
Particles from Sawdust/Coal Co-Firing in a Drop-Tube Furnace. To be submitted
5. Wang, Y.; Li, J.; Jing, H.; Zhang, Q.; Jiang, J.; Biswas, P., Laboratory evaluation and
calibration of three low-cost particle sensors for particulate matter measurement. Aerosol
Science & Technology, 2015, 49(11), 1063-1077.

224
6. Yeh, H.W.; Jing, H.; Chen, D.R., Formulation hydrophobicity on in vitro drug release of
crizotinib- loaded PLGA nanoparticles. Letters in Applied NanoBioScience, 2015, 4, 247-250.
7. Fang, M.; Chen, C.; Guan, J.; Chen, D.R.; Jing, H., Oppositely charged twin-head
electrospray: a general strategy for building Janus particles with controlled structures.
Nanoscale, 2013, 5, 2055-2064.
8. Wang, Y.; Jing, H.; Mehta, V.; Welter, G.J.; Giammar, D.E., Impact of galvanic corrosion
on lead release from aged lead service lines. Water Research, 2012, 46, 5049-5060.
9. Wang, X.; Jing, H.; Dhungel, B.; Wang, W. N.; Kumfer, B. M; Axelbaum, R. L.; Biswas, P.,
Characterization of Organic and Black Carbon Aerosols from Coal Combustio n: An
Experimental Study in a 1 Megawatt Pilot Scale Coal Combustor. To be submitted to Energy
& Fuels
10. Wang, X.; Wang, H.; Huang, Y.; Jing, H.; Wang, W. N.; Cui, W.; Williams, B. J.; Yang, X.;
Biswas, P., Evidence for A New Source of Nitrogen-Containing Organic Aerosol:
Combustion of High Sulfur Content Coal. To be submitted to Environmental Science &
Technology Letters
11. Li, Z; Jing, H.; Biswas, P, Capture of Submicrometer Particles with a Pressurized
Electrostatic Precipitator. In preparation

225
SELECTED PRESENTATIONS
1. 2014 AIChE Annual Meeting, Atlanta, Georgia, Platform presentation, 2014
Elemental Mercury Oxidation in an Electrostatic Precipitator with In-Situ Soft X-rays
2. Invited talk at Peking University, Beijing, China, 2014
Formation of Fine Particles during Coal Combustion and Capture of Mercury from the
Combustion Exhaust
3. 2014 A&WMA Conference & Exhibition, Long Beach, California, Platform presentation,
2014
Elemental Mercury Oxidation in an Electrostatic Precipitator with In-Situ Soft X-rays
4. 2014 A&WMA Conference & Exhibition, Long Beach, California, Platform presentation,
2014
Capture of Submicrometer Particles from Air-Fired and Oxy- Coal Combustion by a Soft X-
Ray Enhanced Electrostatic Precipitator
5. 10th IEA CCC MEC Meeting, Clearwater, Florida, Platform presentation, 2014
Novel Methodologies for Mercury Removal in Coal Combustors

226
6. American Association for Aerosol Research 31th Annual Conference, Minneapolis,
Minnesota, 2012
Experimental Evaluation of a Compact Nanoparticle Sampler
7. 7th asian aerosol conference, Xi’an, China, 2011
Fundamental Study of a Compact Electrostatic Nanoparticle Sampler
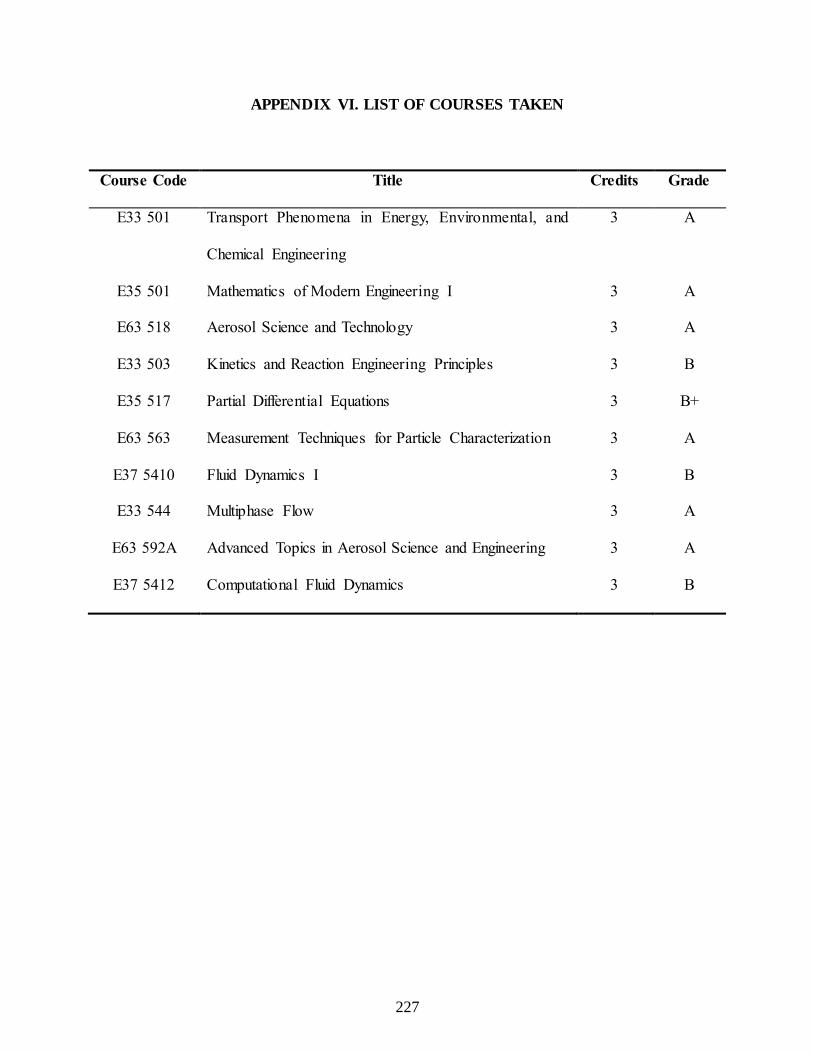
227
APPENDIX VI. LIST OF COURSES TAKEN
Course Code Title Credits Grade
E33 501 Transport Phenomena in Energy, Environmental, and
Chemical Engineering
3 A
E35 501 Mathematics of Modern Engineering I 3 A
E63 518 Aerosol Science and Technology 3 A
E33 503 Kinetics and Reaction Engineering Principles 3 B
E35 517 Partial Differential Equations 3 B+
E63 563 Measurement Techniques for Particle Characterization 3 A
E37 5410 Fluid Dynamics I 3 B
E33 544 Multiphase Flow 3 A
E63 592A Advanced Topics in Aerosol Science and Engineering 3 A
E37 5412 Computational Fluid Dynamics 3 B