Embed Size (px)
Citation preview
Novel Approach Identifies SNPs in SLC2A10 and KCNK9with Evidence for Parent-of-Origin Effect on Body MassIndexClive J. Hoggart1, Giulia Venturini2, Massimo Mangino3, Felicia Gomez4, Giulia Ascari2, Jing Hua Zhao5,
Alexander Teumer6, Thomas W. Winkler7, Natalia Tsernikova8,9, Jian’an Luan5, Evelin Mihailov8,10,
Georg B. Ehret11,12, Weihua Zhang13, David Lamparter2,14, Tonu Esko15,16,17, Aurelien Mace2,14,
Sina Rueger2,14, Pierre-Yves Bochud18, Matteo Barcella19, Yves Dauvilliers20,21, Beben Benyamin22,23,
David M. Evans24,25,26, Caroline Hayward27, Mary F. Lopez15,16,28, Lude Franke29, Alessia Russo30,
Iris M. Heid7, Erika Salvi19, Sailaja Vendantam15,16, Dan E. Arking11, Eric Boerwinkle31,
John C. Chambers13, Giovanni Fiorito30, Harald Grallert32, Simonetta Guarrera33, Georg Homuth6,
Jennifer E. Huffman27, David Porteous34, Generation Scotland Consortium27", The LifeLines Cohort
study29", The GIANT Consortium15", Darius Moradpour35, Alex Iranzo36, Johannes Hebebrand37,
John P. Kemp24,25, Gert J. Lammers38,39, Vincent Aubert40, Markus H. Heim41, Nicholas G. Martin23,
Grant W. Montgomery42, Rosa Peraita-Adrados43, Joan Santamaria36, Francesco Negro44,
Carsten O. Schmidt45, Robert A. Scott5, Tim D. Spector3, Konstantin Strauch46,47, Henry Volzke45,
Nicholas J. Wareham5, Wei Yuan3, Jordana T. Bell3, Aravinda Chakravarti11, Jaspal S. Kooner48,
Annette Peters49,50, Giuseppe Matullo30, Henri Wallaschofski51, John B. Whitfield23, Fred Paccaud52,
Peter Vollenweider53, Sven Bergmann2,14, Jacques S. Beckmann14, Mehdi Tafti54,55, Nicholas D. Hastie27,
Daniele Cusi19, Murielle Bochud52, Timothy M. Frayling56, Andres Metspalu8,9,10, Marjo-
Riitta Jarvelin57,58,59,60,61, Andre Scherag62,63, George Davey Smith24,25, Ingrid B. Borecki4,
Valentin Rousson52, Joel N. Hirschhorn15,16,17, Carlo Rivolta2, Ruth J. F. Loos5,64,65,66,
Zoltan Kutalik2,14,52*
1 Department of Genomics of Common Disease, Imperial College London, London, United Kingdom, 2 Department of Medical Genetics, University of Lausanne, Lausanne,
Switzerland, 3 Department of Twin Research & Genetic Epidemiology, King’s College London, London, United Kingdom, 4 Department of Genetics, Division of Statistical
Genomics, Washington University School of Medicine in St. Louis, St. Louis, Missouri, United States of America, 5 MRC-Epidemiology Unit, University of Cambridge,
Cambridge, United Kingdom, 6 Interfaculty Institute for Genetics and Functional Genomics, University Medicine Greifswald, Greifswald, Germany, 7 Department of Genetic
Epidemiology, University of Regensburg, Regensburg, Germany, 8 Estonian Genome Center, University of Tartu, Tartu, Estonia, 9 Institute of Molecular and Cell Biology,
University of Tartu, Tartu, Estonia, 10 Estonian Biocentre, Tartu, Estonia, 11 McKusick-Nathans Institute of Genetic Medicine, Johns Hopkins University School of Medicine,
Center for Complex Disease Genomics, Baltimore, Maryland, United States of America, 12 Cardiology, Geneva University Hospitals, Geneva, Switzerland, 13 Epidemiology
and Biostatistics, School of Public Health, Imperial College London, London, United Kingdom, 14 Swiss Institute of Bioinformatics, Lausanne, Switzerland, 15 Center for
Basic and Translational Obesity Research and Divisions of Endocrinology and Genetics, Boston Children’s Hospital, Boston, Massachusetts, United States of America,
16 Metabolism Initiative and Program in Medical and Population Genetics, Broad Institute, Cambridge, Massachusetts, United States of America, 17 Department of
Genetics, Harvard Medical School, Boston, Massachusetts, United States of America, 18 Infectious Diseases Service, Department of Medicine, Centre Hospitalier
Universitaire Vaudois (CHUV), Lausanne, Switzerland, 19 Department of Health Sciences, University of Milan, Milan, Italy, 20 INSERM-U1061, Montpellier, France,
21 National Reference Network for Orphan Diseases (Narcolepsy and Idiopathic Hypersomnia), Department of Neurology, Gui-de-Chauliac Hospital, Montpellier, France,
22 Queensland Brain Institute, University of Queensland, Brisbane, Australia, 23 Genetic Epidemiology, QIMR Berghofer Institute of Medical Research, Brisbane, Australia,
24 MRC Integrative Epidemiology Unit, University of Bristol, Bristol, United Kingdom, 25 School of Social and Community Medicine, University of Bristol, Bristol, United
Kingdom, 26 Diamantina Institute, Translational Research Institute, University of Queensland, Brisbane, Australia, 27 MRC Institute of Genetics and Molecular Medicine,
University of Edinburgh, Edinburgh, Scotland, United Kingdom, 28 Department of Medicine, Harvard Medical School, Boston, Massachusetts, United States of America,
29 Department of Genetics, University Medical Center Groningen, University of Groningen, Groningen, The Netherlands, 30 Genomic Variation in Human Populations and
Complex Diseases Unit, Human Genetics Foundation and Dept. of Medical Sciences, University of Turin, Turin, Italy, 31 Human Genetics Center, Houston, Texas, United
States of America, 32 Research Unit Molecular Epidemiology, Helmholtz Zentrum Munchen, Neuherberg, Germany, 33 Genomic Variation in Human Populations and
Complex Diseases Unit, Human Genetics Foundation, Turin, Italy, 34 Centre for Molecular Medicine, Institute of Genetics and Molecular Medicine, University of Edinburgh,
Edinburgh, Scotland, United Kingdom, 35 Department of Medicine, Service of Gastroenterology and Hepatology, Lausanne, Switzerland, 36 Neurology Service, Hospital
Clinic, Barcelona, Spain, 37 Department of Child and Adolescent Psychiatry, University of Duisburg-Essen, Essen, Germany, 38 Department of Neurology, Leiden University
Medical Centre, Leiden, The Netherlands, 39 Sleep Wake Center SEIN, Heemstede, The Netherlands, 40 Division of Immunology and Allergy, Centre Hospitalier
Universitaire Vaudois (CHUV), Lausanne, Switzerland, 41 Department of Gastroenterology, University Hospital Basel, Basel, Switzerland, 42 Molecular Epidemiology, QIMR
Berghofer Institute of Medical Research, Brisbane, Australia, 43 Sleep and Epilepsy Unit - Clinical Neurophysiology Department, Gregorio Maranon University Hospital,
Madrid, Spain, 44 Service of Gastroenterology and Hepatology, Service of Clinical Pathology, Geneva, Switzerland, 45 Institute for Community Medicine, University
Medicine Greifswald, Greifswald, Germany, 46 Institute of Genetic Epidemiology, Helmholtz Zentrum Munchen - German Research Center for Environmental Health,
Neuherberg, Germany, 47 Institute of Medical Informatics, Biometry and Epidemiology, Chair of Genetic Epidemiology, Ludwig-Maximilians-Universitat, Munich, Germany,
48 Cardiovascular Science, National Heart & Lung Institute, Imperial College London, London, United Kingdom, 49 Institute of Epidemiology II, Helmholtz Zentrum
Munchen, Neuherberg, Germany, 50 Deutsches Zentrum fur Diabetes, Neuherberg, Germany, 51 Institute of Clinical Chemistry and Laboratory Medicine, University
Medicine Greifswald, Greifswald, Germany, 52 Institute of Social and Preventive Medicine (IUMSP), Centre Hospitalier Universitaire Vaudois (CHUV), Lausanne, Switzerland,
53 Department of Internal Medicine, Centre Hospitalier Universitaire Vaudois (CHUV), Lausanne, Switzerland, 54 Center for Integrative Genomics (CIG), University of
PLOS Genetics | www.plosgenetics.org 1 July 2014 | Volume 10 | Issue 7 | e1004508
Lausanne, Lausanne, Switzerland, 55 Center for Investigation and Research in Sleep (CIRS), Centre Hospitalier Universitaire Vaudois (CHUV), Lausanne, Switzerland,
56 University of Exeter Medical School, University of Exeter, Exeter, United Kingdom, 57 Institute of Health Sciences, University of Oulu, Oulu, Finland, 58 Biocenter Oulu,
University of Oulu, Oulu, Finland, 59 Department of Children and Young People and Families, National Institute for Health and Welfare, Oulu, Finland, 60 Department of
Epidemiology and Biostatistics, School of Public Health, MRC-HPA Centre for Environment and Health, Faculty of Medicine, Imperial College London, London, United
Kingdom, 61 Unit of Primary Care, Oulu University Hospital, Oulu, Finland, 62 Institute for Medical Informatics, Biometry and Epidemiology, University Hospital of Essen,
University of Duisburg-Essen, Essen, Germany, 63 Clinical Epidemiology, Integrated Research and Treatment Center, Center for Sepsis Control and Care (CSCC), Jena
University Hospital, Jena, Germany, 64 The Charles Bronfman Institute of Personalized Medicine, The Icahn School of Medicine at Mount Sinai, New York, New York, United
States of America, 65 The Mindich Child Health and Development Institute, The Icahn School of Medicine at Mount Sinai, New York, New York, United States of America,
66 The Genetics of Obesity and Related Metabolic Traits Program, The Icahn School of Medicine at Mount Sinai, New York, New York, United States of America
Abstract
The phenotypic effect of some single nucleotide polymorphisms (SNPs) depends on their parental origin. We present anovel approach to detect parent-of-origin effects (POEs) in genome-wide genotype data of unrelated individuals. Themethod exploits increased phenotypic variance in the heterozygous genotype group relative to the homozygous groups.We applied the method to .56,000 unrelated individuals to search for POEs influencing body mass index (BMI). Six leadSNPs were carried forward for replication in five family-based studies (of ,4,000 trios). Two SNPs replicated: the paternalrs2471083-C allele (located near the imprinted KCNK9 gene) and the paternal rs3091869-T allele (located near the SLC2A10gene) increased BMI equally (beta = 0.11 (SD), P,0.0027) compared to the respective maternal alleles. Real-time PCRexperiments of lymphoblastoid cell lines from the CEPH families showed that expression of both genes was dependent onparental origin of the SNPs alleles (P,0.01). Our scheme opens new opportunities to exploit GWAS data of unrelatedindividuals to identify POEs and demonstrates that they play an important role in adult obesity.
Citation: Hoggart CJ, Venturini G, Mangino M, Gomez F, Ascari G, et al. (2014) Novel Approach Identifies SNPs in SLC2A10 and KCNK9 with Evidence for Parent-of-Origin Effect on Body Mass Index. PLoS Genet 10(7): e1004508. doi:10.1371/journal.pgen.1004508
Editor: Peter M. Visscher, The University of Queensland, Australia
Received February 5, 2014; Accepted May 14, 2014; Published July 31, 2014
Copyright: � 2014 Hoggart et al. This is an open-access article distributed under the terms of the Creative Commons Attribution License, which permitsunrestricted use, distribution, and reproduction in any medium, provided the original author and source are credited.
Funding: ALSPAC: The UK Medical Research Council, the Wellcome Trust (combined grant ref. 0927310) and the University of Bristol provide core support forALSPAC. We thank 23andMe for funding the genotyping of the ALSPAC children’s sample. Funding to pay the Open Access publication charges for this article wasprovided by the Wellcome Trust. JPK is funded by a Wellcome Trust grant (WT083431MA). JPK, DME and GDS work in an MRC Unit funded by MC_UU_12013. Thispublication is the work of the authors and DME will serve as guarantor for the contents of this paper. ARIC: The Atherosclerosis Risk in Communities Study iscarried out as a collaborative study supported by National Heart, Lung, and Blood Institute contracts (HHSN268201100005C, HHSN268201100006C,HHSN268201100007C, HHSN268201100008C, HHSN268201100009C, HHSN268201100010C, HHSN268201100011C, and HHSN268201100012C), R01HL087641,R01HL59367 and R01HL086694; National Human Genome Research Institute contract U01HG004402; and National Institutes of Health contractHHSN268200625226C. Infrastructure was partly supported by Grant Number UL1RR025005, a component of the National Institutes of Health and NIH Roadmapfor Medical Research. CoLaus: The CoLaus study was supported by research grants from the Swiss National Science Foundation (grant no: 33CSCO-122661) fromGlaxoSmithKline and the Faculty of Biology and Medicine of Lausanne, Switzerland. ZK received financial support from the Leenaards Foundation and the SwissNational Science Foundation (31003A-143914). EPIC: The EPIC Norfolk diabetes case cohort study is nested within the EPIC Norfolk Study, which is supported byprogramme grants from the Medical Research Council, and Cancer Research UK and with additional support from the European Union, Stroke Association, BritishHeart Foundation, Research into Ageing, Department of Health, The Wellcome Trust and the Food Standards Agency. Genotyping was in part supported by theMRC-GSK pilot programme grant. We acknowledge the contribution of the staff and participants of the EPIC-Norfolk Study. EPIC-Italy: Methylation analysis onEPIC-Italy samples was made possible by a grant of the Compagnia di San Paolo (Turin, Italy; GM) and by Regione Piemonte (GM). EGCUT: Estonian GenomeCenter, University of Tartu (EGCUT) received targeted financing from Estonian Government SF0180142s08, Center of Excellence in Genomics (EXCEGEN) andUniversity of Tartu (SP1GVARENG). We acknowledge EGCUT technical personnel, especially Mr V. Soo and S. Smit. Data analyses were carried out in part in theHigh Performance Computing Center of University of Tartu. EU-NN: Support for the EU-NN research was in part provided by the French Ministry of Research andHigher Education, Project Agence Nationale de la Recherche-07-MRAR (France). FamHS: This work was partly supported by NIDDK grant R01DK8925601 (IBB, PI).Fenland: The Fenland Study is funded by the Wellcome Trust and the Medical Research Council (MC_U106179471). We are grateful to all the volunteers for theirtime and help, and to the General Practitioners and practice staff for assistance with recruitment. We thank the Fenland Study Investigators, Fenland Study Co-ordination team and the Epidemiology Field, Data and Laboratory teams. HYPERGENES: This study was funded by HYPERGENES (FP7 - HEALTH-F4-2007-601201550); INTEROMICS (MIUR - CNR Italian Flagship Project). Carlo Rivolta was supported by the Swiss National Science Foundation (Grant 310030_138346) and theGebert Ruf Foundation, Switzerland (Rare Diseases - New Technologies grant). KORA S3/KORA S4: The KORA research platform (KORA, Cooperative Research in theRegion of Augsburg) was initiated and financed by the Helmholtz Zentrum Munchen - German Research Center for Environmental Health, which is funded by theGerman Federal Ministry of Education and Research (BMBF) and by the State of Bavaria. Furthermore, KORA research was supported within the Munich Center ofHealth Sciences (MC Health), Ludwig-Maximilians-Universitat, as part of LMUinnovativ. Part of this project was supported by BMBF grant number 01GS0823, bythe German National Genome Research Network (NGFNPlus, project number 01GS0823 and project number 01GS0834) and through additional funds from theUniversity of Ulm. LifeLines: The LifeLines Cohort Study, and generation and management of GWAS genotype data for the LifeLines Cohort Study is supported bythe Netherlands Organization of Scientific Research NWO (grant 175.010.2007.006), the Economic Structure Enhancing Fund (FES) of the Dutch government, theMinistry of Economic Affairs, the Ministry of Education, Culture and Science, the Ministry for Health, Welfare and Sports, the Northern Netherlands Collaboration ofProvinces (SNN), the Province of Groningen, University Medical Center Groningen, the University of Groningen, Dutch Kidney Foundation and Dutch DiabetesResearch Foundation. LOLIPOP: The LOLIPOP study is supported by the National Institute for Health Research (NIHR) Comprehensive Biomedical Research CentreImperial College Healthcare NHS Trust, the NIHR Cardiovascular Biomedical Research Unit of Royal Brompton and Harefield NHS Foundation Trust,the British HeartFoundation (SP/04/002), the Medical Research Council (G0601966,G0700931), the Wellcome Trust (084723/Z/08/Z) the NIHR (RP-PG-0407-10371),European UnionFP7 (EpiMigrant, 279143)and Action on Hearing Loss (G51). We thank the participants and research staff who made the study possible. NFBC66: NFBC1966received financial support from the Academy of Finland (project grants 104781, 120315, 129269, 1114194, 24300796, Center of Excellence in Complex DiseaseGenetics and SALVE), University Hospital Oulu, Biocenter, University of Oulu, Finland (75617), NHLBI grant 5R01HL087679-02 through the STAMPEED program(1RL1MH083268-01), NIH/NIMH (5R01MH63706:02), ENGAGE project and grant agreement HEALTH-F4-2007-201413, and the Medical Research Council, UK(G0500539, G0600705, G1002319, PrevMetSyn/SALVE,). The DNA extractions, sample quality controls, biobank upkeep and aliquoting was performed in theNational Public Health Institute, Biomedicum Helsinki, Finland and supported financially by the Academy of Finland and Biocentrum Helsinki. We thank the lateProfessor Paula Rantakallio (launch of NFBC1966), and Ms Outi Tornwall and Ms Minttu Jussila (DNA biobanking). The authors would like to acknowledge thecontribution of the late Academian of Science Leena Peltonen. QIMR: We acknowledge funding from the Australian National Health and Medical Research
SNPs in SLC2A10 and KCNK9 Exhibit Parent-of-Origin Effect on BMI
PLOS Genetics | www.plosgenetics.org 2 July 2014 | Volume 10 | Issue 7 | e1004508

Council (NHMRC grants 241944, 389875, 389891, 389892, 389938, 442915, 442981, 496739, 496688, 552485 and 613672), the U.S. National Institute of Health (grantsAA07535, AA10248, AA014041, AA13320, AA13321, AA13326 and DA12854) and the Australian Research Council (ARC grant DP0770096). SHIP/SHIP-TREND: SHIP ispart of the Community Medicine Research net of the University of Greifswald, Germany, which is funded by the Federal Ministry of Education and Research (grantsno. 01ZZ9603, 01ZZ0103, and 01ZZ0403), the Ministry of Cultural Affairs as well as the Social Ministry of the Federal State of Mecklenburg-West Pomerania, and thenetwork ‘Greifswald Approach to Individualized Medicine (GANI_MED)’ funded by the Federal Ministry of Education and Research (grant 1036 03IS2061A). Genome-wide data have been supported by the Federal Ministry of Education and Research (grant no. 03ZIK012) and a joint grant from Siemens Healthcare, Erlangen, Germanyand the Federal State of Mecklenburg-West Pomerania. The University of Greifswald is a member of the ‘Center of Knowledge Interchange’ program of the SiemensAG and the Cache Campus program of the InterSystems GmbH. TwinsUK: The study was funded by the Wellcome Trust; European Community’s Seventh FrameworkProgramme (FP7/2007–2013), ENGAGE project grant agreement (HEALTH-F4-2007–201413). The study also receives support from the Dept of Health via the NationalInstitute for Health Research (NIHR) comprehensive Biomedical Research Centre award to Guy’s & St Thomas’ NHS Foundation Trust in partnership with King’s CollegeLondon. TDS is an NIHR senior Investigator and is holder of an ERC Advanced Principal Investigator award. Genotyping was performed by The Wellcome Trust SangerInstitute, support of the National Eye Institute via an NIH/CIDR genotyping project. The funders had no role in study design, data collection and analysis, decision topublish, or preparation of the manuscript.
Competing Interests: Prof. Dauvilliers has received speaker’s honoraria and support for travel to meetings from UCB Pharma, JAZZ and Bioprojet. Prof. Dauvilliersparticipated in advisory boards of UCB Pharma, JAZZ and Bioprojet. All other authors declare that they have no competing interests.
* Email: [email protected]
" Membership of Generation Scotland Consortium, The LifeLines Cohort study, and The GIANT Consortium is provided in the Acknowledgments.
Introduction
The effect of genetic variants on phenotypes may depend upon
the parent from whom the variant was inherited [1,2]. Parent-of-
origin effects (POEs) may arise through imprinting; mechanisms of
which include cytosine methylation and histone deacetylation [2].
To date around 50 human genes are known to be imprinted and
for most mammalian species less than 1% of the genome is
confirmed to be imprinted [3]. One plausible explanation for this
phenomenon is the parental conflict hypothesis, whereby both
parents would like to maximize the influence of their genome on
their offspring [4]. Current methods for detecting parent-of-origin
effects rely on assigning parental ancestry to the inherited alleles.
This is straightforward in linkage studies, which have identified
potential POEs on type 2 diabetes, body mass index (BMI) [5,6],
and alcohol intake [7–9]. However, only a very few of these findings
have been replicated and the identified linkage peaks often span
large chromosomal regions harbouring hundreds of genes, hence
the causal gene or regulatory sequence is unknown. A notable
exception is the work of Kong et al [1] who inferred parental origin
through genealogy information and long-range phasing to subse-
quently test for POEs. This study identified six SNPs, four
associated with risk of type 2 diabetes and the other two associated
with each of breast cancer and basal-cell carcinoma.
Genome-wide association studies (GWASs) of unrelated indi-
viduals have very precisely identified a large number of genetic loci
harbouring SNPs whose (alternative) allele counts associate with
common traits. Since GWASs predominantly include unrelated
individuals, the parental origin of the alleles cannot be determined,
hence genetic effects influenced by the parental origin of the alleles
are typically not considered. Here we present a novel approach
that is able to detect POEs using genome-wide genotype data of
unrelated individuals. We chose BMI as our target trait, due to
previous findings [5,6] and the large available sample size. We
report the discovery of two novel loci affecting BMI in a manner
dependent on the parent-of-origin of the transmitted alleles.
Results
We applied our POE test, which compares the phenotypic
variance of the heterozygous genotype group to the variance
observed in the homozygous groups, to all SNPs genome-wide.
The test, which is applicable to unrelated individuals, assumes that an
increased variance in the heterozygous group arises because the
heterozygous group consists of two subgroups (paternal reference
allele/maternal alternative allele and maternal reference allele/
paternal alternative allele) each with different means (see Figure 1).
Differences in phenotypic variance were tested using the Brown-
Forsythe test, modified to test the mean absolute deviations from the
median in the heterozygous and homozygous groups (see Materials
and Methods for details). We applied this test to BMI values
(corrected for age and age-squared), separately in men and women, in
15 studies, totalling up to 56,092 individuals (detailed description of
the cohorts can be found in Tables S1–S3), 13 of which participated
in previous meta-analyses of the GIANT consortium [10]. In total
2,673,768 HapMap imputed and genotyped SNPs were tested. For
each locus, a lead SNP (with the strongest POE association) was
identified; other markers within 1 Mb or in LD (r2.0.1) were
excluded from further investigations. Sex-specific association sum-
mary statistics were then meta-analysed. No sex specific difference in
effects were observed, therefore all reported results are sex-combined.
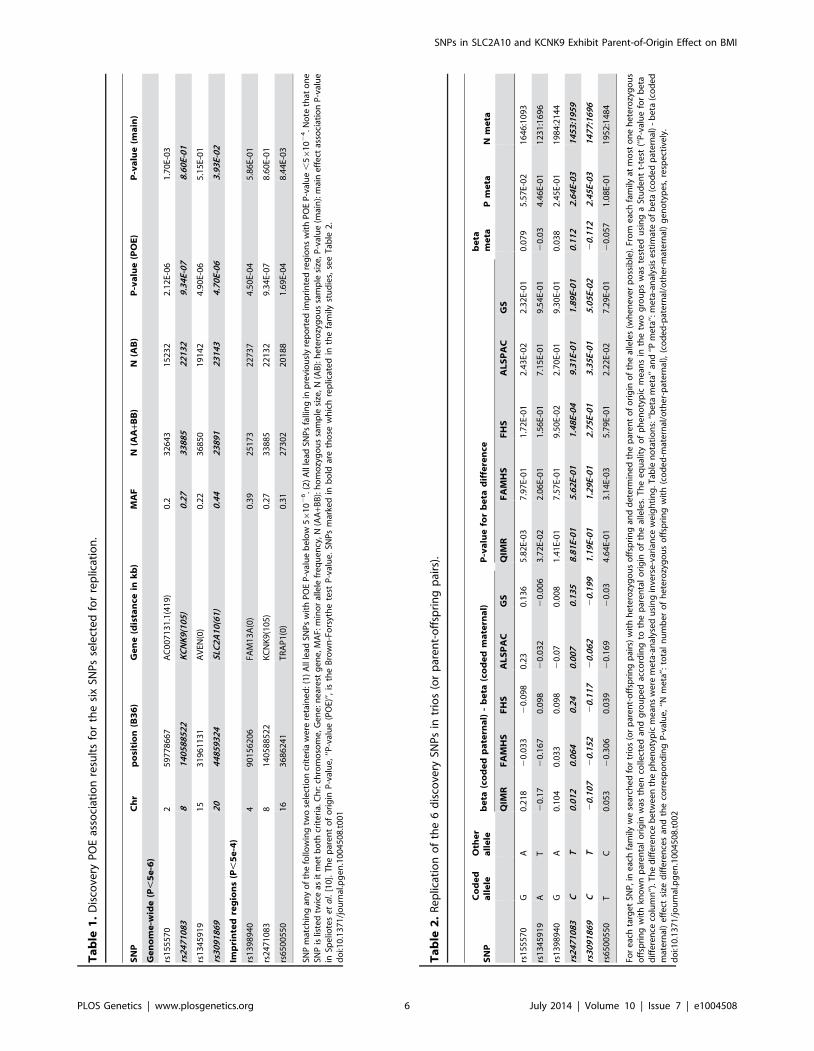
Our criteria to select SNPs to take forward to the replication stage
resulted in the selection of six independent SNPs: four lead SNPs
with POE P-value ,561026 and three SNPs in imprinted regions
with P,561024 (see Fig S1 for QQ-plot), one SNP fulfilled both
criteria. See Table 1 for details of these results and Materials and
Methods for details of the applied selection methods. These six
SNPs were carried forward to the replication stage.
Replication in family-based studiesThe replication stage utilised five family-based studies (see Tables
S1–S3) to test for parent-of-origin effects at the six selected SNPs.
Only heterozygous individuals are informative when testing for
parent-of-origin effects; the number of heterozygous individuals for
each of the tested SNPs ranged from 1,122 to 4,128 (see Table 2 and
Table S4). A simplified parental asymmetry test (PAT, see Materials
and Methods) was applied and SNPs successfully replicated if their
PAT P-values were below 0.0083 (Bonferroni corrected significance
threshold for family-wise error of 0.05 with six tests). Two of these
SNPs, rs2471083 [T/C] (GWAS discovery BMI variance (het vs.
hom): 1.058 vs 0.963, PPOE = 9.3461027; replication PAT
P = 0.00264) and rs3091869 [T/C] (GWAS discovery BMI variance
(het vs. hom): 1.046 vs 0.957, PPOE = 4.761026; replication PAT
P = 0.00245) successfully replicated. In particular, we found that
heterozygous individuals who carry the rs2471083-C allele pater-
nally have 0.11 (SD unit) higher BMI on average than those carrying
the C-allele maternally (P = 0.00264). Heterozygous carriers of the
paternal rs3091869-C allele have 0.11 (SD unit) lower BMI on
average than those carrying the maternal C-allele (P = 0.00245).
Figure 2 shows the locuszoom plots of the POE association P-values
for the two replicated loci (KCNK9 and SLC2A10).
Impact of the discovered variantsBy combining the effect difference estimates (bM{bP) from the
family-based studies and the marginal association effect sizes
SNPs in SLC2A10 and KCNK9 Exhibit Parent-of-Origin Effect on BMI
PLOS Genetics | www.plosgenetics.org 3 July 2014 | Volume 10 | Issue 7 | e1004508

((bMzbP)=2) from the largest-to-date meta-analytic study on
BMI [10], we estimated the effects of the maternal and paternal
alleles. For both rs2471083-C and rs3091869-T we obtained
bM~{0:055 and bP~0:055. Using these effect sizes and the
population frequency of these SNPs, we calculated the explained
variance of these SNPs (if their parent of origin is known) to be
0.24% and 0.30% for rs2471083 and rs3091869, respectively.
These effects are comparable to that of the strongest BMI-
associated variant in the FTO gene (0.34%) [10].
Notably, rs2471083 is located 105 kb upstream of the imprinted
gene KCNK9. Mutations in this potassium channel gene cause
Birk-Barel syndrome, a maternally transmitted syndrome of
mental retardation, hypotonia, and unique dysmorphism, resulting
from genomic-imprinting [11]. SNPs within 2 kb have been shown
to be associated with HDL cholesterol, adiponectin levels [12] and
blood pressure [13]. Its impact on hypertension is potentially via a
mechanism involving aldosterone, the concentration of which
correlates strongly with fat mass. Interestingly, KCNK9 knock-out
mice exhibited more fragmented sleep episodes [14] and 7.1%–
9.6% increased weight gain (P = 0.02) at 19–20 weeks of age [15].
SNP rs3091869 is 61 kb upstream of SLC2A10, a glucose
transporter involved in arterial morphogenesis. SNPs in low LD
(in CEU r2 = 0.05) with rs3091869 have been shown to alter body
fat distribution [16].
We tested these two confirmed SNPs in 705 trios with paediatric
(extreme) obese offspring in which parental origin of the alleles was
known in up to 255 individuals [17]. No significant effect was
observed (see Table S5). This could be due to insufficient power,
different genetic mechanisms between young individuals and
adults or that our association is specific to variations within the
range of normal BMI.
Expression experimentsWe evaluated whether the parent of origin effect of the
rs2471083-T and rs3092611-T (proxy for rs3091869-T,
r2 = 0.998) alleles can be observed in the expression levels of their
respective genes (KCNK9 or SLC2A10). To test this we carried
out quantitative PCR (qPCR) experiments using lymphoblastoid
cell lines (LCL) of the CEPH families. These cell lines have been
used extensively to identify imprinted genes [18,19]. Using the
available trio data we could infer the parental origin of the alleles
of rs2471083 and rs3092611 in 33 (9 maternal T alleles, 24
paternal T alleles) and 24 (16 maternal T alleles, 8 paternal T
alleles) individuals respectively (Table S7). We performed between
2 and 10 technical replicates per individual (mean of 7.75) and
samples with high coefficient of variation (.5%) were discarded in
order to ensure robustness. After quality control, 124 expression
values from 23 (mat:pat = 4:19) samples for KCNK9 and 240
expression values from 24 (mat:pat = 16:8) for SLC2A10 were
available for analysis. We fitted a linear mixed model to test for
association between expression levels (Ct values) and allelic origin.
The paternal T allele of rs2471083 was associated with lower
KCNK9 expression levels (+1.08 [SD unit] Ct values, P = 0.0096),
and the paternal T allele of rs3092611 was associated with higher
SLC2A10 expression values (21.09 [SD unit] Ct values,
P = 0.0023). To ensure there was no systematic bias in our
experiments giving rise to spurious POE associations we repeated
the qPCR experiments for two housekeeping genes GAPDH and
HRPT1. Both analyses gave non-significant POE P-values (P.
0.3).
Methylation lookupsPOEs can be driven by differences between inherited paternal
and maternal methylation. To explore whether the observed
parent-of-origin effects at our discovered SNPs were driven by
differential methylation we tested whether methylation in the
regions (Chr8: 140.45–140.65 Mb and Chr20: 45.3–45.55 Mb)
was (i) associated with the two respective SNPs (rs2471083,
rs3091869) in 262 unrelated individuals from the TwinsUK cohort
and (ii) associated with BMI in two independent cohorts: 79 BMI
discordant (difference .0.5 SD) monozygotic twin pairs from the
TwinsUK cohort and a sample of 412 unrelated individuals from
the EPIC-Italy cohort. None of these analyses showed significant
association (see Supplemental Data S1, Figures S2, S3 and Table
S8 for further details).
Discussion
Our novel approach revealed two SNPs, located near the genes
KCNK9 and SLC2A10, influencing BMI in a parent-of-origin
specific fashion. These loci were the first and fourth most
significant genome-wide in our new POE test for unrelated
individuals and both showed significant parent-of-origin effects in
family studies. Both SNPs exhibit polar overdominance, where
homozygous individuals have equal (baseline) phenotypes and
heterozygous genotypes confer relative risk/protection, depending
on the parental origin. Polar overdominance, has been observed in
humans for type2 diabetes [1] and BMI [20], however it is very
rare and its molecular mechanism is unknown.
RT-PCR experiments revealed that gene expression levels of
KCNK9 and SLC2A10 in LCLs were also influenced in a parent-
of-origin manner. The expression of these genes is highest in the
brain (although it is also expressed in testis, liver, colon, adrenal
gland and kidney; see http://www.genecards.org/) indicating a
potential neuronal involvement. Expression levels of KCNK9 and
SLC2A10 in living brain cells might have been more informative
and robust, however, such information is not available. The
applied qPCR method was optimised to ensure that the expression
levels measured in LCLs were representative only of the target
transcript and amplification efficiency was assessed to be sensitive
enough to allow the detection of even small changes in gene
expression. Interestingly, rs2471083 alleles, regardless of their
Author Summary
Large genetic association studies have revealed manygenetic factors influencing common traits, such as bodymass index (BMI). These studies assume that the effect ofgenetic variants is the same regardless of whether they areinherited from the mother or the father. In our study, wehave developed a new approach that allows us toinvestigate variants whose impact depends on theirparental origin (parent-of-origin effects), in unrelatedsamples when the parental origin cannot be inferred. Thisis feasible because at genetic markers at which sucheffects occur there is increased variability of the traitamong individuals who inherited different genetic codesfrom their mother and their father compared to individualswho inherited the same genetic code from both parents.We applied this methodology to discover genetic markerswith parent-of-origin effects (POEs) on BMI. This resulted insix candidate markers showing strong POE association. Wethen attempted to replicate the POE effects of thesemarkers in family studies (where one can infer the parentalorigin of the inherited variants). Two of our candidatesshowed significant association in the family studies, thepaternal and maternal effects of these markers were in theopposite direction.
SNPs in SLC2A10 and KCNK9 Exhibit Parent-of-Origin Effect on BMI
PLOS Genetics | www.plosgenetics.org 4 July 2014 | Volume 10 | Issue 7 | e1004508
parental origin, show marginally significant association (P = 0.03)
with KCNK9 expression levels in the hippocampus (http://www.
broadinstitute.org/gtex/). Our methylation analyses did not reveal
any evidence that the POEs were driven by differences in inherited
paternal and maternal methylation. Neither of our two SNPs tag
common copy number variants (CNVs) (based on the CNV
reference data used in Heid et al. [21]) and we found only one
sample (out of 14,315 available in-house, whose BMI Z-score was
+1.18) with a 76 kb deletion overlapping rs2471083. Hence, the
effect of the two discovered SNPs are unlikely to be driven by
CNVs. To check whether the two confirmed SNPs (rs3091869,
rs2471083), or SNPs in LD (10 with r2.0.8 in 1000 Genomes
EUR population), show regulatory activity, we queried Regulo-
meDB (http://regulome.stanford.edu). None of these SNPs were
annotated to have more than minimal binding evidence
(RegulomeDB score below 4).
A previous study proposed to detect POE in inbred F2 mice by a
two-component mixture distribution fitting of the heterozygous
genotype group and further two components for the homozygous
groups [22]. This method requires a parametric distribution of the
phenotype to be assumed, small violations of this assumption can
result in heavily biased parameter estimates. The method we chose
is more robust to a wide range of phenotype distributions (due to
the underlying Brown-Forsythe test employed), computationally
faster (making it attractive for testing millions of SNPs) and
applicable to probabilistic genotype calls. Our POE test for
unrelated GWAS samples is similar to a test proposed to detect
gene-environment interactions [23] in that it exploits differences in
phenotypic variance to detect a phenomenon not directly
measured. Inflated phenotypic variance in the heterozygous group
might also be the result of other phenomenon: (i) a phenotype
altering effect (be it genetic or environmental) acting only on the
Figure 1. Explanation of the POE test. Top panel illustrates the phenotype distributions in the four genotype groups that would be observed ifthe parent-of-origin of the alleles were known. Bottom panel shows how these distributions change if the parent-of-origin is unobserved. Theresulting heterozygous group will have increased variance due to its heterogeneity. This example describes a scenario we observe for the tworeplicated hits, namely that the paternal- and maternal effects are of the same size, but opposite in direction (bM~{bP). Therefore the averagephenotype in the B/B group is the same as in the A/A group, as the paternal and maternal B allele effects cancel each other out. In the A/B groupthere are two subpopulations: the A-pat/B-mat group with phenotypic mean of bM and the A-mat/B-pat group with bP mean. Thus, the twosubpopulations combined also have zero mean, but increased variance.doi:10.1371/journal.pgen.1004508.g001
SNPs in SLC2A10 and KCNK9 Exhibit Parent-of-Origin Effect on BMI
PLOS Genetics | www.plosgenetics.org 5 July 2014 | Volume 10 | Issue 7 | e1004508
Ta
ble
1.
Dis
cove
ryP
OE
asso
ciat
ion
resu
lts
for
the
six
SNP
sse
lect
ed
for
rep
licat
ion
.
SN
PC
hr
po
siti
on
(B3
6)
Ge
ne
(dis
tan
cein
kb
)M
AF
N(A
A+B
B)
N(A
B)
P-v
alu
e(P
OE
)P
-va
lue
(ma
in)
Ge
no
me
-wid
e(P
,5
e-6
)
rs1
55
57
02
59
77
86
67
AC
00
71
31
.1(4
19
)0
.23
26
43
15
23
22
.12
E-0
61
.70
E-0
3
rs2
47
10
83
81
40
58
85
22
KC
NK
9(1
05
)0
.27
33
88
52
21
32
9.3
4E-
07
8.6
0E-
01
rs1
34
59
19
15
31
96
11
31
AV
EN(0
)0
.22
36
85
01
91
42
4.9
0E-
06
5.1
5E-
01
rs3
09
18
69
20
44
85
93
24
SLC
2A
10
(61
)0
.44
23
89
12
31
43
4.7
0E-
06
3.9
3E-
02
Imp
rin
ted
reg
ion
s(P
,5
e-4
)
rs1
39
89
40
49
01
56
20
6FA
M1
3A
(0)
0.3
92
51
73
22
73
74
.50
E-0
45
.86
E-0
1
rs2
47
10
83
81
40
58
85
22
KC
NK
9(1
05
)0
.27
33
88
52
21
32
9.3
4E-
07
8.6
0E-
01
rs6
50
05
50
16
36
86
24
1T
RA
P1
(0)
0.3
12
73
02
20
18
81
.69
E-0
48
.44
E-0
3
SNP
mat
chin
gan
yo
fth
efo
llow
ing
two
sele
ctio
ncr
ite
ria
we
rere
tain
ed
:(1
)A
llle
adSN
Ps
wit
hP
OE
P-v
alu
eb
elo
w56
10
26.(
2)
All
lead
SNP
sfa
llin
gin
pre
vio
usl
yre
po
rte
dim
pri
nte
dre
gio
ns
wit
hP
OE
P-v
alu
e,
561
02
4.N
ote
that
on
eSN
Pis
liste
dtw
ice
asit
me
tb
oth
crit
eri
a.C
hr:
chro
mo
som
e,G
en
e:n
ear
est
ge
ne
,MA
F:m
ino
ral
lele
fre
qu
en
cy,N
(AA
+BB
):h
om
ozy
go
us
sam
ple
size
,N(A
B):
he
tero
zyg
ou
ssa
mp
lesi
ze,P
-val
ue
(mai
n):
mai
ne
ffe
ctas
soci
atio
nP
-val
ue
inSp
elio
tes
eta
l.[1
0].
Th
ep
are
nt
of
ori
gin
P-v
alu
e,
‘‘P-v
alu
e(P
OE)
’’,is
the
Bro
wn
-Fo
rsyt
he
test
P-v
alu
e.
SNP
sm
arke
din
bo
ldar
eth
ose
wh
ich
rep
licat
ed
inth
efa
mily
stu
die
s,se
eT
able
2.
do
i:10
.13
71
/jo
urn
al.p
ge
n.1
00
45
08
.t0
01
Ta
ble
2.
Re
plic
atio
no
fth
e6
dis
cove
rySN
Ps
intr
ios
(or
par
en
t-o
ffsp
rin
gp
airs
).
SN
PC
od
ed
all
ele
Oth
er
all
ele
be
ta(c
od
ed
pa
tern
al)
-b
eta
(co
de
dm
ate
rna
l)P
-va
lue
for
be
tad
iffe
ren
ceb
eta
me
taP
me
taN
me
ta
QIM
RF
AM
HS
FH
SA
LS
PA
CG
SQ
IMR
FA
MH
SF
HS
AL
SP
AC
GS
rs1
55
57
0G
A0
.21
82
0.0
33
20
.09
80
.23
0.1
36
5.8
2E-
03
7.9
7E-
01
1.7
2E-
01
2.4
3E-
02
2.3
2E-
01
0.0
79
5.5
7E-
02
16
46
:10
93
rs1
34
59
19
AT
20
.17
20
.16
70
.09
82
0.0
32
20
.00
63
.72
E-0
22
.06
E-0
11
.56
E-0
17
.15
E-0
19
.54
E-0
12
0.0
34
.46
E-0
11
23
1:1
69
6
rs1
39
89
40
GA
0.1
04
0.0
33
0.0
98
20
.07
0.0
08
1.4
1E-
01
7.5
7E-
01
9.5
0E-
02
2.7
0E-
01
9.3
0E-
01
0.0
38
2.4
5E-
01
19
84
:21
44
rs2
47
10
83
CT
0.0
12
0.0
64
0.2
40
.00
70
.13
58
.81
E-0
15
.62
E-0
11
.48
E-0
49
.31
E-0
11
.89
E-0
10
.11
22
.64
E-0
31
45
3:1
95
9
rs3
09
18
69
CT
20
.10
72
0.1
52
20
.11
72
0.0
62
20
.19
91
.19
E-0
11
.29
E-0
12
.75
E-0
13
.35
E-0
15
.05
E-0
22
0.1
12
2.4
5E-
03
14
77
:16
96
rs6
50
05
50
TC
0.0
53
20
.30
60
.03
92
0.1
69
20
.03
4.6
4E-
01
3.1
4E-
03
5.7
9E-
01
2.2
2E-
02
7.2
9E-
01
20
.05
71
.08
E-0
11
95
2:1
48
4
For
eac
hta
rge
tSN
P,i
ne
ach
fam
ilyw
ese
arch
ed
for
trio
s(o
rp
are
nt-
off
spri
ng
pai
rs)
wit
hh
ete
rozy
go
us
off
spri
ng
and
de
term
ine
dth
ep
are
nt
of
ori
gin
of
the
alle
les
(wh
en
eve
rp
oss
ible
).Fr
om
eac
hfa
mily
atm
ost
on
eh
ete
rozy
go
us
off
spri
ng
wit
hkn
ow
np
are
nta
lo
rig
inw
asth
en
colle
cte
dan
dg
rou
pe
dac
cord
ing
toth
ep
are
nta
lo
rig
ino
fth
eal
lele
s.T
he
eq
ual
ity
of
ph
en
oty
pic
me
ans
inth
etw
og
rou
ps
was
test
ed
usi
ng
aSt
ud
en
tt-
test
(‘‘P
-val
ue
for
be
tad
iffe
ren
ceco
lum
n’’)
.Th
ed
iffe
ren
ceb
etw
ee
nth
ep
he
no
typ
icm
ean
sw
ere
me
ta-a
nal
yse
du
sin
gin
vers
e-v
aria
nce
we
igh
tin
g.T
able
no
tati
on
s:‘‘b
eta
me
ta’’
and
‘‘Pm
eta
’’:m
eta
-an
alys
ise
stim
ate
of
be
ta(c
od
ed
pat
ern
al)
-b
eta
(co
de
dm
ate
rnal
)e
ffe
ctsi
zed
iffe
ren
ces
and
the
corr
esp
on
din
gP
-val
ue
,‘‘N
me
ta’’:
tota
ln
um
be
ro
fh
ete
rozy
go
us
off
spri
ng
wit
h(c
od
ed
-mat
ern
al/o
the
r-p
ate
rnal
),(c
od
ed
-pat
ern
al/o
the
r-m
ate
rnal
)g
en
oty
pe
s,re
spe
ctiv
ely
.d
oi:1
0.1
37
1/j
ou
rnal
.pg
en
.10
04
50
8.t
00
2
SNPs in SLC2A10 and KCNK9 Exhibit Parent-of-Origin Effect on BMI
PLOS Genetics | www.plosgenetics.org 6 July 2014 | Volume 10 | Issue 7 | e1004508

heterozygous group; (ii) an overdominant effect combined with a
genetic or environmental interaction or non-linear, monotonic
phenotype transformation that has different derivatives for low
and high trait values; (iii) a large marginal additive effect combined
with a (monotonic) transformation for which the second derivative
is maximised at the mean phenotype value of the heterozygous
group (see Materials and Methods for details). More generally, the
combination of the scale on which the phenotype is measured and
a strong marginal association with an allelic dosage may give rise
to spurious associations using variance tests [24]. Recently some
evidence has emerged about loci which effect the variance of
phenotypes (through impacting environmental plasticity, canali-
zation, developmental stability, etc.) that can be detected via
association with phenotypic variability [25]. Therefore, the top hits
obtained by our POE test may need further prioritisation before
proceeding to trio-based confirmation. We recommend the
following checks: (a) Exclude SNPs with overdominant effects;
(b) For SNPs with low POE P-value, test gene-environment (GxE)
interaction (as done in [23]) via modelling phenotypic variance as
a function of the genotype dosage (coded in additive, recessive or
dominant fashion). If this test is more significant than the POE
test, it is probably a GxE that is driving the POE association and
also as a side effect we will observe significant difference in the
variance between the two homozygous groups. (c) If a SNP with
low POE P-value has marginal effect on the trait, repeat the POE
test for various transformed versions of the phenotype such as log
and inverse-normal quantile. If the resulting POE P-values are not
robust, give lower priority to the examined SNP.
For our confirmed SNPs multiple lines of evidence show that
the parent-of-origin effects are real, most convincingly clear
replication in independent family data of parent-of-origin associ-
ations of the hit SNPs with both BMI and gene expression levels.
Further, the GWAS discovery associations are very unlikely to be
artefacts of the factors discussed above: (i) there is no evidence of
overdominant, additive, recessive or dominant effects (the mean
BMI values are near identical in the three genotype groups), hence
the signals cannot be driven by gene-environment interactions or
be an artefact of the scale on which the phenotype is measured (ii)
no SNP within 500 kb has any detectable marginal effect on BMI
thus the association cannot be driven by haplotype-specific
marginal effects [26]; (iii) the phenotypic variances in the two
homozygous groups, are almost identical (rs2471083: s2CC~0:96,
s2CT~1:06, s2
TT~0:98 and rs3091869: s2CC~0:97, s2
CT~1:05,
s2TT~0:95); (iv) POE test with log- and inverse-normal quantile
transformed BMI values resulted in similar results (Table S6),
further reducing the likelihood of an artefact resulting from the
scale on which the phenotype is measured [24].
Some of the negative results of the other SNPs carried forward
to the replication phase in the family data could be explained by
lack of power. The power to replicate POE associations in family-
based studies is dependent on the available number of heterozy-
gous individuals (for details see Supplemental Data S1) and thus
increases with minor allele frequency (MAF). Therefore, it is
unsurprising that the two SNPs which replicated had relatively
high MAF (.27%).
Linkage studies have identified four regions exerting POE on
BMI (10p12, 12q24, 13q32) [5] and 2q31 [27]). We looked up
SNPs in these regions in our genome-wide discovery POE
association results. The reported linkage regions showed enrich-
ment for lower than expected POE P-values (see Figure S4 for
regional QQ-plots), however, no SNPs survived Bonferroni
correction. We also tried to replicate a SNP in exon 5 of DLK1(rs1802710) because this SNP showed polar overdominance for
obesity in children [20], but only a very slight trend (P = 0.32) was
visible in our study. Previously reported BMI-associated loci [10]
show some enrichment for lower POE P-values (Supplemental
Data S1, Tables S9, S10 and Figure S5), however these need to be
replicated in family studies.
Previous work comparing strength of associations of mother-
offspring BMI with father-offspring BMI did not reveal intrauter-
ine influence on obesity in children [28]. A similar conclusion was
reached in a systematic review of seven studies [29], while stronger
maternal influence was observed in a recent longitudinal study
[30]. The difference in conclusions may be due to that fact that the
former studies included predominantly older children than the
longitudinal study (0–3.5 years). At early age the diet of the
offspring may be more similar to that of the mother than the father
(e.g. due to breastfeeding), which might have contributed to the
higher mother-offspring BMI similarity found by Linabery et al.[30].
In summary, our findings indicate that POEs may play a role in
adult obesity. The two identified SNPs have strong parent-of-
origin effect on BMI, close to that of the FTO, contributing
substantially to the heritability of BMI. Our follow-up experiments
demonstrated parent-of-origin specific gene expression modula-
tion, but failed to link methylation activity of these loci to BMI
values. Inevitably for newly discovered loci, further studies are
warranted to determine how these variations functionally influence
obesity in humans. The reliance of our approach on difference in
phenotypic variance means that it cannot be extended to binary
Figure 2. Local association plots. Panels show the local POE association P-values for the KCNK9 (left panel) and SLC2A10 (right panel) loci.doi:10.1371/journal.pgen.1004508.g002
SNPs in SLC2A10 and KCNK9 Exhibit Parent-of-Origin Effect on BMI
PLOS Genetics | www.plosgenetics.org 7 July 2014 | Volume 10 | Issue 7 | e1004508
outcomes. Since there are other phenomena which can give rise to
significant POE association, we recommend that top hits from our
method are followed up in family studies, where parental origin of
alleles can be inferred. In addition, our variance based POE test
for GWAS data is naturally much less powerful than actually
testing the mean values of the two heterozygous subgroups in trios.
However, GWASs of unrelated individuals are several-fold more
numerous and typically much larger than studies with a trio
design, hence our methodology provides a great advance in
parent-of-origin research by providing means to exploit all
available GWAS data of unrelated individuals in order to identify
parent-of-origin effects on continuous phenotypes.
Materials and Methods
Ethics statementAll participating studies were approved by the respective
institutional Ethics Committees. All study participants gave written
consent including for genetic studies.
Detecting parent of origin effectsIf we denote the alleles of a bi-allelic SNP by ‘‘A’’ (reference)
and ‘‘B’’ (alternative) the possible genotypes are A/A, A/B and B/
B. Standard GWASs estimate the effect of the alternative allele
dosage on the phenotype in question. In this work we are
interested in associations in which a phenotype (y) is influenced by
the alleles of a particular SNP and the effect depends on the
parental origin of these alleles. In the presence of a parent-of-
origin effect the heterozygous genotype group is split into two
subgroups, depending on the parental origin of the A and B alleles.
We assume that the phenotype of any individual in the A/A
genotype group is modelled by yAA~mAAze, where mAAis the
mean and eis an individual level error with mean zero and
variance s2. If the maternal and paternal effects of the B allele are
bMandbP, it follows that the phenotype of an individual in the B/
B group is yBB~(mAAzbMzbP)ze and its variance is s2. (Note
that as a consequence the maternal and paternal effects of the A
allele are {bP and {bM .) Here we assume s2is constant across
genotype groups (A/A, A/B and B/B) and bM andbP are fixed
effects. The effects of violations of these assumptions are covered in
the discussion. The phenotype in the heterozygous group is a
50%–50% mixture of two distributions (Fig 1a):
yAB~mAAzpbMz(1{p)bPze,
where p is a Bernoulli random variable (with parameter K), taking
values p~1 if the B allele is inherited from the mother and p~0 if
inherited from the father. The heterozygous phenotype distribu-
tion can be simplified to yAB~(mAAzbP)zp(bM{bP)ze Since
p and e are independent random variables, the phenotypic
variance of the heterozygous genotype group s2AB is
Var(yAB)~Var(p)(bM{bP)2zVar(e)~1
4(bM{bP)2zs2
If a parent-of-origin effect is present bM andbPare different,
thus s2AB is larger than the variance observed in the
homozygous groups (s2) (Figure 1). Therefore, although in
regular GWAS data we cannot identify the two subgroups
within A/B genotypes, we can detect POE via increased
phenotypic variance in the heterozygous group relative to the
homozygous groups.
In the presence of a marginal association a phenotype
transformation could alter the genotype group variances and
introduce bias into the test [24]. For this reason we analysed
untransformed age-, age2-corrected BMI values (normalised to
have zero mean and unit variance) separately for men and women.
Standard variance tests (such as the F-test) are, however, sensitive
to deviations from the Gaussian distribution.
Therefore, we used a robust version of the Brown-Forsythe test.
Briefly, we first centred the phenotype values (at zero) in each
genotype group to avoid inflated variance in the presence of
marginal effects in the group of all homozygote individuals. We
denote these centred phenotypes by z, where
zi~
yi{mAA if gi~AA
yi{mAB if gi~AB
yi{mBB if gi~BB
8><>:
Here gi stands for the genotype of individual i, and mj represents
the median phenotype value in genotype group j, where j can take
the values of AA, AB or BB. We then regress the absolute
deviations from the median onto a 0–1 coded genotype group
identifier (1 for heterozygous and 0 for homozygous individuals) in
order to estimate the POE effect size [31]. This regression result in
a slope estimate
bb~ahet{ahom,
where ahet~X
i:gi~AB
Dzi D=nAB and ahom~X
i:gi~AA
Dzi DzX
i:gi~BB
Dzi D
0@
1A
=(nAAznBB). The corresponding standard error is
SEb2~
RSS
n{1
�nAB(nAAznBB)
n,
where
RSS~X
i
(zi{a)2{bb2nAB(nAAznBB)=n and a~X
i
Dzi D=n:
Finally, the POE P-value is assigned based on the test statistic
bb=SEb~N(0,1). The test was extended to imputed genotype
probabilities and implemented in the latest version (v0.98) of the
Quicktest software (http://www3.unil.ch/wpmu/sgg/quicktest/).
The robustness of this test to deviations from normality has been
studied in [32] and its power in [31].
SNP selection strategyWe applied our POE test genome-wide to all HapMap imputed
markers in a set of cohorts and results were combined across
cohorts using fixed-effect inverse-variance weighting meta-analy-
sis. SNPs were selected for replication if they met at least one of the
following two criteria: (1) POE P-value ,561026 or (2) POE P-
value ,561024 and within 500 kb of previously reported
imprinted regions according to the Catalogue of Parent of Origin
Effects database (http://igc.otago.ac.nz/home.html). At loci
which met either criteria, a lead SNP (with the strongest POE
association) was identified; other markers within 1 Mb or in LD
(r2.0.1) were excluded from further investigations. In total
2,673,768 HapMap imputed and genotyped SNPs were analysed,
SNPs in SLC2A10 and KCNK9 Exhibit Parent-of-Origin Effect on BMI
PLOS Genetics | www.plosgenetics.org 8 July 2014 | Volume 10 | Issue 7 | e1004508
of which 29,457 were considered as lying in imprinted regions,
criterion (2). Using the procedure of Gao et al. [33] we estimated
the effective number of tests considered by each criterion to be
,1,000,000 and 6,100 respectively, justifying the ,100 fold drop
in the P-value threshold applied to the second criterion.
Testing in family-based studiesWe tested our findings in family-based studies using a simplified
parental asymmetry test [34] (PAT). For each target SNP, in each
family we searched for trios (or parent-offspring pairs) with
heterozygous offspring and determined the parent of origin of the
alleles (whenever possible, i.e. at least one homozygous parent).
From each family at most one heterozygous offspring with known
parental origin was then collected and grouped according to the
parental origin of the alleles. Note that although POE is acting in
every genotype group, it can only be detected in the heterozygous
group.
As at the discovery phase, we used sex-, age- and age2-corrected
BMI residuals as phenotype. The equality of phenotypic means in
the two groups was tested using a Student t-test. When significant
differences were detected we also estimated the difference between
paternal and maternal effect sizes, which is simply the difference
between the phenotype averages in the paternal- and maternal-
groups.
Effect size estimationIn order to estimate paternal bP) and maternal (bM ) effect sizes
it is sufficient to know their mean (bMzbP)=2 and their difference
(bM{bP). The difference between paternal and maternal effect
alleles can also be derived from GWAS of unrelated individuals. It
is easy to see that the test statistic defined as
T~4 s2AB{
(nAA{1)s2AAz(nBB{1)s2
BB
nAAznBB{2
� �
gives an unbiased estimate of (bM{bP)2. Since Var(s2oo)~
s4oo
2
noo{1, the variance of T is &
1
nAB
z1
nAAznBB
. Therefore,
the absolute difference in paternal and maternal effects (DbM{bPD)can be estimated if the phenotypic variances in the three genotype
groups are known. However, these estimates will be strongly
subject to the winner’s curse [35], thus we used the family studies
to derive more reliable estimates of (bM{bP). To reduce the
effect of differences in the distribution of BMI between the family-
based studies, we meta-analysed the difference estimates
(bM{bP) from each study in order to obtain a combined estimate
of (bM{bP). The average of the maternal- and paternal effects,
(bMzbP)=2, is the association effect size using a simple additive
genetic model, which can be most accurately estimated from the
largest-to-date meta-analytic study on BMI [10] (including
,250,000 individuals).
Effect of phenotype transformation in case of marginalassociation
If there is an additive marginal genetic effect influencing the
trait certain transformations may inflate the phenotypic variance
of the heterozygous group. Let m be the phenotypic mean in the
heterozygous group and d the marginal effect of the SNP (on the
original scale). Let g(t) denote an S-shaped transformation
function of the form1
1zea(t{m)that is applied to the trait.
In the following we show that for any d value arbitrarily large
phenotypic variance inflation can be achieved in the heterozygous
group, compared to the two homozygous groups by an appropri-
ate parameter choice for a. Using a second order Taylor
expansion the variance of the transformed phenotype in the
heterozygous group can be estimated by
Var(g(yDG~AB))&g0(m)2s2
z1
4g00(m)½Var((yDG~AB)2){4m2s2�
If we assume the phenotype follows a Gaussian distribution
(yDG) then, Var((yDG~AB)2) simplifies to 4m2s2z2s4 and thus
Var(g(yDG~AB))&g0(m)2s2z1
2g00(m)2s4
Without loss of generality one can assume that s2~1. The
variance in AA genotype group can be estimated similarly and
thus
Var(g(yDG~AB)){Var(g(yDG~AA))
&½g0(m)2{g0(m{d)2�z 1
2½g00(m)2{g00(m{d)2�
Using the special form of g(t), the variance difference can be
expressed as
Var(g(yDG~AB)){Var(g(yDG~AA))
&a2 1
16{
e2ad
(1zead)4
� �{
a2
2
ead(1{ead)
(1zead)3
� �
~a2 1
16{
e2ad
(1zead)4{
ead(1{ead)
2(1zead)3
� �
~a2 1
16{f (a,d)
� �
and since g0(m{d)~g0(mzd) and g00(m{d)~{g00(mzd)
Var(g(yDG~AB)){Var(g(yDG~BB))
&Var(g(yDG~AB)){Var(g(yDG~AA)):
It is easy to see that for a fixed d
lima??
f (a,d)~0
As a??, f (a,d)?0 faster than a2??, thus for any effect size
d we can find a transformation function g such that the variance
inflation of the heterozygous group exceeds any arbitrary
threshold.
Cell lines, nucleic acids isolation, sequencing and qPCRLymphoblastoid cell lines were derived from peripheral blood
leukocytes of 95 members of 11 CEPH families [36] (#102, #884,
#1333, #1340, #1341, #1345, #1346, #1347, #1362, #1408,
#13292). They were purchased from the Coriell Cell Repository
SNPs in SLC2A10 and KCNK9 Exhibit Parent-of-Origin Effect on BMI
PLOS Genetics | www.plosgenetics.org 9 July 2014 | Volume 10 | Issue 7 | e1004508
(http://ccr.coriell.org/), and cultured as previously described [37].
DNA was extracted by using the QIAamp DNA Mini kit
(QIAGEN), and RNA by using the RNeasy Mini kit (QIAGEN),
according to the manufacturer’s instructions. Primer sequences
were designed to amplify a 328-bp region on chromosome 8 that
spans the rs2471083 polymorphism (forward primer: 59-ACCA-
CAGAAGTCAGTAGACGAG-39; reverse primer: 59- GTGA-
CATTGGGAGCATGGGA-39) and a 146-bp region on chromo-
some 20 that spans the rs3092611 polymorphism (forward primer:
59-GCCACCAGTGGTCTGATAGT-39; reverse primer: 59-
TAACTCGTCATTCTGCCCTGG -39). PCR amplification
was performed in a 25 ml reaction using GoTaq polymerase
(Promega). After purification of PCR products (ExoSAP-IT, USB),
sequencing reactions were carried out by using 1 ml of each of the
3.2 mM sequencing primers and 0.5 ml of BigDye Terminator v1.1
(Applied Biosystems). Following on-column purification (EdgeBio),
sequencing products were run on an ABI-3130 XLS sequencer
(Applied Biosystem). To synthesize cDNA, 2 mg of total RNA was
retrotranscribed using the Superscript III reverse transcriptase
(Invitrogen/Life Technologies) according to the manufacturer’s
instructions and a mix of random hexamers and oligo-dT that
facilitate the detection of poorly expressed genes. To validate
primers for qPCR, we first performed a series of test amplifications
by using a defined range of primer concentrations (50–200 nM).
We then loaded 10 ml of each qPCR product on 1% agarose gels
to check the specificity of the amplification product, which should
correspond to a 113-bp (KCNK9) and 148-bp (SLC2A10)
fragment. To test KCNK9 and SLC2A10 PCR efficiency a
standard curve made of five serial dilutions of brain and lung
cDNA were used, respectively, since the two genes are known to
be highly expressed in these organs. We obtained a standard curve
slope of 23.49 for KCNK9 and of 23.37 for SLC2A10,
corresponding to 94% and 98% PCR efficiency. For more details
see Supplemental Data S1.
Comparing Ct valuesThe output of the analysis was threshold cycles (Ct), i.e. the
number of cycles at which the fluorescent signal of the reaction
crosses a pre-determined threshold value. Since standard quanti-
fication methods (including normalization by housekeeping genes)
introduce a considerable amount of experimental noise for very
lowly expressed genes, raw Ct values were used to perform an
absolute quantification of KCNK9 and SLC2A10 transcripts. As
negative controls, housekeeping genes (HPRT1, GAPDH) were
also tested for parent-origin-effect to exclude the possibility that
the observed difference in KCNK9 and SLC2A10 expression
levels was due to the sample preparation process. Raw Ct values
were inverse-normal quantile transformed and a linear mixed
model was fitted (using the R function lmer) modelling the
technical replicates as random effects and parental origin as a fixed
effect.
Supporting Information
Figure S1 QQ-plot of the POE test P-values for SNPs in
imprinted regions (left) and for the whole genome (right).
(PNG)
Figure S2 Left hand side plots describe SNP-methylation
associations (mQTLs), where each point is a methylation probe.
X-axis represents their physical position and y-axis the 2log10
association P-value with the target SNP, whose location is
indicated by the dashed line. Note that rs3092611 was used as a
proxy for rs3091869 (r2 = 0.998). The corresponding QQ-plots
appear on the right hand side. Neighbouring methylation probes
are strongly correlated therefore expected P-values were computed
by estimating the effective number of tests For expected P-values
we computed the effective number of tests [33].
(PNG)
Figure S3 Left hand side plots describe methylation associations
with BMI in MZ twins. Each point is a methylation probe,
X-axis represents their physical position and y-axis the 2log10
association P-value with BMI. Location of the target SNP is
indicated by the dashed line. Note that rs3092611 was used as a
proxy for rs3091869 (r2 = 0.998). The corresponding QQ-plots
appear on the right hand side. Neighbouring methylation probes
are strongly correlated therefore expected P-values were computed
by estimating the effective number of tests For expected P-values
we computed the effective number of tests [33].
(PNG)
Figure S4 POE association results for previously reported
imprinted BMI linkage regions. Second dashed line corresponds
to the Benjamini-Hochberg 5% FDR threshold.
(PNG)
Figure S5 POE association P-value QQ-plot for the top 58
independent SNPs with marginal BMI-association P-value ,1025
in Speliotes et al. [10].
(PNG)
Table S1 Description of the BMI distribution in the participat-
ing cohorts.
(XLSX)
Table S2 Brief summary of the participating cohorts.
(XLSX)
Table S3 Information on the genotyping methods in the
participating cohorts.
(XLSX)
Table S4 Replication of the 6 discovery SNPs in family studies.
Extended version of Table 2.
(XLSX)
Table S5 Parental asymmetry test results for our 6 candidate
SNPs in adolescent population.
(XLSX)
Table S6 Analysis of the effect of gender- and age-correction
and phenotype transformations on the POE association results.
(XLSX)
Table S7 Genotyping results and parental allele determination
for members of the CEPH families.
(XLSX)
Table S8 Association results between methylation- and BMI-
differences among MZ twins of the TwinsUK study.
(XLSX)
Table S9 POE association P-values for the 32 SNPs associated
with BMI in the largest-to-date meta-analysis [10].
(XLSX)
Table S10 POE association P-values for the top 58 independent
SNPs with BMI-association P-value ,1025 in the largest-to-date
meta-analysis [10].
(XLSX)
Data S1 Supporting information contain text on the expression-
and methylation analysis, the effective sample size derivation in
mother-offspring vs trio studies, POE look-ups for SNPs with
marginal BMI association, study descriptions and acknowledgements.
(DOCX)
SNPs in SLC2A10 and KCNK9 Exhibit Parent-of-Origin Effect on BMI
PLOS Genetics | www.plosgenetics.org 10 July 2014 | Volume 10 | Issue 7 | e1004508

Acknowledgments
A full list of acknowledgments can be found in the Supporting Information.
We would like to thank Rosanna Pescini-Gobert, for help with the qPCR
experiments establishing KCNK9 and SLC2A10 expressions. Special
thanks to Gerard Weber, Vincent Mooser and Martin Preisig for their kind
contribution on behalf of the CoLaus study.
Members of the Scientific Board of the LifeLines CohortStudy
P de Bakker, U Bultmann, M Geleijnse, P v.d. Harst, G Koppelman, J
G.M. Rosmalen, L van Rossum, H Smidt, M A. Swertz, R P. Stolk
Collaborators: Alizadeh B, de Boer R, Boezen HM, Bruinenberg M,
Franke L, van der Harst P, Hillege H, van der Klauw M, Navis G, Ormel
J, Postma D, Rosmalen J, Slaets J, Snieder H, Stolk R, Wolffenbuttel B,
Wijmenga C.
Members of the Scientific Committee of the GenerationScotland Study
Jonathan Berg, Douglas Blackwood, Harry Campbell, Jonathan
Cavanagh, John Connell, Mike Connor, Sarah Cunningham-Burley, Ian
Deary, Anna Dominiczak, Paul Ellis, Bridie FitzPatrick, Ian Ford, Rena
Gertz, Antonio Grau, Gill Haddow, Cathy Jackson, Shona Kerr, Robbie
Lindsay, Mark McGilchrist, Donald McIntyre, Andrew Morris, Robin
Morton, Walter Muir, Graeme Murray, Colin Palmer, Jill Pell, Alastair
Philp, David Porteous, Mary Porteous, Rob Procter, Stuart Ralston, David
Reid, Richard Sinnott, Blair Smith, David St Clair, Frank Sullivan, Mary
Sweetland, Jenny Ure, Graham Watt, Roland Wolf, Alan Wright
Members of the Genetic Investigation of ANthropometricTraits (GIANT) Consortium
Sonja I. Berndt, Stefan Gustafsson, Reedik Magi, Andrea Ganna,
Eleanor Wheeler, Mary F. Feitosa, Anne E. Justice, Keri L. Monda,
Damien C. Croteau- Chonka, Felix R. Day, Tonu Esko, Tove Fall, Teresa
Ferreira, Davide Gentilini, Anne U. Jackson, Jian’an Luan, Joshua C.
Randall, Sailaja Vedantam, Cristen J. Willer, Thomas W. Winkler,
Andrew R. Wood, Tsegaselassie Workalemahu, Yi-Juan Hu, Sang Hong
Lee, Liming Liang, Dan-Yu Lin, Josine L. Min, Benjamin M. Neale,
Gudmar Thorleifsson, Jian Yang, Eva Albrecht, Najaf Amin, Jennifer L.
Bragg-Gresham, Gemma Cadby, Martin den Heijer, Niina Eklund, Krista
Fischer, Anuj Goel, Jouke-Jan Hottenga, Jennifer E. Huffman, Ivonne
Jarick, Asa Johansson, Toby Johnson, Stavroula Kanoni, Marcus E.
Kleber, Inke R. Konig, Kati Kristiansson, Zoltan Kutalik, Claudia
Lamina, Cecile Lecoeur, Guo Li, Massimo Mangino, Wendy L. McArdle,
Carolina Medina-Gomez, Martina Muller-Nurasyid, Julius S. Ngwa, Ilja
M. Nolte, Lavinia Paternoster, Sonali Pechlivanis, Markus Perola,
Marjolein J. Peters, Michael Preuss, Lynda M. Rose, Jianxin Shi, Dmitry
Shungin, Albert Vernon Smith, Rona J. Strawbridge, Ida Surakka,
Alexander Teumer, Mieke D. Trip, Jonathan Tyrer, Jana V. Van Vliet-
Ostaptchouk, Liesbeth Vandenput, Lindsay L. Waite, Jing Hua Zhao,
Devin Absher, Folkert W. Asselbergs, Mustafa Atalay, Antony P. Attwood,
Anthony J. Balmforth, Hanneke Basart, John Beilby, Lori L. Bonnycastle,
Paolo Brambilla, Marcel Bruinenberg, Harry Campbell, Daniel I. Chas-
man, Peter S. Chines, Francis S. Collins, John M. Connell, William
Cookson, Ulf de Faire, Femmie de Vegt, Mariano Dei, Maria Dimitriou,
Sarah Edkins, Karol Estrada, David M. Evans, Martin Farrall, Marco M.
Ferrario, Jean Ferrieres, Lude Franke, Francesca Frau, Pablo V. Gejman,
Harald Grallert, Henrik Gronberg, Vilmundur Gudnason, Alistair S. Hall,
Per Hall, Anna-Liisa Hartikainen, Caroline Hayward, Nancy L. Heard-
Costa, Andrew C. Heath, Johannes Hebebrand, Georg Homuth, Frank B.
Hu, Sarah E. Hunt, Elina Hypponen, Carlos Iribarren, Kevin B. Jacobs,
John-Olov Jansson, Antti Jula, Mika Kahonen, Sekar Kathiresan, Frank
Kee, Kay-Tee Khaw, Mika Kivimaki, Wolfgang Koenig, Aldi T. Kraja,
Meena Kumari, KariKuulasmaa, Johanna Kuusisto, Jaana H. Laitinen,
Timo A. Lakka, Claudia Langenberg, Lenore J. Launer, Lars Lind, Jaana
Lindstrom, Jianjun Liu, Antonio Liuzzi, Marja-Liisa Lokki, Mattias
Lorentzon, Pamela A. Madden,Patrik K. Magnusson, Paolo Manunta,
Diana Marek, Winfried Marz, Irene Mateo Leach, Barbara McKnight,
Sarah E. Medland, Evelin Mihailov, Lili Milani, Grant W. Montgomery,
Vincent Mooser, Thomas W. Muhleisen, Patricia B. Munroe, Arthur W.
Musk, Narisu Narisu, Gerjan Navis, George Nicholson, Ellen A. Nohr,
Ken K. Ong, Ben A. Oostra, Colin N.A. Palmer, Aarno Palotie, John F.
Peden, Nancy Pedersen, Annette Peters, Ozren Polasek, Anneli Pouta,
Peter P. Pramstaller, Inga Prokopenko, Carolin Putter, Aparna Radhak-
rishnan, Olli Raitakari, Augusto Rendon, Fernando Rivadeneira, Igor
Rudan, Timo E. Saaristo, Jennifer G. Sambrook, Alan R. Sanders, Serena
Sanna, Jouko Saramies, Sabine Schipf, Stefan Schreiber, Heribert
Schunkert, So-Youn Shin, Stefano Signorini, Juha Sinisalo, Boris Skrobek,
Nicole Soranzo, Alena Stancakova, Klaus Stark, Jonathan C. Stephens,
Kathleen Stirrups, Ronald P. Stolk, Michael Stumvoll, Amy J. Swift, Eirini
V. Theodoraki, Barbara Thorand, David-Alexandre Tregouet, Elena
Tremoli, Melanie M. Van der Klauw, Joyce B.J. van Meurs, Sita H.
Vermeulen, Jorma Viikari, Jarmo Virtamo, Veronique Vitart, Gerard
Waeber, Zhaoming Wang, Elisabeth Widen, Sarah H. Wild, Gonneke
Willemsen, Bernhard R. Winkelmann, Jacqueline C.M. Witteman, Bruce
H.R. Wolffenbuttel, Andrew Wong, Alan F. Wright, M. Carola Zillikens,
Philippe Amouyel, Bernhard O. Boehm, Eric Boerwinkle, Dorret I.
Boomsma, Mark J. Caulfield, Stephen J. Chanock, L. Adrienne Cupples,
Daniele Cusi, George V. Dedoussis, Jeanette Erdmann, Johan G. Eriksson,
Paul W. Franks, Philippe Froguel, Christian Gieger, Ulf Gyllensten, Anders
Hamsten, Tamara B. Harris, Christian Hengstenberg, Andrew A. Hicks,
Aroon Hingorani, Anke Hinney, Albert Hofman, Kees G. Hovingh,
Kristian Hveem, Thomas Illig, Marjo-Riitta Jarvelin, Karl-Heinz Jockel,
Sirkka M. Keinanen-Kiukaanniemi, Lambertus A. Kiemeney, Diana Kuh,
Markku Laakso, Terho Lehtimaki, Douglas F. Levinson, Nicholas G.
Martin, Andres Metspalu, Andrew D. Morris, Markku S. Nieminen, Inger
Njølstad, Claes Ohlsson, Albertine J. Oldehinkel, Willem H. Ouwehand,
Lyle J. Palmer, Brenda Penninx, Chris Power, Michael A. Province, Bruce
M. Psaty, Lu Qi, Rainer Rauramaa, Paul M. Ridker, Samuli Ripatti,
Veikko Salomaa, Nilesh J. Samani, Harold Snieder, Thorkild I.A.
Sørensen, Timothy D. Spector, Kari Stefansson, Anke Tonjes, Jaakko
Tuomilehto, Andre G. Uitterlinden, Matti Uusitupa, Pim van der Harst,
Peter Vollenweider, Henri Wallaschofski, Nicholas J. Wareham, Hugh
Watkins, H.-Erich Wichmann, James F.Wilson, Goncalo R. Abecasis,
Themistocles L. Assimes, Ines Barroso, Michael Boehnke, Ingrid B.
Borecki, Panos Deloukas, Caroline S. Fox, Timothy Frayling, Leif C.
Groop, Talin Haritunian, Iris M. Heid, David Hunter, Robert C. Kaplan,
Fredrik Karpe, MiriamMoffatt, Karen L. Mohlke, Jeffrey R. O’Connell,
Yudi Pawitan, Eric E. Schadt, David Schlessinger, Valgerdur Steinthors-
dottir, David P. Strachan, Unnur Thorsteinsdottir, Cornelia M. van Duijn,
Peter M. Visscher, Anna Maria Di Blasio, Joel N. Hirschhorn, Cecilia M.
Lindgren, Andrew P. Morris, David Meyre, Andre Scherag, Mark I.
McCarthy, Elizabeth K. Speliotes, Kari E. North, Ruth J.F. Loos, Erik
Ingelsson
Author Contributions
Conceived and designed the experiments: CJH JCC NJW JSK JNH CR
RJFL ZK. Performed the experiments: GV GA GBE BB JCC JSK.
Analyzed the data: CJH GV MM FG JHZ AT TWW NT JL EM GBE
WZ DL TE AMa SR PYB BB DME CH MFL LF AR SV GF SG JPK
GM SB MT MBo IBB VR JNH CR ZK. Contributed reagents/materials/
analysis tools: GBE MBa YD CH ES DEA EB JCC HG GH JEH DP DM
AI GJL VA MHH NGM RPA JS FN COS RAS HV WY JTB AC JSK AP
HW JBW MT NDH DC TMF GDS IBB CR IMH HG JH GWM TDS
KS NJW FP PV JSB AMe MRJ AS RJFL. Wrote the paper: CJH FG ZK.
References
1. Kong A, Steinthorsdottir V, Masson G, Thorleifsson G, Sulem P, et al. (2009)
Parental origin of sequence variants associated with complex diseases. Nature
462: 868–874.
2. Rampersaud E, Mitchell BD, Naj AC, Pollin TI (2008) Investigating parent of
origin effects in studies of type 2 diabetes and obesity. Curr Diabetes Rev 4: 329–
339.
3. Lawson HA, Cheverud JM, Wolf JB (2013) Genomic imprinting and parent-of-
origin effects on complex traits. Nat Rev Genet 14: 609–617.
4. Guilmatre A, Sharp AJ (2012) Parent of origin effects. Clin Genet 81: 201–209.
5. Dong C, Li WD, Geller F, Lei L, Li D, et al. (2005) Possible genomic imprinting
of three human obesity-related genetic loci. Am J Hum Genet 76: 427–437.
6. Lindsay RS, Kobes S, Knowler WC, Bennett PH, Hanson RL (2001) Genome-
wide linkage analysis assessing parent-of-origin effects in the inheritance of type 2
diabetes and BMI in Pima Indians. Diabetes 50: 2850–2857.
7. Paterson AD, Petronis A (1999) Sex-based linkage analysis of alcoholism. Genet
Epidemiol 17 Suppl 1: S289–294.
8. Wyszynski DF, Panhuysen CI (1999) Parental sex effect in families with
alcoholism. Genet Epidemiol 17 Suppl 1: S409–413.
SNPs in SLC2A10 and KCNK9 Exhibit Parent-of-Origin Effect on BMI
PLOS Genetics | www.plosgenetics.org 11 July 2014 | Volume 10 | Issue 7 | e1004508
9. Strauch K, Furst R, Ruschendorf F, Windemuth C, Dietter J, et al. (2005)
Linkage analysis of alcohol dependence using MOD scores. BMC Genet 6 Suppl1: S162.
10. Speliotes EK, Willer CJ, Berndt SI, Monda KL, Thorleifsson G, et al. (2010)
Association analyses of 249,796 individuals reveal 18 new loci associated withbody mass index. Nat Genet 42: 937–948.
11. Barel O, Shalev SA, Ofir R, Cohen A, Zlotogora J, et al. (2008) Maternallyinherited Birk Barel mental retardation dysmorphism syndrome caused by a
mutation in the genomically imprinted potassium channel KCNK9. Am J Hum
Genet 83: 193–199.12. Qi L, Menzaghi C, Salvemini L, De Bonis C, Trischitta V, et al. (2011) Novel
locus FER is associated with serum HMW adiponectin levels. Diabetes 60:2197–2201.
13. Jung J, Barrett PQ, Eckert GJ, Edenberg HJ, Xuei X, et al. (2012) Variations inthe potassium channel genes KCNK3 and KCNK9 in relation to blood pressure
and aldosterone production: an exploratory study. J Clin Endocrinol Metab 97:
E2160–2167.14. Pang DS, Robledo CJ, Carr DR, Gent TC, Vyssotski AL, et al. (2009) An
unexpected role for TASK-3 potassium channels in network oscillations withimplications for sleep mechanisms and anesthetic action. Proc Natl Acad
Sci U S A 106: 17546–17551.
15. Linden AM, Sandu C, Aller MI, Vekovischeva OY, Rosenberg PH, et al. (2007)TASK-3 knockout mice exhibit exaggerated nocturnal activity, impairments in
cognitive functions, and reduced sensitivity to inhalation anesthetics. J Pharma-col Exp Ther 323: 924–934.
16. Lowe JK, Maller JB, Pe’er I, Neale BM, Salit J, et al. (2009) Genome-wideassociation studies in an isolated founder population from the Pacific Island of
Kosrae. PLoS Genet 5: e1000365.
17. Jarick I, Vogel CI, Scherag S, Schafer H, Hebebrand J, et al. (2011) Novelcommon copy number variation for early onset extreme obesity on chromosome
11q11 identified by a genome-wide analysis. Hum Mol Genet 20: 840–852.18. Morcos L, Ge B, Koka V, Lam KC, Pokholok DK, et al. (2011) Genome-wide
assessment of imprinted expression in human cells. Genome Biol 12: R25.
19. Pollard KS, Serre D, Wang X, Tao H, Grundberg E, et al. (2008) A genome-wide approach to identifying novel-imprinted genes. Hum Genet 122: 625–634.
20. Wermter AK, Scherag A, Meyre D, Reichwald K, Durand E, et al. (2008)Preferential reciprocal transfer of paternal/maternal DLK1 alleles to obese
children: first evidence of polar overdominance in humans. Eur J Hum Genet16: 1126–1134.
21. Heid IM, Jackson AU, Randall JC, Winkler TW, Qi L, et al. (2010) Meta-
analysis identifies 13 new loci associated with waist-hip ratio and reveals sexualdimorphism in the genetic basis of fat distribution. Nat Genet 42: 949–960.
22. Cui Y, Lu Q, Cheverud JM, Littell RC, Wu R (2006) Model for mappingimprinted quantitative trait loci in an inbred F2 design. Genomics 87: 543–551.
23. Yang J, Loos RJ, Powell JE, Medland SE, Speliotes EK, et al. (2012) FTO
genotype is associated with phenotypic variability of body mass index. Nature.
24. Sun X, Elston R, Morris N, Zhu X (2013) What Is the Significance of Difference
in Phenotypic Variability across SNP Genotypes? Am J Hum Genet 93: 390–
397.
25. Shen X, Pettersson M, Ronnegard L, Carlborg O (2012) Inheritance beyond
plain heritability: variance-controlling genes in Arabidopsis thaliana. PLoS
Genet 8: e1002839.
26. Shibata K, Diatchenko L, Zaykin DV (2009) Haplotype associations with
quantitative traits in the presence of complex multilocus and heterogeneous
effects. Genet Epidemiol 33: 63–78.
27. Guo YF, Shen H, Liu YJ, Wang W, Xiong DH, et al. (2006) Assessment of
genetic linkage and parent-of-origin effects on obesity. J Clin Endocrinol Metab
91: 4001–4005.
28. Davey Smith G, Steer C, Leary S, Ness A (2007) Is there an intrauterine
influence on obesity? Evidence from parent child associations in the Avon
Longitudinal Study of Parents and Children (ALSPAC). Arch Dis Child 92:
876–880.
29. Patro B, Liber A, Zalewski B, Poston L, Szajewska H, et al. (2013) Maternal and
paternal body mass index and offspring obesity: a systematic review. Ann Nutr
Metab 63: 32–41.
30. Linabery AM, Nahhas RW, Johnson W, Choh AC, Towne B, et al. (2013)
Stronger influence of maternal than paternal obesity on infant and early
childhood body mass index: the Fels Longitudinal Study. Pediatr Obes 8: 159–
169.
31. Gastwirth JL, Gel YL, Miao W (2009) The Impact of Levene’s Test of Equality
of Variances on Statistical Theory and Practice. Statistical Science 24: 343–360.
32. Ramsey PH (1994) Testing Variances in Psychological and Educational-
Research. J Educ Stat 19: 23–42.
33. Gao X, Starmer J, Martin ER (2008) A multiple testing correction method for
genetic association studies using correlated single nucleotide polymorphisms.
Genet Epidemiol 32: 361–369.
34. He F, Zhou JY, Hu YQ, Sun F, Yang J, et al. (2011) Detection of parent-of-
origin effects for quantitative traits in complete and incomplete nuclear families
with multiple children. Am J Epidemiol 174: 226–233.
35. Zollner S, Pritchard JK (2007) Overcoming the winner’s curse: estimating
penetrance parameters from case-control data. Am J Hum Genet 80: 605–615.
36. Prescott SM, Lalouel JM, Leppert M (2008) From linkage maps to quantitative
trait loci: the history and science of the Utah genetic reference project. Annu
Rev Genomics Hum Genet 9: 347–358.
37. Rio Frio T, Civic N, Ransijn A, Beckmann JS, Rivolta C (2008) Two trans-
acting eQTLs modulate the penetrance of PRPF31 mutations. Hum Mol Genet
17: 3154–3165.
SNPs in SLC2A10 and KCNK9 Exhibit Parent-of-Origin Effect on BMI
PLOS Genetics | www.plosgenetics.org 12 July 2014 | Volume 10 | Issue 7 | e1004508


![김동환 2009암학회워크샵.ppt [호환 모드]•Basic concepts of SNPs •Applications of SNPs into cancer research ... 21 SNPs a/w antileukemic drug disposition-> 63 SNPs a/w](https://img.pdfslide.net/doc/110x75/601ede878cebc154024e5352/ee-2009oeoefppt-eeoe-abasic-concepts-of-snps-aapplications.jpg)