Embed Size (px)
Citation preview

NOVEL APPROACHES TO TOXICITY TESTING
IN DAPHNIA MAGNA
by
NADINE SUZANNE TAYLOR
A thesis submitted to
The University of Birmingham
for the degree of
DOCTOR OF PHILOSOPHY
School of Biosciences
The University of Birmingham
March 2010

University of Birmingham Research Archive
e-theses repository This unpublished thesis/dissertation is copyright of the author and/or third parties. The intellectual property rights of the author or third parties in respect of this work are as defined by The Copyright Designs and Patents Act 1988 or as modified by any successor legislation. Any use made of information contained in this thesis/dissertation must be in accordance with that legislation and must be properly acknowledged. Further distribution or reproduction in any format is prohibited without the permission of the copyright holder.

i
Abstract
Current regulatory risk assessment strategies have several limitations, such as linking
subcellular changes to higher-level biological effects, and an improved knowledge-based
approach is needed. Ecotoxicogenomic techniques have been proposed as having the
potential to overcome the current limitations, providing greater mechanistic information for
ecotoxicological testing. In this thesis, metabolomics is explored as a novel method for
toxicity testing using Daphnia magna. Initially I evaluated the potential application of Fourier
transform ion cyclotron resonance mass spectrometry (FT-ICR MS) based metabolomics for
use in regulatory toxicity testing. Subsequently, I aimed to use this approach to discriminate
between toxicant modes of action (MOA) and to link toxicant induced metabolic effects to
reduced reproductive output in D. magna. FT-ICR MS metabolomics was determined to be a
feasible approach for toxicity testing of both whole-organism homogenates and haemolymph
of D. magna. It is capable of discriminating between life-stages of D. magna as well as
determining toxicant-induced metabolic effects. Highly predictive multivariate classification
models were capable of significantly discriminating between four different toxicant MOAs;
achievable in both haemolymph and whole-organism extracts, with the latter being the more
information-rich sample type. Multivariate regression models were predictive of reduced
reproductive output in D. magna following toxicant exposure, and determined that a
metabolic biomarker signature was significantly able to predict the reproductive output of D.
magna. Ultimately this research has concluded that an FT-ICR MS metabolomics approach for
use in regulatory toxicity testing using Daphnia magna is both viable and can provide
valuable information.

ii
Acknowledgements
I would like to thank my supervisor, Dr Mark Viant, for all his help and unwavering
enthusiasm throughout my PhD. I also extend my thanks to all members of the Viant
research group for their varied input, advice and guidance with my research. I offer my
thanks to the Natural Environment Research Council for funding this PhD and the Stress
Biology and Ecotoxicology Research Group at Reading University for their advice on Daphnia
and providing the animals to initiate our culture at Birmingham.
In addition I’d like to thank specific members of the 4th
floor, Huw, Rhiannon, Rachael, Leda
and Chib for the many tea breaks and social events that continually made me smile.
Particular thanks go to Rhiannon for all her help in starting the Daphnia culture, helping to
keep the little critters alive and for keeping me calm!
Finally, to my Mum, Dad and Leon for your continual support, tireless encouragement and
your absolute belief in me; thank you.
iii
CHAPTER ONE: General Introduction ………………………………………………………………………. 1
1.1 Introduction ……………………………………………………………………………………………………… 2
1.2 Ecotoxicology and selection of test species ………………………………………………………. 3
1.2.1 Current approaches in regulatory ecotoxicological testing…………………….. 4
1.2.2 Limitations of current strategies …………………………………………………………… 9
1.3 The potential of omics in regulatory ecotoxicological testing ……………………………. 11
1.4 Metabolomics …………………………………………………………………………………………………… 13
1.4.1 Metabolomics in ecotoxicology …………………………………………………………….. 14
1.5 Daphnia magna ………………………………………………………………………………………………… 21
1.5.1 Daphnia magna and regulatory toxicity testing ……………………………………. 25
1.5.2 Daphnia magna and ecotoxicogenomics ………..…………………………………….. 25
1.6 Metabolomics analysis platforms ……………………………………………………………………… 27
1.6.1 NMR spectroscopy ………………………………………………………………………………… 30
1.6.2 Mass spectrometry ……………………………………………………………………………….. 31
1.6.3 FT-ICR MS ……………………………………………………………………………………………… 33
1.7 Metabolomics data analysis ……………………………………………………………………………… 35
1.8 Research aims …………………………………………………………………………………………………… 39
CHAPTER TWO: Materials and Methods ………………………………………………………………….. 40
2.1 Culturing of Daphnia magna …………………………………………………………………………….. 41
2.1.1 Preparation of nutritional supplement Marinure …………………………………. 41
2.1.2 Culture of Chlorella vulgaris algal stock ………………………………………………… 42
2.1.3 Preparation of Chlorella vulgaris algal feed ………………………………………….. 42
2.1.4 Preparation of Baker’s Yeast …………………………………………………………………. 43
2.2 Toxicity exposures and animal capture ……………………………………………………………… 45
2.3 Metabolite extraction ……………………………………………………………………………………….. 45
2.3.1 Whole organism homogenates ……………………………………………………………… 45
2.3.2 Haemolymph ………………………………………………………………………………………… 46
2.4 FT-ICR mass spectrometry ………………………………………………………………………………… 47
2.5 Data pre-processing ………………………………………………………………………………………….. 48
2.6 Putative identification of empirical formulae and metabolites …………………………. 54
2.7 Statistical analysis …………………………………………………………………………………………….. 55
2.7.1 Multivariate statistics ……………………………………………………………………………. 55
2.7.2 Univariate Statistics ………………………………………………………………………………. 57
CHAPTER THREE: Optimisation and validation of FT-ICR MS based metabolomics
using whole organism homogenates of Daphnia magna ………………………………………….
58
3.1 Introduction ……………………………………………………………………………………………………… 59
3.2 Materials and Methods …………………………………………………………………………………….. 60
3.2.1 Biomass optimisation study ………………………………………………………………….. 60
3.2.2 Copper toxicity testing ………………………………………………………………………….. 61

iv
3.2.3 Metabolite extraction and FT-ICR mass spectrometry …………………………… 61
3.2.4 Data processing and peak identification ……………………………………………….. 62
3.2.5 Statistical analysis …………………………………………………………………….............. 62
3.3 Results and Discussion ……………………………………………………………………………………… 63
3.3.1 Biomass optimisation study ………………………………………………………………….. 63
3.3.2 Acute copper range-finding study …………………………………………………………. 69
3.3.3 Acute copper toxicity metabolomics study …………………………………………… 71
3.3.4 Identification of empirical formulae and metabolites …………………………… 82
3.3.5 Biochemical interpretation …………………………………………………………………… 88
3.3.6 Applicability of SIM-stitching DI FT-ICR for metabolomics …………………….. 90
3.4 Conclusion ………………………………………………………………………………………………………… 92
CHAPTER FOUR: Optimisation and validation of FT-ICR MS based metabolomics
using Daphnia magna haemolymph …………………………………………………………………………
94
4.1 Introduction ……………………………………………………………………………………………………… 95
4.2 Materials and Methods …………………………………………………………………………………….. 96
4.2.1 Daphnia magna exposures and haemolymph extraction ………………………. 96
4.2.2 FT-ICR MS metabolomics ………………………………………………………………………. 97
4.2.2.1 Initial haemolymph study ………………………………………………………. 97
4.2.2.2 Cadmium toxicity study ………………………………………………………….. 97
4.2.3 Transcriptomics ……………………………………………………………………………………. 98
4.3 Results and Discussion ……………………………………………………………………………………… 99
4.3.1 Initial metabolomics study ……………………………………………………………………. 99
4.3.2 Metabolomics cadmium toxicity study …………………………………………………. 102
4.3.3 Key findings from transcriptomic cadmium toxicity study …………………….. 109
4.3.4 Relevance of findings to cadmium toxicity ……………………………………………. 109
4.4 Conclusion ………………………………………………………………………………………………………… 113
CHAPTER FIVE: Discriminating toxicant modes of action via changes in the daphnid
metabolome ……………………………………………………………………………………………………………
114
5.1 Introduction ……………………………………………………………………………………………………… 115
5.2 Materials and Methods …………………………………………………………………………………….. 116
5.2.1 Optimisation of FT-ICR MS analysis of individual daphnid haemolymph .. 116
5.2.2 Determination of sub-lethal concentrations …………………………………………. 117
5.2.3 Adult Daphnia magna acute toxicity studies …………………………………………. 117
5.2.4 Animal capture and metabolite extraction ……………………………………………. 118
5.2.5 FT-ICR MS, data processing and metabolite identification ……………………. 119
5.2.6 Statistical analysis …………………………………………………………………………………. 120
5.3 Results and Discussion ……………………………………………………………………………………… 121
5.3.1 Optimisation of FT-ICR MS analysis of individual daphnid haemolymph .. 121
5.3.2 Determination of sublethal concentrations ………………………………………….. 122

v
5.3.3 Effects of individual toxicants on whole organism and haemolymph
metabolomes ………………………………………………………………………………………..
124
5.3.4 Multivariate models for discriminating toxicant modes of action …………. 132
5.3.5 Whole organism metabolome provides more discriminatory predictive
models …………………………………………………………………………………………………..
137
5.4 Conclusion ………………………………………………………………………………………………………… 139
CHAPTER SIX: Discovering metabolic markers that are predictive of reduced
reproductive output in Daphnia magna
140
6.1 Introduction ……………………………………………………………………………………………………… 141
6.2 Materials and Methods …………………………………………………………………………………….. 143
6.2.1 Determination of sub-lethal concentrations …………………………………………. 143
6.2.2 Daphnia magna chronic exposures ………………………………………………………. 143
6.2.3 Metabolite extraction, FT-ICR MS, data processing and putative peak
identification …………………………………………………………………………………………
144
6.2.4 Statistical analysis …………………………………………………………………………………. 145
6.3 Results and Discussion ……………………………………………………………………………………… 147
6.3.1 Chronic toxicant exposures of Daphnia magna …………………………………….. 147
6.3.2 Metabolic effects of toxicant exposure …………………………………………………. 148
6.3.3 Effects of chronic toxicant exposure on the reproductive output of D.
magna …………………………………………………………………………………………………..
151
6.3.4 Development of predictive multivariate models …………………………………… 154
6.3.4.1 Development of optimal predictive models using each toxicant 156
6.3.5 Discovery of biomarkers predictive of reduced reproductive output in D.
magna …………………………………………………………………………………………………..
161
6.3.5.1 Potential biomarker of reduced reproductive output in D.
magna …………………………………………………………………………………….
166
6.4 Conclusion ………………………………………………………………………………………………………… 168
CHAPTER SEVEN: Final Conclusions and Future Work ………………………………………………. 169
7.1 The feasibility of FT-ICR MS-based metabolomics for toxicity testing using
Daphnia magna …………………………………………………………………………………………………
170
7.2 The FT-ICR MS-based metabolomics approach using Daphnia magna
haemolymph ……………………..………………………………………………………………………………
172
7.3 The discrimination of toxicant MOA via changes in the daphnid metabolome ….. 174
7.4 The discovery of metabolic markers which are predictive of reduced
reproductive output in Daphnia magna …………………………………………………………….
177
7.5 Future work ………………………………………………………………………………………………………. 180
7.6 Final conclusions ………………………………………………………………………………………………. 182
CHAPTER EIGHT: References ……………………………………………………………………………………. 184
CHAPTER NINE: Appendix ……………………………………………………………………………………….. 207

vi
List of Figures
Page
Figure 1.1 Images of (a) an adult female daphnid and (b) neonates
23
Figure 1.2 Graphical representation of parthenogenetic reproductive lifecycle of
Daphnia magna
24
Figure 1.3 The trade-off between analytical platforms and the objectives of
metabolomics
28
Figure 3.1 Representative FT-ICR mass spectra of whole-organism extracts of 30 D.
magna neonates in (a) positive ion and (b) negative ion mode
64
Figure 3.2 Summary of peaks detected in biomass optimisation study; (a)
graphical depiction of unique and overlapping peaks and (b) total
number of peaks detected with associated technical variability
66
Figure 3.3 PCA scores plot of D. magna biomass optimisation study
68
Figure 3.4 Dose-mortality relationship from an acute waterborne copper exposure
of D. magna neonates
70
Figure 3.5 PCA scores plots of (a) negative ion and (b) positive ion data of D.
magna neonate copper toxicity study
73
Figure 3.6 PLS-DA scores plots of (a) negative ion and (b) positive ion data of D.
magna neonate copper toxicity study
75
Figure 4.1 Representative FT-ICR mass spectra of pooled haemolymph extracts of
3 D. magna adults in negative ion mode
100
Figure 4.2 Graphical depiction of the peaks detected in an FT-ICR mass spectrum
of pooled D. magna haemolymph extracts
101
Figure 4.3 PCA scores plot from cadmium toxicity study of D. magna haemolymph
103
Figure 4.4 Section (m/z 265-295) of a representative negative ion FT-ICR spectrum
of D. magna pooled haemolymph; highlighting putatively identified
signals from inosine, uridine and palmitic acid
108
Figure 4.5 Summary model of sub-lethal cadmium toxicity in D. magna
110

vii
Figure 5.1
PCA scores plots from analysis of FT-ICR mass spectra of D. magna (a)
haemolymph and (b) whole organism homogenates following Cd
exposure, (c) haemolymph and (d) whole organism homogenates
following DNP exposure, (e) haemolymph and (f) whole organism
homogenates following fenvalerate exposure, and (g) haemolymph and
(h) whole organism homogenates following propranolol exposure.
127
Figure 5.2
PLS-DA scores plots depicting LV1 against LV2 for (a) haemolymph and
(b) whole organism homogenates, and LV2 against LV3 for (c)
haemolymph and (d) whole organism homogenates of D. magna
exposed to each of four toxicants.
134
Figure 6.1 PCA scores plot from analysis of the negative ion FT-ICR mass spectra
from the D. magna chronic studies following exposure to (a) Cd, (b)
DNP and (c) Propranolol
150
Figure 6.2 Bar charts of the reproductive output of individual D. magna following
21 d exposure to (a) Cd, (b) DNP and (c) Propranolol
153
Figure 6.3 Correlation between measured and predicted reproductive output for
individual daphnids, the latter derived from a PLS-R model and the
metabolic signatures of individual daphnids following exposure to (a)
Cd, (b) DNP and (c) propranolol
155
Figure 6.4 Plots of the ranked absolute regression vectors generated from the
building of PLS-R models using metabolic and reproductive output data
from individual D. magna following 21 d exposure to (a) Cd, (b) DNP
and (c) Propranolol
158
Figure 6.5 Plots of the R2 values of increasing numbers of peaks (ranked by
absolute regression vector) incorporated into the building of PLS-R
models using metabolic and reproductive output data from individual
D. magna following a 21 d exposure to (a) Cd, (b) DNP and (c)
Propranolol
159
Figure 6.6 Correlation between measured and predicted reproductive output for
individual daphnids, the latter derived from an optimal PLS-R model
and the metabolic signatures of individual daphnids following exposure
to (a) Cd, (b) DNP and (c) propranolol
160
Figure 6.7 Venn diagrams depicting the common peaks from (a) the optimal PLS-R
models of individual daphnids following exposure to Cd, DNP and
propranolol and (b) the mean of 3 random permutations of the same
data
163

viii
List of Tables
Page
Table 1.1 Summary of the OECD guidelines for toxicity testing in aquatic
environments
7
Table 1.2 Summary of previously reported studies utilising metablomics
approaches in aquatic organisms
17
Table 2.1 Composition of media for culturing D. magna
43
Table 2.2 Composition of Bolds Basal Medium for culturing C. vulgaris
44
Table 2.3 Table of peaks used to calibrate negative ion spectra of D. magna
haemolymph samples
51
Table 2.4 Table of peaks used to calibrate the positive and negative ion spectra of
D. magna whole-organism homogenate samples
52
Table 3.1 Summary of the total number of peaks in the positive and negative ion
datasets of D. magna neonates exposed to copper
71
Table 3.2 Summary of the top weighted peaks following PLS-DA of both positive
and negative ion analyses of D. magna neonates exposed to copper
77
Table 3.3 Comparison of the PLS weightings and PCA loadings from the
multivariate analyses of the D. magna neonate copper toxicity study;
(a) negative ion and (b) positive ion data
80
Table 3.4 Summary of significantly changing amino acids and indicators of
oxidative stress in D. magna neonates exposed to copper
85
Table 4.1 Summary of the total number of peaks in the dataset from pooled D.
magna haemolymph extracts exposed to cadmium
102
Table 4.2 Summary of peaks detected in pooled D. magna haemolymph samples
that change significantly upon cadmium exposure
105
Table 5.1 Results from 24 hr D. magna neonate acute toxicity study summarising
the mean mortality rate for each nominal concentration
123
Table 5.2 Calculated LC50 values from 24 hr neonate exposures using PROBIT
analysis
124

ix
Table 5.3 Peaks identified in the FT-ICR mass spectra that directly related to
parent toxicants. These were subsequently removed from the
metabolic datasets prior to statistical analysis
125
Table 5.4 Summary of p-values from Student’s t-tests of PC scores between
control (n=10) and exposed (n=10) samples, for Cd, DNP, fenvalerate
and propranolol
128
Table 5.5 Number of peaks that significantly changed concentration (FDR<0.05,
relative to controls) and their proportion relative to the total number of
peaks detected, following exposure to cadmium, DNP, fenvalerate and
propranolol
129
Table 5.6 “Optimal model” and “permuted” classification error rates for each of
the six exposure classes, and their mean value, for both haemolymph
and whole organism homogenates of D. magna
136
Table 6.1 The total number of peaks detected and the proportion of peaks that
significantly changed concentration (FDR<0.05) between the control
and high dose groups, following chronic exposure of D. magna to
cadmium, DNP and propranolol
151
Table 6.2 Summary of the common peaks the optimal PLS-R models of individual
D. magna following exposure to cadmium, DNP and propranolol
164
Table 6.3 Summary of the common peaks the optimal PLS-R models of individual
D. magna following exposure to cadmium, DNP and propranolol
165

x
Abbreviations
ANOVA Analysis of Variance
BBM Bolds Basal Medium
(c)DNA (complementary) deoxyribonucleic acid
Cd Cadmium
COMET Consortium on Metabonomic Toxicology
DI FT-ICR MS Direct Infusion Fourier Transform Ion Cyclotron Resonance Mass Spectrometry
DI(MS) Direct Infusion (Mass Spectrometry)
DMSO Dimethyl sulfoxide
DNP 2,4-dinitrophenol
FDR False Discovery Rate
FT-ICR MS Fourier Transform Ion Cyclotron Resonance Mass Spectrometry
GC-MS Gas Chromatography - Mass Spectrometry
g-log Generalised – log
GSH Reduced glutathione
GST Glutathione-S-transferase
HPLC High Performance Liquid Chromatography
LC50 50% of the Lethal Concentration
LC-MS Liquid Chromatography - Mass Spectrometry
MOA Mode of Action
(m)RNA (messenger) ribonucleic acid
MS Mass Spectrometry

xi
MT Metallothionein
(n)ESI (nano) Electrospray Ionisation
NMR Nuclear Magnetic Resonance
OECD Organisation for Economic Cooperation and Development
PCA Principal Components Analysis
PLS-DA Partial Least Squares Discriminant Analysis
PLS-R Partial Least Squares Regression
q-RT-PCR Quantitative – Reverse Transcription – PCR
QSAR Quantitative Structure Activity Relationship
REACH Registration Evaluation Authorisation and Restriction of Chemicals
RSD Relative Standard Deviation
SFG Scope for growth
SIM Single Ion Monitoring
SNR Signal to Noise Ratio
SSAT Spermidine/Spermine N-acetyltransferase
TSCA Toxic Substances Control Act
TYH Tyrosine hydroxylase
US-EPA United States - Environmental Protection Agency

- 1 -
CHAPTER ONE:
General Introduction

- 2 -
1.1 Introduction
The impact of both natural and anthropogenic stressors on ecosystem health is an
international issue. Linking the adverse effects of these impacts in individual animals to their
ecosystem-level consequences is a key challenge in regulatory risk assessment (Moore et al.
2004). Section 1.2 provides an introduction to the current regulatory testing practices for
assessing ecosystem health and the limitations of these approaches, particularly their high
cost, the lack of confidence in extrapolating from the individual to higher levels of biological
organisation, and their inability to provide information on modes of toxicity. The relatively
recent emergence of ecotoxicogenomics (transcriptomics, proteomics and metabolomics)
has considerable potential for addressing these issues and providing a better mechanistic
understanding of the ecotoxicology of known and emerging toxicants (Snape et al. 2004). The
application of ecotoxicogenomics in relation to regulatory toxicity testing is discussed in
Section 1.3. This thesis focuses on one particular area of ecotoxicogenomics; metabolomics,
which provides a relatively non-targeted assessment of toxicity, measuring potentially
several hundred metabolites and multiple pathways in a single experiment. An overview of
metabolomics and its potential for use in regulatory toxicity testing is given in Section 1.4,
with particular focus on using metabolomics as a high-throughput screening tool for
prioritisation of chemicals in a tiered testing approach. In this thesis, the metabolomics
approach is being applied to Daphnia magna, a freshwater invertebrate with many attributes
that make it an ideal test organism; these are discussed in Section 1.5. As such, this species is
used extensively in current regulatory ecotoxicological testing and has great potential as a
test organism for ecotoxicogenomic investigations. The small sample size afforded by using

- 3 -
Daphnia as a test organism brings with it further challenges and the correct analysis platform
needs to be utilised to maximise the potential of using metabolomics for regulatory toxicity
testing. Section 1.6 details the various platforms available and highlights direct infusion mass
spectrometry as being the most appropriate tool for sensitive, accurate and high-throughput
analysis of such small samples. The various approaches to the statistical analysis, both
multivariate and univariate, of metabolomics data used in this thesis are discussed in Section
1.7, with the selection of which approach to use dependent on the overall objective of the
study. The aims of this research are outlined in Section 1.8.
1.2 Ecotoxicology and selection of test species
Until recently, risk assessment procedures have been directed towards the protection of
human health. Now it is widely acknowledged that such procedures must also ensure the
protection of the complex biotic communities in natural ecosystems (Moore et al. 2004).
Ecotoxicology is the integration of ecology and toxicology (Chapman 2002) typically defined
as the study of the effects of anthropogenic toxicants on ecological systems (Truhaut 1977).
The basic test principles of ecotoxicology come from toxicology with experimental studies
resulting in dose response relationships and the estimation of effect concentrations (Van
Straalen 2003). The influence of ecology can be seen in the design of these tests where
environmentally relevant exposure concentrations need to be employed and tested on
ecologically relevant test species (Chapman 2002).
In terms of ecological risk assessment the ideal would be to test millions of organisms across
all environments that may become exposed to the chemical being assessed (Breitholtz et al.

- 4 -
2006). Since this is an impossibility, and in order to make more accurate predictions on
toxicity and inform subsequent regulations on chemical use and disposal, the species
selected for testing should be the equivalent of a keystone species for the trophic level being
assessed (Chapman 2002). The Organisation for Economic Cooperation and Development
(OECD) have defined a series of toxicity tests for ecological risk assessment utilising several
different keystone species’ of plant and animal of both aquatic and terrestrial origin. These
include plants and animals such as algae, Daphnia, earthworms, bees, fish and birds; the
OECD recommended species for aquatic toxicity tests are listed as part of Table 1.1. There is
now a need to balance the growing requirement for ecotoxicity data with animal welfare,
maximising the knowledge output from limited testing with lower vertebrates in order to
help reduce the future level of vertebrate use in routine ecotoxicity testing (Snape et al.
2004). Furthermore, one of the major objectives of the registration, evaluation, authorisation
and restriction of chemicals (REACH), a recent European Union directive, is to reduce all
vertebrate testing in regulatory risk assessment (REACH 2006). The need for the reduction in
vertebrate testing helped direct the selection of Daphnia magna as the test organism for this
research, a keystone invertebrate species in the freshwater ecosystem, discussed in Section
1.5.
1.2.1 Current approaches in regulatory ecotoxicological testing
The ultimate aim of ecological risk assessment is to provide sufficient information for
decision-making with the purpose of protecting the environment from unwanted effects of
chemicals (Breitholtz et al. 2006). Society is faced with the enormous task to assess

- 5 -
numerous chemicals and complex chemical mixtures while protecting many different species
in, and the diversity of, ecosystems (Escher and Hermens 2002). The need for improved
safety data from ecological risk assessments is continually increasing; the effects of new and
existing chemicals along with the threat of emerging pollutants, such as human and
veterinary pharmaceuticals, are all increasing demand for regulatory testing for ecological
effects (Ankley 2008). In Europe, REACH was introduced in June 2007 to redress the
differences between the assessment and regulation of new and existing chemicals and to
facilitate the replacement of existing dangerous chemicals with improved new ones (REACH
2006). The Chemical Acts, introduced in Europe at the start of the 1980s, required all
manufacturers of chemicals that entered the market from 1981 to release information on
their potential risks to both human health and the environment, however the testing
strategies employed were inflexible and tended to relate to production volume rather than
the risk of the chemical (Ahlers et al. 2008). With REACH, the responsibility for chemical
testing was passed to industry rather than the authorities, with the overall scope of REACH
being to ensure a high level of protection to human health and the environment whilst
enhancing competitiveness and innovation in the market (REACH 2006). Both new and
existing chemicals are subject to the testing requirements detailed in REACH and minimum
regulatory data requirements must be reached, however the system is flexible in substituting
standard tests for equivalent information and a weight of evidence based approach, allowing
the use of all information while providing common standards for risk assessment (Ahlers et
al. 2008). In the United States over 80,000 chemicals are currently listed in the Toxic
Substances Control Act (TSCA) Inventory and the majority of them have not undergone

- 6 -
extensive toxicological testing. The US Environmental Protection Agency (US-EPA) now needs
to make decisions regarding these chemicals such as prioritisation either for further testing
or the decision that no further testing is required (US-EPA 2004). Currently, chemical
prioritization may be determined by several factors including production volume, exposure
information, persistence, and consideration of quantitative structure-activity relationships
(QSARs) where the assumption is that similar molecules will have similar activities (US-EPA
2004). The decision as to whether the substance in question requires further evaluation or
not can be considered as the first level in a tiered-testing system. The higher tiers then use a
suite of standardised toxicity testing strategies for assessing the potential hazards of
chemicals that may enter the environment. These can generally be split into two main types
of test; acute (short-term) or chronic (long-term). The OECD provides guidelines for both
acute and chronic tests designed to be relevant to various ecosystems; Table 1.1 summarises
those tests used for assessing the threat to aquatic ecosystems. These conventional
approaches for assessing the toxicity of chemicals utilise endpoints such as mortality,
reproductive dysfunction, impaired growth and behavioural effects (Ankley 2008; De Coen
and Janssen 2003).

- 7 -
Table 1.1 Summary of the OECD guidelines for toxicity testing in aquatic environments; highlighting the recommended test species and a brief
outline of the aims and endpoints of each test (OECD 2009).
Guideline Recommended test species Summary of test
Test No. 201: Alga, Growth
Inhibition Test
Green alga: Pseudokirchneriella subcapitata,,
Desmodesmus subspicatus
Diatom: Navicula pelliculosa
Cyanobacteria: Anabaena flos-aquae,
Synechococcus leopoliensis
To determine the effects of a substance on the growth of
freshwater microalgae and/or cyanobacteria. Typically a
72 h acute toxicity test.
Test No. 202: Daphnia sp.
Acute Immobilisation Test
Daphnia magna (preferred)
Other Daphnia species can be used
To determine the concentration of substance at which
50% (EC50) of Daphnia neonates (<24 h old) become
immobilized. Typically a 24-48 h acute toxicity test.
Test No. 203: Fish, Acute
Toxicity Test
Danio rerio – zebrafish
Pimephales promelas – fathead minnow
Cyprinus carpio – common carp
Oryzias latipes – Japanese medaka
Poecilia reticulata – guppy
Lepomis macrochirus – bluegill
Oncorhynchus mykiss – rainbow trout
To determine the concentration of substance at which
50% (LC50) of fish will die. Typically a 96 h acute toxicity
test with mortality levels recorded at 24, 48, 72 and 96 h.
Test No. 204: Fish,
Prolonged Toxicity Test: 14-
Day Study
As for guideline No 203 To determine lethal, other observed effects (e.g.
behavioural) and no effect levels at set time points
through the duration of this test. Typically a 14 day
chronic study, although can be extended.
Test No. 210: Fish, Early-
Life Stage Toxicity Test
Danio rerio – zebrafish
Pimephales promelas – fathead minnow
Oryzias latipes – Japanese medaka
Oncorhynchus mykiss – rainbow trout
Cyprinodon varieqatus - Sheepshead minnow
To determine the lethal and sub-lethal effects of chemicals
on the early life stages of the species tested. Parameters
measured include; fish weight and length, as well as the
observations of abnormal appearance, abnormal
behaviour, hatching and survival Typically a chronic test,
begun by placing fertilised eggs in the test chambers and is
continued at least until all the control fish are free-feeding

- 8 -
Test No. 211: Daphnia
magna Reproduction Test
Daphnia magna To determine the effects of a test substance on the
reproductive capability of Daphnia magna. Mortality of
parents and number of living offspring per brood should
be reported. Typically a chronic toxicity test of 21 d
duration
Test No. 212: Fish, Short-
term Toxicity Test on
Embryo and Sac-Fry Stages
Danio rerio – zebrafish
Pimephales promelas – fathead minnow
Cyprinus carpio – common carp
Oryzias latipes – Japanese medaka
Oncorhynchus mykiss – rainbow trout
To determine lethal and sublethal effects of test substance
on embryo and sac fry stages of fish, mortality and
parameters such as abnormal growth should be reported.
Typically an acute toxicity test beginning with the fertilised
egg and terminated at sac fry stage.
Test No. 215: Fish, Juvenile
Growth Test
Oncorhynchus mykiss – rainbow trout To determine the effects of prolonged exposure of
juvenile fish to test substance, reportable parameters
include fish weight at end of test and observation of
growth or behavioural abnormalities. Typically a chronic
toxicity test lasting 28 days
Test No. 229: Fish Short
Term Reproduction Assay
and
Test No. 230: 21-day Fish
Assay: A Short-Term
Screening for Oestrogenic
and Androgenic Activity,
and Aromatase Inhibition
Danio rerio – zebrafish
Pimephales promelas – fathead minnow
Oryzias latipes – Japanese medaka
To determine the endocrine activity of the test substance.
Measurement of vitellogenin and secondary sex
characteristics are used as biomarkers for endocrine
disruption, monitoring of fecundity throughout the test is
reported and gonads are preserved for histopathology.
Typically a chronic test of 21 days performed using pairs of
sexually mature males and spawning females.

- 9 -
1.2.2 Limitations of current strategies
Whilst the highest credibility in ecotoxicological testing will be derived from tests which
measure mortality and reproductive or growth effects, as these can more easily be predictive
of population effects (Chapman 2002), these whole organism exposures are expensive in
terms of both time and resources, particularly when moving from acute to chronic tests
(Ankley 2008). The bias in toxicity databases for acute data (typically lethality tests) reflects
this and any extrapolations to chronic endpoints are not as reliable as the data generated
from the time and resource expensive chronic toxicity tests. Therefore extrapolations
frequently add uncertainty to any toxicity assessment (Preston 2002). This trend for acute
toxicity testing offers little more than a means of ranking and comparing the toxicity of
substances (Moore et al. 2004) and is of little use to ecotoxicologists and risk assessors
(Preston 2002). Furthermore, these methods do not take into account any sublethal effects
of exposure and whilst stress-induced changes at the population, community and ecosystem
levels are the primary concern, they are generally too complex and far removed from the
causative events to be of much use in developing tools for the early detection and prediction
of the consequences of exposure (Moore et al. 2004). Over the past few decades biomarker
techniques have become more popular in ecotoxicology, specifically looking for biochemical,
physiological or histological indicators of exposure to toxic chemicals and substantial efforts
have been made to try to incorporate them into ecological risk assessment (De Coen and
Janssen 2003; Forbes et al. 2006). Biomarkers can be considered as measures of the initial
changes caused by toxic exposure starting at the subcellular level (e.g. interference with
molecular pathways) and ultimately leading to adverse effects at higher levels of biological

- 10 -
organization (De Coen and Janssen 2003). In principle, these early warning biomarkers should
be capable of predicting reduced performance, impending pathology and damage to health
(Moore et al. 2004). Hence biomarkers should be able to identify those organisms that have
been, or are being, exposed to certain chemicals or that those organisms are suffering, or will
suffer, future impairments of ecological relevance (Forbes et al. 2006). In fact there has been
some success in the use of biomarkers in regulatory ecotoxicology, the discovery that
tributyltin (TBT) causes imposex in gastropod molluscs has led to legislation banning the use
of this substance as the active ingredient in anti-biofouling paints, with imposex now being
used as the biomarker for organotin (in particular TBT) exposure (Evans and Nicholson 2000;
Forbes et al. 2006). One of the best known biomarkers is the significant elevation of
vitellogenin caused by exposure to estrogenic compounds which were discovered to be the
causal agents of intersex (feminisation of male fish) in UK wild fish populations (Jobling et al.
1998). The success of this biomarker in determining exposure to endocrine disrupting
chemicals has meant that it has been adopted into some regulatory ecotoxicological studies,
such as the OECD tests 229 and 230 (Table 1.1 (OECD 2009)) which aim to determine if the
test substance has endocrine disrupting properties. However, whilst the use of sublethal
endpoints, such as biomarkers of toxicity, have increased our ability to detect stress
responses at low toxicant concentrations (Preston 2002) they have failed to demonstrate
their usefulness, especially in predicting population to ecosystem level effects, as indicated
by their minimal incorporation into national and international risk assessment protocols
(Forbes et al. 2006). Indeed, even the vitellogenin biomarker of exposure to endocrine

- 11 -
disrupting chemicals is only recommended as a “signpost” in ecological risk assessment for
directing chronic exposure studies (Hutchinson et al. 2006).
One of the greatest limitations of all of these testing strategies is that they are restricted to
looking only at whole organism effects or changes in single biochemicals and subsequently
provide no detailed data about the underlying biochemical mechanisms of toxicity (Snape et
al. 2004; US-EPA 2004). Knowledge of mode of action (MOA) is fundamental to improve the
scientific basis of risk assessment (Breitholtz et al. 2006), it will improve our understanding of
the effects of pollutants on ecosystems and also be useful in setting up predictive models and
avoiding pitfalls in applied ecological risk assessment of chemicals (Escher and Hermens
2002). However, with the current strategies, hypotheses need to be made on the mode of
action (MOA) of the test substance to decide which tests may be applicable; at present
QSARs typically tend to be used to do this (Escher and Hermens 2002; Moore et al. 2004).
Testing costs will become enormous, particularly if there is a time limit on completion as
there is for REACH, where approximately 30,000 existing chemicals need to be registered by
2018 (Ahlers et al. 2008), so a better knowledge-based approach is needed (US-EPA 2004).
Ecological testing and screening programs need to be more thorough, less costly and able to
be implemented rapidly and the incorporation of the omics into regulatory toxicity
assessment could provide an answer (Ankley 2008).
1.3 The potential of omics in regulatory ecotoxicological testing
Toxicogenomics is the study of the global response of a genome to a chemical and has three
distinct categories: transcriptomics (mRNA expression), proteomics (protein expression) and

- 12 -
metabolomics (metabolite profiling) (Ankley 2008). When these methods are applied to
ecotoxicology this can then be termed as ecotoxicogenomics (Snape et al. 2004). Rapid
advances in ecotoxicogenomics may have significant implications for risk assessment and
regulatory decision making (US-EPA 2004), particularly as screens for regulatory decision
making such as prioritisation in first tier testing (Ankley 2008). The US-EPA Genomics White
Paper (US-EPA 2004) has evaluated these technologies as having great promise to provide
more mechanistic, molecular-based data for risk-based prioritization of stressors. Thus
offering more efficient, potentially high throughput, and low cost alternatives to the tests
EPA currently relies on for prioritization. The most significant impact of ecotoxicogenomics
on ecological risk assessment would be better definition of MOAs allowing for enhanced
resource utilisation and reduced uncertainty in regulatory decision making (Ankley 2008).
Knowledge of the MOA increases confidence in extrapolating toxicity data between species
(Bundy et al. 2009). It should be noted that ecotoxicogenomics will not fundamentally alter
the risk assessment process, but is expected to serve as a more powerful tool for evaluating
the exposure to and effects of environmental stressors (US-EPA 2004). The application of
transcriptomic, proteomic and metabolomic technologies allows the expression profile of
hundreds to many thousands of genes, gene products and metabolites to be generated
simultaneously, providing for the first time a broad impression of how organisms or cells
respond to a given stimulus (Snape et al. 2004). This type of data may allow for the
development of gene, protein, or metabolite profiles that can advance the screening of
individual chemicals and allow faster and more accurate categorization into defined classes
according to their MOA (US-EPA 2004). The inability of current strategies to elucidate MOA of

- 13 -
toxicants is one of the greatest limitations; therefore exploration of omics techniques that
have this capability is essential for the future of regulatory toxicity testing. Moreover, basal
cellular structures and functions measured by omics technologies are highly conserved
biological entities; therefore, a large number of toxic effects that target these basal functions
are universal in all organisms and target tissues allowing for cross-species extrapolation
(Escher and Hermens 2002), another process in which there is little confidence when using
the current approaches. Metabolomics in particular closely reflects the actual cellular
environment (Schmidt 2004).
1.4 Metabolomics
Metabolomics is the study of endogenous, low molecular weight metabolites and can be
used to examine biological systems at several levels, including cellular, tissue, organ, or even
whole organism (Lin et al. 2006; Viant 2007). The metabolome, describes the composition of
these low molecular weight metabolites at the time of sampling, and includes compounds
such as lipids, sugars, and amino acids that can provide important clues about the individual’s
health and a functional measure of cellular status at that moment in time (Lin et al. 2006;
Schmidt 2004). One of the greatest advantages of metabolomics is that the metabolome is
often the first to respond to anthropogenic stressors, where in some cases no changes in the
transcriptome and proteome occur (Viant 2007). Metabolomics investigations can be
designed as targeted studies looking for specific metabolite changes, although this requires
some prior knowledge on the metabolic action of whatever toxicant is being tested. An
alternative metabolomic approach is where the global metabolome is analysed, although

- 14 -
constrained by the efficiency and sensitivity of the techniques used to extract and detect the
metabolites. This method is a relatively non-targeted approach where there is little, if any,
prior selection of which metabolic components to measure, thus, a similar study design can
be used in both a screening mode and one of mechanistic exploration (Keun 2006) This
research aims to investigate the use of both targeted and global metabolomics approaches
for both of these applications and thus assess its future potential in first-tier regulatory
ecotoxicological testing.
1.4.1 Metabolomics in ecotoxicology
To date metabolomics has had its greatest impact in the pharmaceutical industry, particularly
in preclinical toxicology, and is now recognised as an independent and widely used technique
for evaluating the toxicity of drug-candidate compounds (Nicholson et al. 2002; Robertson
2005; Robertson et al. 2007). However, the application of metabolomics in assessing
environmental health is still in its infancy (Lin et al. 2006; Schmidt 2004). In the broader
scope of environmental research, metabolomics has been applied in several areas. One area
is in determining responses to environmental stressors such as temperature in a variety of
organisms including arabidopsis (Kaplan et al. 2004), fruit flies (Malmendal et al. 2006) and
fish (Turner et al. 2007; Viant et al. 2003b). Another area is disease monitoring, where
metabolomics has been successfully utilised to characterise liver tumours in the flatfish
Limanda limanda (Southam et al. 2008; Stentiford et al. 2005) and withering syndrome in red
abalone (Haliotis rufescens) (Viant et al. 2003a).

- 15 -
In ecotoxicology, metabolomics can be used to characterize and understand the metabolic or
biochemical responses of an organism to toxicant exposure and such information is of
particular value for the risk assessment of chemicals in the environment (Lin et al. 2006).
Recently there have been numerous studies applying metabolomic techniques to this area of
research. In the terrestrial ecosystem there have been a few ecotoxicological metabolomics
studies that use vertebrate test organisms. Griffin et al. (Griffin et al. 2001) used
metabolomics to determine the effects of arsenic exposure on the renal tissue of the bank
vole (Clethrionomys glareolus) and wood mouse (Apodemus sylvaticus) reporting that
metabolic changes in the bank vole following arsenic exposure could be linked to the
observed tissue damage; no effects were seen in the wood mouse. Earthworms have been
widely used for studying environmental pollution and toxicity and have been employed in
several ecotoxicological metabolomics studies (Bundy et al. 2009). The earthworm Eisenia
foetida is the standard terrestrial invertebrate for toxicity testing and McKelvie et al.
(McKelvie et al. 2009) determined significant metabolic changes in this species after
exposure to dichlorodiphenyltrichloroethane (DDT) and endosulfan, highlighting alanine as a
potential biomarker in this instance. Bundy et al. (Bundy et al. 2002) found toxicant induced
metabolic changes in the earthworm, Eisenia veneta, exposed to three different xenobiotic
compounds (4-fluoroaniline, 3,5-difluoroaniline and 2-fluoro-4-methylaniline). Jones et al.
(Jones et al. 2008) determined alterations to the normal metabolic profiles of the
earthworm, Lumbricus rubellus, following exposure to pyrene, a polyaromatic hydrocarbon,
and Bundy et al. (Bundy et al. 2007) determined a metabolic effect correlated to zinc
exposure in this species, from multiple geographical sites.

- 16 -
In the aquatic environment metabolomics has been used to study of the toxic effects of
pesticides, endocrine disrupting compounds and other xenobiotics on fish of differing life
stages (Bundy et al. 2009). The metabolic effects of ethinylestradiol, a synthetic estrogen,
exposure have been reported for several fish species (Ekman et al. 2008; Katsiadaki et al.
2009; Samuelsson et al. 2006) with responses in context with previous knowledge of the
effects of estrogens on fish. The effects of pesticides on the metabolomes of various fish
species have also been studied (Viant et al. 2005; Viant et al. 2006a; Viant et al. 2006b). To
date there has been a single reported study using metabolomics in algae investigating the
effects of the phytotoxin, prometryn, to a unicellular green alga (Kluender et al. 2009). Table
1.2 presents a summary of the key findings from these investigations, providing information
on the species being investigated along with the type of tissue or biofluid analysed, the
metabolomics analysis platform utilised and the data analysis approaches. These studies
serve to highlight the potential of metabolomics for use in regulatory screening and potential
biomarker discovery as in each case a toxicant induced metabolic effect could be
determined. Yet, despite D. magna being one of the most widely utilised aquatic test species,
no metabolomics studies have been reported, a knowledge gap that this research aims to
redress.

- 17 -
Table 1.2 Summary of previously reported studies utilising metabolomics techniques in ecotoxicological studies of aquatic organisms.
Species and sample
type
Toxicant
exposure
Metabolomics
analysis platform
Data
analysis
approaches
Key metabolomics findings Reference
Fathead minnow
(Pimephales promelas)
Liver tissue
17α-
ethynylestradiol
(EE2)
10 or 100 ngL-1
8 day exposure
with 8 day
depuration
1H NMR
spectroscopy
(800 MHz)
PCA
PLS-DA
Determined a greater impact on
exposed male fish, with metabolic
profiles resembling those of
female fish.
Biochemical changes in male livers
included metabolites involved in
energetics, hepatotoxicity and
potentially vitellogenin synthesis.
Response trajectories revealed
males could compensate during
exposure and partially recover
following depuration
Ekman et
al., 2008
Three-spine
Stickleback
(Gasterosteus
aculeatus)
Liver tissue
Ethinyl-estradiol
(EE2)
0.1- 100 ngL-1
4 day exposure
1H NMR
spectroscopy
(500 MHz)
PCA
ANOVA
Determined a weak dose-
response relationship.
Possible decrease in glutamate
and alanine although not
statistically significant.
Katsiadaki
et al., 2009
Rainbow trout
(Oncorhynchus mykiss)
Blood plasma and
plasma lipid extracts
17α-
ethynilestradiol
(EE2)
0.87 or 10 ngL-1
2 week exposure
1H NMR
spectroscopy
(600 MHz)
PCA
PLS-DA
Determined minor toxicant
induced changes between control
and high dose.
Specific metabolite changes were
increased phospholipids and
decreased alanine and
choloesterol levels.
Samuelsson
et al., 2006

- 18 -
Japanese Medaka
(Oryzias latipes)
Embryos
Dinoseb
50 or 75 ppb
14, 62 and 110 h
exposures
1H NMR
spectroscopy
(500 MHz)
13
P NMR
spectroscopy
(200 MHz)
HPLC-UV
PCA
ANOVA
Determined a significant dose
response effect and toxicant
induced metabolic changes
correlated with reduced growth
and abnormal development.
Specifically, significant decreases
were found in the levels of ATP,
phosphocreatine, alanine and
tyrosine, as well as an increase in
lactate.
Viant et al.,
2006a
Chinook salmon
(Oncorhynchus
tshawytscha)
Eggs and alevins
Dinoseb, Diazinon
and Esfenvalerate
Varying
concentrations
(ppb)
96 h exposure
1H NMR
spectroscopy
(500 MHz)
HPLC-UV
PCA
ANOVA
Revealed both dose-dependent
and MOA specific metabolic
changes induced by exposure to
all three pesticides
Viant et al.,
2006b
Japanese Medaka
(Oryzias latipes)
Embryos
Trichloroethylene
0-175 mgL-1
7 day exposure
1H NMR
spectroscopy
(500 MHz)
PCA
ANOVA
Determined metabolic
pertubations at all exposure levels
and PCA revealed a dose-response
relationship and indicated an
energetic cost to TCE exposure.
Viant et al.,
2005
Unicellular green alga
(Scenedesmus
vacuolatus)
Hydrophilic and
lipophillic extracts
prometryn
0.1 µmolL-1
0-14 h exposure
time course
GC-MS PCA
Determined a clear toxicant
induced effect.
Metabolite changes suggest an
impairment of energy metabolism
and carbohydrate synthesis and
an activation of catbolic processes
Kluender et
al., 2009

- 19 -
In mammalian toxicology, metabolomic studies have typically analysed biofluids such as
blood, plasma or urine (Lindon et al. 2000). Biofluids are attractive to study as they represent
a single largely cell-free compartment within an organism, quite different from the
complexity of whole organism homogenates, and yet their composition is intimately linked to
the cellular (dys)function of the organs which they perfuse. The use of biofluids could provide
a unique insight into toxicant effect, particularly in those organisms that are too small in size
for individual organ sampling, such as Daphnia, or when the mode of toxicity is unknown and
therefore the target organ cannot be known ahead of time. Nevertheless, few ecotoxicology
studies, particularly the investigation of terrestrial and aquatic invertebrates, have exploited
the benefits of biofluids. Bundy et al. (Bundy et al. 2001) identified potential biomarkers of 3-
fluoro-4-nitrophenol toxicity in the coelomic fluid of earthworms (Eisenia veneta) using
nuclear magnetic resonance (NMR) spectroscopy based metabolomics. Phalaraksh et al.
(Phalaraksh et al. 1999) used a similar technique to detect and quantify 19 endogenous
metabolites in haemolymph from larval stages of the tobacco hornworm (Manduca sexta),
and in a subsequent study determined changes in these metabolites during hornworm
development (Phalaraksh et al. 2008). An investigative study into withering syndrome in red
abalone (Haliotis rufescens) revealed metabolic biomarkers in haemolymph that could
distinguish healthy, stunted and diseased animals (Viant et al. 2003a). With a demonstrated
potential to provide biochemical insight into invertebrate responses to toxicant exposure,
larval development and disease, together with the advantages of analyzing biofluids
discussed above, metabolomics studies of haemolymph from D. magna are clearly warranted
as a potentially powerful approach for toxicity testing. Therefore, the feasibility of using D.

- 20 -
magna haemolymph for metabolomics toxicity studies and its capability in discriminating
toxic MOAs is investigated in this thesis.
It has been recognized for some time that metabolomics has enormous potential to identify
novel biomarkers of toxicity, with arguably the most important endpoint being in elucidating
a mode of toxicity (Robertson 2005). This has been successfully demonstrated by The
Consortium on Metabonomic Toxicology (COMET) (Lindon et al. 2005) which built a database
of the urinary metabolic responses of rats to 80 model toxicants and then confirmed the
ability of these responses to predict the main organ of toxicity, either liver or kidney (Ebbels
et al. 2007). In ecotoxicology, few studies have been published that have addressed the
question of whether chemicals with differing MOAs can be discriminated. In a study of the
earthworm, Lumbricus rubellus, reported by Guo et al. (Guo et al. 2009), a multiple toxicant
study using cadmium chloride, atrazine and fluoranthene, confirmed that the metabolic
responses to sub-lethal doses of these toxicants can be distinguished, consistent with their
distinct MOAs. In the aquatic environment metabolomics has also successfully been used to
determine the exposure effects of three pesticides to Chinook salmon (Oncorhynchus
tshawytscha) eggs and alevins, reporting both dose-dependent and MOA specific changes to
the metabolome induced by these toxicants (Viant et al. 2006b). Clearly more
ecotoxicological studies are needed to investigate the capability of metabolomics in
distinguishing toxicant MOA, not least in ecologically relevant species such as D. magna.
Consequently, this research contains an investigation into the capability of metabolomics in
discriminating toxicant MOAs in D. magna.

- 21 -
Following the recent success in applying metabolomics to ecotoxicological testing it is
believed that metabolomics will have an important future role in ecological risk assessment,
but exactly how this will be achieved is currently being debated (Ankley 2008). The most
likely applications include: (i) as a screening tool within a tiered testing hierarchy, specifically
as an early screening tool for chemicals that might cause adverse chronic effects and thus
prioritization for more extensive testing; and (ii) as a tool to elucidate the MOA of a toxicant,
at the metabolic level, as part of a comprehensive risk assessment (Bundy et al. 2009). The
huge potential for utilising metabolomic techniques in regulatory toxicity testing is the main
driving force behind this research and as such the overall aim of this thesis is to develop and
apply metabolomics to toxicity testing in Daphnia magna, the OECD recommended
freshwater invertebrate test species.
1.5 Daphnia magna
Given that invertebrates account for at least 95% of all known animal species and are critical
to ecosystem structure and function (Verslycke et al. 2007), an ideal test organism for
freshwater ecosystems is Daphnia magna, commonly known as the water flea (Figure 1.1).
Daphnia magna are small (typically < 3 mm), freshwater filter-feeding crustaceans and can
be found in almost any permanent body of water (LeBlanc 2007; Tatarazako and Oda 2007).
They occupy a key position in the aquatic food web; they are highly abundant grazers of
phytoplankton and provide a crucial link between primary and secondary production by
being a major dietary component of fish and invertebrate predators (Dodson and Hanazato
1995; Martin-Creuzburg et al. 2007; Tatarazako and Oda 2007). Since Daphnia are such a

- 22 -
critical species in the aquatic food web any adverse effects on this species could cause
community or ecosystem-level responses (Flaherty and Dodson 2005) making them model
representatives of the zooplankton for any form of ecological testing (Dodson and Hanazato
1995).
Its small size, high fecundity and short lifecycle makes D. magna the ideal test species for
laboratory controlled experiments of environmental stressors as they are easy to culture and
their reproductive strategy (parthenogenesis) reduces biological variability (Barata et al.
2005). Parthenogenetic reproduction, where females asexually produce genetically identical
female offspring, is a system which allows rapid expansion of daphnid populations in times of
resource abundance and it is known that daphnids can switch to a sexual mode of
reproduction in response to environmental stress (Olmstead and Leblanc 2002; Tatarazako
and Oda 2007) (Figure 1.2). Occurrences such as reduced day length, decreased food
availability, temperature changes and toxicant exposure can all cause daphnids to undergo a
period of sexual reproduction generating dormant, resting eggs encased in a protective
ephippium, which will then hatch when conditions become more favourable; this allows the
species to survive in a habitat that may become inhospitable (Olmstead and Leblanc 2002,
2003). Typically this is an overwintering strategy, although these dormant eggs can remain
viable for decades (Brendonck and De Meester 2003).

- 23 -
(a)
Figure 1.1 Images of (a) an adult female daphnid and (b) neonates from the Daphnia culture
maintained at the University of Birmingham
(b)

- 24 -
Figure 1.2 Graphical representation of parthenogenetic reproductive lifecycle of Daphnia magna. In
favourable conditions Daphnia reproduce by cyclic parthenogenesis releasing genetically identical
offspring. Under adverse conditions females release broods of males and sexually receptive females
allowing for sexual reproduction, producing dormant eggs that will hatch when conditions return to
normal.
Male and sexually
receptive female
neonates
Clonal female neonates
Dormant
eggs
Female neonates
hatch on return to
favourable conditions
Adult female
Cyclic
Parthenogenesis
Sexual Reproduction
Stressful
environment

- 25 -
1.5.1 Daphnia magna and regulatory toxicity testing
Water fleas have a long history in aquatic toxicity testing; they are known to be quite
sensitive to many chemicals (Tatarazako and Oda 2007) and with their ease of handling in the
laboratory, several methods using D. magna exist for regulatory toxicity testing (Tatarazako
and Oda 2007). D. magna is the recommended test species for the OECD (OECD 1998, 2004)
in their chemical testing guidelines and the current ecotoxicological requirements of directive
79/831/EEC for all new industrial chemicals are that acute toxicity tests must be carried out
using fish and Daphnia (Sandbacka et al. 2000). It is an extensively used test species that has
been found to be markedly more sensitive to a larger variety of stressors in toxicity tests than
fish (Martins et al. 2007; Sandbacka et al. 2000) and has been used to evaluate the toxicity of
many toxicants including heavy metals (Arambasic et al. 1995; Knops et al. 2001; Smolders et
al. 2005) and pharmaceuticals (Flaherty and Dodson 2005). However, the majority of studies
use the standard endpoints of acute and chronic toxicity discussed earlier and to date
relatively few studies have been reported that utilise D. magna with ecotoxicogenomic
approaches.
1.5.2 Daphnia magna and ecotoxicogenomics
Of the few studies reported that have utilised ecotoxicogenomic techniques with D. magna
all of them have used transcriptomics, employing DNA microarrays to characterise changes in
gene expression following exposure of D. magna to toxicants. Poynton et al. (Poynton et al.
2007) used a custom cDNA microarray to identify distinct expression profiles of D. magna in
response to sublethal exposures of copper, cadmium and zinc, which supported the known

- 26 -
MOAs of these toxicants. Further microarray studies investigating the effects of short-term
cadmium exposure on D. magna have also determined cadmium induced changes in gene
expression and that these changes could potentially be linked to altered population growth
rate (Connon et al. 2008; Soetaert et al. 2007b). Watanabe et al. (Watanabe et al. 2007)
exposed D. magna to several different compounds finding chemical-specific patterns of gene
expression which indicated that Daphnia DNA microarrays could be used for classification of
toxicants. Other transcriptomic studies into the effects of ibuprofen (pharmaceutical)
(Heckmann et al. 2008), propiconazole (pesticide) (Soetaert et al. 2006) and fenarimol
(fungicide) (Soetaert et al. 2007a) on D. magna have all reported toxicant induced changes in
gene expression profiles. In general, the goals were to reveal insight into the MOA, to
discover biomarkers for hazard characterisation, and to classify toxicants using characteristic
profiles of gene expression. Collectively these studies illustrate the emerging value of
ecotoxicogenomics for toxicity testing and risk assessment and it is surprising that despite
the importance of Daphnia in the freshwater ecosystem and the numerous advantages of
ecotoxicogenomics techniques over standard test methods that so few studies have been
reported. What’s more, given the importance of the metabolome, it’s even more surprising
that at the beginning this research and at the time of writing this thesis no metabolomics
studies (aside from those at the University of Birmingham) using D. magna had been
reported.

- 27 -
1.6 Metabolomics analysis platforms
The key requirement in metabolomics is for analytical methods that can provide
comprehensive metabolite profiles from complex biological samples (Lenz and Wilson 2007)
and any technique capable of generating comprehensive metabolite measurements could, in
theory, be used (Robertson 2005). Lenz and Wilson (Lenz and Wilson 2007) list criteria for the
ideal analytical platform as needing to be: able to be performed directly on the samples, i.e.
without the need for sample pre-processing; should be high-throughput and unbiased in
respect to metabolite class; would be both highly and equally sensitive to all components in
the samples; needs to be robust and reproducible with a wide dynamic range; and all this
should be combined with enough information to allow the identification of key metabolites
following post analysis multivariate statistics. In reality there is not a platform currently
available that can provide all of these properties and there is a trade-off between
technologies and objectives (Figure 1.3). Reproducibility is one of the key attributes required,
therefore, the most useful techniques should be highly reproducible, this can be affected by
variation introduced by sample preparation and analysis techniques so the platform used
must generate data where this introduced variation is less than that found in the normal
population of interest thus ensuring any significant metabolic changes are due to the
biological status of the organism (Keun 2006; Robertson et al. 2007).

- 28 -
High-throughput
Sensitivity Metabolite
identification
NMR DIMS
GC-MS
LC-MS/MS
Figure 1.3 The trade-off between analytical platforms and the objectives of metabolomics, adapted
from Dunn et al. (Dunn et al. 2005)

- 29 -
A successful metabolomics study should result in a high quality data set reflecting a
biochemical snapshot of the state of an organism through its endogenous metabolites
(Robertson et al. 2007); dependent on the objective of the study, it need not be a completely
resolved and assigned survey of composition (Keun 2006). In fact, this is the simplest way to
treat metabolomics data, producing a metabolic fingerprint that reflects the changes in
metabolites without necessarily identifying the components that are changing (Robertson et
al. 2007) allowing for rapid, high-throughput, unbiased sample analysis that can be used for
screening purposes comparing and discriminating between samples of different biological
status or origin (Dunn and Ellis 2005; Lin et al. 2006). The ultimate goal is to identify
discriminating metabolites and a more powerful interpretation of metabolomics data is
metabolic profiling, where a comprehensive (although this can be a targeted approach
looking for pre-selected metabolites), and hopefully quantitative, list of metabolites can be
identified in order to gain mechanistic information of biological processes and determine
potential biomarkers of toxicity and disease (Dettmer et al. 2007; Lin et al. 2006; Robertson
et al. 2007). Since this research aims to utilise metabolomics for both toxicity screening
purposes and to elucidate information on modes of toxic action then a platform that can
produce information for both applications is required. There are relatively few techniques
capable of providing this required level of detail and currently the two most widely used
platforms for metabolomics analysis are nuclear magnetic resonance (NMR) spectroscopy
and mass spectrometry (MS) based methods, not least because both these techniques are
able to detect a wide range of metabolites and provide a wealth of metabolic information

- 30 -
with relatively high reproducibility and sensitivity (Lin et al. 2006; Miller 2007; Robertson et
al. 2007).
1.6.1 NMR spectroscopy
High-resolution (field strengths of 400MHz and higher) NMR spectroscopy has historically
been the platform of choice for metabolomics studies; it is a cost-effective, robust and highly
reproducible technique that can quantitatively report on a few to several tens of compounds
in a single measurement with little or no sample preparation (Keun et al. 2002; Lenz and
Wilson 2007). NMR works on the principle that certain atomic nuclei have the property of
spin and magnetic moment; exposure to a strong magnetic field leads to splitting of their
energy levels and absorption of radio frequency radiation that can be correlated with
molecular structure (Skoog et al. 1998). Individual signals are dispersed dependent on the
chemical environment of the source nuclei making NMR spectra rich in structural information
and there are NMR visible isotopes for most chemical elements including 1H,
13C,
31P and
15N
(Keun 2006). To date the most commonly used technique for generating metabolic profiles is
1H NMR since hydrogen atoms are ubiquitous in organic molecules making this approach
non-biased to particular metabolites, and with a natural abundance of 99.98% gives the
highest relative sensitivity of all naturally occurring spin-active nuclei (Dunn and Ellis 2005;
Keun 2006; Lenz and Wilson 2007). For these reasons 1H NMR has become, and likely will
continue to be, one of the primary choices in analytical platforms for metabolomics studies
despite the fact that it is a relatively insensitive technique (Robertson et al. 2007). However,
this lack of sensitivity means NMR requires larger sample sizes in order for metabolites of

- 31 -
interest to be within its limits of detection so is not the most appropriate tool for use with
small organisms such as D. magna.
1.6.2 Mass Spectrometry
The major advantage of mass spectrometry techniques over NMR as a means of metabolic
profiling is its vastly greater sensitivity (Keun 2006). MS platforms are able to achieve low
detection limits enabling the detection of low abundance metabolites that are beyond the
capabilities of NMR (Dettmer et al. 2007), and as such is the platform of choice for
metabolomics studies that utilise small sample sizes and complex matrices (Brown et al.
2005). These attributes mean that MS technologies are the more appropriate choice of
analytical platform for this research into metabolomics toxicity testing of D. magna, a small
freshwater invertebrate. MS operates by separation and detection of ions according to their
mass to charge (m/z) ratio and has the ability to provide rapid, sensitive and selective
qualitative and quantitative analyses with the potential to identify metabolites (Dunn and
Ellis 2005).
MS is often employed using front-end separation techniques such as gas chromatography
(GC-MS) and liquid chromatography (LC-MS) (Robertson et al. 2007 1056) to enable better
metabolite separation (and consequently identification and quantification) (Dunn et al.
2005). GC-MS detects volatile, low molecular weight metabolites by first separating them by
GC then detecting the eluting compounds traditionally using electron-impact mass
spectrometers, although the majority of metabolites, such as sugars and amino acids, need
to be made volatile and thermally stable prior to analysis and such sample preparation can

- 32 -
introduce variability (Dunn and Ellis 2005; Lenz and Wilson 2007). LC-MS is simpler in terms
of sample preparation as it does not require sample volatility; LC is the separation technique
typically followed by electrospray ionisation (ESI) of the sample for MS detection (Dunn and
Ellis 2005). However, metabolite detection by a mass spectrometer using ESI is limited by the
ability of the metabolites to be ionised. Despite the benefits for metabolite identification, the
use of hyphenated MS techniques increases preparation and analysis time per sample,
making this a less cost effective technique particularly in terms of a high-throughput
screening tool. Since one of the main objectives of this research is to evaluate the potential
of using metabolomics as a potential first-tier screening tool for regulatory toxicity testing
then a high-throughput method is an essential, thus making hyphenated MS techniques
unsuitable for this purpose.
Direct injection mass spectrometry (DIMS) has been proposed as the answer to this problem;
here crude samples are injected directly in to the ESI source of a mass spectrometer with no
prior separation method, resulting in a mass spectrum representative of the composition of
the sample being analysed (Lenz and Wilson 2007). This is a high-throughput approach with
samples processed in typically a few minutes, the short analysis time potentially increasing
sample reproducibility and improving the accuracy of subsequent data analysis (Dettmer et
al. 2007). As with LC-MS, the ability of metabolites to be ionised determines the proportion
of the metabolome that can be detected, but ESI can be conducted in both positive and
negative ion modes to obtain the most comprehensive profile possible (Dunn and Ellis 2005;
Lenz and Wilson 2007). Alongside this, ion suppression, which occurs when all components of
the sample are introduced simultaneously into the ionisation source, has been greatly

- 33 -
decreased by the introduction of nano-electrospray ionisation (nESI) which reduces the flow
rate at which the sample enters the ionisation source (Dettmer et al. 2007), though it should
be noted that this does not completely remove the issue of ion suppression. The drawback
with ESI techniques, however, is that metabolite identification is more time intensive;
tandem MS (MS/MS) can be employed where fragmentation of molecular ions allows
structural identification of metabolites from interpretation of fragment ions and
fragmentation patterns (Dunn and Ellis 2005), yet this reduces the capability of DIMS to be
useful as a high-throughput method. The use of high resolution instruments which allow
accurate mass determination and are capable of fully resolving detected peaks for accurate
calculation of their empirical formula can overcome this problem (Dunn and Ellis 2005; Keun
2006). Fourier transform ion cyclotron resonance mass spectrometry (FT-ICR MS) is one of
the few techniques capable of the necessary mass resolution and accuracy required for this
(Dunn et al. 2005).
1.6.3 FT-ICR MS
FT-ICR MS is a DIMS technique ideal for high-throughput analysis of complex mixtures; its
performance characteristics include ultra-high mass resolution (values over 1,000,000 are
possible but routinely 100,000), and high mass accuracy with average errors generally < 1
ppm (Brown et al. 2005; Dunn and Ellis 2005). Mass accuracy is simply the difference
between the theoretical and measured mass of any peak relative to the theoretical mass of
that peak. Mass resolution refers to the resolution of a single peak, expressed as the m/z
value of that peak divided by the width of that peak at half its height, meaning that peaks

- 34 -
differing by the mass resolution yield distinguishable peaks (Breitling et al. 2006). In basic
terms, this means that with a mass resolution of 1,000,000 the m/z value of an individual
peak can be given to six decimal places, and peaks separated by this mass can be
distinguished by the instrument. It should be noted that the higher the resolution, the larger
the data files that subsequently need to be analysed (Breitling et al. 2006). This high-
resolving power reduces the need for time consuming and costly chromatographic
separations prior to MS analysis (Brown et al. 2005) and in principle would allow the
resolution of millions of peaks, although the dynamic range of the instruments can prevent
such performance (Breitling et al. 2006). Until recently the maximum reported dynamic
range of FT-ICR MS platforms was 10,000, meaning components < 0.01% abundant,
compared to the most abundant components, will not be observed (Brown et al. 2005).
Southam et al. (Southam et al. 2007) developed an analysis method which increases dynamic
range (to 16,000) whilst achieving a high mass accuracy (0.18 ppm). This approach collects
multiple, narrow, overlapping spectra (termed windows), the windows are analysed by single
ion monitoring (SIM) and then “stitched” together to form a complete “SIM-stitched”
spectrum with a greater dynamic range, enabling the detection of both low and highly
abundant metabolites. The high mass accuracy capabilities of FT-ICR MS means that
metabolites can often be putatively identified by determining their elemental composition,
i.e. CcHhNnOoPpSs (Brown et al. 2005; Dettmer et al. 2007). If only the most common
biological elements are permitted (carbon, hydrogen, oxygen, nitrogen, sulfur, and
phosphate), only a finite number of combinations of atoms will give a match to an observed
mass with a given degree of accuracy, although for larger molecules more alternatives

- 35 -
become chemically possible (Breitling et al. 2006). FT-ICR MS, and other high resolution MS
platforms, have an important future in high-throughput metabolomics investigations (Dunn
and Ellis 2005). FT-ICR MS is the analytical platform that has been selected for use in this
research, coupled with the SIM stitching approach developed by Southam et al. (Southam et
al. 2007), to maximise its potential in metabolite detection and therefore its ability to
determine toxicant induced effects on the daphnid metabolome.
1.7 Metabolomics data analysis
Metabolomics data is intrinsically multivariate so typically necessitates multivariate analysis.
The statistical tools chosen for metabolomics data analysis need to be selected according to
the objectives of the study (Dettmer et al. 2007). If the aim of the study is sample
classification (e.g. can control samples be distinguished from exposed samples) unsupervised
methods such as principal components analysis (PCA) can be used (Dettmer et al. 2007). PCA
has been widely used in metabolomics studies; it allows inherent clustering behaviour of
samples to be ascertained with no a priori knowledge of sample class (Coen et al. 2008).
Given that PCA does not use class information in construction of the model, it just attempts
to describe the overall variation in the data (Wise et al. 2006). PCA breaks down the data into
scores and loadings, scores reflect the relationship between individual samples whereas
loadings indicate the relationships between the variables (peaks) (Robertson 2005; Wise et
al. 2006). Principal components (PCs) describe decreasing amounts of variance in the data;
that is PC1 accounts for the greatest variance, followed by PC2 then PC3 and so on
(Robertson 2005). The number of PCs included in the PCA model is dependent on how best

- 36 -
to represent the variance in the dataset. All PC analyses use score plots (typically PC1 against
PC2) to visually determine if there are any natural clusters (Robertson et al. 2007); these
clusters allow for rapid identification of similar and dissimilar samples, indicating a common
effect or mechanism (Keun 2006). Whilst scores plots visually highlight the similarities and
differences between individual samples they give no mechanistic insight into their molecular
basis (Robertson 2005).
If the aim of the study is to discover characteristic biomarkers between groups (e.g. peaks
that distinguish between exposed and control groups), supervised classification methods
such as partial least squares discriminant analysis (PLS-DA) can also be used (Dettmer et al.
2007). PLS-DA uses prior knowledge of sample class to maximise separation and derive
predictive models based on the original data (Nicholson et al. 2002) and hence can be used
to determine variables that directly discriminate between classes (Wise et al. 2006). Latent
variables (LVs), which are similar to the PCs obtained from PCA, can be depicted as scores
plots with LV1 representing the highest variation that discriminates between the sample
classes, and the PLS-DA weightings (akin to PCA loadings) can be used as a feature selection
tool for identifying discriminating peaks (Baldovin et al. 1996). As this is a supervised analysis,
specifically looking for differences between the sample classes, the model must be cross-
validated in order to prevent over-fitting of the data and allow accurate prediction of sample
class. Cross-validation eliminates one or more samples (forming the test set) from the data,
building the predictive model with the remaining samples (the training set), this model is
then used for the classification of the samples in the test set; with the predictive capability of
the model assessed by determining a classification error rate using the difference between

- 37 -
the true and predicted values of the test set (Baldovin et al. 1996). Alongside the cross
validation, it is recommended that permutation testing is also performed. Here the data is
randomly permuted, mixing up the class labels, which should then create models with a
much higher classification error rate than the true models (i.e. those built using the correctly
labelled data) and thus giving confidence in the predictive capabilities of the true models, if
indeed they are robust. Examination of the loadings or weightings data can then determine
which peaks are responsible for any separation seen in the scores plots but it is important
not to interpret these as having any univariate significance (Robertson et al. 2007).
However, although metabolomics is in its nature multivariate, it is possible to utilise
univariate analysis with the right approaches. Standard statistical p-tests (e.g. ANOVA, t-test)
can be used to screen for peaks that change significantly, although due to the large size of
the datasets generated by metabolomics, the measurement of multiple variables will induce
a large number of false positives (Robertson et al. 2007). This means that when using a
significance value of 0.05 that chance alone means 5% of peaks could be wrongly assigned as
changing significantly (Benjamini and Hochberg 1995; Robertson et al. 2007). This false
discovery rate (FDR) needs to be accounted for, which can be achieved by calculating a
corrected significance level as described in Benjamini and Hochberg (Benjamini and
Hochberg 1995). For an FDR of 5% the following calculation: 0.05 × (p-value of the peak/total
number of peaks), creates an adjusted p-value; the peak is still considered to be changing
significantly if the original p-value is smaller than the FDR adjusted p-value. Both multivariate
classification techniques and FDR-corrected univariate statistics are employed in this thesis.

- 38 -
Finally, if the aim of the study is to relate the metabolic data to another set of measured
variables (e.g. reproductive output) then multivariate regression analysis can be employed
(Wise et al. 2006). Partial least squares regression (PLS-R) can be used to analyse
metabolomics data, whilst simultaneously modelling another response variable; the
metabolomics data are classed as predictors whereas the other measured variable(s) are
classed as responses (Wold et al. 2001). PLS-R attempts to find factors that both capture the
variance in the metabolomics data and achieve correlation with the response variable (Wise
et al. 2006). Again, cross validation needs to be employed as with PLS-DA to prevent over-
fitting of the data (Wold et al. 2001). The quality of the regression model can be assessed
after cross validation by comparing the measured and predicted values of the response
variable (e.g. reproductive output); this generates an R2 value that is indicative of how well
the model might predict the response variable of unknown samples (Wise et al. 2006; Wold
et al. 2001). To determine which metabolites are correlated to (i.e. predictive of) changes in
the response variable a regression vector can be generated, and the highlighted metabolites
can then, in theory, be putatively identified (Wise et al. 2006). Multiregression analyses are
also employed in this thesis, for discovering molecular markers that are predictive of D.
magna reproductive fitness

- 39 -
1.8 Research aims
Overall, the primary objective of this thesis research is to evaluate the potential of FT-ICR
mass spectrometry based metabolomics for use in first-tier, regulatory toxicity testing using
Daphnia magna; the specific aims of my research are:
1. To optimise an FT-ICR mass spectrometry based metabolomics approach using whole
organism homogenates of D. magna and to validate the technique using copper as a
model toxicant.
2. To optimise an FT-ICR mass spectrometry based metabolomics approach using D. magna
haemolymph and to validate the technique using cadmium as a model toxicant.
3. To develop robust multivariate models that can discriminate toxicant modes of action in
D. magna acute toxicity tests, utilising four model toxicants, and to evaluate whether the
haemolymph or whole organism metabolome is better at discriminating toxicant mode of
action.
4. To discover metabolic markers in individual D. magna exposed to model toxicants that
are predictive of higher level biological effects, specifically reproductive output.
These aims are addressed in Chapters 3, 4, 5 and 6 respectively.

- 40 -
CHAPTER TWO:
Materials and Methods
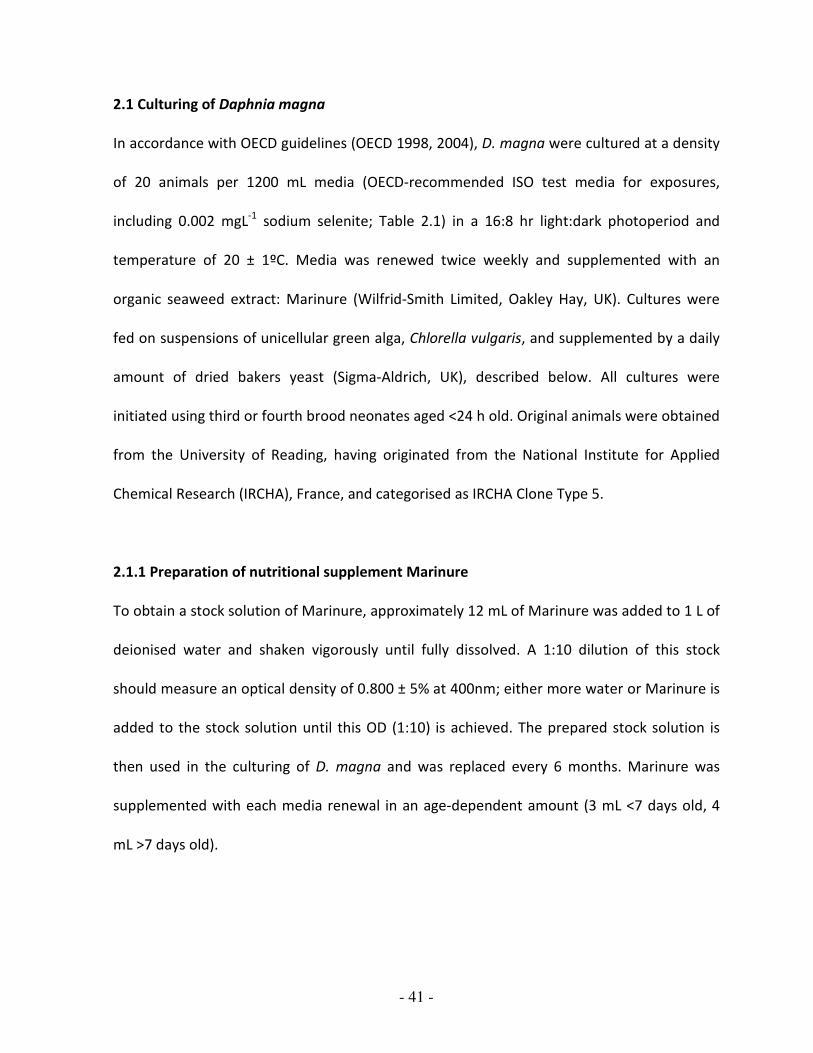
- 41 -
2.1 Culturing of Daphnia magna
In accordance with OECD guidelines (OECD 1998, 2004), D. magna were cultured at a density
of 20 animals per 1200 mL media (OECD-recommended ISO test media for exposures,
including 0.002 mgL-1
sodium selenite; Table 2.1) in a 16:8 hr light:dark photoperiod and
temperature of 20 ± 1ºC. Media was renewed twice weekly and supplemented with an
organic seaweed extract: Marinure (Wilfrid-Smith Limited, Oakley Hay, UK). Cultures were
fed on suspensions of unicellular green alga, Chlorella vulgaris, and supplemented by a daily
amount of dried bakers yeast (Sigma-Aldrich, UK), described below. All cultures were
initiated using third or fourth brood neonates aged <24 h old. Original animals were obtained
from the University of Reading, having originated from the National Institute for Applied
Chemical Research (IRCHA), France, and categorised as IRCHA Clone Type 5.
2.1.1 Preparation of nutritional supplement Marinure
To obtain a stock solution of Marinure, approximately 12 mL of Marinure was added to 1 L of
deionised water and shaken vigorously until fully dissolved. A 1:10 dilution of this stock
should measure an optical density of 0.800 ± 5% at 400nm; either more water or Marinure is
added to the stock solution until this OD (1:10) is achieved. The prepared stock solution is
then used in the culturing of D. magna and was replaced every 6 months. Marinure was
supplemented with each media renewal in an age-dependent amount (3 mL <7 days old, 4
mL >7 days old).

- 42 -
2.1.2 Culture of Chlorella vulgaris algal stock
Chlorella vulgaris was cultured in Bolds Basal Medium (BBM) in an aerated system under
photosynthetic light. A minimum of two C. vulgaris stocks were active at any time. BBM was
prepared as detailed in Table 2.2, and autoclaved prior to use. Algal suspensions were
alternately removed from these stock vessels in order to prepare as food for the daphnid
cultures and the volume taken replenished with BBM.
2.1.3 Preparation of Chlorella vulgaris algal feed
A known volume of C. vulgaris was taken from one of the main culture vessels, in order to
obtain the correct density of algae for the daphnids the OD (1:10) at 440nm required is
0.800. The algae was spun at 3000 rpm for 30 min at room temperature, the supernatant
discarded and the algae resuspended in the calculated volume of deionised water to achieve
the required density:
Resuspension volume = (measured OD (1:10) × volume of algae) / 0.800
Algal feed suspensions were stored at 4 °C and kept for a maximum of two weeks before
replacing with a fresh suspension. D. magna were fed daily with varying volumes of algae
depending on age: <2 days old: 1 mL; 3-7 days old: 1.5 mL; >7 days old: 2 mL per culture
vessel.

- 43 -
2.1.4 Preparation of Baker’s Yeast
10 mg of dried baker’s yeast was added to 100 mL of distilled water and dissolved using a
magnetic stirrer. This was stored at 4 °C and replaced every two weeks. A volume of 0.5 mL
per culture vessel was added daily to the daphnids.
Table 2.1 Media for Daphnia magna culturing and exposure, modified from OECD guidelines (OECD
1998, 2004).
Stock solutions
Substance Concentration
To prepare media add the
following volumes of stock
solutions to 1 litre water *
Calcium chloride
CaCl2·2H2O 11.76 gL
-1 25 mL
Magnesium sulphate
MgSO4·7H2O 4.93 gL
-1 25 mL
Sodium bicarbonate
NaHCO3 2.59 gL
-1 25 mL
Potassium chloride
KCl 0.23 gL
-1 25 mL
Sodium selenite
Na2SeO3 40 μgmL
-1 50 μL
* Water of suitable purity with conductivity not exceeding 10 μScm-1

- 44 -
Table 2.2 Bolds Basal Medium (BBM) for culturing of Chlorella vulgaris.
Stock solutions
Substance Weight Volume
Volume required to
make up 1 litre BBM *
di-potassium hydrogen
orthophosphate
(K2HPO4)
1.875 g 250 mL 10 mL
Potassium di-hydrogen
orthophosphate
(KH2PO4)
4.375 g 250 mL 10 mL
Magnesium sulphate
(MgSO4.7H2O) 1.875 g 250 mL 10 mL
Sodium Nitrate
(NaNO3) 6.250 g 250 mL 10 mL
Calcium chloride
(CaCl2.2H2O) 0.625 g 250 mL 10 mL
Sodium Chloride
(NaCl) 0.625 g 250 mL 10 mL
EDTA tetrasodium salt
(EDTA - Na4) +
Potassium hydroxide
(KOH)
5.000 g
3.100 g
100 mL 1 mL
Ferrous sulphate
(FeSO47H2O)
Sulphuric acid conc.
(H2SO4)
0.498 g
0.1 mL
100 mL 1 mL
Boric acid
(H3BO3) 1.142 g 100 mL 1 mL
Zinc sulphate
(ZnSO4.7H2O) 0.353 25 mL 0.1 mL
Manganese chloride
(MnCl2.4H2O) 0.058 25 mL 0.1 mL
Copper sulphate
(CuSO4.5H2O) 0.063 25 mL 0.1 mL
Cobaltous nitrate
(Co(NO3)2.6H2O) 0.020 25 mL 0.1 mL
Sodium molybdate
(Na2MoO4.2H2O) 0.048 25 mL 0.1 mL
* After making up to 1 litre with deionised water pH must be 6.7 ± 0.3

- 45 -
2.2 Toxicity exposures and animal capture
Exposure to toxicants is described for each individual study in each Chapter. Capture of
animals following exposures was dependent on the sample type to be analysed. For those
experiments where whole organism homogenates were to be analysed capture of exposed
animals was via filtration through a fine mesh gauze and then quickly transferred into a
Precellys™ homogenisation tube containing ceramic beads (CK14; Stretton Scientific Ltd, UK),
immediately frozen in liquid nitrogen, and transferred to storage at -80 °C prior to metabolite
extraction (Section 2.3.1). This whole process took ca. 30-45 s per sample. Capture of
exposed animals where haemolymph samples were to be analysed involved the immediate
extraction of the haemolymph at the end of the exposure period; this is as detailed in Section
2.3.2.
2.3 Metabolite extraction
2.3.1 Whole organism homogenates
Metabolites were extracted from whole D. magna using the two step
methanol:water:chloroform (2:2:1.8 final solvent ratio) protocol as described previously (Wu
et al. 2008). Since the D. magna samples were of such low mass some modifications were
made; all samples were assumed to weigh 10 mg wet mass and solvent volumes were
increased. Each sample was homogenised in 320 μL methanol and 128 μL water (both HPLC
grade) using a Precellys-24 ceramic bead-based homogeniser (Stretton Scientific Ltd, UK).
Samples were then transferred to 1.8 mL glass vials before adding 320 μL chloroform
(pesticide analysis grade) and 160 μL water, keeping the final solvent ratio as previously

- 46 -
described (Bligh and Dyer 1959; Wu et al. 2008). The biphasic mixture was centrifuged
(1,500-g) and the upper (polar) and lower (non-polar) fractions were removed, each split into
two equal volumes, and aliquotted into two 1.5 mL microcentrifuge tubes (polar fraction)
and two 1.8 mL glass vials (non-polar fraction). Samples were then dried in a centrifugal
concentrator (Thermo Savant, Holbrook, NY, USA) and stored at -80° C until FT-ICR analysis.
For each individual experiment an “extract blank” was also prepared using identical methods
except that no biological material was added to the solvents.
2.3.2 Haemolymph
Extraction of haemolymph from individual adult daphnids was as described in Mucklow and
Ebert (Mucklow and Ebert 2003). Immediately following the end of exposure, each daphnid
was placed on a clean microscope slide, rinsed with deionised water to remove any algae,
then carefully blotted dry. Next the haemolymph of the daphnid was sampled by pricking the
carapace close to the heart with a 21 gauge needle and collecting approximately 1 μL of the
haemolymph that immediately seeped out using a micropipette (Mucklow and Ebert 2003).
The haemolymph sample was immediately transferred to a microcentrifuge tube and stored
at -80° C until metabolite extraction. Metabolite extraction occurred the evening prior to FT-
ICR analysis. Due to the very small volume of haemolymph obtained only negative ion mass
spectrometry analysis could be undertaken, so metabolite extraction was by the addition of
30 μL 80:20 methanol:water (both HPLC grade) containing 20 mM ammonium acetate to the
sample and allowing for precipitation of proteins in the solvent overnight at -20° C. As for the

- 47 -
whole organism homogenate samples, for every study an extract blank was also prepared
with no addition of haemolymph.
2.4 FT-ICR mass spectrometry
Dried polar extracts from the whole organism homogenate samples were resuspended in 30
μL 80:20 methanol:water (both HPLC grade) containing 0.25% formic acid for positive ion
analysis, or in 30 μL 80:20 methanol:water containing 20 mM ammonium acetate for
negative ion analysis. The non-polar extracts were not used in this research. The
haemolymph samples were simply removed from the -20° C freezer on the day of analysis
following overnight metabolite extraction (Section 2.3.2). All samples were then centrifuged
at 5,000g for 10 minutes and 5 μL aliquots of each sample were loaded into a 96-well plate in
triplicate, covered with 20 μm easy-pierce heat-sealing foil and sealed using a Thermo-sealer
(Agbene, Epsom, UK). Samples were analyzed using a hybrid 7-T Fourier transform ion
cyclotron resonance mass spectrometer (LTQ FT, Thermo Scientific, Bremen, Germany)
equipped with a chip-based direct infusion nanoelectrospray ionisation assembly (Triversa,
Advion Biosciences, Ithaca, NY). Nanoelectrospray conditions comprised of a 200 nL/min flow
rate, 0.3 psi backing pressure, and +1.7 or -1.7 kV electrospray voltage (for positive and
negative ion analysis, respectively), controlled by ChipSoft software (version 8.1.0, Advion
Biosciences). Samples were analysed in triplicate using the SIM-stitching FT-ICR method from
m/z 70 to 500, as reported previously (Southam et al. 2007). Parameters included an
automatic gain control setting of 1 x 10⁵ (to control the number of ions entering the FT-ICR
detection cell) and a mass resolution of 100,000, and data was recorded for 5.5 min per

- 48 -
replicate analysis using Xcalibur software (version 2.0, Thermo Scientific). The “extract
blanks” were also analysed in triplicate using identical methods.
2.5 Data pre-processing
Transient data from the FT-ICR detector (i.e., in the time-domain) were processed as
described previously (Southam et al. 2007), including averaging of transients, Hanning
apodisation, zero filling once, and application of a fast Fourier transformation, all using
custom-written code in MATLAB (version 7, The MathWorks). Next, the SIM-stitching
algorithm was applied (version 2.10, custom-written MATLAB code; (Southam et al. 2007)),
which stitched together multiple SIM windows, rejected all peaks with a signal-to-noise ratio
(SNR) below 3.5, and then internally calibrated each mass spectrum using a pre-defined
calibrant list of known metabolites, listed in Tables 2.3 (haemolymph) and 2.4 (whole
organism homogenates). At this stage of processing each replicate analysis (i.e., of a total of
three per biological sample) consisted of a single list of peaks characterised by specific m/z
and intensity values. A novel two-stage peak filtering algorithm was then applied to the
dataset (Payne et al. 2009). The first stage, referred to as the “replicate filter”, retained only
those peaks which appeared in at least 2 out of the 3 technical replicate mass spectra to help
reject noise. Peaks were considered to arise from the same metabolite if they occurred
within a 1.5 ppm spread along the m/z axis. This generated a single peak list per biological
sample. Next, peaks in these lists that also occurred in the “extract blank” mass spectrum
were either removed or retained if they were more intense in the “extract blank” versus
biological sample dependent on a pre-defined ratio. The second stage of the peak filtering

- 49 -
algorithm, termed the “sample filter”, was used to further eliminate noise from the spectra
and also to reduce the problem of missing values. Using the peak lists from the replicate filter
(one per biological sample), the sample filter retained only those peaks which appeared in a
defined percentage of the biological samples in the dataset (e.g., in at least 50% of all
samples), using a defined (e.g. 2 ppm) spread along the m/z axis for defining unique peaks.
This results in a matrix of peak intensities, where each row corresponds to a unique sample
and each column to a unique peak, thus allowing for data comparison and the discovery of
differentially expressed metabolites (Dettmer et al. 2007).
Inevitably the matrix resulting from the two-stage peak filtering algorithm has entities
missing due to peaks only needing to be present in a pre-defined percentage of samples
(typically 50%). Therefore a similar strategy as Sangster et al. (Sangster et al. 2007) was
employed to replace the missing values by re-examining the original spectral data and
selecting features (typically below the initial SNR threshold of 3.5) that occurred at the
location of each missing peak. To minimise the impact of the variability of high intensity
peaks, data normalisation and transformation was employed (Dettmer et al. 2007). Spectra
were normalised using probabilistic quotient normalisation (PQN) where all peaks are
individually assessed, allocated a normalisation scaling factor, and the median scaling factor
is then used to normalise the entire spectra thus avoiding the use of highly variable peaks
(Dieterle et al. 2006). Transformation of the data is intended to reduce the intrinsic variability
of high intensity peaks relative to low intensity ones (Dettmer et al. 2007). Technical
variation caused by sample preparation and detection means that the absolute intensity
changes of highly abundant peaks are larger than those of lower abundance peaks and are
- 50 -
hence seen as more important in subsequent multivariate statistical analysis. Here we used a
generalised-log (g-log) transformation to stabilise (i.e. “normalise”) technical variance across
the peaks by reducing the intensity of highly abundant peaks and increasing the intensity of
lower abundance peaks, effectively evening out technical variation across the samples and
preventing highly abundant peaks from dominating any multivariate analysis (Parsons et al.
2007). The g-log transformation parameter, λ, was optimised using six technical replicate
mass spectra of one biological sample (six adults individually extracted and then pooled to
obtain enough biological material) in order to estimate technical variance and select an
appropriate λ value for both positive and negative ion analysis (Parsons et al. 2007). The λ
values calculated and used in this thesis were 5.8365 × 10⁻⁹
for positive ion data and 7.3097 ×
10-11
for negative ion data. All of these data pre-processing steps result in the production of a
final processed data matrix that can be used for statistical analysis.

- 51 -
Table 2.3 The empirical formula, ion form (i.e. molecular ion or adduct), and exact mass of each
internal calibrant used to calibrate the negative ion (23 peaks) SIM-stitched spectra of D. magna
haemolymph extracts.
Empirical formula Ion form Theoretical exact mass (Da)
C3H7NO2 [M-H]- 88.04040
C3H6O3 [M-H]- 89.02442
CH2O2 [M+Ac]- 105.01933
C2H4O2 [M+Ac]- 119.03498
C5H10N2O3 [M-H]- 145.06187
C6H9N3O2 [M-H]- 154.06220
C9H11NO2 [M-H]- 164.07170
C6H12O6 [M-H]- 179.05611
C11H12N2O2 [M-H]- 203.08260
C9H11NO3 [M+35
Cl]- 216.04330
C6H12O6 [M+Ac]- 239.07724
C16H32O2 [M-H]- 255.23295
C9H12N2O6 [M+35
Cl]- 279.03894
C10H13N5O4 [M+35
Cl]- 302.06616
C18H35NO [M+35
Cl]- 316.24127
C18H35NO [M+37
Cl]- 318.23832
C18H35NO [M+Ac]- 340.28572
C22H43NO [M+35
Cl]- 372.30387
C22H43NO [M+37
Cl]- 374.30092
C22H43NO [M+Ac]- 396.34832
C22H26O6 [M+35
Cl]- 421.14234
C22H26O6 [M+37
Cl]- 423.13939
C22H26O6 [M+Ac]- 445.18679

- 52 -
Table 2.4 The empirical formula, ion form (i.e. molecular ion or adduct), and exact mass of each
internal calibrant used to calibrate the positive (27 peaks) and negative ion (22 peaks) SIM-stitched
spectra of D. magna whole organism homogenate extracts.
Empirical formula Ion form Theoretical exact mass (Da)
Positive ion
C3H7NO2 [M+H]+ 90.05495
C5H9NO2 [M+H]+ 116.07060
C5H11NO2 [M+H]+ 118.08625
C6H13NO2 [M+H]+ 132.10190
C5H10N2O3 [M+H]+ 147.07642
C6H14N2O2 [M+H]+ 147.11280
C5H9NO4 [M+H]+ 148.06043
C5H11NO2S [M+H]+ 150.05833
C6H13NO2 [M+Na]+ 154.08384
C6H9N3O2 [M+H]+ 156.07675
C9H11NO2 [M+H]+ 166.08625
C6H14N4O2 [M+H]+ 175.11895
C9H11NO3 [M+H]+ 182.08117
C11H12N2O2 [M+H]+ 205.09715
C12H24O3 [M+H]+ 217.17982
C12H24O3 [M+Na]+ 239.16177
C12H24O3 [M+39
K]+ 255.13570
C18H36O2 [M+H]+ 284.29479
C18H36O2 [M+Na]+ 306.27674
C12H22O11 [M+Na]+ 365.10543
C22H26O6 [M+H]+ 387.18021
C24H38O4 [M+H]+ 391.28429
C22H26O6 [M+Na]+ 409.16216

- 53 -
C24H38O4 [M+Na]+ 413.26623
C22H26O6 [M+39
K]+ 425.13609
C24H38O4 [M+39
K]+ 429.24017
C24H47NO7 [M+Na]+ 484.32447
Negative ion
CH2O2 [M+35
Cl]- 80.97488
C3H7NO2 [M-H]- 88.04040
C3H6O3 [M-H]- 89.02442
CH2O2 [M+Ac]- 105.01933
C2H4O2 [M+Ac]- 119.03498
C5H10N2O3 [M-H]- 145.06187
C5H9NO4 [M-H]- 146.04588
C6H12O6 [M-H]- 179.05611
C11H12N2O2 [M-H]- 203.08260
C6H12O6 [M+Ac]- 239.07724
C16H32O2 [M-H]- 255.23295
C10H13N5O4 [M+35
Cl]- 302.06616
C8H20NO6P [M+Ac]- 316.11668
C18H35NO [M+35
Cl]- 316.24127
C18H35NO [M+37
Cl]- 318.23832
C18H35NO [M+Ac]- 340.28572
C22H43NO [M+35
Cl]- 372.30387
C22H43NO [M+37
Cl]- 374.30092
C22H43NO [M+Ac]- 396.34832
C22H26O6 [M+35
Cl]- 421.14234
C22H26O6 [M+37
Cl]- 423.13939
C22H26O6 [M+Ac]- 445.18679
- 54 -
2.6 Putative identification of empirical formulae and metabolites
Between zero and many potential empirical formulae (CCHHNNOOPPSS) were calculated for
each of the experimentally detected peaks in the data matrix described above. This was
achieved using a custom-written elemental composition calculator (Weber and Viant
submitted) in which the number of occurrences of each element were restricted as follows:
12C = 0-34,
1H = 0-72,
14N = 0-15,
16O = 0-19,
31P = 0-4 and
32S = 0-3 (Kind and Fiehn 2007). In
addition, since the observed peaks correspond to charged molecular ions or adducts of the
neutral metabolites, the masses of the seven most common positive or negative ion adducts
were effectively added to the elemental composition calculator. In practice, the calculation
was conducted seven times for each positive ion peak (i.e. allowing for [M-e]+, [M+H]
+,
[M+Na]+, [M+
39K]
+, [M+
41K]
+, [M+2Na-H]
+, [M+2
39K-H]
+) or seven times for each negative ion
peak (i.e. allowing for [M+e]-, [M-H]
-, [M+
35Cl]
-, [M+
37Cl]
-, [M+Na-2H]
-, [M+
39K-2H]
-, [M+Ac]
-,
where Ac=acetate). Only those empirical formulae with an absolute mass error of <0.75 ppm
were recorded, and then all potential formulae were filtered using four heuristic rules
reported by Kind and Fiehn (Kind and Fiehn 2007), specifically: (1) restricted number of
atoms per element, (2) Lewis and Senior rules, (3) H/C ratio, and (4) elemental ratio of N, O,
P, and S versus C. Note that these rules were applied to the neutral metabolites following
subtraction of the adduct; e.g. applied to [C5H9NO2] not to [C5H9NO2+Na]+. In some cases, the
13C isotope of CCHHNNOOPPSS was identified, allowing the approximate determination of the
number of carbon atoms in the molecule based upon the intensity ratio of the 12
C and 13
C
peaks.

- 55 -
The putative metabolite identity of each of the observed peaks was determined based upon
accurate mass measurements, which was achieved using custom-written script (in Python
and MySQL; by Ralf Weber, Centre for Systems Biology, University of Birmingham) and the
Kyoto Encyclopedia of Genes and Genomes (KEGG) database (Kanehisa et al. 2006). First the
KEGG LIGAND database was downloaded and the exact mass of each entry was re-calculated
based on the associated empirical formula; this served to increase the mass accuracy to 6
decimal places. Then the exact mass of each entry (neutral compound) was modified to allow
for the formation of all 14 adduct ions listed above. For example, the database record
glucose (KEGG ID C00031, m/z 180.063390) was extended by different adduct masses such as
m/z 203.052611 for [glucose+Na]+, m/z 215.032792 for [glucose+
35Cl]
-, etc. Next the m/z
values of all the experimentally observed peaks were compared to the modified KEGG data
and matches with an absolute mass error of <0.75 ppm.
2.7 Statistical analysis
2.7.1 Multivariate statistics
For all multivariate statistics the metabolic data matrix used had previously been normalised
and g-log transformed. PCA and PLS-DA were both employed in this thesis as multivariate
classification techniques, using the PLS_Toolbox (v 4.21) in Matlab (Eigenvector Research,
USA). PCA was used as an unbiased analysis to visually depict whether there was any
separation between sample classes in each study. The number of PCs included in each model
typically accounted for at least 60% of the total variance of the dataset. Scores plots were
generated depicting two PCs plotted against each other (typically PC1 against PC2) allowing

- 56 -
rapid identification of clusters that indicate inherent similarities within the samples
(Nicholson et al. 2002).
PLS-DA was used to maximise separation and derive predictive models based on the original
data (Nicholson et al. 2002). A Y matrix was constructed containing sample class information,
consisting of one variable for each class in the model, a value of 1 if the sample belongs to a
class, or 0 if not (Coen et al. 2008; Keun 2006). By regressing against the Y matrix, latent
variables (LVs) can be derived that separate the classes (Keun 2006). Cross-validation was
employed to test the stability of the model (Rubingh et al. 2006) using a method known as
venetian blinds. Here a pre-defined number of samples (square root of the total number of
samples) were left out when building the model and then used to generate a classification
error rate for each sample class. To determine the robustness of the predictive models,
random permutations of the class labels (n=1000) were used to generate a mean permuted
classification error for comparison with the real classification error. The number of LVs used
in the model accounted for at least 50% of the total variation, and the scores plots (typically
LV1 against LV2) allowed visualisation of similarities and differences between samples.
Weightings data was used as a feature selection tool, in order to elucidate those peaks that
discriminated between sample classes (Baldovin et al. 1996). For one investigation a
multivariate regression technique, PLS-R, was used to link changes in reproductive output to
metabolic changes and this is detailed in Chapter 6.

- 57 -
2.7.2 Univariate Statistics
The metabolomics data used for univariate statistical analysis were normalised but not g-log
transformed. For each dataset either a Student’s t-test or ANOVA, depending on the number
of sample classes in the study, were applied to determine if any peaks were changing
significantly. Due to the large number of tests being carried out a FDR of 5% was utilised to
correct for any false positive results (Benjamini and Hochberg 1995). Following this the fold
changes (between control and exposed groups) of these putatively identified significant
peaks were calculated.
- 58 -
CHAPTER THREE:
Optimisation and validation of FT-ICR MS based
metabolomics using whole organism homogenates of
Daphnia magna†
†The contents of this Chapter, including the figures have been published in Metabolomics:
Taylor, N. S.; Weber, R. J. M.; Southam, A. D.; Payne, T. G.; Hrydziuszko, O.; Arvanitis, T. N.; Viant, M. R. A new
approach to toxicity testing in Daphnia magna: Application of high throughput FT-ICR mass spectrometry
metabolomics. Metabolomics. 2009, 5 (1), 45-58.

- 59 -
3.1 Introduction
Currently there is a surge of interest in developing toxicogenomic techniques, including
transcriptomics, proteomics and metabolomics, to advance the screening of individual
chemicals, allowing more rapid and accurate categorisation into defined classes according to
their MOA, and thereby help to prioritise chemicals for further evaluation (Benson et al.
2007; US-EPA 2004). Furthermore, within the framework of tiered toxicity testing,
toxicogenomic techniques may better direct the focus of resources within the higher tier
tests (Ankley 2008).
As discussed in Chapter 1, Daphnia magna is a keystone species in the freshwater ecosystem
that is extensively used as a toxicity test species and recently, several toxicogenomic studies
of this species have been reported (Connon et al. 2008; Heckmann et al. 2008; Poynton et al.
2007; Soetaert et al. 2007a; Soetaert et al. 2007b; Watanabe et al. 2007). Although
metabolomics is also recognised to be a powerful tool for investigating toxicity (Coen et al.
2008; Nicholson et al. 2002; Robosky et al. 2002), including in the field of aquatic toxicology
(Ekman et al. 2008; Viant 2007; Viant et al. 2005; Viant et al. 2006b), no metabolomics
studies of utilising D. magna have been reported.
This Chapter describes the application of FT-ICR MS based metabolomics for assessing toxic
responses in D. magna. Specifically, the approach is a nESI DIMS technique that utilises the
SIM spectral stitching method, which has been shown to detect over 3000 peaks in a liver
extract of dab (Limanda limanda), a marine flatfish (Southam et al. 2007). FT-ICR is widely
accepted to be one of the most powerful tools for the analysis of complex mixtures of

- 60 -
metabolites since it offers the highest mass accuracy and resolution of all mass
spectrometers (Breitling et al. 2006; Breitling et al. 2008; Brown et al. 2005; Han et al. 2008).
Here the effectiveness of DI FT-ICR MS metabolomics for toxicity testing in D. magna is
evaluated. The initial aim was to optimise the daphnid biomass to extract and analyse by
nanoelectrospray MS in order to detect a large number of metabolites with high
reproducibility. This was optimised for both neonatal and adult D. magna since both life
stages are used in OECD toxicity testing (OECD 1998, 2004). The second aim was to validate
the metabolomics approach using copper as a model toxicant in an OECD 24-h acute toxicity
test. The overall goal was to conduct the first steps in evaluating the effectiveness of high
throughput, ultrahigh resolution mass spectrometry based metabolomics as a tool for
screening and prioritising chemicals within tiered risk assessment.
3.2 Materials and Methods
3.2.1 Biomass optimisation study
To determine the optimal biomass of D. magna for FT-ICR mass spectrometry, varying
numbers of adults (1, 2 and 5 animals) and neonates (10, 20 and 50) were analysed (n=3
replicates per group size). All animals were obtained from the D. magna culture, adults aged
14 days, and third brood neonates < 24 h old. Animals were captured and flash frozen as
described in Chapter 2 and samples were stored at -80°C prior to metabolite extraction. The
aim was to determine what biomass of D. magna was required to generate high quality mass
spectra with a large number of peaks and low technical variation (i.e., high reproducibility)
across the three replicate analyses of each biological sample.

- 61 -
3.2.2 Copper toxicity testing
To determine the appropriate copper concentrations for the acute toxicity study, an initial
range-finding experiment was performed. Groups of 30 neonates (<24 h old) in 250 mL of
clean media were exposed to increasing concentrations of CuSO4·5H20 (calculated as Cu2+
ions) for 24 h. Nominal concentrations of 0, 5, 10, 25, 50, 75 and 100 μgL-1
were used (n=5
test beakers per concentration). No food or supplements were provided during this exposure
and any mortality after 24 h was recorded.
Subsequently, a more extensive acute copper exposure study was undertaken. Groups of 30
neonates (<24 h old) in 250 mL of clean media were exposed to nominal copper
concentrations of 0, 5, 10, 25 and 50 μgL-1
for 24 h (n=6 per concentration). During the
method optimisation studies it was discovered that the number of animals analysed by FT-
ICR per exposure beaker must be kept constant (refer to Section 3.3.1). Since dead animals
were not retained on the mesh gauze during filtering and therefore were not analysed, it was
necessary to set up an additional exposure beaker for the highest concentration group (50
μgL-1
) to guarantee that at final sampling each of the six replicates comprised of 30 live
neonates. Animals were captured and stored as described in Chapter 2.
3.2.3 Metabolite extraction and FT-ICR mass spectrometry
Metabolites were extracted from whole D. magna using the two-step
methanol:water:chloroform protocol as detailed in Chapter 2. The dried polar extracts were
resuspended in 30 μl of 80:20 methanol:water with the addition of either 0.25% formic acid
for positive ion analysis or 20mM ammonium acetate for negative ion MS analysis. All
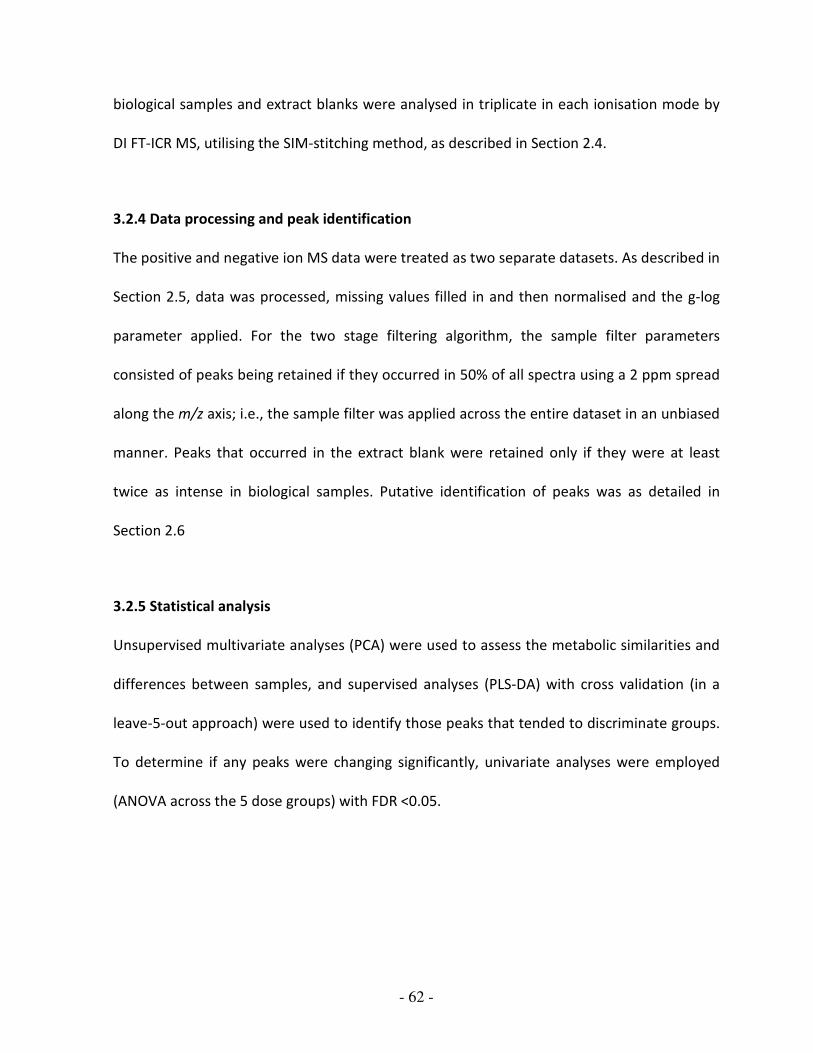
- 62 -
biological samples and extract blanks were analysed in triplicate in each ionisation mode by
DI FT-ICR MS, utilising the SIM-stitching method, as described in Section 2.4.
3.2.4 Data processing and peak identification
The positive and negative ion MS data were treated as two separate datasets. As described in
Section 2.5, data was processed, missing values filled in and then normalised and the g-log
parameter applied. For the two stage filtering algorithm, the sample filter parameters
consisted of peaks being retained if they occurred in 50% of all spectra using a 2 ppm spread
along the m/z axis; i.e., the sample filter was applied across the entire dataset in an unbiased
manner. Peaks that occurred in the extract blank were retained only if they were at least
twice as intense in biological samples. Putative identification of peaks was as detailed in
Section 2.6
3.2.5 Statistical analysis
Unsupervised multivariate analyses (PCA) were used to assess the metabolic similarities and
differences between samples, and supervised analyses (PLS-DA) with cross validation (in a
leave-5-out approach) were used to identify those peaks that tended to discriminate groups.
To determine if any peaks were changing significantly, univariate analyses were employed
(ANOVA across the 5 dose groups) with FDR <0.05.

- 63 -
3.3 Results and Discussion
3.3.1 Biomass optimisation study
The initial aim was to determine what biomass of D. magna was required to generate high
quality mass spectra with a large number of peaks and low technical variation (i.e., high
reproducibility) across the three replicate analyses of each biological sample. The dry mass of
a single neonate (7.46 ± 0.27 µg) and adult D. magna (301 ± 18 µg) were determined. The
group sizes of 10, 20 and 50 neonates and 1, 2 and 5 adults therefore corresponded to dry
masses of 74.6, 149, 373, 301, 602 and 1505 μg, respectively. An FT-ICR analysis (in positive
ion mode only) of these 6 group sizes, with n=3 replicate samples per group size was
conducted. The mass spectra were processed using a 2 out of 3 replicate filter (for the 3
technical replicates per biological sample) followed by a sample filter that retained only
those peaks that occurred in at least 66% of the samples (for each group size independently)
generating a single peak list for each group. Representative FT-ICR mass spectra of the polar
extracts from whole D. magna neonates, in positive and negative ion modes, are shown in
Figure 3.1a and b respectively.
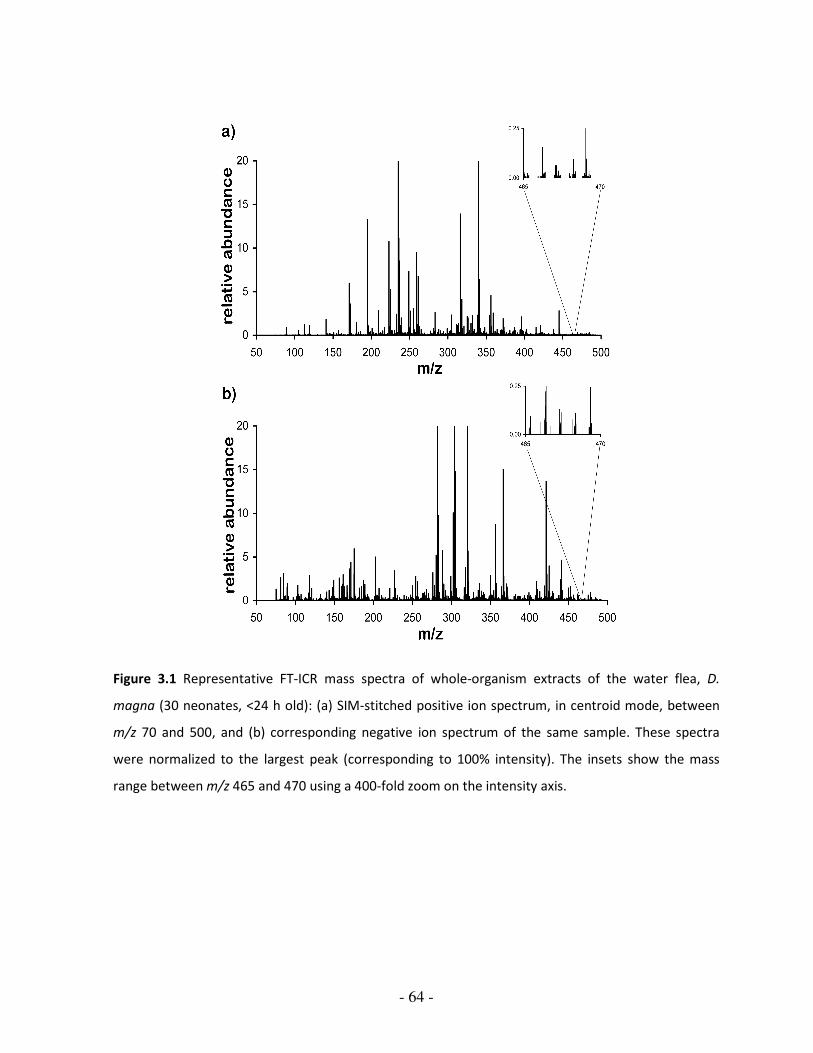
- 64 -
Figure 3.1 Representative FT-ICR mass spectra of whole-organism extracts of the water flea, D.
magna (30 neonates, <24 h old): (a) SIM-stitched positive ion spectrum, in centroid mode, between
m/z 70 and 500, and (b) corresponding negative ion spectrum of the same sample. These spectra
were normalized to the largest peak (corresponding to 100% intensity). The insets show the mass
range between m/z 465 and 470 using a 400-fold zoom on the intensity axis.

- 65 -
A software tool was developed (by Olga Hrydziuszko, Centre for Systems Biology, University
of Birmingham) to visualise which peaks were common (or not) across the extract blank and
multiple biological mass spectra using the peak lists generated from the sample filter (Figure
3.2a). The peaks in the extract blank likely include contaminants from the air and compounds
such as plasticisers that may leach from the plastic sample preparation tubes.
From Figure 3.2a it is evident that the majority of peaks occurring in the extract blank
spectrum were suppressed as soon as biological metabolites from the daphnid extracts were
present and able to compete for charge during nanoelectrospray ionisation. This is a clear
demonstration of the finite dynamic range of the mass spectrometric detector.
Further examination of Figure 3.2a shows that as the biomass increased, up to a maximum of
5 pooled adults in a single extract, additional unique peaks were detected but at the expense
of losing some peaks detected in the lower mass groups. To summarise this more clearly,
Figure 3.2b shows the total peak count for each group size (with all extract blank peaks
removed), as well as a measure of spectral reproducibility.
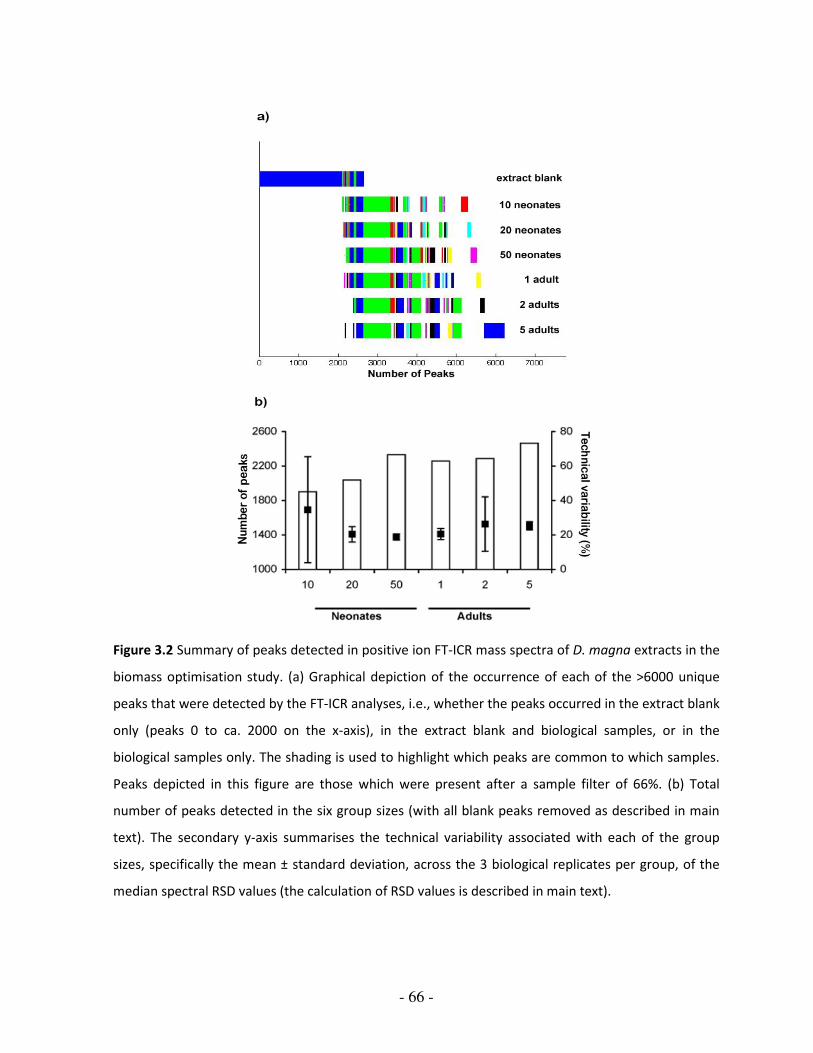
- 66 -
Figure 3.2 Summary of peaks detected in positive ion FT-ICR mass spectra of D. magna extracts in the
biomass optimisation study. (a) Graphical depiction of the occurrence of each of the >6000 unique
peaks that were detected by the FT-ICR analyses, i.e., whether the peaks occurred in the extract blank
only (peaks 0 to ca. 2000 on the x-axis), in the extract blank and biological samples, or in the
biological samples only. The shading is used to highlight which peaks are common to which samples.
Peaks depicted in this figure are those which were present after a sample filter of 66%. (b) Total
number of peaks detected in the six group sizes (with all blank peaks removed as described in main
text). The secondary y-axis summarises the technical variability associated with each of the group
sizes, specifically the mean ± standard deviation, across the 3 biological replicates per group, of the
median spectral RSD values (the calculation of RSD values is described in main text).

- 67 -
The reproducibility was determined by first calculating the relative standard deviations
(RSDs) of the intensities of all the peaks that appeared in 3 out of 3 technical replicates per
sample. The median RSD value was then used to represent the reproducibility for that mass
spectrum, a parameter recently proposed as a valuable benchmark in metabolomics (Parsons
et al. 2009). Figure 3.2b shows the mean of the 3 median RSD values (one RSD value per
biological replicate). Considering the total peak counts, group sizes of 10 and 20 pooled
neonates resulted in an apparent reduction in the number of peaks detected, whereas 50
neonates and 1, 2 or 5 adults yielded greater and more consistent numbers of peaks. The
spectral reproducibility appeared largely independent of biomass analysed, with a single 10-
neonate sample and 2-adult sample having unusually poor reproducibility, generating large
error bars.
The biomass optimisation data was further analysed using PCA to visualise any metabolic
differences between the 10, 20 and 50 neonate and 1, 2 and 5 adult group sizes. The scores
plot (Figure 3.3) highlights three significant points. First, the three biological replicates per
group size are relatively well clustered, as would be anticipated, providing a degree of
validation to the FT-ICR metabolomics data acquisition and processing strategies. Second,
there is separation of the neonatal and adult D. magna along the PC1-PC3 axis (t-test on PC1-
PC3 scores, p=5.95×10⁻⁹
), which is not surprising given the difference in developmental
stages. This separation could also be affected by the gut contents of the adult daphnids at
the time of sampling, whereas the neonates were not exposed to food prior to sampling.
Third, and most importantly, the separation along PC1 (which accounts for 41% of the
variance in the dataset) correlates well with the mass of D. magna that was extracted and

- 68 -
analysed. For example, 10 neonates (74.6 μg) have the largest PC1 score, the approximately
equivalent masses of 50 neonates (373 μg) and 1 adult (301 μg) both have a PC1 score close
to zero, and 5 adults (1505 μg) have the most negative PC1 score. The separation along PC1 is
a highly statistically significant (ANOVA, p=1.66×10⁻¹¹
, followed by a Tukey-Kramer post-hoc
test that revealed significant differences between all combinations of the six group sizes
except between 1 adult and 50 neonates, and between 10 and 20 neonates). This clearly
illustrates that varying the biomass induces a noticeable change in the FT-ICR metabolic
profile, as suggested by Figure 3.2a, and highlights the critical need to standardise the
biomass per sample within a metabolomics study.
Figure 3.3 PCA scores plot from analysis of the positive ion FT-ICR mass spectra from the D. magna
biomass optimisation study. Polar extracts from varying numbers of animals were analysed, each in
triplicate: 10 neonates (∇), 20 neonates (□), 50 neonates (○), 1 adult (▼), 2 adults (■), and 5 adults
(●).

- 69 -
Considering all these results it was concluded that a D. magna sample of dry mass ca. 300 μg
can be extracted and analysed in triplicate, yielding high quality spectra with a large number
of peaks and low technical variation.
However, a practical requirement for high throughput toxicity testing is to minimise the
number of animals per exposure group, in order to minimise the culture volumes and total
number of daphnids required. Therefore all subsequent studies using D. magna neonates
were conducted using 30 animals per sample and those studies using D. magna adults were
conducted using a single individual per sample.
3.3.2 Acute copper range-finding study
An acute 24-h toxicity test of D. magna neonates (<24 h old) to increasing concentrations of
copper was conducted in order to select appropriate exposure concentrations for the
subsequent metabolomics study. The onset of mortality occurred at 50 μgL-1
enabling an LC50
of between 50 and 75 µgL-1
to be determined (Figure 3.4). In order to minimise lethality, 50
μgL-1
was selected as the highest dose for the metabolomics study.

- 70 -
Figure 3.4 Dose-mortality relationship determined from an acute exposure of <24-h old D. magna
neonates to waterborne copper. Data shows nominal metal concentrations.

- 71 -
3.3.3 Acute copper toxicity metabolomics study
Based upon the range-finding study, doses of 0, 5, 10, 25 and 50 µgL-1
were selected (n = 6
beakers, each containing 30 neonates, per dose). Additionally, since it was demonstrated in
Section 3.3.1 that samples analysed by FT-ICR should have a similar biomass, an additional
exposure beaker was added for the highest dose group so that there were sufficient animals
for 30 live D. magna per sample. After 24 h, 7% mortality was observed at 50 µgL-1
(the dead
animals were discarded, replaced with similarly-exposed live ones, and samples rapidly
frozen) while no mortality was observed at 25 µgL-1
or below. FT-ICR analysis was conducted
on all 30 samples, in positive and negative ion modes, and the spectra were processed as
described. The total number of peaks comprised 1848 for positive ion and 3599 for negative
ion mode (Table 3.1), giving a total of 5447 peaks.
Table 3.1 Summary of the total number of peaks in positive and negative ion datasets of D. magna
neonate extracts, and the number of those peaks that could be assigned empirical formulae and
putative metabolite identities.
a Following removal of assignments in which the match was a non-endogenous metabolite such as a
drug, plasticiser or pesticide.
Number of peaks Negative ion Positive ion Total
Total (after replicate & sample filters) 3599 1848 5447
Assigned to ≥1 empirical formulae 3290 1478 4768
Assigned to unique empirical formula 231 675 906
Assigned to ≥1 KEGG LIGAND ID a 734 283 1017

- 72 -
PCA was then used to visualise any metabolic differences between the FT-ICR metabolic
profiles of control and exposed animals. The PC scores plots for negative (Figure 3.5a) and
positive (Figure 3.5b) ion data were consistent, both showing the 0, 5 and 10 µgL-1
exposed
D. magna tending to cluster together, while the 25 and 50 µgL-1
groups occurred at higher PC
scores. One sample did not fit this trend (sample 24, 5 µgL-1
group), which was evident in
both the positive and negative ion analyses. The overall differences between the metabolic
profiles were confirmed to be significant via ANOVAs of the PC scores. Specifically, significant
separation of exposure groups occurred along PC1 (p=8.94×10⁻³
) and PC1+PC2 (p=7.76×10⁻⁶
)
for the negative ion data (Figure 3.5a), and along PC2 (p=3.08×10⁻²
) and PC2+PC3 (p=9.06×10-
4) for the positive ion data (Figure 3.5b). Subsequent post-hoc tests (Tukey-Kramer)
performed on both the negative (PC1+PC2) and positive (PC2+PC3) ion data identified that
there was a significant difference between the 0, 5 and 10 µgL-1
doses compared to the 25
and 50 µgL-1
doses, but no significant differences within these two groupings.

- 73 -
Figure 3.5 PCA scores plots from analysis of (a) negative ion, and (b) positive ion FT-ICR mass spectra
of whole organism extracts of D. magna neonates that were exposed to a series of copper
concentrations: 0 (▼), 5 (●), 10 (■), 25 (○) and 50 (□) µgL-1
. Both scores plots show a dose-dependent
metabolic response to copper along the diagonal axis, from the bottom left to top right. Sample 24
consistently appears as an outlier in both datasets.

- 74 -
The next step was to discover which peaks were responsible for the separation in
multivariate space. Therefore, based upon the results of the post-hoc tests, the treatments
were reclassified: the 0, 5 and 10 µgL-1
treatments termed as “no effect” and the 25 and 50
µgL-1
treatments termed as “effect”, then conducted PLS-DA on this 2-class dataset (n=18
and 12 in “no effect” and “effect” classes, respectively). This strategy was used since the
existing 5-class dataset, with n=6 per class, would be highly susceptible to over-fitting in a
supervised analysis. Even with sample sizes of n=18 and 12 there is the potential for over-
fitting. As expected, the separation of the “no effect” and “effect” classes in the PLS scores
plots (Figure 3.6) improved upon the PCA results, though this alone provides relatively little
new information (Westerhuis et al. 2008). However, the PLS models were internally cross-
validated, achieving classification error rates of 6.94% and 2.78% for positive and negative
ion data, respectively. Furthermore, when the class labels were randomly permuted the
classification error rates increased to between 40 and 65%, giving us still greater confidence
in the real PLS models. Note that the aim was not so much to build predictive models of
copper toxicity, but rather to use PLS as a feature selection tool to find those peaks that
distinguished the “no effect” and “effect” classes (Baldovin et al. 1996).

- 75 -
Figure 3.6 PLS-DA scores plots from analysis of (a) negative ion, and (b) positive ion FT-ICR mass
spectra of whole organism extracts of D. magna neonates that were exposed to a series of copper
concentrations. Based upon statistically significant findings from unsupervised PCA of the same data,
the 5 concentration groups were re-categorised as either “no effect” (▼; 0, 5 and 10 µgL-1
) or “effect”
(∇; 25 and 50 µgL-1
). Both scores plots show a dose-dependent metabolic response to copper along
the LV1+LV2 diagonal axis, and the cross-validated PLS models yielded classification error rates of
6.94% and 2.78% for positive and negative ion data, respectively. Sample 24 consistently appears as
an outlier in both datasets.

- 76 -
Next the absolute values of the LV1 weightings were ranked for both the positive ion and
negative ion analyses. In addition, to check that these top weighted peaks did in fact change
intensity in response to copper toxicity, all 1848 peaks in the positive ion dataset and 3599
peaks in the negative ion data were examined using univariate statistics. Ten of the top 12
LV1 weightings from the positive ion dataset corresponded to peaks that changed
significantly with copper exposure. Similarly, for the negative ion data, 10 of the top 16 LV1
weightings were significant. The top weighted peaks that were also significant (with
FDR<0.05) are listed in Table 3.2, for positive and negative ion data, along with their
associated p-value and fold-change between the control (0 µgL-1
) and highest dose (50 µgL-1
)
groups. To justify the use of these supervised analyses in this study, even when some
separation of classes was evident in the unsupervised PCA, we compared the peaks with the
top LV weightings with those with the top PC loadings (from the PLS-DA and PCA models
described above, respectively). Table 3.3 shows that the two approaches found similar peaks
for the negative ion data, but that this was not the case for the positive ion data for which
the PLS-DA found many more highly ranked significant peaks.

- 77 -
Table 3.2 Summary of the top weighted peaks following PLS-DA for both positive and negative ion analyses of D. magna neonate extracts
exposed to copper.
Observed
peak (m/z)
p-value a
Fold
change b
No. of C
atoms
Potential
empirical
formulae
Absolute
mass
error
(ppm)
Ion form
Putative
metabolite
identification
Positive ion
398.37427 1.41×10⁻⁵
6.843 27.0±5.1 C23H47N3O2 0.418 [M+H]+ M1 (
12C)
399.37761 3.45×10⁻⁵
6.640 27.0±5.1 C23H47N3O2 0.106 [M+H]+ M1 (
13C)
275.06259 5.66×10⁻⁶
0.236 - C10H17N2OP3 0.230 [M+H]+ ?
C5H14N8OS 0.671 [M+41
K]+
C10H10N6O 0.674 [M+2Na-H]+
182.08119 2.86×10⁻⁷
0.393 9.3±0.5 C9H11NO3 0.108 [M+H]+ tyrosine (
12C)
463.35321 1.33×10⁻³
0.573 25.7±3.0 C23H50N3O4P 0.294 [M-e]+ M2 (
12C)
C27H46N2O4 0.379 [M+H]+
188.17572 1.72×10⁻⁵
2.948 - C9H21N3O 0.098 [M+H]+
N-acetyl-
spermidine
183.08454 4.29×10⁻⁷
0.412 - C9H11NO3 0.160 [M+H]+ tyrosine (
13C)
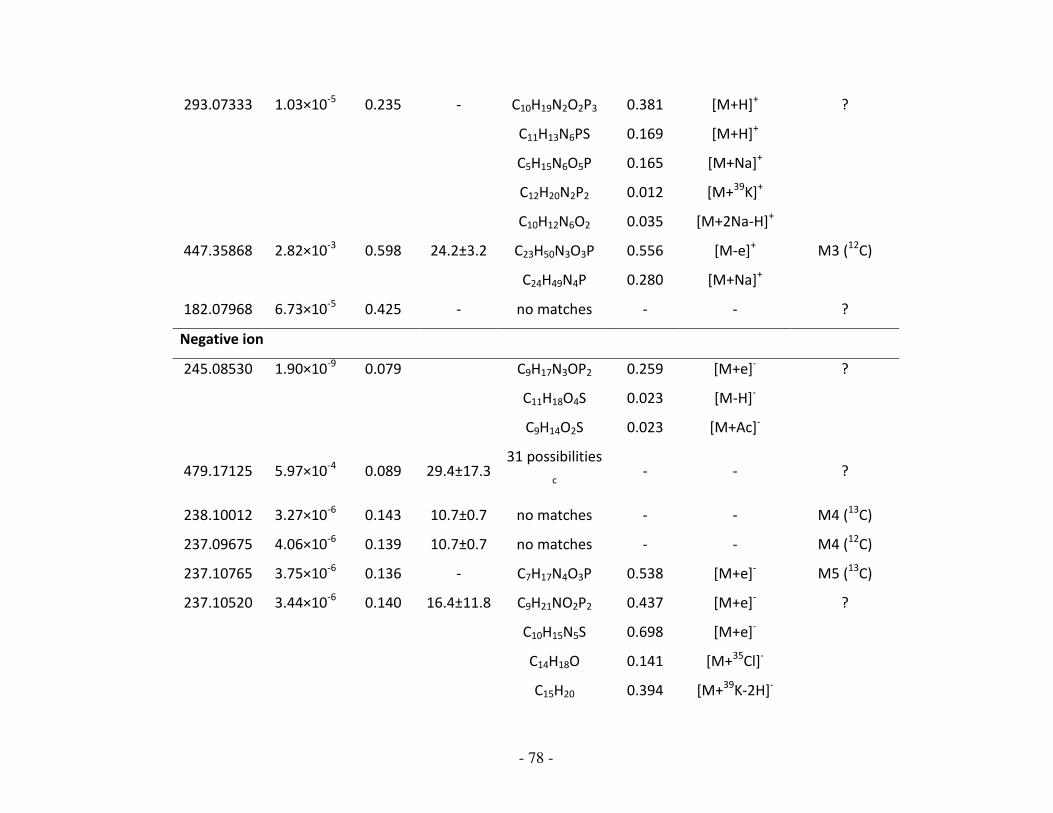
- 78 -
293.07333 1.03×10⁻⁵
0.235 - C10H19N2O2P3 0.381 [M+H]+ ?
C11H13N6PS 0.169 [M+H]+
C5H15N6O5P 0.165 [M+Na]+
C12H20N2P2 0.012 [M+39
K]+
C10H12N6O2 0.035 [M+2Na-H]+
447.35868 2.82×10⁻³
0.598 24.2±3.2 C23H50N3O3P 0.556 [M-e]+ M3 (
12C)
C24H49N4P 0.280 [M+Na]+
182.07968 6.73×10⁻⁵
0.425 - no matches - - ?
Negative ion
245.08530 1.90×10⁻⁹
0.079 C9H17N3OP2 0.259 [M+e]- ?
C11H18O4S 0.023 [M-H]-
C9H14O2S 0.023 [M+Ac]-
479.17125 5.97×10⁻⁴
0.089 29.4±17.3 31 possibilities
c
- - ?
238.10012 3.27×10⁻⁶
0.143 10.7±0.7 no matches - - M4 (13
C)
237.09675 4.06×10⁻⁶
0.139 10.7±0.7 no matches - - M4 (12
C)
237.10765 3.75×10⁻⁶
0.136 - C7H17N4O3P 0.538 [M+e]- M5 (
13C)
237.10520 3.44×10⁻⁶
0.140 16.4±11.8 C9H21NO2P2 0.437 [M+e]- ?
C10H15N5S 0.698 [M+e]-
C14H18O 0.141 [M+35
Cl]-
C15H20 0.394 [M+39
K-2H]-

- 79 -
441.14374 1.12×10⁻⁴
0.130 - 30 possibilities
c
- - ?
309.03351 5.10×10⁻⁴
0.145 - 7 possibilities c - - ?
293.05961 1.22×10⁻³
0.146 - C11H21NP2S2 0.026 [M+e]- ?
C19H7N3O 0.510 [M+e]-
C15H11N4OP 0.555 [M-H]-
C9H8N10 0.620 [M+37
Cl]-
C9H21O5PS 0.704 [M+Na-2H]-
236.10430 6.09×10⁻⁶
0.161 - C7H17N4O3P 0.329 [M+e]- M5 (
12C)
a Determined from ANOVA of peak intensities across all 5 dose groups (0, 5, 10, 25 and 50 µgL
-1 copper).
b Fold change between the control (0 µgL
-1) to highest dose (50 µgL
-1) groups.
c Not listed explicitly because of limited space.

- 80 -
Table 3.3 Comparison of the PLS weightings and the PCA loadings from the multivariate analyses of
the copper toxicity study, including the univariate ANOVA results. (a) Negative ion data, showing that
the peaks associated with the top PLS and PCA loadings are similar (i.e. they have similar ranking and
also a similar number of peaks that are significant based upon univariate statistical tests with FDR
correction). (b) Positive ion data, showing that the peaks associated with the top PLS and PCA
loadings are quite different, with most of the peaks in the top PLS weightings being significant and
most of the peaks in the top PCA loadings being non–significant. Shading denotes those peaks that
were significantly different across the 5 dose groups, determined from ANOVA of peak intensities
following FDR correction at <0.05.
(a) Negative ion data
p value LV1 weightings
from PLS-DA
PC1+PC2 loadings
from PCA p value
0.0000 245.08530 387.01969 0.2574
0.0006 479.17125 306.07654 0.1132
0.1325 371.17447 371.17447 0.1325
0.0063 426.18041 245.08530 0.0000
0.0293 471.21002 426.18041 0.0063
0.0000 238.10012 479.17125 0.0006
0.0000 237.09675 367.20618 0.3602
0.0000 237.10765 441.14374 0.0001
0.0000 237.10520 238.10012 0.0000
0.2574 387.01969 237.09675 0.0000
0.0105 333.07832 237.10520 0.0000
0.1132 306.07654 237.10765 0.0000
0.0001 441.14374 328.05862 0.1392
0.0005 309.03351 409.13340 0.0060
0.0012 293.05961 355.2425 0.3229
0.0000 236.10430 236.10430 0.0000

- 81 -
0.0000 236.10037 236.10037 0.0000
0.0000 235.10091 353.22679 0.3651
0.0130 415.08111 235.10091 0.0000
0.0070 431.19424 411.27537 0.4845
(b) Positive ion data
p value LV1 weightings
from PLS-DA
PC2+PC3 loadings
from PCA p value
0.0000 398.37427 398.37427 0.0000
0.0270 160.18087 424.27344 0.2899
0.0040 281.07949 160.18087 0.0270
0.0000 399.37761 177.13463 0.6523
0.0000 275.06259 456.26349 0.1399
0.0000 182.08119 319.25921 0.0379
0.0013 463.35321 399.37761 0.0000
0.0000 188.17572 470.31513 0.2435
0.0000 183.08454 182.08119 0.0000
0.0000 293.07333 425.27693 0.2800
0.0028 447.35868 281.07949 0.0040
0.0001 182.07968 412.23729 0.2540
0.0010 464.35647 421.33996 0.8899
0.0324 490.27992 329.18200 0.0000
0.0001 343.04971 183.08454 0.0000
0.0009 307.08869 421.33250 0.6533
0.4345 366.22711 422.34338 0.8603
0.0075 88.07569 487.32685 0.0918
0.0011 463.22226 441.30886 0.9582
0.9139 322.23670 209.97431 0.2254

- 82 -
3.3.4 Identification of empirical formulae and metabolites
One of the greatest challenges in metabolomics is the annotation of the thousands of peaks
detected, in particular for non-mammalian species for which novel metabolites may occur
(Ankley 2008). Here employed two strategies were employed: first, the assignment of
empirical formulae to the peaks using an elemental composition calculator with appropriate
constraints. The number of matches per peak ranged from zero to many potential formulae,
summarised in Table 3.1. The second strategy utilised the high mass accuracy of the FT-ICR
measurements to match the observed m/z values of the peaks to putative metabolite
identities in a modified KEGG LIGAND database, as described in Section 2.6. Note that none
of the metabolite assignments reported in this study can be regarded as unambiguous since
they depend only on accurate mass and therefore do not fulfil the Metabolomics Standards
Initiative criteria for metabolite identification (Sumner et al. 2007). Table 3.1 summarises the
number of metabolites that have been putatively identified in D. magna extracts, and all
1017 of these assignments are listed on the Supplementary Information CD (Tables SI1 and
SI2).
The same two strategies were employed to identify the top weighted peaks from the PLS
models, listed in Table 3.2. In addition, in cases where carbon isotope patterns were
detected, the 12
C/13
C ratio was used to calculate the approximate number of carbon atoms in
the metabolite. Seventeen of the top 20 significant peaks could be assigned one or more
empirical formulae. The 3 remaining “no matches” likely arise due to the presence of
isotopes (not included in our elemental composition calculator) or alternative adducts (not
included in our algorithm). Putatively identified metabolites included tyrosine (12
C and 13
C
- 83 -
isotopes) and N-acetylspermidine, and a further five unidentified metabolites with 12
C and
13C peaks were detected, labelled M1-M5 (note that for two of these metabolites the
13C
isotopes were outside of the top weighted peaks). What is particularly reassuring is the
consistency between the isotope pairs; e.g., the 12
C and 13
C isotopes of tyrosine show 0.393-
and 0.412-fold changes following copper exposure, with associated p-values of 3×10⁻⁷
and
4×10⁻⁷
. Furthermore the number of carbon atoms derived from the 12
C/13
C intensity ratio is
9.3 ± 0.5, consistent with the actual empirical formula of C9H11NO3.
Having putatively identified tyrosine as undergoing a highly significant decrease in
concentration in response to copper toxicity, attention was then focussed on the other
amino acids. Table 3.4 lists those amino acids that also changed concentration significantly
following copper exposure (with FDR<0.05). Again, the fold-changes and associated p-values
for the multiple observations of each metabolite are consistent; e.g., arginine is detected as
four positively charged and four negatively charged ions, arising from various combinations
of adducts and 13
C isotopes, with fold changes between 0.367 to 0.697 and with 7 of the 8 p-
values statistically significant. The consistency across the positive and negative ion data is
particularly reassuring since these datasets were acquired independently, i.e., the final stages
of sample preparation, FT-ICR data collection and all stages of spectral processing including
the two-stage peak filtering, normalisation and glog transformation were conducted
separately for positive and negative ion data. What is also noteworthy is that the mean of the
absolute mass error for the 57 peaks in Table 3.4 is only 0.10 ppm, and the maximum error is
0.40 ppm, which is consistent with earlier studies on liver extracts (rms error of 0.18 ppm,
and maximum error of 0.48 ppm; (Southam et al. 2007). The results presented here clearly

- 84 -
show a significant decrease in the concentrations of several amino acids. In addition a search
was made for the classic biomarker of heavy metal induced oxidative stress, glutathione
(Gaetke and Chow 2003; Stohs and Bagchi 1995), as well as a recently reported analogue of
this tri-peptide called ophthalmic acid, which is an alternative marker of oxidative stress
(Soga et al. 2006). Peaks corresponding to their empirical formulae were detected, with GSH
showing a large but non-significant >10-fold depletion after 50 μgL-1
copper exposure, and
opthalmic acid showing a statistically significant 1.5-fold depletion in the high dose group
versus controls.

- 85 -
Table 3.4 Summary of significantly changing amino acids as well as key metabolic indicators of
oxidative stress in D. magna neonates following exposure to copper.
Empirical
formula
Putative
metabolite
identification
Ion form
Absolute
mass error
(ppm)
Fold
change a
p-value
b
Amino acids
C4H9NO3 Threonine [M+H]+ 0.007 0.629 7.51×10
-5(*)
C5H9NO2 Proline [M+H]+ 0.047 0.759 5.21×10
-5(*)
[M-H]- 0.114 0.689 9.51×10
-2(*)
C5H9NO4 Glutamic acid [M+H]+ 0.042 0.787 8.51×10
-2
[M+Na]+ 0.050 0.775 1.97×10
-1
[M+39
K]+ 0.090 0.611 1.56×10
-2
[M-H]- 0.012 0.646 8.19×10
-3
[M(13
C)-H]- 0.352 0.841 3.61×10
-2
[M+35
Cl]- 0.056 0.544 1.04×10
-3 (*)
C5H11NO2S Methionine [M+H]+ 0.043 0.570 1.76×10
-4 (*)
[M+Na]+ 0.006 0.694 1.49×10
-1
[M-H]- 0.030 0.497 5.84×10
-5(*)
C6H9N3O2 Histidine [M+H]+ 0.240 0.801 1.58×10
-1
[M+Na]+ 0.184 0.807 8.44×10
-2
[M+39
K]+ 0.131 0.636 1.23×10
-1
[M-H]- 0.068 0.584 4.55×10
-3 (*)
[M+35
Cl]- 0.045 0.288 1.74×10
-4 (*)
C6H13NO2 Leucine/Isoleucine [M+H]+ 0.036 0.673 2.11×10
-3 (*)
[M+Na]+ 0.061 0.806 1.69×10
-1
[M+39
K]+ 0.014 0.634 5.28×10
-3

- 86 -
C6H14N2O2 Lysine [M+H]+ 0.110 0.588 7.76×10
-4 (*)
[M(13
C)+H]+ 0.228 0.666 1.76×10
-2
[M+Na]+ 0.009 0.671 2.17×10
-1
[M+39
K]+ 0.072 0.645 7.07×10
-2
[M-H]- 0.012 0.586 5.00×10
-3
[M+35
Cl]- 0.109 0.336 1.95×10
-3 (*)
[M+Ac]- 0.092 0.717 8.13×10
-3
C6H14N4O2 Arginine [M+H]+ 0.104 0.591 9.28×10
-6(*)
[M(13
C)+H]+ 0.010 0.575 3.70×10
-6(*)
[M+Na]+ 0.271 0.697 7.98×10
-3
[M+39
K]+ 0.398 0.478 1.16×10
-3 (*)
[M-H]- 0.002 0.578 6.20×10
-5(*)
[M+35
Cl]- 0.106 0.385 5.80×10
-4 (*)
[M(13
C)+ 35
Cl]- 0.053 0.390 2.66×10
-8(*)
[M+37
Cl]- 0.058 0.367 5.33×10
-4 (*)
C9H11NO2 Phenylalanine [M+H]+ 0.092 0.502 4.73×10
-4 (*)
[M(13
C)+H]+ 0.208 0.531 1.55×10
-3 (*)
[M+Na]+ 0.103 0.497 9.44×10
-4 (*)
[M+K]+ 0.061 0.445 5.10×10
-5(*)
[M-H] - 0.045 0.445 2.06×10
-4 (*)
[M+35
Cl] - 0.003 0.431 1.49×10
-2
C9H11NO3 Tyrosine [M+H] +
0.114 0.393 2.86×10⁻⁷
(*)
[M(13
C)+H]+ 0.160 0.412 4.29×10
-7(*)
[M+Na] +
0.275 0.570 4.90×10⁻²
[M+K] +
0.309 0.558 8.34×10⁻³
[M-H] - 0.016 0.348 6.85×10
-5(*)
[M(13
C)-H] - 0.040 0.369 1.10×10
-5(*)
[M+Ac] - 0.014 0.350 1.68×10
-4 (*)

- 87 -
C11H12N2O2 Tryptophan [M+H] +
0.018 0.521 1.08×10⁻⁵
(*)
[M(13
C)+H]+ 0.212 0.538 2.63×10
-5(*)
[M+Na] +
0.139 0.584 1.61×10⁻³
(*)
[M-H]- 0.041 0.410 2.24×10
-6(*)
[M(13
C)-H] - 0.302 0.668 2.99×10
-3 (*)
[M+Ac] - 0.034 0.590 6.87×10
-4(*)
Biomarkers of oxidative stress
C10H17N3O6S Glutathione [M-H] - 0.029 0.079 1.13×10
-1
C11H19N3O6 Opthalmic acid [M-H]- 0.141 0.652 9.26×10
-3
[M+H]+ 0.384 0.701 2.86×10
-5(*)
a Fold change between the control (0 µgL
-1) to highest dose (50 µgL
-1) groups.
b Determined from ANOVA of peak intensities across all 5 dose groups (0, 5, 10, 25 and 50 µgL
-1
copper).
(*) Significant following FDR correction at <0.05

- 88 -
3.3.5 Biochemical interpretation
Copper is an essential trace element for D. magna, at low levels it is likely to be utilised for
normal biochemical processes, with toxicity occurring only at higher concentrations.
Although normally bound to proteins, copper may be released and become free to catalyse
the formation of highly reactive hydroxyl radicals and initiate oxidative damage or interfere
with important cellular events (Bopp et al. 2008; Gaetke and Chow 2003; Linder and Hazegh-
Azam 1996). Copper induced cellular toxicity is thought to be caused by the participation of
copper ions in the formation of reactive oxygen species (ROS) (Gaetke and Chow 2003; Stohs
and Bagchi 1995). The protective effect of GSH has been attributed to its ability to stabilise
copper in its Cu2+
oxidised state, preventing redox cycling and the generation of free radicals
(Stohs and Bagchi 1995). This is consistent with our observed >10-fold decrease in GSH
concentration at the highest exposure dose, an effect that has also been observed in a
copper toxicity study on rats (Gaetke and Chow 2003). Consequently, this could explain the
observed significant reduction in the GSH analogue, ophthalmic acid, as it is speculated to act
in the role of GSH for some cellular functions following the depletion of GSH due to oxidative
stress (Soga et al. 2006). In addition to ROS depleting antioxidants such as GSH, they will also
oxidise amino acids. The amino acids listed in Table 2, that significantly decreased
concentration at the highest copper dose, are among those listed as most susceptible to
oxidation (Berlett and Stadtman 1997). A further reason for the observed decrease in amino
acids is likely because of a general depletion of the amino acid pool in response to induction
of defence and repair mechanisms, such as the synthesis of stress proteins and DNA repair
enzymes (Knops et al. 2001; Smolders et al. 2005). A previously reported metabolomics study
- 89 -
using earthworms (Lumbricus rubellus) exposed to copper determined a decrease (at 10 and
40mgKg-1
of copper) in several of the amino acids that were found to decrease in this
investigation, including leucine/isoleucine, phenylalanine, tyrosine and tryptophan (Bundy et
al. 2008). Bundy et al. (Bundy et al. 2008) also determined changes to the levels of several
nucleosides following exposure, including a decrease in adenosine and uridine at
concentrations of 10mgKg-1
, putative identifications of these metabolites (in various ion
forms) in our investigation has also found fold changes of ca. 0.4-0.6 in both of these
metabolites. Though generally these are not significant, the deprotonated form of uridine
was determined to be a significant fold change and these findings indicate that copper
exposure may cause a metabolic perubation to the nucleuotide sugar metabolism pathway.
The significant increase in N-acetylspermidine in response to copper exposure was
unexpected and this observation has not previously been reported. However, a viable
rationalisation of this discovery can be proposed. Polyamines, including spermidine, are small
abundant molecules found ubiquitously in all living organisms (Coffino and Poznanski 1991).
In mammalian cells they are thought to have several roles in cell growth and differentiation,
and the intracellular concentrations of these polycations are highly regulated (Casero and
Pegg 1993). Spermidine/spermine N-acetyltransferase (SSAT) is the rate limiting enzyme in
the degradation of intracellular polyamines, forming N-acetylspermidine/spermine (Casero
and Pegg 1993). This enzyme’s activity is known to increase in response to numerous toxic
stimuli, including radical-producing agents such as paraquat (Casero and Pegg 1993).
Furthermore, mouse liver cells exposed to free radical inducing lipopolysaccharides exhibited
an increase in N-acetylspermidine, presumably as a result of increased SSAT activity

- 90 -
(Sugimoto et al. 1991). We hypothesise that the known induction of ROS due to copper
exposure also increases the activity of SSAT in D. magna, resulting in the observed increase in
N-acetylspermidine.
The biochemical interpretation of particular aspects of our metabolomics data has identified
metabolic changes that are consistent with previously known responses of organisms to
copper exposure; note that a comprehensive biochemical analysis of this data was not the
primary aim of the study. However, the ability to determine these metabolic changes has
huge potential in the future of ecotoxicogenomics research, especially as sequencing of the
genome of D. magna is now underway (Colbourne et al. 2005). This interpretation provides
some validation for the first application of the SIM-stitching FT-ICR method in a
metabolomics study. Furthermore, the approach has uncovered a potentially novel marker
for copper toxicity in N-acetylspermidine. This highlights the potential of FT-ICR mass
spectrometry for metabolic biomarker discovery, and as a tool for providing detailed
mechanistic insight into the MOA of toxicants, discussed further below.
3.3.6 Applicability of SIM-stitching DI FT-ICR for metabolomics
Measuring a complete cellular or organismal metabolome is impossible to achieve with
current technologies as many metabolites occur at low concentration. However, mass
spectrometry remains the technology of choice for the measurement of metabolites at small
sample sizes in complex matrices (Brown et al. 2005). FT-ICR mass spectrometry currently
provides the highest resolving power and mass accuracy of all commercial mass

- 91 -
spectrometers which, in theory, should enable the detection and identification of a large
number of metabolites even when a complex mixture is directly infused into the ion source.
This removes the need for time consuming chromatographic separation prior to ionisation
and produces a multivariate dataset with extremely high reproducibility along the
independent axis (i.e., m/z), and is increasingly being used in metabolomics (Breitling et al.
2006; Breitling et al. 2008; Brown et al. 2005; Dunn 2008; Southam et al. 2007; Takahashi et
al. 2008). Furthermore, Han et al. (Han et al. 2008) have recently demonstrated that
ultrahigh-field FT-ICR mass spectrometry shows great promise for quantitative metabolomics
and reported that comparable quantitation accuracies were achieved by DI FT-ICR and
LC/MS, however the former analysis consumed much less sample and was significantly
faster. A potential disadvantage of FT-ICR mass spectrometry is that in order to achieve a
high dynamic range, and detect both low and high concentration metabolites, the necessarily
high number of ions within the ICR detector cell will undergo space-charge interactions which
reduces the mass accuracy (Zhang et al. 2005). However, this problem can be solved with a
SIM-stitching approach, which has been demonstrated to yield a rms mass error of only 0.18
ppm and a dynamic range of 16,000 (Southam et al. 2007). These values should be
contrasted with more “traditional” DI FT-ICR mass spectrometry metabolomics approaches,
for example Han et al. (Han et al. 2008) reported a mass error of ≤1 ppm and a dynamic
range of 750, and also with other FT mass spectrometry analysers such as the LTQ Orbitrap,
where a mass accuracy of between 0.48 to 5 ppm and a dynamic range of 5000 have been
reported (Makarov et al. 2006; Olsen et al. 2005). Furthermore, the SIM-stitching approach,
after a two-stage peak filtering algorithm to remove noise, yielded a total of 5447 peaks from

- 92 -
D. magna extracts (positive and negative ion modes combined). This is surprisingly large
considering that the extracts are directly infused and are therefore susceptible to ion
suppression. In fact this value greatly exceeds other FT-ICR mass spectrometry metabolomic
studies, such as by Takahashi et al. (Takahashi et al. 2008) where only 220 ions were
detected using negative ion mode, 72 of which were assigned to candidate metabolites, and
by Han et al. (Han et al. 2008) who reported 570 metabolite features, 250 of which could be
assigned a rational empirical formula and 100 given a possible metabolite identification.
Collectively, these results highlight the excellent sensitivity, mass accuracy and dynamic
range of the SIM-stitching DI FT-ICR method for metabolomics.
3.4 Conclusion
In this study we have optimised and then confirmed the effectiveness of SIM-stitching DI FT-
ICR mass spectrometry metabolomics for toxicity testing in D. magna. It has been
demonstrated that the approach is sensitive by detecting more than 5000 peaks, as
described above. In addition the approach has high resolution, not only from a spectral
perspective of narrow peak widths but also in terms of the processing of the m/z
measurements; i.e., each peak is treated as unique, which avoids the problem of “binning”
multiple peaks into the same variable prior to statistical analysis. Of course each peak could
still comprise of more than one metabolite as isomers will not be separated by the DI FT-ICR
approach. This is also the first successful application of the g-log transform to mass
spectrometry data. These results confirm that the entire approach, including the toxicity
testing, metabolite extraction, mass spectrometric analysis and spectral processing, has

- 93 -
sufficient reproducibility (both technical and biological) to allow the classification of different
life stages of D. magna as well as the classification of differing degrees of copper toxicity.
Furthermore, all aspects of the approach are highly scalable which would enable screening of
multiple chemicals with high sample throughput. This is particularly true of the culturing and
toxicity testing components since D. magna are easy to culture and have a short generation
time, and therefore it is rapid and low cost to generate the single adult or 30 neonates
required per sample. Based upon the copper toxicity results, we conclude that the
combination of toxicity testing, DI FT-ICR mass spectrometry and multivariate classification
methods is ideal for high throughput first-tier screening of chemicals in D. magna.
Furthermore, this combination of methods coupled with a more detailed and unbiased
investigation of the metabolic mechanism of toxicity will be of particular value for a more
comprehensive chemical risk assessment.
Having confirmed in this investigation that using FT-ICR MS, coupled with the SIM-stitching
approach, is an effective method of high-throughput toxicity testing; I next evaluate the
feasibility of utilising this approach with D. magna haemolymph.

- 94 -
CHAPTER FOUR:
Optimisation and validation of FT-ICR MS based
metabolomics using Daphnia magna haemolymph†
†The contents of this Chapter, including the figures, have been submitted to Environmental Science and
Technology: Poynton, H. C.; Taylor, N. S.; Hicks, J.; Colson, K.; Chan, S.; Clark, C.; Scanlan, L.; Louginov, A. V.;
Vulpe, C.; Viant, M. R. Integration of metabolomics and transcriptomic signatures offers a coordinated model of
cadmium toxicity in Daphnia magna.

- 95 -
4.1 Introduction
Metabolomics is increasingly becoming a valuable tool in molecular and eco-toxicology
(Bundy et al. 2009; Coen et al. 2008; Viant 2007, 2008). The measurement of the small
molecule compounds in a biological sample enables a non-biased investigation into the
metabolic responses to toxic stress. As previously stated, given the importance of Daphnia
magna in the freshwater ecosystem and its widespread use as a test organism, no
metabolomics studies have been conducted that utilise this species. The findings from the
studies discussed in Chapter 3 have determined that FT-ICR MS-based metabolomics studies
using D. magna are a viable tool for high-throughput toxicity testing and thus further studies
are required to realise the full potential of this technique.
Metabolomics studies in mammalian toxicology often use biofluids such as blood, plasma and
urine to detect significant metabolic responses to toxicants. In biofluids, metabolites are in
dynamic equilibrium with those inside cells and tissues and, consequently, abnormal cellular
processes in tissues of the whole organism following toxicant exposure will be reflected in
altered biofluid compositions (Lindon et al. 2000). Consequently the use of biofluids could
provide a “cleaner” biological sample for detecting significant metabolic changes when
compared to whole organism homogenates that could mask subtle toxicant induced effects.
In environmental metabolomics, in particular in terrestrial and aquatic invertebrates, few
studies have taken advantage of the benefits of using biofluids. As detailed in Chapter 1,
there have been two studies reported using the haemolymph of the tobacco hornworm
(Manduca sexta) (Phalaraksh et al. 1999; Phalaraksh et al. 2008), one using the coelomic fluid
of the earthworm (Eisenia veneta) (Bundy et al. 2001), and one utilising the haemolymph of

- 96 -
red abalone (Haliotis rufescens) (Viant et al. 2003a). All four of these studies, and the
majority of mammalian biofluid metabolomics investigations (Lindon et al. 2000), use NMR
spectroscopy based metabolomics. However, if the ultimate aim of metabolomics is to detect
every small-molecule metabolite and xenobiotic in a biofluid, then MS has a huge advantage
in terms of sensitivity over NMR spectroscopy (Griffin 2003), and this technique has yet to be
exploited in ecotoxicological metabolomic investigations.
Since our previous work (Chapter 3) has shown whole organism homogenates of D. magna to
be compatible with FT-ICR MS-based metabolomics, the first objective of this study was to
assess the feasibility of sampling ca. 1 μL of haemolymph from individual adult D. magna and
then measuring high quality metabolic fingerprints from small pools of these samples using
this same technique. Following this, the second objective was to apply these metabolomic
investigations of haemolymph to examine the toxicity of the model toxicant, cadmium, to D.
magna. These metabolomics studies were done in conjunction with transcriptomic studies
on additional D. magna samples, conducted by Dr Helen Poynton (National exposure
Research Laboratory, US-EPA, Cincinnati, USA), allowing a combined omics investigation into
the toxicity of cadmium to D. magna.
4.2 Materials and Methods
4.2.1 Daphnia magna exposures and haemolymph extraction
The exposure of D. magna to cadmium and the subsequent haemolymph extraction was
carried out at UC Berkeley, California, USA. Briefly, adult daphnids (10-14 d old, immediately
after release of second brood) were exposed to 18 μgL-1
of cadmium sulfate for 24 h. This

- 97 -
corresponded to 10% of the LC50, a previously determined sublethal concentration of
cadmium that resulted in impaired reproduction in chronic exposures (Poynton et al. 2008).
A zero concentration control was performed alongside each cadmium exposure. Following
exposure, haemolymph was extracted as described in Mucklow and Ebert (Mucklow and
Ebert 2003) by pricking the heart of the Daphnia and collecting ca. 1 µL of haemolymph from
the body cavity. Haemolymph was then rapidly frozen in liquid nitrogen and stored at -80 °C,
including during shipping to our laboratory at Birmingham.
4.2.2 FT-ICR MS metabolomics
4.2.2.1 Initial haemolymph study
A total of 20 cadmium exposed haemolymph samples and 19 control haemolymph samples
from D. magna were delivered to Birmingham University on dry ice; these were then stored
at -80 °C prior to extraction analysis. To determine the feasibility of using FT-ICR based
metabolomics for analysing Daphnia haemolymph it was decided that 3 individual samples
would be pooled for an initial MS investigation in order to obtain sufficient material for
analysis. At this stage two cadmium exposed samples and one control sample (total of ca. 3
μL) were pooled; metabolite extraction (with corresponding extract blank), FT-ICR analysis
and data processing were all as described in Chapter 2.
4.2.2.2 Cadmium toxicity study
Since the initial haemolymph study proved successful (see Section 4.3.1) the remaining
haemolymph samples (18 cadmium exposed and 18 control) were pooled as 3 haemolymph

- 98 -
samples per biological replicate, resulting in 6 biological replicates per group; again an
extract blank was also prepared. Metabolites were extracted by methanol precipitation as
described in Section 2.3.2. FT-ICR MS analysis (negative ion), data processing and metabolite
identification were all as detailed in Chapter 2. The data pre-processing parameters consisted
of a 2 out of 3 replicate filter, a sample filter retaining peaks that occurred in at least 50% of
all samples using a 1.8ppm spread along the m/z axis for defining unique peaks, and blank
peaks were retained only if twice as intense in the biological sample. PCA was used to assess
metabolic similarities and differences between the samples while univariate statistics
(Student’s t-test across the 2 groups) were used to examine the significance of these
metabolic changes, with p-values adjusted for a False Discovery Rate (FDR) of 5% (Benjamini
and Hochberg 1995).
4.2.3 Transcriptomics (conducted by Dr Helen Poynton, US-EPA)
For the transcriptomic analysis 6 replicate exposures, each containing 12 individual adult D.
magna, were conducted. These analyses were performed on a different batch of exposed
daphnids to the metabolomics investigation, and used whole organism samples rather than
haemolymph. RNA was extracted from each of the 12 daphnids and pooled resulting in 6
biological replicates. In brief, the extracted RNA was labelled and hybridised to a custom 44k
D. magna array (eArray AMADID# 020720; Agilent Technologies, Santa Clara, CA). The arrays
were scanned and the resulting data analysed to determine any differentially expressed
genes. Quantitative Reverse Transcription PCR (q-RT-PCR) of five genes was used to confirm
differential expression.

- 99 -
4.3 Results and Discussion
4.3.1 Initial metabolomics study
The initial aim was to determine if high quality mass spectra, distinguishable from blank
samples, could be achieved from the pooled haemolymph of 3 individual adult daphnids; i.e.
3 μL of haemolymph. An FT-ICR MS analysis was conducted on this sample and on the
corresponding extract blank in triplicate and the data was SIM-stitched and subjected to a
two out of three replicate filter giving a single peak list each for the haemolymph sample and
the extract blank. A representative mass spectrum of D. magna haemolymph is shown in
Figure 4.1. The peak lists generated from the replicate filter were then compared using a
visualization software tool (see Section 3.3.1) to compare the commonality of the peaks
between the haemolymph sample and the extract blank (Figure 4.2). As with the whole
organism D. magna samples in Chapter 3, the presence of biological material competing for
charge during nano-electrospray ionisation causes suppression of the peaks in the “blank”
revealing over 2000 peaks unique to D. magna haemolymph. There is clearly an overlap of
ca. 1000 peaks between the sample and the extract blank, however, further investigation of
these common peaks revealed that over 50% were at least twice as intense in the
haemolymph sample and would be classed as biological peaks in a FT-ICR MS metabolomics
study. It was therefore determined that 3 μL of D. magna haemolymph could produce
distinguishable, high quality mass spectra using FT-ICR MS and would be suitable for a
metabolomics study into cadmium toxicity.

- 100 -
Figure 4.1 A representative FT-ICR mass spectra of pooled haemolymph extracts of the water flea, D.
magna: a SIM-stitched spectrum, in centroid mode, between m/z 70 and 500. This spectrum was
normalised to the largest peak (corresponding to 100% intensity).

- 101 -
Figure 4.2 Graphical depiction of the peaks detected in an FT-ICR mass spectrum of pooled D. magna
haemolymph extracts. Shows the occurrence of each of the >5000 unique peaks that were detected
by the FT-ICR analyses, i.e., whether the peaks occurred in the extract blank only (blue), in the extract
blank and the haemolypmh sample (green), or in the haemolymph sample only (red). The peaks
depicted in this figure are those which were present following a 2 out of 3 replicate filter.
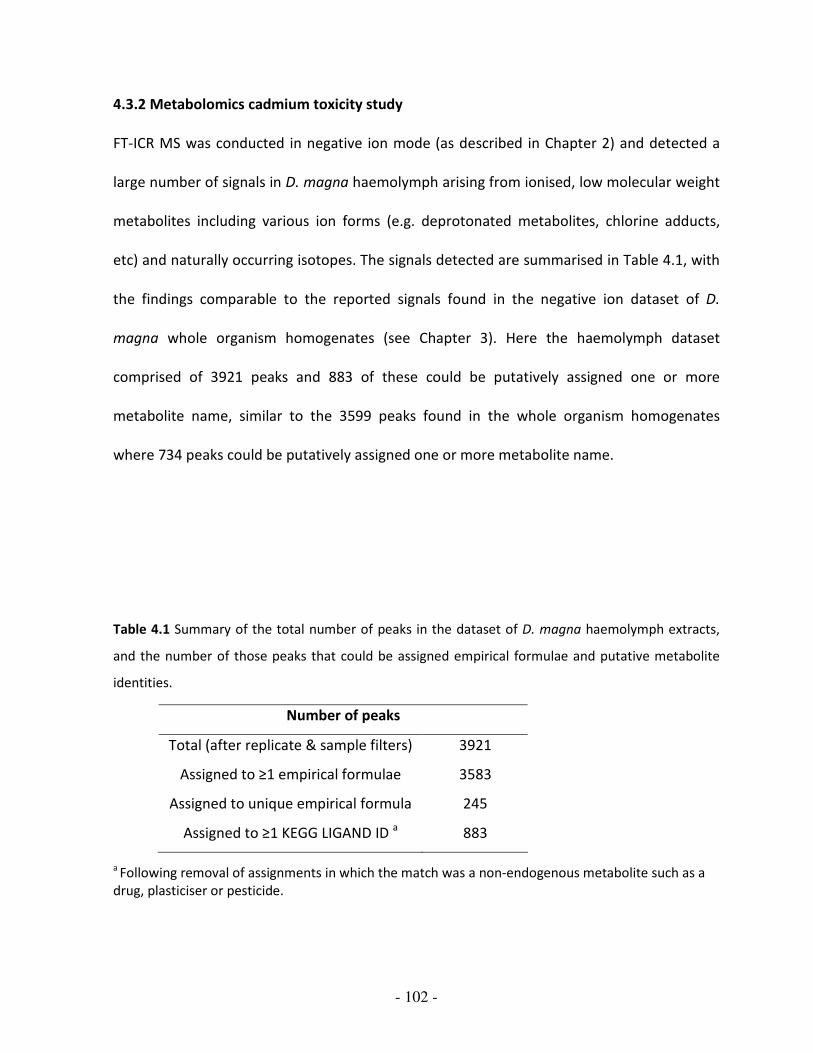
- 102 -
4.3.2 Metabolomics cadmium toxicity study
FT-ICR MS was conducted in negative ion mode (as described in Chapter 2) and detected a
large number of signals in D. magna haemolymph arising from ionised, low molecular weight
metabolites including various ion forms (e.g. deprotonated metabolites, chlorine adducts,
etc) and naturally occurring isotopes. The signals detected are summarised in Table 4.1, with
the findings comparable to the reported signals found in the negative ion dataset of D.
magna whole organism homogenates (see Chapter 3). Here the haemolymph dataset
comprised of 3921 peaks and 883 of these could be putatively assigned one or more
metabolite name, similar to the 3599 peaks found in the whole organism homogenates
where 734 peaks could be putatively assigned one or more metabolite name.
Table 4.1 Summary of the total number of peaks in the dataset of D. magna haemolymph extracts,
and the number of those peaks that could be assigned empirical formulae and putative metabolite
identities.
a Following removal of assignments in which the match was a non-endogenous metabolite such as a
drug, plasticiser or pesticide.
Number of peaks
Total (after replicate & sample filters) 3921
Assigned to ≥1 empirical formulae 3583
Assigned to unique empirical formula 245
Assigned to ≥1 KEGG LIGAND ID a 883

- 103 -
PCA was used to visualise any differences between the control and exposed samples and the
PCA scores plot (Figure 4.3) shows a clear separation between the two groups, indicative of a
cadmium induced metabolic response. This separation was confirmed to be significant
following a t-test of the PC scores, specifically along the PC1 axis (p=3.19×10⁻³
) and the
PC1+PC2 axis (p=2.24×10⁻³
). The samples in the control group are more tightly clustered
relative to the cadmium exposed samples which show considerable metabolic variability.
Figure 4.3 PCA scores plot from analysis of FT-ICR mass spectra of haemolymph extracts of D. magna:
control (○) and cadmium exposed (■). The scores plot shows a cadmium induced metabolic response
along the PC1 axis and the diagonal axis from bottom left to top right (PC1+PC2).

- 104 -
Univariate analysis of the 3921 peaks detected by FT-ICR MS revealed that 126 of these
peaks (representing 3.2% of the total peaks) changed significantly following exposure of D.
magna to cadmium (at FDR <0.05). Putative identifications of several of these metabolites
are listed in Table 4.2 where it can be seen that metabolites were often detected as 12
C and
13C containing forms, enabling the calculation of the number of carbon atoms in the
metabolite from the 12
C/13
C intensity ratio. Alongside this, the consistency of the fold
changes and associated p-values for the various adducts and isotope forms of each
metabolite provide increased confidence in the identification of the empirical formulae. It
should be noted that the mean mass error of the peaks identified in Table 4.2 is 0.34 ppm
with the maximum error at 0.94 ppm. These values are higher than those found in the D.
magna whole organism study, where the mean mass error was only 0.10 ppm (see Chapter
3) but still depict the high mass accuracy found in FT-ICR MS studies (Brown et al. 2005). A
selected region of a representative FT-ICR mass spectrum of D. magna haemolymph (m/z 220
265-295, equivalent to ca. 7% of the total spectrum) is shown in Figure 4.4, and includes
signals from three putatively identified metabolites, inosine (C10H12N4O5), uridine (C9H12N2O6)
and palmitic acid (C16H32O2), all of which change concentration significantly in response to
cadmium exposure as indicated in the inset bar charts. These results from the FT-ICR MS
metabolomics investigation successfully achieved the objective of determining a toxicant
induced effect in the haemolymph of D. magna following exposure to cadmium.

- 105 -
Table 4.2 Summary of peaks detected by FT-ICR MS that change significantly upon cadmium exposure for which putative metabolite names
could be assigned.
Observed
peak
(m/z)
Theoretical
exact mass
(m/z)
Empirical formula
Putative
metabolite
identification
Ion form
Number
of C
atoms
Absolute
mass error
(ppm)
Fold
change a
p-value
b
148.04377 148.043774 C5H11NO2S Methionine [M-H]- - 0.031 0.345 1.22×10
-3(*)
154.06219 154.0622 C6H9N3O2 Histidine [M-H]- 5±1 0.069 0.471 6.21×10
-5 (*)
155.06555 155.0656 C6H9N3O2 Histidine [M(13
C)-H]- 5±1 0.326 0.512 1.45×10
-4 (*)
164.07169 164.071703 C9H11NO2 Phenylalanine [M-H] - 11±2 0.077 0.479 8.31×10
-4 (*)
165.07503 165.075103 C9H11NO2 Phenylalanine [M(13
C)-H]- 11±2 0.440 0.617 1.66×10
-2
173.10437 173.1044 C6H14N4O2 Arginine [M-H]- - 0.171 0.246 3.29×10
-7(*)
203.0826 203.082602 C11H12N2O2 Tryptophan [M-H]- 13±4 0.008 0.411 1.79×10
-5(*)
204.08597 204.086002 C11H12N2O2 Tryptophan [M(13
C)-H]- 13±4 0.155 0.534 5.50×10
-3
207.11574 207.1157316 C10H20O2 Decanoic acid [M+35
Cl]- - 0.041 0.606 3.79×10
-5(*)
209.0811 209.081078 C6H14N4O2 Arginine [M+35
Cl]- - 0.107 0.537 5.21×10
-5(*)
211.07811 211.078128 C6H14N4O2 Arginine [M+37
Cl]- - 0.083 0.428 1.04×10
-5(*)
220.09391 220.0938956 C7H15N3O5
1-Guanidino-
1-deoxy-
scyllo-inositol
[M-H] - - 0.065 2.372 5.12×10
-4(*)

- 106 -
243.06231 243.06226 C9H12N2O6 Uridine [M-H] - - 0.199 0.407 6.20×10
-5(*)
255.23295 255.232954 C16H32O2 Palmitic acid [M-H]- - 0.017 0.558 1.14×10
-2
267.07355 267.073493 C10H12N4O5 Inosine [M-H]- 11±1 0.207 0.460 4.66×10
-5(*)
267.0736346 C11H19O3P c [M+37
Cl]- 11±1 0.317
268.07696 268.076893 C10H12N4O5 Inosine [M(13
C)-H]- 11±1 0.248 0.518 1.92×10
-4 (*)
268.0771256 C10H17NO5 c [M+37
Cl]- - 0.618
268.0770346 C11H19O3P c [M(13
C)+37
Cl]- 11±1 0.279
279.0392 279.038938 C9H12N2O6 Uridine [M+35
Cl]- 8±1 0.939 0.386 7.85×10
-6(*)
280.0425 280.042338 C9H12N2O6 Uridine [M(13
C )+35
Cl]- 8±1 0.058 0.422 7.56×10
-5(*)
281.03622 281.035988 C9H12N2O6 Uridine [M+37
Cl]- - 0.825 0.428 1.04×10
-5(*)
281.0362756 C10H12N4O2P2 c [M-H]- - 0.198
281.0363376 C11H6N8S c [M-H]- - 0.418
281.0364156 C11H19P3 c [M+37
Cl]- - 0.696
291.20989 291.209633 C16H32O2 Palmitic acid [M+35
Cl]- 19±6 0.884 0.388 1.29×10
-3(*)
292.2132 292.213033 C16H32O2 Palmitic acid [M(13
C )+35
Cl]- 19±6 0.573 0.451 1.12×10
-3(*)
293.20691 293.206683 C16H32O2 Palmitic acid [M+37
Cl]- 21±7 0.776 0.426 1.30×10
-3(*)
294.21024 294.210083 C16H32O2 Palmitic acid [M(13
C )+37
Cl]- 21±7 0.535 0.488 2.11×10
-3
294.2104586 C16H30N3P c [M-H]- - 0.743

- 107 -
305.04741 305.047221 C10H12N4O5 Inosine [M+37
Cl]- - 0.614 0.434 3.19×10
-5(*)
305.0474016 C6H14N2O12 c [M-H]- - 0.028
305.0475086 C11H12N6OP2 c [M-H]- - 0.323
a Fold change between the control and cadmium exposed groups.
b Determined from t-test of peak intensities across control and cadmium exposed groups
c No metabolite name in KEGG matching this formula
(*) Significant following FDR correction at <0.05

- 108 -
Figure 4.4 Section of a representative negative ion FT-ICR mass spectrum of D. magna haemolymph
highlighting the putatively identified signals from inosine (I), uridine (U) and palmitic acid (PA), each
detected as various adduct forms and naturally-occurring isotopes. Inset bar charts show the levels of
these significantly effected metabolites in control versus cadmium exposed daphnids. Error bars
represent the standard deviation.

- 109 -
4.3.3 Key findings from transcriptomic cadmium toxicity study
The transcriptomic studies and subsequent analysis were performed by Dr Helen Poynton
(US-EPA National Exposure Laboratory) and the key findings from this work are as follows.
Affected genes included those involved in digestion, immune function, xenobiotic
metabolism and growth and development; with the microarray and q-RT-PCR results being
strongly correlated. Specifically; there was an up-regulation of genes involved in embryonic
development (2.9 to 4.5-fold increases), including vitellogenin and egg-shell proteins; a
down-regulation of carboxypeptidase A (an enzyme involved in protein digestion; 2-fold
decrease); these changes in gene expression are linked to the metabolomics data and are
discussed in the next Section. An up-regulation in oxidative stress response genes (2.2 to 2.6-
fold increases), including cytochrome P450, glutathione-S-transferase (GST) and
metallothionein (MT); and an up-regulation of cuticle proteins (up to 3.7-fold increases) were
also determined from the transcriptomic analysis.
4.3.4 Relevance of findings to cadmium toxicity
As this was a combined omics study into the toxicity of cadmium to D. magna, the key
findings from both the metabolomics and transcriptomic studies have been integrated into
Figure 4.5 giving an overview of the physiological processes affected by cadmium exposure.
However, the focus of this discussion is on the findings of the metabolomics investigation
into the effects of cadmium on the daphnid haemolymph metabolome, summarised in Table
4.2.

- 110 -
Figure 4.5 Summary model of sub-lethal cadmium toxicity in D. magna. Processes, metabolites and
genes affected by cadmium exposure are shown in red (increases) or green (decreases). Those
revealed in this study shown in plain text, those found in other studies are italicised. Decrease in
feeding rate and digestive enzyme activity was shown by De Coen and Janssen (1998) (De Coen and
Janssen 1998), while decreases in digestive enzyme expression level were described by Poynton et al.
(Poynton et al. 2007). Decreases in protein and lipid reserves were described by Soetaert et al.
(Soetaert et al. 2007b).
- 111 -
Cadmium is a toxic non-essential metal with no reported biological function (Connon et al.
2008). It is known to cause oxidative tissue damage, increased lipid peroxidation and DNA
damage (Stohs and Bagchi 1995) and has been reported to significantly decrease survival,
growth and reproduction in D. magna (Smolders et al. 2005). The significant decrease in
several amino acids is comparable to the findings from the whole organism study into copper
toxicity (Chapter 3) and could again be a consequence of depletion of the amino acid pool
following induction of defence and repair mechanisms in response to cadmium stress
(Smolders et al. 2005). Interestingly, all the amino acids found to be changing significantly are
essential amino acids (methionine, histidine, phenylalanine, arginine and tryptophan) and are
therefore only obtainable via absorption from food. This suggests that an effect on food
uptake or digestive capabilities could account for these changes in metabolite concentration.
Following exposure of D. magna to cadmium, De Coen and Janssen (De Coen and Janssen
1998) observed a drastic reduction in ingestion activity and an initial reduction of digestive
enzyme activity which then recovered. Another study by De Coen and Janssen (De Coen and
Janssen 1997a) found an increase in digestive enzyme activity of D. magna in response to
cadmium stress, and a transcriptomic investigation by Soetaert et al. (Soetaert et al. 2007b)
determined an up-regulation of genes involved in digestive processes. It is likely that a
decrease in essential amino acids is the result of reduced feeding capability and an increase
in digestive enzyme activity is reflecting an increased efficiency in food assimilation to
compensate for reduced food intake (De Coen and Janssen 1997b) and the increased energy
demand required for dealing with the toxicant (Connon et al. 2008). These responses would

- 112 -
all contribute to a depleted pool of amino acids that the daphnids are unable to replenish
due to inhibition of feeding activity.
Another reason for the significant decrease in phenylalanine could be due to its role in
catecholamine synthesis. Phenylalanine can be converted to tyrosine, a precursor for
catecholamines, in particular dopamine, which has been shown to be increased in aquatic
invertebrates in response to stress (Lansing et al. 1993). The present transcriptomic study
found an increase in tyrosine hydroxylase (TYH). This enzyme catalyses the initial step in the
conversion of tyrosine into dopamine, suggesting the decrease in the metabolite
phenylalanine could also be due to it being shuttled into the synthesis of dopamine.
As with the decrease in essential amino acids, the reduction in food intake could also explain
the significant decrease in two putatively identified fatty acids, palmitic acid and decanoic
acid, found in the haemolymph of cadmium exposed D. magna. A decrease in feeding rate
could cause decreased absorption of fatty acids, and with previous transcriptomic studies
reporting down-regulation of fatty acid binding proteins and reduced lipid reserves (Poynton
et al. 2007; Soetaert et al. 2007b) this could contribute to decreased levels of fatty acids in
the haemolymph.
The metabolomics investigation also determined a significant decrease in two nucleosides,
uridine and inosine, in the haemolymph of D. magna in response to cadmium exposure.
Uridine is a pyrimidine nucleoside found in RNA and is a precursor for the pyrimidine
nucleosides in DNA, while inosine is a precursor for the purine ribonucleotides. The up-
regulation of genes involved in embryonic development in this present study would explain

- 113 -
the decrease in these nucleosides as they are utilised for the synthesis of nucleotides
required for embryonic growth.
4.4 Conclusion
This study has demonstrated for the first time the feasibility of FT-ICR MS metabolomics on
small volumes of D. magna haemolymph, showing that it is a sensitive approach, detecting
thousands of unique signals. We have reported that significant cadmium induced toxic
effects can be determined using the haemolymph metabolome of D. magna, specifically
decreases in amino acids, fatty acids and nucleic acids. The concurrent transcriptomic study
has enabled us to integrate both metabolomics and transcriptomic signatures into a model of
cadmium toxicity, where a depletion of both lipid and protein reserves would likely result in
decreased fitness and survival during prolonged exposure.
Having confirmed here that FT-ICR MS analysis of haemolymph is a feasible approach for
determining toxicant induced effects in D. magna; I next evaluate the capabilities of both
haemolymph and whole organism homogenates of D. magna in discriminating between
toxicant MOAs.

- 114 -
CHAPTER FIVE:
Discriminating toxicant modes of action via changes in the
daphnid metabolome†
†The contents of this Chapter, including the figures, have been submitted to Toxicological Sciences:
Taylor, N. S. and Viant, M. R. Discriminating toxicant modes of action via changes in the daphnid metabolome.

- 115 -
5.1 Introduction
A battery of standardised toxicity testing strategies exists for assessing the potential hazards
of chemicals that may enter the environment; these and their limitations are discussed in
Chapter 1. The potential role and importance of metabolomics in toxicity testing and
ecological risk assessment is currently being evaluated (Ankley 2008), for example as a tool to
discover the mode(s) of action (MOA) of toxicants at a metabolic level (Bundy et al. 2009).
Such an application would exploit several of the strengths of metabolomics, including its
ability to characterise multiple metabolic pathways simultaneously and in a relatively rapid
and non-targeted manner. After having catalogued a library of sub-lethal metabolic
responses to a series of defined MOAs, this approach could be used as a discovery tool for
identifying the MOA of a new drug or emerging environmental contaminant, (Edwards and
Preston 2008) with subsequent use in screening and/or prioritisation of chemicals in risk
assessment. However, for this to be achieved it is first necessary to confirm that different
chemical MOAs do indeed elicit specific and distinct metabolic response profiles that can
predict toxicity (Guo et al. 2009). As detailed in Section 1.4.1, this has been achieved in
mammalian toxicology by the COMET group (Ebbels et al. 2007; Lindon et al. 2005) and yet
there remain relatively few studies published that have applied metabolomics to investigate
the specificity of toxicant MOAs in ecotoxicology (Guo et al. 2009; McKelvie et al. 2009; Viant
et al. 2006b). Furthermore, all such studies to date have utilised NMR based metabolomics
only. FT-ICR MS provides ca. 10 times greater coverage of the metabolome than that
achieved using standard NMR approaches. Building on the findings from our previous work
(Chapters 3 and 4), which established FT-ICR MS based metabolomics as an effective

- 116 -
technique for assessing toxicity in both the whole-organism and haemolymph metabolome
of D. magna; the main objective of this investigation is to develop robust multivariate models
to predict toxicant MOA using FT-ICR MS metabolomics data derived from D. magna toxicity
tests. These investigations are focussed on four model toxicants: cadmium (Cd; an inducer of
oxidative stress; (Stohs and Bagchi 1995)), fenvalerate (induces hyper-excitation through
prolonged opening of sodium channels; (Ray and Fry 2006)), 2,4-dinitrophenol (DNP; an
uncoupler of oxidative phosphorylation; (Drysdale and Cohn 1958)) and propranolol (a non-
selective β-blocker; (Huggett et al. 2002)). The first aim was to attempt to detect metabolic
responses, following acute exposures to each toxicant, in both the whole organism
metabolome (derived from homogenate of an individual daphnid) and the haemolymph
metabolome (sampled from an individual animal). The second aim was to determine if the
four different MOAs could be distinguished based upon the measured metabolic responses,
using supervised multivariate modelling coupled to robust cross-validation and permutation
testing. The final aim was to determine whether the metabolome of haemolymph or of
whole organism homogenates was the more discriminatory of toxicant MOA.
5.2 Materials and Methods
5.2.1 Optimisation of FT-ICR MS analysis of individual daphnid haemolymph
Since the studies detailed in Chapter 4 utilised pooled haemolymph samples, the first stage
of this investigation was to determine if FT-ICR MS of haemolymph from an individual
daphnid was feasible. Haemolymph and metabolite extraction from individual daphnids was
as detailed in Section 2.3.2 with varying resuspension volumes of 16, 20 and 30 µL (n=5

- 117 -
daphnids per resuspension volume) of 80:20 methanol:water containing 20 mM ammonium
acetate. FT-ICR MS analysis in negative ion mode and data processing were conducted on all
samples (Sections 2.4 and 2.5 respectively) and the results assessed to determine the optimal
resuspension volume for an individual daphnid haemolymph sample.
5.2.2 Determination of sub-lethal concentrations
To determine the appropriate sub-lethal concentrations for each of the four toxicants
(cadmium, 2,4-dinitrophenol, fenvalerate and propranolol; all Sigma Aldrich, UK), initial 24 h
acute toxicity studies were carried out. Groups of 30 neonates (< 24-h old), in 250 mL of
clean media were exposed to a range of concentrations of one of the toxicants (0-1000 μgL-1
Cd; 0-20 mgL-1
DNP; 0-20 μgL-1
fenvalerate and 0-24 mgL-1
propranolol), with n=3 exposure
vessels per concentration. All toxicants were solubilised in deionised water with the
exception of fenvalerate, which used dimethyl sulfoxide (DMSO) as a solvent (0.00001%) with
a corresponding solvent control. No food or supplements were provided during this exposure
and any mortality after 24 h was recorded. PROBIT analysis (SPSS v16, SPSSInc, Chicago) was
used to establish the neonatal LC50 for each of the four toxicants.
5.2.3 Adult Daphnia magna acute toxicity studies
The nominal exposure concentration for each of the four toxicants was standardised to 10%
of the calculated neonatal LC50 to ensure that any metabolic effects were sublethal. This
approach also effectively normalised the exposure concentration to a defined biological
effect. The nominal concentrations were 71 μgL-1
cadmium (measured as Cd2+
ions), 1.5 mgL-1

- 118 -
DNP, 0.6 μgL-1
fenvalerate (0.00001% DMSO) and 1.4 mgL-1
propranolol. For all toxicity
exposures, third brood neonates were obtained and cultured as normal until 14 days of age,
and then individual daphnids were transferred to 250 mL of clean media and exposed to the
relevant toxicant for 24 h. Four sample groups were used for each toxicant: control (n=10
individuals) and toxicant-exposed (n=10) for whole organism sampling, and control (n=10)
and toxicant-exposed (n=10) for haemolymph sampling. Again, no food or supplements were
provided during the exposures.
5.2.4 Animal capture and metabolite extraction
Following 24 hours of exposure, daphnids were captured and metabolites extracted using
one of two methods (Sections 2.2 and 2.3). For whole organism homogenate studies,
daphnids were captured by filtration through a fine mesh gauze, transferred rapidly to a
Precellys™ homogenisation tube, flash frozen in liquid nitrogen, and then stored at -80°C
until metabolite extraction. Metabolite extraction used the two-step
methanol:chloroform:water protocol detailed in Section 2.3.1, including the preparation of
an extract blank. For haemolymph studies, animals were transferred onto clean microscope
slides, carefully blotted dry and approximately 1 μL of haemolymph was extracted by piercing
the carapace close to the heart using a 21 gauge needle and collecting the haemolymph
using a micropipette as described by Mucklow and Ebert (Mucklow and Ebert 2003). Each
haemolymph sample was place in an individual Eppendorf™ tube and again stored at -80°C.
Metabolites from the haemolymph samples were extracted and an extract blank prepared,
as described in Section 2.3.2. The evening prior to FT-ICR MS analysis, each ca. 1 μL

- 119 -
haemolymph sample was diluted with 30 μL of 80:20 methanol:water containing 20 mM
ammonium acetate, vortexed, and stored at -20°C overnight to facilitate protein
precipitation.
5.2.5 FT-ICR MS, data processing and metabolite identification
On the day of FT-ICR analysis, one aliquot of each of the dried polar extracts from the whole
daphnid extractions was resuspended in 30 μL 80:20 methanol:water containing 20 mM
ammonium acetate. The protein-precipitated haemolymph samples were used directly. All
biological samples and extract blanks were then prepared, analysed in triplicate, in negative
ion mode, by DI FT-ICR MS, utilising the SIM-stitching method, as described in Section 2.4.
Mass spectra were processed as detailed in Section 2.5; the sample filter set to retain only
those peaks that occurred in at least 50% of all samples using a 1.8ppm spread along the m/z
axis for defining unique peaks, and blank peaks were retained only if twice as intense in the
biological sample.
For the individual analyses of each of the four toxicants, mass spectral processing was
applied to each of the whole organism homogenate datasets and to each of the haemolymph
datasets, resulting in eight data matrices in total (each comprising n=10 controls and n=10
exposed). For the analysis of all toxicants together, mass spectra were reprocessed (as stated
above, except that in this case all peaks in the “extract blank” were removed from the
biological samples) to obtain one whole organism homogenate dataset and one haemolymph
dataset (each comprising n=30 controls, n=10 solvent controls, and n=10 exposed to each of
the four toxicants). Subsequently, every matrix was further processed by the addition of

- 120 -
missing values, normalised and g-log transformed (transformation parameter λ=7.31×10⁻¹¹
)
as detailed in Section 2.5. Putative identification of peaks was as described in Section 2.6,
which consequently enabled the identification of peaks directly related to the parent
toxicants, which were subsequently removed from the datasets prior to statistical analysis.
5.2.6 Statistical analysis
To assess the effects of each individual toxicant on both the whole organism and
haemolymph metabolomes of D. magna, eight principal components analyses (PCA) were
conducted on the processed data matrices (Section 2.7.1). The significance of separation
between the control and exposed classes – along the first several principal components (PCs)
– was evaluated via t-tests of the PC scores. Univariate statistical tests (t-tests; Section 2.7.2)
were used to determine if individual peaks (i.e. metabolites) changed significantly between
control and exposed classes.
To distinguish between the four toxicant MOAs, in both whole organism and haemolymph
metabolome datasets, two partial least squares discriminant analyses (PLS-DA) were
conducted (Section 2.7.1). Here, internal cross validation and permutation testing were
employed, as described below, to calculate robust classification error rates associated with
the prediction of toxicant MOAs. Results are presented as “balanced” error rates, i.e. the
average of false positive and false negative error rates (Fleuret 2004). First the number of
latent variables (LVs) for each PLS model (i.e. whole organism and haemolymph) was chosen
to minimise the classification errors. Then the following strategy was employed: an optimal
PLS-DA model was built and internally cross validated (venetian blinds with 8 splits) to yield

- 121 -
the “optimal model” classification error rate (derived from repeating the internal cross-
validation process 1000 times) for each class: control, solvent control, Cd, DNP, fenvalerate
and propranolol. Next, to evaluate the statistical significance of these error rates (i.e. to
ensure that the optimal model was not over-fitting the dataset) the class labels were
randomly permuted and another PLS-DA model was built. Internal cross validation was used
to calculate a “permuted” classification error rate (for control, solvent control, Cd, DNP,
fenvalerate and propranolol classes); this permutation and model building process was
repeated 1000 times. Statistical significance, for the prediction of each class, could then be
assessed by comparing the optimal model classification error rate to the null distribution of
permuted error rates (Westerhuis et al. 2008). Specifically the number of instances for which
the permuted classification error rate was less than the optimal model error rate was
determined and then divided by the total number of permutations (1000), generating a p-
value, with p<0.05 indicating that the metabolic profile associated with that toxicant MOA
could be discriminated from all other metabolic profiles.
5.3 Results and Discussion
5.3.1 Optimisation of FT-ICR MS analysis of individual daphnid haemolymph
FT-ICR analysis of samples resuspended in both 16 and 20 µL of MS solvent only enabled
each of the samples to be run in duplicate rather than triplicate, potentially due to
disturbance of particulates in the sample when loading the samples causing poor spray
stability. The samples resuspended in 30 µL of MS solvent were all successfully analysed in
triplicate, allowing data processing to be performed as detailed in Section 2.5. Furthermore

- 122 -
this achieved high quality mass spectra detecting ca. 2500 signals, therefore 30 µL of MS
solvent was determined to be sufficient for this approach and utilised for all FT-ICR MS
analysis of individual daphnid haemolymph samples.
5.3.2 Determination of sublethal concentrations
Preliminary acute toxicity tests were conducted in order to determine the D. magna neonatal
lethality concentrations for each of the four toxicants. The objective of these preliminary
exposures was to facilitate the selection of an exposure concentration for the acute toxicity
studies of the adult daphnids that would not induce any mortality, thus ensuring that any
observed metabolic effect was sublethal. The incidence of neonate mortality during these
exposures is summarised in Table 5.1, with the calculated neonatal LC50 for each of the
toxicants listed in Table 5.2. The nominal exposure concentrations selected for the acute
toxicity studies using adult D. magna were 10% of the neonatal LC50 for each toxicant.

- 123 -
Table 5.1 Results from 24 hr D. magna neonate acute toxicity study summarising the mean mortality
rate for each nominal concentration (n=3).
Toxicant Nominal concentrations Mean mortality rate (%)
Cadmium chloride * 0 μg/L 0
200 μg/L 0
400 μg/L 0
600 μg/L 25
800 μg/L 33
1000 μg/L 52
Fenvalerate ** 0 μg/L 0
2 μg/L 2
4 μg/L 18
6 μg/L 47
8 μg/L 73
10 μg/L 93
DNP 0 mg/L 0
5 mg/L 0
10 mg/L 5.5
12.5 mg/L 12
15 mg/L 33
17.5 mg/L 87
20 mg/L 100
Propranolol 0 mg/L 0
5 mg/L 2
10 mg/L 18
15 mg/L 33
18 mg/L 80
21 mg/L 92
24 mg/L 100
* Calculated at Cd2+
ions
** All concentrations using 0.00001% DMSO as solvent

- 124 -
Table 5.2 Calculated LC50 values from 24 hr neonate exposures using PROBIT analysis
Toxicant LC50
Cadmium chloride * 713.6 ± 154 μg/L
Fenvalerate 5.9 ± 0.5 μg/L
DNP 14.9 ± 2.9 mg/L
Propranolol 13.8 ± 2.4 mg/L
* Calculated at Cd2+
ions
5.3.3 Effects of individual toxicants on whole organism and haemolymph metabolomes
The first aim of this study was to utilise the mass spectrometry-based metabolomics
approach to attempt to detect metabolic responses to acute toxicity, in both the whole
organism and haemolymph metabolomes of individual adult daphnids. Exposure to 10% of
the concentration of the neonatal LC50 did not cause lethality for all four toxicants tested,
confirming that these studies evaluated sub-lethal metabolic responses in adult daphnids. FT-
ICR mass spectrometry of whole organism extracts and haemolymph resulted in high quality
metabolite profiles with a mean of 3094 signals detected in haemolymph and 4134 signals in
the whole organism extracts. Putative identification of peaks following spectral processing
identified any peaks that directly related to the parent toxicants, these are shown in Table
5.3, and were subsequently removed from the datasets at this stage; prior to statistical
analysis.

- 125 -
Table 5.3 Peaks identified in the FT-ICR mass spectra that directly related to parent toxicants. These
were subsequently removed from the metabolic datasets prior to statistical analysis.
PCA was used to visualise the metabolic differences between control and toxicant-exposed
samples (Figure 5.1). The scores plots show clear metabolic effects due to Cd, DNP,
fenvalerate and propranolol exposures, for both the whole organism and haemolymph
datasets. These effects were evaluated statistically by testing the significance of the
separation between each toxicant class and its corresponding control, along the PC1, PC2,
PC3 and PC4 axes (these PCs accounted for ≥60% of the total variance in each dataset; Table
5.4). All four toxicants induced a significant metabolic perturbation in both the haemolymph
and whole organism homogenates (all p<0.0125, Bonferroni-corrected for multiple testing),
with Cd inducing the largest effect, along PC1, in both sample types.
Haemolymph Whole organism
homogenates
[Dinitrophenol-H]- [Dinitrophenol-H]
-
[Dinitrophenol(13
C)-H]- [Dinitrophenol
(13
C)-H]-
[Propranolol+ 35
Cl]-
[Propranolol(13
C)+ 35
Cl]-
[Propranolol+ 37
Cl]-
[Propranolol(13
C)+ 37
Cl]-

- 126 -
To determine the number of peaks that changed intensity significantly in response to each
toxicant (and their proportion relative to the total number of peaks detected), Student’s t-
tests were applied between control (n=10) and exposed (n=10) samples (adjusted for
FDR<5%; Table 5.5). Consistent with the PCA results, the greatest number of (and relative
proportion of) significant peaks occurred in response to Cd, totalling ca. 600 for both
haemolymph and whole organism homogenates. For the other three toxicants, however, the
proportion of significantly changing peaks was much higher in the whole organism
homogenates (from 5-13%) than in the haemolymph samples (<1% for all three toxicants).
This provides the first evidence that the whole organism metabolome’s response to a
toxicant is typically more extensive (and potentially contains more information) compared to
the response of the haemolymph.

- 127 -
Figure 5.1 PCA scores plots from analysis of FT-ICR mass spectra of D. magna (a) haemolymph and (b) whole
organism homogenates following Cd exposure (control ●, exposed Δ), (c) haemolymph and (d) whole
organism homogenates following DNP exposure (control ●, exposed ◊), (e) haemolymph and (f) whole
organism homogenates following fenvalerate exposure (control ■, exposed □), and (g) haemolymph and (h)
whole organism homogenates following propranolol exposure (control ●, exposed ○). All plots show PC1
against the (next) most significant PC axis and all show a toxicant induced metabolic response.

- 128 -
Table 5.4 Summary of p-values from Student’s t-tests of PC scores between control (n=10) and
exposed (n=10) samples, for Cd, DNP, fenvalerate and propranolol (see Figure 1). Data are presented
for both haemolymph and whole organism homogenates of D. magna.
Haemolymph
Principal
component
Cd DNP Fenvalerate Propranolol
PC1 2.12 × 10⁻⁶
(*) 0.25 0.06 6.20 × 10⁻³
(*)
PC2 0.04 0.04
0.55 0.72
PC3 0.66 7.66 × 10⁻³
(*) 4.32 × 10⁻⁶
(*) 0.12
PC4 0.75 0.17 0.75 0.06
Whole organism homogenates
Principal
component
Cd DNP Fenvalerate Propranolol
PC1 3.29 × 10⁻⁵
(*) 1.41 × 10⁻⁴
(*) 0.02 6.49 × 10
-3 (*)
PC2 0.04 0.32 1.29 × 10
-3 (*) 3.63 × 10
-3 (*)
PC3 0.23 9.45 × 10⁻³
(*) 0.67 0.74
PC4 0.89 0.81 0.40 0.16
* indicates significance at the Bonferroni-corrected p-value<0.0125

- 129 -
Table 5.5 Number of peaks that significantly changed concentration (FDR<0.05, relative to controls)
and their proportion relative to the total number of peaks detected, following exposure to cadmium,
DNP, fenvalerate and propranolol. Data are presented for both haemolymph and whole organism
homogenates of D. magna.
Haemolymph
Cd DNP Fenvalerate Propranolol
Number of
significant
peaks
618 9 31 10
Proportion of
significant
peaks (%)
21 0.3 0.8 0.4
Whole organism homogenates
Cd DNP Fenvalerate Propranolol
Number of
significant
peaks
660 544 398 232
Proportion of
significant
peaks (%)
14 13 12 5

- 130 -
While an extensive biochemical interpretation of the effects of each toxicant is not an
objective of this study, it is however valuable to confirm that some of the putatively
identified metabolites that change concentration are consistent with MOAs reported in the
literature. For example, focusing on the more extensive responses within the whole organism
homogenates, the uncoupler of oxidative phosphorylation (DNP) significantly induced
anticipated changes to the invertebrate phosphagen system, specifically arginine (p=0.0032)
and phosphoarginine (p=0.0112) (Uda et al. 2006). This response is comparable to a previous
metabolomics investigation into the responses of Japanese Medaka embryos to Dinoseb
(another herbicide that is known to uncouple oxidative phosphorylation), where the levels of
phosphocreatine (part of the vertebrate phosphagen system) were significantly changed
following exposure (Viant et al. 2006a). The study by Viant et al. (Viant et al. 2006a) also
found altered levels of ATP as a further indicator of disruption to energy metabolism,
however, in this current investigation ATP falls outside of the m/z range analysed so could
not be detected. Another study using rat hepatocytes exposed to Dinoseb (Palmeira et al.
1994) found a depletion of cellular glutathione, this depletion was proposed to initiate the
process of cell death. While not a significant change, a depletion of glutathione (0.6 fold
change) was also putatively identified in this investigation following DNP exposure. Cd
exposure, unlike the previous metabolomics study of copper toxicity in D. magna (Chapter 3),
did not induce oxidative stress in the form of glutathione depletion. However, consistent
with the reported toxicity of a low concentration of Cd (6 μg/L) to D. magna, in which Krebs
cycle enzymes were disturbed (Connon et al. 2008), we detected a significant increase in
isocitrate. Previously, Cd has been shown to inhibit the enzyme isocitrate dehydrogenase in

- 131 -
an aquatic invertebrate (Ivanina et al. 2008). From a comparison with the significant changes
found following Cd exposure in the investigation detailed in Chapter 4, it can be determined
that some of the changes putatively identified, specifically decreases in arginine, methionine,
histidine and phenylalanine could also be putatively identified in this investigation. However,
it needs to be noted that none of these changes are significant and the average fold change
for all these metabolites is small (0.8), but could be a further indication of the initial stages of
Cd toxicity causing depletion of amino acids for defence and repair mechanisms. Fenvalerate,
although unrelated to its action as a neurotoxin, has also been found to reduce Krebs cycle
enzyme activity, disrupting primary metabolism in catfish (Tripathi and Verma 2004). In D.
magna it reduced feeding rate and growth (Reynaldi et al. 2006), and a metabolomics study
into esfenvalerate toxicity to Chinook salmon (Viant et al. 2006b) found decreased levels of
ATP and phosphocreatine, all consistent with a perturbation to energy metabolism. Our
observations support this, with 1.7- and 1.8-fold increases in AMP (p=0.1010) and ADP
(p=0.0850) respectively, as well as a 2.2-fold increase in phosphoarginine (p=0.0087).
Propranolol is a non-selective β–adrenergic receptor blocker that is used to treat
hypertension (Sui et al. 2007). The metabolic effects of this drug in non-target organisms are
less well understood, potentially due to the lack of β–adrenergic receptors in cladocerans
(Stanley et al. 2006). The metabolic rate of D. magna was found to decrease in response to
acute metroprolol exposure (another β–adrenergic receptor blocker) thought to be a
consequence of reduced heart rate (Dzialowski et al. 2006). Whilst not significant, small
increases (1.2-2 fold changes) in the levels of many amino acids putatively identified in this
investigation following acute propranolol exposure could be a build up of these metabolites

- 132 -
due a reduced metabolic rate meaning they are not utilised for general metabolic processes.
Propranolol exposure to D. magna has also been reported to cause membrane
destabilisation (Huggett et al. 2002), while mussels exhibited an increase in lipid peroxidation
(Sole et al. 2010), however, the lipophilic metabolites were not analysed in the current study,
hampering the comparison of our data with the published literature. Future analysis of the
non-polar fractions would also be particularly advantageous in the case of the potential
disruption to energy metabolism indicated by DNP and fenvalerate exposure, as Daphnia are
known to store energy in the form of triglyceride droplets (Tessier and Goulden 1982).
5.3.4 Multivariate models for discriminating toxicant modes of action
The second aim was to determine if the four toxicants that induced metabolic perturbations
were distinguishable according to their MOAs. The metabolic measurements from the
individual acute toxicity tests were combined into two datasets (for haemolymph and whole
organism homogenates) optimal PLS-DA models were derived, using internal cross-validation
to assess their predictive powers. The optimal PLS models each comprised of eight LVs, based
upon the minimisation of classification errors, and accounted for ≥50% of the total variance
in the metabolic data. From the scores plots for haemolymph and whole organism
homogenates (LV1 vs. LV2, Figure 5.2a and 5.2b, respectively) a clear clustering of the
individual samples within some of the treatment classes is evident, particularly for the whole
organism homogenates. However the greatest separation within the haemolymph and whole
organism homogenate scores plots, though markedly more obvious for the former, is that of
the fenvalerate exposed samples and their corresponding solvent controls away from all

- 133 -
other samples along LV1. This suggested a strong solvent effect. Therefore scores plots
showing LV2 vs. LV3 are also plotted (Figure 2c and 2d), which again show separations
between some of the treatment classes. Considering both scores plots for haemolymph
(Figure 2a and 2c), only the Cd-exposed class clearly separates from all other samples,
consistent with the results from the individual toxicant analyses. For the whole organism
homogenates (Figure 2b and 2d), there is much more distinct clustering of samples into each
of their individual toxicant classes.

- 134 -
Figure 5.2 PLS-DA scores plots depicting LV1 against LV2 for (a) haemolymph and (b) whole organism
homogenates, and LV2 against LV3 for (c) haemolymph and (d) whole organism homogenates of D.
magna exposed to each of four toxicants. Classes comprise of control (●), solvent control (■), Cd
exposed (Δ), DNP exposed (◊), fenvalerate exposed (□) and propranolol exposed (○). For both sample
types, the separation along LV1 is dominated by a solvent effect.

- 135 -
Visual examination of PLS-DA scores plots, however, is not a reliable method for determining
their predictive power (Westerhuis et al. 2008), partly because a 2-dimensional plot can only
provide a limited description of the optimal 8-dimensional models calculated here. Therefore
robust classification error rates for each of the treatment classes (control, solvent control,
Cd, DNP, fenvalerate and propranolol) were calculated using internal cross validation, and
the significance of these classification errors determined via permutation testing. The
“optimal model” classification error rates for each treatment, for both the haemolymph and
whole organism homogenate datasets, are low, confirming the high predictivities of the
models (Table 5.6). For both sample types, prediction of Cd-exposed samples had the lowest
error rates (both <1%), consistent with the visual interpretation of the PLS-DA scores plots
(Figure 5.2). The mean classification error rate (across all four toxicants and two control
classes) for the whole organism homogenates (3.9%) is lower than that for haemolymph
(6.9%), providing evidence that the whole organism metabolome contains a greater amount
of metabolic information that is specific to each of the four toxicant MOAs. These error rates
clearly demonstrate that the metabolic responses to the four toxicants can each be
differentiated from the others and also from the control groups. To highlight the quality of
these predictive models, both Cd- and fenvalerate-induced biomarker signatures are so
distinct that each enables >98% of samples to be correctly predicted; and this is true for
metabolic perturbations to both the whole organism and haemolymph metabolomes.

- 136 -
Table 5.6 “Optimal model” and “permuted” classification error rates for each of the six exposure
classes, and their mean value, for both haemolymph and whole organism homogenates of D. magna.
The permuted classification error rates are presented as the mean values derived from 1000 random
permutations of the class labels.
Haemolymph
Control Solvent
control
Cd DNP Fenvalerate Propranolol Mean
Optimal
model
classification
error rate (%)
11.2 2.7 0.1 17.8 1.2 8.2 6.9
Permuted
classification
error rate (%)
51.1 50.2 50.8 50.1 50.1 50.8 50.5
Whole organism homogenates
Control Solvent
control
Cd DNP Fenvalerate Propranolol Mean
Optimal
model
classification
error rate (%)
4.0 0.7 0.9 7.6 1.8 8.1 3.9
Permuted
classification
error rate (%)
50.9 50.1 50.2 50.0 50.4 50.8 50.4
For all six exposure classes, in both sample types, p-value<0.001

- 137 -
Although the classification error rates appear low, these values do not provide any measure
of statistical significance. To assess the statistical significance of these apparently highly
predictive multivariate models, permutation testing was conducted. One thousand random
permutations of the class labels prior to PLS-DA analyses resulted in a distribution of
“permuted” classification error rates for each class, the mean of each being ca. 50% (Table
5.6). From analyses of these distributions, the significance of the power of the optimal
models to predict each of the four toxicant MOAs and two controls classes was determined
to be p<0.001 (i.e. none of the 1000 permuted classification error rates were less than those
from the optimal models).
In principle, these predictive models can now be used to classify the metabolic perturbations
induced by a toxicant of unknown MOA as similar (or not) to that caused by an inducer of
oxidative stress, a sodium channel activator, an uncoupler of oxidative phosphorylation, or a
non-selective β-blocker. The actual application of such an approach to chemical toxicity
testing would of course require the construction of a larger library of sub-lethal metabolic
responses to a series of defined MOAs.
5.3.5 Whole organism metabolome provides more discriminatory predictive models
The final aim was to determine whether the metabolome of haemolymph or of whole
organism homogenates was the more discriminatory of the toxicant-induced metabolic
perturbations. The univariate and multivariate analyses presented above clearly demonstrate
that the whole organism metabolome provides the greatest predictivity of metabolic effect.
Specifically, considering the analysis of the effects of the individual toxicants, whole organism

- 138 -
homogenates displayed a higher percentage of significantly changing peaks (average of 11%
of all peaks detected across the four toxicants; Table 5.5) than for haemolymph (average of
5.6%). Furthermore, this value for haemolymph is skewed by the Cd exposure (21%), with the
remaining three toxicants inducing an average of only 0.5% of all peaks changing
significantly; i.e. Cd is the only toxicant to induce a major change in the haemolymph
metabolome. Overall this provides evidence that the whole organism metabolome’s
response to a toxicant is typically more extensive compared to the response of the
haemolymph. Further evidence for this can be derived from the PLS-DA models, in which the
mean classification error rate (across all four toxicants and two control classes) for the whole
organism homogenates (3.9%) is lower than that for haemolymph (6.9%). Hence this
confirms that the whole organism metabolome contains a greater amount of metabolic
information that is specific to each of the four toxicant-induced perturbations. It can
therefore be concluded that whole organism homogenates of D. magna should be employed
in any future applications of metabolomics in aquatic toxicity testing.
In addition to the evidence presented above, there are several further benefits of using
whole organism homogenates over haemolymph. First, whole organism sampling can be
applied across all daphnid life-stages while haemolymph can only feasibly be extracted from
adult animals. Second, whole organism studies allow for the standardisation of the biomass
per sample, this is an important criteria in FT-ICR mass spectrometry as highlighted by the
studies conducted in Chapter 3, whereas the volumes of haemolymph extracted can vary

- 139 -
considerably across individuals. Finally, the extraction of haemolymph from daphnids is more
time consuming and prone to operator error than simply flash-freezing whole animals.
5.4 Conclusion
This study represents the first reported multiple-toxicant metabolomics study in the OECD
recommended test species, Daphnia magna. We have confirmed that a metabolic effect can
be elucidated using both haemolymph samples and whole organism homogenates for four
different toxicants. We have also demonstrated that individual toxicants, with differing
MOAs can be distinguished using multivariate classification models with minimal
classification error rates. Based upon the results of the individual acute toxicity tests and the
combined analysis of all four toxicants, we conclude that whole organism homogenates are
the more information-rich sample type for use in predictive toxicology. These findings
strengthen the argument that omics approaches could become a valuable additional tool
within toxicity testing and ecological risk assessment. Moreover, the ability to use single
daphnids for such studies hints at the considerable future potential for causally relating
molecular responses to internationally-recognised reproductive fitness.
The next investigation aims to exploit this potential by evaluating the possibility of using
metabolic data to predict changes to the reproductive output of D. magna; utilising whole
organism homogenates of individual D. magna, identified here as the more information-rich
and reproducible sample type.

- 140 -
CHAPTER SIX:
Discovering metabolic markers that are predictive of
reduced reproductive output in Daphnia magna
- 141 -
6.1 Introduction
Over recent decades the use of biomarker techniques in ecotoxicology has become more
popular; looking for molecular indicators of exposure to toxic chemicals that ultimately leads
to higher level effects and are, in principle, capable of predicting reduced performance (De
Coen and Janssen 2003; Forbes et al. 2006; Moore et al. 2004). However, despite the early
promise of these techniques, they have done little except increase our ability to detect stress
responses at low levels of exposure (Preston 2002), and are yet to demonstrate their
usefulness in predicting organism fitness and subsequent population to ecosystem level
effects (Forbes et al. 2006). Lately, the utilisation of metabolomics techniques in toxicity
testing have had some success in overcoming the problem of elucidating toxicant MOA
(Ebbels et al. 2007; Guo et al. 2009; Viant et al. 2006b), and the previous study (Chapter 5)
has also shown this to be possible in Daphnia magna. However, until recently the metabolic
pertubations determined from metabolomic investigations have also lacked the ability to
predict whole organism fitness, such as adverse effects on growth or reproductive output.
One metabolomics study that attempts to address this issue was reported by Hines et al.
(Hines et al. 2010) where a measure of physiological response (scope for growth; SFG) and
metabolic changes in the marine mussel (Mytilus edulis) following exposure to copper or
pentachlorophenol (PCP), found metabolic signatures that were predictive of reduced fitness.
Since D. magna is a keystone species in the freshwater aquatic food web, any adverse effects
on this species could cause ecosystem level responses (Flaherty and Dodson 2005) and as
such is a vital species for any investigation that can link subcellular changes to whole
organism responses. A study reported by De Coen and Janssen (De Coen and Janssen 2003)

- 142 -
successfully attempted to link subcellular changes in D. magna to population level responses
by measuring chronic effects after 21 d of exposure to a series of toxicants, and building
multivariate models to predict changes in pre-defined metabolite changes measured at 96 h.
However, unlike metabolomics investigations, which are relatively non-targeted, this study
required the selection of short-term exposure endpoints and thus some prior knowledge of
toxicant MOA and expected targets of toxicity. Therefore, the main objective of this study is
to attempt to find molecular biomarkers of reduced reproductive output in D. magna,
following toxicant exposure, using FT-ICR MS-based metabolomics (of individual D. magna
whole-organism homogenates). These investigations used three of the model toxicants
investigated in Chapter 5: cadmium (Cd), 2,4-dinitrophenol (DNP) and propranolol, with the
initial aim being to induce changes in the reproductive output of D. magna following a
standard OECD chronic exposure (OECD 1998) to varying concentrations (0.05%-10% of the
neonatal LC50; 1% dose common to all three toxicants) of one of these toxicants. Since these
studies were conducted on individual daphnids, both the reproductive output and the
subsequent FT-ICR MS measurements relate to a single animal. To achieve the objective of
biomarker discovery, the development of robust multivariate models using partial least
squares regression (PLS-R) were employed to attempt to predict the reproductive output of
an individual D. magna based upon its metabolic profile.

- 143 -
6.2 Materials and Methods
6.2.1 Determination of sub-lethal concentrations
Initial 21 d test exposures to each of the 3 toxicants were conducted to determine the
appropriate concentrations at which the animals were likely to survive throughout the entire
exposure period. Individual 3rd
brood neonates were exposed to the relevant concentration
of toxicant in 250 mL media, exposure vessels were fed daily with Chlorella vulgaris as per
normal culturing conditions (Section 2.1) without the addition of any supplements. Media
and appropriate toxicant renewal occurred every 48 hours. The starting test concentration
for each of the three toxicants was 10% of the neonatal LC50 concentration previously
determined in Chapter 5 (n=5 exposure vessels per concentration). If mortality occurred
within the 21 d exposure period then repeat exposures of a lesser concentrations were set
up until a concentration was determined that allowed for survival through the entire test
period.
6.2.2 Daphnia magna chronic exposures
Individual D. magna neonates (3rd
brood, <24-h old), in 250 mL media, were exposed for 21
days to varying concentrations of one of the three toxicants tested (n=8 exposure vessels per
concentration). Animals were fed daily with Chlorella vulgaris as per normal culturing
conditions (Section 2.1) without the addition of any supplements, with media and toxicant
renewal every 48 hours. Three separate chronic studies were conducted using cadmium, DNP
or propranolol as the test chemical. Nominal concentrations were: 0, 0.35, 1.4, 3.5 and 7 μgL-
1 cadmium (measured as Cd
2+ ions); 0, 0.15, 0.75 and 1.5 mgL
-1 DNP and 0, 0.14, 0.7 and 1.4

- 144 -
mgL-1
propranolol. As a means of normalising to biological effect, the exposures of 7 μgL-1
cadmium, 0.15 mgL-1
DNP and 0.14 mgL-1
propranolol all corresponded to 1% of the
previously determined neonatal LC50 (Chapter 5). For each of the three chronic studies a
further control was set up that were not exposed to any toxicants but were fed on a half
ration of algae (termed “half-feed control”), in order to see if any of the adverse metabolic
effects were due to a reduction in feeding. Throughout each of the 21 d studies reproductive
output was monitored and recorded, specifically the number of offspring produced per adult
per brood and the day on which each brood was released. Neonates were removed from the
test beakers and discarded. Any mortality during the exposure period was also recorded. At
the end of the 21 d test period, the now adult daphnids were captured and flash frozen as
detailed in Section 2.2, then stored at -80°C prior to metabolite extraction.
6.2.3 Metabolite extraction, FT-ICR MS, data processing and putative peak identification
At the culmination of the 21 d exposure, daphnids were captured (Section 2.2) and
metabolites extracted as detailed in Section 2.3.1, including the preparation of an extract
blank. FT-ICR MS analysis in negative ion mode was performed on all biological samples and
extract blanks as described in Section 2.4, with all samples analysed in triplicate, utilising the
SIM-stitching approach.
For each of the three toxicants studied (Cd, DNP and Propranolol), mass spectra were
processed as detailed in Section 2.5; the sample filter set to retain only those peaks that
occurred in at least 50% of all samples using a 1.8ppm spread along the m/z axis for defining
unique peaks, and blank peaks were retained only if three times as intense in the biological

- 145 -
sample. This resulted in three separate processed data matrices, one each for Cd, DNP and
Propranolol. Subsequently, each matrix was further processed by the addition of missing
values, normalised and g-log transformed (transformation parameter λ=7.31×10⁻¹¹
). Putative
identification of peaks was as described in Section 2.6, enabling the identification of peaks
directly related to the parent toxicants, which were subsequently removed from the datasets
prior to statistical analysis.
6.2.4 Statistical analysis
To visualise the effects of each individual toxicant on the metabolome of D. magna, PCAs
were conducted on the processed data matrices (Section 2.7.1) to generate scores plots.
Univariate statistical tests (t-tests; Section 2.7.2) were used to determine if individual peaks
(i.e. metabolites) changed significantly between the control and high dose classes. The total
number of offspring produced per individual daphnid over the duration of the 21 d study was
used as a measure of reproductive output of D. magna. For each toxicant, Grubbs statistical
tests were employed for each dose group to determine any outliers in the reproductive
output data (which were subsequently removed from any further analysis) and ANOVAs
(across all controls and dose groups) were then conducted on this data followed by a Tukey-
Kramer post-hoc test that revealed any significant differences.
Partial least squares regression (PLS-R) was then employed for each individual toxicant to
analyse the metabolic data, whilst simultaneously modelling the reproductive output; this
was performed for each of the three toxicants tested. The metabolic data is used as a
predictor for the response variable of reproductive output (Wold et al. 2001) and PLS-R

- 146 -
attempts to find factors that both capture the variance in the metabolic data and achieves
correlation with the reproductive output (Wise et al. 2006). Cross validation (venetian blinds
with 6 splits) was employed to prevent over-fitting of the data (Wold et al. 2001). After cross
validation, the quality of the regression model was assessed by comparing the measured and
predicted values of reproductive output; this generates a cross-validated R2 value that is
indicative of how well the model might predict the reproductive output of unknown samples
(Wise et al. 2006; Wold et al. 2001). Next, to evaluate the statistical significance of these
cross-validated R2 values, the class labels were randomly permuted and another PLS-R model
was built. Internal cross validation was used to calculate a “permuted” R2 value; this
permutation and model building process was repeated 1000 times. Statistical significance, for
the prediction of reproductive output, could then be assessed by comparing the actual PLS-R
model R2 value to the null distribution of permuted R
2 values (Westerhuis et al. 2008).
Specifically the number of instances for which the permuted R2 values were greater than the
actual R2 value was determined and then divided by the total number of permutations
(1000), generating a p-value, with p<0.05 indicating that the metabolic profile associated
with exposure to that toxicant was predictive of reduced reproductive output in D. magna.
To determine which metabolites were predictive of changes in the reproductive output
regression vectors were generated from each of the three PLS-R models; this resulted in a list
of regression vectors (related to each of the peaks in the metabolic data) for Cd, DNP and
propranolol. In theory, those peaks then deemed to be important predictors could be
putatively identified (Wise et al. 2006), effectively revealing potential biomarkers of reduced
reproductive output in D. magna. These regression vectors were subsequently ranked in

- 147 -
order of absolute value and plotted to visually assess what proportion of the total number of
peaks dominated the PLS-R models for each toxicant. The original processed metabolic data
matrices for each of the toxicant exposures were then restructured in order of their absolute
regression vector values (from the highest to the lowest); this allowed further PLS-R model
building. Specifically, multiple PLS-R models were built using the restructured data matrices;
starting with the peak with the highest absolute regression vector value (P) then
incorporating the next peak from this list (P+1, P+2, P+3, etc), until all of the peaks from the
metabolic data were included in the model. This resulted in an R2 value for each further peak
included in the model, ultimately generating a list of R2 values that corresponded to the
number of peaks incorporated in the model. This multiple model building process was
conducted individually for all three toxicants (Cd, DNP and propranolol), consequently
producing a list of R2 values (for each peak included in the model) for each of the three
toxicants. These R2 values could then be plotted and further assessed to determine the
fewest number of peaks that needed to be included in the multi-regression analysis for each
toxicant, in order to produce an “optimal” PLS-R model that is highly predictive of
reproductive output.
6.3 Results and discussion
6.3.1 Chronic toxicant exposures of Daphnia magna
The preliminary 21 d exposures of D. magna to both DNP and propranolol determined that
10% of the neonatal LC50 (1.5 mgL-1
DNP and 1.4 mgL-1
propranolol) did not induce any
mortality for the duration of the exposure. However, exposure to cadmium did induce

- 148 -
mortality at this concentration, with 100% survival for the duration of a chronic 21 d study
only occurring at 1% of the neonatal LC50 (7 μgL-1
). Subsequently these concentrations were
used as the highest doses of each toxicant for the chronic studies. It should be noted that
subjective observations of the animals exposed to Cd showed them to be very immobile and
pale in colour at the end of this period.
No mortality occurred during the 21 d exposure to propranolol. Some mortality occurred
during the chronic exposures in both the Cd and DNP studies. Specifically, during the Cd
exposure: 1 animal died in each of the 0 and 1.4 μgL-1
doses, 5 animals died at 3.5 μgL-1
and 3
animals died at 7 μgL-1
. Due to the high levels of mortality in the Cd exposure, the 3.5 and 7
μgL-1
doses were subsequently grouped together as one dose for the analysis of reproductive
output. During the DNP exposure, 1 animal died in each of the 0, 0.15 and 0.75 mgL-1
dose
groups.
6.3.2 Metabolic effects of toxicant exposure
During FT-ICR MS analysis of the biological samples, it should be noted that one sample from
the half-feed control in the propranolol exposure failed to spray. Putative identification of
peaks following data processing allowed for the identification of two peaks ([Dinitrophenol-
H]- and [Dinitrophenol
(13
C)-H]-) in the DNP dataset that directly related to the parent
toxicant, these were removed prior to statistical analysis. Whilst determining a toxicant
induced metabolic effect was not an objective of this investigation, the metabolic data is
nonetheless required for the development of the predictive models and subsequent
biomarker discovery. Multivariate analysis (PCA) of the metabolic data for each toxicant is

- 149 -
presented in Figure 6.1. Visual interpretation of the PCA scores plots shows a clear
separation between the different dose groups following exposure to both Cd and propranolol
(Figure 6.1a and 6.1c respectively), indicating a toxicant induced metabolic effect. Exposure
to DNP (Figure 6.1b) is less well separated suggesting less of a toxicant effect in this instance.
For all three toxicant exposures the half-feed group was separated from the control and
toxicant exposed groups confirming that none of the toxicants caused a starvation effect.
Table 6.1 summarises the total number of peaks found in each of the three toxicant studies,
along with the proportion of those peaks that were significant following univariate analysis
(Student’s t-tests between control and high dose samples; adjusted for FDR<5%). Consistent
with the PCA results, where little class separation was visible, the proportion of significant
peaks in the DNP data is only 2.6% of the total peaks detected. The high proportion of
significant peaks in the Cd and propranolol datasets (59 and 44% respectively) is again
consistent with the clear separation seen in the corresponding scores plots.

- 150 -
Figure 6.1 PCA scores plot from analysis of the negative ion FT-ICR mass spectra from the D. magna
chronic studies exposed to (a) Cd, (b) DNP and (c) Propranolol. Classes comprise of control (●), half-
feed control (○), Low dose (□), medium dose (◊) and high dose(s) (Δ).

- 151 -
Table 6.1 The total number of peaks detected and the proportion of peaks that significantly changed
concentration (FDR<0.05) between the control and high dose groups, following chronic exposure of
D. magna to cadmium, DNP and propranolol.
Cd DNP Propranolol
Total Number of peaks 4056 4112 3647
Proportion of significant peaks (%) 59 2.6 44
6.3.3 Effects of chronic toxicant exposure on the reproductive output of D. magna
The initial aim of this study was to induce a change in the reproductive output of individual
D. magna following chronic toxicant exposure to Cd, DNP or propranolol. The reproductive
output of D. magna was assessed in terms of the total number of offspring produced per
individual daphnid throughout the 21 d exposure period. Figure 6.2 depicts the reproductive
output for every surviving animal for all three toxicants (Cd, DNP and propranolol). Grubbs
outlier tests determined that the reproductive output from two animals in the DNP exposure
were outliers (one in the low dose group and one in the medium dose group) and these have
subsequently been removed from the data. Visual interpretation of the plots shows a distinct
reduction in reproductive output with increasing toxicant dose following Cd exposure (Figure
6.2a). A clear toxicant induced effect can be seen following propranolol exposure (Figure
6.2c) but little effect can be seen on reproductive output following exposure to DNP (Figure
6.2b). Univariate statistical analysis (ANOVA across the dose groups) determined statistically
significant effects on D. magna reproductive output for all three toxicants: Cd (p= 1.73 × 10-

- 152 -
20), DNP (p= 1.49 × 10
-6) and propranolol (p= 1.52 × 10
-15). Subsequent Tukey-Kramer post-
hoc tests revealed that significant reproductive differences in the Cd exposed daphnids
occurred between all dose groups except for between the half-fed and low dose group. In
the DNP exposed daphnids the control, low and medium dose groups were significantly
different to the half-fed and high dose groups. The reproductive output from the control
group of daphnids in the propranolol exposure were significantly different from all other
dose groups, with the half-fed and low dose groups also proving to be significantly different
from the medium and high dose groups. These significant findings are consistent with the
plots in Figure 6.2, and establish that a reduction reproductive output of the daphnids has
been induced by each of the toxicants, with the most notable reduction occurring following
exposure to Cd.

- 153 -
Figure 6.2 Bar charts of the reproductive output of individual D. magna following 21 d exposure to (a)
Cd, (b) DNP and (c) Propranolol.

- 154 -
6.3.4 Development of predictive multivariate models
The overall objective of this study was to discover metabolic biomarkers that are predictive
of reduced reproductive output in D. magna following toxicant exposure. In order to achieve
this, cross-validated multivariate models were developed for each of the three toxicants (Cd,
DNP and propranolol) using PLS-R (Figure 6.3). The models were then evaluated as to how
well they might predict the reproductive output of unknown samples. The PLS-R models
generated high cross-validated R2 values for all three toxicants: Cd (4056 peaks; R
2 = 0.822),
DNP (4112 peaks; R2
= 0.768) and propranolol (3647 peaks; R2
= 0.735), suggesting high
predictive capabilities of each model, consistent with the highly correlated plots depicted in
Figure 6.3.
To assess the statistical significance of these apparently highly predictive multivariate
models, permutation testing was conducted. One thousand random permutations of the
class labels prior to PLS-R analyses resulted in a distribution of “permuted” cross-validated R2
values, the mean for each toxicant being ca. 0.05. From analyses of these distributions, the
significance of the power of the actual PLS-R models to predict the reproductive output of
individual D. magna was determined to be p<0.001 (i.e. none of the 1000 permuted cross-
validated R2 values were greater than those from the actual models) for all three toxicants.
The statistical significance of these highly predictive models demonstrates that signals from
the mass spectra of individual D. magna can be utilised to predict the reproductive output of
daphnids exposed to toxicants of the same or similar MOA and potentially extrapolation to
subsequent population/ecosystem effects.

- 155 -
Figure 6.3 Correlation between measured and predicted reproductive output for individual daphnids,
the latter derived from a PLS-R model and the metabolic signatures of individual daphnids following
exposure to (a) Cd, (b) DNP and (c) propranolol, including lines of best fit. The cross-validated R2
values are 0.822 for Cd (4056 peaks), 0.768 for DNP (4112 peaks) and 0.735 for propranolol (3647
peaks); p = <0.001 in all cases. Classes comprise of control (●), half-feed control (○), Low dose (□),
medium dose (◊) and high dose(s) (Δ).
- 156 -
6.3.4.1 Development of optimal predictive models using each toxicant
When building PLS-R models, regression vectors are generated; the highest regression
vectors relate to the m/z value of those peaks that are most predictive of reduced
reproductive output of D. magna using the metabolic data. This resulted in a ranked list of
absolute regression vectors for each toxicant (Cd, DNP and propranolol). These regression
vectors are depicted in Figure 6.4, and clearly show that only a small proportion of the total
numbers of peaks dominate the PLS-R models. As detailed in Section 6.2.4, these ranked
regression vector values were then used to build multiple PLS-R models for each toxicant,
incorporating increasing numbers of peaks. This strategy generated a list of R2 values for each
toxicant; these are depicted in Figure 6.5. Consistent with the plots of regression vectors
(Figure 6.4), it can clearly be seen only a small proportion of the total peaks are required to
achieve a high R2 value, thus a highly predictive model, for all three toxicants. Forward
selection was utilised to determine the fewest number of peaks required to build an
“optimal” highly predictive model (i.e. generating a high R2 value), using a cut-off point of
within 1% of the greatest R2 value generated by the multiple model building strategy. This
determined that (in order of absolute regression vector value), the top 107 peaks from the
Cd dataset, the top 502 peaks from the DNP dataset and the top 170 peaks from the
propranolol dataset would build toxicant specific models that are highly predictive of
reduced reproductive output in D. magna. The peaks determined from the forward selection
strategy are detailed on the Supplementary Information CD (Tables SI3, SI4 and SI5 for Cd,
DNP and propranolol respectively). The number of peaks required to build optimal predictive
models is consistent with toxicant induced effects of reproductive output in Figure 6.2, the

- 157 -
clearest toxicant induced effect is in the Cd data (Figure 6.2a) and requires the fewest peaks
in the optimal model, whereas the lack of toxicant induced effect in the DNP data (Figure
6.2b) requires the largest number of peaks in the optimal model.
Utilising the peaks from the forward selection strategy, optimal PLS-R models were then built
(Figure 6.6). These models generated cross-validated R2 values of 0.937 for Cd, 0.851 for DNP
and 0.907 for propranolol. These are all noticeably higher that the values generated from the
original models (0.822 for Cd, 0.768 for DNP and 0.735 for propranolol) but consistent in
their predictive capabilities, with the Cd dataset being the most predictive of reduced
reproductive output in D. magna. It is notable that, for all three toxicants, over one hundred
peaks are required to build the optimal, highly predictive, PLS-R models. This indicates that a
lot of metabolic data is required to predict reduced reproductive output in D. magna.

- 158 -
Figure 6.4 Plots of the ranked absolute regression vectors generated from the building of PLS-R
models using metabolic and reproductive output data from individual D. magna following 21 d
exposure to (a) Cd, (b) DNP and (c) Propranolol. The inset plots are the top 500 peaks in each
instance.

- 159 -
Figure 6.5 Plots of the R
2 values of increasing numbers of peaks (ranked by absolute regression
vector) incorporated into the building of PLS-R models using metabolic and reproductive output data
from individual D. magna following a 21 d exposure to (a) Cd, (b) DNP and (c) Propranolol. The inset
plots are the first 500 peaks included in the model in each instance. This data was used in a forward
selection strategy for building an optimal PLS-R model for each toxicant.

- 160 -
Figure 6.6 Correlation between measured and predicted reproductive output for individual daphnids,
the latter derived from an optimal PLS-R model and the metabolic signatures of individual daphnids
following exposure to (a) Cd, (b) DNP and (c) propranolol, including lines of best fit. The cross-
validated R2 values are 0.937 for Cd (107 peaks), 0.851 for DNP (502 peaks)and 0.907 for propranolol
(170 peaks). Classes comprise of control (●), half-feed control (○), Low dose (□), medium dose (◊) and
high dose(s) (Δ).

- 161 -
6.3.5 Discovery of biomarkers predictive of reduced reproductive output in D. magna
One objective of this study was to find molecular biomarkers of exposure, regardless of
toxicant MOA. Therefore, the peaks that were determined from the forward selection
strategy for use in the optimal (but toxicant specific) PLS-R predictive models were assessed
to establish whether there were any common peaks across the three toxicant models (Cd,
DNP and propranolol). Putative identification of these peaks could then identify potential
biomarkers of reduced reproductive output (Wise et al. 2006). A peak was deemed to be
common across the datasets if it occurred within a 1 ppm error range. Figure 6.7a visually
depicts the common peaks from the three toxicant datasets; clearly the majority of common
peaks occur between the Cd and propranolol datasets, with less overlap with the DNP data in
both cases and only one peak common across all three toxicants. To confirm that the
appearance of common peaks was not purely by chance due to using a large number of
peaks, random permutations (n=3) of the datasets were utilised to assess this (Figure 6.7b).
This clearly shows that no common peaks were found using the permuted data giving
confidence in the occurrence of the common peaks in the real data and their potential to be
biomarkers of reduced reproductive output in D. magna.
The common peaks across two or more of the three datasets are explicitly listed in Table 6.2,
along with the putative identification of those peaks using the modified KEGG database as
described in Section 2.6. Further information on the significance and fold change of these
peaks (Student’s t-tests between control and high dose samples; adjusted for FDR<5%)
detailed in Table 6.3. There is a degree of consistency of the fold changes and significance of
some of the peaks are detailed in Table 6.3 highlighting these peaks in particular as metabolic

- 162 -
biomarkers of reduced reproductive output, regardless of toxicant MOA. Interestingly there
are also some inconsistencies (marked as bold in Table 6.3) which suggests that the
predictive models are somewhat toxicant specific and the metabolic changes are related to
the toxicant with the reduced reproductive output just well correlated rather than causally
related.
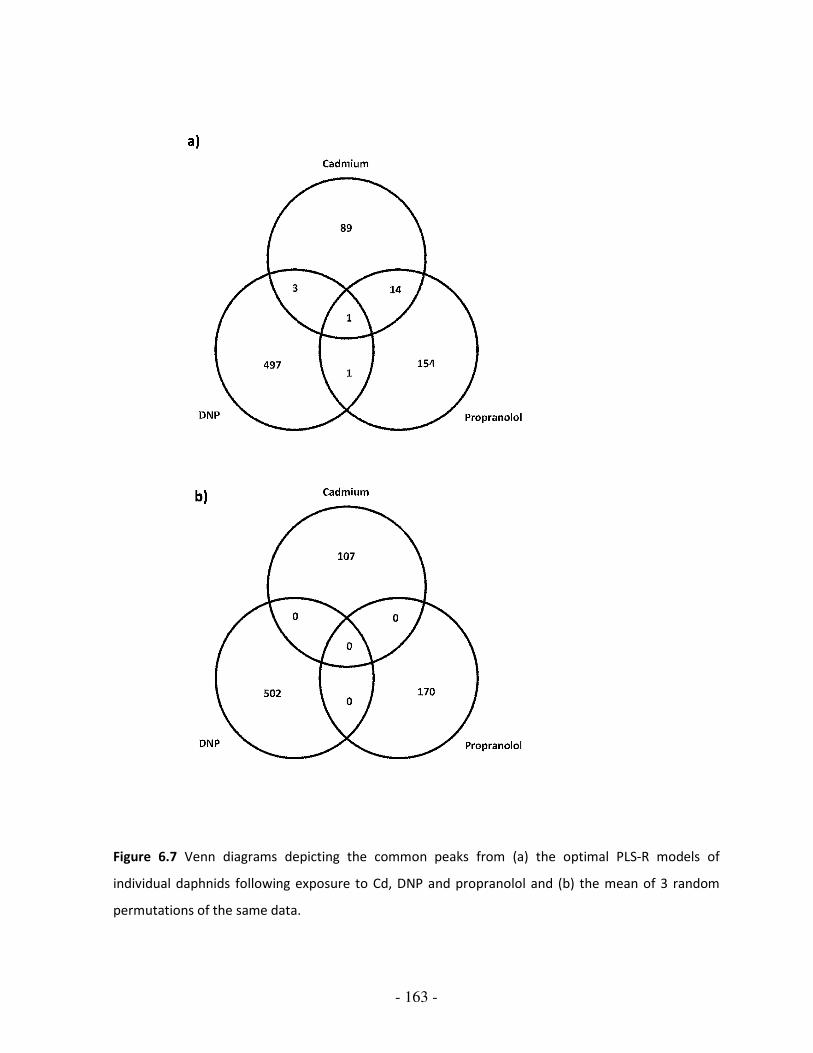
- 163 -
Figure 6.7 Venn diagrams depicting the common peaks from (a) the optimal PLS-R models of
individual daphnids following exposure to Cd, DNP and propranolol and (b) the mean of 3 random
permutations of the same data.

- 164 -
Table 6.2 Summary of the common peaks the optimal PLS-R models of individual D. magna following
exposure to cadmium, DNP and propranolol. With the putative identification of metabolites using a
modified KEGG database.
Cd DNP Propranolol
Empirical formula of
putatively identified
metabolite
Putative metabolite
identification a
145.06265 145.06267
175.02481 175.0248 175.02482 C6H8O6 Ascorbate (11)
181.07302 181.07308 C7H10N4O2 Lathyrine
196.04518 196.04505
237.99488 237.9949
251.09631 251.09627
275.00834 275.00834
277.2178 277.2178 M1 (12
C)
278.22116 278.22116 M1 (13
C)
295.99316 295.99326
340.12549 340.12564
354.17616 354.17634
359.22133 359.22124
392.97009 392.96982
400.14692 400.14709
411.27628 411.27618
441.17365 441.17369
474.97352 474.97312
475.17612 475.17586
a Following removal of assignments in which the match was a non-endogenous metabolite such as a
drug, plasticiser or pesticide. However, compounds such as secondary alkaloid metabolites and
bacterial metabolites have not been removed and the presence of these reflects the fact that
empirical formulae are insufficient for unambiguous metabolite identification. The number in
parentheses represents the total number of possible metabolites that match the stated empirical
formula.

- 165 -
Table 6.3 Summary of the common peaks the optimal PLS-R models of individual D. magna following
exposure to cadmium, DNP and propranolol. Showing the significance and fold change values for each
of the peaks following Student’s t-tests between control and high dose samples; adjusted for
FDR<5%. Peaks marked in bold text show inconsistency in fold changes between toxicants.
m/z Cd DNP Propranolol
145.063 0.938 0.802 -
175.025 0.498 0.636 0.571
181.073 6.722 (***) 0.574 -
196.045 2.199 0.478 -
237.995 1.354 - 7.225
251.096 0.503 (*) - 0.188 (***)
275.008 0.704 - 0.298 (**)
277.218 0.229 - 0.736
278.221 0.260 - 0.753
295.993 0.438 (*) - 0.383 (**)
340.125 11.993 - 5.284 (***)
354.176 - 0.571 0.375
359.221 0.337 - 0.931
392.970 0.128 (***) - 0.204 (**)
400.147 20.737 - 7.558 (***)
411.276 0.164 - 1.433
441.174 0.534 - 1.011
474.973 0.182 (***) - 0.209 (**)
475.176 10.705 (**) - 0.625
*** p=0.005
** p=0.01
* p=0.05

- 166 -
6.3.5.1 Potential biomarker of reduced reproductive output in D. magna
Ultimately, the ideal route forward is extensive metabolite identification of the peaks that
were utilised in the optimal PLS-R models for each of the three toxicants. A biomarker
signature of >100 peaks rather than a single or several peaks is a more robust approach to
relating subcellular changes to whole organism response. This would create models of
metabolic signatures that are predictive of toxicant specific induced reduction in
reproduction in D. magna. However, such extensive metabolite identification is extremely
challenging and new methods are being developed to overcome this problem. Until this is
achievable, here, we focus on the single peak that was determined to be an important
predictor of reduced reproductive output in D. magna across all three toxicants, this has
been putatively identified as ascorbate (Table 6.2). The fold change in this peak is also
consistent across the three toxicants (a mean 2-fold decrease from control to high dose)
indicating that a reduction in ascorbate could be a biomarker of exposure that is causally
related to reduced reproductive output in D. magna, regardless of toxicant MOA. Ascorbate
has long been associated with fertility (Loh and Wilson 1971), it is considered an essential
biochemical for reproduction and potentially a significant factor in human fertility (Luck et al.
1995). In the aquatic environment, ascorbate is used as a supplement in the aquaculture of
fish as it is deemed such an important nutrient for reproductive function, a deficiency causing
reduced gamete production and quality and thus fertility (Ciereszko and Dabrowski 1995;
Dabrowski and Ciereszko 2001). There is evidence that ascorbate performs a protective role
against genetic defects during gametogenesis in fish (Dabrowski and Ciereszko 2001) and it
has also been proposed as a biomarker of ovulation in the seabass (Dicentrarchus labrax)

- 167 -
(Guerriero et al. 1999). Similar findings have also been reported in the aquaculture of
Penaeid shrimp, where high levels of dietary ascorbate were related to a high hatch rate of
Fenneropenaeus indicus eggs (Wouters et al. 2001) and a diet high in ascorbate also
increased the resistance of postlarvae shrimp (Penaeus monodon and Penaeus vannamei) to
infection and stress (Merchie et al. 1997). The previously reported study by De Coen and
Janssen (2003) which attempted to link early biomarkers of exposure to whole organism
responses found that the highest contributions to the predictive models for growth and
survival were obtained from cellular energy allocation measurements (particularly lipid
content) and parameters related to oxidative stress (catalase and DNA damage) (De Coen
and Janssen 2003). The lipid fractions of the samples used in this investigation were not
analysed, however, the potential discovery of a reduction in ascorbate, combined with its
well known anti-oxidant properties (Padayatty et al. 2003) are consistent with the
speculation that damage caused by oxidative stress is predictive of reduced survival
capabilities of D. magna (De Coen and Janssen 2003).
Our findings indicate that a decrease in ascorbate levels in D. magna, could be predictive of
reduced reproductive output as it features highly in all three optimal PLS-R models (for Cd,
DNP and propranolol. The reported evidence of high levels of ascorbate relating to high
levels of fertility and reproductive function gives confidence in the putative identification of
this predictive peak as ascorbate, however, further work is required to confirm the identity of
this peak, and indeed of the other peaks that could potentially be predictive of reduced
reproductive output in D. magna. Techniques such as tandem MS (MS/MS) can be used,

- 168 -
allowing structural identification of metabolites from interpretation of fragment ions and
fragmentation patterns (Dunn and Ellis 2005).
6.4 Conclusion
This study has established that metabolic signatures from individual D. magna exposed to
toxicants can be used to develop multivariate models that are highly predictive of reduced
reproductive output. Furthermore, it has determined that biomarkers of reduced
reproductive output can be elucidated that are either toxicant specific (Cd, DNP or
propranolol) or generic. One particular example from this work is the possibility that
decreased ascorbate levels could be a generic biomarker of reduced reproductive function in
D. magna. However, this investigation has also highlighted that a lot of metabolic data is
required to build highly predictive models and, despite the challenge of metabolite
identification, metabolomics studies are ideal for measuring hundreds of metabolites
simultaneously requiring no prior knowledge of toxicant MOA. Since chronic studies are both
resource and time expensive, methods that reduce these costs are the ultimate aim for
ecotoxicological studies that are predictive of whole organism responses (Santojanni et al.
1998). The greatest validation of this approach would therefore be to determine if short-
term (acute) exposure to these toxicants could establish the same metabolic pertubations
and biomarkers of toxicity. Overall, this investigation highlighted the considerable potential
of using non-targeted metabolomics to find measurements of subcellular responses that can
be predictive of higher level biological responses, with subsequent implications for
population and ecosystem dynamics.

- 169 -
CHAPTER SEVEN:
Final Conclusions and Future Work

- 170 -
At the start of this research four aims were outlined (Section 1.8) in order to achieve the
primary objective of this thesis in exploring the potential for FT-ICR mass spectrometry based
metabolomics in regulatory toxicity testing using Daphnia magna. Initially the feasibility of
using this approach with the small, freshwater invertebrate, D. magna had to be assessed
(Chapters 3 and 4). The concept of a metabolic biomarker signature that informs upon
toxicant MOA (Chapter 5) and on reproductive fitness (Chapter 6) was then explored, using
different metabolite signatures for each outcome. How well these aims were addressed will
be considered and what further work is necessary, either to entirely fulfil these aims or in
light of the findings from each investigation.
7.1 The feasibility of FT-ICR MS-based metabolomics for toxicity testing using Daphnia
magna
The first aim of this thesis was to optimise an FT-ICR mass spectrometry based metabolomics
approach using whole organism homogenates of D. magna; subsequently validating this
technique using copper as a model toxicant and assessing its feasibility for use in first-tier
toxicity testing.
The studies detailed in Chapter 3 are the first reported metabolomics investigations utilising
the keystone freshwater aquatic invertebrate D. magna. The findings confirm that FT-ICR MS,
coupled with the SIM-stitching spectral processing approach, is an effective method of
toxicity testing using D. magna whole organism homogenates. Specifically, during the
optimisation studies it was highlighted that this approach was a highly sensitive technique,
detecting many thousands of signals, and was reproducible, capable of discriminating
between different life-stages of Daphnia. A further discovery during the optimisation studies

- 171 -
was that the technique also discriminated between differing masses of biological material
drawing an important conclusion that the amount of biological material used in this approach
needs to be standardised for any direct comparison of the results. This finding is important
for FT-ICR MS metabolomics studies of any biological sample. The feasibility of this approach
for future first-tier toxicity testing was confirmed by the results from the acute copper
toxicity tests. Here, supervised multivariate analysis (PLS-DA) enabled the classification of
samples into differing degrees of copper toxicity, with a high degree of consistency of the
copper induced metabolic changes between the positive and negative ion mode mass
spectrometry measurements. Putative identification of peaks identified potential biomarkers
of toxicity that were consistent with the known MOA of copper, including known biomarkers
of oxidative stress such as depleted GSH and a decrease in the amino acid pool. In addition to
this, the discovery of increased N-acetylspermidine following copper exposure as a potential
new biomarker highlighted the potential of this approach for metabolic biomarker discovery
and mechanistic insight into toxicant MOA. Further analysis would be required to confirm N-
acetylspermidine as a novel biomarker of copper toxicity, such as tandem MS to confirm the
metabolic identity of this signal in the mass spectrum or targeted analysis such as HPLC on
levels of N-acetylspermidine following copper, or indeed other heavy metals, exposures.
These findings have validated the FT-ICR MS approach as an effective approach, ideal for high
throughput first-tier screening of chemicals in D. magna. Future studies using other toxicants
with well documented MOAs would add further validity to this approach.
An area where this approach has its limitations is in the identification of metabolites. Each
peak could comprise of more than one metabolite as structural isomers will not be separated

- 172 -
by the direct infusion FT-ICR approach and none of the metabolite assignments reported in
this study can be regarded as unambiguous since they depend only on accurate mass. To
overcome these issues, a hyphenated technique such as LC-MS or tandem MS could be
employed, however, these techniques would prevent this being a high-throughput approach.
Since the overall objective of these studies was to assess this approach for use in high-
throughput screening and prioritisation of toxicants for further testing then it can be
concluded that the outcomes of these studies have met this aim.
7.2 The FT-ICR MS-based metabolomics approach using Daphnia magna haemolymph
Following the achievement of the first aim of optimising and validating the FT-ICR MS
metabolomics approach for toxicity testing using whole body homogenates of D. magna the
second aim of this thesis was to optimise the same approach using D. magna haemolymph.
The premise for using haemolymph as a biological sample being that it could provide a
“cleaner” biological sample for detecting significant metabolic changes when compared to
whole organism homogenates that could mask subtle toxicant induced effects (i.e. organ or
tissue specific effects). The toxicant induced metabolic effects on D. magna haemolymph
were evaluated in conjunction with the findings from a transcriptomics study of further D.
magna whole organism samples, both using cadmium (Cd) as a model toxicant.
The findings from the studies in Chapter 4 determined that the FT-ICR MS approach was
feasible for use with small pools of daphnid haemolymph. Several thousand unique signals
were detected, clearly distinguishable from an extract blank sample that contains no
biological material. This is comparable to the signals detected by the previous studies that

- 173 -
utilised whole organism homogenates of D. magna (Chapter 3) which were concluded to be
suitable for first-tier toxicity testing (Section 7.1). In assessing the validity of using
haemolymph for high-throughput toxicity testing, an acute exposure using Cd as a model
toxicant was employed. Following unsupervised multivariate analysis (PCA), the results of this
exposure demonstrated a clear and significant Cd induced metabolic effect on the daphnid
haemolymph samples. Univariate analysis determined which peaks were changing
significantly due to Cd exposure and these were then putatively identified, specifically
significant changes included decreases in amino acids, fatty acids and nucleic acids.
The primary objective of these studies was to evaluate the use of D. magna haemolymph as a
biological sample for high-throughput toxicity testing using FT-ICR MS-based metabolomics.
The high quality mass spectra produced during this study, along with the significant
metabolic changes induced by exposure to Cd, permits the conclusion that using this
approach with small pooled samples of haemolymph is feasible for determining toxicant
induced effects in D. magna. Consequently this determines that daphnid haemolymph could
also be utilised for first-tier screening and prioritisation of toxicants. The second objective of
using both metabolomic and transcriptomic investigations to examine the toxicity of Cd to D.
magna was also achieved. A level of consistency between the findings from the two
approaches allowed for the development of a model of Cd toxicity, where a depletion of both
lipid and protein reserves would likely result in decreased fitness and survival during
prolonged exposure. Again, further studies using other toxicants with well documented
MOAs would be necessary to completely establish that the use of D. magna haemolymph is a
viable sample type for the FT-ICR MS approach.
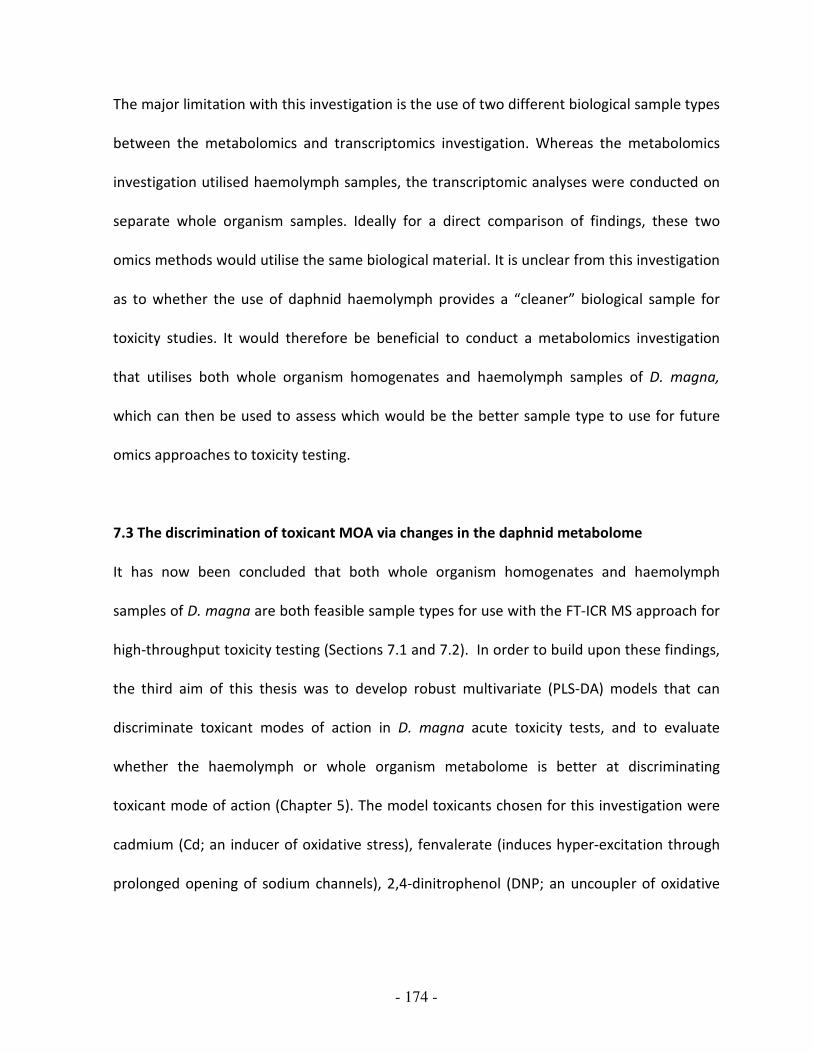
- 174 -
The major limitation with this investigation is the use of two different biological sample types
between the metabolomics and transcriptomics investigation. Whereas the metabolomics
investigation utilised haemolymph samples, the transcriptomic analyses were conducted on
separate whole organism samples. Ideally for a direct comparison of findings, these two
omics methods would utilise the same biological material. It is unclear from this investigation
as to whether the use of daphnid haemolymph provides a “cleaner” biological sample for
toxicity studies. It would therefore be beneficial to conduct a metabolomics investigation
that utilises both whole organism homogenates and haemolymph samples of D. magna,
which can then be used to assess which would be the better sample type to use for future
omics approaches to toxicity testing.
7.3 The discrimination of toxicant MOA via changes in the daphnid metabolome
It has now been concluded that both whole organism homogenates and haemolymph
samples of D. magna are both feasible sample types for use with the FT-ICR MS approach for
high-throughput toxicity testing (Sections 7.1 and 7.2). In order to build upon these findings,
the third aim of this thesis was to develop robust multivariate (PLS-DA) models that can
discriminate toxicant modes of action in D. magna acute toxicity tests, and to evaluate
whether the haemolymph or whole organism metabolome is better at discriminating
toxicant mode of action (Chapter 5). The model toxicants chosen for this investigation were
cadmium (Cd; an inducer of oxidative stress), fenvalerate (induces hyper-excitation through
prolonged opening of sodium channels), 2,4-dinitrophenol (DNP; an uncoupler of oxidative

- 175 -
phosphorylation) and propranolol (a non-selective β-blocker), and each sample related to an
individual adult daphnid.
To achieve this aim, it was first necessary to establish that each of these toxicants induced a
detectable metabolic effect following an acute exposure, in both the whole organism and
haemolymph metabolome. Unsupervised multivariate analysis confirmed that significant
metabolic perturbations were induced by each toxicant in both sample types, the most
notable following Cd exposure for both the whole organism homogenates and the
haemolymph samples. Subsequent univariate analysis determined that the proportion of
significant peaks was also greatest following Cd exposure for both sample types, although in
general, the proportion of significant peaks was greater in the whole organism metabolome.
With the conclusion that a significant toxicant induced effect could be determined in all
cases, the second aim was to determine if the four different MOAs could be distinguished in
daphnids based upon the measured metabolic responses. The development of supervised
multivariate models, coupled to robust cross-validation and permutation testing, was
employed to evaluate this. The models generated were highly predictive for both the whole
organism and haemolymph metabolomes, with small classification error rates of 3.9% for the
whole organism homogenates and 6.9% for haemolymph. The predictive power of these
models was determined to be significant following permutation testing for both sample
types. It can therefore be concluded that the metabolome of D. magna can be used to
discriminate between toxicant MOA, using either whole organism homogenates or
haemolymph samples.

- 176 -
The final aim of these investigations was to evaluate whether the metabolome of
haemolymph or of whole organism homogenates was the more discriminatory of toxicant
MOA. The first evidence that the whole organism metabolome’s response to a toxicant is
typically more extensive (and potentially contains more information) compared to the
response of the haemolymph comes from the analysis of the individual toxicants. Here the
proportion of significantly changing peaks is greater in the whole organism metabolome,
particularly when comparing the results from the DNP, fenvalerate and propranolol
exposures. Secondly the development of the predictive multivariate models determined that
the predictive capabilities of the whole organism metabolome are higher than in the
haemolymph metabolome, highlighted by the smaller classification error rate in this case. In
addition to the results of the experimental data, further support for using the whole
organism metabolome is that; whole organism sampling can be applied across all daphnid
life-stages while haemolymph can only feasibly be extracted from adult animals. Moreover,
whole organism studies allow for the standardisation of the biomass per sample, an
important issue highlighted in Section 7.1, whereas the volumes of haemolymph extracted
can vary considerably across individuals with the extraction of haemolymph from daphnids
being more time consuming and prone to error.
The overall conclusion from these investigations is that different toxicant MOAs can be
distinguished using highly predictive multivariate classification models, and that the whole
organism metabolome of D. magna is the better sample type for use in predictive toxicology.
In principle, these predictive models can now be used to classify the metabolic perturbations
induced by a toxicant of unknown MOA as similar (or not) to that caused by an inducer of

- 177 -
oxidative stress, a sodium channel activator, an uncoupler of oxidative phosphorylation, or a
non-selective β-blocker. Ideally, more confidence in these predictive models would come
from having more than one toxicant in each category of MOA which should, in theory,
produce the same metabolic perturbations to daphnids. Another consideration that needs to
be taken into account is the degree of toxicity of similar chemicals. In this investigation the
selection of 10% of the neonatal LC50 as the dose was intended to “normalise” the study to a
fixed degree of biological effect. However chemicals with similar MOAs may incur toxic
effects over differing timescales so a more robust approach would have been to design a
dose-response study with a range of sampling time-points for a thorough comparison of
multiple toxicant MOAs. However, constraints on both time and resources prevented such an
exhaustive investigation in this thesis. Nevertheless, the actual application of such an
approach to chemical toxicity testing is certainly feasible but would require the construction
of a larger library of sub-lethal metabolic responses to a series of defined MOAs.
7.4 The discovery of metabolic markers which are predictive of reduced reproductive
output in Daphnia magna
Subsequent to discovering that FT-ICR MS-based metabolomics can be used to discriminate
between toxicant MOAs (Section 7.3) the final aim of this thesis was to attempt discover
metabolic markers in individual D. magna exposed to model toxicants that are predictive of
reproductive output, regardless of toxicant MOA (Chapter 6). This is an exceptionally
important step in any toxicity study as previous attempts to link metabolic markers of toxicity

- 178 -
to relevant higher level biological effects have been relatively unsuccessful, yet are the
ultimate aim in ecotoxicology (Section 1.2.2).
The first step in achieving this final aim was to induce changes in the reproductive output of
D. magna following a standard OECD chronic exposure to Cd, DNP or propranolol. A chronic
21 d exposure of individual daphnids to each of these toxicants induced a significant
reduction in the reproductive output of D. magna, successfully achieving this initial aim. FT-
ICR MS analysis of the same individual daphnids was then conducted and the metabolic data,
coupled with the reproductive output data, was used to build multivariate (PLS-R) models
and their ability to predict the reproductive output of unknown samples was evaluated. For
all three toxicants significant and highly predictive PLS-R models were developed,
demonstrating that signals from the mass spectra of individual D. magna can be utilised to
accurately predict the reproductive output of daphnids exposed to these toxicants. To
achieve the overall objective of biomarker discovery, regression vectors, generated from the
PLS-R predictive models were utilised to identify those peaks that were most predictive of
reduced reproductive output of D. magna for each toxicant. Following a forward selection
strategy that established the fewest number of these peaks required to build an optimal (the
most predictive) PLS-R model for each toxicant, a comparison of these selected peaks across
all three datasets generated a list of common peaks. Putative identification of these peaks
(based upon accurate mass measurements) could then be employed to identify biomarkers
of toxicity that are predictive of reduced reproductive function in D. magna. The comparison
of common peaks across all three toxicant datasets revealed only a limited number of
potential biomarkers and only a single peak that was common to all three toxicants. This

- 179 -
peak was putatively identified as ascorbate, and was found to be decreased following
toxicant exposure. Whilst this is consistent with previous reports of the role of this
metabolite in reproductive function, it is dangerous to assume that this single metabolite can
act as a biomarker of reduced reproductive function in D. magna. In fact, considering that
the optimal PLS-R models in this study required a contribution from many metabolites (over
100 signals for each toxicant), it is highly unlikely that ascorbate alone is predictive of
reproductive output; i.e. these findings highlight the fact that to generate highly predictive
models, a signature of metabolic biomarkers is required rather than just a single or even a
few measurements. This in turn highlights how a metabolomics approach is ideally suited to
acquiring this kind of signature as one of its greatest advantages is the ability to measure
several hundred markers simultaneously, with no prior knowledge of toxicant MOA required.
Such studies into signatures of biomarkers would allow for the identification of the top rated
regression vectors for each of the individual toxicants, producing a list of toxicant specific
biomarkers for reduced reproductive output. However, as stated in Section 7.1, one of the
limitations with metabolite identification of FT-ICR MS data is its ambiguity. With this in
mind, future studies would require techniques such as tandem MS (MS/MS), which can
attempt to confirm the identity of these peaks, creating a signature of biomarkers that are
predictive of reduced reproductive output in D. magna. The ultimate validation of this
approach would be to link acute biomarkers of exposure to reproductive output, thus
removing the need for time and resource expensive chronic tests. Therefore, further studies
that involve an acute exposure of D. magna to these model toxicants would be necessary to
elucidate whether the same metabolic biomarkers of toxicity can be identified at 24 h as

- 180 -
occur after 21 d of exposure. Overall though, this investigation can conclude that multivariate
models can be built, generating biomarkers which are predictive of reduced reproductive
function in D. magna, even if identification of these markers requires further analysis.
7.5 Future work
Firstly it needs to be noted that all the toxicant concentrations stated in this thesis are
nominal concentrations and the actual exposure concentrations may well be less that those
stated, due factors such as the toxicant adhering to the glass exposure vessels. Therefore,
any future work should incorporate the analysis of media samples to determine the exact
toxicant concentrations. Whilst the metabolomics approach used in this thesis was relatively
non-targeted, in effect only a proportion of the metabolome was actually investigated. In
particular, analysis of the non-polar metabolites (i.e. lipophilic compounds) would be
extremely beneficial for all of the investigations conducted in this thesis. Alongside this, for
the investigations detailed in Chapters 4, 5 and 6, FT-ICR MS analysis was only conducted in
negative ion mode so effectively only those metabolites that ionise well in this mode would
be detected. Therefore, further analysis of the polar fractions of these samples in positive ion
mode would also allow for a more definitive idea of how the metabolome responded in each
investigation. Another limiting factor applied in all the investigations in this thesis is that the
metabolome was only analysed from 70-500 m/z, this could be expanded to incorporate a
larger m/z scale, in order to detect higher mass metabolites, such as ATP which occurs
outside of this region and could be an important indicator of changes to energy metabolism.
Although, this would require a longer analysis time and specifically taking into account the

- 181 -
small sample size available when using D. magna, there is a finite length of time for which
the sample can be delivered into the mass spectrometer. These results would provide more
insight into the biochemistry of toxicant effects in D. magna, corroborating the current
findings and enabling further comparisons with other reported studies.
Biochemical insight into the MOA of toxicants is highly valuable for the future of regulatory
toxicity testing; being able to identify the target(s) of toxicity will enable confidence in the
extrapolation of effects across species. It can be determined if the species under
consideration is at risk by knowing these target sites, if the organism has the relevant
receptors/pathways then it is likely to be susceptible to the toxicant, thus driving the need
for higher level toxicity testing. As yet it is unknown whether the metabolic changes
determined by the approach used in this thesis are the direct results of, for example, a
toxicant induced increase or inhibition of metabolite production. To determine this, further
experiments such as flux analysis could be utilised by radio-labelling the food source and
investigating which metabolites have incorporated these stable isotopes, allowing for
determining which biochemical pathways have been perturbed. Having said this, in order for
gaining true insight into the metabolic changes, the greatest challenge that needs to be
overcome in this approach is that of metabolite identification. Until this is achieved only
putative identifications can be given to the signals in the mass spectra. In this approach,
incorporation of more adducts into the empirical formula algorithm could potentially allow
more putative identifications; specifically this could be advantageous for metal exposures
where the metal itself could be incorporated as an additional adduct. As yet, the only way to

- 182 -
be certain of the identity of any metabolite is to employ fragmentation approaches such as
MS/MS, which in turn reduce the capabilities of this being a high throughput technique.
One final consideration is that all the studies in this thesis used a single strain of D. magna as
the test organism and could be considered specific to just this particular species, or indeed
strain. Future studies may therefore benefit from using multiple strains or species of Daphnia
to determine if toxicant effects are generic or dependent upon the sensitivity of the target
organism. However, even if these effects are determined to be specific to only this particular
strain of D. magna, adverse effects caused by toxicant exposure could lead to a subsequent
loss of genetic diversity within this species, with wider implications for future population
dynamics in response to further stress. It should also be noted that all the metabolic
investigations detailed in this thesis apply to strictly controlled laboratory experiments and
do not reflect the natural environment of D. magna. Whilst this was a suitable approach for
the objectives of this thesis in evaluating the metabolomics approach for use in toxicity
testing and chemical screening/prioritisation, any future studies that aim to reflect potential
effects of toxicant exposure in the natural environment need to consider fluctuating
environmental parameters such as day length, temperature, pH and water chemistry.
7.6 Final conclusions
The driving force behind the investigations detailed in this thesis was to evaluate the
potential of FT-ICR mass spectrometry based metabolomics for use in regulatory toxicity
testing using Daphnia magna. Each study has appropriately addressed and met its individual
aims (Sections 7.1 to 7.4) with a high degree of success and ultimately highlighting areas that

- 183 -
need further exploration (Section 7.5), yet outside of the scope of this thesis due to time and
resource limitations. These investigations have determined that this novel approach to
toxicity testing in D. magna can be used with both whole organism homogenates and
haemolymph samples, bringing to light the advantages of using the whole organism
metabolome. Toxicants with differing MOAs can be discriminated using this approach and
models can be built that predict reduced reproductive function, a highly valuable advantage
for regulatory decision making as this could prove beneficial when attempting to extrapolate
results to predict population/ecosystem dynamics. In view of these findings it can be
concluded that the FT-ICR mass spectrometry based metabolomics approach for use in
regulatory toxicity testing using Daphnia magna is extremely viable.

- 184 -
CHAPTER EIGHT:
References

- 185 -
Ahlers, J., Stock, F., and Werschkun, B. (2008). Integrated testing and intelligent assessment-
new challenges under REACH. Environmental Science and Pollution Research International 15,
565-72.
Ankley, G. T. (2008). Genomics in regulatory ecotoxicology : applications and challenges. In
collaboration with the Society of Environmental Toxicology and Chemistry. CRC Press, Boca
Raton ; London.
Arambasic, M. B., Bjelic, S., and Subakov, G. (1995). Acute toxicity of heavy metals (copper,
lead and zinc), phenol and sodium on Allium cepa L, Lepidium sativum L and Daphnia magna
ST - comparative investigations and the practical applications. Water Research 29, 497-503.
Baldovin, A., Wu, W., Centner, V., JouanRimbaud, D., Massart, D. L., Favretto, L., and Turello,
A. (1996). Feature selection for the discrimination between pollution types with partial least
squares modelling. Analyst 121, 1603-1608.
Barata, C., Navarro, J. C., Varo, I., Riva, M. C., Arun, S., and Porte, C. (2005). Changes in
antioxidant enzyme activities, fatty acid composition and lipid peroxidation in Daphnia
magna during the aging process. Comparative Biochemistry and Physiology B-Biochemistry &
Molecular Biology 140, 81-90.
Benjamini, Y., and Hochberg, Y. (1995). Controlling the False Discovery Rate - a Practical and
Powerful Approach to Multiple Testing. Journal of the Royal Statistical Society Series B-
Methodological 57, 289-300.
Benson, W. H., Gallagher, K., and McClintock, J. T. (2007). U.S. Environmental Protection
Agency's activities to prepare for regulatory and risk assessment applications of genomics
information. Environmental and Molecular Mutagenesis 48, 359-62.

- 186 -
Berlett, B. S., and Stadtman, E. R. (1997). Protein oxidation in aging, disease, and oxidative
stress. Journal of Biological Chemistry 272, 20313-20316.
Bligh, E. G., and Dyer, W. J. (1959). A rapid method of total lipid extraction and purification.
Canadian Journal of Biochemistry and Physiology 37, 911-917.
Bopp, S. K., Abicht, H. K., and Knauer, K. (2008). Copper-induced oxidative stress in rainbow
trout gill cells. Aquatic Toxicology 86, 197-204.
Breitholtz, M., Ruden, C., Hansson, S. O., and Bengtsson, B. E. (2006). Ten challenges for
improved ecotoxicological testing in environmental risk assessment. Ecotoxicology and
environmental safety 63, 324-35.
Breitling, R., Pitt, A. R., and Barrett, M. P. (2006). Precision mapping of the metabolome.
Trends in Biotechnology 24, 543-548.
Breitling, R., Vitkup, D., and Barrett, M. P. (2008). New surveyor tools for charting microbial
metabolic maps. Nature Reviews Microbiology 6, 156-161.
Brendonck, L., and De Meester, L. (2003). Egg banks in freshwater zooplankton: evolutionary
and ecological archives in the sediment. Hydrobiologia 491, 65-84.
Brown, S. C., Kruppa, G., and Dasseux, J. L. (2005). Metabolomics applications of FT-ICR mass
spectrometry. Mass Spectrometry Reviews 24, 223-231.
Bundy, J. G., Davey, M. P., and Viant, M. R. (2009). Environmental metabolomics: a critical
review and future perspectives. Metabolomics 5, 3-21.

- 187 -
Bundy, J. G., Keun, H. C., Sidhu, J. K., Spurgeon, D. J., Svendsen, C., Kille, P., and Morgan, A. J.
(2007). Metabolic profile biomarkers of metal contamination in a sentinel terrestrial species
are applicable across multiple sites. Environmental Science & Technology 41, 4458-4464.
Bundy, J. G., Lenz, E. M., Bailey, N. J., Gavaghan, C. L., Svendsen, C., Spurgeon, D., Hankard, P.
K., Osborn, D., Weeks, J. M., and Trauger, S. A. (2002). Metabonomic assessment of toxicity
of 4-fluoroaniline, 3,5-difluoroaniline and 2-fluoro-4-methylaniline to the earthworm Eisenia
veneta (Rosa): Identification of new endogenous biomarkers. Environmental Toxicology and
Chemistry 21, 1966-1972.
Bundy, J. G., Osborn, D., Weeks, J. M., Lindon, J. C., and Nicholson, J. K. (2001). An NMR-
based metabonomic approach to the investigation of coelomic fluid biochemistry in
earthworms under toxic stress. Febs Letters 500, 31-5.
Bundy, J. G., Sidhu, J. K., Rana, F., Spurgeon, D. J., Svendsen, C., Wren, J. F., Sturzenbaum, S.
R., Morgan, A. J., and Kille, P. (2008). 'Systems toxicology' approach identifies coordinated
metabolic responses to copper in a terrestrial non-model invertebrate, the earthworm
Lumbricus rubellus. Bmc Biology 6, -.
Casero, R. A., and Pegg, A. E. (1993). Spermidine Spermine N1-Acetyltransferase - the
Turning-Point in Polyamine Metabolism. Faseb Journal 7, 653-661.
Chapman, P. M. (2002). Integrating toxicology and ecology: putting the "eco" into
ecotoxicology. Marine pollution bulletin 44, 7-15.
Ciereszko, A., and Dabrowski, K. (1995). Sperm Quality and Ascorbic-Acid Concentration in
Rainbow-Trout Semen Are Affected by Dietary Vitamin-C - an across-Season Study. Biology of
Reproduction 52, 982-988.

- 188 -
Coen, M., Holmes, E., Lindon, J. C., and Nicholson, J. K. (2008). NMR-based metabolic
profiling and metabonomic approaches to problems in molecular toxicology. Chemical
Research in Toxicology 21, 9-27.
Coffino, P., and Poznanski, A. (1991). Killer Polyamines. Journal of Cellular Biochemistry 45,
54-58.
Colbourne, J. K., Singan, V. R., and Gilbert, D. G. (2005). wFleaBase: the Daphnia genomics
information system: http://wfleabase.org/
Connon, R., Hooper, H. L., Sibly, R. M., Lim, F. L., Heckmann, L. H., Moore, D. J., Watanabe, H.,
Soetaert, A., Cook, K., Maund, S. J., Hutchinson, T. H., Moggs, J., De Coen, W., Iguchi, T., and
Callaghan, A. (2008). Linking molecular and population stress responses in Daphnia magna
exposed to cadmium. Environmental Science & Technology 42, 2181-2188.
Dabrowski, K., and Ciereszko, A. (2001). Ascorbic acid and reproduction in fish: endocrine
regulation and gamete quality. Aquaculture Research 32, 623-638.
De Coen, W. M., and Janssen, C. R. (1997a). The use of biomarkers in Daphnia magna toxicity
testing .2. Digestive enzyme activity in Daphnia magna exposed to sublethal concentrations
of cadmium, chromium and mercury. Chemosphere 35, 1053-1067.
De Coen, W. M., and Janssen, C. R. (1997b). The use of biomarkers in Daphnia magna toxicity
testing. IV. Cellular Energy Allocation: a new methodology to assess the energy budget of
toxicant-stressed Daphnia populations. Journal of Aquatic Ecosystem Stress and Recovery
(Formerly Journal of Aquatic Ecosystem Health) 6, 43-55.
- 189 -
De Coen, W. M., and Janssen, C. R. (1998). The use of biomarkers in Daphnia magna toxicity
testing - I. The digestive physiology of daphnids exposed to toxic stress. Hydrobiologia 367,
199-209.
De Coen, W. M., and Janssen, C. R. (2003). A multivariate biomarker-based model predicting
population-level responses of Daphnia magna. Environmental Toxicology and Chemistry 22,
2195-2201.
Dettmer, K., Aronov, P. A., and Hammock, B. D. (2007). Mass spectrometry-based
metabolomics. Mass Spectrometry Reviews 26, 51-78.
Dieterle, F., Ross, A., Schlotterbeck, G., and Senn, H. (2006). Probabilistic quotient
normalization as robust method to account for dilution of complex biological mixtures.
Application in 1H NMR metabonomics. Analytical Chemistry 78, 4281-90.
Dodson, S. I., and Hanazato, T. (1995). Commentary on effects of anthropogenic and natural
organic chemicals on development, swimming behavior, and reproduction of Daphnia, a key
member of aquatic ecosystems. Environmental health perspectives 103 Suppl 4, 7-11.
Drysdale, G. R., and Cohn, M. (1958). Mode of Action of 2,4-Dinitrophenol in Uncoupling
Oxidative Phosphorylation. Journal of Biological Chemistry 233, 1574-1577.
Dunn, W. B. (2008). Current trends and future requirements for the mass spectrometric
investigation of microbial, mammalian and plant metabolomes. Physical biology 5, 11001.
Dunn, W. B., Bailey, N. J. C., and Johnson, H. E. (2005). Measuring the metabolome: current
analytical technologies. Analyst 130, 606-625.

- 190 -
Dunn, W. B., and Ellis, D. I. (2005). Metabolomics: Current analytical platforms and
methodologies. Trends in Analytical Chemistry 24, 285-294.
Dzialowski, E. M., Turner, P. K., and Brooks, B. W. (2006). Physiological and reproductive
effects of beta adrenergic receptor antagonists in Daphnia magna. Archives of Environmental
Contamination and Toxicology 50, 503-10.
Ebbels, T. M. D., Keun, H. C., Beckonert, O. P., Bollard, M. E., Lindon, J. C., Holmes, E., and
Nicholson, J. K. (2007). Prediction and classification of drug toxicity using probabilistic
modeling of temporal metabolic data: The Consortium on Metabonomic Toxicology
screening approach. Journal of Proteome Research 6, 4407-4422.
Edwards, S. W., and Preston, R. J. (2008). Systems biology and mode of action based risk
assessment. Toxicological Sciences 106, 312-8.
Ekman, D. R., Teng, Q., Villeneuve, D. L., Kahl, M. D., Jensen, K. M., Durhan, E. J., Ankley, G. T.,
and Collette, T. W. (2008). Investigating compensation and recovery of fathead minnow
(Pimephales promelas) exposed to 17 alpha-ethynylestradiol with metabolite profiling.
Environmental Science & Technology 42, 4188-4194.
Escher, B. I., and Hermens, J. L. (2002). Modes of action in ecotoxicology: their role in body
burdens, species sensitivity, QSARs, and mixture effects. Environmental Science & Technology
36, 4201-17.
Evans, S. M., and Nicholson, G. J. (2000). The use of imposex to assess tributyltin
contamination in coastal waters and open seas. The Science of the Total Environment 258,
73-80.

- 191 -
Flaherty, C. M., and Dodson, S. I. (2005). Effects of pharmaceuticals on Daphnia survival,
growth, and reproduction. Chemosphere 61, 200-7.
Fleuret, F. (2004). Fast binary feature selection with conditional mutual information. Journal
of Machine Learning Research 5, 1531-1555.
Forbes, V. E., Palmqvist, A., and Bach, L. (2006). The use and misuse of biomarkers in
ecotoxicology. Environmental Toxicology and Chemistry 25, 272-80.
Gaetke, L. M., and Chow, C. K. (2003). Copper toxicity, oxidative stress, and antioxidant
nutrients. Toxicology 189, 147-63.
Griffin, J. L. (2003). Metabonomics: NMR spectroscopy and pattern recognition analysis of
body fluids and tissues for characterisation of xenobiotic toxicity and disease diagnosis.
Current Opinion in Chemical Biology 7, 648-654.
Griffin, J. L., Walker, L. A., Shore, R. F., and Nicholson, J. K. (2001). High-resolution magic
angle spinning H-1-NMR spectroscopy studies on the renal biochemistry in the bank vole
(Clethrionomys glareolus) and the effects of arsenic (As3+) toxicity. Xenobiotica 31, 377-385.
Guerriero, G., Paolucci, M., and Ciarcia, G. (1999). Vitamin C: A biomarker of the ovulation in
sea bass, Dicentrarchus labrax. Free Radical Biology and Medicine 27, S154-S154.
Guo, Q., Sidhu, J. K., Ebbels, T. M. D., Rana, F., Spurgeon, D. J., Svendsen, C., Sturzenbaum, S.
R., Kille, P., Morgan, A. J., and Bundy, J. G. (2009). Validation of metabolomics for toxic
mechanism of action screening with the earthworm Lumbricus rubellus. Metabolomics 5, 72-
83.

- 192 -
Han, J., Danell, R. M., Patel, J. R., Gumerov, D. R., Scarlett, C. O., Speir, J. P., Parker, C. E.,
Rusyn, I., Zeisel, S., and Borchers, C. H. (2008). Towards high-throughput metabolomics using
ultrahigh-field Fourier transform ion cyclotron resonance mass spectrometry. Metabolomics
4, 128-140.
Heckmann, L.-R., Sibly, R. M., Connon, R., Hooper, H. L., Hutchinson, T. H., Maund, S. J., Hill,
C. J., Bouetard, A., and Callaghan, A. (2008). Systems biology meets stress ecology: Linking
molecular and organismal stress responses in Daphnia magna. Genome Biology 9, Article no.
R40.
Hines, A., Staff, F. J., Widdows, J., Compton, R. M., Falciani, F., and Viant, M. R. (2010).
Discovery of metabolic signatures for predicting whole organism toxicology. Toxicological
Sciences doi: 10.1093/toxsci/kfq004.
Huggett, D. B., Brooks, B. W., Peterson, B., Foran, C. M., and Schlenk, D. (2002). Toxicity of
select beta adrenergic receptor-blocking pharmaceuticals (B-blockers) on aquatic organisms.
Archives of Environmental Contamination and Toxicology 43, 229-235.
Hutchinson, T. H., Ankley, G. T., Segner, H., and Tyler, C. R. (2006). Screening and testing for
endocrine disruption in fish-biomarkers as "signposts," not "traffic lights," in risk assessment.
Environmental Health Perspectives 114 Suppl 1, 106-14.
Ivanina, A. V., Habinck, E., and Sokolova, I. M. (2008). Differential sensitivity to cadmium of
key mitochondrial enzymes in the eastern oyster, Crassostrea virginica Gmelin (Bivalvia :
Ostreidae). Comparative Biochemistry and Physiology C-Toxicology & Pharmacology 148, 72-
79.
Jobling, S., Nolan, M., Tyler, C. R., Brighty, G., and Sumpter, J. P. (1998). Widespread sexual
disruption in wild fish. Environmental Science & Technology 32, 2498-2506.

- 193 -
Jones, O. A. H., Spurgeon, D. J., Svendsen, C., and Griffin, J. L. (2008). A metabolomics based
approach to assessing the toxicity of the polyaromatic hydrocarbon pyrene to the earthworm
Lumbricus rubellus. Chemosphere 71, 601-609.
Kanehisa, M., Goto, S., Hattori, M., Aoki-Kinoshita, K. F., Itoh, M., Kawashima, S., Katayama,
T., Araki, M., and Hirakawa, M. (2006). From genomics to chemical genomics: new
developments in KEGG. Nucleic Acids Research 34, D354-D357.
Kaplan, F., Kopka, J., Haskell, D. W., Zhao, W., Schiller, K. C., Gatzke, N., Sung, D. Y., and Guy,
C. L. (2004). Exploring the temperature-stress metabolome of Arabidopsis. Plant Physiology
136, 4159-68.
Katsiadaki, I., Williams, T. D., Ball, J. S., Bean, T. P., Sanders, M. B., Wu, H. F., Santos, E. M.,
Brown, M. M., Baker, P., Ortega, F., Falciani, F., Craft, J. A., Tyler, C. R., Viant, M. R., and
Chipman, J. K. (2009). Hepatic transcriptomic and metabolomic responses in the Stickleback
(Gasterosteus aculeatus) exposed to ethinyl-estradiol. Aquatic Toxicology
doi:10.1016/j.aquatox.2009.07.005.
Keun, H. C. (2006). Metabonomic modeling of drug toxicity. Pharmacology & Therapeutics
109, 92-106.
Keun, H. C., Ebbels, T. M. D., Antti, H., Bollard, M. E., Beckonert, O., Schlotterbeck, G., Senn,
H., Niederhauser, U., Holmes, E., Lindon, J. C., and Nicholson, J. K. (2002). Analytical
reproducibility in H-1 NMR-based metabonomic urinalysis. Chemical Research in Toxicology
15, 1380-1386.
Kind, T., and Fiehn, O. (2007). Seven Golden Rules for heuristic filtering of molecular formulas
obtained by accurate mass spectrometry. BMC Bioinformatics 8, 105.

- 194 -
Kluender, C., Sans-Piche, F., Riedl, J., Altenburger, R., Hartig, C., Laue, G., and Schmitt-Jansen,
M. (2009). A metabolomics approach to assessing phytotoxic effects on the green alga
Scenedesmus vacuolatus. Metabolomics 5, 59-71.
Knops, M., Altenburger, R., and Segner, H. (2001). Alterations of physiological energetics,
growth and reproduction of Daphnia magna under toxicant stress. Aquatic Toxicology 53, 79-
90.
Lansing, M. B., Gardner, W. S., and Eadie, B. J. (1993). Catecholamines as Potential Sublethal
Stress Indicators in Great-Lakes Macrobenthic Invertebrates. Journal of Great Lakes Research
19, 569-581.
LeBlanc, G. A. (2007). Crustacean endocrine toxicology: a review. Ecotoxicology 16, 61-81.
Lenz, E. M., and Wilson, I. D. (2007). Analytical strategies in metabonomics. Journal of
Proteome Research 6, 443-458.
Lin, C. Y., Viant, M. R., and Tjeerdema, R. S. (2006). Metabolomics: Methodologies and
applications in the environmental sciences. Journal of Pesticide Science 31, 245-251.
Linder, M. C., and Hazegh-Azam, M. (1996). Copper biochemistry and molecular biology.
American Journal of Clinical Nutrition 63, 797S-811S.
Lindon, J. C., Keun, H. C., Ebbels, T. M. D., Pearce, J. M. T., Holmes, E., and Nicholson, J. K.
(2005). The Consortium for Metabonomic Toxicology (COMET): aims, activities and
achievements. Pharmacogenomics 6, 691-699.

- 195 -
Lindon, J. C., Nicholson, J. K., Holmes, E., and Everett, J. R. (2000). Metabonomics: Metabolic
processes studied by NMR spectroscopy of biofluids. Concepts in Magnetic Resonance 12,
289-320.
Loh, H. S., and Wilson, C. W. M. (1971). Relationship of Human Ascorbic-Acid Metabolism to
Ovulation. Lancet 1, 110-&.
Luck, M. R., Jeyaseelan, I., and Scholes, R. A. (1995). Ascorbic-Acid and Fertility. Biology of
Reproduction 52, 262-266.
Makarov, A., Denisov, E., Lange, O., and Horning, S. (2006). Dynamic range of mass accuracy
in LTQ orbitrap hybrid mass spectrometer. . Journal of the American Society for Mass
Spectrometry 17, 977-982.
Malmendal, A., Overgaard, J., Bundy, J. G., Sorensen, J. G., Nielsen, N. C., Loeschcke, V., and
Holmstrup, M. (2006). Metabolomic profiling of heat stress: hardening and recovery of
homeostasis in Drosophila. American Journal of Physiology-Regulatory Integrative and
Comparative Physiology 291, R205-R212.
Martin-Creuzburg, D., Westerlund, S. A., and Hoffmann, K. H. (2007). Ecdysteroid levels in
Daphnia magna during a molt cycle: determination by radioimmunoassay (RIA) and liquid
chromatography-mass spectrometry (LC-MS). General and Comparative Endocrinology 151,
66-71.
Martins, J., Oliva Teles, L., and Vasconcelos, V. (2007). Assays with Daphnia magna and Danio
rerio as alert systems in aquatic toxicology. Environment International 33, 414-25.

- 196 -
McKelvie, J. R., Yuk, J., Xu, Y. P., Simpson, A. J., and Simpson, M. J. (2009). H-1 NMR and
GC/MS metabolomics of earthworm responses to sub-lethal DDT and endosulfan exposure.
Metabolomics 5, 84-94.
Merchie, G., Lavens, P., and Sorgeloos, P. (1997). Optimization of dietary vitamin C in fish and
crustacean larvae: a review. Aquaculture 155, 165-181.
Miller, M. G. (2007). Environmental metabolomics: A SWOT analysis (strengths, weaknesses,
opportunities, and threats). Journal of Proteome Research 6, 540-545.
Moore, M. N., Depledge, M. H., Readman, J. W., and Leonard, D. R. P. (2004). An integrated
biomarker-based strategy for ecotoxicological evaluation of risk in environmental
management. Mutation Research-Fundamental and Molecular Mechanisms of Mutagenesis
552, 247-268.
Mucklow, P. T., and Ebert, D. (2003). Physiology of immunity in the water flea Daphnia
magna: environmental and genetic aspects of phenoloxidase activity. Physiological and
Biochemical Zoology 76, 836-42.
Nicholson, J. K., Connelly, J., Lindon, J. C., and Holmes, E. (2002). Metabonomics: a platform
for studying drug toxicity and gene function. Nat. Rev. Drug Discov. 1, 153-161.
OECD (1998). OECD Guidelines for Testing of Chemicals 211 - Daphnia magna Reproduction
Test, Vol. 64, p. 21.
OECD (2004). OECD guidelines for testing of chemicals, No 202, Daphnia sp. acute
immobilisation test, p. 12. Organisation for Economic Cooperation and Development.

- 197 -
OECD (2009). OECD Guidelines for the Testing of Chemicals, Section 2: Effects on Biotic
Systems.
Olmstead, A. W., and Leblanc, G. A. (2002). Juvenoid hormone methyl farnesoate is a sex
determinant in the crustacean Daphnia magna. Journal of Experimental Zoology 293, 736-9.
Olmstead, A. W., and LeBlanc, G. A. (2003). Insecticidal juvenile hormone analogs stimulate
the production of male offspring in the crustacean Daphnia magna. Environmental Health
Perspectives 111, 919-24.
Olsen, J. V., de Godoy, L. M. F., Li, G. Q., Macek, B., Mortensen, P., Pesch, R., Makarov, A.,
Lange, O., Horning, S., and Mann, M. (2005). Parts per million mass accuracy on an orbitrap
mass spectrometer via lock mass injection into a C-trap. Molecular & Cellular Proteomics 4,
2010-2021.
Padayatty, S. J., Katz, A., Wang, Y. H., Eck, P., Kwon, O., Lee, J. H., Chen, S. L., Corpe, C., Dutta,
A., Dutta, S. K., and Levine, M. (2003). Vitamin C as an antioxidant: Evaluation of its role in
disease prevention. Journal of the American College of Nutrition 22, 18-35.
Palmeira, C. M., Moreno, A. J., and Madeira, V. M. (1994). Metabolic alterations in
hepatocytes promoted by the herbicides paraquat, dinoseb and 2,4-D. Archives of Toxicology
68, 24-31.
Parsons, H. M., Ekman, D. R., Collette, T. W., and Viant, M. R. (2009). Spectral Relative
Standard Deviation: A Practical Benchmark in Metabolomics. The Analyst 134, 478-485.
Parsons, H. M., Ludwig, C., Günther, U. L., and Viant, M. R. (2007). Improved classification
accuracy in 1- and 2-dimensional NMR metabolomics data using the variance stabilising
generalised logarithm transformation. BMC Bioinformatics 8, 234.

- 198 -
Payne, T. G., Southam, A. D., Arvanitis, T. N., and Viant, M. R. (2009). A Signal Filtering
Method for Improved Quantification and Noise Discrimination in Fourier Transform Ion
Cyclotron Resonance Mass Spectrometry-Based Metabolomics Data. Journal of the American
Society for Mass Spectrometry 20, 1087-1095.
Phalaraksh, C., Lenz, E. M., Lindon, J. C., Nicholson, J. K., Farrant, R. D., Reynolds, S. E.,
Wilson, I. D., Osborn, D., and Weeks, J. M. (1999). NMR spectroscopic studies on the
haemolymph of the tobacco hornworm, Manduca sexta: assignment of H-1 and C-13 NMR
spectra. Insect Biochemistry and Molecular Biology 29, 795-805.
Phalaraksh, C., Reynolds, S. E., Wilson, I. D., Lenz, E. M., Nicholson, J. K., and Lindon, J. C.
(2008). A metabonomic analysis of insect development: H-1-NMR spectroscopic
characterization of changes in the composition of the haemolymph of larvae and pupae of
the tobacco hornworm, Manduca sexta. Scienceasia 34, 279-286.
Poynton, H. C., Loguinov, A. V., Varshavsky, J. R., Chan, S., Perkins, E. I., and Vulpe, C. D.
(2008). Gene expression profiling in Daphnia magna part I: Concentration-dependent profiles
provide support for the No Observed Transcriptional Effect Level. Environmental Science &
Technology 42, 6250-6256.
Poynton, H. C., Varshavsky, J. R., Chang, B., Cavigiolio, G., Chan, S., Holman, P. S., Loguinov, A.
V., Bauer, D. J., Komachi, K., Theil, E. C., Perkins, E. J., Hughes, O., and Vulpe, C. D. (2007).
Daphnia magna ecotoxicogenomics provides mechanistic insights into metal toxicity.
Environmental Science & Technology 41, 1044-1050.
Preston, B. L. (2002). Indirect effects in aquatic ecotoxicology: implications for ecological risk
assessment. Environmental Management 29, 311-23.

- 199 -
Ray, D. E., and Fry, J. R. (2006). A reassessment of the neurotoxicity of pyrethroid
insecticides. Pharmacology & Theraputics 111, 174-93.
REACH (2006). Regulation (EC) No 1907/2006 of The European Parliament and of The Council
In Registration, Evaluation, Authorisation and Restriction of Chemicals (REACH), establishing
a European Chemicals Agency, amending Directive 1999/45/EC and repealing Council
Regulation (EEC) No 793/93 and Commission Regulation (EC) No 1488/94 as well as
Council Directive 76/769/EEC and Commission Directives 91/155/EEC, 93/67/EEC, 93/105/EC
and 2000/21/EC. The European Parliament and The Council of The European Union.
.
Reynaldi, S., Duquesne, S., Jung, K., and Liess, M. (2006). Linking feeding activity and
maturation of Daphnia magna following short-term exposure to fenvalerate. Environmental
Toxicology and Chemistry 25, 1826-30.
Robertson, D. G. (2005). Metabonomics in toxicology: A review. Toxicological Sciences 85,
809-822.
Robertson, D. G., Reily, M. D., and Baker, J. D. (2007). Metabonomics in pharmaceutical
discovery and development. Journal of Proteome Research 6, 526-39.
Robosky, L. C., Robertson, D. G., Baker, J. D., Rane, S., and Reily, M. D. (2002). In vivo toxicity
screening programs using metabonomics. Combinatorial Chemistry and High Throughput
Screening 5, 651-662.
Rubingh, C. M., Bijlsma, S., Derks, E. P. P. A., Bobeldijk, I., Verheij, E. R., Kochhar, S., and
Smilde, A. K. (2006). Assessing the performance of statistical validation tools for megavariate
metabolomics data. Metabolomics 2, 53-61.

- 200 -
Samuelsson, L. M., Forlin, L., Karlsson, G., Adolfsson-Eric, M., and Larsson, D. G. J. (2006).
Using NMR metabolomics to identify responses of an environmental estrogen in blood
plasma of fish. Aquatic Toxicology 78, 341-349.
Sandbacka, M., Christianson, I., and Isomaa, B. (2000). The acute toxicity of surfactants on
fish cells, Daphnia magna and fish-a comparative study. Toxicology in Vitro 14, 61-8.
Sangster, T. P., Wingate, J. E., Burton, L., Teichert, F., and Wilson, I. D. (2007). Investigation of
analytical variation in metabonomic analysis using liquid chromatography/mass
spectrometry. Rapid Communications in Mass Spectrometry 21, 2965-70.
Santojanni, A., Gorbi, G., and Sartore, F. (1998). Prediction of fecundity in chronic toxicity
tests on Daphnia magna. Water Research 32, 3146-3156.
Schmidt, C. W. (2004). Metabolomics: What's happening downstream of DNA. Environmental
Health Perspectives 112, A410-A415.
Skoog, D. A., Holler, F. J., and Nieman, T. A. (1998). Principles of Instrumental Analysis.
Harcourt Brace & Company, Orlando; Florida.
Smolders, R., Baillieul, M., and Blust, R. (2005). Relationship between the energy status of
Daphnia magna and its sensitivity to environmental stress. Aquatic Toxicology 73, 155-70.
Snape, J. R., Maund, S. J., Pickford, D. B., and Hutchinson, T. H. (2004). Ecotoxicogenomics:
the challenge of integrating genomics into aquatic and terrestrial ecotoxicology. Aquatic
Toxicology 67, 143-154.
Soetaert, A., Moens, L. N., Van der Ven, K., Van Leemput, K., Naudts, B., Blust, R., and De
Coen, W. M. (2006). Molecular impact of propiconazole on Daphnia magna using a

- 201 -
reproduction-related cDNA array. Comparative Biochemistry and Physiology C-Toxicology &
Pharmacology 142, 66-76.
Soetaert, A., van der Ven, K., Moens, L. N., Vandenbrouck, T., van Remortel, P., and De Coen,
W. M. (2007a). Daphnia magna and ecotoxicogenomics: Gene expression profiles of the anti-
ecdysteroidal fungicide fenarimol using energy-, molting- and life stage-related cDNA
libraries. Chemosphere 67, 60-71.
Soetaert, A., Vandenbrouck, T., van der Ven, K., Maras, M., van Remortel, P., Blust, R., and de
Coen, W. M. (2007b). Molecular responses during cadmium-induced stress in Daphnia
magna: Integration of differential gene expression with higher-level effects. Aquatic
Toxicology 83, 212-222.
Soga, T., Baran, R., Suematsu, M., Ueno, Y., Ikeda, S., Sakurakawa, T., Kakazu, Y., Ishikawa, T.,
Robert, M., Nishioka, T., and Tomita, M. (2006). Differential metabolomics reveals
ophthalmic acid as an oxidative stress biomarker indicating hepatic glutathione consumption.
Journal of Biological Chemistry 281, 16768-16776.
Sole, M., Shaw, J. P., Frickers, P. E., Readman, J. W., and Hutchinson, T. H. (2010). Effects on
feeding rate and biomarker responses of marine mussels experimentally exposed to
propranolol and acetaminophen. Analytical and Bioanalytical Chemistry 396, 649-656.
Southam, A. D., Easton, J. M., Stentiford, G. D., Ludwig, C., Arvanitis, T. N., and Viant, M. R.
(2008). Metabolic changes in flatfish hepatic tumours revealed by NMR-based metabolomics
and metabolic correlation networks. Journal of Proteome Research 7, 5277-85.
Southam, A. D., Payne, T. G., Cooper, H. J., Arvanitis, T. N., and Viant, M. R. (2007). Dynamic
Range and Mass Accuracy of Wide-Scan Direct Infusion Nanoelectrospray Fourier Transform

- 202 -
Ion Cyclotron Resonance Mass Spectrometry-Based Metabolomics Increased by the Spectral
Stitching Method. Analytical Chemistry 79, 4595-4602.
Stanley, J. K., Ramirez, A. J., Mottaleb, M., Chambliss, C. K., and Brooks, B. W. (2006).
Enantiospecific toxicity of the beta-blocker propranolol to Daphnia magna and Pimephales
promelas. Environmental Toxicology and Chemistry 25, 1780-1786.
Stentiford, G. D., Viant, M. R., Ward, D. G., Johnson, P. J., Martin, A., Wei, W., Cooper, H. J.,
Lyons, B. P., and Feist, S. W. (2005). Liver tumours in wild flatfish: a histopathological,
proteomic and metabolomic study. OMICS - Journal of Integrative Biology 9, 281-299.
Stohs, S. J., and Bagchi, D. (1995). Oxidative mechanisms in the toxicity of metal ions. Free
Radical Biology and Medicine 18, 321-36.
Sugimoto, H., Matsuzaki, S., Hamana, K., Yamada, S., and Kobayashi, S. (1991). Alpha-
Tocopherol and Superoxide-Dismutase Suppress and Diethyldithiocarbamate and Phorone
Enhance the Lipopolysaccharide-Induced Increase in N1-Acetylspermidine Concentrations in
Mouse-Liver. Circulatory Shock 33, 171-177.
Sui, J. J., Tan, T. L., Zhang, J. H., Ching, C. B., and Chen, W. N. (2007). ITRAQ-coupled 2D LC-
MS/MS analysis on protein profile in vascular smooth muscle cells incubated with S- and R-
enantiomers of propranolol: Possible role of metabolic enzymes involved in cellular
anabolism and antioxidant activity. Journal of Proteome Research 6, 1643-1651.
Sumner, L. W., Amberg, A., Barrett, D., Beale, M. H., Beger, R., Daykin, C. A., Fan, T. W. M.,
Fiehn, O., Goodacre, R., Griffin, J. L., Hankemeier, T., Hardy, N., Harnly, J., Higashi, R., Kopka,
J., Lane, A. N., Lindon, J. C., Marriott, P., Nicholls, A. W., Reily, M. D., Thaden, J. J., and Viant,
M. R. (2007). Proposed minimum reporting standards for chemical analysis. Metabolomics 3,
211-221.

- 203 -
Takahashi, H., Kai, K., Shinbo, Y., Tanaka, K., Ohta, D., Oshima, T., Altaf-Ul-Amin, M.,
Kurokawa, K., Ogasawara, N., and Kanaya, S. (2008). Metabolomics approach for determining
growth-specific metabolites based on Fourier transform ion cyclotron resonance mass
spectrometry. Analytical and Bioanalytical Chemistry 391, 2769-82.
Tatarazako, N., and Oda, S. (2007). The water flea Daphnia magna (Crustacea, Cladocera) as a
test species for screening and evaluation of chemicals with endocrine disrupting effects on
crustaceans. Ecotoxicology 16, 197-203.
Tessier, A. J., and Goulden, C. E. (1982). Estimating food limitation in cladoceran populations.
Limnological Oceanography 27, 707-717.
Tripathi, G., and Verma, P. (2004). Fenvalerate-induced changes in a catfish, Clarias
batrachus: metabolic enzymes, RNA and protein. Comparative Biochemistry and Physiology
C-Toxicology & Pharmacology 138, 75-79.
Truhaut, R. (1977). Ecotoxicology: objectives, principles and perspectives. Ecotoxicology and
Environmental Safety 1, 151-73.
Turner, M. A., Viant, M. R., Teh, S. J., and Johnson, M. L. (2007). Developmental rates,
structural asymmetry, and metabolic fingerprints of steelhead trout (Oncorhynchus mykiss)
eggs incubated at two temperatures. Fish Physiology and Biochemistry 33, 59-72.
Uda, K., Fujimoto, N., Akiyama, Y., Mizuta, K., Tanaka, K., Ellington, W. R., and Suzuki, T.
(2006). Evolution of the arginine kinase gene family. Comparative Biochemistry and
Physiology D-Genomics & Proteomics 1, 209-218.

- 204 -
US-EPA (2004). Potential Implications of Genomics for Regulatory and Risk Assessment
Applications at EPA, p. 70. United States Environmental Protection Agency.
Van Straalen, N. (2003). Ecotoxicology becomes stress ecology. Environmental Science &
Technology 37, 324A-330A.
Verslycke, T., Ghekiere, A., Raimondo, S., and Janssen, C. (2007). Mysid crustaceans as
standard models for the screening and testing of endocrine-disrupting chemicals.
Ecotoxicology 16, 205-219.
Viant, M. R. (2007). Metabolomics of aquatic organisms: the new 'omics' on the block.
Marine Ecology-Progress Series 332, 301-306.
Viant, M. R. (2008). Recent developments in environmental metabolomics. Molecular
Biosystems 4, 980-986.
Viant, M. R., Bundy, J. G., Pincetich, C. A., de Ropp, J. S., and Tjeerdema, R. S. (2005). NMR-
derived developmental metabolic trajectories: An approach for visualizing the toxic actions of
trichloroethylene during embryogenesis. Metabolomics 1, 149-158.
Viant, M. R., Pincetich, C. A., Hinton, D. E., and Tjeerdema, R. S. (2006a). Toxic actions of
dinoseb in medaka (Oryzias latipes) embryos as determined by in vivo 31
P NMR, HPLC-UV and
1H NMR metabolomics. Aquatic Toxicology 76, 329–342.
Viant, M. R., Pincetich, C. A., and Tjeerdema, R. S. (2006b). Metabolic effects of dinoseb,
diazinon and esfenvalerate in eyed eggs and alevins of Chinook salmon (Oncorhynchus
tshawytscha) determined by 1H NMR metabolomics. Aquatic Toxicology 77, 359–371.

- 205 -
Viant, M. R., Rosenblum, E. S., and Tjeerdema, R. S. (2003a). NMR-based metabolomics: A
powerful approach for characterizing the effects of environmental stressors on organism
health. Environmental Science & Technology 37, 4982-4989.
Viant, M. R., Werner, I., Rosenblum, E. S., Gantner, A. S., Tjeerdema, R. S., and Johnson, M. L.
(2003b). Correlation between heat-shock protein induction and reduced metabolic condition
in juvenile steelhead trout (Oncorhynchus mykiss) chronically exposed to elevated
temperature. Fish Physiology and Biochemistry 29, 159-171.
Watanabe, H., Takahashi, E., Nakamura, Y., Oda, S., Tatarazako, N., and Iguchi, T. (2007).
Development of a Daphnia magna DNA microarray for evaluating the toxicity of
environmental chemicals. Environmental Toxicology and Chemistry 26, 669-676.
Weber, R. J. M., and Viant, M. R. (submitted). MI-Pack: Increased confidence of metabolite
identification in mass spectra by integrating accurate masses and metabolic pathways.
Chemometrics and Intelligent Laboratory Systems
Westerhuis, J. A., Hoefsloot, H. C. J., Smit, S., Vis, D. J., Smilde, A. K., van Velzen, E. J. J., van
Duijnhoven, J. P. M., and van Dorsten, F. A. (2008). Assessment of PLSDA cross validation.
Metabolomics 4, 81-89.
Wise, B. M., Gallagher, N. B., Bro, R., Shaver, J. M., Windig, W., and Koch, R. S. (2006).
PLS_Toolbox 4.0 for use with MATLAB (user manual). Eigenvector Research, Inc, Wenatchee,
USA.
Wold, S., Sjostrom, M., and Eriksson, L. (2001). PLS-regression: a basic tool of chemometrics.
Chemometrics and Intelligent Laboratory Systems 58, 109-130.

- 206 -
Wouters, R., Lavens, P., Nieto, J., and Sorgeloos, P. (2001). Penaeid shrimp broodstock
nutrition: an updated review on research and development. Aquaculture 202, 1-21.
Wu, H., Southam, A. D., Hines, A., and Viant, M. R. (2008). High throughput tissue extraction
protocol for NMR- and MS-based metabolomics. Analytical Biochemistry 372, 204-212.
Zhang, L. K., Rempel, D., Pramanik, B. N., and Gross, M. L. (2005). Accurate mass
measurements by Fourier transform mass spectrometry. Mass Spectrometry Reviews 24,
286-309.

- 207 -
CHAPTER NINE:
Appendix

- 208 -
Publication List and Author Contributions
Taylor, N. S.; Weber, R. J. M.; Southam, A. D.; Payne, T. G.; Hrydziuszko, O.; Arvanitis, T. N.;
Viant, M. R. A new approach to toxicity testing in Daphnia magna: Application of high
throughput FT-ICR mass spectrometry metabolomics. Metabolomics. 2009, 5 (1), 45-58.
Taylor, N.S.: Experimental design, exposure studies, FT-ICR MS analysis, data analysis and
writing of manuscript
Weber, R.J.M.: development of algorithm for calculating empirical formulae and KEGG
identification
Southam, A.D.: Optimisation of FT-ICR MS and SIM-stitch approach
Payne, T.G.: Optimisation of SIM-stitch approach, including data pre-processing and three-
stage filtering algorithm.
Hrydziusko, O.: Development of algorithm for replacing missing values and software
visualisation tool for determining common peaks
Arvantis, T.N.: Optimisation of SIM-stitch approach, including data pre-processing and three-
stage filtering algorithm.
Viant, M.R.: Experimental design, FT-ICRMS and data analysis optimisation, editing of
manuscript.
Poynton, H. C.; Taylor, N. S.; Hicks, J.; Colson, K.; Chan, S.; Clark, C.; Scanlan, L.; Louginov, A.
V.; Vulpe, C.; Viant, M. R. Integration of metabolomics and transcriptomic signatures offers a
coordinated model of cadmium toxicity in Daphnia magna. Environmental Science and
Technology (submitted).
Taylor, N.S.: FT-ICR MS analysis and subsequent data processing and analysis, writing of
manuscript
Poynton, H.C.: Exposures for transcriptomic analysis, microarray analysis and q-RT-PCR
analysis, writing of manuscript.

- 209 -
Hicks, J. and Chan S.: NMR analysis, manuscript editing
Vulpe, C., Colson, K., Clark, C. Scanlan, L and Louginov, A.: Daphnia eaxposures and
haemolymph extraction for metabolomic analysis, manuscript editing
Viant, M.R.: FT-ICR MS metablomic data analysis, manuscript editing.
Taylor, N. S. and Viant, M. R. Discriminating toxicant modes of action via changes in the
daphnid metabolome. Toxicological Sciences (submitted)
Taylor, N.S.: Experimental design, exposure studies, FT-ICR MS analysis, data analysis and
writing of manuscript
Viant, M.R.: Data analysis, manuscript editing.

![Microbiotests Daphtoxkit F test procedure slide show ...€¦ · Microsoft PowerPoint - Microbiotests Daphtoxkit F test procedure slide show daphnia toxicity test.ppt [Compatibiliteitsmodus]](https://img.pdfslide.net/doc/110x75/5ec9fd18aa226c52ed29ea4c/microbiotests-daphtoxkit-f-test-procedure-slide-show-microsoft-powerpoint-.jpg)