Embed Size (px)
Citation preview

RESEARCH ARTICLE
Novel non-invasive algorithm to identify the
origins of re-entry and ectopic foci in the atria
from 64-lead ECGs: A computational study
Erick A. Perez Alday1, Michael A. Colman2,3, Philip Langley4, Henggui Zhang1*
1 Biological Physics Group, Department of Physics and Astronomy, University of Manchester, Manchester,
United Kingdom, 2 Theoretical Physics Division, Department of Physics and Astronomy, University of
Manchester, Manchester, United Kingdom, 3 School of Biomedical Sciences, Faculty of Biological Sciences,
University of Leeds, United Kingdom, 4 School of Engineering, University of Hull, Hull, United Kingdom
Abstract
Atrial tachy-arrhytmias, such as atrial fibrillation (AF), are characterised by irregular electri-
cal activity in the atria, generally associated with erratic excitation underlain by re-entrant
scroll waves, fibrillatory conduction of multiple wavelets or rapid focal activity. Epidemiologi-
cal studies have shown an increase in AF prevalence in the developed world associated
with an ageing society, highlighting the need for effective treatment options. Catheter ablation
therapy, commonly used in the treatment of AF, requires spatial information on atrial electri-
cal excitation. The standard 12-lead electrocardiogram (ECG) provides a method for non-
invasive identification of the presence of arrhythmia, due to irregularity in the ECG signal
associated with atrial activation compared to sinus rhythm, but has limitations in providing
specific spatial information. There is therefore a pressing need to develop novel methods to
identify and locate the origin of arrhythmic excitation. Invasive methods provide direct infor-
mation on atrial activity, but may induce clinical complications. Non-invasive methods avoid
such complications, but their development presents a greater challenge due to the non-direct
nature of monitoring. Algorithms based on the ECG signals in multiple leads (e.g. a 64-lead
vest) may provide a viable approach. In this study, we used a biophysically detailed model of
the human atria and torso to investigate the correlation between the morphology of the ECG
signals from a 64-lead vest and the location of the origin of rapid atrial excitation arising from
rapid focal activity and/or re-entrant scroll waves. A focus-location algorithm was then con-
structed from this correlation. The algorithm had success rates of 93% and 76% for correctly
identifying the origin of focal and re-entrant excitation with a spatial resolution of 40 mm,
respectively. The general approach allows its application to any multi-lead ECG system. This
represents a significant extension to our previously developed algorithms to predict the AF
origins in association with focal activities.
PLOS Computational Biology | DOI:10.1371/journal.pcbi.1005270 March 2, 2017 1 / 16
a1111111111
a1111111111
a1111111111
a1111111111
a1111111111
OPENACCESS
Citation: Alday EAP, Colman MA, Langley P, Zhang
H (2017) Novel non-invasive algorithm to identify
the origins of re-entry and ectopic foci in the atria
from 64-lead ECGs: A computational study. PLoS
Comput Biol 13(3): e1005270. doi:10.1371/journal.
pcbi.1005270
Editor: Alexander V Panfilov, Universiteit Gent,
BELGIUM
Received: November 27, 2015
Accepted: November 28, 2016
Published: March 2, 2017
Copyright: © 2017 Alday et al. This is an open
access article distributed under the terms of the
Creative Commons Attribution License, which
permits unrestricted use, distribution, and
reproduction in any medium, provided the original
author and source are credited.
Data Availability Statement: All relevant data are
within the paper and its Supporting Information
files.
Funding: This work was supported by research
project grants from EPSRC (EP/J00958X/1; EP/
I029826/1) and BHF (FS/14/5/30533). It was also
supported by Conacyt and the University of
Manchester. The funders had no role in study
design, data collection and analysis, decision to
publish, or preparation of the manuscript.

Author summary
Atrial tachy-arrhythmias are associated with irregular excitation waves arising from re-
entrant excitation, multiple wavelets or rapid focal activity. Identifying the origin of the
irregular activity may be vital for diagnosis and treatment of the disorder. Where invasive
and non-invasive methods provide approaches for such identification, both have associ-
ated disadvantages. In this study, we used a biophysically detailed model of the human
atria and torso to develop an algorithm based on the correlation between the electrocar-
diogram (ECG) signal from a 64-lead vest and the location of rapid focal and re-entrant
excitation. Using the properties of the atrial activation and the ECG signals, we developed
a focus-location algorithm which is able to distinguish rapid focal activity from re-entrant
scroll waves centred in the same location. Based on simulated data, the algorithm had suc-
cess rates of 93% and 76% for correctly identifying the origin of focal and re-entrant exci-
tation, respectively, and 88% for distinguish focal and re-entrant excitation, with no false
positives. Inherited from our previous algorithm, it is also easily generalizable to any
multi-lead ECG system.
Introduction
Atrial tachy-arrhythmias, including atrial fibrillation (AF), atrial tachycardia (AT) and flutter
(AFL), are the most common cardiac arrhythmias, predisposing to heart attack, stroke and
even possible cardiac death [1,2]. All three are characterised by rapid and irregular electrical
activation of the atria, with AF presenting the greatest complexity. Such rapid and irregular
electrical activity of the atria is normally associated with one or more of the following abnor-
mal excitation patterns: focal pacing (spontaneous rapid firing of non-pacemaker cells) [3,4],
fibrillatory conduction of multiple wavelets [5] and re-entrant excitation scroll waves (i.e.,
rotors) [4,5].
Epidemiological studies have shown an increase in AF prevalence in the developed world
associated with an ageing society, highlighting the need for effective treatment options [6,7].
Current treatment of AF involves the use of rate control, anticoagulation, cardioversion and
ablation [8]. The restoration of sinus rhythm in the atria may improve cardiac function, how-
ever several drug treatments have limited efficacy in long term maintenance of sinus rhythm
[6,9]. Developments aiming to reduce the critical mass required to sustain AF, such as cathe-
ter-based radio-frequency ablation therapy, have proven to be more effective in suppressing
AF substantially [9], although multiple procedures may still be necessary due to high recur-
rence rates [10].
For a successful AF ablation, it is vital to know the origins (i.e., the driving sources) of AF
prior to the procedure, because isolating the driving source from the rest of the atria is the pri-
mary goal of such therapy [9]. To identify such origins, both invasive and non-invasive tech-
niques have been developed. These include the low density endo-surface mapping technique
of 64-electrode basket catheters [11] and electrocardiogram imaging (ECGi) [12]. The main
limitation of using an invasive method is that it might produce further complications during
the surgery [13]. There is a pressing need to develop effective non-invasive methods to identify
AF origins which might provide all of the necessary information prior to the surgery. The
ECGi technology, based on the inverse problem solution [12], is a promising method in clini-
cal diagnosis. However, current algorithms require further information to constrain the solu-
tion to achieve a reliable reconstruction of cardiac excitation waves due to the ill-posedness of
the problem [14].
Identify origins of atrial re-entry
PLOS Computational Biology | DOI:10.1371/journal.pcbi.1005270 March 2, 2017 2 / 16
Competing Interests: The authors have declared
that no competing interests exist.

Recent studies have also developed algorithms to identify non-invasively the location of
focal sources by using either the standard 12-lead [15–17] or multiple-lead (e.g. 64-lead) ECG
systems [18,19]. The success rates of these algorithms range from 40 to 90%. Most are based
on the correlation between the location of focal activity and the P-wave morphology or polarity
[16–18]. Whereas they are useful in identifying the origin of focal excitation, current algo-
rithms may not be applicable to identify re-entry or very rapid focal activity; at such rapid
rates, regular and irregular fragmented waves are typically observed and thus determination of
morphology or polarity of the main activation wave is non-trivial. Confounding the case for
re-entry, atrial flutter waves or F-waves are also likely to be more fragmented and more com-
plex in nature. It is also important to be able to distinguish very rapid focal activity from that
of re-entry at a comparable rate, as the underlying maintenance mechanisms in these condi-
tions are different and thus it is possible that different intervention may be required to termi-
nate the arrhythmia.
The aim of this study is to go-beyond our previous studies [17–19] in identifying the origins
of focal-related AF from body surface ECG to develop a novel algorithm based on rapid regu-
lar atrial waves in order to identify origins for both rapid focal and re-entrant activity from a
multi-lead ECG system.
Methods
Atrial-torso model
A previously validated biophysically detailed computational model of the three-dimensional
(3D) human atria and torso [17,18,20] was used to simulate ectopic focal and re-entry con-
ditions (Fig 1). The atrial model was segmented into the major anatomical structures and
accounts for electro-physiological heterogeneity between these regions (Fig 1A) [21]. The
model has been previously used and determined suitable for studying atrial arrhythmia
mechanisms [17,22]. The atrial model was placed into a previously developed and validated
male torso model which accounts for the segmented structure of lungs, liver, blood masses
and spinal cord and the respective electrical conductivities (Fig 1B) [18,20]. A table of con-
ductivity values used can be found in supplementary information (S1 Table). For further
Fig 1. Models and procedure used to develop the algorithm. Illustration of atria (A) and torso (B) models used in the study to simulate re-entry and
ectopic activity in the atria. (C) Electrode positions used to simulate the 64-lead ECG. (D) Simulated anterior (i) and posterior (ii) polarity map, as
compared to experimental data, validating the 3D atria-torso models.
doi:10.1371/journal.pcbi.1005270.g001
Identify origins of atrial re-entry
PLOS Computational Biology | DOI:10.1371/journal.pcbi.1005270 March 2, 2017 3 / 16

test, a previously developed and validated female torso geometry [18] was implemented
(S1 Text). Both models have been used before to develop an algorithm to diagnose atrial
ectopic origin from multi lead ECG systems [18]. Details of the atrial cell models and 3D
simulation protocols can be found in Colman et al [22] or in S2 Text and single cell code S3
Text; details of the torso model development, validation and simulation protocols can be
found in Perez Alday et al [18].
Simulating atrial rapid ectopic foci and re-entry
Ectopic focal and re-entrant excitations were initiated in different regions of the atria (Fig
2Ai). 2D views and 3D vtk files can be found in supplementary information S. In order to
allow rapid excitation waves with rates at frequencies typical of AF/AT/AFL (i.e. 2.5–8 HZ
[22,23]) to be sustained in the atria, parameters of the Colman et al. model of single human atrial
myocytes were modified to incorporate experimentally observed AF-induced electrical remodel-
ling of ion channels [22], which resulted in shortened AP (Fig 2A). To simulate ectopic focal
activity, a sequence of external supra-threshold electrical pulses (with amplitude of 2nA and
duration of 2-3ms) was applied to various locations across different regions of the atria (Fig 2Ai).
Re-entrant excitation waves were initiated by a phase distribution method [24,25]. Although this
is an artificial method for initiating re-entrant excitation, it allows the location of the centre of
the rotor wave to be easily controlled. To avoid possible effects of the transition period of excita-
tion waves on their kinetics due to the unphysiological initiation procedure, data after 1 second
of initiation were analysed. In cases where re-entrant scroll waves were not localised to the initia-
tion point, i.e. there was a degree of meander, a small non-excitation area (0.5 cm in radius) was
incorporated around a specific region of the atria, in order to stabilise the rotor centre (Fig 2C).
This allowed sustained re-entrant activity with its origin (i.e. tip) located in a specific region of
the atria to be produced. The inclusion of a small area of non-excitable tissue did not produce a
marked change in tissue’s volume or morphology of the measured potential on the body surface.
In simulations, cases when re-entrant excitation waves had a significant degree of meander were
used to test the ability of the algorithm to track the tip of the scroll waves spatio-temporally.
To test the algorithm’s ability to distinguish between focal and re-entrant activities centred
on the same spatial locations, a set of focal stimuli simulations were matched in location and
excitation rate to re-entrant simulations centre at multiple locations.
Simulating body surface potential
A boundary element method (BEM) was used to calculate the potential on the surface of the
torso [26]. From the body surface potential (BSP), 64-lead ECG signals were obtained by select-
ing elements of the torso mesh corresponding to the position of the electrodes as described in
previous studies [18,20]. The P-wave of the 64-lead ECG during control conditions matched the
experimental data of multiple patients [18,27] (see S1 Fig), validating the development of the
heart-torso model.
Measurement of potentials of positive and negative poles
From the measured atrial-waves, the dynamical evolution of the spatial distribution and ampli-
tude of the atrial-wave dipole was computed from the 64-lead ECG, following the same method
as used in previous experimental studies [18,27]. The dipole pattern on the body surface was
reconstructed by selecting the maximum positive potential value (positive pole) and the mini-
mum negative potential value (negative pole) of the 64-lead ECG at every time step [27]. The
amplitude and the spatial pattern of the atrial-wave dipole based on the 64-lead ECG changed
with time as the atrial activation evolved. In the model, both the amplitude and the temporal
Identify origins of atrial re-entry
PLOS Computational Biology | DOI:10.1371/journal.pcbi.1005270 March 2, 2017 4 / 16
evolution of the dipole location agreed with the experimental data [18] during control condi-
tions (S2 Fig), further validating the model development.
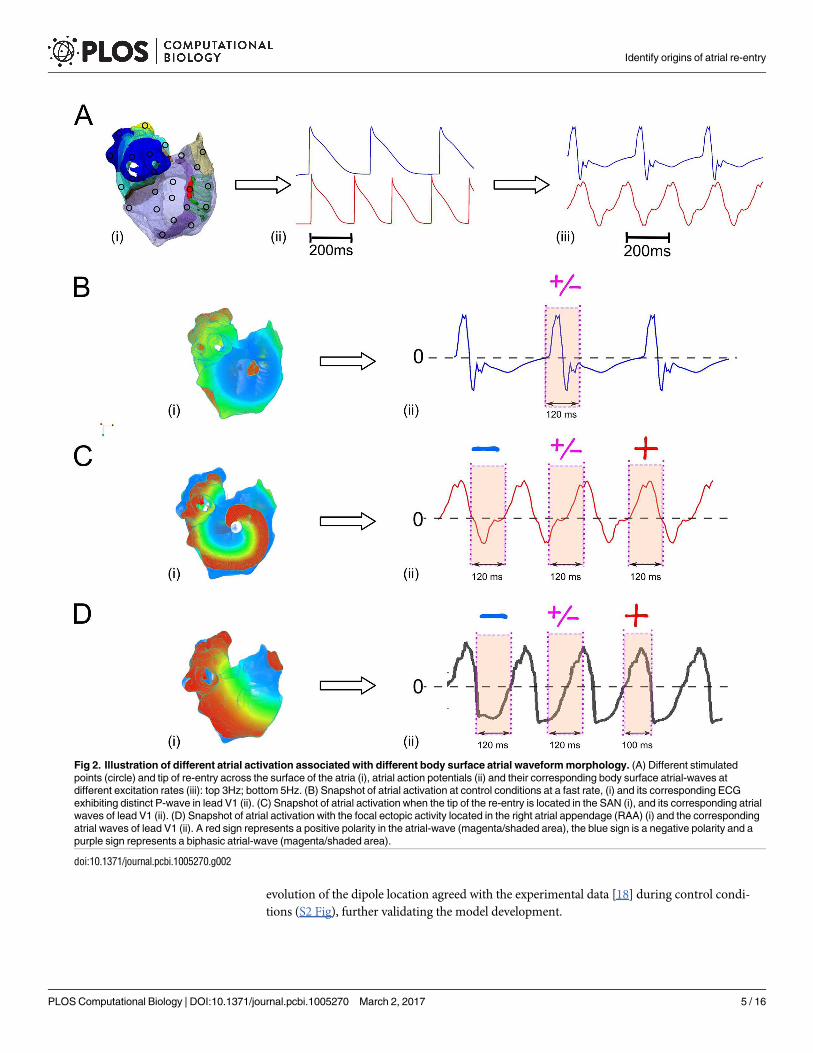
Fig 2. Illustration of different atrial activation associated with different body surface atrial waveform morphology. (A) Different stimulated
points (circle) and tip of re-entry across the surface of the atria (i), atrial action potentials (ii) and their corresponding body surface atrial-waves at
different excitation rates (iii): top 3Hz; bottom 5Hz. (B) Snapshot of atrial activation at control conditions at a fast rate, (i) and its corresponding ECG
exhibiting distinct P-wave in lead V1 (ii). (C) Snapshot of atrial activation when the tip of the re-entry is located in the SAN (i), and its corresponding atrial
waves of lead V1 (ii). (D) Snapshot of atrial activation with the focal ectopic activity located in the right atrial appendage (RAA) (i) and the corresponding
atrial waves of lead V1 (ii). A red sign represents a positive polarity in the atrial-wave (magenta/shaded area), the blue sign is a negative polarity and a
purple sign represents a biphasic atrial-wave (magenta/shaded area).
doi:10.1371/journal.pcbi.1005270.g002
Identify origins of atrial re-entry
PLOS Computational Biology | DOI:10.1371/journal.pcbi.1005270 March 2, 2017 5 / 16
Algorithm to locate the atrial source
In a previous study, we developed an algorithm to identify the location of atrial ectopic focal
activity, using the polarity map on the body surface potential that was produced from a 64-lead
ECG system, which was split into two sets of quadrants (anterior/posterior) [18]. The algorithm
was based on the fact that a negative polarity P-wave in a certain lead implied an excitation wave
propagating away from the positive electrode of that lead. Thus, the quadrant of the 64-lead elec-
trode positions with the largest number of electrodes with negative P-waves would correlate
directly to the origin of the focal excitation. The success rate of the algorithm was 93%, meaning
that it correctly identified the origin of atrial focus in 75/80 simulations.
However, the previous algorithm was only able to detect slow ectopic focal atrial activation
from body surface potential mapping and cannot be applied directly to detect the origin of
atrial excitation waves due to rapid focal or re-entrant activity because of the complexity of the
body surface waveform, which produces fibrillatory waves. Determining the polarity of fast
atrial waves is not trivial since it may consist of positive, negative and biphasic waves, depend-
ing on the time period investigated (Fig 2C(ii) and 2D(ii)). Furthermore, re-entrant and focal
excitation patterns may present different characteristics of fragmented fast atrial waves, and
the ability to distinguish between these types of excitation could provide valuable information
for directing treatment. Thus, in order to apply our previously developed algorithm to both
rapid focal and re-entrant excitation, new tools were developed. The first tool was to determine
the polarity of the atrial wave associated with main atrial activation, in order to identify the
location of the source. The second tool was to quantify the differences between focal and re-
entrant activity. Further details of these algorithmic developments are provided below.
Determining the polarity of atrial waves
At slow pacing rates, it is straightforward to determine the polarity of individual P-waves: the
long period of the diastolic phase means that the ECG signal remains at a baseline during this
interval, with a clear deflection from the baseline corresponding to atrial activation during the
systolic period (Fig 2B). This deflection is the P-wave, and may be positive, negative or biphasic
(with both positive and negative portions). The duration (i.e., the time interval) of the P-wave
corresponds to the time interval of atrial activation.
The challenge for determining the polarity of the atrial wave at rapid pacing rates is that the
diastolic period is absent, leaving the ECG signal absent of a stable baseline. Therefore, there is
no clear distinction between successive deflections (Fig 2C(ii) and 2D(ii)). Determination of
the polarity of the atrial wave in such case is thus non-trivial; any polarity can be extracted
from the same signal, depending on the time interval which is considered (Fig 2C(ii) and 2D
(ii)). However, the polarity in the interval during which a large volume of the atrial mass is
excited (i.e. main atrial activation) can be determined and is suitable for our algorithm. Thus
the time interval corresponding to the main atrial activation must first be determined.
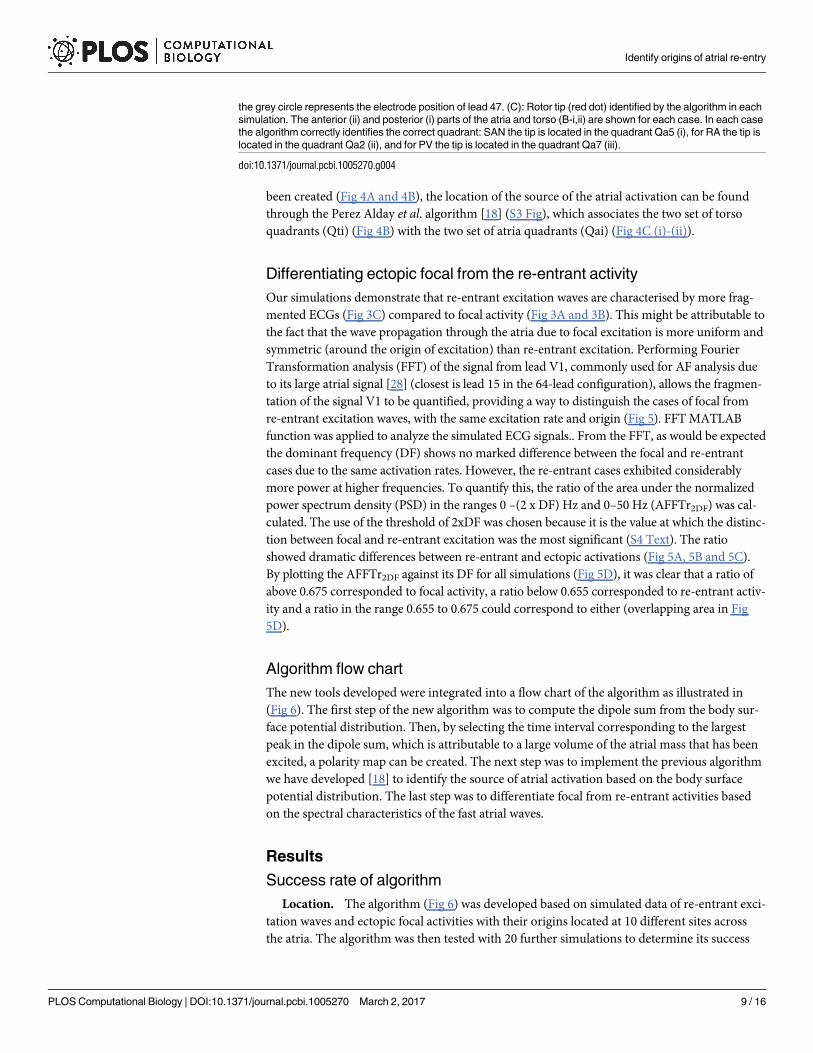
Analysis shows that the dipole signal provides sufficient information to determine the time
interval of main atrial excitation (Fig 3). Fig 3 illustrates results for three different cases of atrial
activation originating from the same location but with increasing complexity (i.e. slow focal
pacing, rapid focal pacing, and re-entrant excitation).
At the slow rate, determination of the polarity of the P-wave is straightforward and can be
seen to be positive in lead V1 (Fig 3A–black line). Note that the time interval of the P-wave
indeed corresponds to the time interval of the atrial activation (Fig 3A(i) (ii)). Also, both posi-
tive and negative poles of the body surface dipole have one significant deflection, and the time
interval of this deflection corresponds directly to the time interval of atrial activation and
therefore the P-wave (Fig 3 –red and blue lines). The positive and negative dipole signals can
Identify origins of atrial re-entry
PLOS Computational Biology | DOI:10.1371/journal.pcbi.1005270 March 2, 2017 6 / 16

be combined as a “dipole sum” (defined as the sum of the modulus of the negative and positive
poles), giving a single signal with a significant deflection corresponding to the time interval of
atrial activation (Fig 3 –green line).
At rapid rates where F-waves rather than P-waves are observed, there are no clear markers
for the time interval of atrial activation in the ECG signal (Fig 3B and 3C–black line). The
dipole sum, however, still presents a signal with one easily identifiable prominent deflection;
the time interval of this deflection corresponds to the main atrial activation (Fig 3B(i),(ii)),
even in the case of more fragmented atrial waves resulting from re-entrant activity (Fig 3C(i),
(ii)). The portion of the atrial wave within this time interval therefore gives the polarity associ-
ated with the main atrial activation. In examples shown in Fig 3, the polarity is positive in lead
V1 for all cases but the polarity will vary spatially across the body surface according to lead
position.
Thus, by selecting the ECG segment corresponding to the main atrial activation (obtained
from dipole sum, Fig 3 magenta/shaded regions), the polarity (positive, negative or biphasic)
of each lead in this segment is determined.
Atrial source location based on the atrial-wave polarity map
Having identified the polarity of the fast atrial waves in each lead, the resulting 64-lead polarity
distribution feeds directly into our original atrial source location algorithm [18].
Fig 4 demonstrate the correlation used by the algorithm to determine the origin of non-
meandering atrial re-entrant activations, centred on the sino-atrial node (SAN) (left), right
atrial appendage (RAA) (middle) and pulmonary veins (PV) (right). In each case, the time
interval has been obtained by selecting the largest deflection in the dipole sum evolution pat-
tern (Fig 4A- vertical dashed lines) as described in the previous section. Then, an atrial-wave
polarity map is created (Fig 4B) from the time interval selection. Once the polarity map has
Fig 3. Dipole and atrial activation evolution in different atrial activations located in the pulmonary veins (PV). (A) Slow ectopic atrial activation
focus in the PV (non fibrillatory waves observed). (B) Fast focal activation focus in the PV (F-waves observed). (C) Re-entrant activation around the PV
(F-waves observed). Red line: Positive dipole. Blue line: Negative dipole. Green line: Dipole sum. Black line: lead V1 (ECG). The Magenta regions
represent the time interval of the main atrial wave, selected from the peaks in the dipole pattern. (i)-(ii) Snapshots of the atria activation at the beginning
and end of the time interval selected.
doi:10.1371/journal.pcbi.1005270.g003
Identify origins of atrial re-entry
PLOS Computational Biology | DOI:10.1371/journal.pcbi.1005270 March 2, 2017 7 / 16
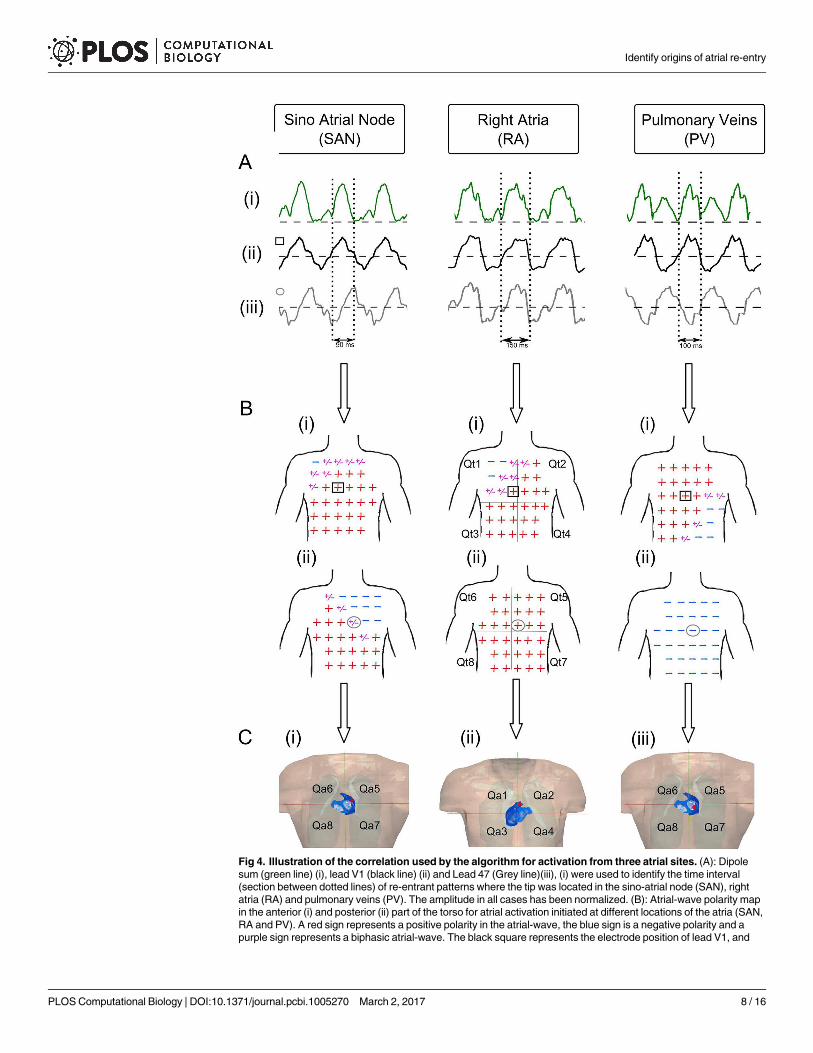
Fig 4. Illustration of the correlation used by the algorithm for activation from three atrial sites. (A): Dipole
sum (green line) (i), lead V1 (black line) (ii) and Lead 47 (Grey line)(iii), (i) were used to identify the time interval
(section between dotted lines) of re-entrant patterns where the tip was located in the sino-atrial node (SAN), right
atria (RA) and pulmonary veins (PV). The amplitude in all cases has been normalized. (B): Atrial-wave polarity map
in the anterior (i) and posterior (ii) part of the torso for atrial activation initiated at different locations of the atria (SAN,
RA and PV). A red sign represents a positive polarity in the atrial-wave, the blue sign is a negative polarity and a
purple sign represents a biphasic atrial-wave. The black square represents the electrode position of lead V1, and
Identify origins of atrial re-entry
PLOS Computational Biology | DOI:10.1371/journal.pcbi.1005270 March 2, 2017 8 / 16
been created (Fig 4A and 4B), the location of the source of the atrial activation can be found
through the Perez Alday et al. algorithm [18] (S3 Fig), which associates the two set of torso
quadrants (Qti) (Fig 4B) with the two set of atria quadrants (Qai) (Fig 4C (i)-(ii)).
Differentiating ectopic focal from the re-entrant activity
Our simulations demonstrate that re-entrant excitation waves are characterised by more frag-
mented ECGs (Fig 3C) compared to focal activity (Fig 3A and 3B). This might be attributable to
the fact that the wave propagation through the atria due to focal excitation is more uniform and
symmetric (around the origin of excitation) than re-entrant excitation. Performing Fourier
Transformation analysis (FFT) of the signal from lead V1, commonly used for AF analysis due
to its large atrial signal [28] (closest is lead 15 in the 64-lead configuration), allows the fragmen-
tation of the signal V1 to be quantified, providing a way to distinguish the cases of focal from
re-entrant excitation waves, with the same excitation rate and origin (Fig 5). FFT MATLAB
function was applied to analyze the simulated ECG signals.. From the FFT, as would be expected
the dominant frequency (DF) shows no marked difference between the focal and re-entrant
cases due to the same activation rates. However, the re-entrant cases exhibited considerably
more power at higher frequencies. To quantify this, the ratio of the area under the normalized
power spectrum density (PSD) in the ranges 0 –(2 x DF) Hz and 0–50 Hz (AFFTr2DF) was cal-
culated. The use of the threshold of 2xDF was chosen because it is the value at which the distinc-
tion between focal and re-entrant excitation was the most significant (S4 Text). The ratio
showed dramatic differences between re-entrant and ectopic activations (Fig 5A, 5B and 5C).
By plotting the AFFTr2DF against its DF for all simulations (Fig 5D), it was clear that a ratio of
above 0.675 corresponded to focal activity, a ratio below 0.655 corresponded to re-entrant activ-
ity and a ratio in the range 0.655 to 0.675 could correspond to either (overlapping area in Fig
5D).
Algorithm flow chart
The new tools developed were integrated into a flow chart of the algorithm as illustrated in
(Fig 6). The first step of the new algorithm was to compute the dipole sum from the body sur-
face potential distribution. Then, by selecting the time interval corresponding to the largest
peak in the dipole sum, which is attributable to a large volume of the atrial mass that has been
excited, a polarity map can be created. The next step was to implement the previous algorithm
we have developed [18] to identify the source of atrial activation based on the body surface
potential distribution. The last step was to differentiate focal from re-entrant activities based
on the spectral characteristics of the fast atrial waves.
Results
Success rate of algorithm
Location. The algorithm (Fig 6) was developed based on simulated data of re-entrant exci-
tation waves and ectopic focal activities with their origins located at 10 different sites across
the atria. The algorithm was then tested with 20 further simulations to determine its success
the grey circle represents the electrode position of lead 47. (C): Rotor tip (red dot) identified by the algorithm in each
simulation. The anterior (ii) and posterior (i) parts of the atria and torso (B-i,ii) are shown for each case. In each case
the algorithm correctly identifies the correct quadrant: SAN the tip is located in the quadrant Qa5 (i), for RA the tip is
located in the quadrant Qa2 (ii), and for PV the tip is located in the quadrant Qa7 (iii).
doi:10.1371/journal.pcbi.1005270.g004
Identify origins of atrial re-entry
PLOS Computational Biology | DOI:10.1371/journal.pcbi.1005270 March 2, 2017 9 / 16

rate (i.e. the proportion of cases in which the algorithm correctly identified the origin of atrial
arrhythmias).
In the test for re-entrant excitation, the success rate of determining the atrial quadrant con-
taining the tip of the scroll wave was 75%. In the cases which the origin of the scroll wave was
not identified by the algorithm, it was due to the tip of the scroll wave being close to the
boundary of two nearby quadrants (i.e., within 0.5 cm). The direction of the rotation of the
scroll wave played an important role as well.
In the test for ectopic focal excitation the success rate for detecting the atrial quadrant
where the rapid focal activity was located was 92%. This is comparable with the success rate of
our previous algorithm [18] for slow ectopic foci (93%). The consistency between the present
and the previous algorithm suggests the newly devised tool for identifying the polarity of the
fast atrial wave is valid.
Fig 5. Normalized power spectral density for ectopic focal and re-entrant activation. Normalized power spectral density for ectopic focal (blue) and re-
entrant (red) activity located in (A) SAN; (B) PV and (C) RAA. The darker shadow corresponds to the area between 0–2 x DF. (D): a scatter plot of (AFFTr2DF)
against the DF, the magenta area is the overlapping area where both activities can occur. AFFTr2DF is the ratio of the area under the power spectrum density
in the ranges 0 –(2 x DF) Hz and (2 x DF)– 50 Hz: AFFTr2DF = Area0-2DF/Area0-50Hz
doi:10.1371/journal.pcbi.1005270.g005
Identify origins of atrial re-entry
PLOS Computational Biology | DOI:10.1371/journal.pcbi.1005270 March 2, 2017 10 / 16

Further refinements to the spatial resolution of the quadrants was performed with the aim
to improve the specificity of the algorithm for locating the focal origin site, by dividing each
quadrant into sub-quadrants, as described in [18,19]. Though such a spatial refinement
improved the detection accuracy in terms of the spatial resolution, the success rate of detection
showed a slight decrease, down to 87% and 72% in ectopic and re-entrant activation
respectively.
Focal vs Re-entry. The success rate to differentiate ectopic activity from re-entrant activa-
tion with the same frequency was 88%. Note that the algorithm never produced a false positive,
because in the remaining 12% of the cases the FFTAr was within the overlapping area where
ectopic and re-entrant activity could not be distinguished (Fig 5D, magenta shaded area).
White noise added test. The algorithm was tested with random noise added to ECG sig-
nals. During this test, a dipole sum was obtained with the same characteristics as previously
described. The AFFTr2DF values were affected by the addition of noise; however, the changes
did not produce large differences. Further information can be found in S5 Text.
Determining the time-dependent location of meandering re-entry. The algorithm
showed good feasibility for tracking the tip of scroll waves with a significant degree of mean-
der. This was done by selecting the time intervals when the tip of the rotor was in two different
positions across the atria (Fig 7).
Discussion
Major contribution
By using a biophysically detailed computer model of human atria-torso and identifying the
correct polarity of the fast atrial waves, we have developed a novel algorithm to locate the ori-
gin of atrial fibrillation in association with both of ectopic focal and re-entrant activity. The
success rate of the algorithm was 92% and 75% for focal and re-entry activation, respectively.
The properties of the FFT allowed re-entry and focal activation to be distinguished with a suc-
cess rate of 88%.
Fig 6. Schematic illustration of the algorithm to identify the location of atrial focal origin or re-entry
from atrial wave polarity maps.
doi:10.1371/journal.pcbi.1005270.g006
Identify origins of atrial re-entry
PLOS Computational Biology | DOI:10.1371/journal.pcbi.1005270 March 2, 2017 11 / 16

Further test
The algorithm was also tested with a different torso geometry. During this test, dipole sum and
AFFTr2DF values were obtained and the algorithm successfully identified the quadrant where
the origin of the arrhythmia was located. Further information can be found in supporting
information S1 Text.
It was also shown that when white noise was added with a signal to noise ratio of 10, the
performance of the algorithm was not affected as the changes of the FFTAr values were small
(S5 Text). However, further test need to be implemented.
FFT analysis was applied to experimental AF signals, where AFFTr2DF values were obtained
to compare simulated and experimental data. Similar AFFTr2DF values were obtained with
simulated and experimental data. Further information can be found in S6 Text.
Comparison to previous/other algorithms
Previous studies have been focused on differentiating ectopic activity against re-entry [29–32].
Most use atria-electrocardiograms to detect and characterize complex fractionated signals, FFT
and DF atria maps [29,30,33]. The success rate of these algorithms is in the range of 60–80%
[29,30,34], however, as it is an invasive method, it might unduly lengthen the ablation proce-
dure [35]. By using a 12-lead ECG system, algorithms to detect ectopic activity have been devel-
oped [16,36], however, the success rates range within 55–78% [15,16,18] and it has been proved
that the 12-lead ECG system does not produce enough information to identify the origins when
fast atrial waves are presented or under re-entrant activity [15,18,32]. Other attempts have used
multi-lead ECG systems and body surface mapping [31,32,37], to correlate to atrial DF or add
extra information like phase mapping [32]. However, it has been difficult to validate the time
interval, location and the source of the atrial activation when fast atrial waves are presented.
Fig 7. Comparison of quadrants position and atrial-waves polarity maps in meandering re-entrant activation. (A) Snapshot at two different
instant of re-entrant activation in the atria. (B) Snapshot at two different instant of re-entrant activation of the atria-torso model from a posterior superior
right view. (C) Simulated 64-lead ECG atrial-waves polarity map at two different instant of re-entrant activation. We observed the polarity pattern of the
atrial waves of the experimental and simulation, in the anterior (i), (iii) and posterior (ii), (iv) part of the body. The red positive sign represents a positive
atrial-wave, the blue negative sign represents negative atrial-wave, and the purple positive/negative sign represents a biphasic atrial-wave.
doi:10.1371/journal.pcbi.1005270.g007
Identify origins of atrial re-entry
PLOS Computational Biology | DOI:10.1371/journal.pcbi.1005270 March 2, 2017 12 / 16

Nevertheless, they are promising methods that can add extra useful information. Ours is the
first attempt to distinguish the main activity and find the position of the focus and tip of the re-
entry from a multi-lead ECG.
The present algorithm can also be used together with other invasive or non-invasive mapping
methods, with potential to reduce procedures times in locating the origin of atrial arrhythmias.
Limitations
The torso model lacks considerations of some other tissue types or organs (such as muscles, fat
tissue, bowel, kidneys and spleen) that may affect the amplitude of simulated surface poten-
tials. However, the absence of those tissues does not have a big effect on the polarity of the
atrial-waves, which is the characteristic used in the present algorithm, as demonstrated previ-
ously [18].
In the algorithm, two-sets of quadrants were defined to cover the torso. The spatial resolu-
tion of the 8 quadrant was about 40mm. The finer spatial resolution with lower accuracy was
20mm. Though this provided roughly the site of the AF origin, it is the information needed for
identifying which part of the atria for ablation (i.e., left or right atrium, the low or upper part
of the atrium). The diameter size in current ablation procedures varies from 3mm to 10mm
[9,13,38,39]. Therefore, the current algorithm can be used in clinical studies, but it may require
further investigation and refinement to provide the essential information in all case.
Future work
In the present study, we only tested the effectiveness of the algorithm for detecting single atrial
focal activity and a single centre of a rotor activity. However, a possible extension is to identify
multiple wavelets, using the dipole evolution patterns. For that purpose, consideration of com-
bined use of the present algorithm with vecto-cardiograms, phase relationships, correlation anal-
ysis and inverse problem reconstruction may be necessary, warranting further investigation.
Conclusion
A novel algorithm has been developed to locate the origins of rapid and irregular atrial excita-
tion waves, associated with both ectopic focal and re-entrant activity. This represents a signifi-
cant progress to previously developed algorithms to predict AF origins in association with
focal activities.
Supporting information
S1 Table. Table of conductivities.
(DOCX)
S1 Text. Female Torso.
(DOCX)
S2 Text. Atrial Model.
(DOCX)
S3 Text. Colman_2013_single_cell_function.
(C)
S1 Fig. 2D and 3D view files.
(ZIP)
Identify origins of atrial re-entry
PLOS Computational Biology | DOI:10.1371/journal.pcbi.1005270 March 2, 2017 13 / 16

S2 Fig. Dipole Validation.
(DOCX)
S3 Fig. Perez-Alday et al. algorithm.
(DOCX)
S4 Text. FFTR ratio.
(DOCX)
S5 Text. White Noise.
(DOCX)
S6 Text. Experimental Data.
(DOCX)
Author contributions
Conceptualization: HZ.
Data curation: HZ EAPA.
Formal analysis: EAPA MAC HZ PL.
Funding acquisition: HZ.
Investigation: EAPA MAC HZ PL.
Methodology: EAPA MAC HZ PL.
Project administration: HZ.
Resources: HZ.
Software: EAPA MAC HZ PL.
Supervision: HZ.
Validation: EAPA MAC HZ PL.
Visualization: EAPA.
Writing – original draft: EAPA MAC HZ PL.
Writing – review & editing: EAPA MAC HZ PL.
References
1. Anter E, Jessup M, Callans DJ. Atrial Fibrillation and Heart Failure Treatment Considerations for a Dual
Epidemic. Circulation. 2009 Dec 5; 119(18):2516–25. doi: 10.1161/CIRCULATIONAHA.108.821306
PMID: 19433768
2. Benjamin EJ, Wolf PA, D’Agostino RB, Silbershatz H, Kannel WB, Levy D. Impact of atrial fibrillation on
the risk of death: the Framingham Heart Study. Circulation. 1998 Sep 8; 98(10):946–52. PMID:
9737513
3. Konings KTS, Smeets JLRM, Penn OC, Wellens HJJ, Allessie MA. Configuration of Unipolar Atrial
Electrograms During Electrically Induced Atrial Fibrillation in Humans. Circulation. 1997 Apr 3; 95
(5):1231–41. PMID: 9054854
4. Narayan SM, Krummen DE, Rappel W-J. Clinical mapping approach to diagnose electrical rotors and
focal impulse sources for human atrial fibrillation. J Cardiovasc Electrophysiol. 2012 May; 23(5):447–
54. doi: 10.1111/j.1540-8167.2012.02332.x PMID: 22537106
5. J J, O B, A S, R M. Mechanisms of atrial fibrillation: mother rotors or multiple daughter wavelets, or
both? J Cardiovasc Electrophysiol. 1998 Aug; 9(8 Suppl):S2–12.
Identify origins of atrial re-entry
PLOS Computational Biology | DOI:10.1371/journal.pcbi.1005270 March 2, 2017 14 / 16

6. Graham I, Atar D, Borch-Johnsen K, Boysen G, Burell G, Cifkova R, et al. European guidelines on car-
diovascular disease prevention in clinical practice: executive summary. Eur Heart J. 2007; 28
(19):2375–414. doi: 10.1093/eurheartj/ehm316 PMID: 17726041
7. Rahman F, Kwan GF, Benjamin EJ. Global epidemiology of atrial fibrillation. Nat Rev Cardiol. 2014; 11
(11):639–54. doi: 10.1038/nrcardio.2014.118 PMID: 25113750
8. Jais P, Shah DC, Hocini M, Macle L, Choi KJ, Haïssaguerre M, et al. Radiofrequency ablation for atrial
fibrillation. Eur Heart J-Suppl. 2003; 5:H34.
9. Wazni OM, Marrouche NF, Martin DO, Verma A, Bhargava M, Saliba W, et al. Radiofrequency ablation
vs antiarrhythmic drugs as first-line treatment of symptomatic atrial fibrillation: a randomized trial. Jama.
2005; 293(21):2634–40. doi: 10.1001/jama.293.21.2634 PMID: 15928285
10. Ganesan AN, Shipp NJ, Brooks AG, Kuklik P, Lau DH, Lim HS, et al. Long-term outcomes of catheter
ablation of atrial fibrillation: a systematic review and meta-analysis. J Am Heart Assoc. 2013 Apr; 2(2):
e004549. doi: 10.1161/JAHA.112.004549 PMID: 23537812
11. Schmitt C, Ndrepepa G, Weber S, Schmieder S, Weyerbrock S, Schneider M, et al. Biatrial multisite
mapping of atrial premature complexes triggering onset of atrial fibrillation. Am J Cardiol. 2002 Jun 15;
89(12):1381–7. PMID: 12062732
12. Rudy Y. Noninvasive Electrocardiographic Imaging of Arrhythmogenic Substrates in Humans. Circ
Res. 2013 Jan 3; 112(5):863–74. doi: 10.1161/CIRCRESAHA.112.279315 PMID: 23449548
13. Anne W, van Rensburg H, Adams J, Ector H, Van de Werf F, Heidbuchel H. Ablation of post-surgical
intra-atrial reentrant tachycardia. Predilection target sites and mapping approach. Eur Heart J. 2002
Oct; 23(20):1609–16. PMID: 12323161
14. Oster HS, Rudy Y. The use of temporal information in the regularization of the inverse problem of
electrocardiography. IEEE Trans Biomed Eng. 1992 Jan; 39(1):65–75. doi: 10.1109/10.108129 PMID:
1572683
15. Uhm J-S, Shim J, Wi J, Mun H-S, Pak H-N, Lee M-H, et al. An electrocardiography algorithm combined
with clinical features could localize the origins of focal atrial tachycardias in adjacent structures. Euro-
pace. 2014 Jul 1; 16(7):1061–8. doi: 10.1093/europace/eut393 PMID: 24381331
16. QIAN Z-Y, HOU X-F, XU D-J, Yang B, CHEN M-L, Chen C, et al. An algorithm to predict the site of origin
of focal atrial tachycardia. Pacing Clin Electrophysiol. 2011; 34(4):414–21. doi: 10.1111/j.1540-8159.
2010.02980.x PMID: 21091746
17. Colman MA, Aslanidi OV, Stott J, Holden AV, Zhang H. Correlation between P-wave morphology and
origin of atrial focal tachycardia—insights from realistic models of the human atria and torso. IEEE
Trans Biomed Eng. 2011 Oct; 58(10):2952–5. doi: 10.1109/TBME.2011.2161305 PMID: 21742568
18. Alday EAP, Colman MA, Langley P, Butters TD, Higham J, Workman AJ, et al. A New Algorithm to
Diagnose Atrial Ectopic Origin from Multi Lead ECG Systems—Insights from 3D Virtual Human Atria
and Torso. PLoS Comput Biol [Internet]. 2015 Jan 22 [cited 2015 Sep 25]; 11(1). Available from: http://
www.ncbi.nlm.nih.gov/pmc/articles/PMC4303377/
19. Perez Alday E, Colman M, Langley P, Zhang H, others. Spatial refinement of a new algorithm to identify
focus of atrial ectopic activity from 64-lead ECGs. In: Computing in Cardiology Conference (CinC), 2014
[Internet]. IEEE; 2014 [cited 2015 Sep 30]. p. 501–4. Available from: http://ieeexplore.ieee.org/xpls/
abs_all.jsp?arnumber=7043089
20. Perez Alday E, Colman MA, Butters TD, Higham J, Giacopelli D, Langley P, et al. Diagnosis of atrial
ectopic origin from the body surface ECG: Insights from 3D virtual human atria and torso. In: Computing
in Cardiology Conference (CinC), 2013 [Internet]. IEEE; 2013 [cited 2015 Sep 25]. p. 1075–8. Available
from: http://ieeexplore.ieee.org/xpls/abs_all.jsp?arnumber=6713567
21. Aslanidi OV, Colman MA, Stott J, Dobrzynski H, Boyett MR, Holden AV, et al. 3D virtual human atria: A
computational platform for studying clinical atrial fibrillation. Prog Biophys Mol Biol. 2011 Oct; 107
(1):156–68. doi: 10.1016/j.pbiomolbio.2011.06.011 PMID: 21762716
22. Colman MA, Aslanidi OV, Kharche S, Boyett MR, Garratt C, Hancox JC, et al. Pro-arrhythmogenic
effects of atrial fibrillation-induced electrical remodelling: insights from the three-dimensional virtual
human atria. J Physiol. 2013 Sep 1; 591(Pt 17):4249–72.
23. Hsu N-W, Lin Y-J, Tai C-T, Kao T, Chang S-L, Wongcharoen W, et al. Frequency analysis of the fibrilla-
tory activity from surface ECG lead V1 and intracardiac recordings: implications for mapping of AF. Eur
Eur Pacing Arrhythm Card Electrophysiol J Work Groups Card Pacing Arrhythm Card Cell Electrophy-
siol Eur Soc Cardiol. 2008 Apr; 10(4):438–43.
24. Biktashev VN, Holden AV. Reentrant waves and their elimination in a model of mammalian ventricular
tissue. Chaos Woodbury N. 1998 Mar; 8(1):48–56.
25. Kharche SR, Stary T, Colman MA, Biktasheva IV, Workman AJ, Rankin AC, et al. Effects of human
atrial ionic remodelling by β-blocker therapy on mechanisms of atrial fibrillation: a computer simulation.
Identify origins of atrial re-entry
PLOS Computational Biology | DOI:10.1371/journal.pcbi.1005270 March 2, 2017 15 / 16

Eur Eur Pacing Arrhythm Card Electrophysiol J Work Groups Card Pacing Arrhythm Card Cell Electro-
physiol Eur Soc Cardiol. 2014 Oct; 16(10):1524–33.
26. Salu Y. Implementing a Consistency Criterion in Numerical Solution of the Bioelectric Forward Problem.
IEEE Trans Biomed Eng. 1980 Jun; BME-27(6):338–41.
27. Giacopelli D, Bourke JP, Murray A, Langley P. Spatial pattern of P waves in paroxysmal atrial fibrillation
patients in sinus rhythm and controls. Pacing Clin Electrophysiol PACE. 2012 Jul; 35(7):819–26. doi:
10.1111/j.1540-8159.2012.03428.x PMID: 22651809
28. Bollmann A, Husser D, Stridh M, Soernmo L, Majic M, Klein HU, et al. Frequency measures obtained
from the surface electrocardiogram in atrial fibrillation research and clinical decision-making. J Cardio-
vasc Electrophysiol. 2003 Oct; 14(10 Suppl):S154–61. PMID: 14760918
29. Scherr D, Dalal D, Cheema A, Cheng A, Henrikson CA, Spragg D, et al. Automated detection and char-
acterization of complex fractionated atrial electrograms in human left atrium during atrial fibrillation.
Heart Rhythm. 2007; 4(8):1013–20. doi: 10.1016/j.hrthm.2007.04.021 PMID: 17675074
30. Ghoraani B, Dalvi R, Gizurarson S, Das M, Ha A, Suszko A, et al. Localized rotational activation in the
left atrium during human atrial fibrillation: relationship to complex fractionated atrial electrograms and
low-voltage zones. Heart Rhythm. 2013; 10(12):1830–8. doi: 10.1016/j.hrthm.2013.09.007 PMID:
24016695
31. Bojarnejad M, Blake JR, Bourke J, Shepherd E, Murray A, Langley P. Non-Invasive Estimation Of Left
Atrial Dominant Frequency In Atrial Fibrillation From Different Electrode Sites: Insight From Body Sur-
face Potential Mapping. JAFIB J Atr Fibrillation [Internet]. 2014 [cited 2015 Sep 30]; 7(3). Available
from: http://www.jafib.com/published/published.php?id=1131&is=previous_issue&f=full&date=2014-
10-31
32. Rodrigo M, Guillem MS, Climent AM, Pedron-Torrecilla J, Liberos A, Millet J, et al. Body surface locali-
zation of left and right atrial high-frequency rotors in atrial fibrillation patients: A clinical-computational
study. Heart Rhythm. 2014; 11(9):1584–91. doi: 10.1016/j.hrthm.2014.05.013 PMID: 24846374
33. Ravelli F, MasèM. Computational mapping in atrial fibrillation: how the integration of signal-derived
maps may guide the localization of critical sources. Europace. 2014; 16(5):714–23. doi: 10.1093/
europace/eut376 PMID: 24798961
34. Lau DH, Maesen B, Zeemering S, Verheule S, Crijns HJ, Schotten U. Stability of complex fractionated
atrial electrograms: a systematic review. J Cardiovasc Electrophysiol. 2012; 23(9):980–7. doi: 10.1111/
j.1540-8167.2012.02335.x PMID: 22554025
35. Stiles MK, Brooks AG, John B, Wilson L, Kuklik P, Dimitri H, et al. The effect of electrogram duration on
quantification of complex fractionated atrial electrograms and dominant frequency. J Cardiovasc Elec-
trophysiol. 2008; 19(3):252–8. doi: 10.1111/j.1540-8167.2007.01034.x PMID: 18302697
36. Kistler PM, Fynn SP, Haqqani H, Stevenson IH, Vohra JK, Morton JB, et al. Focal Atrial Tachycardia
From the Ostium of the Coronary Sinus. J Am Coll Cardiol. 2005 May; 45(9):1488–93. doi: 10.1016/j.
jacc.2005.01.042 PMID: 15862424
37. Guillem MS, Climent AM, Castells F, Husser D, Millet J, Arya A, et al. Noninvasive mapping of human
atrial fibrillation. J Cardiovasc Electrophysiol. 2009; 20(5):507–13. doi: 10.1111/j.1540-8167.2008.
01356.x PMID: 19017334
38. Al-ahmad A. Hands-on Ablation: The Experts’ Approach. 1 edition. Callans D, Hsia HH, Natale A, Oser-
off O, Wang PJ, editors. Cardiotext Publishing; 2013. 520 p.
39. Earley MJ, Showkathali R, Alzetani M, Kistler PM, Gupta D, Abrams DJ, et al. Radiofrequency ablation
of arrhythmias guided by non-fluoroscopic catheter location: a prospective randomized trial. Eur Heart
J. 2006; 27(10):1223–9. doi: 10.1093/eurheartj/ehi834 PMID: 16613932
Identify origins of atrial re-entry
PLOS Computational Biology | DOI:10.1371/journal.pcbi.1005270 March 2, 2017 16 / 16