Embed Size (px)
Citation preview
Journal of Catalysis 286 (2012) 78–87
Contents lists available at SciVerse ScienceDirect
Journal of Catalysis
journal homepage: www.elsevier .com/locate / jcat
Novel PtCuO/CeO2/a-Al2O3 sponge catalysts for the preferential oxidationof CO (PROX) prepared by means of supercritical fluid reactive deposition (SFRD)
Sebastian Lang a, Michael Türk b, Bettina Kraushaar-Czarnetzki a,⇑a Institute of Chemical Process Engineering CVT, Karlsruhe Institute of Technology (KIT, Campus South), Kaiserstrasse 12, D-76128 Karlsruhe, Germanyb Institute for Technical Thermodynamics and Refrigeration, Karlsruhe Institute of Technology (KIT, Campus South), Kaiserstrasse 12, D-76128 Karlsruhe, Germany
a r t i c l e i n f o a b s t r a c t
Article history:Received 29 June 2011Revised 19 October 2011Accepted 19 October 2011Available online 23 November 2011
Keywords:PlatinumCopperCeO2
PROXSFRDCeramic sponges
0021-9517/$ - see front matter � 2011 Elsevier Inc. Adoi:10.1016/j.jcat.2011.10.017
⇑ Corresponding author.E-mail address: [email protected] (B. Kraushaar-C
Ceramic sponges (a-alumina) supporting ceria wash-coats and PtCuO layers of varying compositionswere tested in the preferential oxidation (PROX) of CO in the presence of excess hydrogen. Copper andplatinum were loaded simultaneously on the ceria-coated sponge by means of supercritical fluid reactivedeposition (SFRD) which includes adsorption and reduction of metal-organic complexes dissolved insupercritical CO2. Products were characterized by means of SEM, STEM HAADF, EDX, H2-TPR, CO-TPD,CO2-TPD and N2-adsorption. Catalysts prepared after the SFRD-method exhibit high selectivity. The COoxidation activity roughly correlates with the copper content and is superior as compared to the activityof PROX-catalysts reported in the literature so far.
� 2011 Elsevier Inc. All rights reserved.
1. Introduction
CuO/CeO2-catalysts have many fields of application such as thecombustion of CO and methane [1], the water–gas shift reaction[2–4], the reduction of SO2 by CO [5], reduction of NOx [6] metha-nol synthesis [7], and the wet oxidation of phenol [8]. Most fre-quently they are being investigated as catalysts for thepreferential oxidation of CO in the presence of hydrogen (PROX)[9] for application in the context of a fuel cell economy.
Fuel cells find increasing proliferation due to their high effi-ciency in small scale power generation. In those cases in which fuelcells act as an auxiliary power sources, overall efficiency might befurther increased by not making use of a dedicated hydrogen fueltank, but by utilizing the chemical fuel (i.e., methane, methanol,petrol, diesel, etc.) already at hand and converting it to hydrogen.In this scenario, a reforming of the fuel is followed by a water–gas shift stage to increase the H2-content of the feed. Because theCO-concentration is required to be lower than 10 ppm [10], afurther purification has to be carried out, since this concentrationis below the thermodynamic equilibrium concentration that couldbe reached at water–gas shift temperatures. The most straightfor-ward method to achieve this goal is the preferential oxidation ofCO (PROX). The PROX process is a unit operation step during which
ll rights reserved.
zarnetzki).
CO is selectively oxidized to CO2 while the simultaneous oxidationof H2 is avoided.
It is agreed upon that the dispersion of copper on ceria is thekey parameter to a high catalyst activity [11–13]. In the literature,a multitude of preparation routes for CuO/CeO2-type catalysts hasbeen reported to date. In this present study, we apply supercriticalfluid reactive deposition (SFRD) as a novel method to producehighly dispersed copper (and platinum) particles on a ceriawash-coat. Previously, SFRD has been employed to prepare Pt/SnO2 catalysts with a high dispersion of platinum [14]. The conceptis also employed to create thin metal films for optical and micro-electronic applications [15]. In which case, however, an excess ofthe complexes melting point is sought after in order to create a filmrather than separate particles.
Our method comprises dissolution of suitable metal-organiccomplexes in supercritical CO2, adsorption of the complexes onthe catalyst support, and in situ reduction in the supercriticalstate with dissolved hydrogen. Upon pressure relief, CO2 is vapor-ized and removed together with the organic ligands and residualhydrogen. Because disturbing effects of capillary pressure andgravitation are absent, SFRD is particularly useful to achieve evendistributions of metallic nanoparticles on supports of complexgeometry and/or with fine pores [14,16]. We have chosen cera-mic sponges as catalyst carriers because they combine low pres-sure drop with good heat and mass transfer characteristics[17,18].
S. Lang et al. / Journal of Catalysis 286 (2012) 78–87 79
2. Experimental
2.1. Catalyst preparation
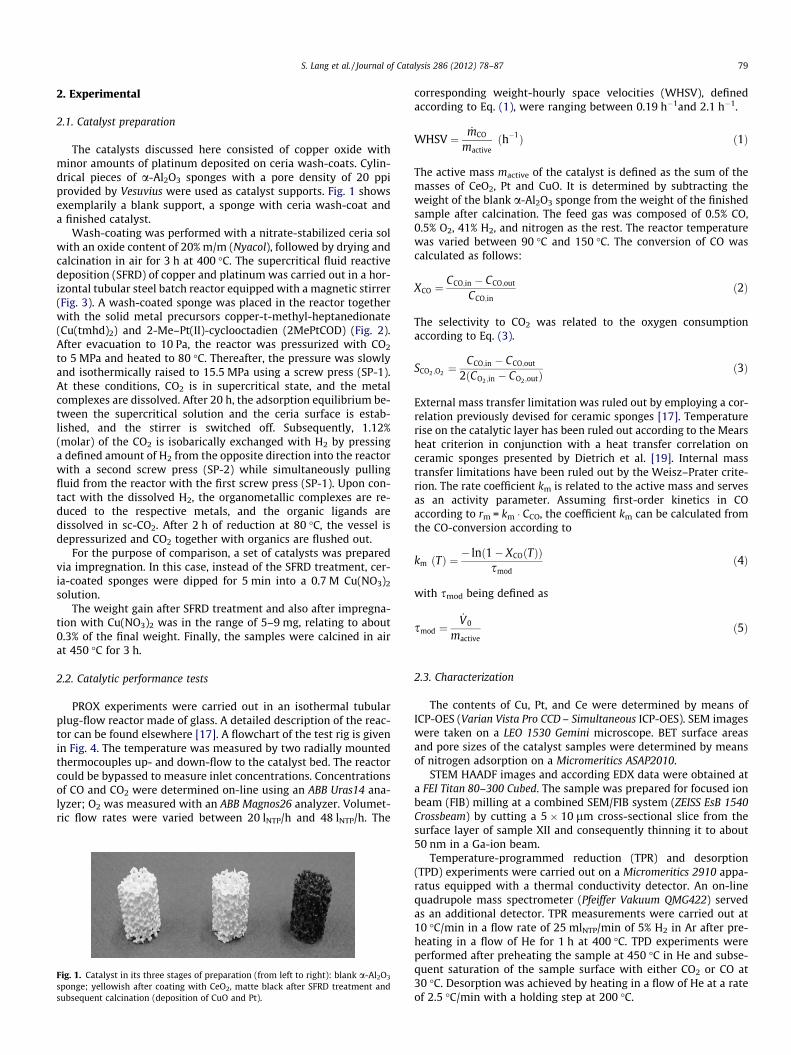
The catalysts discussed here consisted of copper oxide withminor amounts of platinum deposited on ceria wash-coats. Cylin-drical pieces of a-Al2O3 sponges with a pore density of 20 ppiprovided by Vesuvius were used as catalyst supports. Fig. 1 showsexemplarily a blank support, a sponge with ceria wash-coat anda finished catalyst.
Wash-coating was performed with a nitrate-stabilized ceria solwith an oxide content of 20% m/m (Nyacol), followed by drying andcalcination in air for 3 h at 400 �C. The supercritical fluid reactivedeposition (SFRD) of copper and platinum was carried out in a hor-izontal tubular steel batch reactor equipped with a magnetic stirrer(Fig. 3). A wash-coated sponge was placed in the reactor togetherwith the solid metal precursors copper-t-methyl-heptanedionate(Cu(tmhd)2) and 2-Me–Pt(II)-cyclooctadien (2MePtCOD) (Fig. 2).After evacuation to 10 Pa, the reactor was pressurized with CO2
to 5 MPa and heated to 80 �C. Thereafter, the pressure was slowlyand isothermically raised to 15.5 MPa using a screw press (SP-1).At these conditions, CO2 is in supercritical state, and the metalcomplexes are dissolved. After 20 h, the adsorption equilibrium be-tween the supercritical solution and the ceria surface is estab-lished, and the stirrer is switched off. Subsequently, 1.12%(molar) of the CO2 is isobarically exchanged with H2 by pressinga defined amount of H2 from the opposite direction into the reactorwith a second screw press (SP-2) while simultaneously pullingfluid from the reactor with the first screw press (SP-1). Upon con-tact with the dissolved H2, the organometallic complexes are re-duced to the respective metals, and the organic ligands aredissolved in sc-CO2. After 2 h of reduction at 80 �C, the vessel isdepressurized and CO2 together with organics are flushed out.
For the purpose of comparison, a set of catalysts was preparedvia impregnation. In this case, instead of the SFRD treatment, cer-ia-coated sponges were dipped for 5 min into a 0.7 M Cu(NO3)2
solution.The weight gain after SFRD treatment and also after impregna-
tion with Cu(NO3)2 was in the range of 5–9 mg, relating to about0.3% of the final weight. Finally, the samples were calcined in airat 450 �C for 3 h.
2.2. Catalytic performance tests
PROX experiments were carried out in an isothermal tubularplug-flow reactor made of glass. A detailed description of the reac-tor can be found elsewhere [17]. A flowchart of the test rig is givenin Fig. 4. The temperature was measured by two radially mountedthermocouples up- and down-flow to the catalyst bed. The reactorcould be bypassed to measure inlet concentrations. Concentrationsof CO and CO2 were determined on-line using an ABB Uras14 ana-lyzer; O2 was measured with an ABB Magnos26 analyzer. Volumet-ric flow rates were varied between 20 lNTP/h and 48 lNTP/h. The
Fig. 1. Catalyst in its three stages of preparation (from left to right): blank a-Al2O3
sponge; yellowish after coating with CeO2, matte black after SFRD treatment andsubsequent calcination (deposition of CuO and Pt).
corresponding weight-hourly space velocities (WHSV), definedaccording to Eq. (1), were ranging between 0.19 h�1and 2.1 h�1.
WHSV ¼_mCO
mactiveðh�1Þ ð1Þ
The active mass mactive of the catalyst is defined as the sum of themasses of CeO2, Pt and CuO. It is determined by subtracting theweight of the blank a-Al2O3 sponge from the weight of the finishedsample after calcination. The feed gas was composed of 0.5% CO,0.5% O2, 41% H2, and nitrogen as the rest. The reactor temperaturewas varied between 90 �C and 150 �C. The conversion of CO wascalculated as follows:
XCO ¼CCO;in � CCO;out
CCO;inð2Þ
The selectivity to CO2 was related to the oxygen consumptionaccording to Eq. (3).
SCO2 ;O2 ¼CCO;in � CCO;out
2ðCO2 ;in � CO2 ;outÞð3Þ
External mass transfer limitation was ruled out by employing a cor-relation previously devised for ceramic sponges [17]. Temperaturerise on the catalytic layer has been ruled out according to the Mearsheat criterion in conjunction with a heat transfer correlation onceramic sponges presented by Dietrich et al. [19]. Internal masstransfer limitations have been ruled out by the Weisz–Prater crite-rion. The rate coefficient km is related to the active mass and servesas an activity parameter. Assuming first-order kinetics in COaccording to rm = km � CCO, the coefficient km can be calculated fromthe CO-conversion according to
km ðTÞ ¼� lnð1� XCOðTÞÞ
smodð4Þ
with smod being defined as
smod ¼_V0
mactiveð5Þ
2.3. Characterization
The contents of Cu, Pt, and Ce were determined by means ofICP-OES (Varian Vista Pro CCD – Simultaneous ICP-OES). SEM imageswere taken on a LEO 1530 Gemini microscope. BET surface areasand pore sizes of the catalyst samples were determined by meansof nitrogen adsorption on a Micromeritics ASAP2010.
STEM HAADF images and according EDX data were obtained ata FEI Titan 80–300 Cubed. The sample was prepared for focused ionbeam (FIB) milling at a combined SEM/FIB system (ZEISS EsB 1540Crossbeam) by cutting a 5 � 10 lm cross-sectional slice from thesurface layer of sample XII and consequently thinning it to about50 nm in a Ga-ion beam.
Temperature-programmed reduction (TPR) and desorption(TPD) experiments were carried out on a Micromeritics 2910 appa-ratus equipped with a thermal conductivity detector. An on-linequadrupole mass spectrometer (Pfeiffer Vakuum QMG422) servedas an additional detector. TPR measurements were carried out at10 �C/min in a flow rate of 25 mlNTP/min of 5% H2 in Ar after pre-heating in a flow of He for 1 h at 400 �C. TPD experiments wereperformed after preheating the sample at 450 �C in He and subse-quent saturation of the sample surface with either CO2 or CO at30 �C. Desorption was achieved by heating in a flow of He at a rateof 2.5 �C/min with a holding step at 200 �C.
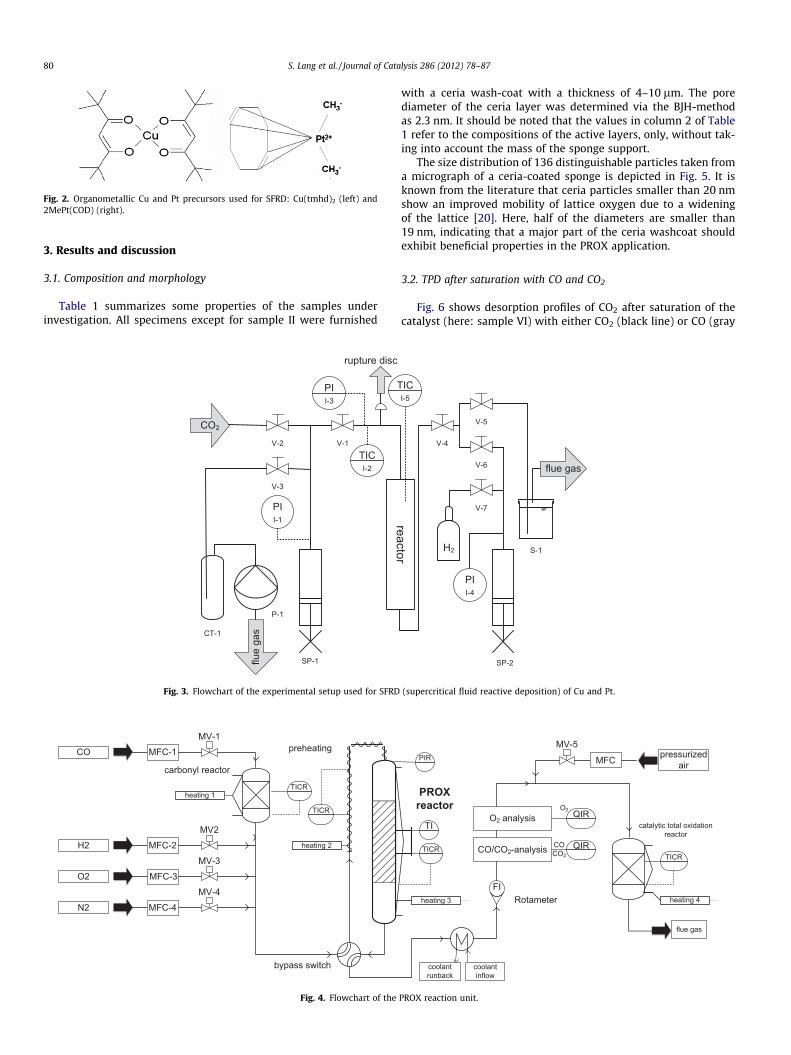
Fig. 2. Organometallic Cu and Pt precursors used for SFRD: Cu(tmhd)2 (left) and2MePt(COD) (right).
80 S. Lang et al. / Journal of Catalysis 286 (2012) 78–87
3. Results and discussion
3.1. Composition and morphology
Table 1 summarizes some properties of the samples underinvestigation. All specimens except for sample II were furnished
Fig. 4. Flowchart of the
CT-1
reactor
V-1V-2
V-3
I-1PI
CO2
I-2TIC
I-3PI
rupture disc
SP-1
P-1
flue
gas
T
Fig. 3. Flowchart of the experimental setup used for SFRD
with a ceria wash-coat with a thickness of 4–10 lm. The porediameter of the ceria layer was determined via the BJH-methodas 2.3 nm. It should be noted that the values in column 2 of Table1 refer to the compositions of the active layers, only, without tak-ing into account the mass of the sponge support.
The size distribution of 136 distinguishable particles taken froma micrograph of a ceria-coated sponge is depicted in Fig. 5. It isknown from the literature that ceria particles smaller than 20 nmshow an improved mobility of lattice oxygen due to a wideningof the lattice [20]. Here, half of the diameters are smaller than19 nm, indicating that a major part of the ceria washcoat shouldexhibit beneficial properties in the PROX application.
3.2. TPD after saturation with CO and CO2
Fig. 6 shows desorption profiles of CO2 after saturation of thecatalyst (here: sample VI) with either CO2 (black line) or CO (gray
PROX reaction unit.
V-4
V-5
V-6
V-7
H2 S-1
SP-2
I-4PI
flue gas
I-5IC
(supercritical fluid reactive deposition) of Cu and Pt.
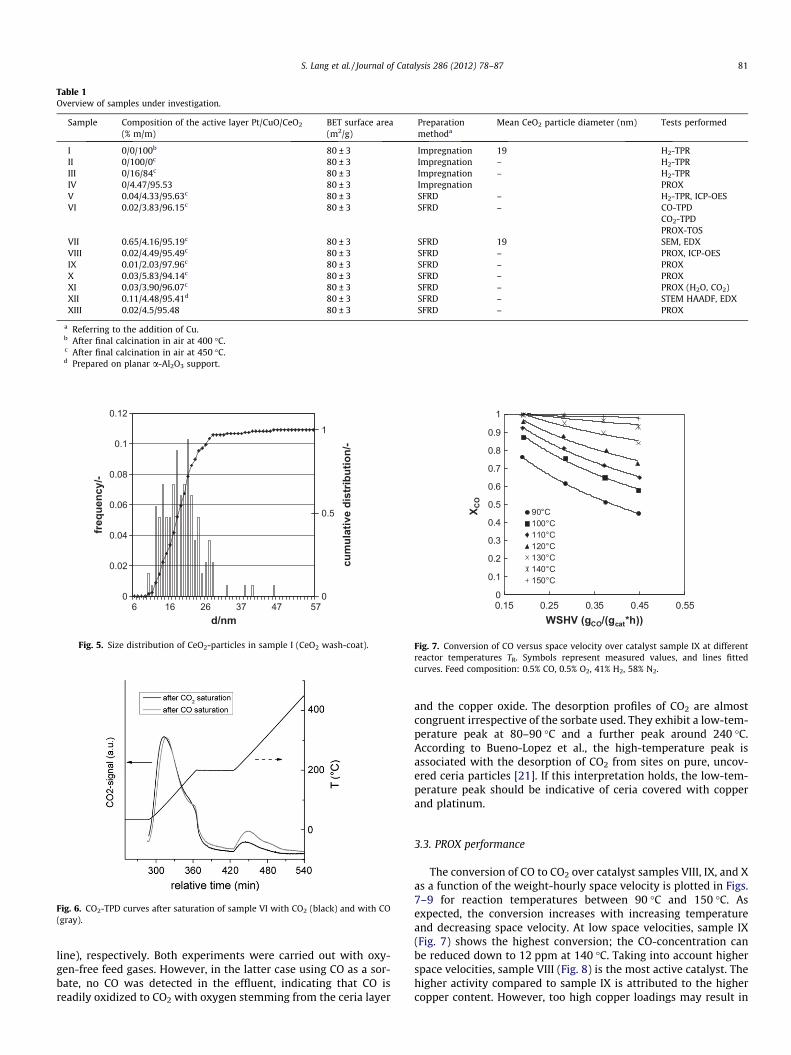
Table 1Overview of samples under investigation.
Sample Composition of the active layer Pt/CuO/CeO2
(% m/m)BET surface area(m2/g)
Preparationmethoda
Mean CeO2 particle diameter (nm) Tests performed
I 0/0/100b 80 ± 3 Impregnation 19 H2-TPRII 0/100/0c 80 ± 3 Impregnation – H2-TPRIII 0/16/84c 80 ± 3 Impregnation – H2-TPRIV 0/4.47/95.53 80 ± 3 Impregnation PROXV 0.04/4.33/95.63c 80 ± 3 SFRD – H2-TPR, ICP-OESVI 0.02/3.83/96.15c 80 ± 3 SFRD – CO-TPD
CO2-TPDPROX-TOS
VII 0.65/4.16/95.19c 80 ± 3 SFRD 19 SEM, EDXVIII 0.02/4.49/95.49c 80 ± 3 SFRD – PROX, ICP-OESIX 0.01/2.03/97.96c 80 ± 3 SFRD – PROXX 0.03/5.83/94.14c 80 ± 3 SFRD – PROXXI 0.03/3.90/96.07c 80 ± 3 SFRD – PROX (H2O, CO2)XII 0.11/4.48/95.41d 80 ± 3 SFRD – STEM HAADF, EDXXIII 0.02/4.5/95.48 80 ± 3 SFRD – PROX
a Referring to the addition of Cu.b After final calcination in air at 400 �C.c After final calcination in air at 450 �C.d Prepared on planar a-Al2O3 support.
0
0.02
0.04
0.06
0.08
0.1
0.12
6 16 26 37 47 57d/nm
freq
uenc
y/-
0
0.5
1
cum
ulat
ive
dist
ribut
ion/
-
Fig. 5. Size distribution of CeO2-particles in sample I (CeO2 wash-coat).
Fig. 6. CO2-TPD curves after saturation of sample VI with CO2 (black) and with CO(gray).
0
0.1
0.2
0.3
0.4
0.5
0.6
0.7
0.8
0.9
1
0.15 0.25 0.35 0.45 0.55WSHV (gCO/(gcat*h))
X CO
90°C100°C110°C120°C130°C140°C150°C
Fig. 7. Conversion of CO versus space velocity over catalyst sample IX at differentreactor temperatures TR. Symbols represent measured values, and lines fittedcurves. Feed composition: 0.5% CO, 0.5% O2, 41% H2, 58% N2.
S. Lang et al. / Journal of Catalysis 286 (2012) 78–87 81
line), respectively. Both experiments were carried out with oxy-gen-free feed gases. However, in the latter case using CO as a sor-bate, no CO was detected in the effluent, indicating that CO isreadily oxidized to CO2 with oxygen stemming from the ceria layer
and the copper oxide. The desorption profiles of CO2 are almostcongruent irrespective of the sorbate used. They exhibit a low-tem-perature peak at 80–90 �C and a further peak around 240 �C.According to Bueno-Lopez et al., the high-temperature peak isassociated with the desorption of CO2 from sites on pure, uncov-ered ceria particles [21]. If this interpretation holds, the low-tem-perature peak should be indicative of ceria covered with copperand platinum.
3.3. PROX performance
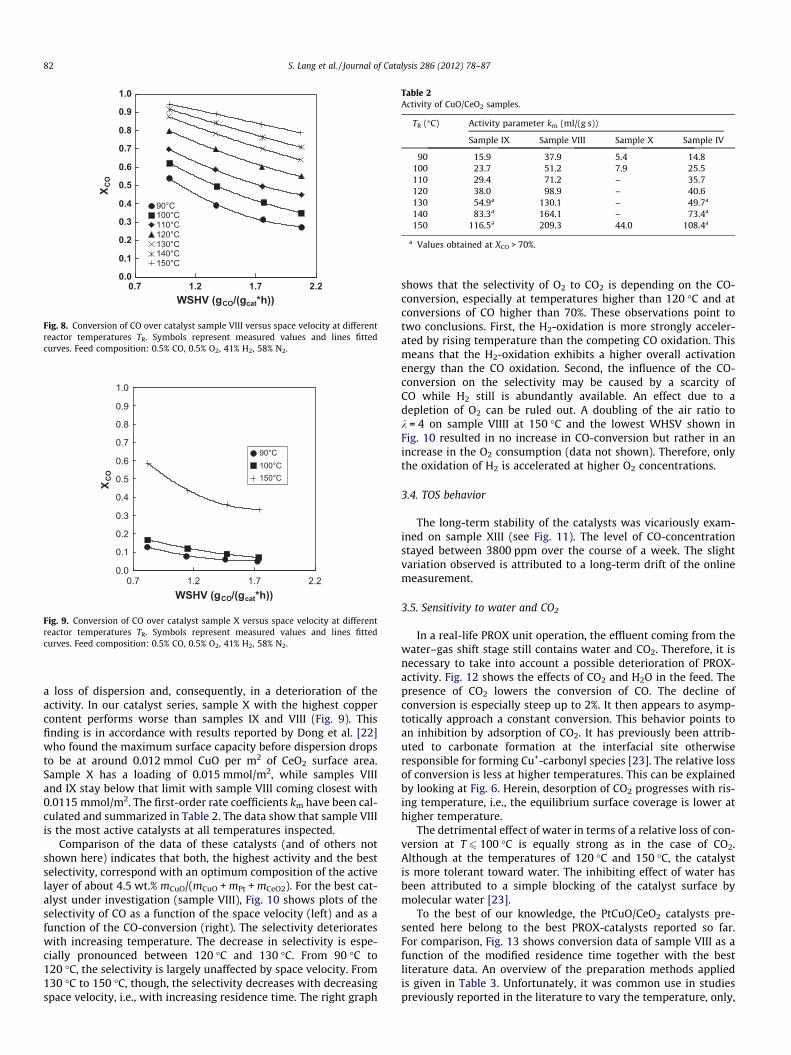
The conversion of CO to CO2 over catalyst samples VIII, IX, and Xas a function of the weight-hourly space velocity is plotted in Figs.7–9 for reaction temperatures between 90 �C and 150 �C. Asexpected, the conversion increases with increasing temperatureand decreasing space velocity. At low space velocities, sample IX(Fig. 7) shows the highest conversion; the CO-concentration canbe reduced down to 12 ppm at 140 �C. Taking into account higherspace velocities, sample VIII (Fig. 8) is the most active catalyst. Thehigher activity compared to sample IX is attributed to the highercopper content. However, too high copper loadings may result in
0.0
0.1
0.2
0.3
0.4
0.5
0.6
0.7
0.8
0.9
1.0
0.7 1.2 1.7 2.2WSHV (gCO/(gcat*h))
X CO
90°C100°C110°C120°C130°C140°C150°C
Fig. 8. Conversion of CO over catalyst sample VIII versus space velocity at differentreactor temperatures TR. Symbols represent measured values and lines fittedcurves. Feed composition: 0.5% CO, 0.5% O2, 41% H2, 58% N2.
0.0
0.1
0.2
0.3
0.4
0.5
0.6
0.7
0.8
0.9
1.0
0.7 1.2 1.7 2.2WSHV (gCO/(gcat*h))
XC
O
90°C100°C150°C
Fig. 9. Conversion of CO over catalyst sample X versus space velocity at differentreactor temperatures TR. Symbols represent measured values and lines fittedcurves. Feed composition: 0.5% CO, 0.5% O2, 41% H2, 58% N2.
Table 2Activity of CuO/CeO2 samples.
TR (�C) Activity parameter km (ml/(g s))
Sample IX Sample VIII Sample X Sample IV
90 15.9 37.9 5.4 14.8100 23.7 51.2 7.9 25.5110 29.4 71.2 – 35.7120 38.0 98.9 – 40.6130 54.9a 130.1 – 49.7a
140 83.3a 164.1 – 73.4a
150 116.5a 209.3 44.0 108.4a
a Values obtained at XCO > 70%.
82 S. Lang et al. / Journal of Catalysis 286 (2012) 78–87
a loss of dispersion and, consequently, in a deterioration of theactivity. In our catalyst series, sample X with the highest coppercontent performs worse than samples IX and VIII (Fig. 9). Thisfinding is in accordance with results reported by Dong et al. [22]who found the maximum surface capacity before dispersion dropsto be at around 0.012 mmol CuO per m2 of CeO2 surface area.Sample X has a loading of 0.015 mmol/m2, while samples VIIIand IX stay below that limit with sample VIII coming closest with0.0115 mmol/m2. The first-order rate coefficients km have been cal-culated and summarized in Table 2. The data show that sample VIIIis the most active catalysts at all temperatures inspected.
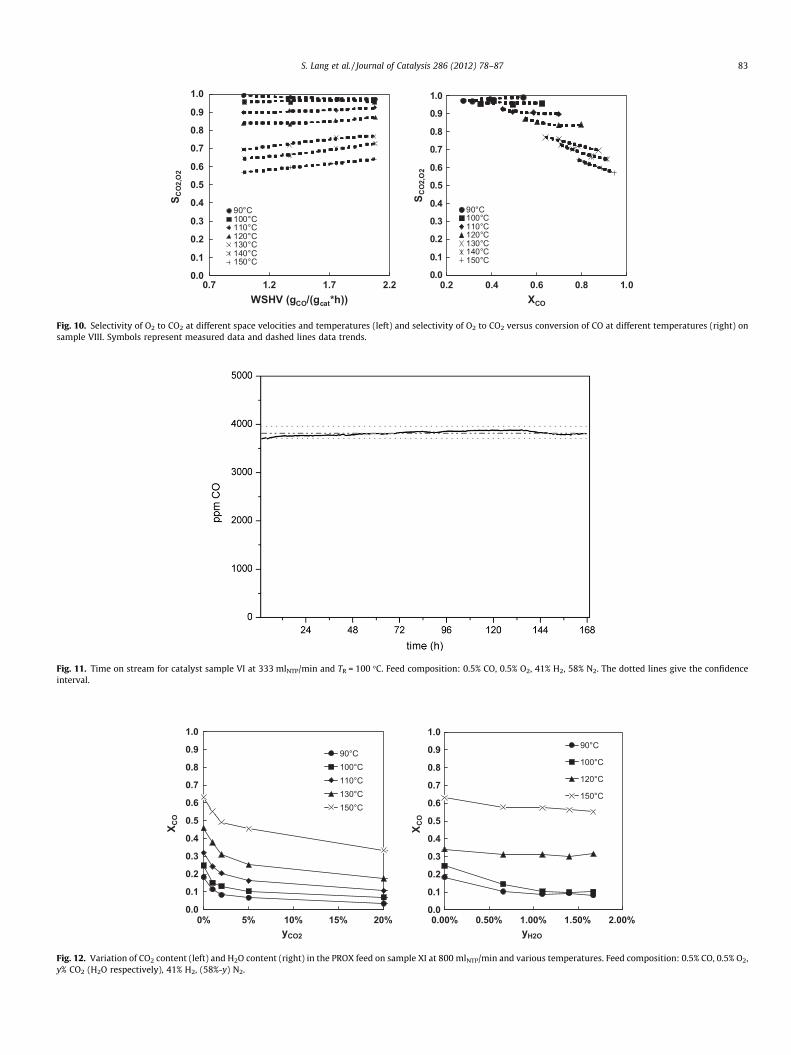
Comparison of the data of these catalysts (and of others notshown here) indicates that both, the highest activity and the bestselectivity, correspond with an optimum composition of the activelayer of about 4.5 wt.% mCuO/(mCuO + mPt + mCeO2). For the best cat-alyst under investigation (sample VIII), Fig. 10 shows plots of theselectivity of CO as a function of the space velocity (left) and as afunction of the CO-conversion (right). The selectivity deteriorateswith increasing temperature. The decrease in selectivity is espe-cially pronounced between 120 �C and 130 �C. From 90 �C to120 �C, the selectivity is largely unaffected by space velocity. From130 �C to 150 �C, though, the selectivity decreases with decreasingspace velocity, i.e., with increasing residence time. The right graph
shows that the selectivity of O2 to CO2 is depending on the CO-conversion, especially at temperatures higher than 120 �C and atconversions of CO higher than 70%. These observations point totwo conclusions. First, the H2-oxidation is more strongly acceler-ated by rising temperature than the competing CO oxidation. Thismeans that the H2-oxidation exhibits a higher overall activationenergy than the CO oxidation. Second, the influence of the CO-conversion on the selectivity may be caused by a scarcity ofCO while H2 still is abundantly available. An effect due to adepletion of O2 can be ruled out. A doubling of the air ratio tok = 4 on sample VIIII at 150 �C and the lowest WHSV shown inFig. 10 resulted in no increase in CO-conversion but rather in anincrease in the O2 consumption (data not shown). Therefore, onlythe oxidation of H2 is accelerated at higher O2 concentrations.
3.4. TOS behavior
The long-term stability of the catalysts was vicariously exam-ined on sample XIII (see Fig. 11). The level of CO-concentrationstayed between 3800 ppm over the course of a week. The slightvariation observed is attributed to a long-term drift of the onlinemeasurement.
3.5. Sensitivity to water and CO2
In a real-life PROX unit operation, the effluent coming from thewater–gas shift stage still contains water and CO2. Therefore, it isnecessary to take into account a possible deterioration of PROX-activity. Fig. 12 shows the effects of CO2 and H2O in the feed. Thepresence of CO2 lowers the conversion of CO. The decline ofconversion is especially steep up to 2%. It then appears to asymp-totically approach a constant conversion. This behavior points toan inhibition by adsorption of CO2. It has previously been attrib-uted to carbonate formation at the interfacial site otherwiseresponsible for forming Cu+-carbonyl species [23]. The relative lossof conversion is less at higher temperatures. This can be explainedby looking at Fig. 6. Herein, desorption of CO2 progresses with ris-ing temperature, i.e., the equilibrium surface coverage is lower athigher temperature.
The detrimental effect of water in terms of a relative loss of con-version at T 6 100 �C is equally strong as in the case of CO2.Although at the temperatures of 120 �C and 150 �C, the catalystis more tolerant toward water. The inhibiting effect of water hasbeen attributed to a simple blocking of the catalyst surface bymolecular water [23].
To the best of our knowledge, the PtCuO/CeO2 catalysts pre-sented here belong to the best PROX-catalysts reported so far.For comparison, Fig. 13 shows conversion data of sample VIII as afunction of the modified residence time together with the bestliterature data. An overview of the preparation methods appliedis given in Table 3. Unfortunately, it was common use in studiespreviously reported in the literature to vary the temperature, only,
0.0
0.1
0.2
0.3
0.4
0.5
0.6
0.7
0.8
0.9
1.0
0.2 0.4 0.6 0.8 1.0XCO
S CO
2,O
2
90°C100°C110°C120°C130°C140°C150°C
0.0
0.1
0.2
0.3
0.4
0.5
0.6
0.7
0.8
0.9
1.0
0.7 1.2 1.7 2.2WSHV (gCO/(gcat*h))
S CO
2,O
2
90°C100°C110°C120°C130°C140°C150°C
Fig. 10. Selectivity of O2 to CO2 at different space velocities and temperatures (left) and selectivity of O2 to CO2 versus conversion of CO at different temperatures (right) onsample VIII. Symbols represent measured data and dashed lines data trends.
Fig. 11. Time on stream for catalyst sample VI at 333 mlNTP/min and TR = 100 �C. Feed composition: 0.5% CO, 0.5% O2, 41% H2, 58% N2. The dotted lines give the confidenceinterval.
0.0
0.1
0.2
0.3
0.4
0.5
0.6
0.7
0.8
0.9
1.0
0% 5% 10% 15% 20%yCO2
X CO
90°C100°C110°C130°C150°C
0.0
0.1
0.2
0.3
0.4
0.5
0.6
0.7
0.8
0.9
1.0
0.00% 0.50% 1.00% 1.50% 2.00%yH2O
X CO
90°C
100°C
120°C
150°C
Fig. 12. Variation of CO2 content (left) and H2O content (right) in the PROX feed on sample XI at 800 mlNTP/min and various temperatures. Feed composition: 0.5% CO, 0.5% O2,y% CO2 (H2O respectively), 41% H2, (58%-y) N2.
S. Lang et al. / Journal of Catalysis 286 (2012) 78–87 83
Avgouropoulos100°C
Liu100°C
Schönbrod110°C
Schönbrod130°C
Tada 100°C
Razeghi 100°C
Ayastuy 100°C
Ayastuy 90°C
Gurbani100°C
Sedmak100°C Tada 90°C
Tada 90°C
Tada 100°C
0.0
0.1
0.2
0.3
0.4
0.5
0.6
0.7
0.8
0.9
1.0
0.00 0.05 0.10 0.15 0.20τmod ((g*s)/mlNTP)
X CO
(-)
90°C
100°C
110°C
130°C
Fig. 13. Conversion of CO versus modified residence time over PtCuO/CeO2 (thiswork, sample VIII, black symbols) and over CuO/CeO2 catalysts reported in theliterature (gray symbols). Symbols represent measured data; lines stem from a first-order fit of the kinetics over our own catalyst (sample VIII). Feed composition: 0.5%CO, 0.5% O2, 41% H2, 58% N2.
Table 3Overview of catalysts and preparation methods applied by other authors (perfor-mances are compared in Fig. 13).
Author Composition mCuO/(mCuO + mCeO2)a (%)
Preparation method
Avgouropoulos andIoannides [24]
6.44 Combustion method
Ayastuy et al. [25] 6.8 Wet impregnation/monolith
Gurbani et al. [12] 8.61 Deposition precipitationLiu et al. [26] 12.75 Urea gelation/co-
precipitation (UGC)Razeghi et al. [27] 5 Co-precipitationSchönbrod et al. [28] 10.36 Co-precipitated ureaSedmak et al. [29] 4.89 Sol–gel peroxo routeTada et al. [30] 7.34 CETAB
a Calculated from literature under the assumption of fully oxidized copper andcerium.
0.0
0.1
0.2
0.3
0.4
0.5
0.6
0.7
0.80.9
1.0
0.00 0.02 0.04 0.06 0.08 0.10τmod (g*s/mlNTP)
XC
O (-
)
Fig. 14. Comparison of CO-conversion on catalysts VIII (black) and IV (gray) at100 �C (squares) and 110 �C (diamonds), respectively. Also shown are modeledconversions at both temperatures on catalyst IV for a simple first-order reactionrate (dashed lines).
Fig. 15. Formation of water as a function of the reduction temperature upon TPRwith H2 of sponge samples coated with (I) pure CeO2 (sample I), (II) wet chemicallyprepared CuO (sample II), (III) wet chemically prepared CuO/CeO2 (sample III) and(IV) SFRD-prepared PtCuO/CeO2 (sample V).
0.0
0.5
1.0
1.5
2.0
2.5
3.0
3.5
4.0
4.5
II III IV
n H2/m
CuO
(10
-2m
ol/g
)
nH2/nCuO = 1
Fig. 16. Amount of H2 consumed by H2-TPR depicted in Fig. 15 related to the CuOmass of the samples. The dashed line shows the stochiometric maximum. For thesake of comparability only H2-consumption in the temperature range between50 �C and 360 �C was taken into account.
84 S. Lang et al. / Journal of Catalysis 286 (2012) 78–87
while the residence time was fixed, or to adjust the residence timessuch that full conversion was achieved. As a result, the literaturedata plotted in Fig. 13 cover a different regime of residence times
than our own data. Nevertheless, it can be seen that our sample VIIIis very active, while only the catalyst reported by Gurbani et al.[12] showed a slightly higher activity at 100 �C. This high activityis attributed to a high dispersion of copper of 87%. Extrapolationof the kinetic fit toward higher residence times – as shown inFig. 13 through the dotted parts of the lines – gives an indicationof the conversion differences in the complete range of residence
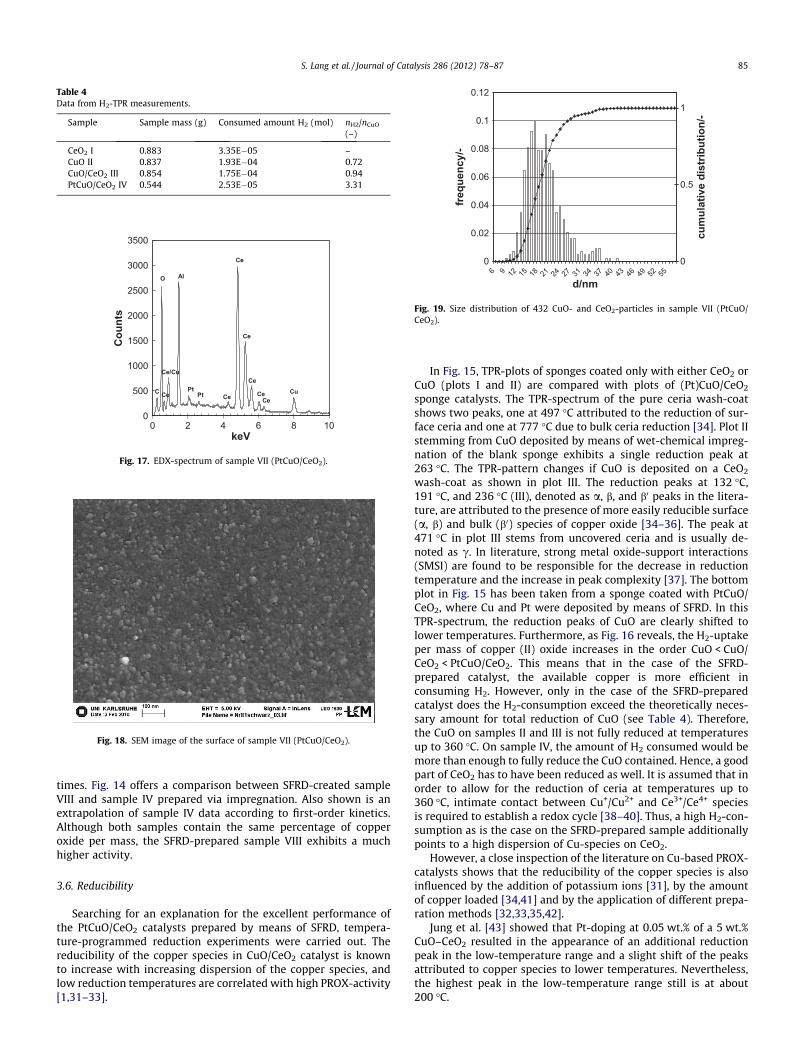
Table 4Data from H2-TPR measurements.
Sample Sample mass (g) Consumed amount H2 (mol) nH2/nCuO
(–)
CeO2 I 0.883 3.35E�05 –CuO II 0.837 1.93E�04 0.72CuO/CeO2 III 0.854 1.75E�04 0.94PtCuO/CeO2 IV 0.544 2.53E�05 3.31
0
500
1000
1500
2000
2500
3000
3500
0 2 4 6 8 10keV
Cou
nts
C PtCe
O
Ce/Cu
Al
Pt
CeCe
Ce
Ce
Ce
CeCu
Fig. 17. EDX-spectrum of sample VII (PtCuO/CeO2).
Fig. 18. SEM image of the surface of sample VII (PtCuO/CeO2).
0
0.02
0.04
0.06
0.08
0.1
0.12
6 9 12 15 18 21 24 27 31 34 37 40 43 46 49 52 55
d/nm
freq
uenc
y/-
0
0.5
1
cum
ulat
ive
dist
ribut
ion/
-
Fig. 19. Size distribution of 432 CuO- and CeO2-particles in sample VII (PtCuO/CeO2).
S. Lang et al. / Journal of Catalysis 286 (2012) 78–87 85
times. Fig. 14 offers a comparison between SFRD-created sampleVIII and sample IV prepared via impregnation. Also shown is anextrapolation of sample IV data according to first-order kinetics.Although both samples contain the same percentage of copperoxide per mass, the SFRD-prepared sample VIII exhibits a muchhigher activity.
3.6. Reducibility
Searching for an explanation for the excellent performance ofthe PtCuO/CeO2 catalysts prepared by means of SFRD, tempera-ture-programmed reduction experiments were carried out. Thereducibility of the copper species in CuO/CeO2 catalyst is knownto increase with increasing dispersion of the copper species, andlow reduction temperatures are correlated with high PROX-activity[1,31–33].
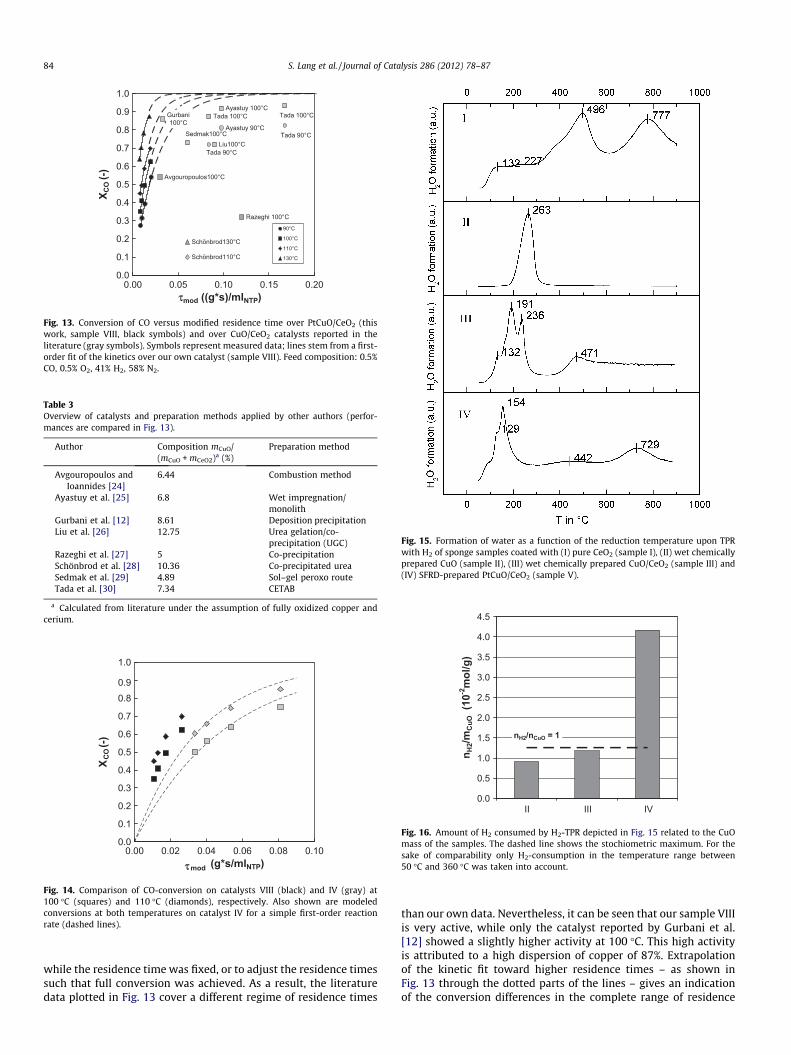
In Fig. 15, TPR-plots of sponges coated only with either CeO2 orCuO (plots I and II) are compared with plots of (Pt)CuO/CeO2
sponge catalysts. The TPR-spectrum of the pure ceria wash-coatshows two peaks, one at 497 �C attributed to the reduction of sur-face ceria and one at 777 �C due to bulk ceria reduction [34]. Plot IIstemming from CuO deposited by means of wet-chemical impreg-nation of the blank sponge exhibits a single reduction peak at263 �C. The TPR-pattern changes if CuO is deposited on a CeO2
wash-coat as shown in plot III. The reduction peaks at 132 �C,191 �C, and 236 �C (III), denoted as a, b, and b0 peaks in the litera-ture, are attributed to the presence of more easily reducible surface(a, b) and bulk (b0) species of copper oxide [34–36]. The peak at471 �C in plot III stems from uncovered ceria and is usually de-noted as c. In literature, strong metal oxide-support interactions(SMSI) are found to be responsible for the decrease in reductiontemperature and the increase in peak complexity [37]. The bottomplot in Fig. 15 has been taken from a sponge coated with PtCuO/CeO2, where Cu and Pt were deposited by means of SFRD. In thisTPR-spectrum, the reduction peaks of CuO are clearly shifted tolower temperatures. Furthermore, as Fig. 16 reveals, the H2-uptakeper mass of copper (II) oxide increases in the order CuO < CuO/CeO2 < PtCuO/CeO2. This means that in the case of the SFRD-prepared catalyst, the available copper is more efficient inconsuming H2. However, only in the case of the SFRD-preparedcatalyst does the H2-consumption exceed the theoretically neces-sary amount for total reduction of CuO (see Table 4). Therefore,the CuO on samples II and III is not fully reduced at temperaturesup to 360 �C. On sample IV, the amount of H2 consumed would bemore than enough to fully reduce the CuO contained. Hence, a goodpart of CeO2 has to have been reduced as well. It is assumed that inorder to allow for the reduction of ceria at temperatures up to360 �C, intimate contact between Cu+/Cu2+ and Ce3+/Ce4+ speciesis required to establish a redox cycle [38–40]. Thus, a high H2-con-sumption as is the case on the SFRD-prepared sample additionallypoints to a high dispersion of Cu-species on CeO2.
However, a close inspection of the literature on Cu-based PROX-catalysts shows that the reducibility of the copper species is alsoinfluenced by the addition of potassium ions [31], by the amountof copper loaded [34,41] and by the application of different prepa-ration methods [32,33,35,42].
Jung et al. [43] showed that Pt-doping at 0.05 wt.% of a 5 wt.%CuO–CeO2 resulted in the appearance of an additional reductionpeak in the low-temperature range and a slight shift of the peaksattributed to copper species to lower temperatures. Nevertheless,the highest peak in the low-temperature range still is at about200 �C.
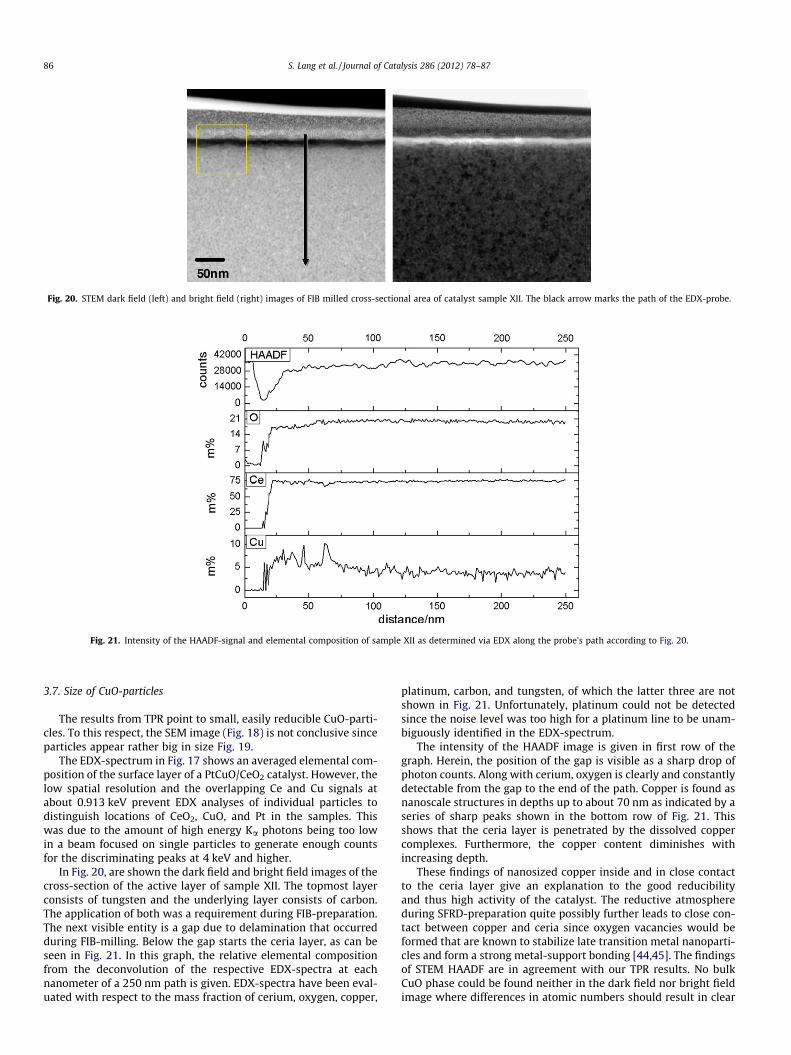
Fig. 20. STEM dark field (left) and bright field (right) images of FIB milled cross-sectional area of catalyst sample XII. The black arrow marks the path of the EDX-probe.
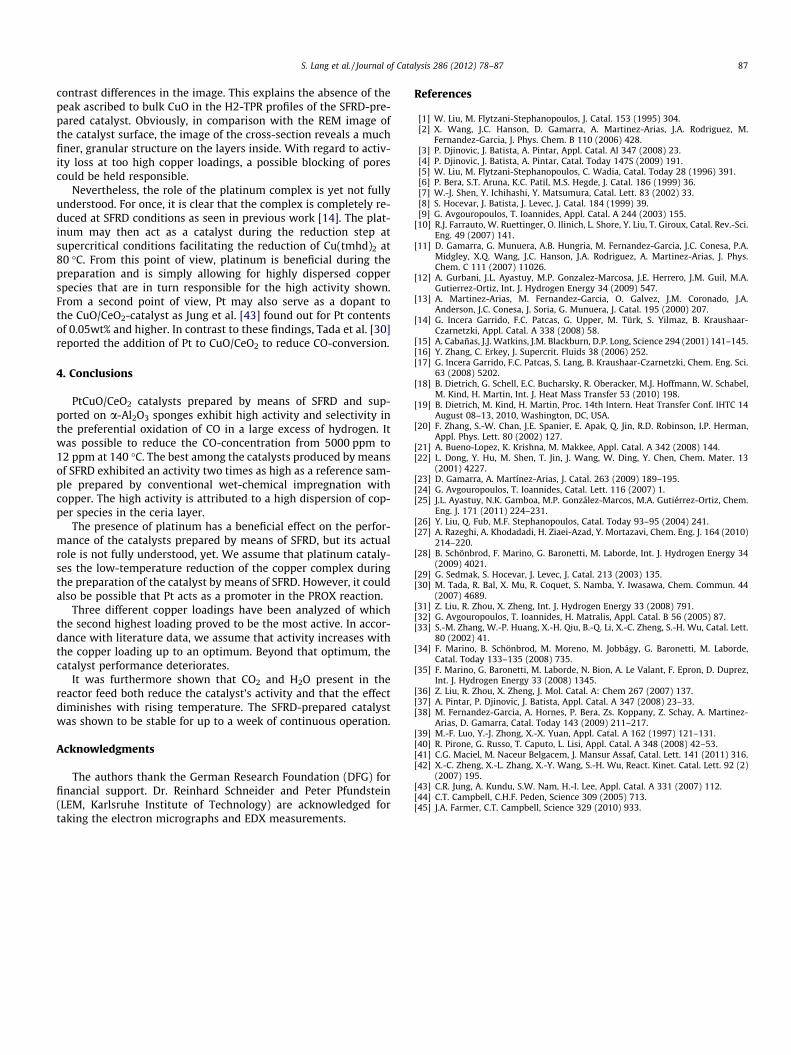
Fig. 21. Intensity of the HAADF-signal and elemental composition of sample XII as determined via EDX along the probe’s path according to Fig. 20.
86 S. Lang et al. / Journal of Catalysis 286 (2012) 78–87
3.7. Size of CuO-particles
The results from TPR point to small, easily reducible CuO-parti-cles. To this respect, the SEM image (Fig. 18) is not conclusive sinceparticles appear rather big in size Fig. 19.
The EDX-spectrum in Fig. 17 shows an averaged elemental com-position of the surface layer of a PtCuO/CeO2 catalyst. However, thelow spatial resolution and the overlapping Ce and Cu signals atabout 0.913 keV prevent EDX analyses of individual particles todistinguish locations of CeO2, CuO, and Pt in the samples. Thiswas due to the amount of high energy Ka photons being too lowin a beam focused on single particles to generate enough countsfor the discriminating peaks at 4 keV and higher.
In Fig. 20, are shown the dark field and bright field images of thecross-section of the active layer of sample XII. The topmost layerconsists of tungsten and the underlying layer consists of carbon.The application of both was a requirement during FIB-preparation.The next visible entity is a gap due to delamination that occurredduring FIB-milling. Below the gap starts the ceria layer, as can beseen in Fig. 21. In this graph, the relative elemental compositionfrom the deconvolution of the respective EDX-spectra at eachnanometer of a 250 nm path is given. EDX-spectra have been eval-uated with respect to the mass fraction of cerium, oxygen, copper,
platinum, carbon, and tungsten, of which the latter three are notshown in Fig. 21. Unfortunately, platinum could not be detectedsince the noise level was too high for a platinum line to be unam-biguously identified in the EDX-spectrum.
The intensity of the HAADF image is given in first row of thegraph. Herein, the position of the gap is visible as a sharp drop ofphoton counts. Along with cerium, oxygen is clearly and constantlydetectable from the gap to the end of the path. Copper is found asnanoscale structures in depths up to about 70 nm as indicated by aseries of sharp peaks shown in the bottom row of Fig. 21. Thisshows that the ceria layer is penetrated by the dissolved coppercomplexes. Furthermore, the copper content diminishes withincreasing depth.
These findings of nanosized copper inside and in close contactto the ceria layer give an explanation to the good reducibilityand thus high activity of the catalyst. The reductive atmosphereduring SFRD-preparation quite possibly further leads to close con-tact between copper and ceria since oxygen vacancies would beformed that are known to stabilize late transition metal nanoparti-cles and form a strong metal-support bonding [44,45]. The findingsof STEM HAADF are in agreement with our TPR results. No bulkCuO phase could be found neither in the dark field nor bright fieldimage where differences in atomic numbers should result in clear
S. Lang et al. / Journal of Catalysis 286 (2012) 78–87 87
contrast differences in the image. This explains the absence of thepeak ascribed to bulk CuO in the H2-TPR profiles of the SFRD-pre-pared catalyst. Obviously, in comparison with the REM image ofthe catalyst surface, the image of the cross-section reveals a muchfiner, granular structure on the layers inside. With regard to activ-ity loss at too high copper loadings, a possible blocking of porescould be held responsible.
Nevertheless, the role of the platinum complex is yet not fullyunderstood. For once, it is clear that the complex is completely re-duced at SFRD conditions as seen in previous work [14]. The plat-inum may then act as a catalyst during the reduction step atsupercritical conditions facilitating the reduction of Cu(tmhd)2 at80 �C. From this point of view, platinum is beneficial during thepreparation and is simply allowing for highly dispersed copperspecies that are in turn responsible for the high activity shown.From a second point of view, Pt may also serve as a dopant tothe CuO/CeO2-catalyst as Jung et al. [43] found out for Pt contentsof 0.05wt% and higher. In contrast to these findings, Tada et al. [30]reported the addition of Pt to CuO/CeO2 to reduce CO-conversion.
4. Conclusions
PtCuO/CeO2 catalysts prepared by means of SFRD and sup-ported on a-Al2O3 sponges exhibit high activity and selectivity inthe preferential oxidation of CO in a large excess of hydrogen. Itwas possible to reduce the CO-concentration from 5000 ppm to12 ppm at 140 �C. The best among the catalysts produced by meansof SFRD exhibited an activity two times as high as a reference sam-ple prepared by conventional wet-chemical impregnation withcopper. The high activity is attributed to a high dispersion of cop-per species in the ceria layer.
The presence of platinum has a beneficial effect on the perfor-mance of the catalysts prepared by means of SFRD, but its actualrole is not fully understood, yet. We assume that platinum cataly-ses the low-temperature reduction of the copper complex duringthe preparation of the catalyst by means of SFRD. However, it couldalso be possible that Pt acts as a promoter in the PROX reaction.
Three different copper loadings have been analyzed of whichthe second highest loading proved to be the most active. In accor-dance with literature data, we assume that activity increases withthe copper loading up to an optimum. Beyond that optimum, thecatalyst performance deteriorates.
It was furthermore shown that CO2 and H2O present in thereactor feed both reduce the catalyst’s activity and that the effectdiminishes with rising temperature. The SFRD-prepared catalystwas shown to be stable for up to a week of continuous operation.
Acknowledgments
The authors thank the German Research Foundation (DFG) forfinancial support. Dr. Reinhard Schneider and Peter Pfundstein(LEM, Karlsruhe Institute of Technology) are acknowledged fortaking the electron micrographs and EDX measurements.
References
[1] W. Liu, M. Flytzani-Stephanopoulos, J. Catal. 153 (1995) 304.[2] X. Wang, J.C. Hanson, D. Gamarra, A. Martinez-Arias, J.A. Rodriguez, M.
Fernandez-Garcia, J. Phys. Chem. B 110 (2006) 428.[3] P. Djinovic, J. Batista, A. Pintar, Appl. Catal. Al 347 (2008) 23.[4] P. Djinovic, J. Batista, A. Pintar, Catal. Today 147S (2009) 191.[5] W. Liu, M. Flytzani-Stephanopoulos, C. Wadia, Catal. Today 28 (1996) 391.[6] P. Bera, S.T. Aruna, K.C. Patil, M.S. Hegde, J. Catal. 186 (1999) 36.[7] W.-J. Shen, Y. Ichihashi, Y. Matsumura, Catal. Lett. 83 (2002) 33.[8] S. Hocevar, J. Batista, J. Levec, J. Catal. 184 (1999) 39.[9] G. Avgouropoulos, T. Ioannides, Appl. Catal. A 244 (2003) 155.
[10] R.J. Farrauto, W. Ruettinger, O. Ilinich, L. Shore, Y. Liu, T. Giroux, Catal. Rev.-Sci.Eng. 49 (2007) 141.
[11] D. Gamarra, G. Munuera, A.B. Hungria, M. Fernandez-Garcia, J.C. Conesa, P.A.Midgley, X.Q. Wang, J.C. Hanson, J.A. Rodriguez, A. Martinez-Arias, J. Phys.Chem. C 111 (2007) 11026.
[12] A. Gurbani, J.L. Ayastuy, M.P. Gonzalez-Marcosa, J.E. Herrero, J.M. Guil, M.A.Gutierrez-Ortiz, Int. J. Hydrogen Energy 34 (2009) 547.
[13] A. Martinez-Arias, M. Fernandez-Garcia, O. Galvez, J.M. Coronado, J.A.Anderson, J.C. Conesa, J. Soria, G. Munuera, J. Catal. 195 (2000) 207.
[14] G. Incera Garrido, F.C. Patcas, G. Upper, M. Türk, S. Yilmaz, B. Kraushaar-Czarnetzki, Appl. Catal. A 338 (2008) 58.
[15] A. Cabañas, J.J. Watkins, J.M. Blackburn, D.P. Long, Science 294 (2001) 141–145.[16] Y. Zhang, C. Erkey, J. Supercrit. Fluids 38 (2006) 252.[17] G. Incera Garrido, F.C. Patcas, S. Lang, B. Kraushaar-Czarnetzki, Chem. Eng. Sci.
63 (2008) 5202.[18] B. Dietrich, G. Schell, E.C. Bucharsky, R. Oberacker, M.J. Hoffmann, W. Schabel,
M. Kind, H. Martin, Int. J. Heat Mass Transfer 53 (2010) 198.[19] B. Dietrich, M. Kind, H. Martin, Proc. 14th Intern. Heat Transfer Conf. IHTC 14
August 08–13, 2010, Washington, DC, USA.[20] F. Zhang, S.-W. Chan, J.E. Spanier, E. Apak, Q. Jin, R.D. Robinson, I.P. Herman,
Appl. Phys. Lett. 80 (2002) 127.[21] A. Bueno-Lopez, K. Krishna, M. Makkee, Appl. Catal. A 342 (2008) 144.[22] L. Dong, Y. Hu, M. Shen, T. Jin, J. Wang, W. Ding, Y. Chen, Chem. Mater. 13
(2001) 4227.[23] D. Gamarra, A. Martínez-Arias, J. Catal. 263 (2009) 189–195.[24] G. Avgouropoulos, T. Ioannides, Catal. Lett. 116 (2007) 1.[25] J.L. Ayastuy, N.K. Gamboa, M.P. González-Marcos, M.A. Gutiérrez-Ortiz, Chem.
Eng. J. 171 (2011) 224–231.[26] Y. Liu, Q. Fub, M.F. Stephanopoulos, Catal. Today 93–95 (2004) 241.[27] A. Razeghi, A. Khodadadi, H. Ziaei-Azad, Y. Mortazavi, Chem. Eng. J. 164 (2010)
214–220.[28] B. Schönbrod, F. Marino, G. Baronetti, M. Laborde, Int. J. Hydrogen Energy 34
(2009) 4021.[29] G. Sedmak, S. Hocevar, J. Levec, J. Catal. 213 (2003) 135.[30] M. Tada, R. Bal, X. Mu, R. Coquet, S. Namba, Y. Iwasawa, Chem. Commun. 44
(2007) 4689.[31] Z. Liu, R. Zhou, X. Zheng, Int. J. Hydrogen Energy 33 (2008) 791.[32] G. Avgouropoulos, T. Ioannides, H. Matralis, Appl. Catal. B 56 (2005) 87.[33] S.-M. Zhang, W.-P. Huang, X.-H. Qiu, B.-Q. Li, X.-C. Zheng, S.-H. Wu, Catal. Lett.
80 (2002) 41.[34] F. Marino, B. Schönbrod, M. Moreno, M. Jobbágy, G. Baronetti, M. Laborde,
Catal. Today 133–135 (2008) 735.[35] F. Marino, G. Baronetti, M. Laborde, N. Bion, A. Le Valant, F. Epron, D. Duprez,
Int. J. Hydrogen Energy 33 (2008) 1345.[36] Z. Liu, R. Zhou, X. Zheng, J. Mol. Catal. A: Chem 267 (2007) 137.[37] A. Pintar, P. Djinovic, J. Batista, Appl. Catal. A 347 (2008) 23–33.[38] M. Fernandez-Garcia, A. Hornes, P. Bera, Zs. Koppany, Z. Schay, A. Martinez-
Arias, D. Gamarra, Catal. Today 143 (2009) 211–217.[39] M.-F. Luo, Y.-J. Zhong, X.-X. Yuan, Appl. Catal. A 162 (1997) 121–131.[40] R. Pirone, G. Russo, T. Caputo, L. Lisi, Appl. Catal. A 348 (2008) 42–53.[41] C.G. Maciel, M. Naceur Belgacem, J. Mansur Assaf, Catal. Lett. 141 (2011) 316.[42] X.-C. Zheng, X.-L. Zhang, X.-Y. Wang, S.-H. Wu, React. Kinet. Catal. Lett. 92 (2)
(2007) 195.[43] C.R. Jung, A. Kundu, S.W. Nam, H.-I. Lee, Appl. Catal. A 331 (2007) 112.[44] C.T. Campbell, C.H.F. Peden, Science 309 (2005) 713.[45] J.A. Farmer, C.T. Campbell, Science 329 (2010) 933.


![Cocina Práctica - Todo Con Pollo Edición de Bolsillo [Sfrd]](https://img.pdfslide.net/doc/110x75/55cf8dec550346703b8ca746/cocina-practica-todo-con-pollo-edicion-de-bolsillo-sfrd.jpg)


![Año Cero - Contactos extraterrestres en la Biblia [Diciembre 2012][Sfrd]](https://img.pdfslide.net/doc/110x75/577cdab21a28ab9e78a649a8/ano-cero-contactos-extraterrestres-en-la-biblia-diciembre-2012sfrd.jpg)

![1 REVISTA Integral.enero.2009.Sfrd[1]](https://img.pdfslide.net/doc/110x75/557213da497959fc0b932dc1/1-revista-integralenero2009sfrd1.jpg)

![Harper's Bazaar [Mexico][Enero][2011][Sfrd]](https://img.pdfslide.net/doc/110x75/563db963550346aa9a9cda05/harpers-bazaar-mexicoenero2011sfrd.jpg)
![Cocina Fácil - 65 Recetas Para Lucirte Octubre 2014 [Sfrd]](https://img.pdfslide.net/doc/110x75/55cf8d145503462b1391f4c8/cocina-facil-65-recetas-para-lucirte-octubre-2014-sfrd.jpg)


![La astrologia en los manuscritos medievales - Sophie Page [Sfrd]](https://img.pdfslide.net/doc/110x75/5571f97f49795991698fb67d/la-astrologia-en-los-manuscritos-medievales-sophie-page-sfrd.jpg)

![Harper's Bazaar Mexico [Febrero][2011][Sfrd]](https://img.pdfslide.net/doc/110x75/563db963550346aa9a9cd969/harpers-bazaar-mexico-febrero2011sfrd.jpg)