Embed Size (px)
Citation preview

Novel single chain cAMP sensors for receptor-induced
signal propagation
Viacheslav O. Nikolaev, Moritz Bünemann, Lutz Hein, Annette Hannawacker &
Martin J. Lohse
Institute of Pharmacology and Toxicology, University of Würzburg, Versbacherstr. 9,
D-97078 Würzburg, Germany
phone +49 – 931 – 201 48400 fax +49 – 931 – 201 48411
email: lohse @ toxi.uni-wuerzburg.de
Running title: cAMP imaging with novel Epac-based sensors
JBC Papers in Press. Published on July 1, 2004 as Manuscript C400302200
Copyright 2004 by The American Society for Biochemistry and Molecular Biology, Inc.
by guest on February 14, 2018http://w
ww
.jbc.org/D
ownloaded from

cAMP imaging with novel Epac-based sensors 2
Summary
Cyclic adenosine monophosphate (cAMP) is a universal second messenger of many G-
protein-coupled receptors and regulates a wide variety of cellular events. cAMP exerts its
effects via cAMP-dependent protein kinase (PKA), cAMP-gated ion channels and two
isoforms of exchange protein directly activated by cAMP (Epac). Here we report the
development of novel fluorescent indicators for cAMP based on the cAMP-binding domains
of Epac and PKA. Fluorescence resonance energy transfer (FRET) between variants of green
fluorescent protein (ECFP and EYFP) fused directly to the cAMP-binding domains was used
to analyze spatial and temporal aspects of cAMP-signaling in different cells. In contrast to
previously developed PKA-based indicators, these probes are comprised of only a single
binding site lacking cooperativity, catalytic properties and interactions with other proteins and
thereby allow to easily image free intracellular cAMP and rapid signaling events. Rapid b-
adrenergic receptor-induced cAMP-signals were observed to travel with high speed (≈40
µm/s) throughout the entire cell body of hippocampal neurons and peritoneal macrophages.
The developed indicators could be ubiquitously applied to studying cAMP, its physiological
role and spatio-temporal regulation.
by guest on February 14, 2018http://w
ww
.jbc.org/D
ownloaded from

cAMP imaging with novel Epac-based sensors 3
Introduction
The second messenger cyclic adenosine monophosphate (cAMP)1 was discovered in the early
1950s, and since then its cellular function and regulation have been gaining increased interest
over the last half a century (1). cAMP is a ubiquitous second messenger and regulates a wide
variety of cellular events and biological processes from metabolism and gene expression (2),
cell division (3) and migration (4), exocytosis (5) and insulin secretion (6) to immune defense
(7), memory formation (8) and cardiac contractility (9). A few years ago new avenues for
cAMP research have been opened up by discovery of exchange protein directly activated by
cAMP (Epac), which in addition to cAMP-dependent protein kinase (PKA) represents an
important intracellular effector for cAMP and appears to account for many of its effects (10).
Further cAMP-binding proteins such as cyclic nucleotide-gated ion channels (9) and
neuropathy target esterase (11) have been identified, demonstrating functional heterogeneity
of signaling by this second messenger.
Fluorescence resonance energy transfer (FRET) between variants of green fluorescent protein
(GFP) or rhodamine and fluorescein fused to the regulatory and catalytic subunits of PKA has
been described for cAMP-imaging (12-15). cAMP-induced dissociation of the subunits results
in loss of FRET, which has been used to study the spatio-temporal dynamics of cAMP in
neurons (13, 14) and cardiac myocytes (15). Because PKA has a complex mechanism of
activation (cooperative cAMP-binding to four interconnected sites of different affinities) (16)
as well as potent regulatory functions in cells, we sought to develop simpler sensors based on
individual cAMP-binding domains lacking catalytic properties and cooperative binding.
Fusing single binding domains of PKA and Epac with GFP variants we obtained several
highly sensitive cAMP-sensors, which give new insights into spatio-temporal and regulatory
patterns of receptor-mediated responses of this second messenger.
by guest on February 14, 2018http://w
ww
.jbc.org/D
ownloaded from

cAMP imaging with novel Epac-based sensors 4
Experimental procedures
Construction of fluorescent cAMP indicators. The DNA-constructs encoding for cAMP-
sensing proteins were generated by PCR using human Epac1 (Acc.No. AF103905), murine
Epac2 (AF115480) or murine PKA regulatory type IIb subunit (M12492) cDNA as a
template. GFP-variants were amplified with standard primers from pEYFP- and pECFP
plasmids (Clontech) and cloned into pcDNA3 vector (Invitrogen) for transient expression in
mammalian cells (see Fig. 1A for structural details). For fluorescent protein purification, the
Epac2-camps cDNA was cloned into pVL1393 vector (Invitrogen) and a sequence encoding
for a hexa-histidine tag was inserted directly on the N-terminus. The protein was expressed in
Sf9 cells using the baculovirus system (Baculogold, Pharmingen) and purified using a
standard Ni-agarose method (Qiagen) with 5 mM Tris-HCl (pH = 7.4) for washing and a 0-
100 mM imidazol gradient for elution.
Cell culture. CHO cells stably expressing adenosine A2B-receptors, TsA201 and HEK293-
cells stably expressing b1- or b2-adrenergic receptors were maintained in DMEM/F12 (37 °C,
5 % CO2) or DMEM (37 °C, 7 % CO2) medium, respectively, plated onto 24 mm glass
coverslips for imaging experiments or 90 mm Petri dishes for cuvette fluorometric
measurements and transfected with 3 µg or 30 µg, resp., DNA for each construct using the
calcium phosphate method. Peritoneal macrophages were isolated from 10-12 week old
FVB/N mice as described (17), resuspended in PBS and immediately transfected by
electroporation using Gene Pulser (BioRad) at 250 V, 500 µF, seeded onto 24 mm glass
coverslips and maintained in RPMI 1640 medium (37 °C, 5 % CO2). Primary dissociated
mouse hippocampus neurons were isolated from neonatal (P1) C57BL/6 mice and cultured as
described previously with some modifications (18). Hippocampi were dissociated by
incubation for 20 min in Tyrode’s solution containing ispase (GibcoBRL, Eggenstein,
Germany), collagenase and desoxyribonuclease I (Sigma, Deisenhofen, Germany). Primary
neurons were transiently transfected with the Nucleofector system (Amaxa, Köln, Germany).
Briefly, 3-4 x 10⁶ freshly dissociated cells were electroporated with 3-5 µg plasmid DNA and
cells were plated on poly-L-lysine and Matrigel-coated (Becton-Dickinson, Heidelberg,
by guest on February 14, 2018http://w
ww
.jbc.org/D
ownloaded from

cAMP imaging with novel Epac-based sensors 5
Germany) glass slides in Neurobasal-A medium for 3-5 days. 18 hrs after transfection, 5 µM
cytosine arabinoside was added to prevent proliferation of glial cells. All animal procedures
were approved by the responsible university and government authorities (protocol No. 621-
2531.01-10/98).
FRET measurements and cell imaging. For fluorescent microscopy glass coverslips with
adherent cells were transferred to the experimental chamber in buffer A (144 mM NaCl, 5
mM KCl, 2 mM CaCl2, 1 mM MgCl2, 20 mM HEPES, pH = 7.3) at room temperature and
placed on a Zeiss Axiovert 200 inverted microscope equipped with an oil immersion 63x
Plan-Neofluar objective, a dual-emission (480/535 nm) photometric system (Till Photonics,
Planegg, Germany) and a CoolSNAP-HQ CCD-camera (Visitron Systems, Puchheim,
Germany). Samples were excited with a light from a polychrome IV (Till Photonics). FRET
was monitored using MetaFluor 5.0 software (Visitron Systems) as the emission ratio at 535 ±
20 nm and 480 ± 15 nm upon excitation at 436 ± 10 nm (beam splitter 505 DCXR). The
imaging data were analyzed with MetaMorph 5.0 (Visitron Systems) and Origin (Microcal,
Amherst, MA) software, corrected for spillover of CFP into the 535 nm channel, direct YFP-
excitation and acceptor photobleaching to give a corrected YFP/CFP-ratio. To study agonist-
induced changes in FRET, cells were continuously superfused with buffer A plus agonists
(adenosine or isoprenaline, Sigma). For local stimulation of a cell, patch pipettes (Harvard
Apparatus, Edenbridge, UK) filled with the respective agonists were accurately positioned
onto the plasma membrane by a manipulator (Patchman, Eppendorf, Germany). To avoid free
agonist diffusion along the membrane, cells were continuously superfused with laminar flow
of buffer A in the direction opposite to the pipette. Photometric experiments were performed
as previously described (19).
Fluorescence measurements in vitro. TsA201 cells 24 h post-transfection were washed
thrice with chilled PBS, scraped from the plate and resuspended in 5 mM Tris-HCl, 2 mM
EDTA, pH = 7.3. After disruption with an Ultraturrax device for 40s on ice and 20 min
centrifugation at 80,000 rpm, fluorescence emission spectra of the supernatant (excitation at
436 nm, emission range 460-550 nm) were measured with a fluorescence spectrometer
by guest on February 14, 2018http://w
ww
.jbc.org/D
ownloaded from

cAMP imaging with novel Epac-based sensors 6
LS50B (Perkin Elmer) before and after adding various concentrations of cAMP, cGMP, AMP
or ATP (Sigma). Purified proteins from Sf9 cells were diluted prior to measurements in the
same buffer to 40 nM final concentration. cAMP-saturation curves were plotted using
KaleidaGraph 3.0.5 software (Abelbeck).
Results
Development of novel fluorescent cAMP indicators. Several fusion proteins were generated
that contained a single or both cAMP-binding domains of Epac1, Epac2 or PKA regulatory
bII-subunit fused to GFP-variants at different positions (Fig. 1A). Based on structural data for
cAMP-binding to Epac2 (20) we hypothesized that positioning of YFP and CFP directly on
a-helices H4 and a6:B, encompassing the cAMP-binding domain B of Epac2, might lead to a
change in distance between the fluorophores due to a cAMP-induced conformational switch
(Fig. 1B). We obtained a fusion protein termed Epac2-camps (for cAMP Sensor) exhibiting
FRET that decreased upon addition of receptor-cAMP (Fig. 1C) – compatible with an
increased distance of the CFP- and YFP-moieties as deduced from structural predictions of
the cAMP-induced conformational change (see arrow in Fig. 1B). This decrease in FRET in
response to cAMP was specific since fluorometric measurements in vitro using Epac2-camps
purified from Sf9 cells further demonstrated that other nucleotides were recognized only
weakly (e.g. AMP>10 mM, ATP 2.5 ± 0.4 mM, cGMP 10.6 ± 0.4 µM). Using this
experimental system we sought to compare the novel system with the previously developed
PKA-based approach (12). Measuring activation of purified proteins in vitro, we observed a
lower speed of cAMP-induced PKA-complex dissociation, which was even slower in the
presence of lower cAMP-concentrations, whereas the Epac2-camps was switched on much
more rapidly at all cAMP-concentrations with kinetics faster than our experimental setup
allowed to resolve (0.5 Hz sampling rate; Fig. 1D,E). This demonstrates higher temporal
resolution of the new single-domain sensor.
by guest on February 14, 2018http://w
ww
.jbc.org/D
ownloaded from

cAMP imaging with novel Epac-based sensors 7
FRET measurements in living cells. In order to monitor agonist-induced cAMP-
accumulation in living cells (CHO, COS7, HEK293) we transfected them with Epac2-camps.
FRET between the CFP and YFP moieties was confirmed both by ratiometric measurements
(Fig. 2A) and by acceptor photobleaching resulting in 15.5 ± 1.6% donor dequenching (n=4,
not shown). Stimulation of adenylyl cyclase with adenosine in CHO-cells stably expressing
adenosine A2B-receptors (CHO-A2B) and transiently transfected with Epac2-camps led to a
decrease in the FRET signal, reflecting a rise in intracellular cAMP (Fig. 2A). A direct
comparison of Epac2-camps with the tetrameric PKA-system (12) uncovered that Epac2-
camps reacted to adenylyl cyclase stimulation much more rapidly (Fig. 2B) in accordance
with the faster activation kinetics of the new indicator observed in vitro (Fig. 1C,D).
Comparison of the in vitro kinetics and the kinetics in intact cells reveals that the response of
the Epac-based sensor may be limited by the kinetics of cAMP production whereas the
tetrameric PKA sensor is limited by primarily by activation kinetics of the sensor itself
(binding of 4 cAMP and subsequent subunit dissociation).
Having shown that a single cAMP-binding domain is sufficient to generate a conformational
change detectable by FRET, we optimized the position of fluorophore insertion using again
the CHO-A2B cells and stimulation with adenosine (Fig. 1A,2C). We next generated similar
sensors using the cAMP-binding domains of Epac1 and PKA regulatory bII-subunit (see Fig.
1A,B). These constructs, termed Epac1-camps and PKA-camps, respectively, likewise
displayed cAMP-induced changes in FRET but had slightly (≈2.5-fold) lower affinities for
cAMP (Fig. 2D), which correspond well with binding data for single domains of Epac1 and 2
(21). These results support the concept of a common mechanism of ligand-induced
conformational change for cAMP-binding proteins (10, 21). FRET-measurements in single
cells stably expressing b1-adrenergic receptors (HEK-b1AR) further demonstrated similar
activation properties of Epac1-, 2- and PKA-camps (Fig. 2E), but revealed a significantly
larger signal amplitude and activation speed for Epac1-camps, which was, therefore, used in
all further assays.
Imaging experiments with Epac1-camps were then done to view the spatial properties of
intracellular cAMP-signals. Expression of Epac1-camps in individual CHO-A2B-cells (Fig.
by guest on February 14, 2018http://w
ww
.jbc.org/D
ownloaded from

cAMP imaging with novel Epac-based sensors 8
2F) and other cells showed uniform distribution throughout the cytosol (as judged from
simple YFP-fluorescence), which is presumably due to the fact that the sensor contains only
the cAMP-binding domain of Epac. Ratiometric imaging allowed the determination of FRET
and stimulation of A2B-receptors with adenosine caused a decrease in the FRET-signal
throughout the cells (Fig. 2F).
Rapid gradients of cAMP. It has been argued over decades, whether cAMP acts in cells as a
freely diffusing second messenger or whether such signals are more localized (22). PKA-
dependent b2-adrenergic receptor mediated stimulation of L-type Ca-channels in primary
hippocampal neurons (23) as well as PKA activation in cardiac myocytes (15) has been
suggested to occur in spatially restricted signaling complexes. To assess the spatio-temporal
aspects of cAMP-induced Epac signaling we transfected primary hippocampal neurons with
Epac1-camps. The Epac1-camps expressing cells were then stimulated with the b-adrenergic
agonist isoprenaline (50 nM) delivered locally with a patch pipette under constant perfusion
in the opposite direction in order to prevent agonist diffusion on the cell surface (see
Experimental procedures). This local stimulation resulted in a rapidly spreading change in the
FRET-signal, reflecting a rise in cAMP propagating from the site of stimulation through the
whole neuron on the scale of a few hundred milliseconds (Fig. 2A; Supplementary Movie 1).
Rapidly spreading cAMP-signals were also observed with Epac1-camps in other cells,
including mouse peritoneal macrophages stimulated locally with isoprenaline (Fig. 2B). In
CHO-A2B-cells, as well as in PC12-cells with endogenous adenosine A2A-receptors (24)
similar spatial patterns of cAMP-responses to adenosine were observed (not shown).
Measuring these rapidly propagating FRET-changes in many cells enabled us to calculate the
speed of the cAMP-gradient in neurons. To do so, we fitted the FRET-signals in different
regions of the cell (Fig. 2A) to a first-order exponential function and defined the intersection
of the fit with the baseline as the time of activation. The speed of the cAMP-gradients after
local stimulation with 50 nM isoprenaline was calculated at almost 40 µm/s, from which a
diffusion coefficient at 487 ± 23 µm2/s was derived. This is much faster than previously
described for cells stimulated with neurotransmitters (14). For example, in lobster
by guest on February 14, 2018http://w
ww
.jbc.org/D
ownloaded from

cAMP imaging with novel Epac-based sensors 9
somatogastric neurons microinjected with fluorescently labeled tetrameric PKA, receptor-
mediated cAMP-gradients took many seconds to reach distant parts of the cell (14). These
differences are due to the different sensor speeds (see Figs. 1D,E and 2B), since transfecting
hippocampal neurons with the tetrameric PKA-sensor (12, 15) revealed a speed of cAMP-
propagation (even at 1 µM isoprenaline, Fig. 3C) that was ≈20-fold slower than that recorded
with Epac1-camps (Fig. 3D). The speed of cAMP-propagation measured with Epac1-camps
corresponds well with those estimated for cAMP using patch-clamp recording of cyclic
nucleotide-gated channels (270 µm2/s) (25) and with the diffusion coefficients calculated for
cGMP (500 µm2/s) (26) and microinjected cAMP (780 µm2/s) (13).
Discussion
Our initial aim was to develop a novel cAMP fluorescent indicator, lacking catalytic activity
and cooperative binding typical for PKA and containing only one ligand-binding moiety fused
to both GFP variants to provide a robust monomolecular change in FRET in response to
elevating intracellular cAMP. Having four binding sites with different affinities the tetrameric
PKA-based indicator demonstrated relatively slow activation kinetics (Figs. 1D,E, 2B, 3C,D),
reflecting subunit dissociation. In contrast, the new indicators presented in this paper are
based on a single binding domain and reveal a fast speed of activation and are, therefore,
more suitable for measuring cAMP with high temporal resolution. Taking only one binding
domain of different cAMP-binding proteins made it possible to achieve not only a higher
temporal resolution, but also a equal level of YFP/CFP expression. Short cAMP-binding
sequences in our indicators do not contain any catalytic or targeting domains which might
interfere with intracellular regulatory processes. Transfected cells demonstrated uniform,
stably reproducible and rapid cAMP-signals following agonist stimulation.
Using constructs based on different cAMP-binding proteins in our imaging (Fig. 2E) and
fluorometric experiments (Fig. 2D), we show that all three - Epac1, Epac2 and PKA
by guest on February 14, 2018http://w
ww
.jbc.org/D
ownloaded from
cAMP imaging with novel Epac-based sensors 10
regulatory subunit - seem to have a common mechanism of ligand-induced rearrangement in
cyclic nucleotide binding domain suggesting a high functional homology.
The fluorescent indicator allowed us to gain insight into the spatio-temporal organization of
cAMP signaling in cells. The present study demonstrates rapid gradients of cAMP,
propagating from the site of receptor activation through the whole living cell on the scale of a
few hundred milliseconds, which is much faster than previously described for cells stimulated
with neurotransmitters (14). cAMP-signals recorded with Epac1-camps were uniformly
distributed throughout hippocampal neurons, whereas PKA-mediated signals such as b-
adrenergic stimulation of L-Type Ca-channels have been reported to be locally restricted due
to formation of signaling complexes including receptors, G-proteins, adenylyl cyclases,
effectors and phosphatases (23). The tetrameric PKA-sensor used in cardiomyocytes (15) is
spatially restricted by binding to A-kinase anchoring proteins, whereas Epac-camps (and the
analogous sensors) appears to be uniformly distributed throughout the cytosol and to provide
a novel sensitive method to image free cAMP concentrations in living cells.
Interestingly, the speed of cAMP signals we measured in primary neurons or macrophages
(Fig. 3A,B) was remarkably higher than that in CHO or HEK293 cells (Fig. 2). This fact
demonstrates that it is particulary important to study rapid signaling events in more
physiological systems in order to fully understand their spatio-temporal properties. On the
other hand, such physiological systems allow to further study kinetic differences between
distinct cAMP-signaling pathways. Here we show that Epac-signals are faster than PKA-
signals, suggesting that Epac may be a cAMP-target physiologically developed to regulate
more rapid receptor-mediated intracellular events.
cAMP plays a crucial role in almost all cells of the body. The binding domain of Epac, which
is highly expressed in many different tissues (10, 27), provides an excellent backbone for
fluorescent probes to monitor the dynamics of cAMP in neurons and other cells. Epac-based
fluorescent indicators presented here are capable of measuring cAMP in physiological range
with high temporal and spatial resolution and could therefore be ubiquitously applied to study
regulation and biological function of cAMP in living cells.
by guest on February 14, 2018http://w
ww
.jbc.org/D
ownloaded from

cAMP imaging with novel Epac-based sensors 11
References
1. Beavo, J. A., and Brunton, L. L. (2002) Nat. Rev. Mol. Cell Biol. 3, 710-718
2. Lee, K. A. (1991) Curr. Opin. Cell Biol. 3, 953-959
3. Prasad, K. N., Cole, W. C., Yan, X. D., Nahreini, P., Kumar, B., Hanson, A., and Prasad, J.
E. (2003) Apoptosis 8, 579-586
4. McLeod, S. J., Li, A. H., Lee, R. L., Burgess, A. E., and Gold, M. R. (2002) J. Immunol.
169, 1365-1371
5. Ozaki, N., Shibasaki, T., Kashima, Y., Miki, T., Takahashi, K., Ueno, H., Sunaga, Y.,
Yano, H., Matsuura, Y., Iwanaga, T., Takai, Y., and Seino, S. (2000) Nat. Cell Biol. 2, 805-
811
6. Holz, G. G. (2004) Diabetes 53, 5-13
7. Torgersen, K.M. Vang, T., Abrahamsen, H., Yaqub, S, and Tasken, K. (2002) Cell. Signal.
14, 1-9
8. Kandel, E. R. (2001) Science 294, 1030-1038
9. Zagotta, W. N., Olivier, N. B., Black, K. D., Young, E. C., Olson, R., and Gouaux (2003)
Nature 425, 730-740
10. Bos, J. L. (2003) 4, 733-738
11. Dremier, S., Kopperud, R., Doskeland, S. O., Dumont, J. E., and Maenhaut, C. (2003)
FEBS Lett. 546, 103-107
12. Zaccolo, M., De Giorgi, F., Cho, C. Y., Feng, L., Knapp, T., Negulescu, P. A., Taylor, S.
S., Tsien, R. Y., and Pozzan, T. (2000) Nat. Cell Biol. 2, 25-29
13. Bacskai, B.J., Hochner, B., Mahaut-Smith, M., Adams, S. R., Kaang, B. K., Kandel, E. R.,
and Tsien, R. Y. (1993) Science 260, 222–226
14. Hempel, C. M., Vincent, P., Adams, S. R., Tsien, R. Y., and Selverston, A. I. (1996)
Nature 384, 113-114
15. Zaccolo, M., and Pozzan, T. (2002) Science 295, 1711-1715
by guest on February 14, 2018http://w
ww
.jbc.org/D
ownloaded from

cAMP imaging with novel Epac-based sensors 12
16. Diller, T. C., Madhusudan, Xuong, N. H., and Taylor, S. S. (2001) Structure 9, 73-82
17. Odaka, C., Mizuochi, T., Yang, J., and Ding, A. (2003) J. Immunol. 171, 1507-1514
18. Dityatev, A., Dityateva, G., and Schachner, M. (2000) Neuron 26, 207-217
19. Vilardaga, J. P., Bünemann, M., Krasel, C., Castro, M., and Lohse, M. J. (2003) Nat.
Biotechnol. 21, 807-812
20. Rehmann, H., Prakash, B., Wolf, E., Rueppel, A., De Rooij, J., Bos, J. L., Wittinghofer,
A. (2003) Nat. Struct. Biol. 10, 26-32
21. de Rooij, J., Rehmann, H., van Triest, M., Cool, R. H., Wittinghofer, A., and Bos, J. L.
(2000) J. Biol. Chem. 275, 20829-20836
22. Tasken, K., and Aandahl, E. M. (2004) Physiol. Rev. 84, 751-773
23. Davare, M. A., Avdonin, V., Hall, D. D., Peden, E. M., Burette, A., Weinberg, R. J.,
Horne, M. C., Hoshi, T. and Hell, J. W. (2001) Science 293, 98-101.
24. Arslan, G., Kull, B., and Fredholm, B. B. (1999) Naunyn Schmiedebergs Arch.
Pharmacol. 359, 28-32
25. Chen, C., Nakamura, T., and Koutalos, Y. (1999) Biophys. J. 76, 2861-2867
26. Olson, A., and Pugh, E. N., Jr. (1993) Biophys. J. 65, 1335–1352
27. Kawasaki, H., Springett, G. M., Mochizuki, N., Toki, S., Nakaya, M., Matsuda, M.,
Housman, D. E., and Graybiel, A. M. (1998) Science 282, 2275-2279
1 The abbreviation used are: cAMP, adenosine cyclic 3’, 5’-monophosphate; Epac, exchange
protein directly activated by cAMP; FRET, fluorescence resonance energy transfer; PKA,
protein kinase A; CFP, YFP, BFP, GFP – enhanced cyan, yellow, blue, green fluorescent
proteins, respectively.
Supplementary Information accompanies the paper.
by guest on February 14, 2018http://w
ww
.jbc.org/D
ownloaded from

cAMP imaging with novel Epac-based sensors 13
Acknowledgements. We thank Alfred Wittinghofer and Manuela Zaccolo for plasmids,
Cornelius Krasel and Holger Rehmann for useful discussions, Martina Fischer and Gabriele
Wolz-Curtaz for cell culture assistance and Christian Dees for protein purification. This work
was supported by the Deutsche Forschungsgemeinschaft (SFB487, Leibniz award to M.J.L.)
and the Fonds der Chemischen Industrie.
Correspondence and requests for materials should be addressed to M.J.L. (e-mail:
Figure legends
Fig. 1. Development of novel cAMP indicators. A, Structure of individual fusion proteins
based on regulatory domains of PKA and Epac. The relative change of FRET in response to
cAMP is indicated. CFP – enhanced cyan fluorescent protein, YFP – enhanced yellow
fluorescent protein, HA – hemagglutinine tag. B, Crystal structure of B binding domains of
PKA regulatory subunit (with ligand, left) and Epac2 (without cAMP, right). Black arrow
indicates the proposed cAMP-induced conformational change. Positions of fluorophore (CFP
and YFP) insertion are labeled. C, Fluorescence emission spectra of Epac2-camps. A cAMP-
dependent decrease in FRET is demonstrated. Excitation of the CFP in Epac2-camps at a
wavelength of 436 nm led not only to CFP-emission at ≈480 nm but also to YFP-emission at
≈525 nm. Addition of increasing concentration of cAMP caused a progressive reduction of
the YFP-peak and a smaller increase in the CFP-emission, indicative of a loss in FRET. D and
E. Differences in activation speed of tetrameric PKA (12) and Epac-based cAMP-sensors.
Ratiometric measurements were performed in vitro using proteins expressed Sf9 cells. cAMP
in various concentrations was added at time-point 0. One representative experiment for each
concentration is shown. Epac-camps is switched-on faster than resolved by the instrument (<
2 s), whereas dissociation of PKA-complex is much slower, particularly at low the cAMP
concentration.
by guest on February 14, 2018http://w
ww
.jbc.org/D
ownloaded from

cAMP imaging with novel Epac-based sensors 14
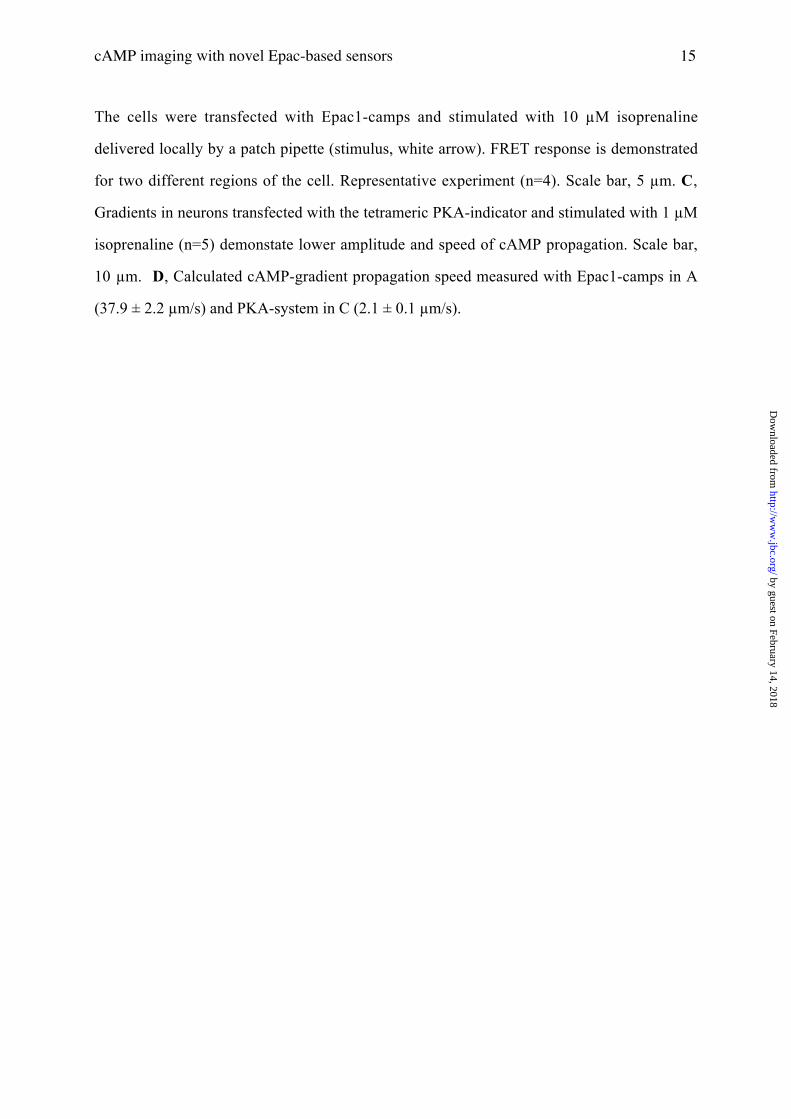
Fig. 2. FRET measurements of cAMP in living cells. A. Measurement of FRET in single
CHO-cells stably expressing adenosine A2B-receptors and transiently transfected with Epac2-
camps. Stimulation with adenosine leads to a rapid decrease in YFP and increase in CFP
fluorescence, demonstrating a loss in FRET (represented as ratio YFP/CFP). B, Activation
kinetics of Epac2-camps are faster than those of the tetrameric PKA-sensor. Experimental
system as in Fig. 2A; means ± SEM, n=4. C, Optimization of Epac2-camps by varying the
length of cAMP-binding moiety. The fragment of Epac2 protein sequence is indicated for
each construct. Changes in FRET are compared in the same measuring system as in Fig. 2A
and are represented as normalized ratios ± SEM, n=5. Shortening of helix H4 did not lead to a
significant increase in the amplitude of the signal, whereas cloning longer C-terminal
sequences after a6:B hinge helix resulted in a decrease of FRET signal upon agonist
activation. D, Concentration-response curves for different camps, based on cAMP-dependent
FRET of a single Epac2B, PKA regulatory bII-subunit and Epac1 binding moieties. FRET-
responses to cAMP were measured fluorometrically. EC50-values were (n=3): Epac2-camps
(0.92 ± 0.07 µM), Epac1-camps (2.35 ± 0.42 µM), PKA-camps (1.88 ± 0.37 µM). E,
Microscopic single-cell measurements of HEK-b1AR-cells transfected with different camps
and challenged with 1 µM isoprenaline (Iso). The traces are dissected to better compare
activation and relaxation kinetics for the three indicators (one representative experiment for
each camps is shown). F, Live time imaging of CHO-A2B-cells transfected with Epac1-camps.
YFP emission image to demonstrate cytoplasmatic localization of the camps and ratio images
before and after stimulation with 100 µM adenosine are shown.
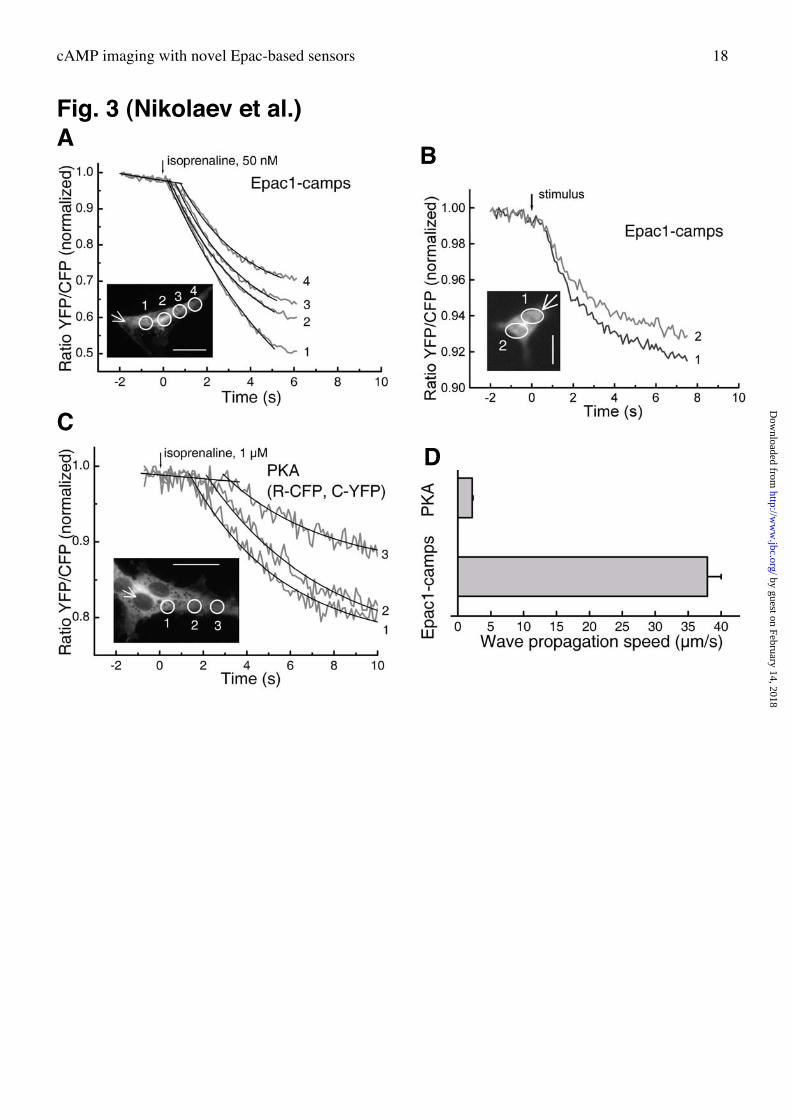
Fig. 3. cAMP gradients in murine primary hippocampal neurons and peritoneal
macrophages. A, Neurons transiently transfected with Epac1-camps were stimulated by
gently touching with a patch pipette filled with 50 nM isoprenaline (white arrow) under a
constant perfusion to avoid agonist diffusion along the membrane. FRET response was
measured in different regions of the cell away from the site of stimulation. Representative
experiment (n=5). Scale bar, 10 µm. B, cAMP gradients in murine peritoneal macrophages.
by guest on February 14, 2018http://w
ww
.jbc.org/D
ownloaded from
cAMP imaging with novel Epac-based sensors 15
The cells were transfected with Epac1-camps and stimulated with 10 µM isoprenaline
delivered locally by a patch pipette (stimulus, white arrow). FRET response is demonstrated
for two different regions of the cell. Representative experiment (n=4). Scale bar, 5 µm. C,
Gradients in neurons transfected with the tetrameric PKA-indicator and stimulated with 1 µM
isoprenaline (n=5) demonstate lower amplitude and speed of cAMP propagation. Scale bar,
10 µm. D, Calculated cAMP-gradient propagation speed measured with Epac1-camps in A
(37.9 ± 2.2 µm/s) and PKA-system in C (2.1 ± 0.1 µm/s).
by guest on February 14, 2018http://w
ww
.jbc.org/D
ownloaded from

cAMP imaging with novel Epac-based sensors 16Fig. 1 (Nikolaev et al.)
A
B
C
D
E
by guest on February 14, 2018http://w
ww
.jbc.org/D
ownloaded from
cAMP imaging with novel Epac-based sensors 17Fig. 2 (Nikolaev et al.)
A
B
C
D
E
F
by guest on February 14, 2018http://w
ww
.jbc.org/D
ownloaded from
cAMP imaging with novel Epac-based sensors 18
Fig. 3 (Nikolaev et al.)A
C
B
D
by guest on February 14, 2018http://w
ww
.jbc.org/D
ownloaded from

Martin J. LohseViacheslav O. Nikolaev, Moritz Bunemann, Lutz Hein, Annette Hannawacker and
Novel single chain cAMP sensors for receptor-induced signal propagation
published online July 1, 2004J. Biol. Chem.
10.1074/jbc.C400302200Access the most updated version of this article at doi:
Alerts:
When a correction for this article is posted•
When this article is cited•
to choose from all of JBC's e-mail alertsClick here
Supplemental material:
http://www.jbc.org/content/suppl/2004/09/08/C400302200.DC1
by guest on February 14, 2018http://w
ww
.jbc.org/D
ownloaded from