Embed Size (px)
Citation preview

November 18th, 2016
Company: SBA CommunicationsAction: LongPrice Target: $130Students: Athena Zhao, Pat Moran and Breed Randall

SBA Communications
Business Overview
Source: [Investor Relations, Estimates, Company Data, Google Images ]
SBA Communications Corporation leases antenna space on multi-tenant towers to a variety of wireless service providers under long-term lease contracts. SBA owns and operates over 25,000 towers across North, Central and South America. SBA generates revenue from two primary businesses - site leasing and site development services.
SBAC SBA Communications CorporationCurrent Price: $98.93Target: $130.13Upside: 31.5%Total Return: 33.5%
Market Cap: $12,451,579.4 EV/EBITDA(current): 15.7x ROIC(15A) : 4.3% Revenue Growth(16E) : -0.3%Net Debt: $8,488,079.1 EV/EBITDA(target): 18.7x ROIC(16E) : 5.3% Revenue Growth(17E) : 1.1%52wk Range: $82.80 - $118.57 AFFO/share(16E) : $6.04 ROIC(17E) : 6.9% EBITDA Growth(15A) : 12.5%EBITDA(17E) : $1,156,404.6 AFFO/share(17E) : $6.70 EBITDA Margin(15A) : 73.3% EBITDA Growth(16E) : 3.0%Revenues(16E) : $1,634,224.9 P/AFFO(current): 14.8x EBITDA Margin(16E) : 73.4% EBITDA Growth(17E) : 15.2%Revenues(17E) : $1,652,227.0 P/AFFO(target): 19.4x EBITDA Margin(17E) : 76.2% Yield(17E) : 1.9%

Long: SBAC – Investment Thesis Overview
Unparalleled Business Model with Sustained Long Term Drivers
5G
FirstNet
Business Model
Capital Return
• Invest in the next major upgrade cycle• Will drive double digit leasing growth
• New Federal Network to benefit US towers• Network build-out to commence in 2017E
• Repurchased $1bln in Stock since 2009, 12% of current FDSO• REIT conversion will shift capital return to dividends
~$14/share through 2020E done in conjunction with share repurchases
• Essential Infrastructure for wireless industry• Effective US oligopoly, with sustained LT growth drivers• Multi-Year contracts w/ the best incremental economic returns

Thesis #1: 5G
Source: [American Tower, Goldman Sachs Equity Research, Company Filings]
Invest in the Next Cycle
Timeline• Verizon Beta Deployments 4Q16• AT&T Beta Deployment 3Q16• T-Mobile Beta Deployments 2016• Sprint Beta Deployments 1Q16
• Reached Speeds > 4GBps
$0.0
$20.0
$40.0
$60.0
$80.0
$100.0
$120.0
$140.0
0.0
5,000.0
10,000.0
15,000.0
20,000.0
25,000.0
30,000.0
35,000.0
40,000.0
2008 2009 2010 2011 2012 2013 2014 2015 2016E
4G CAPEX & Stock Returns
Total AMT CCI SBAC
5G will require another major round of network investment by the wireless carriers driving organic leasing activity for the Towers
Thesis #1: 5G
Source: [‘The Future of Wireless: A Vision for U.S. Leadership in a 5G World’ – FCC, CommScope 5G White Paper]
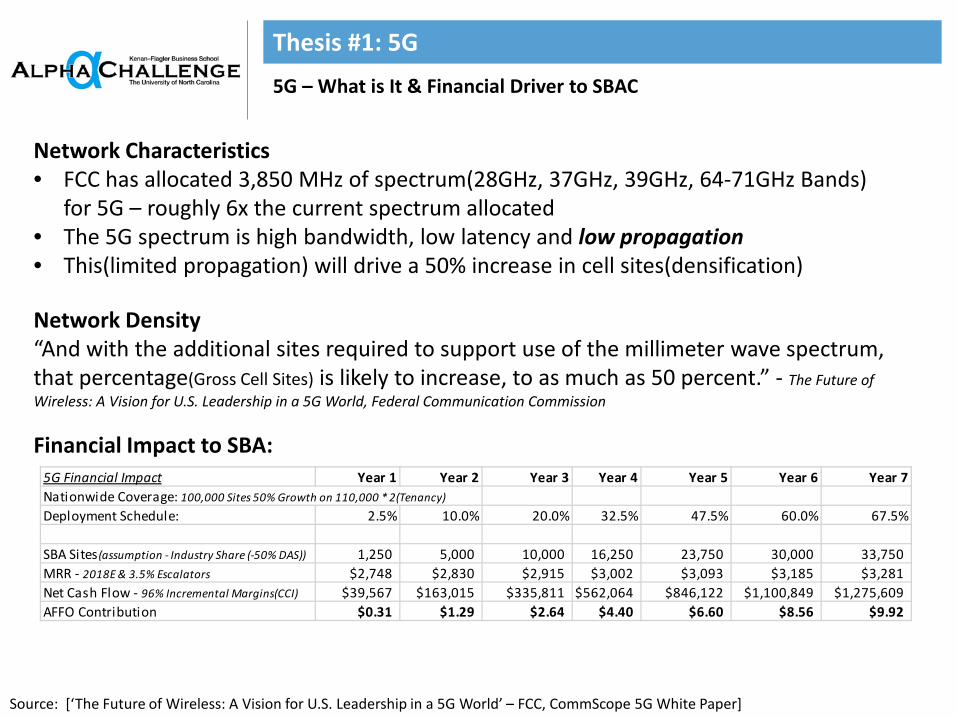
Network Characteristics• FCC has allocated 3,850 MHz of spectrum(28GHz, 37GHz, 39GHz, 64-71GHz Bands)
for 5G – roughly 6x the current spectrum allocated• The 5G spectrum is high bandwidth, low latency and low propagation• This(limited propagation) will drive a 50% increase in cell sites(densification)
Network Density“And with the additional sites required to support use of the millimeter wave spectrum, that percentage(Gross Cell Sites) is likely to increase, to as much as 50 percent.” - The Future of Wireless: A Vision for U.S. Leadership in a 5G World, Federal Communication Commission
Financial Impact to SBA:
5G – What is It & Financial Driver to SBAC
5G Financial Impact Year 1 Year 2 Year 3 Year 4 Year 5 Year 6 Year 7Nationwide Coverage: 100,000 Sites 50% Growth on 110,000 * 2(Tenancy)Deployment Schedule: 2.5% 10.0% 20.0% 32.5% 47.5% 60.0% 67.5%
SBA Sites(assumption - Industry Share (-50% DAS)) 1,250 5,000 10,000 16,250 23,750 30,000 33,750MRR - 2018E & 3.5% Escalators $2,748 $2,830 $2,915 $3,002 $3,093 $3,185 $3,281Net Cash Flow - 96% Incremental Margins(CCI) $39,567 $163,015 $335,811 $562,064 $846,122 $1,100,849 $1,275,609AFFO Contribution $0.31 $1.29 $2.64 $4.40 $6.60 $8.56 $9.92

Thesis #1: 5G
Source: [American Tower Investor Presentation, Goldman Sachs Equity Research]
Details – Requirement for Increased Densification
5G Data Speeds will lead to a 70x increase in data capacity/speed, but the higher frequency higher bandwidth spectrum of 5G mandates a significant increase in network densification

Thesis #2: FirstNet – First Responder Network
FirstNet – Federally mandated (and funded) First Responder Safety Cellular Network• FirstNet was born post 9/11 to fund and create a nationwide network to be used by first
responders and safety professional• After years of political process, FirstNet finally sent out RFP’s and will be awarding the
network contracts November 2016• The government has allocated the spectrum, and has already committed the funding• Funding: $7bln to Construct the Network, and $5.625bln to be paid out annually over
25years to support the network• Nationwide(56 States and Territories) Coverage: 80% by 2020 and 100% by 2022
Source: [FirstNet by Numbers – FirstNet.gov, ]
FirstNet Nationwide Deployment 2018E 2019E 2020E 2021E 2022E 2023E 2024ENationwide Coverage: 30,000 SitesDeployment Schedule(assumption) 15.0% 40.0% 65.0% 80.0% 85.0% 90.0% 95.0%
SBA Sites(assumption - Industry Share) 741 1,977 3,213 3,954 4,201 4,448 4,696MRR - 2018E & 3.5% Escalators $2,748 $2,830 $2,915 $3,002 $3,093 $3,185 $3,281Net Cash Flow - 96% Incremental Margins(CCI) $23,468 $64,460 $107,890 $136,771 $149,678 $163,238 $177,476AFFO Contribution $0.19 $0.51 $0.85 $1.07 $1.17 $1.27 $1.38
Financial Impact to SBA:
Thesis #2: FirstNet – First Responder Network
Source: [Congressional Research Service - First Responder Network and Next-Generation Communications, Coverage Objectives -FirstNet.gov]
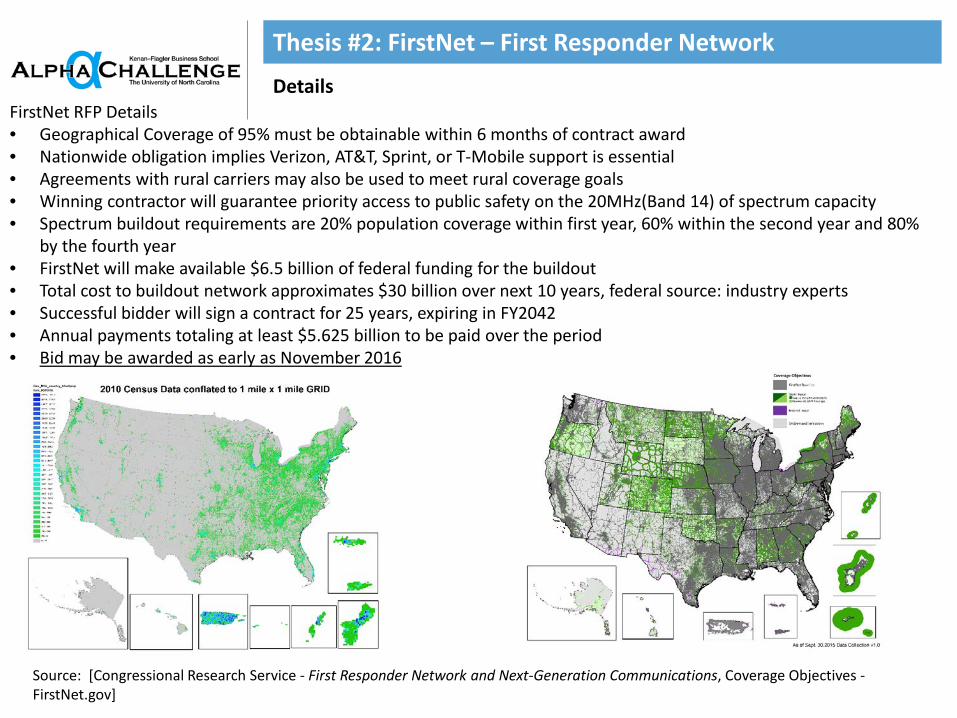
DetailsFirstNet RFP Details• Geographical Coverage of 95% must be obtainable within 6 months of contract award• Nationwide obligation implies Verizon, AT&T, Sprint, or T-Mobile support is essential• Agreements with rural carriers may also be used to meet rural coverage goals• Winning contractor will guarantee priority access to public safety on the 20MHz(Band 14) of spectrum capacity• Spectrum buildout requirements are 20% population coverage within first year, 60% within the second year and 80%
by the fourth year• FirstNet will make available $6.5 billion of federal funding for the buildout• Total cost to buildout network approximates $30 billion over next 10 years, federal source: industry experts• Successful bidder will sign a contract for 25 years, expiring in FY2042• Annual payments totaling at least $5.625 billion to be paid over the period• Bid may be awarded as early as November 2016

Thesis #3: REIT Conversion
Timing & Impact
October 3, 2016: SBA elects to be taxed as a REIT commencing taxable year 2016• $1.15 billion in NOLs will offset future REIT Taxable Income, and no purging dividend is required with conversion
Impact• REIT Conversion, in conjunction with MSCI & S&P changes, will drive Index Inclusion and broaden investor base
• MSCI & S&P reclassified REITs as a standalone sector, versus sub-industry within financials • The indexes were officially rebalanced on September 16, 2016
• Approximately $100bln of index rebalancing required• This will drive upside via multiple expansion as SBA will now be valued on REIT metrics
• REIT’s are valued on a combination of AFFO and Yield• Towers are a far superior business model, and offer higher and more sustainable growth
metrics• Given those dynamics SBAC should be valued at 19x 17E AFFO
Source: [ NAREIT, Reuters – JPM & Cohen & Steers, FTSE NA REIT Index Constituents Broken Down by Subsector, Estimates]
P/AFFO 18 Yield 19 Yield Dividend GrowthSBAC 14.8x 3.0% 4.1% 34.3% CAGR 17-23
Average: 16.2x 5.7% 5.8% 5.5%Infrastructure: 13.4x 6.5% 6.9% 11.8%Data Centers: 18.1x 3.9% 4.4% 11.5%Office: 15.2x 4.3% 4.4% 7.4%Industrial: 18.2x 9.2% 9.2% 0.0%Retail: 15.7x 4.7% 4.5% 2.0%Residential: 21.0x 4.1% 4.3% 2.0%Diversified: 14.0x 6.4% 6.4% 4.9%Lodging/Resorts: 8.2x 5.9% 5.7% 2.3%Self Storage: 19.0x 4.3% 4.7% 11.1%Health Care: 12.8x 6.7% 7.0% 2.6%Specialty: 22.9x 6.3% 6.6% 4.4%

Spectrum Capacity
Source: [allnet insights & analytics – Spectrum Analysis Tool - www.allnetinsights.com, Ericsson, Goldman Sachs Equity Research]
45 5210 14 5 5 0
90
69 73
6837 71
2 1
40
30
0
151
0
0 0
0
0
50
100
150
200
250
VerizonWireless
AT&T T-Mobile Sprint Dish USCellular C Spire FCC
National Weighted AverageSpectrum Depth (MHz)Detailed by Band Class
High Band
Mid Band
Low Band
Verizon & others are short on Spectrum – deployments need to continue irrespective of 5G(supports 5%+ organic growth in addition to 3.5% contribution from escalators)
“Densification may delay the crunch by a year or two, but sooner or later the company(Verizon) will need more Spectrum. If over the next two years subs continue to move to LTE and usage grows at 30% per year, total LTE traffic would more than double.”-Jonathan Chaplin, New Street Research, July 2015

Historical Performance
Source: [Company Filings, Estimates]
Percentage of Total Revenues 2009 2010 2011 2012 2013 2014 2015AT&T Wireless (1) 23.8% 20.4% 23.8% 20.3% 20.5% 23.0% 24.2%Sprint 21.9% 21.2% 21.9% 23.9% 25.0% 23.4% 19.6%T-Mobile 13.7% 12.7% 13.5% 17.2% 17.3% 15.5% 16.0%Verizon Wireless 15.4% 12.7% 14.8% 12.7% 11.3% 12.0% 13.8%
Percentage of Site Leasing Operating Profit 1Q13 2Q13 3Q13 4Q13 1Q14 2Q14 3Q14 4Q14 1Q15 2Q15 3Q15 4Q15 1Q16 2Q16 3Q16Overall 96.7% 96.0% 95.9% 96.1% 96.5% 96.0% 96.3% 96.7% 96.8% 96.7% 97.2% 96.5% 98.2% 98.8% 98.7%
Domestic 93.1% 91.0% 91.4% 87.5% 90.1% 84.8% 83.8% 85.3% 84.4% 84.4% 85.9% 85.9% 86.0% 84.9% 84.1%International 6.9% 9.0% 8.6% 12.5% 9.9% 15.2% 16.2% 14.7% 15.6% 15.6% 14.1% 14.1% 14.0% 15.1% 15.9%
Domestic(mln) 238$ 199$ 206$ 208$ 269$ 225$ 231$ 242$ 244$ 244$ 250$ 247$ 251$ 251$ 254$ International (mln) 18$ 20$ 19$ 30$ 30$ 40$ 45$ 42$ 45$ 45$ 41$ 40$ 41$ 45$ 48$
SBA Business Metrics 2011 2012 2013 2014 2015Towers 10,524 17,491 20,079 24,292 25,465
Domestic - - 14,886 15,124 15,778International - - 5,193 9,168 9,687
Tower Tenancy 2.3 2.0 1.9 1.8 1.8
Revenue $954,084.0 $1,304,866.0 $1,526,996.0 $1,638,474.0EBITDA Margin 67.2% 69.5% 70.4% 71.5% 73.9%AFFO/Share $2.37 $3.14 $4.14 $5.27 $5.74
Historic Business Drivers – Model Inputs:
Historic Customer Concentration:
Historic Site Leasing Operating Profit & Geographic Breakdown:
Drivers, Customer Concentration, and Geographic Composition

Capital – Return on & Return of
Source: [Company Filings, Estimates]
History and future share repurchases combined with REIT dividend
Return on Capital 2015 2016E 2017E 2018E 2019E 2020E 2021E 2022E 2023EROIC 4.3% 5.3% 6.9% 9.4% 12.2% 15.3% 19.2% 23.3% 27.4%NOPAT $312,456 $378,719 $479,180 $642,880 $812,391 $1,008,656 $1,254,281 $1,519,604 $1,806,230Invested Capital $7,308,071 $7,162,054 $6,946,878 $6,804,893 $6,679,008 $6,577,194 $6,528,674 $6,535,235 $6,598,867mFCF/Invested Capital (OCF - maintenance CAPEX / IC) 9.7% 11.0% 13.7% 16.4% 19.5% 22.9% 26.3% 29.8%
Return of Capital 2015 2016E 2017E 2018E 2019E 2020E 2021E 2022E 2023EShare Repurchases $542,939,065 $342,576 $50,000 $50,000 $50,000 $50,000 $50,000 $50,000 $50,000Dividends $0 $0 $241,987 $372,767 $518,133 $696,542 $905,517 $1,148,408 $1,428,424Dividends Per Share $1.92 $2.95 $4.09 $5.47 $7.09 $8.96 $11.10

Executive Compensation
NEO’s annual incentive compensation is set at 50%• SBA Sets annual incentive target performance on
Adjusted EBITDA• If SBA achieves Annualized Adjusted EBITDA at the
maximum level, (thereby earning 75% of the annual bonus opportunity), then the achievement of the subjective component at target would only entitle an NEO with a 100% target bonus opportunity to 25% of his annual bonus opportunity (100% minus 75%).
• Therefore, an NEO will only be entitled to receive his full annual bonus opportunity if he achieves 100% of his subjective component.
Source: [SBA 2016 Proxy Statement]
Minimum Equity Ownership Rules:
Strategy, Incentives and Ownership

Valuation Methodologies
Bear Case: $90 Base Case: $130 Bull Case : $157
Implied downside: (9%)Key Assumptions• Data demand stops increasing
exponentially • Tower and tenancy growth slows
well below historical levels• MRR escalators drop to 1.5%
Implied upside: 31%Key Assumptions• Domestic 2017 tower growth equal to
2016, 4 fewer towers per year though 2023
• International tower growth held flat at 2016 level
• Tenancy increases 10% (domestic), 15% (international)
• MRR increases 5% (domestic), 3.5% (international)
Implied upside: 58%Key Assumptions• 5G implementation comes sooner
and faster than anticipated• Network density increases,
driving tenancy growth
TerminalDC InputsAssumed Terminal Growth Rate 1.5%WACC 5.5%Implied Enterprise Value $25,070,257Less Debt ($8,692,305)Implied Equity Value $16,377,952
Diluted Shares Outstanding 125,863 Impled Value Per Share 130.13$
Price Upside 31.5%Total Return 33.5%Impled AFFO (2017) 19xImpled AFFO (2018) 16x

Debunking Myths
Source: [Goldman Sachs, US Carrier Filings, Tower Filings]
Wireless Capital Intensity is Increasing and Carriers can’t support Costs
13.5%
14.0%
14.5%
15.0%
15.5%
16.0%
16.5%
0.0
50,000.0
100,000.0
150,000.0
200,000.0
250,000.0
2010 2011 2012 2013 2014 2015
Wireless Carriers vs. Total CAPEX Intensity
Verizon Revenues T-Mobile Revenues Sprint Revenues
AT&T Revenues Total CAPEX
False - Wireless carrier domestic revenues have grown at a 7% CAGR(10-15CY)
as connections have grown at a 7% CAGR vs. 3% CAGR in wireless CAPEX

Debunking Myths
Source: [http://www.pcworld.com/article/2046234/bad-connections-dog-googles-mountain-view-wifi-network.html]
Towers can easily be replaced by Wi-Fi
Google: Sunnyvale Wi-Fi – Shutdown• Comcast, Optimum have launched local
Wi-Fi networks, but the economic model is not clear and a pure Wi-Fi(unlicensed) network is not sufficient to replicate a secured macro network. The attraction of mobile coverage is exactly that, mobility.
To be clear, we firmly believe that Wi-Fi is necessary and will complement Cellular Macro Networks• Wi-Fi traffic growth(offloading) will continue, it is necessary given network constraints• 5G Network Dynamics will require denser mesh networks, which Wi-Fi will help support• However, further investment in Macro Networks is Critical to keep pace with untethered
data demand growth

Source: [Cisco – Minutes Used, Cisco – Projected IPv6 Mobile Data Traffic, Verizon – Summary of Data Consumption]
Data Demand – Still Growing
• 4G connections represented only 14 percent of mobile connections in 2015 - account for 47 percent of mobile data traffic
• 3G connections represented 34 percent of mobile –account for 43 percent of the traffic.
• In 2015, a 4G connection generated six times more traffic on average than a non 4G connection.
• Mobile video traffic accounted for 55 percent of total mobile data traffic in 2015
• Mobile data traffic will grow at a compound annual growth rate (CAGR) of 53 percent from 2015 to 2020, reaching 30.6 exabytes per month by 2020.

Source: [American Tower Investor Presentations]
Core Business Economics
Two Critical Observations• Shared Infrastructure is far cheaper and the best option for Wireless
Carriers(why Verizon, T-Mobile and AT&T have sold all of their ~20,000 towers to the tower companies in the past several years)
• Towers offer some of the best return on capital dynamics, and in a consolidated oligopoly with regulatory hurdles, these margins are defensible

Model
DCF
Source: [Company Filings, Industry Filings, Competitor Filings and Estimates]
DCF for SBA Communications CorporationDollars in Thousands, except per share Data
2016 2017 2018 2019 2020 2021 2022 2023Revenue $1,634,224.9 $1,652,227.0 $1,828,024.5 $2,013,723.7 $2,227,195.5 $2,459,610.0 $2,712,401.6 $2,987,106.0
10.6% 10.2% 10.6% 9.1% 7.6% 6.1%OCF 723,935.4 783,636.7 949,621.8 1,115,966.6 1,306,614.8 1,514,235.3 1,740,166.6 Capex (503,648.2) (422,265.5) (438,942.3) (456,779.4) (477,889.5) (501,227.6) (526,962.6)
NoL Tax OffsetFCF 220,287.2 361,371.2 510,679.5 659,187.2 828,725.3 1,013,007.7 1,213,204.0
0 0 0 0 0 0 30,785,051.59 FCF Margin 13.3% 19.8% 25.4% 29.6% 33.7% 37.3% 40.6%
WACC 5.50%Long Term Growth Rate 2%Terminal Value 30,785,051.59
Present Value of FCF $3,703,253.39Present Value of TV 21,162,777.6 Implied Firm Value 24,866,031.0
Plus Cash 204,225.9 Less Debt (8,692,305.0) Implied Equity Value $16,377,951.88
FDSO 125,863
Equity Price 130.13$

Model
Annual Income Statement
Source: [Company Filings, Industry Filings, Competitor Filings and Estimates]
Income Statement for SBA Communications CorporationDollars in Thousands, except per share Data
2012 2013 2014 2015 2016E 2017E 2018E 2019E 2020E 2021E 2022E 2023E
Site Leasing $846,094.0 $1,133,013.0 $1,360,202.0 $1,480,634.0 $1,538,065.9 $1,575,067.0 $1,748,181.6 $1,931,068.4 $2,141,591.7 $2,370,914.6 $2,620,463.9 $2,891,767.3Site Development 107,990.0 171,853.0 166,794.0 157,840.0 96,159.0 77,160.0 79,843.0 82,655.3 85,603.8 88,695.4 91,937.8 95,338.7 Total Revenues 954,084.0 1,304,866.0 1,526,996.0 1,638,474.0 1,634,224.9 1,652,227.0 1,828,024.5 2,013,723.7 2,227,195.5 2,459,610.0 2,712,401.6 2,987,106.0
Cost of Site Leasing 188,951.0 270,772.0 301,313.0 324,655.0 339,813.5 342,786.9 354,784.4 367,201.9 380,053.9 393,355.8 407,123.3 421,372.6 Cost of Site Development 90,556.0 137,481.0 127,172.0 119,744.0 78,836.0 63,705.1 65,920.2 68,242.1 70,676.4 73,229.0 75,906.0 78,713.8 Sell ing, General & Administrative 72,148.0 85,476.0 103,317.0 114,951.0 139,692.0 122,524.6 124,362.5 126,227.9 128,121.4 130,043.2 131,993.8 133,973.7 Acquisition Related Adjustments & Expenses 40,433.0 19,198.0 7,798.0 11,864.0 11,984.6 9,680.3 6,383.2 7,051.0 7,819.6 8,657.0 9,568.2 10,558.8 Asset Impairment and Decomission Expenses 6,383.0 28,960.0 23,801.0 94,783.0 23,179.0 23,526.7 23,879.6 24,237.8 24,601.3 24,970.4 25,344.9 25,725.1 Depreciation, Accrection, and Amortization 408,467.0 533,334.0 627,072.0 660,021.0 662,000.8 610,823.5 609,814.2 608,372.5 607,266.3 575,073.8 542,861.7 510,532.2 Total operating expenses 806,938.0 1,075,221.0 1,190,473.0 1,326,018.0 1,255,505.9 1,173,047.0 1,185,144.1 1,201,333.2 1,218,539.0 1,205,329.2 1,192,797.9 1,180,876.3
Income from operations 147,146.0 229,645.0 336,523.0 312,456.0 378,719.1 479,180.0 642,880.5 812,390.6 1,008,656.4 1,254,280.8 1,519,603.8 1,806,229.8
Interest Income (1,128.0) (1,794.0) (677.0) (3,894.0) (4,028.4) (6,256.6) (9,356.9) (12,808.4) (16,241.8) (19,281.8) (21,472.2) (22,294.2) Interest Expense 196,241.0 249,051.0 292,600.0 322,366.0 342,118.6 324,132.6 324,132.6 324,132.6 324,132.6 324,132.6 324,132.6 324,132.6 Non-cash Interest Expense 70,110.0 49,085.0 27,112.0 1,505.0 1,954.0 1,954.0 1,954.0 1,954.0 1,954.0 1,954.0 1,954.0 1,954.0 Amortization of Deferred Financing Fees 12,870.0 15,560.0 17,572.0 19,154.0 21,371.4 22,012.6 22,673.0 23,353.1 24,053.7 24,775.3 25,518.6 26,284.2 Loss from Extinguishment of Debt, net 51,799.0 6,099.0 26,204.0 783.0 34,512.0 0.0 0.0 0.0 0.0 0.0 0.0 0.0Other (Expense)/Income, net (5,654.0) (31,138.0) (10,628.0) 139,137.0 (92,137.0) 0.0 0.0 0.0 0.0 0.0 0.0 0.0
Income before provision for income taxes (177,092.0) (57,218.0) (15,660.0) (166,595.0) 74,928.4 137,337.4 328,104.8 501,066.4 700,765.6 949,430.0 1,216,943.4 1,504,391.3
Provision/(Benefit) for income taxes 6,594.0 (1,309.0) 8,635.0 9,061.0 5,688.4 6,866.9 16,405.2 25,053.3 35,038.3 47,471.5 60,847.2 75,219.6 Income from Discontinued Operations 2,296.0 0.0 0.0 0.0 - 0.0 0.0 0.0 0.0 0.0 0.0 0.0Net Income Attributable to NCI 353.0 0.0 0.0 0.0 - 0.0 0.0 0.0 0.0 0.0 0.0 0.0
Net income (181,037.0) (55,909.0) (24,295.0) (175,656.0) 69,240.0 130,470.5 311,699.5 476,013.1 665,727.3 901,958.5 1,156,096.2 1,429,171.8
Basic and Diluted Shares Outstanding 120,280.000 127,769.000 128,919.000 127,794.000 125,862.523 126,126.758 126,455.142 126,827.050 127,236.487 127,680.354 128,152.411 128,648.162
EPS ($1.51) ($0.44) ($0.19) ($1.37) $0.55 $1.03 $2.46 $3.75 $5.23 $7.06 $9.02 $11.11
Model
Quarterly Income Statement
Source: [Company Filings, Industry Filings, Competitor Filings and Estimates]
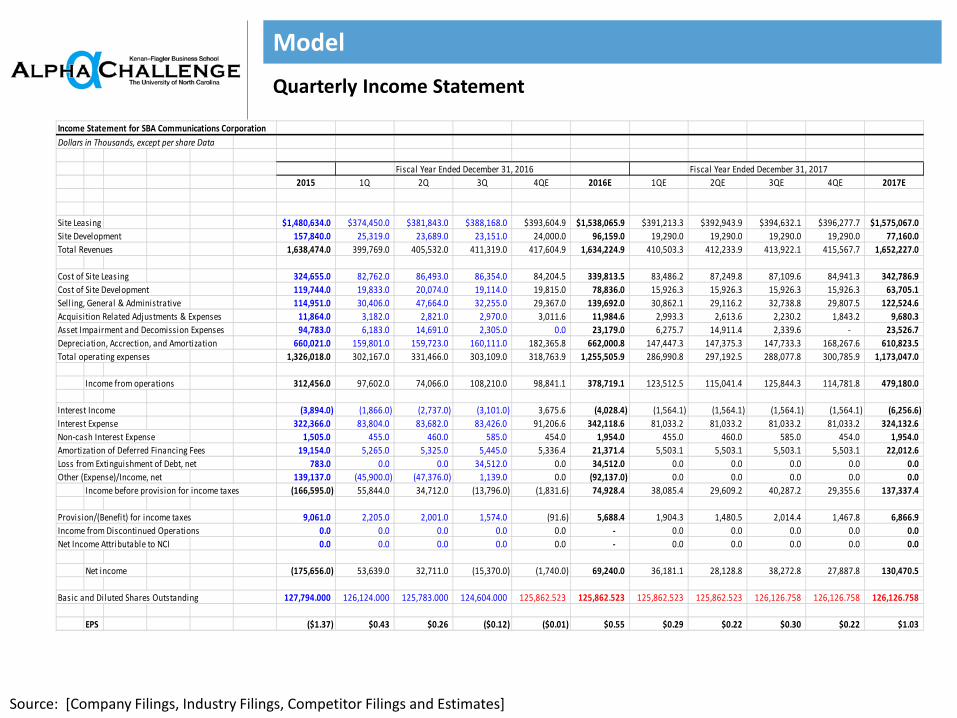
Income Statement for SBA Communications CorporationDollars in Thousands, except per share Data
Fiscal Year Ended December 31, 2016 Fiscal Year Ended December 31, 20172015 1Q 2Q 3Q 4QE 2016E 1QE 2QE 3QE 4QE 2017E
Site Leasing $1,480,634.0 $374,450.0 $381,843.0 $388,168.0 $393,604.9 $1,538,065.9 $391,213.3 $392,943.9 $394,632.1 $396,277.7 $1,575,067.0Site Development 157,840.0 25,319.0 23,689.0 23,151.0 24,000.0 96,159.0 19,290.0 19,290.0 19,290.0 19,290.0 77,160.0 Total Revenues 1,638,474.0 399,769.0 405,532.0 411,319.0 417,604.9 1,634,224.9 410,503.3 412,233.9 413,922.1 415,567.7 1,652,227.0
Cost of Site Leasing 324,655.0 82,762.0 86,493.0 86,354.0 84,204.5 339,813.5 83,486.2 87,249.8 87,109.6 84,941.3 342,786.9 Cost of Site Development 119,744.0 19,833.0 20,074.0 19,114.0 19,815.0 78,836.0 15,926.3 15,926.3 15,926.3 15,926.3 63,705.1 Sell ing, General & Administrative 114,951.0 30,406.0 47,664.0 32,255.0 29,367.0 139,692.0 30,862.1 29,116.2 32,738.8 29,807.5 122,524.6 Acquisition Related Adjustments & Expenses 11,864.0 3,182.0 2,821.0 2,970.0 3,011.6 11,984.6 2,993.3 2,613.6 2,230.2 1,843.2 9,680.3 Asset Impairment and Decomission Expenses 94,783.0 6,183.0 14,691.0 2,305.0 0.0 23,179.0 6,275.7 14,911.4 2,339.6 - 23,526.7 Depreciation, Accrection, and Amortization 660,021.0 159,801.0 159,723.0 160,111.0 182,365.8 662,000.8 147,447.3 147,375.3 147,733.3 168,267.6 610,823.5 Total operating expenses 1,326,018.0 302,167.0 331,466.0 303,109.0 318,763.9 1,255,505.9 286,990.8 297,192.5 288,077.8 300,785.9 1,173,047.0
Income from operations 312,456.0 97,602.0 74,066.0 108,210.0 98,841.1 378,719.1 123,512.5 115,041.4 125,844.3 114,781.8 479,180.0
Interest Income (3,894.0) (1,866.0) (2,737.0) (3,101.0) 3,675.6 (4,028.4) (1,564.1) (1,564.1) (1,564.1) (1,564.1) (6,256.6) Interest Expense 322,366.0 83,804.0 83,682.0 83,426.0 91,206.6 342,118.6 81,033.2 81,033.2 81,033.2 81,033.2 324,132.6 Non-cash Interest Expense 1,505.0 455.0 460.0 585.0 454.0 1,954.0 455.0 460.0 585.0 454.0 1,954.0 Amortization of Deferred Financing Fees 19,154.0 5,265.0 5,325.0 5,445.0 5,336.4 21,371.4 5,503.1 5,503.1 5,503.1 5,503.1 22,012.6 Loss from Extinguishment of Debt, net 783.0 0.0 0.0 34,512.0 0.0 34,512.0 0.0 0.0 0.0 0.0 0.0Other (Expense)/Income, net 139,137.0 (45,900.0) (47,376.0) 1,139.0 0.0 (92,137.0) 0.0 0.0 0.0 0.0 0.0
Income before provision for income taxes (166,595.0) 55,844.0 34,712.0 (13,796.0) (1,831.6) 74,928.4 38,085.4 29,609.2 40,287.2 29,355.6 137,337.4
Provision/(Benefit) for income taxes 9,061.0 2,205.0 2,001.0 1,574.0 (91.6) 5,688.4 1,904.3 1,480.5 2,014.4 1,467.8 6,866.9 Income from Discontinued Operations 0.0 0.0 0.0 0.0 0.0 - 0.0 0.0 0.0 0.0 0.0Net Income Attributable to NCI 0.0 0.0 0.0 0.0 0.0 - 0.0 0.0 0.0 0.0 0.0
Net income (175,656.0) 53,639.0 32,711.0 (15,370.0) (1,740.0) 69,240.0 36,181.1 28,128.8 38,272.8 27,887.8 130,470.5
Basic and Diluted Shares Outstanding 127,794.000 126,124.000 125,783.000 124,604.000 125,862.523 125,862.523 125,862.523 125,862.523 126,126.758 126,126.758 126,126.758
EPS ($1.37) $0.43 $0.26 ($0.12) ($0.01) $0.55 $0.29 $0.22 $0.30 $0.22 $1.03

Model
Non-GAAP Adjustments – EBITDA & AFFO
Source: [Company Filings, Industry Filings, Competitor Filings and Estimates]
Non-GAAP Adj.2012 2013 2014 2015 2016E 2017E 2018E 2019E 2020E 2021E 2022E 2023E
Net loss (181,037.0) (55,909.0) (24,295.0) (175,656.0) 69,240.0 130,470.5 311,699.5 476,013.1 665,727.3 901,958.5 1,156,096.2 1,429,171.8Non-cash straight-l ine leasing revenue (52,009.0) (65,611.0) (56,867.0) (49,064.0) (34,919.0) (34,919.0) (34,919.0) (34,919.0) (34,919.0) (34,919.0) (34,919.0) (34,919.0) Non-cash straight-l ine ground lease expense 22,463.0 33,621.0 36,271.0 34,204.0 35,021.0 35,021.0 35,021.0 35,021.0 35,021.0 35,021.0 35,021.0 35,021.0 Non-cash compensation 13,968.0 17,205.0 22,671.0 28,747.0 30,184.4 31,693.6 33,278.2 34,942.2 36,689.3 38,523.7 40,449.9 42,472.4Other expense (income) (5,654.0) (31,138.0) (10,628.0) 139,137.0 (92,137.0) - 0.0 0.0 0.0 0.0 0.0 0.0Acquisition related adjustments and expenses 25,268.0 19,198.0 7,798.0 11,864.0 11,984.6 9,680.3 6,383.2 7,051.0 7,819.6 8,657.0 9,568.2 10,558.8Asset impairment and decommission costs 21,548.0 28,960.0 23,801.0 94,783.0 23,179.0 23,526.7 23,879.6 24,237.8 24,601.3 24,970.4 25,344.9 25,725.1Interest income (1,128.0) (1,794.0) (677.0) (3,894.0) (4,028.4) (6,256.6) (9,356.9) (12,808.4) (16,241.8) (19,281.8) (21,472.2) (22,294.2)Interest expense (1) 279,220.0 313,696.0 337,284.0 343,025.0 366,027.6 346,784.6 346,784.6 346,784.6 346,784.6 346,784.6 346,784.6 346,784.6Depreciation, accretion, and amortization 408,467.0 533,334.0 627,072.0 660,021.0 662,000.8 610,823.5 609,814.2 608,372.5 607,266.3 575,073.8 542,861.7 510,532.2Provision (benefit) for taxes (2) 7,689.0 (492.0) 10,120.0 10,827.0 9,580.0 9,580.0 9,580.0 9,580.0 9,580.0 9,580.0 9,580.0 9,580.0Loss from extinguishment of debt, net 51,799.0 6,099.0 26,204.0 783.0 34,512.0 - 0.0 0.0 0.0 0.0 0.0 0.0Oi Reserve (2,297.0) 0.0 0.0 0.0 16,498.0 - 0.0 0.0 0.0 0.0 0.0 0.0
Adj. EBITDA 588,297.0 797,169.0 972,550.0 1,093,994.0 1,127,143.0 1,156,404.6 1,332,164.5 1,494,274.7 1,682,328.8 1,886,368.3 2,109,315.4 2,352,632.7 Margin 69.5% 70.4% 71.5% 73.9% 73.3% 73.4% 76.2% 77.4% 78.6% 79.6% 80.5% 81.4%
Net Loss (179,235.0) (62,410.0) (21,591.0) (173,877.0) 69,240.0 130,470.5 311,699.5 476,013.1 665,727.3 901,958.5 1,156,096.2 1,429,171.8 Real Estate related DA and accretion 404,668.0 528,831.0 621,209.0 653,990.0 634,439.0 640,783.4 647,191.2 653,663.1 660,199.8 666,801.8 673,469.8 680,204.5
FFO 225,433.0 466,421.0 599,618.0 480,113.0 703,679.0 771,253.9 958,890.7 1,129,676.2 1,325,927.1 1,568,760.3 1,829,566.0 2,109,376.3 Non-cash straight-l ine leasing revenue (52,009.0) (64,935.0) (56,866.0) (49,058.0) (34,919.0) (34,919.0) (34,919.0) (34,919.0) (34,919.0) (34,919.0) (34,919.0) (34,919.0) Non-cash straight-l ine ground lease expense 22,463.0 32,944.0 36,271.0 34,204.0 35,021.0 35,021.0 35,021.0 35,021.0 35,021.0 35,021.0 35,021.0 35,021.0 Non-cash compensation 13,968.0 17,206.0 22,670.0 28,748.0 30,184.4 31,693.6 33,278.2 34,942.2 36,689.3 38,523.7 40,449.9 42,472.4 Adjustment for non-cash portion of tax provision 0.0 0.0 0.0 436.0 (1,163.0) - - - - - - - Non-real estate related DA and accretion 3,760.0 4,503.0 5,862.0 6,031.0 5,412.0 5,412.0 5,412.0 5,412.0 5,412.0 5,412.0 5,412.0 5,412.0 Amortization of deferred financing costs and debt discounts 82,980.0 68,291.0 44,685.0 20,659.0 23,380.0 23,380.0 23,380.0 23,380.0 23,380.0 23,380.0 23,380.0 23,380.0 Loss from extinguishment of debt, net 51,799.0 6,647.0 33,741.0 783.0 34,512.0 - - - - - - - Other expense (income) (5,655.0) (31,138.0) (10,627.0) 139,139.0 (92,137.0) - - - - - - - Acquisition related adjustments and expenses 25,268.0 19,199.0 7,798.0 11,863.0 11,984.6 9,680.3 6,383.2 7,051.0 7,819.6 8,657.0 9,568.2 10,558.8 Asset impairment and decommission costs 21,548.0 28,960.0 23,801.0 94,783.0 23,179.0 23,526.7 23,879.6 24,237.8 24,601.3 24,970.4 25,344.9 25,725.1 Non-discretionary cash capital expenditures (12,286.0) (18,981.0) (27,244.0) (33,600.0) (29,929.0) (20,227.9) (20,531.4) (20,839.3) (21,151.9) (21,469.2) (21,791.2) (22,118.1)Adjustment for Oi Reserve 0.0 0.0 0.0 0.0 16,498.0 - - - - - - -
AFFO 377,269.0 529,117.0 679,709.0 734,101.0 759,702.0 844,820.5 1,030,794.4 1,203,961.8 1,402,779.4 1,648,336.2 1,912,031.7 2,194,908.5 AFFO per Share 3.14$ 4.14$ 5.27$ 5.74$ 6.04$ 6.70$ 8.15$ 9.49$ 11.02$ 12.91$ 14.92$ 17.06$

Model
Revenue Driver
Source: [Company Filings, Industry Filings, Competitor Filings and Estimates]
Revenue & Expense Driver for SBA Communications CorporationDollars in Thousands, except per share Data
2016E 1QE 2QE 3QE 4QE 2017E 2018E 2019E 2020E 2021E 2022E 2023E
Total Revenues $410,503.3 $412,233.9 $413,922.1 $415,567.7 $1,828,024.5 $2,013,723.7 $2,227,195.5 $2,459,610.0 $2,712,401.6 $2,987,106.0
Site Leasing Revenues 391,213.34 392,943.94 394,632.06 396,277.70 1,748,181.58 1,931,068.43 2,141,591.70 2,370,914.57 2,620,463.85 2,891,767.32 Domestic 337,910.4 338,887.3 339,821.8 340,713.8 1,476,396.0 1,600,168.7 1,737,251.5 1,882,619.7 2,036,632.6 2,199,659.6
MRR $2,949.8 $2,949.8 $2,949.8 $2,949.8 $3,053.0 $3,159.8 $3,270.4 $3,384.9 $3,503.4 $3,626.0Tenancy 2.4 2.4 2.4 2.4 2.5 2.6 2.7 2.8 2.9 3.0
International 53,303.0 54,056.6 54,810.2 55,563.9 271,785.5 330,899.7 404,340.2 488,294.9 583,831.3 692,107.7 MRR 1,575.0 1,575.0 1,575.0 1,575.0 $1,653.8 $1,736.4 $1,823.3 $1,914.4 $2,010.1 $2,110.7Tenancy 1.1 1.1 1.1 1.1 1.3 1.4 1.6 1.7 1.9 2.0
Site Development Revenues 19,290.0 19,290.0 19,290.0 19,290.0 79,843.0 82,655.3 85,603.8 88,695.4 91,937.8 95,338.7 Domestic 4,590.0 4,590.0 4,590.0 4,590.0 18,103.0 17,828.3 17,535.4 17,223.7 16,892.4 16,541.1
Development Fee 306.0 306.0 306.0 306.0 312.1 318.4 324.7 331.2 337.8 344.6 International 14,700.0 14,700.0 14,700.0 14,700.0 61,740.0 64,827.0 68,068.4 71,471.8 75,045.4 78,797.6
Development Fee 210.0 210.0 210.0 210.0 220.5 231.5 243.1 255.3 268.0 281.4
DomesticTowers owned at beginning of period 15,778 15,887 15,934 15,979 16,022 15,887 16,063 16,233 16,397 16,555 16,707 16,853Towers acquired 220 32 30 28 26 116 112 108 104 100 96 92Towers constructed 43 15 15 15 15 60 58 56 54 52 50 48Towers reclassified/disposed of (1) (154) 0 0 0 0 0 0 0 0 0 0 0Towers owned at end of period 15,887 15,934 15,979 16,022 16,063 16,063 16,233 16,397 16,555 16,707 16,853 16,993
InternationalTowers owned at beginning of period 9,687 10,183 10,328 10,473 10,618 10,183 10,763 11,343 11,923 12,503 13,083 13,663Towers acquired 228 75 75 75 75 300 300 300 300 300 300 300Towers constructed 271 70 70 70 70 280 280 280 280 280 280 280Towers reclassified/disposed of (1) (3) 0 0 0 0 0 0 0 0 0 0 0Towers owned at end of period 10,183 10,328 10,473 10,618 10,763 10,763 11,343 11,923 12,503 13,083 13,663 14,243

Model
Balance Sheet
Source: [Company Filings, Industry Filings, Competitor Filings and Estimates]
Balance Sheet for SBA Communications CorporationDollars in Thousands, except per share Data
2015 2016E 2017E 2018E 2019E 2020E 2021E 2022E 2023E
Cash and cash equivalents $118,039.0 $178,166.9 $281,875.8 $406,131.6 $535,664.7 $658,583.9 $759,196.9 $819,639.4 $819,639.4Restricted cash 25,353.0 25,353.0 25,353.0 25,353.0 25,353.0 25,353.0 25,353.0 25,353.0 25,353.0 Short-term investments 706.0 706.0 706.0 706.0 706.0 706.0 706.0 706.0 706.0 Accounts receivable, net of allowance of $1,681 and $88 83,326.0 95,273.7 93,250.4 98,709.9 103,745.9 109,188.8 114,385.2 119,245.4 123,668.5Costs and Earnings in Excess of Bil l ings on Uncompleted 16,934.0 10,316.5 8,278.2 8,566.0 8,867.7 9,184.1 9,515.8 9,863.6 10,228.5Prepaid expenses and other current assets 49,602.0 54,270.2 39,319.6 36,311.8 33,061.8 29,550.5 25,757.8 21,661.7 17,238.9
Total current assets 293,960.0 364,086.2 448,782.9 575,778.4 707,399.2 832,566.3 934,914.6 996,469.1 996,834.3
Property and equipment, net 2,782,353.0 2,981,963.4 3,149,319.4 3,334,258.6 3,538,132.4 3,763,375.6 4,012,149.4 4,286,870.3 4,590,233.1Intangible Assets, net 3,735,413.0 3,377,450.0 3,021,536.0 2,665,725.0 2,310,258.0 1,955,638.0 1,633,018.0 1,342,398.0 1,083,778.0Deferred Financing Fees, net 94,152.0 94,152.0 94,152.0 94,152.0 94,152.0 94,152.0 94,152.0 94,152.0 94,152.0 Other assets 497,337.0 493,557.1 481,804.5 508,536.6 532,771.4 558,729.8 582,995.1 605,051.0 624,317.0
Total assets 7,403,215.0 7,311,208.7 7,195,594.9 7,178,450.5 7,182,713.0 7,204,461.7 7,257,229.1 7,324,940.3 7,389,314.5
Accounts payable 27,105.0 20,987.4 16,840.7 17,426.3 18,040.1 18,683.6 19,358.4 20,066.1 20,808.3Accrued expenses 63,755.0 38,840.7 29,237.6 28,258.2 27,187.1 26,016.8 24,739.1 23,345.0 21,825.1Current maturities of long-term debt 20,000.0 20,000.0 20,000.0 20,000.0 20,000.0 20,000.0 20,000.0 20,000.0 20,000.0 Deferred revenue 97,083.0 75,796.7 73,682.5 77,410.4 80,681.0 84,122.8 87,203.5 89,830.9 91,901.9Accrued interest 53,365.0 53,365.0 53,365.0 53,365.0 53,365.0 53,365.0 53,365.0 53,365.0 53,365.0 Other current l iabil ities 12,063.0 12,063.0 12,063.0 12,063.0 12,063.0 12,063.0 12,063.0 12,063.0 12,063.0
Total current l iabil ities 273,371.0 221,052.8 205,188.8 208,522.8 211,336.3 214,251.3 216,728.9 218,669.9 219,963.3
Long-term debt 8,522,305.0 8,672,305.0 8,672,305.0 8,672,305.0 8,672,305.0 8,672,305.0 8,672,305.0 8,672,305.0 8,672,305.0Other long-term liabil iteis 313,683.0 314,314.9 310,063.3 331,030.8 351,178.7 373,402.0 395,604.2 417,589.8 439,135.7
Total liabilities 9,109,359.0 9,207,672.6 9,187,557.1 9,211,858.6 9,234,820.0 9,259,958.3 9,284,638.2 9,308,564.8 9,331,404.0
Total Equity (1,706,144.0) (1,896,464.0) (1,991,962.2) (2,033,408.1) (2,052,107.0) (2,055,496.6) (2,027,409.0) (1,983,624.4) (1,942,089.6)Total liabilities and Equity 7,403,215.0 7,311,208.7 7,195,594.9 7,178,450.5 7,182,713.0 7,204,461.7 7,257,229.1 7,324,940.3 7,389,314.5 Parity check(A=L+E) - - - - - - - - -

Model
Cash Flow Statement
Source: [Company Filings, Industry Filings, Competitor Filings and Estimates]
Cash Flow Statement for SBA Communications CorporationDollars in Thousands, except per share Data
2016E 2017E 2018E 2019E 2020E 2021E 2022E 2023E
Operating ActivitiesNet Income $69,240.0 $130,470.5 $311,699.5 $476,013.1 $665,727.3 $901,958.5 $1,156,096.2 $1,429,171.8Income from Discontinued Operations 0.0 0.0 0.0 0.0 0.0 0.0 0.0 0.0Depreciation and Accretion 304,037.8 254,909.5 254,003.2 252,905.5 252,646.3 252,453.8 252,241.7 251,912.2Amortization of Intangibles 357,963.0 355,914.0 355,811.0 355,467.0 354,620.0 322,620.0 290,620.0 258,620.0Non-cash interest expense 0.0 0.0 0.0 0.0 0.0 0.0 0.0 0.0Deferred income tax (benefit) expense 0.0 0.0 0.0 0.0 0.0 0.0 0.0 0.0Non-cash asset impairment and decommission 0.0 0.0 0.0 0.0 0.0 0.0 0.0 0.0Non-cash compensation expense 30,184.4 31,693.6 33,278.2 34,942.2 36,689.3 38,523.7 40,449.9 42,472.4Amortization of deferred financing fees 0.0 0.0 0.0 0.0 0.0 0.0 0.0 0.0Changes in Other Items 3,540.5 5,386.8 (2,036.7) (816.2) (293.3) 1,017.5 2,557.1 4,350.9Loss from extinguishment of debt, net 0.0 0.0 0.0 0.0 0.0 0.0 0.0 0.0Gain on sale/settlement of bankruptcy claim on convertible hedge 0.0 0.0 0.0 0.0 0.0 0.0 0.0 0.0Loss on remeasurement of U.S. denominated intercompany loan 0.0 0.0 0.0 0.0 0.0 0.0 0.0 0.0Gain on sale of cost method investments 0.0 0.0 0.0 0.0 0.0 0.0 0.0 0.0Other non-cash items reflected in the Statement of Operations 0.0 0.0 0.0 0.0 0.0 0.0 0.0 0.0Changes in Working Capital (41,030.2) 5,262.4 (3,133.5) (2,544.9) (2,774.8) (2,338.2) (1,798.4) (1,142.9)
Cash Flow from operating activities 723,935.4 783,636.7 949,621.8 1,115,966.6 1,306,614.8 1,514,235.3 1,740,166.6 1,985,384.4 NoL for Model - - - - - - - OCF for Model 723,935.4 783,636.7 949,621.8 1,115,966.6 1,306,614.8 1,514,235.3 1,740,166.6 1,985,384.4
Investing ActivitiesAcquisitions (291,820.0) (215,762.5) (211,662.5) (207,562.5) (203,462.5) (199,362.5) (195,262.5) (191,162.5)Capital expenditures (211,828.2) (206,503.0) (227,279.8) (249,216.9) (274,427.0) (301,865.1) (331,700.1) (364,112.6)Proceeds from sale of DAS networks - - - - - - - - Return of principal on long-term notes - - - - - - - - Proceeds from sale of cost method investments - - - - - - - - Other investing activities - - - - - - - -
Cash Flow from investing activities (503,648.2) (422,265.5) (438,942.3) (456,779.4) (477,889.5) (501,227.6) (526,962.6) (555,275.1)
Cash Flow Available for Financing Activities 220,287.2 361,371.2 510,679.5 659,187.2 828,725.3 1,013,007.7 1,213,204.0 1,430,109.3
Financing ActivitiesBorrowings under Revolving Credit Facil ity 0.0 0.0 0.0 0.0 0.0 0.0 0.0 0.0Repayments under Revolving Credit Facil ity 0.0 0.0 0.0 0.0 0.0 0.0 0.0 0.0Borrowings of Long Term Debt 700,000.0 0.0 0.0 0.0 0.0 0.0 0.0 0.0Repayments of Long Term Debt (550,000.0) 0.0 0.0 0.0 0.0 0.0 0.0 0.0Other Financing Activities 0.0 0.0 0.0 0.0 0.0 0.0 0.0 0.0Option Proceeds 32,416.4 34,325.1 36,343.7 38,478.4 40,735.7 43,122.5 45,646.1 48,314.3Repurchase of Common Stock (342,575.7) (50,000.0) (50,000.0) (50,000.0) (50,000.0) (50,000.0) (50,000.0) (50,000.0)Dividends 0.0 (241,987.4) (372,767.4) (518,132.5) (696,541.9) (905,517.2) (1,148,407.6) (1,428,423.7)
Cash Flow from financing activities (160,159.3) (257,662.3) (386,423.7) (529,654.1) (705,806.2) (912,394.7) (1,152,761.5) (1,430,109.3)
Effects of Exchange Rates on Cash
Net change in cash 60,127.9 103,708.9 124,255.8 129,533.1 122,919.2 100,613.0 60,442.5 - Beginning Cash Balance 118,039.0 178,166.9 281,875.8 406,131.6 535,664.7 658,583.9 759,196.9 819,639.4Ending Cash Balance 178,166.9 281,875.8 406,131.6 535,664.7 658,583.9 759,196.9 819,639.4 819,639.4
Fiscal Year Ending December 31,

Model
Working Capital Schedule
Source: [Company Filings, Industry Filings, Competitor Filings and Estimates]
Working Capital Schedule for SBA Communications CorporationDollars in Thousands, except per share Data
2015 2016E 2017E 2018E 2019E 2020E 2021E 2022E 2023E
Sales $1,480,634.0 $1,538,065.9 $1,575,067.0 $1,748,181.6 $1,931,068.4 $2,141,591.7 $2,370,914.6 $2,620,463.9 $2,891,767.3Cost of goods sold 157,840.0 96,159.0 77,160.0 79,843.0 82,655.3 85,603.8 88,695.4 91,937.8 95,338.7
Working Capital balancesAccounts receivable, net 83,326.0 95,273.7$ 93,250.4$ 98,709.9$ 103,745.9$ 109,188.8$ 114,385.2$ 119,245.4$ 123,668.5$ Costs and Earnings in Excess of Bil l ings on Uncompleted Contr 16,934.0 10,316.5 8,278.2 8,566.0 8,867.7 9,184.1 9,515.8 9,863.6 10,228.5 Prepaid expenses and other current assets 49,602.0 54,270.2 39,319.6 36,311.8 33,061.8 29,550.5 25,757.8 21,661.7 17,238.9
Total non-cash current assets 149,862.0$ 159,860.3$ 140,848.1$ 143,587.8$ 145,675.5$ 147,923.4$ 149,658.7$ 150,770.7$ 151,135.9$
Accounts payable 27,105.0 20,987.4$ 16,840.7$ 17,426.3$ 18,040.1$ 18,683.6$ 19,358.4$ 20,066.1$ 20,808.3$ Accrued Expenses 63,755.0 38,840.7$ 29,237.6$ 28,258.2$ 27,187.1$ 26,016.8$ 24,739.1$ 23,345.0$ 21,825.1$
Total non-debt current l iabil ities 90,860.0$ 59,828.1$ 46,078.3$ 45,684.4$ 45,227.2$ 44,700.5$ 44,097.5$ 43,411.1$ 42,633.4$
Net Working capital 59,002.0$ 100,032.2$ 94,769.8$ 97,903.3$ 100,448.2$ 103,223.0$ 105,561.2$ 107,359.6$ 108,502.5$
(Increase)/Decrease in working capital $61,971.0 ($41,030.2) $5,262.4 ($3,133.5) ($2,544.9) ($2,774.8) ($2,338.2) ($1,798.4) ($1,142.9)
Ratios and assumptionsNumbers of days in the period 365Accounts receivable, net(collection period in days) 22.6 22.6 21.6 20.6 19.6 18.6 17.6 16.6 15.6Cost and Earnings in Excess of Bil l ings 39.2 39.2 39.2 39.2 39.2 39.2 39.2 39.2 39.2Inventories(days outstanding) 186.0 206.0 186.0 166.0 146.0 126.0 106.0 86.0 66.0
Accounts payable(days outstanding) 79.7 79.7 79.7 79.7 79.7 79.7 79.7 79.7 79.7Accrued Expenses & Other l iabil ities(as a % of cost of goods s 40.4% 40.4% 37.9% 35.4% 32.9% 30.4% 27.9% 25.4% 22.9%
Fiscal Year nding December 31, Fiscal Year Ending December 31,

Model
Depreciation Schedule
Source: [Company Filings, Industry Filings, Competitor Filings and Estimates]
Depreciation Schedule for SBA Communications CorporationDollars in Thousands, except per share Data
2015 2016E 2017E 2018E 2019E 2020E 2021E 2022E 2023E
Sales $1,480,634.0 $1,538,065.9 $1,575,067.0 $1,748,181.6 $1,931,068.4 $2,141,591.7 $2,370,914.6 $2,620,463.9 $2,891,767.3Acquisitions 525,802.0 291,820.0 215,762.5 211,662.5 207,562.5 203,462.5 199,362.5 195,262.5 191,162.5Discrectionary CAPEX 175,107.0 181,899.2 186,275.1 206,748.5 228,377.6 253,275.1 280,395.9 309,908.8 341,994.5Non-Discretionary CAPEX 33,600.0 29,929.0 20,227.9 20,531.4 20,839.3 21,151.9 21,469.2 21,791.2 22,118.1
Capital expenditures(Non M&A) as % of sales 14.1% 13.8% 13.1% 13.0% 12.9% 12.8% 12.7% 12.7% 12.6%
Depreciation expense $296,500.0 304,037.81 254,909.47 254,003.21 252,905.52 252,646.33 252,453.83 252,241.71 251,912.23 Depreciation as % of CAPEX 40.4% 60.4% 60.4% 57.9% 55.4% 52.9% 50.4% 47.9% 45.4%
Beginning PP&E, net $2,782,353.0 $2,981,963.4 $3,149,319.4 $3,334,258.6 $3,538,132.4 $3,763,375.6 $4,012,149.4 $4,286,870.3Acquisitions 291,820.0 215,762.5 211,662.5 207,562.5 203,462.5 199,362.5 195,262.5 191,162.5 Capital expenditures 211,828.2 206,503.0 227,279.8 249,216.9 274,427.0 301,865.1 331,700.1 364,112.6 (Depreciation expense) (304,037.8) (254,909.5) (254,003.2) (252,905.5) (252,646.3) (252,453.8) (252,241.7) (251,912.2) (Asset sales and write-offs) - - - - - - - -
Ending PP&E, net $2,782,353.0 $2,981,963.4 $3,149,319.4 $3,334,258.6 $3,538,132.4 $3,763,375.6 $4,012,149.4 $4,286,870.3 $4,590,233.1
CAPEX Build
AcquisitionsDomestic Tower Price $1,000.0 $1,025.0 $1,025.0 $1,025.0 $1,025.0 $1,025.0 $1,025.0 $1,025.0International Tower Price $315.0 $322.9 $322.9 $322.9 $322.9 $322.9 $322.9 $322.9
Discretionary 11.8% 11.8% 11.8% 11.8% 11.8% 11.8% 11.8% 11.8% 11.8%
ear Ending Decem Fiscal Year Ending December 31,

Model
Amortization Schedule
Source: [Company Filings, Industry Filings, Competitor Filings and Estimates]
Amortization Schedule for SBA Communications CorporationDollars in Millions, except per share Data
2015 2016E 2017E 2018E 2019E 2020E 2021E 2022E 2023E
Sales $1,480,634.0 $1,538,065.9 $1,575,067.0 $1,748,181.6 $1,931,068.4 $2,141,591.7 $2,370,914.6 $2,620,463.9 $2,891,767.3Additions to Intangibles (90,606.0) - - - - - - - -
Additions as a % of sales -6.1% 0.0% 0.0% 0.0% 0.0% 0.0% 0.0% 0.0% 0.0%
Amortization expense $363,521.0 $357,963.0 $355,914.0 $355,811.0 $355,467.0 $354,620.0 $322,620.0 $290,620.0 $258,620.0Amortization as % of definite life intangibles, net
Beginning Intangibles, net $3,735,413.0 $3,377,450.0 $3,021,536.0 $2,665,725.0 $2,310,258.0 $1,955,638.0 $1,633,018.0 $1,342,398.0Additions to definite l ife intangibles - - - - - - - - (Amortization Expense) (357,963.0) (355,914.0) (355,811.0) (355,467.0) (354,620.0) (322,620.0) (290,620.0) (258,620.0) (Write-Offs) - - - - - - - -
Ending Intangibles, net $3,735,413.0 $3,377,450.0 $3,021,536.0 $2,665,725.0 $2,310,258.0 $1,955,638.0 $1,633,018.0 $1,342,398.0 $1,083,778.0
Year Ending Decemb Fiscal Year Ending December 31,

Model
Other Long Term Items
Source: [Company Filings, Industry Filings, Competitor Filings and Estimates]
Other Long Term Items for SBA Communications CorporationDollars in Thousands, except per share Data
2015 2016E 2017E 2018E 2019E 2020E 2021E 2022E 2023E
Sales $1,480,634.0 $1,538,065.9 $1,575,067.0 $1,748,181.6 $1,931,068.4 $2,141,591.7 $2,370,914.6 $2,620,463.9 $2,891,767.3
AssetsOther Assets 497,337.0 493,557.1 481,804.5 508,536.6 532,771.4 558,729.8 582,995.1 605,051.0 624,317.0
Total other long-term assets $497,337.0 $493,557.1 $481,804.5 $508,536.6 $532,771.4 $558,729.8 $582,995.1 $605,051.0 $624,317.0(Increase)/decrease in other long-term assets (30,294.0) 3,779.9 11,752.5 (26,732.1) (24,234.8) (25,958.4) (24,265.4) (22,055.9) (19,266.0)
Liabil itiesDeferred Revenue 76,668.0 75,796.7 73,682.5 77,410.4 80,681.0 84,122.8 87,203.5 89,830.9 91,901.9 Other Long Term Liabil ities 313,683.0 314,314.9 310,063.3 331,030.8 351,178.7 373,402.0 395,604.2 417,589.8 439,135.7
Total other long-term liabil ities $390,351.0 $390,111.6 $383,745.8 $408,441.2 $431,859.8 $457,524.8 $482,807.7 $507,420.7 $531,037.6Increase/(decrease) in other long-term liabilities (2,004.0) (239.4) (6,365.8) 24,695.4 23,418.6 25,665.0 25,282.9 24,613.0 23,616.9
Changes in other long-term assets and liabilities ($32,298.0) $3,540.5 $5,386.8 ($2,036.7) ($816.2) ($293.3) $1,017.5 $2,557.1 $4,350.9
% of SalesOther Assets 33.6% 32.1% 30.6% 29.1% 27.6% 26.1% 24.6% 23.1% 21.6%Deferred Revenue 5.2% 4.9% 4.7% 4.4% 4.2% 3.9% 3.7% 3.4% 3.2%Other Long Term Liabil ities 21.2% 20.4% 19.7% 18.9% 18.2% 17.4% 16.7% 15.9% 15.2%
Year Ending Decemb Fiscal Year Ending December 31,
Model
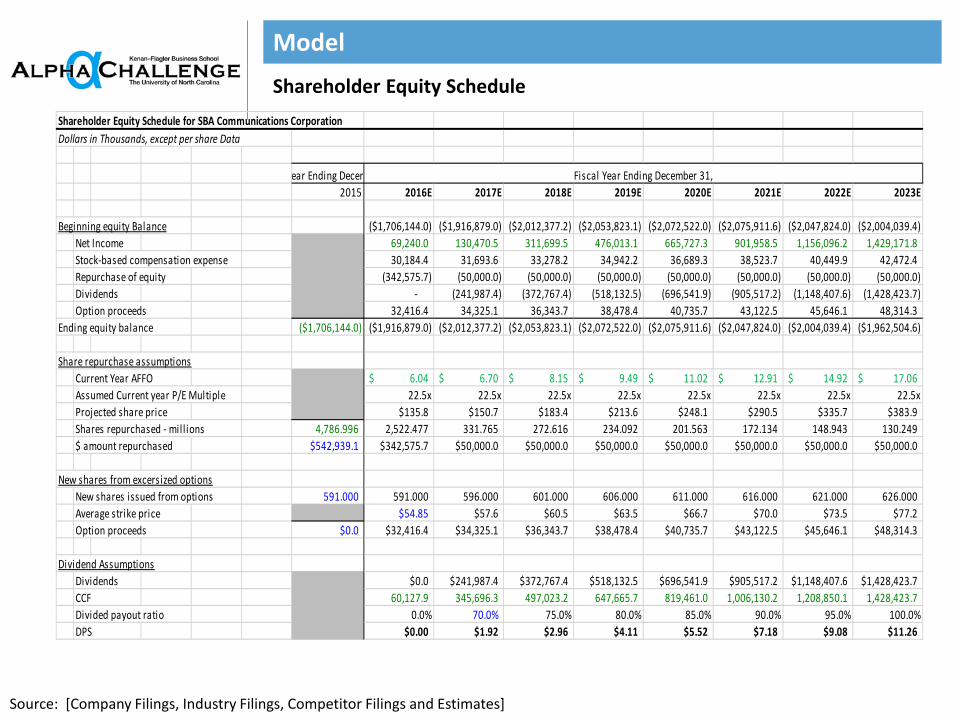
Shareholder Equity Schedule
Source: [Company Filings, Industry Filings, Competitor Filings and Estimates]
Shareholder Equity Schedule for SBA Communications CorporationDollars in Thousands, except per share Data
2015 2016E 2017E 2018E 2019E 2020E 2021E 2022E 2023E
Beginning equity Balance ($1,706,144.0) ($1,916,879.0) ($2,012,377.2) ($2,053,823.1) ($2,072,522.0) ($2,075,911.6) ($2,047,824.0) ($2,004,039.4)Net Income 69,240.0 130,470.5 311,699.5 476,013.1 665,727.3 901,958.5 1,156,096.2 1,429,171.8Stock-based compensation expense 28747 30,184.4 31,693.6 33,278.2 34,942.2 36,689.3 38,523.7 40,449.9 42,472.4 Repurchase of equity (342,575.7) (50,000.0) (50,000.0) (50,000.0) (50,000.0) (50,000.0) (50,000.0) (50,000.0) Dividends - (241,987.4) (372,767.4) (518,132.5) (696,541.9) (905,517.2) (1,148,407.6) (1,428,423.7) Option proceeds 32,416.4 34,325.1 36,343.7 38,478.4 40,735.7 43,122.5 45,646.1 48,314.3
Ending equity balance ($1,706,144.0) ($1,916,879.0) ($2,012,377.2) ($2,053,823.1) ($2,072,522.0) ($2,075,911.6) ($2,047,824.0) ($2,004,039.4) ($1,962,504.6)
Share repurchase assumptionsCurrent Year AFFO 6.04$ 6.70$ 8.15$ 9.49$ 11.02$ 12.91$ 14.92$ 17.06$ Assumed Current year P/E Multiple 22.5x 22.5x 22.5x 22.5x 22.5x 22.5x 22.5x 22.5xProjected share price $135.8 $150.7 $183.4 $213.6 $248.1 $290.5 $335.7 $383.9Shares repurchased - mill ions 4,786.996 2,522.477 331.765 272.616 234.092 201.563 172.134 148.943 130.249 $ amount repurchased $542,939.1 $342,575.7 $50,000.0 $50,000.0 $50,000.0 $50,000.0 $50,000.0 $50,000.0 $50,000.0
New shares from excersized optionsNew shares issued from options 591.000 591.000 596.000 601.000 606.000 611.000 616.000 621.000 626.000Average strike price $54.85 $57.6 $60.5 $63.5 $66.7 $70.0 $73.5 $77.2Option proceeds $0.0 $32,416.4 $34,325.1 $36,343.7 $38,478.4 $40,735.7 $43,122.5 $45,646.1 $48,314.3
Dividend AssumptionsDividends $0.0 $241,987.4 $372,767.4 $518,132.5 $696,541.9 $905,517.2 $1,148,407.6 $1,428,423.7CCF 60,127.9 345,696.3 497,023.2 647,665.7 819,461.0 1,006,130.2 1,208,850.1 1,428,423.7Divided payout ratio 0.0% 70.0% 75.0% 80.0% 85.0% 90.0% 95.0% 100.0%DPS $0.00 $1.92 $2.96 $4.11 $5.52 $7.18 $9.08 $11.26
Year Ending Decem Fiscal Year Ending December 31,
Model
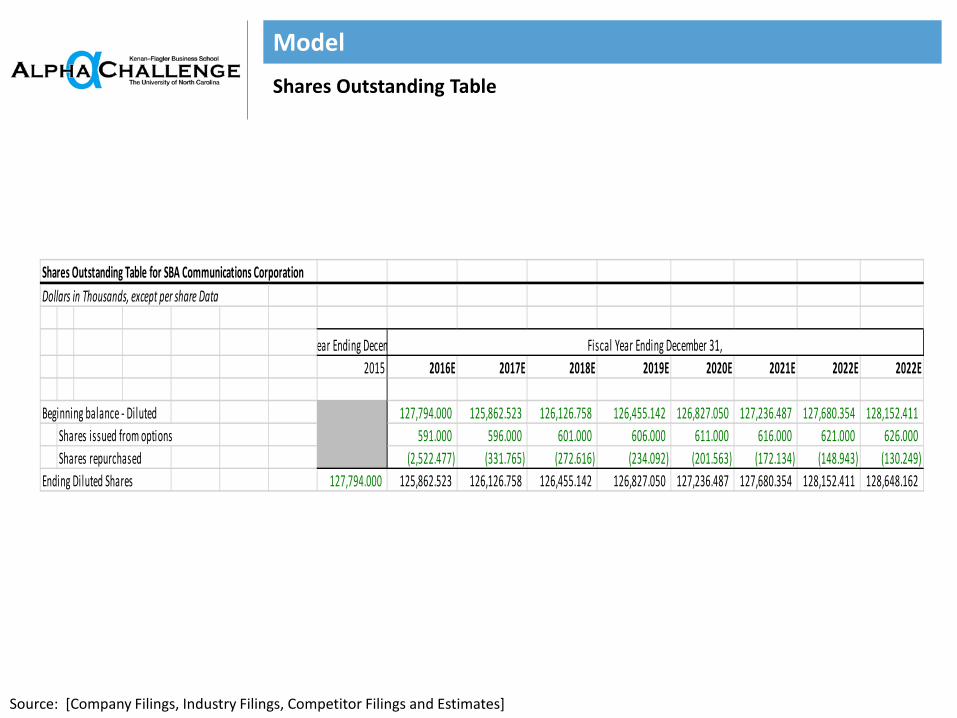
Shares Outstanding Table
Source: [Company Filings, Industry Filings, Competitor Filings and Estimates]
Shares Outstanding Table for SBA Communications CorporationDollars in Thousands, except per share Data
2015 2016E 2017E 2018E 2019E 2020E 2021E 2022E 2022E
Beginning balance - Diluted 127,794.000 125,862.523 126,126.758 126,455.142 126,827.050 127,236.487 127,680.354 128,152.411Shares issued from options 591.000 596.000 601.000 606.000 611.000 616.000 621.000 626.000Shares repurchased (2,522.477) (331.765) (272.616) (234.092) (201.563) (172.134) (148.943) (130.249)
Ending Diluted Shares 127,794.000 125,862.523 126,126.758 126,455.142 126,827.050 127,236.487 127,680.354 128,152.411 128,648.162
Year Ending Decem Fiscal Year Ending December 31,

Model
Debt Schedule
Source: [Company Filings, Industry Filings, Competitor Filings and Estimates]
Debt and Interest Schedule for SBA Communications CorporationDollars in Thousands, except per share Data
2015 2016E 2017E 2018E 2019E 2020E 2021E 2022E 2023E
Cash Flow from Financing Activities ($160,159.3) ($257,662.3) ($386,423.7) ($529,654.1) ($705,806.2) ($912,394.7) ($1,152,761.5) ($1,430,109.3)Purchases of common stock (342,575.7) (50,000.0) (50,000.0) (50,000.0) (50,000.0) (50,000.0) (50,000.0) (50,000.0)Dividends Paid 0.0 (241,987.4) (372,767.4) (518,132.5) (696,541.9) (905,517.2) (1,148,407.6) (1,428,423.7)Option Proceeds 32,416.4 34,325.1 36,343.7 38,478.4 40,735.7 43,122.5 45,646.1 48,314.3Plus: beginning cash balance 118,039.0 178,166.9 281,875.8 406,131.6 535,664.7 658,583.9 759,196.9 819,639.4Less: minimum cash balance (100,000.0) (100,000.0) (100,000.0) (100,000.0) (100,000.0) (100,000.0) (100,000.0) (100,000.0)
Cash vailable for debt repayment ($452,279.7) ($437,157.7) ($590,971.6) ($753,176.6) ($975,947.6) ($1,266,205.6) ($1,646,326.1) ($2,140,579.3)Credit Facil ity Borrowing - - - - - - - - Credit Facil ity (repayment) - - - - - - - - Long-Term Debt Borrowing 700,000.0 - - - - - - - Long-Term Debt (repayment) (550,000.0) - - - - - - -
Excess cash available for Senior Secured Debt ($302,279.7) ($437,157.7) ($590,971.6) ($753,176.6) ($975,947.6) ($1,266,205.6) ($1,646,326.1) ($2,140,579.3)
BOLD = Unsecured DebtCarrying Value - GAAP
Total Debt $8,542,305.0 $8,692,305.0 $8,692,305.0 $8,692,305.0 $8,692,305.0 $8,692,305.0 $8,692,305.0 $8,692,305.0 $8,692,305.0
5.625% Senior Notes 2019Beginning balance $500,000.0 $500,000.0 $500,000.0 $500,000.0 $500,000.0 $500,000.0 $500,000.0 $500,000.0Issuance - - - - - - - - Repayment - - - - - - - - Ending balance $500,000.0 $500,000.0 $500,000.0 $500,000.0 $500,000.0 $500,000.0 $500,000.0 $500,000.0 $500,000.0
5.75% Senior Notes 2020Beginning balance $800,000.0 $800,000.0 $800,000.0 $800,000.0 $800,000.0 $800,000.0 $800,000.0 $800,000.0Issuance - - - - - - - - Repayment - - - - - - - - Ending balance $800,000.0 $800,000.0 $800,000.0 $800,000.0 $800,000.0 $800,000.0 $800,000.0 $800,000.0 $800,000.0
4.875% Senior Notes 2022Beginning balance $744,806.0 $744,806.0 $744,806.0 $744,806.0 $744,806.0 $744,806.0 $744,806.0 $744,806.0Issuance - - - - - - - - Repayment - - - - - - - - Ending balance $744,806.0 $744,806.0 $744,806.0 $744,806.0 $744,806.0 $744,806.0 $744,806.0 $744,806.0 $744,806.0
2010-2C Tower Securities 2017Beginning Balance $550,000.0 $0.0 $0.0 $0.0 $0.0 $0.0 $0.0 $0.0Issuance - - - - - - - - Repayment (550,000.0) - - - - - - - Ending balance $550,000.0 $0.0 $0.0 $0.0 $0.0 $0.0 $0.0 $0.0 $0.0
2012-1C Tower Securities 2017Beginning balance $610,000.0 $610,000.0 $610,000.0 $610,000.0 $610,000.0 $610,000.0 $610,000.0 $610,000.0Issuance - - - - - - - - Repayment - - - - - - - - Ending balance $610,000.0 $610,000.0 $610,000.0 $610,000.0 $610,000.0 $610,000.0 $610,000.0 $610,000.0 $610,000.0
2013-1C Tower Securities 2018Beginning balance $425,000.0 $425,000.0 $425,000.0 $425,000.0 $425,000.0 $425,000.0 $425,000.0 $425,000.0Issuance - - - - - - - - Repayment - - - - - - - - Ending balance $425,000.0 $425,000.0 $425,000.0 $425,000.0 $425,000.0 $425,000.0 $425,000.0 $425,000.0 $425,000.0
2013-2C Tower Securities 2023Beginning balance $575,000.0 $575,000.0 $575,000.0 $575,000.0 $575,000.0 $575,000.0 $575,000.0 $575,000.0Issuance - - - - - - - - Repayment - - - - - - - - Ending balance $575,000.0 $575,000.0 $575,000.0 $575,000.0 $575,000.0 $575,000.0 $575,000.0 $575,000.0 $575,000.0
2013-1D Tower Securities 2018Beginning balance $330,000.0 $330,000.0 $330,000.0 $330,000.0 $330,000.0 $330,000.0 $330,000.0 $330,000.0Issuance - - - - - - - - Repayment - - - - - - - - Ending balance $330,000.0 $330,000.0 $330,000.0 $330,000.0 $330,000.0 $330,000.0 $330,000.0 $330,000.0 $330,000.0
2014-1C Tower Securities 2019Beginning Balance $920,000.0 $920,000.0 $920,000.0 $920,000.0 $920,000.0 $920,000.0 $920,000.0 $920,000.0Issuance - - - - - - - - Repayment - - - - - - - - Ending balance $920,000.0 $920,000.0 $920,000.0 $920,000.0 $920,000.0 $920,000.0 $920,000.0 $920,000.0 $920,000.0
2014-2C Tower Securities 2024Beginning balance $620,000.0 $620,000.0 $620,000.0 $620,000.0 $620,000.0 $620,000.0 $620,000.0 $620,000.0Issuance - - - - - - - - Repayment - - - - - - - - Ending balance $620,000.0 $620,000.0 $620,000.0 $620,000.0 $620,000.0 $620,000.0 $620,000.0 $620,000.0 $620,000.0
2015-1C Tower Securities 2020Beginning balance $500,000.0 $500,000.0 $500,000.0 $500,000.0 $500,000.0 $500,000.0 $500,000.0 $500,000.0Issuance - - - - - - - - Repayment - - - - - - - - Ending balance $500,000.0 $500,000.0 $500,000.0 $500,000.0 $500,000.0 $500,000.0 $500,000.0 $500,000.0 $500,000.0
2016-1C Tower Securities 2046Beginning balance $0.0 $700,000.0 $700,000.0 $700,000.0 $700,000.0 $700,000.0 $700,000.0 $700,000.0Issuance 700,000.0 - - - - - - - Repayment - - - - - - - - Ending balance $0.0 $700,000.0 $700,000.0 $700,000.0 $700,000.0 $700,000.0 $700,000.0 $700,000.0 $700,000.0
Revolving Credit Facil ity 2017Beginning Balance $0.0 $0.0 $0.0 $0.0 $0.0 $0.0 $0.0 $0.0Issuance - - - - - - - - Repayment - - - - - - - - Ending balance $0.0 $0.0 $0.0 $0.0 $0.0 $0.0 $0.0 $0.0 $0.0
2014 Term Loan 2021Beginning balance $1,474,641.0 $1,474,641.0 $1,474,641.0 $1,474,641.0 $1,474,641.0 $1,474,641.0 $1,474,641.0 $1,474,641.0Issuance - - - - - - - - Repayment - - - - - - - - Ending balance $1,474,641.0 $1,474,641.0 $1,474,641.0 $1,474,641.0 $1,474,641.0 $1,474,641.0 $1,474,641.0 $1,474,641.0 $1,474,641.0
2015 Term Loan 2022Beginning balance $492,858.0 $492,858.0 $492,858.0 $492,858.0 $492,858.0 $492,858.0 $492,858.0 $492,858.0Issuance - - - - - - - - Repayment - - - - - - - - Ending balance $492,858.0 $492,858.0 $492,858.0 $492,858.0 $492,858.0 $492,858.0 $492,858.0 $492,858.0 $492,858.0
Year Ending Decem Fiscal Year Ending December 31,

Model
Interest Schedule
Source: [Company Filings, Industry Filings, Competitor Filings and Estimates]
5.625% Senior Notes $500,000.0 $500,000.0 $500,000.0 $500,000.0 $500,000.0 $500,000.0 $500,000.0 $500,000.0 $500,000.0Interest Rate 5.63% 5.63% 5.63% 5.63% 5.63% 5.63% 5.63% 5.63% 5.63%Interest Payments $28,125.0 $28,125.0 $28,125.0 $28,125.0 $28,125.0 $28,125.0 $28,125.0 $28,125.0 $28,125.0
SN Indenture: Restrict SBA to issue Debt in Excess of 9.5x Annualized Cons EBITDA per FQ5.75% Senior Notes $800,000.0 $800,000.0 $800,000.0 $800,000.0 $800,000.0 $800,000.0 $800,000.0 $800,000.0 $800,000.0
Interest Rate 5.75% 5.75% 5.75% 5.75% 5.75% 5.75% 5.75% 5.75% 5.75%Interest Payments $46,000.0 $46,000.0 $46,000.0 $46,000.0 $46,000.0 $46,000.0 $46,000.0 $46,000.0 $46,000.0
4.875% Senior Notes $747,403.0 $744,806.0 $744,806.0 $744,806.0 $744,806.0 $744,806.0 $744,806.0 $744,806.0 $744,806.0Interest Rate 4.88% 4.88% 4.88% 4.88% 4.88% 4.88% 4.88% 4.88% 4.88%Interest Payments $36,435.9 $36,309.3 $36,309.3 $36,309.3 $36,309.3 $36,309.3 $36,309.3 $36,309.3 $36,309.3
2010-2C Tower Securities $550,000.0 $550,000.0 $0.0 $0.0 $0.0 $0.0 $0.0 $0.0 $0.0Interest Rate 5.10% 5.10% 5.10% 5.10% 5.10% 5.10% 5.10% 5.10% 5.10%Interest Payments $28,055.5 $28,055.5 $0.0 $0.0 $0.0 $0.0 $0.0 $0.0 $0.0
2012-1C Tower Securities $610,000.0 $610,000.0 $610,000.0 $610,000.0 $610,000.0 $610,000.0 $610,000.0 $610,000.0 $610,000.0Interest Rate 2.93% 2.93% 2.93% 2.93% 2.93% 2.93% 2.93% 2.93% 2.93%Interest Payments $17,891.3 $17,891.3 $17,891.3 $17,891.3 $17,891.3 $17,891.3 $17,891.3 $17,891.3 $17,891.3
2013-1C Tower Securities $425,000.0 $425,000.0 $425,000.0 $425,000.0 $425,000.0 $425,000.0 $425,000.0 $425,000.0 $425,000.0Interest Rate 2.24% 2.24% 2.24% 2.24% 2.24% 2.24% 2.24% 2.24% 2.24%Interest Payments $9,520.0 $9,520.0 $9,520.0 $9,520.0 $9,520.0 $9,520.0 $9,520.0 $9,520.0 $9,520.0
2013-2C Tower Securities $575,000.0 $575,000.0 $575,000.0 $575,000.0 $575,000.0 $575,000.0 $575,000.0 $575,000.0 $575,000.0Interest Rate 3.72% 3.72% 3.72% 3.72% 3.72% 3.72% 3.72% 3.72% 3.72%Interest Payments $21,401.5 $21,401.5 $21,401.5 $21,401.5 $21,401.5 $21,401.5 $21,401.5 $21,401.5 $21,401.5
2013-1D Tower Securities $330,000.0 $330,000.0 $330,000.0 $330,000.0 $330,000.0 $330,000.0 $330,000.0 $330,000.0 $330,000.0Interest Rate 3.60% 3.60% 3.60% 3.60% 3.60% 3.60% 3.60% 3.60% 3.60%Interest Payments $11,873.4 $11,873.4 $11,873.4 $11,873.4 $11,873.4 $11,873.4 $11,873.4 $11,873.4 $11,873.4
2014-1C Tower Securities $920,000.0 $920,000.0 $920,000.0 $920,000.0 $920,000.0 $920,000.0 $920,000.0 $920,000.0 $920,000.0Interest Rate 2.90% 2.90% 2.90% 2.90% 2.90% 2.90% 2.90% 2.90% 2.90%Interest Payments $26,661.6 $26,661.6 $26,661.6 $26,661.6 $26,661.6 $26,661.6 $26,661.6 $26,661.6 $26,661.6
2014-2C Tower Securities $620,000.0 $620,000.0 $620,000.0 $620,000.0 $620,000.0 $620,000.0 $620,000.0 $620,000.0 $620,000.0Interest Rate 3.87% 3.87% 3.87% 3.87% 3.87% 3.87% 3.87% 3.87% 3.87%Interest Payments $23,987.8 $23,987.8 $23,987.8 $23,987.8 $23,987.8 $23,987.8 $23,987.8 $23,987.8 $23,987.8
2015-1C Tower Securities $500,000.0 $500,000.0 $500,000.0 $500,000.0 $500,000.0 $500,000.0 $500,000.0 $500,000.0 $500,000.0Interest Rate 3.16% 3.16% 3.16% 3.16% 3.16% 3.16% 3.16% 3.16% 3.16%Interest Payments $15,780.0 $15,780.0 $15,780.0 $15,780.0 $15,780.0 $15,780.0 $15,780.0 $15,780.0 $15,780.0
2016-1C Tower Securities $0.0 $350,000.0 $700,000.0 $700,000.0 $700,000.0 $700,000.0 $700,000.0 $700,000.0 $700,000.0Interest Rate 2.88% 2.88% 2.88% 2.88% 2.88% 2.88% 2.88% 2.88% 2.88%Interest Payments $0.0 $10,069.5 $20,139.0 $20,139.0 $20,139.0 $20,139.0 $20,139.0 $20,139.0 $20,139.0
Revolving Credit Facil ity $0.0 $0.0 $0.0 $0.0 $0.0 $0.0 $0.0 $0.0 $0.0Interest Rate 0.25% 0.25% 0.25% 0.25% 0.25% 0.25% 0.25% 0.25% 0.25%Interest Payments $2,500.0 $2,500.0 $2,500.0 $2,500.0 $2,500.0 $2,500.0 $2,500.0 $2,500.0 $2,500.0
$775 - $1bln, Eurodollar Rate + Margin Range 137.5bps - 200bps or Base Rate 37.5-100bps, Commitment Fee of .25% Unused2014 Term Loan $1,476,070.5 $1,474,641.0 $1,474,641.0 $1,474,641.0 $1,474,641.0 $1,474,641.0 $1,474,641.0 $1,474,641.0 $1,474,641.0
Interest Rate 3.25% 3.25% 3.25% 3.25% 3.25% 3.25% 3.25% 3.25% 3.25%Interest Payments $47,972.3 $47,925.8 $47,925.8 $47,925.8 $47,925.8 $47,925.8 $47,925.8 $47,925.8 $47,925.8
2015 Term Loan $495,179.0 $492,858.0 $492,858.0 $492,858.0 $492,858.0 $492,858.0 $492,858.0 $492,858.0 $492,858.0Interest Rate 3.25% 3.25% 3.25% 3.25% 3.25% 3.25% 3.25% 3.25% 3.25%Interest Payments $16,093.3 $16,017.9 $16,017.9 $16,017.9 $16,017.9 $16,017.9 $16,017.9 $16,017.9 $16,017.9
Interest Expense $332,297.6 $342,118.6 $324,132.6 $324,132.6 $324,132.6 $324,132.6 $324,132.6 $324,132.6 $324,132.6
Cash $148,102.9 $230,021.3 $344,003.7 $470,898.1 $597,124.3 $708,890.4 $789,418.1 $819,639.4 $819,639.42.72% 2.72% 2.72% 2.72% 2.72% 2.72% 2.72% 2.72% 2.72%
($4,028.4) ($6,256.6) ($9,356.9) ($12,808.4) ($16,241.8) ($19,281.8) ($21,472.2) ($22,294.2) ($22,294.2)