Embed Size (px)
Citation preview
Russell CommuniquéNovember 2012
Current and emerging investment issues: Russell perspective
The case for Defensive equityAnd the benefits of an active approach
Also in this issue:
2 Do you know where your equity risks are?
9 Quality Income
11 Marshmallows, the long-term, trust and incentives
exeCuTive view
1 welcome from John Stannard
STRATegiC FOCuS
2 Do you know where your equity risks are? Knowing which factor exposures exist in your portfolios
4 The case for Defensive equity And the benefits of an active approach
9 Quality income understanding the role of investment Strategy Portfolios (“iSPs”)
gOveRNANCe & RegulATORy FOCuS
11 Marshmallows, the long-term, trust and incentives
The Kay Review reports
ReSeARCH FOCuS
13 Russell Research summaries
This publication is written by associates from Russell’s consulting team as well as other service lines within Russell. if you would like further information on any of the topics included here, do not hesitate to get in touch with your usual Russell contact.
The Consulting team is responsible for providing advice on all aspects of the investment process, including governance, investment policy setting, asset allocation, asset class strategy and manager selection. Russell is one of the world’s largest providers of investment advice, with over 40 years’ experience in this field.
editors:
Lloyd Raynor, Consulting
Jihan Diolosa, Consulting
Russell Communiqué
Russell investments // Russell Communiqué // europe, Middle east & Africa
1Russell investments // Russell Communiqué // europe, Middle east & Africa
Dear Readers,
in the final edition of Communique for 2012 we turn our attention to the equity in our client’s portfolios. equity has been the poor relation to fixed income over recent years as clients have focussed on hedging strategies and moving their fixed income into extended credit sectors. while this focus has certainly been warranted, we now think the time is right for clients to give greater consideration to their equity portfolios. given the continuation of low yields many funds cannot afford to de-risk and retain an emphasis on the equity risk premium as a result.
in Do you know where your equity risks are? we make the case for understanding the various factor exposures that exist in an equity portfolio: exposures to value or growth, to size, to volatility and market sensitivity for example. Some of these factors have tended to have a significant non-zero payoff, and it is for this reason that clients should have a proper understanding of the exposures within their equity portfolios. One of the most notable observations in recent years is the positive payoff associated with having an exposure to less volatile stocks. in light of this, in The case for Defensive equity we explain why clients may consider having an allocation to low volatility equity within their equity structures. we also explain why we believe the Russell Defensive index family is a good benchmark for such an approach as well as the potential advantages of going active in this space.
Continuing with the theme of actively managing the exposures embedded within your equity portfolios, in Quality Income we describe our use of an investment Strategy Portfolio (“iSP”) in our uK and european multi-manager funds. iSPs are concentrated sleeve portfolios constructed by Russell’s portfolio managers to improve the efficiency of portfolios, plugging any gaps that cannot be readily filled with the use of active managers. we find that Quality income, our sleeve portfolio of high quality high income stocks, has succeeded in reducing downside risk without having a detrimental impact on return.
Finally, in Marshmallows, the long-term, trust and incentives we describe the recommendations of the Kay Review, a uK study looking into whether equity markets inherently foster short-termism and whether this has reduced our long-term wellbeing.
This edition of Communiqué is a little more focused than usual with its concentration on equity. we hope you find this focus useful, and should you require any further detail on individual articles don’t hesitate to get in touch with your usual Russell contact.
Regards,
John StannardConsulting
welcomeBy John Stannard, Consulting
exeCuTive view
John Stannard
Russell investments // Russell Communiqué // europe, Middle east & Africa 2
Consider the various factor exposures that can exist in an equity portfolio: exposures to value or growth, to size, to volatility and market sensitivity, to name a few1. Factors can be intentionally included in a portfolio, but often they are the byproducts of decisions made over time without careful consideration of their potential impact. it is important to be fully aware of the sorts of risks your equity portfolios are running on an ongoing basis. This is possible with the use of risk management tools such as Axioma, a tool that Russell uses when managing and advising on equity portfolios.
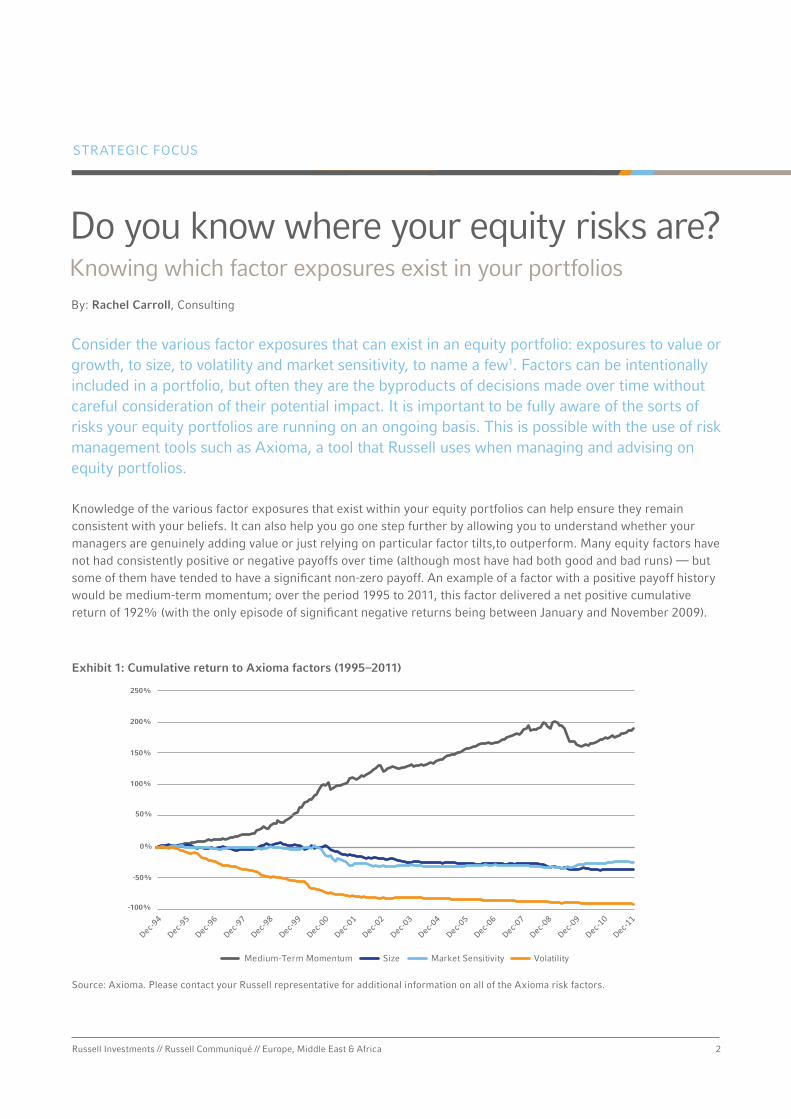
Knowledge of the various factor exposures that exist within your equity portfolios can help ensure they remain consistent with your beliefs. it can also help you go one step further by allowing you to understand whether your managers are genuinely adding value or just relying on particular factor tilts,to outperform. Many equity factors have not had consistently positive or negative payoffs over time (although most have had both good and bad runs) — but some of them have tended to have a significant non-zero payoff. An example of a factor with a positive payoff history would be medium-term momentum; over the period 1995 to 2011, this factor delivered a net positive cumulative return of 192% (with the only episode of significant negative returns being between January and November 2009).
Do you know where your equity risks are?Knowing which factor exposures exist in your portfoliosBy: Rachel Carroll, Consulting
Exhibit 1: Cumulative return to Axioma factors (1995–2011)
STRATegiC FOCuS
-100%
-50%
0%
50%
100%
150%
200%
250%
Medium-Term Momentum Size Market Sensitivity Volatility
Source: Axioma. Please contact your Russell representative for additional information on all of the Axioma risk factors.
3Russell investments // Russell Communiqué // europe, Middle east & Africa
However, some of the factor exposures we often see in equity portfolios—including volatility, size and market sensitivity — have tended to yield a negative payoff over time.
while both the size and market sensitivity factors have had periods wherein the payoff has been positive, since 1995 the payoff pattern for volatility has been consistently negative. This seemingly consistent attribute of the volatility factor is what is behind the rise in popularity of the low volatility and defensive equity products that have been introduced to the market.
As Bob Collie and John Osborn described last year2, most active investment managers tend to overweight volatility. Obviously, we need to take care to distinguish the positions investors take consciously to reflect a manager’s market views from those that are simply structural
biases. But given the persistence of these positions in the majority of institutional portfolios, they are something to be cognisant of.
if factor tilts exist in your portfolio, they should reflect your underlying beliefs about future payoffs. Tilts should be implemented intentionally, with a full understanding of historical payoffs and an eye to expected future payoffs. The default starting point for any factor exposure may in theory be expected to be a neutral position—in line with the market. There can be good reasons to move away from that neutral default position, but doing so carelessly or without a clear picture of the extent of and rationale for the exposure is a bad idea. it’s good to know where your risks are!
Russell investments // Russell Communiqué // europe, Middle east & Africa 4
The case for Defensive equityAnd the benefits of an active approach
The historically superior payoff and lower risk of low volatility stocks has generated substantial interest in recent years. we believe that this approach warrants investigation for inclusion in your equity portfolio structure. we also believe that the Russell Defensive index family allows for the best representation of the approach, and that there are additional benefits from having an active line-up of managers benchmarked to such indices. indeed, this is why we are shortly launching the active Russell global Defensive Fund benchmarked to the Russell global Defensive index.
By Lloyd Raynor, Consulting and Patrick Egan, investment Division
The low volatility anomaly: empirical evidence
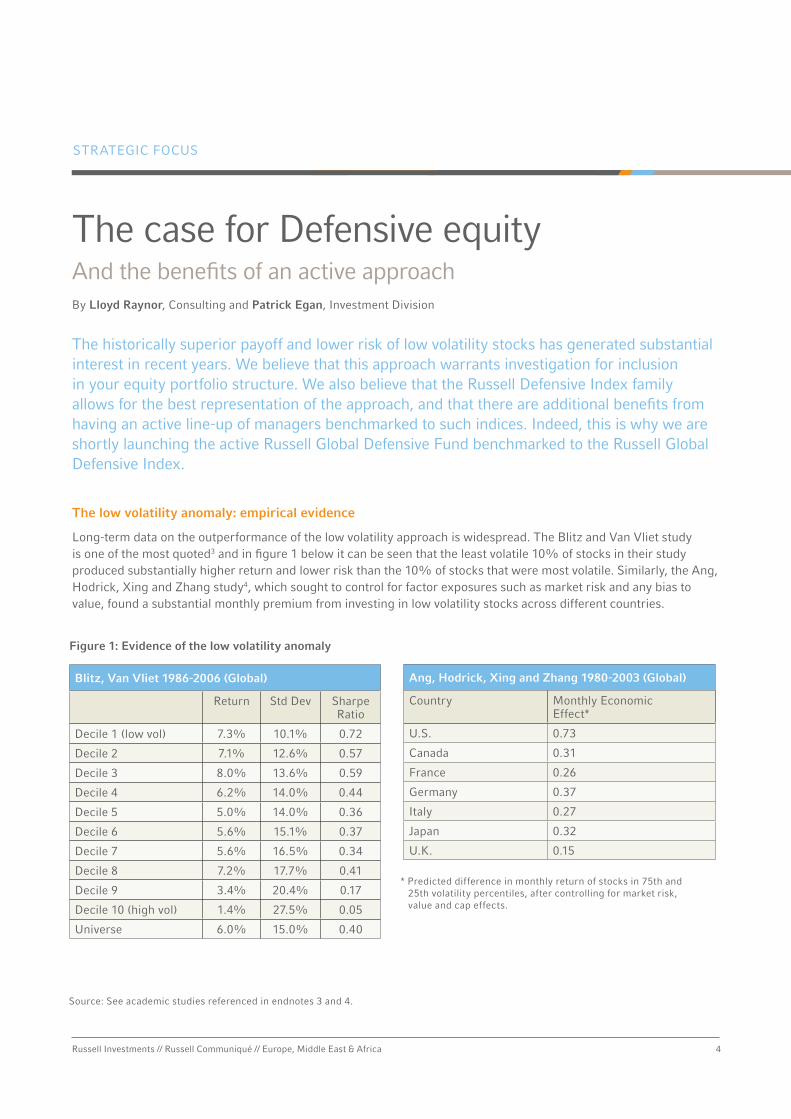
long-term data on the outperformance of the low volatility approach is widespread. The Blitz and van vliet study is one of the most quoted3 and in figure 1 below it can be seen that the least volatile 10% of stocks in their study produced substantially higher return and lower risk than the 10% of stocks that were most volatile. Similarly, the Ang, Hodrick, xing and Zhang study4, which sought to control for factor exposures such as market risk and any bias to value, found a substantial monthly premium from investing in low volatility stocks across different countries.
Figure 1: Evidence of the low volatility anomaly
* Predicted difference in monthly return of stocks in 75th and 25th volatility percentiles, after controlling for market risk, value and cap effects.
STRATegiC FOCuS
Blitz, Van Vliet 1986-2006 (Global)
Return Std Dev Sharpe Ratio
Decile 1 (low vol) 7.3% 10.1% 0.72
Decile 2 7.1% 12.6% 0.57
Decile 3 8.0% 13.6% 0.59
Decile 4 6.2% 14.0% 0.44
Decile 5 5.0% 14.0% 0.36
Decile 6 5.6% 15.1% 0.37
Decile 7 5.6% 16.5% 0.34
Decile 8 7.2% 17.7% 0.41
Decile 9 3.4% 20.4% 0.17
Decile 10 (high vol) 1.4% 27.5% 0.05
universe 6.0% 15.0% 0.40
Ang, Hodrick, Xing and Zhang 1980-2003 (Global)
Country Monthly economic effect*
u.S. 0.73
Canada 0.31
France 0.26
germany 0.37
italy 0.27
Japan 0.32
u.K. 0.15
Source: See academic studies referenced in endnotes 3 and 4.
5Russell investments // Russell Communiqué // europe, Middle east & Africa
Economic rationale for the approach
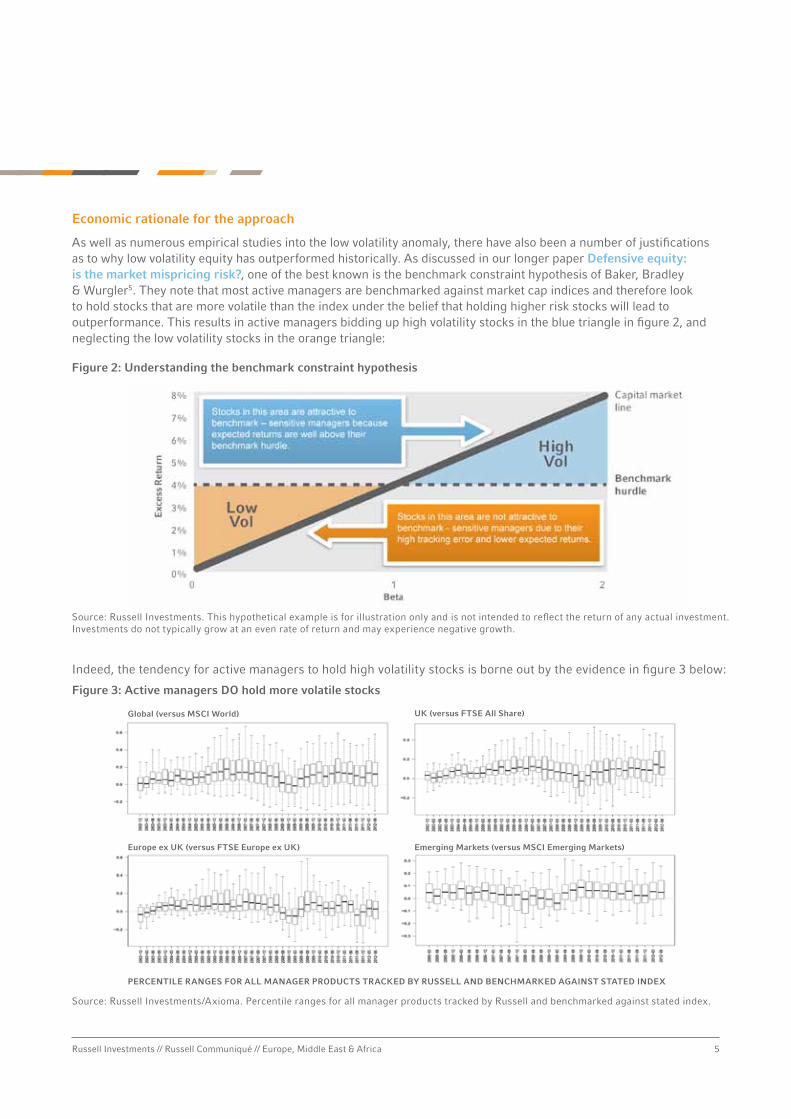
As well as numerous empirical studies into the low volatility anomaly, there have also been a number of justifications as to why low volatility equity has outperformed historically. As discussed in our longer paper Defensive equity: is the market mispricing risk?, one of the best known is the benchmark constraint hypothesis of Baker, Bradley & wurgler5. They note that most active managers are benchmarked against market cap indices and therefore look to hold stocks that are more volatile than the index under the belief that holding higher risk stocks will lead to outperformance. This results in active managers bidding up high volatility stocks in the blue triangle in figure 2, and neglecting the low volatility stocks in the orange triangle:
indeed, the tendency for active managers to hold high volatility stocks is borne out by the evidence in figure 3 below:
Figure 3: Active managers DO hold more volatile stocks
Figure 2: Understanding the benchmark constraint hypothesis
Source: Russell investments/Axioma. Percentile ranges for all manager products tracked by Russell and benchmarked against stated index.
Source: Russell investments. This hypothetical example is for illustration only and is not intended to reflect the return of any actual investment. investments do not typically grow at an even rate of return and may experience negative growth.
Global (versus MSCI World) UK (versus FTSE All Share)
Europe ex UK (versus FTSE Europe ex UK) Emerging Markets (versus MSCI Emerging Markets)
PERCEnTILE RAnGES FOR ALL MAnAGER PRODUCTS TRACKED By RUSSELL AnD BEnCHMARKED AGAInST STATED InDEX
Russell investments // Russell Communiqué // europe, Middle east & Africa 6
STRATegiC FOCuS
An alternative explanation suggested by Cowan & wilderman6 is that high beta stocks provide a lower risk way for investors to gain a magnified exposure to market performance as compared with the equivalent of holding the full market portfolio and applying leverage to it. under the latter approach the theory is that you have a higher chance of losing all your money, and as investors recognise this, they effectively pay for an insurance premium when buying high beta stocks reducing the prospective returns from high beta stocks7.
Why use the Russell Defensive Index?
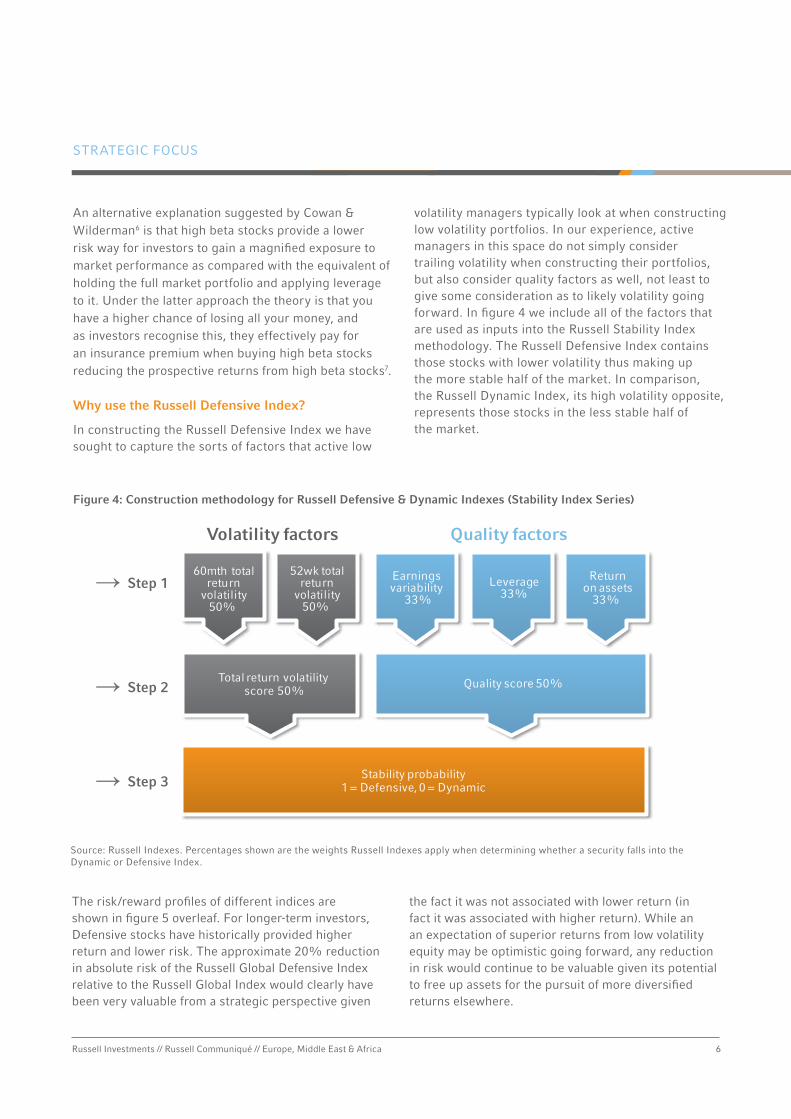
in constructing the Russell Defensive index we have sought to capture the sorts of factors that active low
volatility managers typically look at when constructing low volatility portfolios. in our experience, active managers in this space do not simply consider trailing volatility when constructing their portfolios, but also consider quality factors as well, not least to give some consideration as to likely volatility going forward. in figure 4 we include all of the factors that are used as inputs into the Russell Stability index methodology. The Russell Defensive index contains those stocks with lower volatility thus making up the more stable half of the market. in comparison, the Russell Dynamic index, its high volatility opposite, represents those stocks in the less stable half of the market.
Figure 4: Construction methodology for Russell Defensive & Dynamic Indexes (Stability Index Series)
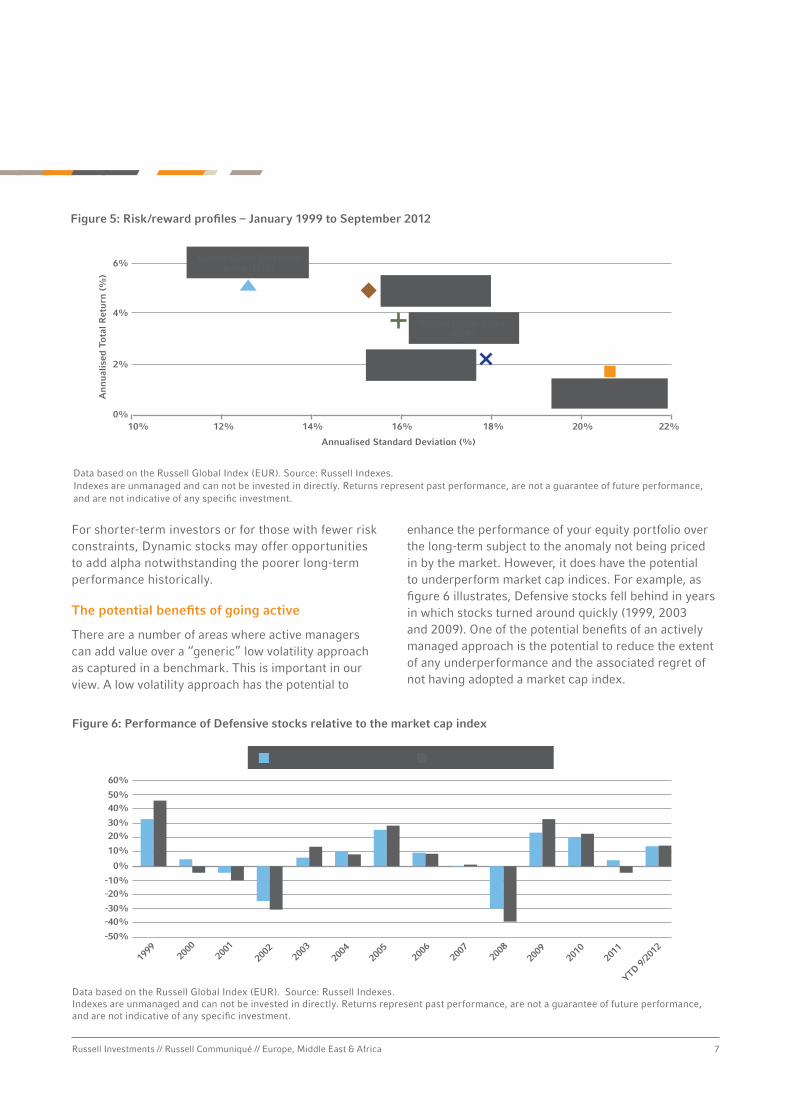
The risk/reward profiles of different indices are shown in figure 5 overleaf. For longer-term investors, Defensive stocks have historically provided higher return and lower risk. The approximate 20% reduction in absolute risk of the Russell global Defensive index relative to the Russell global index would clearly have been very valuable from a strategic perspective given
the fact it was not associated with lower return (in fact it was associated with higher return). while an an expectation of superior returns from low volatility equity may be optimistic going forward, any reduction in risk would continue to be valuable given its potential to free up assets for the pursuit of more diversified returns elsewhere.
Total return volatility score 50%
Quality score 50%
Volatility factors Quality factors
Stability probability1 = Defensive, 0 = Dynamic
Leverage33%
Returnon assets
33% → Step 1
→ Step 2
→ Step 3
60mth totalreturn
volatility50%
52wk totalreturn
volatility50%
Earnings variability
33%
Source: Russell indexes. Percentages shown are the weights Russell indexes apply when determining whether a security falls into the Dynamic or Defensive index.
7Russell investments // Russell Communiqué // europe, Middle east & Africa
For shorter-term investors or for those with fewer risk constraints, Dynamic stocks may offer opportunities to add alpha notwithstanding the poorer long-term performance historically.
The potential benefits of going active
There are a number of areas where active managers can add value over a “generic” low volatility approach as captured in a benchmark. This is important in our view. A low volatility approach has the potential to
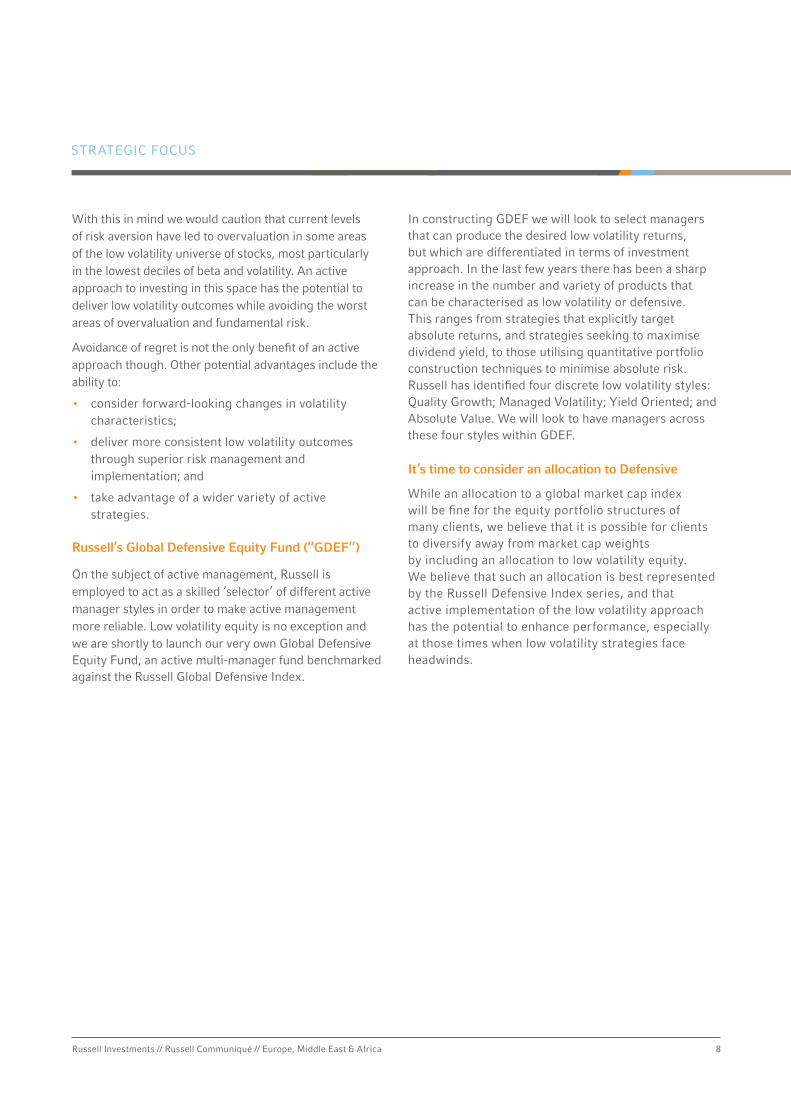
enhance the performance of your equity portfolio over the long-term subject to the anomaly not being priced in by the market. However, it does have the potential to underperform market cap indices. For example, as figure 6 illustrates, Defensive stocks fell behind in years in which stocks turned around quickly (1999, 2003 and 2009). One of the potential benefits of an actively managed approach is the potential to reduce the extent of any underperformance and the associated regret of not having adopted a market cap index.
Russell Global Growth Index (EUR)
Russell Global Defensive Index (EUR)
Russell Global Value Index (EUR)
Russell Global Index (EUR)
Russell Global Dynamic Index (EUR)
Annualised Standard Deviation (%)
An
nua
lised
Tot
al R
etur
n (
%)
0%
2%
4%
6%
10% 12% 14% 16% 18% 20% 22%
-50%
-40%-30%
-20%-10%
0%
10%
20%30%
40%50%
60%
1999
2000
2001
2002
2003
2004
2005
2006
2007
2008
2009
2010
2011
YTD 9/20
12
Russell Global Defensive IndexTM Russell Global Index (EUR)
Data based on the Russell global index (euR). Source: Russell indexes.indexes are unmanaged and can not be invested in directly. Returns represent past performance, are not a guarantee of future performance, and are not indicative of any specific investment.
Figure 5: Risk/reward profiles – January 1999 to September 2012
Figure 6: Performance of Defensive stocks relative to the market cap index
Data based on the Russell global index (euR). Source: Russell indexes.indexes are unmanaged and can not be invested in directly. Returns represent past performance, are not a guarantee of future performance, and are not indicative of any specific investment.
Russell Global Growth Index (EUR)
Russell Global Defensive Index (EUR)
Russell Global Value Index (EUR)
Russell Global Index (EUR)
Russell Global Dynamic Index (EUR)
Annualised Standard Deviation (%)
An
nua
lised
Tot
al R
etur
n (
%)
0%
2%
4%
6%
10% 12% 14% 16% 18% 20% 22%
-50%
-40%-30%
-20%-10%
0%
10%
20%30%
40%50%
60%
1999
2000
2001
2002
2003
2004
2005
2006
2007
2008
2009
2010
2011
YTD 9/20
12
Russell Global Defensive IndexTM Russell Global Index (EUR)
Russell investments // Russell Communiqué // europe, Middle east & Africa 8
STRATegiC FOCuS
with this in mind we would caution that current levels of risk aversion have led to overvaluation in some areas of the low volatility universe of stocks, most particularly in the lowest deciles of beta and volatility. An active approach to investing in this space has the potential to deliver low volatility outcomes while avoiding the worst areas of overvaluation and fundamental risk.
Avoidance of regret is not the only benefit of an active approach though. Other potential advantages include the ability to:
• consider forward-looking changes in volatility characteristics;
• deliver more consistent low volatility outcomes through superior risk management and implementation; and
• take advantage of a wider variety of active strategies.
Russell’s Global Defensive Equity Fund (“GDEF”)
On the subject of active management, Russell is employed to act as a skilled ‘selector’ of different active manager styles in order to make active management more reliable. low volatility equity is no exception and we are shortly to launch our very own global Defensive equity Fund, an active multi-manager fund benchmarked against the Russell global Defensive index.
in constructing gDeF we will look to select managers that can produce the desired low volatility returns, but which are differentiated in terms of investment approach. in the last few years there has been a sharp increase in the number and variety of products that can be characterised as low volatility or defensive. This ranges from strategies that explicitly target absolute returns, and strategies seeking to maximise dividend yield, to those utilising quantitative portfolio construction techniques to minimise absolute risk. Russell has identified four discrete low volatility styles: Quality growth; Managed volatility; yield Oriented; and Absolute value. we will look to have managers across these four styles within gDeF.
It’s time to consider an allocation to Defensive
while an allocation to a global market cap index will be fine for the equity portfolio structures of many clients, we believe that it is possible for clients to diversify away from market cap weights by including an allocation to low volatility equity. we believe that such an allocation is best represented by the Russell Defensive index series, and that active implementation of the low volatility approach has the potential to enhance performance, especially at those times when low volatility strategies face headwinds.
9Russell investments // Russell Communiqué // europe, Middle east & Africa
in this edition of Communique we have discussed how active management can be applied both to stock selection as well as factor exposures within your equity portfolios. in this article we highlight another form of active management: the inclusion of “investment Strategy Portfolios” or iSPs. These are sleeve portfolios constructed by Russell’s portfolio managers to improve the investment efficiency of multi-manager portfolios run on behalf of clients. iSPs plug any gaps that cannot be readily filled with the use of active managers. They are typically concentrated to ensure that capital is used efficiently, while their formulaic nature means that we can apply and remove them rapidly as market conditions adjust. “Quality income”, Russell’s very own quantitative income strategy, is a perfect example of just such a sleeve portfolio and was used as an effective weapon against market volatility in our uK and european funds.
By: Robert Mears, investment Division
Quality incomeunderstanding the role of investment Strategy Portfolios (“iSPs”)
The role of Quality Income
in October 2011, we added Quality income as a sleeve portfolio to a number of the uK and european equity multi-manager portfolios that we manage on behalf of clients. The correlation between stocks had become particularly high following the summer sell-off in 2011. This increased the correlation between the different managers to uncomfortable levels, raising concerns that the funds were not diversified enough using their usual staple of different active manager styles. Furthermore, too much risk was coming from factors such as market sensitivity and volatility. To counteract these issues, we looked for a risk-reducing strategy that was low risk, low volatility and that had low/negative correlation with the existing managers. Quality income fitted the bill perfectly.
Before discussing the construction of our Quality income strategy, it is important to note that we considered all available alternatives before implementing it. Some alternatives were quickly dismissed: cash (imprecise and with market timing risk) and eTFs (concerns over third party methodology). Adding an income manager was a more credible option but this too was ruled out. while there were managers with suitable exposures there were implementation issues as we wanted to act quickly and across multiple regions. Furthermore, we wanted to use as little capital as possible and while income managers focus
primarily on yield, they are still index aware, which dilutes their yield exposure. with Quality income, we had a more focussed exposure.
Understanding the strategy in more detail
The first thing to note is that high yields do not mean high income! Buying high yielding stocks is easy but high yields do not guarantee the stable dividend stream that can help to reduce price volatility within our portfolios. in fact, high yields are more commonly a sign of ‘distress’ with research by Societe generale showing that over 50% of companies predicted to yield more than 4% fail to meet analysts’ estimates8. Relying on sell-side analysts for dividend forecasts is also unreliable. Consensus forecasts are often slow to update, even when companies have announced publicly that they are cutting their dividend. For example, Spanish telecoms company Telefonica cancelled its dividend on the 25th July of this year but, at the time of writing, the average dividend estimate was still positive! in practice a portfolio of high yield stocks would simply be a portfolio of risky, deep value stocks with very low realised yields – the exact opposite of what clients want.
given the fact that high yields do not mean high income, in designing our strategy we focussed on the two factors that determine a company’s dividend strategy; their willingness and their ability to pay. By focusing on these
Russell investments // Russell Communiqué // europe, Middle east & Africa 10
two factors we sought to replicate a conservative equity income manager holding a portfolio of stocks with high but sustainable dividend yields. Below we discuss our methodology for understanding whether a company either will, or can, pay dividends.
Will they pay?
A company’s commitment to its dividend policy is variable and cannot be measured quantitatively. Some companies are explicit about what their policy is and are very vocal on their commitment to their dividend. For example, electrical utility SSe state very clearly that they aim to increase their dividend above the rate of RPi every year. Some companies favour the more mechanistic approach of a consistent payout ratio (more popular with european companies) which gives a more volatile dividend stream. Others may have no stated policy at all. given these issues, we made what we believed to be a reasonable simplifying assumption: if a company pays a dividend today, it will want to pay a dividend in the future.
Can they pay?
Despite management’s best intentions, a company’s financial situation may mean that cancelling the dividend is the right thing to do. we believe this decision will be based primarily on fundamentals and therefore measurable through financial statement analysis. From those companies classified as willing to pay we simply looked to exclude companies that we judged to be at risk of cancelling their dividend. we assumed that a company would keep paying a dividend if it could afford to do so, so we looked for the things that cause companies to cut their dividends: weak balance sheets and poor cash generation. we addressed the first with a volatility-adjusted measure of balance sheet strength that removed companies that are overly leveraged. The issue of cash generation was evaluated using a proprietary ‘Ability to Pay’ score that looked at cash flow volatility and a cyclically-adjusted fixed charge cover ratio to see if a company was likely to generate enough cash to maintain its dividend. Our back-tests showed these two factors had been effective in excluding companies that cut their dividends and significantly increased the realised yield versus a naive “just buy high yielders” strategy.
The benefits of Quality Income in practice
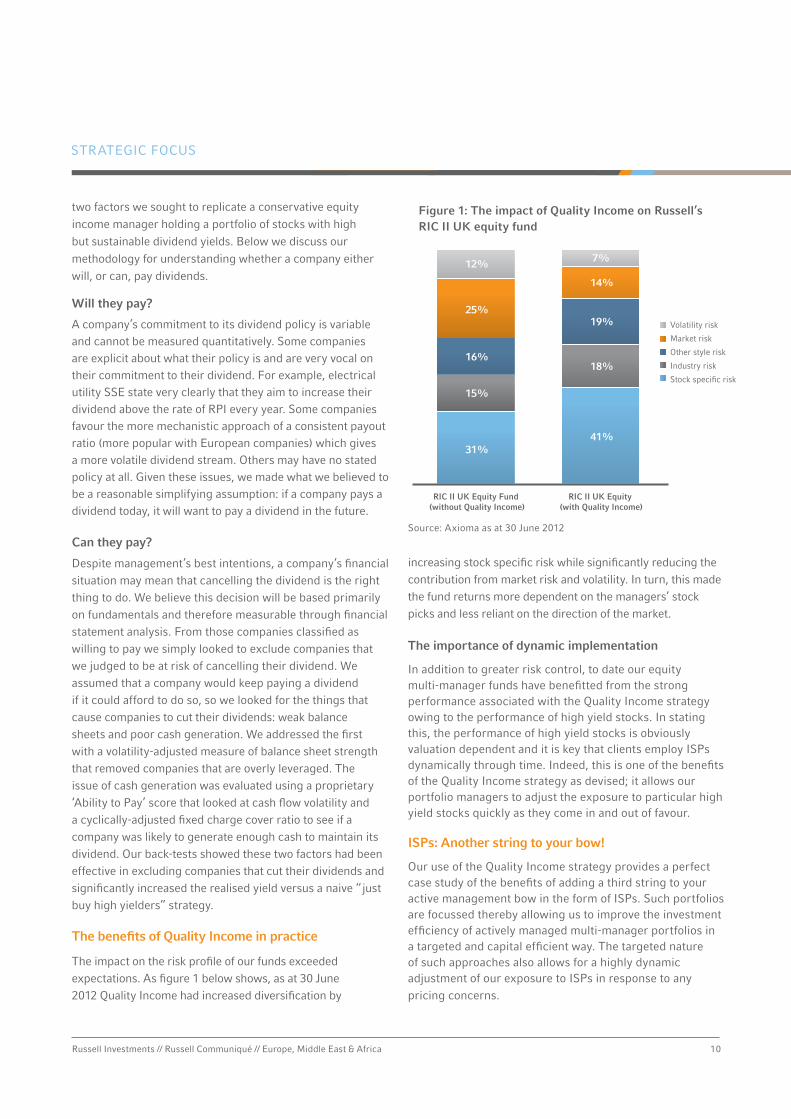
The impact on the risk profile of our funds exceeded expectations. As figure 1 below shows, as at 30 June 2012 Quality income had increased diversification by
increasing stock specific risk while significantly reducing the contribution from market risk and volatility. in turn, this made the fund returns more dependent on the managers’ stock picks and less reliant on the direction of the market.
The importance of dynamic implementation
in addition to greater risk control, to date our equity multi-manager funds have benefitted from the strong performance associated with the Quality income strategy owing to the performance of high yield stocks. in stating this, the performance of high yield stocks is obviously valuation dependent and it is key that clients employ iSPs dynamically through time. indeed, this is one of the benefits of the Quality income strategy as devised; it allows our portfolio managers to adjust the exposure to particular high yield stocks quickly as they come in and out of favour.
ISPs: Another string to your bow!
Our use of the Quality income strategy provides a perfect case study of the benefits of adding a third string to your active management bow in the form of iSPs. Such portfolios are focussed thereby allowing us to improve the investment efficiency of actively managed multi-manager portfolios in a targeted and capital efficient way. The targeted nature of such approaches also allows for a highly dynamic adjustment of our exposure to iSPs in response to any pricing concerns.
STRATegiC FOCuS
Figure 1: The impact of Quality Income on Russell’s RIC II UK equity fund
31%41%
15%
18%16%
19%25%
14%
12% 7%
RIC II UK Equity Fund (without Quality Income)
RIC II UK Equity (with Quality Income)
Volatility risk
Market risk
Other style risk
Industry risk
Stock specific risk
Source: Axioma as at 30 June 2012
11Russell investments // Russell Communiqué // europe, Middle east & Africa
it’s not often that marshmallows figure in investment conversations. But when John Kay launched his Review’s report back in the summer, he captured the audience’s attention with a video clip to show the difficulties of behaving with the long-term in mind. well known to psychologists, the marshmallow test makes several youTube appearances, and here’s the one that John Kay used at the Review launch <see video>. Faced with temptation, will the participant’s short-term desire to eat the first marshmallow overwhelm the benefit of holding out, and getting that second marshmallow? Kay’s reference to the marshmallow indicates an implicit belief on his part that short-termism in stockmarkets can inhibit long-term economic performance.
Marshmallows, the long-term, trust and incentivesThe Kay Review reports
Too much short-termism
The Kay Review was set up a year ago by the uK Secretary of State for Business, innovation and Skills, vincent Cable. Although probably not thinking of marshmallows at the time, the Secretary of State is well-known for his belief that the market economy, if uncontrolled, can foster short-termism and diminish our longer-term wellbeing. The economist John Kay, familiar to many through his weekly columns in the Financial Times where he applies his insights to business, was considered a suitable individual to lead the review. The Review’s remit was: “to examine the mechanisms of corporate control and accountability provided by uK equity markets and their impact on the long-term competitive performance of uK businesses, and to make recommendations.” The Review also concerned itself with whether government policies around regulation and procurement sufficiently encourage boards to focus on the long-term development of their businesses.
The importance of trust and incentives: let stewardship flourish
The Review makes nineteen recommendations, to which the uK Secretary of State will respond in due course. At the heart of these recommendations lie two strong beliefs. The first is that trust in the investment chain
needs both to be restored and encouraged. Kay argues that we need to be able to trust financial intermediaries to a greater extent than previously, and to have a less transactional culture. The second belief is that incentives need to be actively structured to support and encourage trustworthy behaviour.
A key recommendation is for the law Commission to review the legal concept of fiduciary duty as applied to investment by trustees and their advisers. There is a body of opinion that the standard interpretation is too narrow, and inhibits trustees from being able to take a truly long-term view inhibiting wealth creation over time. Regulatory authorities are also recommended to apply fiduciary standards to all relevant relationships in the investment chain, while another recommendation is that the Stewardship Code be developed to incorporate a more expansive form of stewardship. The Code should be not just about corporate governance, but should support a stronger relationship between companies and their shareholders around strategic issues. A related recommendation is to establish an investors’ forum to facilitate collective engagement by investors in uK companies.
Kay also recommends that government and regulators conduct a review of the metrics and models used in the investment chain. The Review sees risk as failure to meet
By: Mike Clark, Chair, Russell Sustainability Council
gOveRNANCe & RegulATORy FOCuS

Russell investments // Russell Communiqué // europe, Middle east & Africa 12 12Russell investments // Russell Communiqué // europe, Middle east & Africa
reasonable expectations rather than the current industry focus on measurements of short-term volatility and relative performance. For a company, these reasonable expectations belong to its stakeholders, whilst for an investment the expectations are those of the savers it attracts.
Using regulation to support good cultures
Kay has a clear perspective on the role of financial intermediation between the end-users, savers and companies. early in his work, Kay made it clear that he saw financial market regulation as having too much of a legal, inward-looking focus. He took the view that regulation inadequately addresses the needs of end-users. Kay brings an economist’s perspective, and focuses on the providers of capital, individual savers, and the users of capital, mostly companies. He sees existing financial regulation as a process that typically seeks to deliver more new rules to regulate against bad behaviour, which can be a fruitless task. Rather, he wants to promote the view that a key goal of regulation should be to develop and support market structures which incentivise good behaviour.
Getting that second marshmallow
Many would find it hard to argue against the direction of travel of the Kay Review recommendations. A focus on the long-term is clearly in the interests of the clients
we serve. indeed, signatories to the uN Principles for Responsible investment (“uN PRi”), a group which includes Russell, place a growing emphasis on environmental, Social and governance (“eSg”) influences in their work. it seems likely that over time this eSg perspective will intertwine with the long-term goals of a successful financial system, the focus of the Kay Review, but it will be a long path. Participants in the investment chain need to sharpen their focus on the long-term interests of those they serve, and behave accordingly. Russell is committed to playing its part. we believe our clients should get that second marshmallow.
13Russell investments // Russell Communiqué // europe, Middle east & Africa
Volatility management
Since the global credit crisis, investors have become more attuned to risk in general and to portfolio volatility more specifically. The investment industry has responded with an array of strategies to help manage volatility. This paper tests three of the most promising approaches, exploring the underpinnings of each, and questions whether the recent effectiveness of the strategies can be expected to persist.
The evolution of listed real assets
Real assets are an increasingly relevant and important part of the global economy. investors are often underinvested in real assets relative to their size in the total market portfolio. growth in developing countries, compelling income opportunities and a high potential for excess return support a higher allocation to real assets in investors’ total portfolios.
Russell Investments’ 2012 Global Survey on Alternative Investing
This survey provides a clear lens through which to view the changing nature of alternative investments in a growing multi-asset investment landscape. Our publication provides useful insight into the demand for alternative investments, defining barriers to investing in alternatives, understanding key influencers and gaining insight into key implementation issues.
Still overpaying for FX?
Historically many institutional investors overlooked the fees they paid for transacting foreign exchange (Fx). The situation has now changed. An increasing number of high profile investors have queried the extent to which they have received best execution in Fx. in this paper, we present research indicating that Fx costs are still too high and provide recommendations that investors should take to reduce such costs.
The Russell Fundamental Index series
Fundamental indices are created be weighting stocks based on economic measures of a firm’s size, breaking the direct link to stock price and capturing the economic footprint of a company. By definition stocks that are overvalued have a higher weight in cap weighted indices whereas undervalued stocks have a lower weighting. This paper makes the case for a fundamental investment strategy explaining how it seeks to benefit from rebalancing away from overvalued stocks in favour of undervalued stocks. The paper also describes the Russell Fundamental index methodology.
Russell Research summaries
ReSeARCH FOCuS
Russell investments // Russell Communiqué // europe, Middle east & Africa 13

Endnotes1 The analysis described in this article is based on
Axioma’s factor definitions and risk model.2 “Defensive equity: is the market mispricing
risk?”, Robert Collie & John Osborn, Russell Research, July 2011.
3 “The volatility effect: lower Risk without lower Return”, David C. Blitz and Pim van vliet, Journal of Portfolio Management, pp. 102-113, Fall 2007.
4 “The Cross-Section of volatility and expected Returns”, Andrew Ang, Robert J. Hodrick, yuhang xing, and xiaoyan Zhang, The Journal of Finance, February 2006.
5 “Benchmarks as limits to Arbitrage:
understanding the low volatility Anomaly”, Malcolm P. Baker, Brendan Bradley, Jeffrey wurgler, Nyu working Paper, March 2010.
6 “Re-Thinking Risk – what the Beta Puzzle Tells us about investing”, David Cowan & Sam wilderman, gMO white Paper, November 2011.
7 As sourced from the David Cowan & Sam wilderman paper: “Compare, for example, the fate of two investors, each starting with $100: one invests $100 in a portfolio of beta-2 stocks, while the other borrows an additional $100 from his prime broker and buys $200 of the market. The first is using implicit leverage, while the second levers the portfolio explicitly. While the investors earn similar returns in a market
advance, each gaining twice what the market does, their outcomes should differ when the market falls. When the market declines 50% or more, the investor who borrowed money explicitly has no capital left from his investment (and could potentially lose even more). The owner of the high beta portfolio, however, will have some value left in his portfolio, as the prices of the equities in the beta-2 portfolio will most likely remain above zero in a down 50% market…”
8 “The global income investor: A bastion of hope for beleaguered investors”, Societe generale, October 2011.
For more information: visit:
www.russell.com
Call:
+44 20 7024 6000
IMPORTAnT InFORMATIOn
This material is not intended for distribution to retail clients. This material does not constitute an offer or invitation to anyone in any jurisdiction to invest in any Russell product or use any Russell services where such offer or invitation is not lawful, or in which the person making such offer or invitation is not qualified to do so, nor has it been prepared in connection with any such offer or invitation.
unless otherwise specified, Russell investments is the source of all data. All information contained in this material is current at the time of issue and, to the best of our knowledge, accurate. Any opinion expressed is that of Russell investments, is not a statement of fact, is subject to change and, unless it relates to a specified investment, does not constitute the regulated activity of “advising on investments” for the purposes of the Financial Services and Markets Act 2000.
Analytics and data provided by Axioma inc. (“Axioma Data”) was used in the preparation of this report. Copyrights (2006-2011) Axioma, inc. All Rights Reserved (www.axioma.com). Such data may not be copied or distributed in any manner. The Axioma data is provided “as is” exclusive of any warranty whatsoever, including, but not limited to, any implied warranties arising under the laws of any jurisdiction. Axioma’s provision of the axioma data shall not be deemed to be investment management or advisory services. Any use of the Axioma data for analyzing, managing or trading financial instruments is at your sole risk. Accuracy and completeness of the axioma data are not guaranteed. Neither Axioma nor any of its third party vendors shall be liable for any damages, including direct, indirect, incidental, special or consequential damages, or damages for loss of profits, revenue, data or use, incurred by you or any third party.
The value of investments and the income from them can fall as well as rise and is not guaranteed. you may not get back the amount originally invested.
Any forecast, projection or target is indicative only and not guaranteed in any way. Any past performance figures are not necessarily a guide to future performance.
Any reference to returns linked to currencies may increase or decrease as a result of currency fluctuations. Any references to tax treatments depend on the circumstances of the individual client and may be subject to change in the future.
issued by Russell investments limited. Company No. 02086230. Registered in england and wales with registered office at: Rex House, 10 Regent Street, london Sw1y 4Pe. Telephone 020 7024 6000. Authorised and regulated by the Financial Services Authority, 25 The North Colonnade, Canary wharf, london e14 5HS.
0450/November 2012
To learn more about the topics in this issue of Communiqué, please contact your usual Russell representative or the editors of Communiqué:
Lloyd Raynor
+44-20-7024-6346
Jihan Diolosa
+44-20-7024-6430