Embed Size (px)
Citation preview
1616 P Street, NW Suite 200 • Washington, DC 20036 www.itep.org • 202.299.1066
November 2017
Revised Senate Plan Would Raise Taxes on at Least 29% of Americans and Cause 19 States to Pay More Overall
(State-by-State Figures in Appendix)
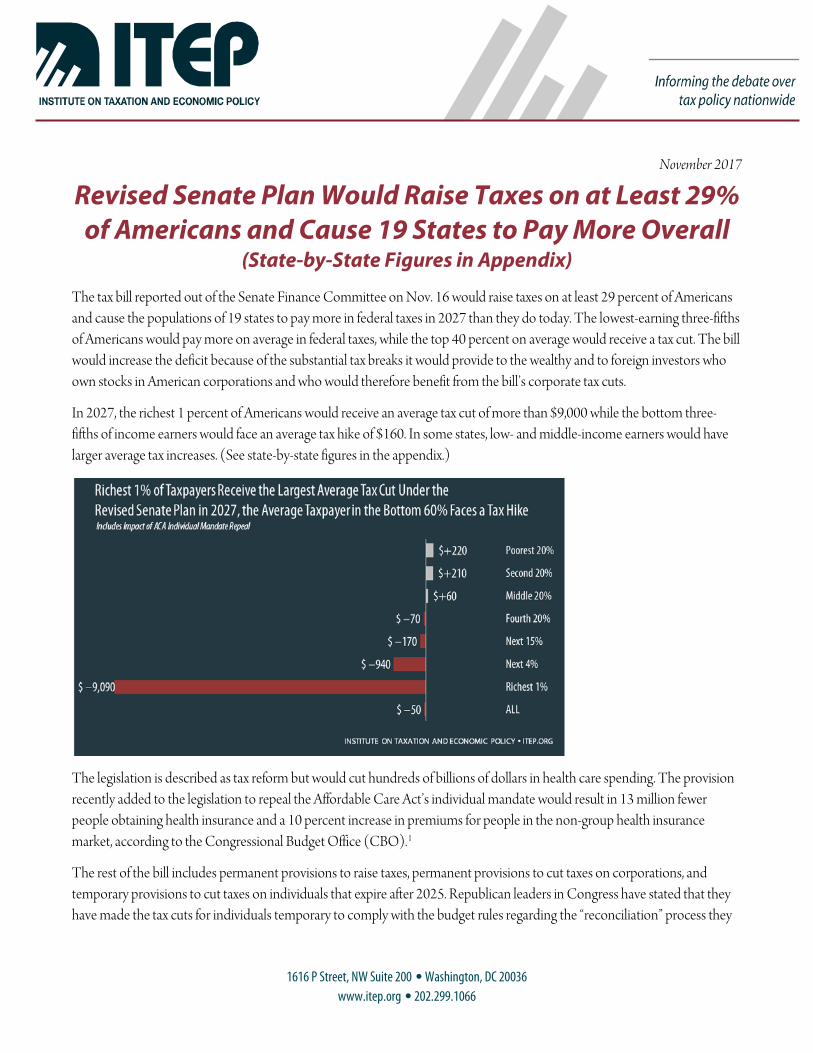
The tax bill reported out of the Senate Finance Committee on Nov. 16 would raise taxes on at least 29 percent of Americans and cause the populations of 19 states to pay more in federal taxes in 2027 than they do today. The lowest-earning three-fifths of Americans would pay more on average in federal taxes, while the top 40 percent on average would receive a tax cut. The bill would increase the deficit because of the substantial tax breaks it would provide to the wealthy and to foreign investors who own stocks in American corporations and who would therefore benefit from the bill’s corporate tax cuts.
In 2027, the richest 1 percent of Americans would receive an average tax cut of more than $9,000 while the bottom three-fifths of income earners would face an average tax hike of $160. In some states, low- and middle-income earners would have larger average tax increases. (See state-by-state figures in the appendix.)
The legislation is described as tax reform but would cut hundreds of billions of dollars in health care spending. The provision recently added to the legislation to repeal the Affordable Care Act’s individual mandate would result in 13 million fewer people obtaining health insurance and a 10 percent increase in premiums for people in the non-group health insurance market, according to the Congressional Budget Office (CBO).1
The rest of the bill includes permanent provisions to raise taxes, permanent provisions to cut taxes on corporations, and temporary provisions to cut taxes on individuals that expire after 2025. Republican leaders in Congress have stated that they have made the tax cuts for individuals temporary to comply with the budget rules regarding the “reconciliation” process they
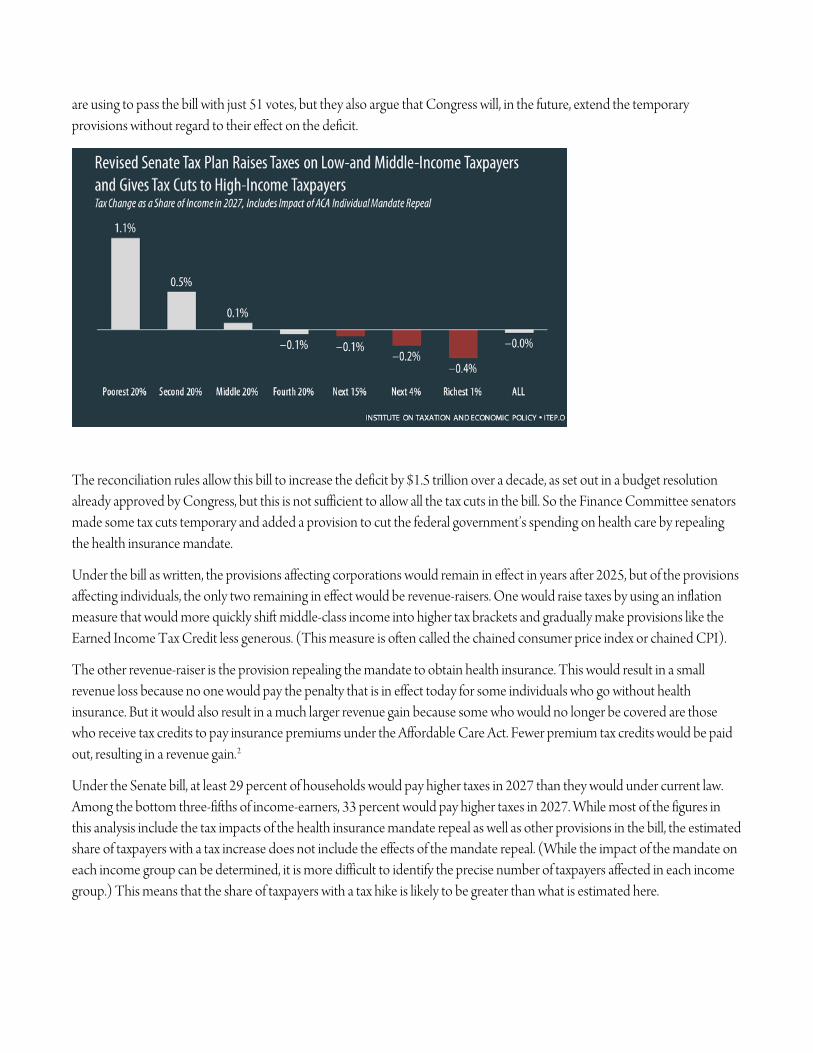
are using to pass the bill with just 51 votes, but they also argue that Congress will, in the future, extend the temporary provisions without regard to their effect on the deficit.
The reconciliation rules allow this bill to increase the deficit by $1.5 trillion over a decade, as set out in a budget resolution already approved by Congress, but this is not sufficient to allow all the tax cuts in the bill. So the Finance Committee senators made some tax cuts temporary and added a provision to cut the federal government’s spending on health care by repealing the health insurance mandate.
Under the bill as written, the provisions affecting corporations would remain in effect in years after 2025, but of the provisions affecting individuals, the only two remaining in effect would be revenue-raisers. One would raise taxes by using an inflation measure that would more quickly shift middle-class income into higher tax brackets and gradually make provisions like the Earned Income Tax Credit less generous. (This measure is often called the chained consumer price index or chained CPI).
The other revenue-raiser is the provision repealing the mandate to obtain health insurance. This would result in a small revenue loss because no one would pay the penalty that is in effect today for some individuals who go without health insurance. But it would also result in a much larger revenue gain because some who would no longer be covered are those who receive tax credits to pay insurance premiums under the Affordable Care Act. Fewer premium tax credits would be paid out, resulting in a revenue gain.2
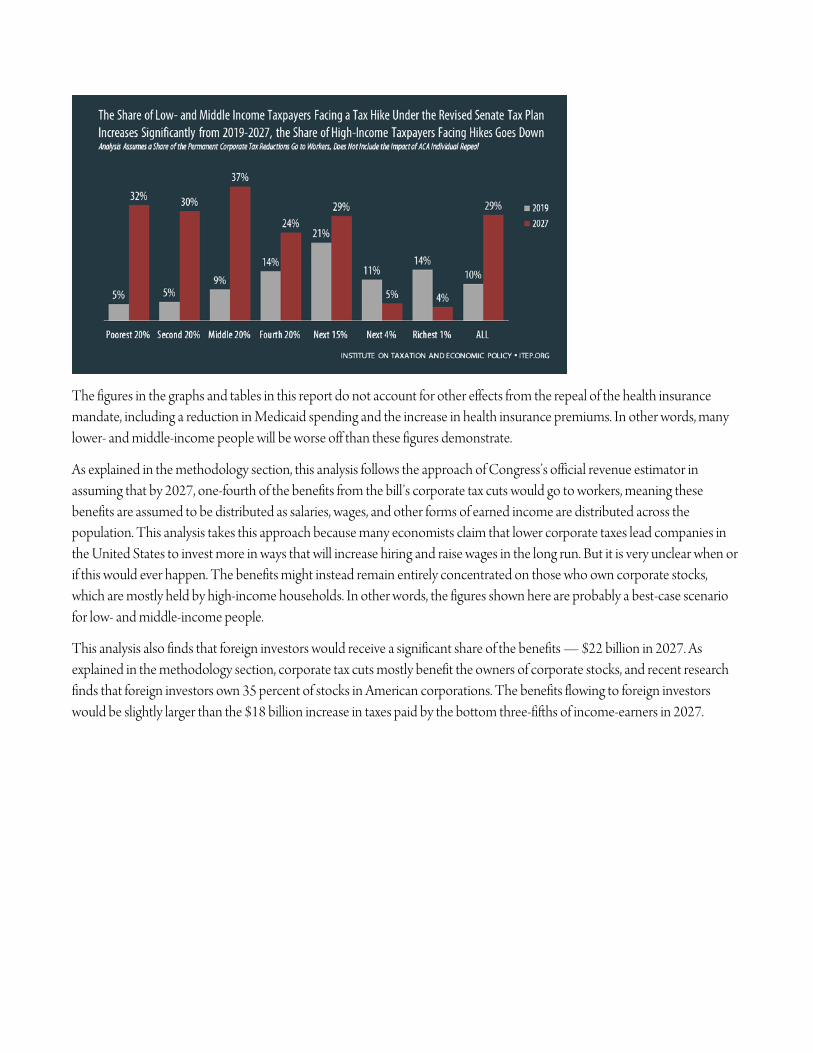
Under the Senate bill, at least 29 percent of households would pay higher taxes in 2027 than they would under current law. Among the bottom three-fifths of income-earners, 33 percent would pay higher taxes in 2027. While most of the figures in this analysis include the tax impacts of the health insurance mandate repeal as well as other provisions in the bill, the estimated share of taxpayers with a tax increase does not include the effects of the mandate repeal. (While the impact of the mandate on each income group can be determined, it is more difficult to identify the precise number of taxpayers affected in each income group.) This means that the share of taxpayers with a tax hike is likely to be greater than what is estimated here.
The figures in the graphs and tables in this report do not account for other effects from the repeal of the health insurance mandate, including a reduction in Medicaid spending and the increase in health insurance premiums. In other words, many lower- and middle-income people will be worse off than these figures demonstrate.
As explained in the methodology section, this analysis follows the approach of Congress’s official revenue estimator in assuming that by 2027, one-fourth of the benefits from the bill’s corporate tax cuts would go to workers, meaning these benefits are assumed to be distributed as salaries, wages, and other forms of earned income are distributed across the population. This analysis takes this approach because many economists claim that lower corporate taxes lead companies in the United States to invest more in ways that will increase hiring and raise wages in the long run. But it is very unclear when or if this would ever happen. The benefits might instead remain entirely concentrated on those who own corporate stocks, which are mostly held by high-income households. In other words, the figures shown here are probably a best-case scenario for low- and middle-income people.
This analysis also finds that foreign investors would receive a significant share of the benefits — $22 billion in 2027. As explained in the methodology section, corporate tax cuts mostly benefit the owners of corporate stocks, and recent research finds that foreign investors own 35 percent of stocks in American corporations. The benefits flowing to foreign investors would be slightly larger than the $18 billion increase in taxes paid by the bottom three-fifths of income-earners in 2027.
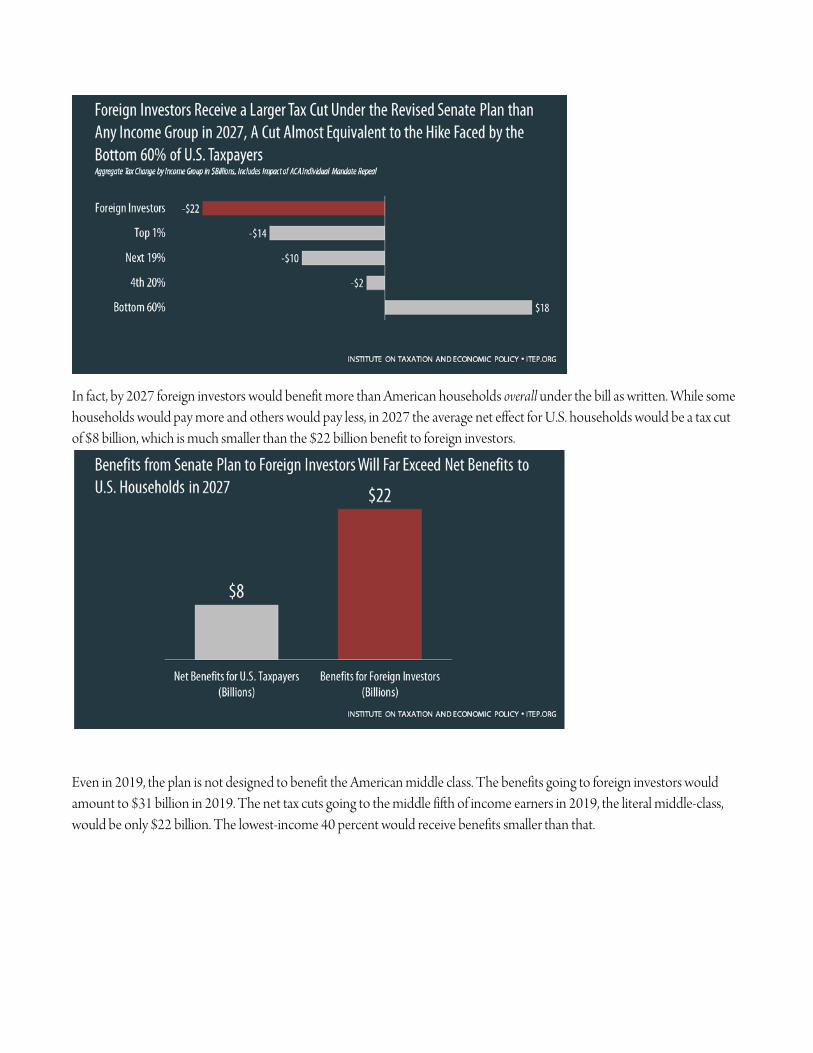
In fact, by 2027 foreign investors would benefit more than American households overall under the bill as written. While some households would pay more and others would pay less, in 2027 the average net effect for U.S. households would be a tax cut of $8 billion, which is much smaller than the $22 billion benefit to foreign investors.
Even in 2019, the plan is not designed to benefit the American middle class. The benefits going to foreign investors would amount to $31 billion in 2019. The net tax cuts going to the middle fifth of income earners in 2019, the literal middle-class, would be only $22 billion. The lowest-income 40 percent would receive benefits smaller than that.

Table 1:National Distributional Impacts of the Amended Senate Tax Plan in 2019
Income Average Share w/ Share w/Group Income Tax Cut Tax Hike
Poorest 20% Less than $24,090 14,600$ -$2,297,100 -$70 –0.5% 1% 68% $ –160 20,749,000 5% $+60 1,414,000
Second 20% $24,090 to $41,910 32,900$ -$10,939,100 -$360 –1.1% 5% 85% $ –490 26,088,000 5% $+470 1,599,000
Middle 20% $41,910 to $66,850 53,400$ -$22,397,700 -$730 –1.4% 9% 88% $ –940 26,848,000 9% $+740 2,627,000
Fourth 20% $66,850 to $112,160 86,400$ -$36,928,100 -$1,200 –1.4% 15% 85% $ –1,630 26,153,000 14% $+1,280 4,172,000
Next 15% $112,160 to $239,600 155,700$ -$48,072,300 -$2,090 –1.3% 20% 78% $ –3,200 17,997,000 21% $+1,930 4,940,000
Next 4% $239,600 to $607,090 356,800$ -$61,264,300 -$10,000 –2.8% 26% 88% $ –11,700 5,420,000 11% $+3,100 693,000
Richest 1% $607,090 and higher 2,023,900$ -$56,933,100 -$37,070 –1.8% 24% 86% $ –48,270 1,319,000 14% $+31,340 215,000
ALL $94,400 $ –238,772,500 $ –1,540 –1.6% 100% 81% $ –2,150 125,098,000 10% $+1,700 15,660,000
Bottom 60% Less than $66,850 $33,600 $ –35,634,000 $ –390 –1.2% 15% 80% $ –560 73,685,000 6% $+490 5,640,000
Table 2:National Distributional Impacts of the Amended Senate Tax Plan in 2027
Income Average Share w/ Share w/Group Income Tax Cut Tax Hike
Poorest 20% Less than $32,300 $19,300 $8,237,500 +$220 1.1% -103% 55% $ –20 20,628,000 32% $+80 11,823,000
Second 20% $32,300 to $56,350 $43,800 $7,415,100 +$210 0.5% -92% 61% $ –40 21,714,000 30% $+180 10,811,000
Middle 20% $56,350 to $90,300 $72,000 $2,125,900 +$60 0.1% -26% 58% $ –70 20,401,000 37% $+90 12,867,000
Fourth 20% $90,300 to $150,500 $115,900 -$2,245,300 -$70 –0.1% 28% 74% $ –110 24,770,000 24% $+80 8,088,000
Next 15% $150,500 to $315,000 $207,000 -$4,086,900 -$170 –0.1% 51% 70% $ –250 16,638,000 29% $+70 6,806,000
Next 4% $315,000 to $786,980 $468,900 -$6,028,600 -$940 –0.2% 75% 95% $ –980 6,063,000 5% $+270 303,000
Richest 1% $786,980 and higher $2,561,000 -$13,870,300 -$9,090 –0.4% 173% 96% $ –9,390 1,468,000 4% $+290 58,000
ALL $117,100 $ –8,034,800 $ –50 –0.0% 100% 64% $ –260 112,613,000 29% $+100 50,756,000
Bottom 60% Less than $90,300 $44,500 $+17,779,000 $+160 0.4% 0% 58% $ –40 62,743,000 33% $+110 35,501,000
* Taxpayers with Tax Cut and Taxpayer with Tax Hikes figures do not include the impact of repealing the ACA individual mandate
Source: Institute on Taxation and Econonomic Policy Microsimulation Tax Model, Updated November 17, 2017
Taxpayers w/ Tax Cut *
Avg. Hike $Income Range Total Change ($1000s) Avg. Tax Change $
Change as a % of Pre- Tax
Income
Avg. Cut $ Tot. Taxpayers
w/Cut Share of Tax
Change
Taxpayers w/ Tax Hike*
Tot. Taxpayers w/Hike
Taxpayers w/ Tax Hike*
Avg. Hike $
Income All Taxpayers (Includes Repeal of ACA Individual Mandate) Taxpayers w/ Tax Cut *
Income Range Total Change ($1000s) Avg. Tax Change $
Change as a % of Pre- Tax
Income
Avg. Cut $ Tot. Taxpayers
w/Cut Share of Tax
Change
Income All Taxpayers (Includes Repeal of ACA Individual Mandate)
Tot. Taxpayers w/Hike
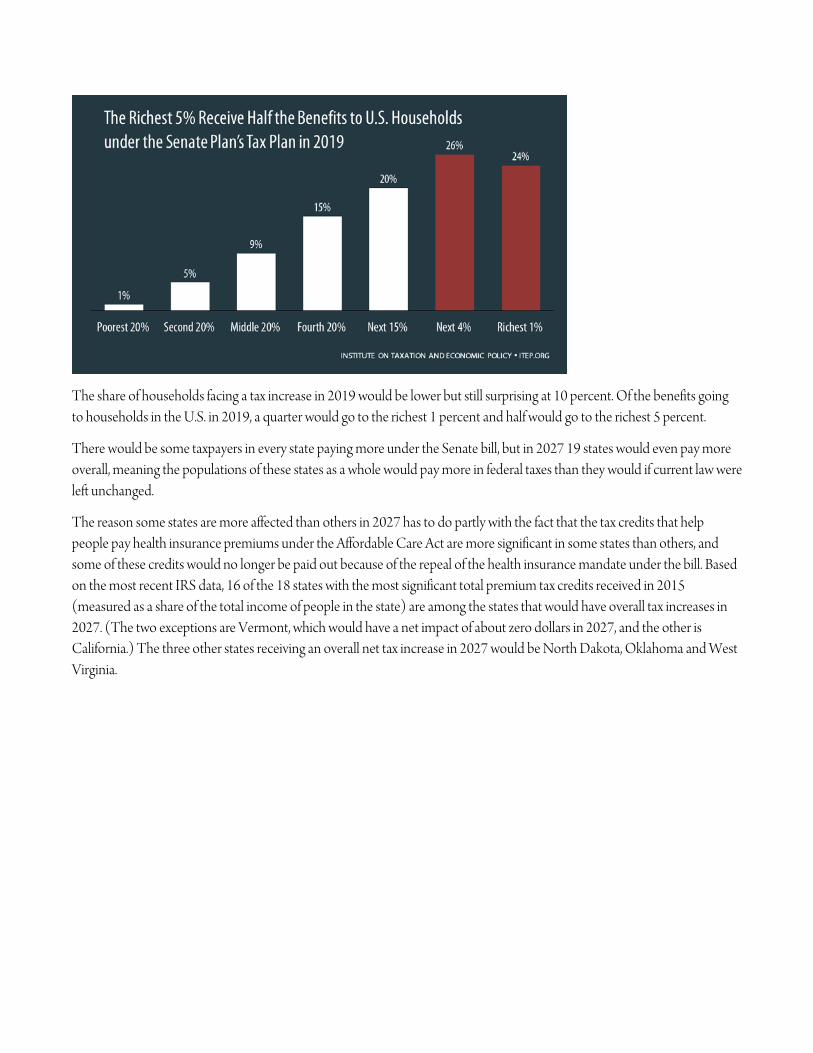
The share of households facing a tax increase in 2019 would be lower but still surprising at 10 percent. Of the benefits going to households in the U.S. in 2019, a quarter would go to the richest 1 percent and half would go to the richest 5 percent.
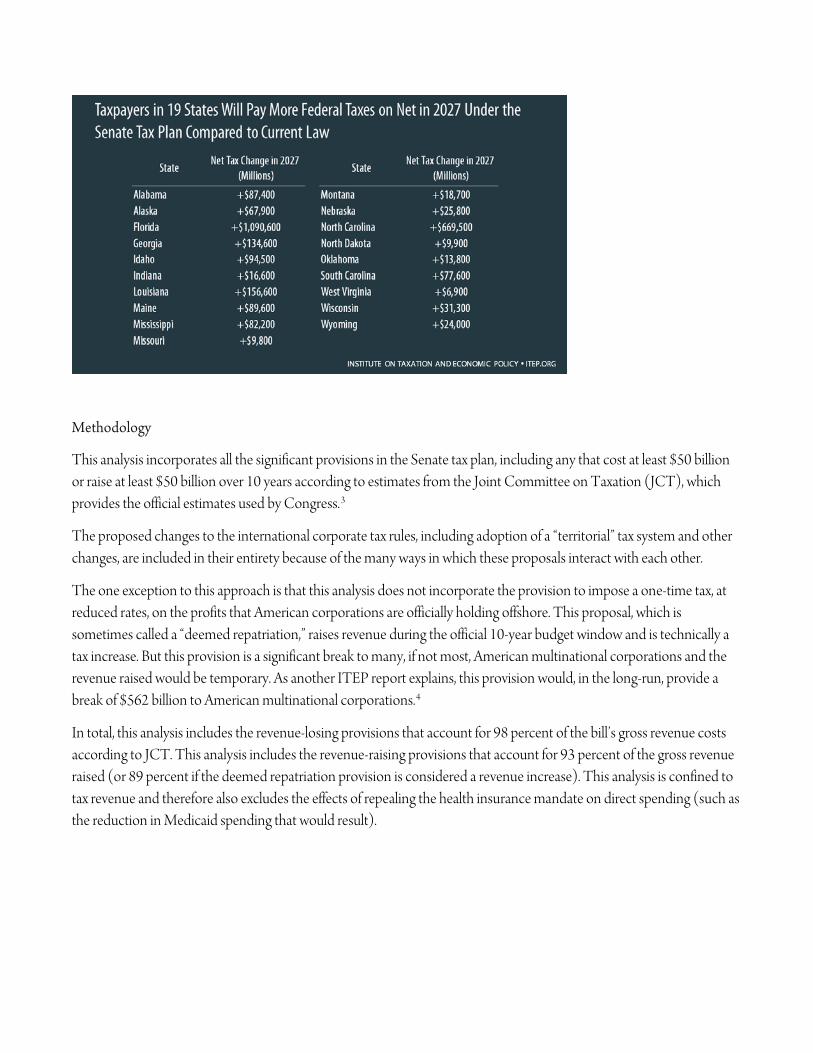
There would be some taxpayers in every state paying more under the Senate bill, but in 2027 19 states would even pay more overall, meaning the populations of these states as a whole would pay more in federal taxes than they would if current law were left unchanged.
The reason some states are more affected than others in 2027 has to do partly with the fact that the tax credits that help people pay health insurance premiums under the Affordable Care Act are more significant in some states than others, and some of these credits would no longer be paid out because of the repeal of the health insurance mandate under the bill. Based on the most recent IRS data, 16 of the 18 states with the most significant total premium tax credits received in 2015 (measured as a share of the total income of people in the state) are among the states that would have overall tax increases in 2027. (The two exceptions are Vermont, which would have a net impact of about zero dollars in 2027, and the other is California.) The three other states receiving an overall net tax increase in 2027 would be North Dakota, Oklahoma and West Virginia.
Methodology
This analysis incorporates all the significant provisions in the Senate tax plan, including any that cost at least $50 billion or raise at least $50 billion over 10 years according to estimates from the Joint Committee on Taxation (JCT), which provides the official estimates used by Congress.3
The proposed changes to the international corporate tax rules, including adoption of a “territorial” tax system and other changes, are included in their entirety because of the many ways in which these proposals interact with each other.
The one exception to this approach is that this analysis does not incorporate the provision to impose a one-time tax, at reduced rates, on the profits that American corporations are officially holding offshore. This proposal, which is sometimes called a “deemed repatriation,” raises revenue during the official 10-year budget window and is technically a tax increase. But this provision is a significant break to many, if not most, American multinational corporations and the revenue raised would be temporary. As another ITEP report explains, this provision would, in the long-run, provide a break of $562 billion to American multinational corporations.4
In total, this analysis includes the revenue-losing provisions that account for 98 percent of the bill’s gross revenue costs according to JCT. This analysis includes the revenue-raising provisions that account for 93 percent of the gross revenue raised (or 89 percent if the deemed repatriation provision is considered a revenue increase). This analysis is confined to tax revenue and therefore also excludes the effects of repealing the health insurance mandate on direct spending (such as the reduction in Medicaid spending that would result).
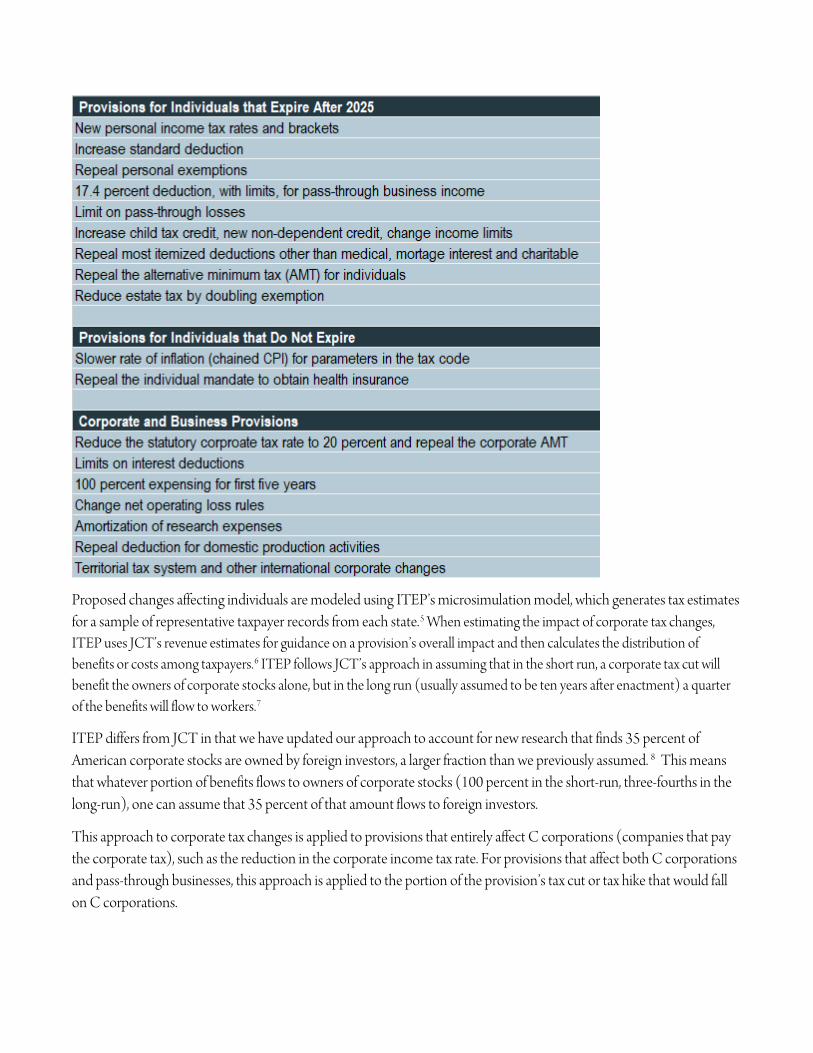
Proposed changes affecting individuals are modeled using ITEP’s microsimulation model, which generates tax estimates for a sample of representative taxpayer records from each state.5 When estimating the impact of corporate tax changes, ITEP uses JCT’s revenue estimates for guidance on a provision’s overall impact and then calculates the distribution of benefits or costs among taxpayers.6 ITEP follows JCT’s approach in assuming that in the short run, a corporate tax cut will benefit the owners of corporate stocks alone, but in the long run (usually assumed to be ten years after enactment) a quarter of the benefits will flow to workers.7
ITEP differs from JCT in that we have updated our approach to account for new research that finds 35 percent of American corporate stocks are owned by foreign investors, a larger fraction than we previously assumed. 8 This means that whatever portion of benefits flows to owners of corporate stocks (100 percent in the short-run, three-fourths in the long-run), one can assume that 35 percent of that amount flows to foreign investors.
This approach to corporate tax changes is applied to provisions that entirely affect C corporations (companies that pay the corporate tax), such as the reduction in the corporate income tax rate. For provisions that affect both C corporations and pass-through businesses, this approach is applied to the portion of the provision’s tax cut or tax hike that would fall on C corporations.
To estimate the effects of repealing the ACA’s individual mandate to obtain health insurance, we begin with CBO’s estimates of the change in tax revenue that would result from this provision. For example, CBO has estimated that by 2027 repealing the mandate would result in $6 billion less collected from the penalty for not obtaining health insurance (because the penalty would be eliminated) and $28 billion in savings from what CBO calls “changes in subsidies for coverage through marketplace and related spending and revenues.”9 In another document, CBO breaks down baseline revenue and spending impacts under current law of what it calls “Nongroup Coverage and the Basic Health Program,” which appears to be the same thing and shows that premium tax credits make up 79 percent of that category.10 This analysis therefore assumes that of the $28 billion in savings that CBO projects for 2027 from changes in subsidies for coverage that would result from repealing the mandate, 79 percent of that amount, or about $22 billion, is a reduction in premium credits paid out that year. To estimate the distribution of these amounts across income groups in each state, this analysis begins with the distribution of penalty payments paid and premium tax credits received in each state in 2015 according to the most recent IRS data.11 The distribution of the reduction in these amounts under this bill is assumed to be similar, with adjustments for the shift to later years.
1 Congressional Budget Office, “Repealing the Individual Health Insurance Mandate: An Updated Estimate,” November 8, 2017. https://www.cbo.gov/publication/53300
2 Congressional Budget Office, “Repealing the Individual Health Insurance Mandate: An Updated Estimate,” November 8, 2017. https://www.cbo.gov/publication/53300
3 Joint Committee on Taxation, “Estimated Revenue Effects of the Chairman's Modification to the Chairman's Mark of the "Tax Cuts and Jobs Act," Scheduled for Markup by the Committee on Finance on November 15, 2017,” JCX-57-17. https://www.jct.gov/publications.html?func=startdown&id=5038
4 Institute on Taxation and Economic Policy, “Multinational Corporations Would Receive At Least $458 Billion in Tax Breaks from Congressional Repatriation Proposals,” November 5, 2017. https://itep.org/multinational-corporations-would-receive-over-half-a-trillion-in-tax-breaks-from-the-house-repatriation-proposal/
5 ITEP Microsimulation Tax Model Overview. https://itep.org/itep-tax-model-simple/
6 See note 3.
7 Joint Committee on Taxation, “Modeling the Distribution of Taxes on Business Income,” JCX-14-13, October 16, 2013. https://www.jct.gov/publications.html?func=startdown&id=4528
8 Steven M. Rosenthal, “Slashing Corporate Taxes: Foreign Investors Are Surprise Winners,” Tax Notes, October 23, 2017. https://www.taxnotes.com/tax-notes/corporate-taxation/slashing-corporate-taxes-foreign-investors-are-surprise-winners/2017/10/23/1x78l
9 Congressional Budget Office, “Repealing the Individual Health Insurance Mandate: An Updated Estimate,” Table 1, November 8, 2017. https://www.cbo.gov/publication/53300

10 Congressional Budget Office, “Federal Subsidies for Health Insurance Coverage for People Under Age 65: 2017 to 2027,” September 14, 2017, Table 2. https://www.cbo.gov/publication/53091
11 Internal Revenue Service, SOI Tax Statistics Historic Table 2. https://www.irs.gov/statistics/soi-tax-stats-historic-table-2
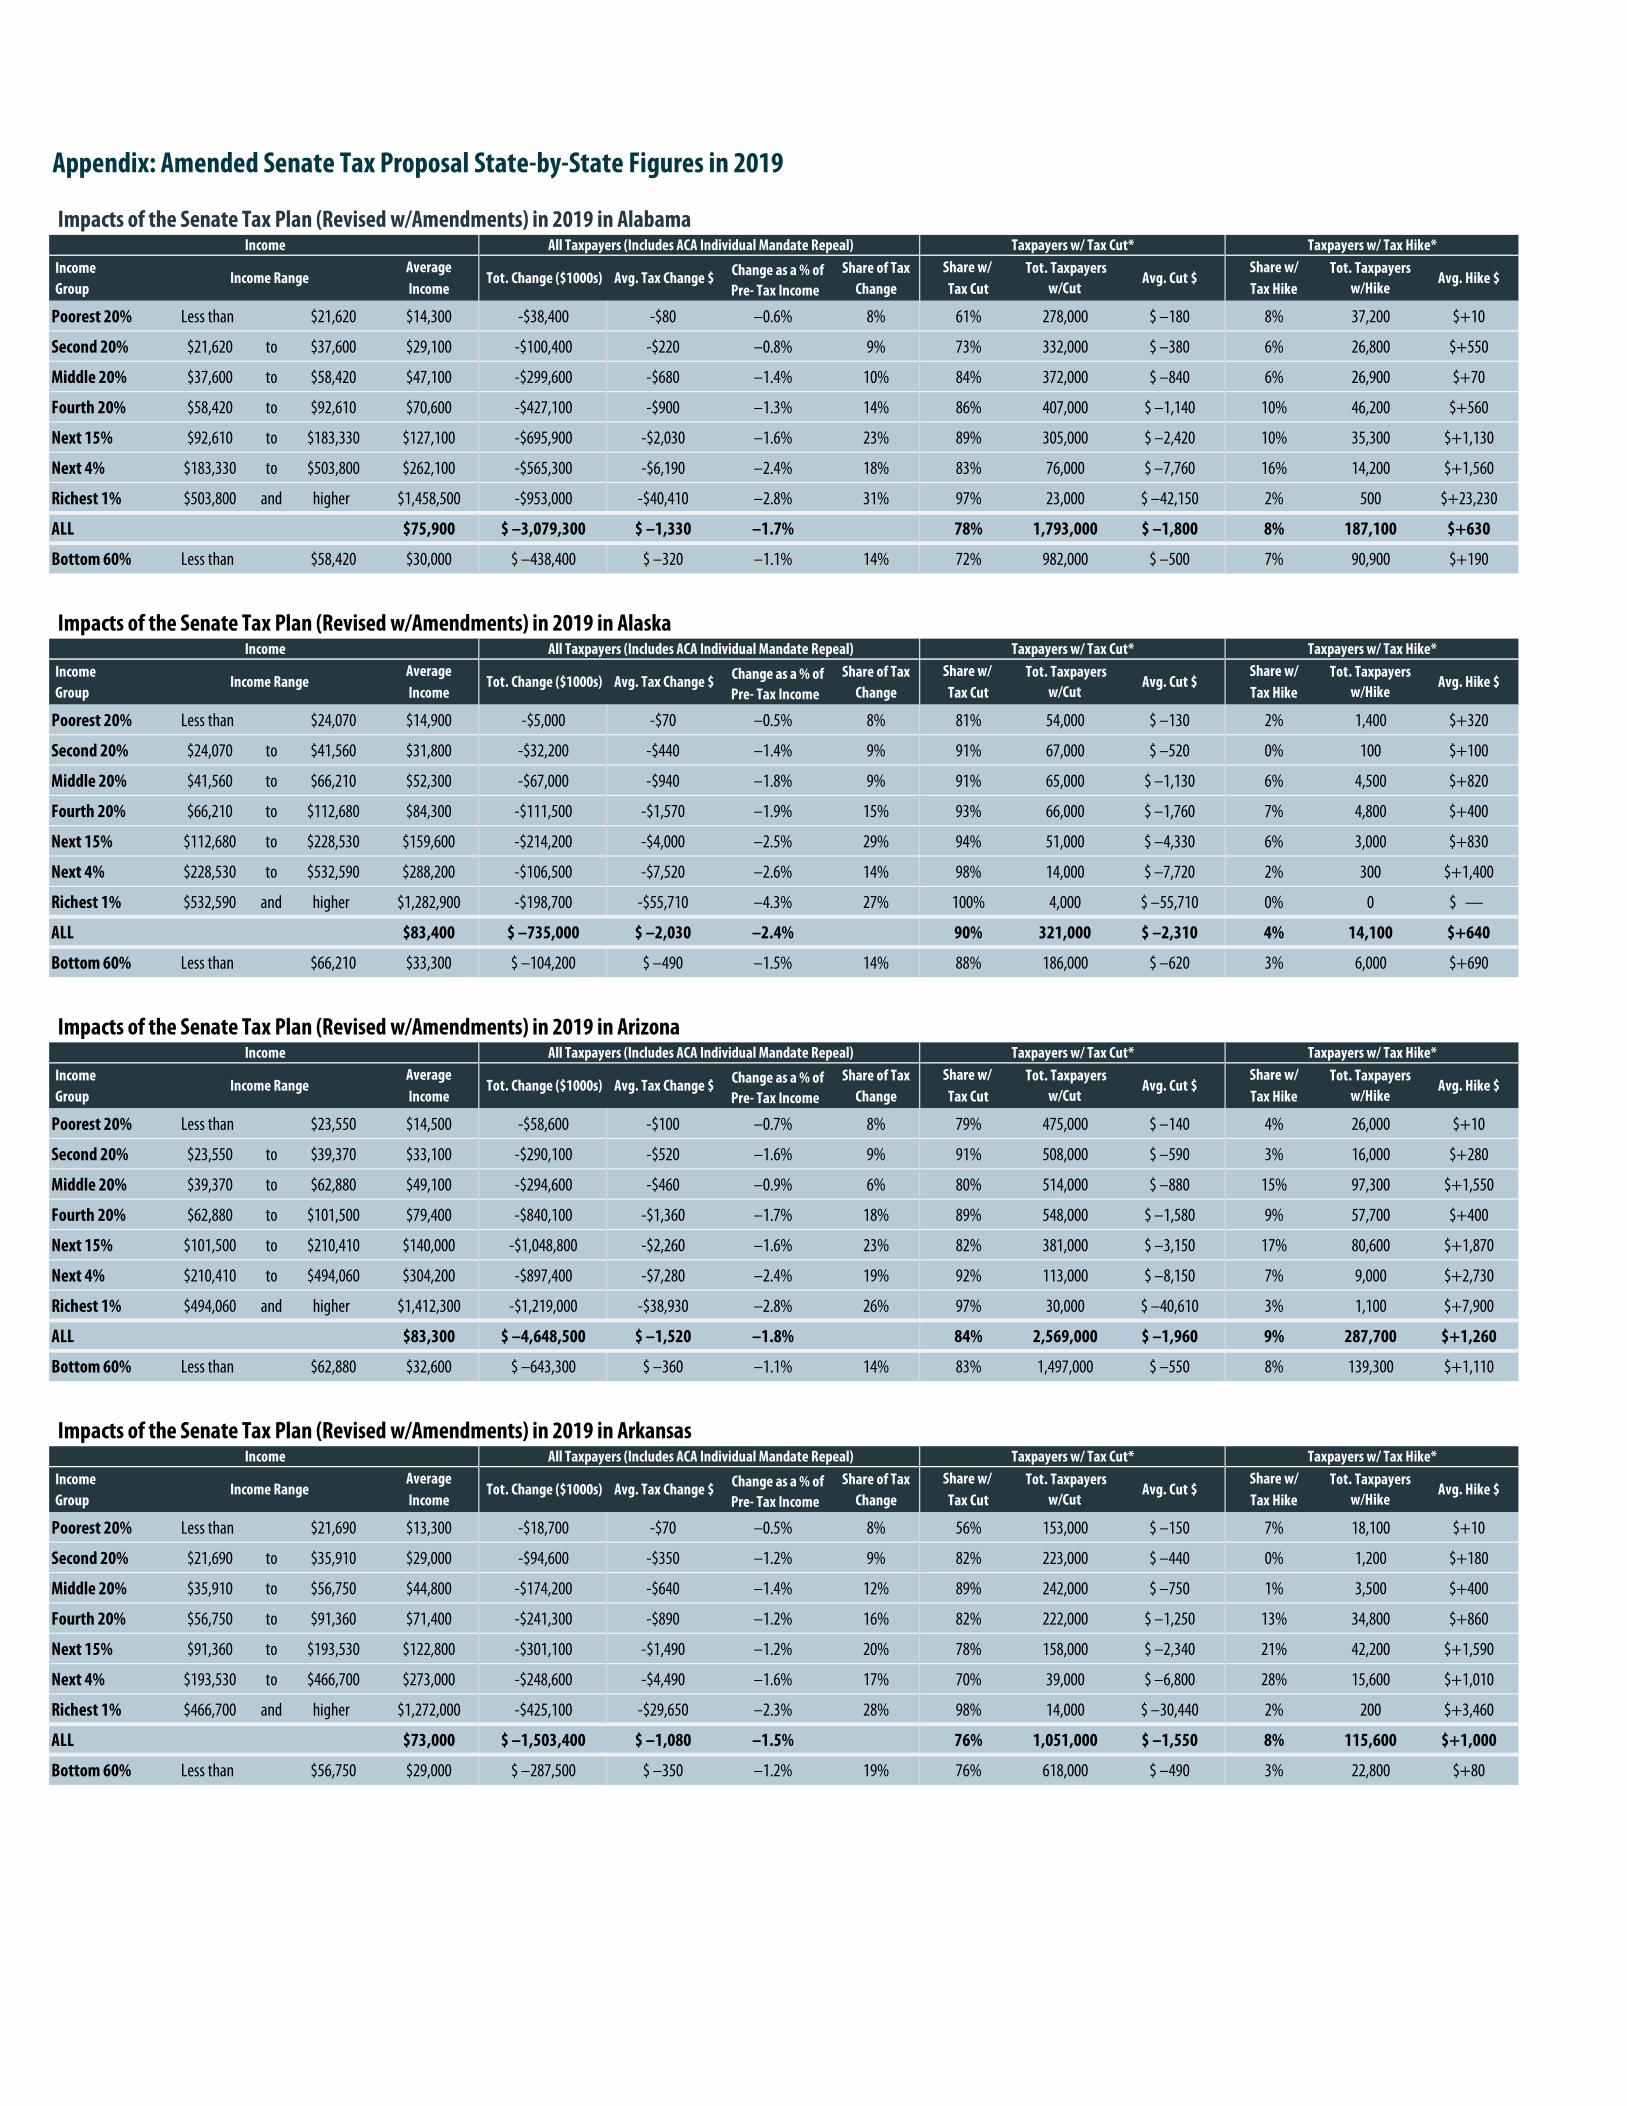
Appendix: Amended Senate Tax Proposal State-by-State Figures in 2019
Impacts of the Senate Tax Plan (Revised w/Amendments) in 2019 in Alabama
Income Average Share of Tax Share w/ Share w/Group Income Change Tax Cut Tax Hike
Poorest 20% Less than $21,620 $14,300 -$38,400 -$80 –0.6% 8% 61% 278,000 $ –180 8% 37,200 $+10
Second 20% $21,620 to $37,600 $29,100 -$100,400 -$220 –0.8% 9% 73% 332,000 $ –380 6% 26,800 $+550
Middle 20% $37,600 to $58,420 $47,100 -$299,600 -$680 –1.4% 10% 84% 372,000 $ –840 6% 26,900 $+70
Fourth 20% $58,420 to $92,610 $70,600 -$427,100 -$900 –1.3% 14% 86% 407,000 $ –1,140 10% 46,200 $+560
Next 15% $92,610 to $183,330 $127,100 -$695,900 -$2,030 –1.6% 23% 89% 305,000 $ –2,420 10% 35,300 $+1,130
Next 4% $183,330 to $503,800 $262,100 -$565,300 -$6,190 –2.4% 18% 83% 76,000 $ –7,760 16% 14,200 $+1,560
Richest 1% $503,800 and higher $1,458,500 -$953,000 -$40,410 –2.8% 31% 97% 23,000 $ –42,150 2% 500 $+23,230
ALL $75,900 $ –3,079,300 $ –1,330 –1.7% 78% 1,793,000 $ –1,800 8% 187,100 $+630
Bottom 60% Less than $58,420 $30,000 $ –438,400 $ –320 –1.1% 14% 72% 982,000 $ –500 7% 90,900 $+190
Impacts of the Senate Tax Plan (Revised w/Amendments) in 2019 in Alaska
Income Average Share of Tax Share w/ Share w/Group Income Change Tax Cut Tax Hike
Poorest 20% Less than $24,070 $14,900 -$5,000 -$70 –0.5% 8% 81% 54,000 $ –130 2% 1,400 $+320
Second 20% $24,070 to $41,560 $31,800 -$32,200 -$440 –1.4% 9% 91% 67,000 $ –520 0% 100 $+100
Middle 20% $41,560 to $66,210 $52,300 -$67,000 -$940 –1.8% 9% 91% 65,000 $ –1,130 6% 4,500 $+820
Fourth 20% $66,210 to $112,680 $84,300 -$111,500 -$1,570 –1.9% 15% 93% 66,000 $ –1,760 7% 4,800 $+400
Next 15% $112,680 to $228,530 $159,600 -$214,200 -$4,000 –2.5% 29% 94% 51,000 $ –4,330 6% 3,000 $+830
Next 4% $228,530 to $532,590 $288,200 -$106,500 -$7,520 –2.6% 14% 98% 14,000 $ –7,720 2% 300 $+1,400
Richest 1% $532,590 and higher $1,282,900 -$198,700 -$55,710 –4.3% 27% 100% 4,000 $ –55,710 0% 0 $ —
ALL $83,400 $ –735,000 $ –2,030 –2.4% 90% 321,000 $ –2,310 4% 14,100 $+640
Bottom 60% Less than $66,210 $33,300 $ –104,200 $ –490 –1.5% 14% 88% 186,000 $ –620 3% 6,000 $+690
Impacts of the Senate Tax Plan (Revised w/Amendments) in 2019 in Arizona
Income Average Share of Tax Share w/ Share w/Group Income Change Tax Cut Tax Hike
Poorest 20% Less than $23,550 $14,500 -$58,600 -$100 –0.7% 8% 79% 475,000 $ –140 4% 26,000 $+10
Second 20% $23,550 to $39,370 $33,100 -$290,100 -$520 –1.6% 9% 91% 508,000 $ –590 3% 16,000 $+280
Middle 20% $39,370 to $62,880 $49,100 -$294,600 -$460 –0.9% 6% 80% 514,000 $ –880 15% 97,300 $+1,550
Fourth 20% $62,880 to $101,500 $79,400 -$840,100 -$1,360 –1.7% 18% 89% 548,000 $ –1,580 9% 57,700 $+400
Next 15% $101,500 to $210,410 $140,000 -$1,048,800 -$2,260 –1.6% 23% 82% 381,000 $ –3,150 17% 80,600 $+1,870
Next 4% $210,410 to $494,060 $304,200 -$897,400 -$7,280 –2.4% 19% 92% 113,000 $ –8,150 7% 9,000 $+2,730
Richest 1% $494,060 and higher $1,412,300 -$1,219,000 -$38,930 –2.8% 26% 97% 30,000 $ –40,610 3% 1,100 $+7,900
ALL $83,300 $ –4,648,500 $ –1,520 –1.8% 84% 2,569,000 $ –1,960 9% 287,700 $+1,260
Bottom 60% Less than $62,880 $32,600 $ –643,300 $ –360 –1.1% 14% 83% 1,497,000 $ –550 8% 139,300 $+1,110
Impacts of the Senate Tax Plan (Revised w/Amendments) in 2019 in Arkansas
Income Average Share of Tax Share w/ Share w/Group Income Change Tax Cut Tax Hike
Poorest 20% Less than $21,690 $13,300 -$18,700 -$70 –0.5% 8% 56% 153,000 $ –150 7% 18,100 $+10
Second 20% $21,690 to $35,910 $29,000 -$94,600 -$350 –1.2% 9% 82% 223,000 $ –440 0% 1,200 $+180
Middle 20% $35,910 to $56,750 $44,800 -$174,200 -$640 –1.4% 12% 89% 242,000 $ –750 1% 3,500 $+400
Fourth 20% $56,750 to $91,360 $71,400 -$241,300 -$890 –1.2% 16% 82% 222,000 $ –1,250 13% 34,800 $+860
Next 15% $91,360 to $193,530 $122,800 -$301,100 -$1,490 –1.2% 20% 78% 158,000 $ –2,340 21% 42,200 $+1,590
Next 4% $193,530 to $466,700 $273,000 -$248,600 -$4,490 –1.6% 17% 70% 39,000 $ –6,800 28% 15,600 $+1,010
Richest 1% $466,700 and higher $1,272,000 -$425,100 -$29,650 –2.3% 28% 98% 14,000 $ –30,440 2% 200 $+3,460
ALL $73,000 $ –1,503,400 $ –1,080 –1.5% 76% 1,051,000 $ –1,550 8% 115,600 $+1,000
Bottom 60% Less than $56,750 $29,000 $ –287,500 $ –350 –1.2% 19% 76% 618,000 $ –490 3% 22,800 $+80
Income All Taxpayers (Includes ACA Individual Mandate Repeal) Taxpayers w/ Tax Cut* Taxpayers w/ Tax Hike*
Income Range Tot. Change ($1000s) Avg. Tax Change $ Change as a % of Pre- Tax Income
Avg. Cut $ Avg. Hike $Tot. Taxpayers
w/Hike Tot. Taxpayers
w/Cut
Income All Taxpayers (Includes ACA Individual Mandate Repeal) Taxpayers w/ Tax Cut* Taxpayers w/ Tax Hike*
Income Range Tot. Change ($1000s) Avg. Tax Change $ Change as a % of Pre- Tax Income
Avg. Cut $
Income Range Tot. Change ($1000s) Avg. Tax Change $ Change as a % of Pre- Tax Income
Avg. Cut $ Avg. Hike $
Avg. Hike $
Income All Taxpayers (Includes ACA Individual Mandate Repeal) Taxpayers w/ Tax Cut* Taxpayers w/ Tax Hike*
Tot. Taxpayers w/Cut
Tot. Taxpayers w/Hike
Tot. Taxpayers w/Cut
Tot. Taxpayers w/Hike
Income All Taxpayers (Includes ACA Individual Mandate Repeal) Taxpayers w/ Tax Cut* Taxpayers w/ Tax Hike*
Income Range Tot. Change ($1000s) Avg. Tax Change $ Change as a % of Pre- Tax Income
Avg. Cut $ Avg. Hike $ Tot. Taxpayers
w/Cut Tot. Taxpayers
w/Hike
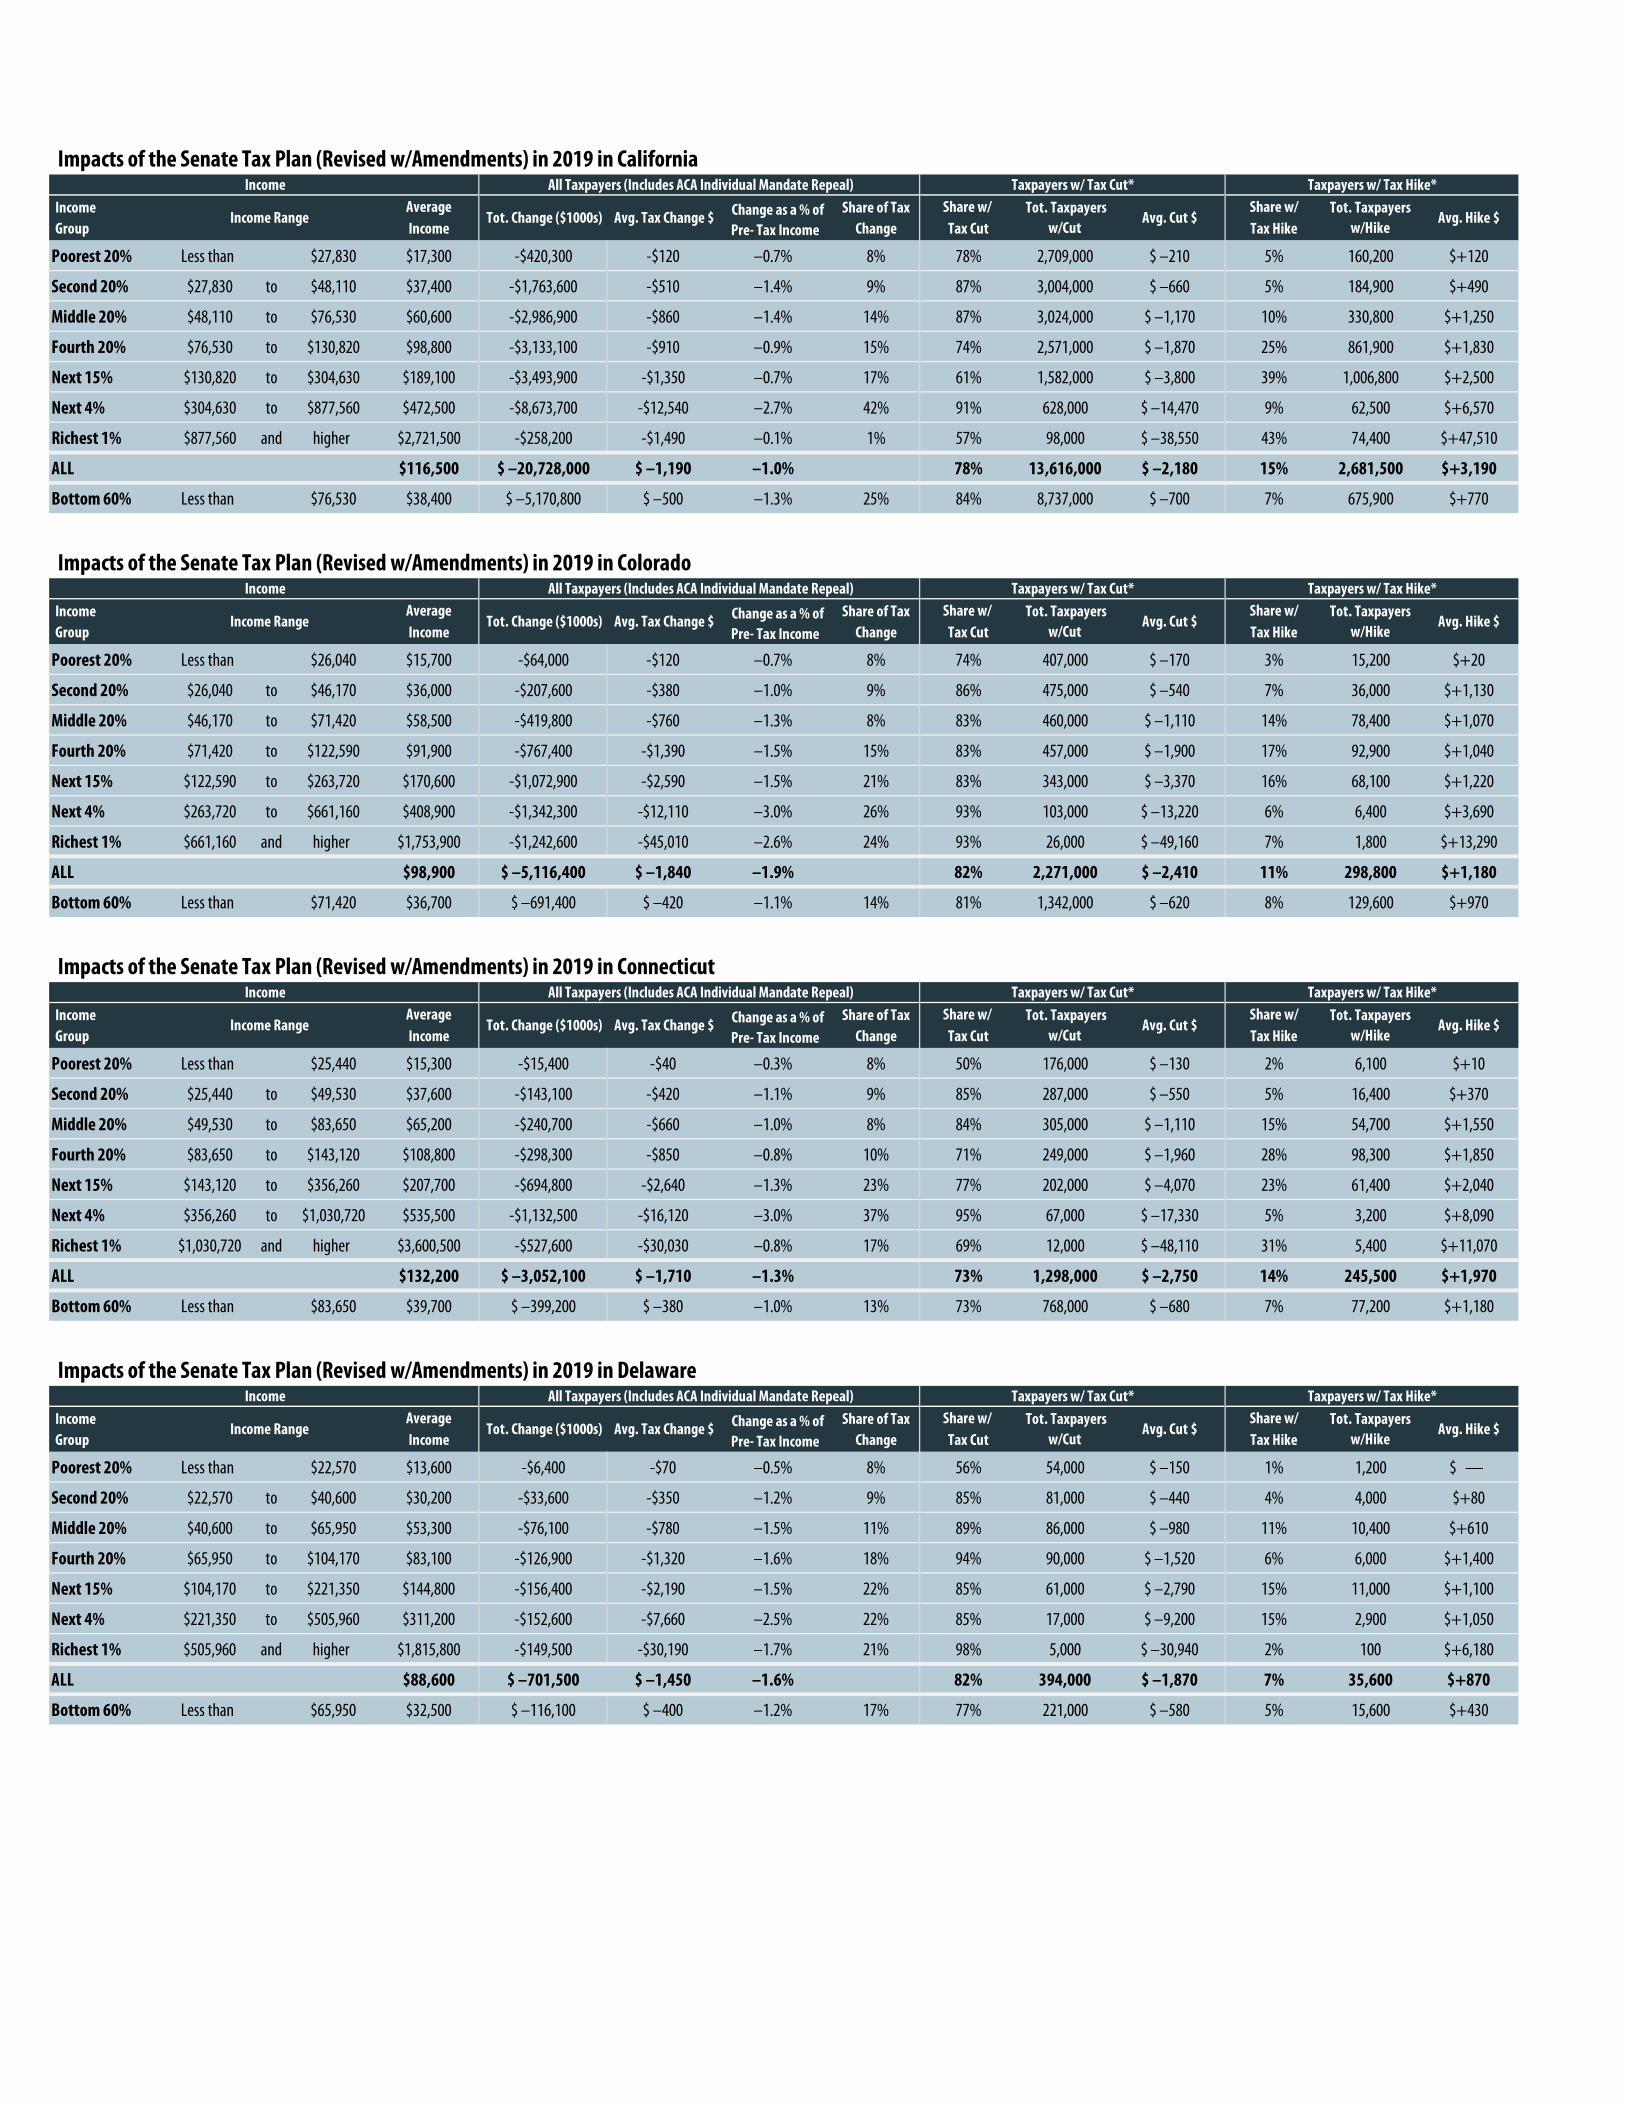
Impacts of the Senate Tax Plan (Revised w/Amendments) in 2019 in California
Income Average Share of Tax Share w/ Share w/Group Income Change Tax Cut Tax Hike
Poorest 20% Less than $27,830 $17,300 -$420,300 -$120 –0.7% 8% 78% 2,709,000 $ –210 5% 160,200 $+120
Second 20% $27,830 to $48,110 $37,400 -$1,763,600 -$510 –1.4% 9% 87% 3,004,000 $ –660 5% 184,900 $+490
Middle 20% $48,110 to $76,530 $60,600 -$2,986,900 -$860 –1.4% 14% 87% 3,024,000 $ –1,170 10% 330,800 $+1,250
Fourth 20% $76,530 to $130,820 $98,800 -$3,133,100 -$910 –0.9% 15% 74% 2,571,000 $ –1,870 25% 861,900 $+1,830
Next 15% $130,820 to $304,630 $189,100 -$3,493,900 -$1,350 –0.7% 17% 61% 1,582,000 $ –3,800 39% 1,006,800 $+2,500
Next 4% $304,630 to $877,560 $472,500 -$8,673,700 -$12,540 –2.7% 42% 91% 628,000 $ –14,470 9% 62,500 $+6,570
Richest 1% $877,560 and higher $2,721,500 -$258,200 -$1,490 –0.1% 1% 57% 98,000 $ –38,550 43% 74,400 $+47,510
ALL $116,500 $ –20,728,000 $ –1,190 –1.0% 78% 13,616,000 $ –2,180 15% 2,681,500 $+3,190
Bottom 60% Less than $76,530 $38,400 $ –5,170,800 $ –500 –1.3% 25% 84% 8,737,000 $ –700 7% 675,900 $+770
Impacts of the Senate Tax Plan (Revised w/Amendments) in 2019 in Colorado
Income Average Share of Tax Share w/ Share w/Group Income Change Tax Cut Tax Hike
Poorest 20% Less than $26,040 $15,700 -$64,000 -$120 –0.7% 8% 74% 407,000 $ –170 3% 15,200 $+20
Second 20% $26,040 to $46,170 $36,000 -$207,600 -$380 –1.0% 9% 86% 475,000 $ –540 7% 36,000 $+1,130
Middle 20% $46,170 to $71,420 $58,500 -$419,800 -$760 –1.3% 8% 83% 460,000 $ –1,110 14% 78,400 $+1,070
Fourth 20% $71,420 to $122,590 $91,900 -$767,400 -$1,390 –1.5% 15% 83% 457,000 $ –1,900 17% 92,900 $+1,040
Next 15% $122,590 to $263,720 $170,600 -$1,072,900 -$2,590 –1.5% 21% 83% 343,000 $ –3,370 16% 68,100 $+1,220
Next 4% $263,720 to $661,160 $408,900 -$1,342,300 -$12,110 –3.0% 26% 93% 103,000 $ –13,220 6% 6,400 $+3,690
Richest 1% $661,160 and higher $1,753,900 -$1,242,600 -$45,010 –2.6% 24% 93% 26,000 $ –49,160 7% 1,800 $+13,290
ALL $98,900 $ –5,116,400 $ –1,840 –1.9% 82% 2,271,000 $ –2,410 11% 298,800 $+1,180
Bottom 60% Less than $71,420 $36,700 $ –691,400 $ –420 –1.1% 14% 81% 1,342,000 $ –620 8% 129,600 $+970
Impacts of the Senate Tax Plan (Revised w/Amendments) in 2019 in Connecticut
Income Average Share of Tax Share w/ Share w/Group Income Change Tax Cut Tax Hike
Poorest 20% Less than $25,440 $15,300 -$15,400 -$40 –0.3% 8% 50% 176,000 $ –130 2% 6,100 $+10
Second 20% $25,440 to $49,530 $37,600 -$143,100 -$420 –1.1% 9% 85% 287,000 $ –550 5% 16,400 $+370
Middle 20% $49,530 to $83,650 $65,200 -$240,700 -$660 –1.0% 8% 84% 305,000 $ –1,110 15% 54,700 $+1,550
Fourth 20% $83,650 to $143,120 $108,800 -$298,300 -$850 –0.8% 10% 71% 249,000 $ –1,960 28% 98,300 $+1,850
Next 15% $143,120 to $356,260 $207,700 -$694,800 -$2,640 –1.3% 23% 77% 202,000 $ –4,070 23% 61,400 $+2,040
Next 4% $356,260 to $1,030,720 $535,500 -$1,132,500 -$16,120 –3.0% 37% 95% 67,000 $ –17,330 5% 3,200 $+8,090
Richest 1% $1,030,720 and higher $3,600,500 -$527,600 -$30,030 –0.8% 17% 69% 12,000 $ –48,110 31% 5,400 $+11,070
ALL $132,200 $ –3,052,100 $ –1,710 –1.3% 73% 1,298,000 $ –2,750 14% 245,500 $+1,970
Bottom 60% Less than $83,650 $39,700 $ –399,200 $ –380 –1.0% 13% 73% 768,000 $ –680 7% 77,200 $+1,180
Impacts of the Senate Tax Plan (Revised w/Amendments) in 2019 in Delaware
Income Average Share of Tax Share w/ Share w/Group Income Change Tax Cut Tax Hike
Poorest 20% Less than $22,570 $13,600 -$6,400 -$70 –0.5% 8% 56% 54,000 $ –150 1% 1,200 $ —
Second 20% $22,570 to $40,600 $30,200 -$33,600 -$350 –1.2% 9% 85% 81,000 $ –440 4% 4,000 $+80
Middle 20% $40,600 to $65,950 $53,300 -$76,100 -$780 –1.5% 11% 89% 86,000 $ –980 11% 10,400 $+610
Fourth 20% $65,950 to $104,170 $83,100 -$126,900 -$1,320 –1.6% 18% 94% 90,000 $ –1,520 6% 6,000 $+1,400
Next 15% $104,170 to $221,350 $144,800 -$156,400 -$2,190 –1.5% 22% 85% 61,000 $ –2,790 15% 11,000 $+1,100
Next 4% $221,350 to $505,960 $311,200 -$152,600 -$7,660 –2.5% 22% 85% 17,000 $ –9,200 15% 2,900 $+1,050
Richest 1% $505,960 and higher $1,815,800 -$149,500 -$30,190 –1.7% 21% 98% 5,000 $ –30,940 2% 100 $+6,180
ALL $88,600 $ –701,500 $ –1,450 –1.6% 82% 394,000 $ –1,870 7% 35,600 $+870
Bottom 60% Less than $65,950 $32,500 $ –116,100 $ –400 –1.2% 17% 77% 221,000 $ –580 5% 15,600 $+430
Income Range Tot. Change ($1000s) Avg. Tax Change $ Change as a % of Pre- Tax Income
Avg. Cut $ Avg. Hike $Tot. Taxpayers
w/Hike
Income All Taxpayers (Includes ACA Individual Mandate Repeal) Taxpayers w/ Tax Cut* Taxpayers w/ Tax Hike* Tot. Taxpayers
w/Cut
Income All Taxpayers (Includes ACA Individual Mandate Repeal) Taxpayers w/ Tax Cut* Taxpayers w/ Tax Hike*
Income Range Tot. Change ($1000s) Avg. Tax Change $ Change as a % of Pre- Tax Income
Avg. Cut $
Income Range Tot. Change ($1000s) Avg. Tax Change $ Change as a % of Pre- Tax Income
Avg. Cut $ Avg. Hike $ Tot. Taxpayers
w/Cut Tot. Taxpayers
w/Hike
Avg. Hike $
Income All Taxpayers (Includes ACA Individual Mandate Repeal) Taxpayers w/ Tax Cut* Taxpayers w/ Tax Hike*
Tot. Taxpayers w/Cut
Tot. Taxpayers w/Hike
Income All Taxpayers (Includes ACA Individual Mandate Repeal) Taxpayers w/ Tax Cut* Taxpayers w/ Tax Hike*
Income Range Tot. Change ($1000s) Avg. Tax Change $ Change as a % of Pre- Tax Income
Avg. Cut $ Avg. Hike $ Tot. Taxpayers
w/Cut Tot. Taxpayers
w/Hike
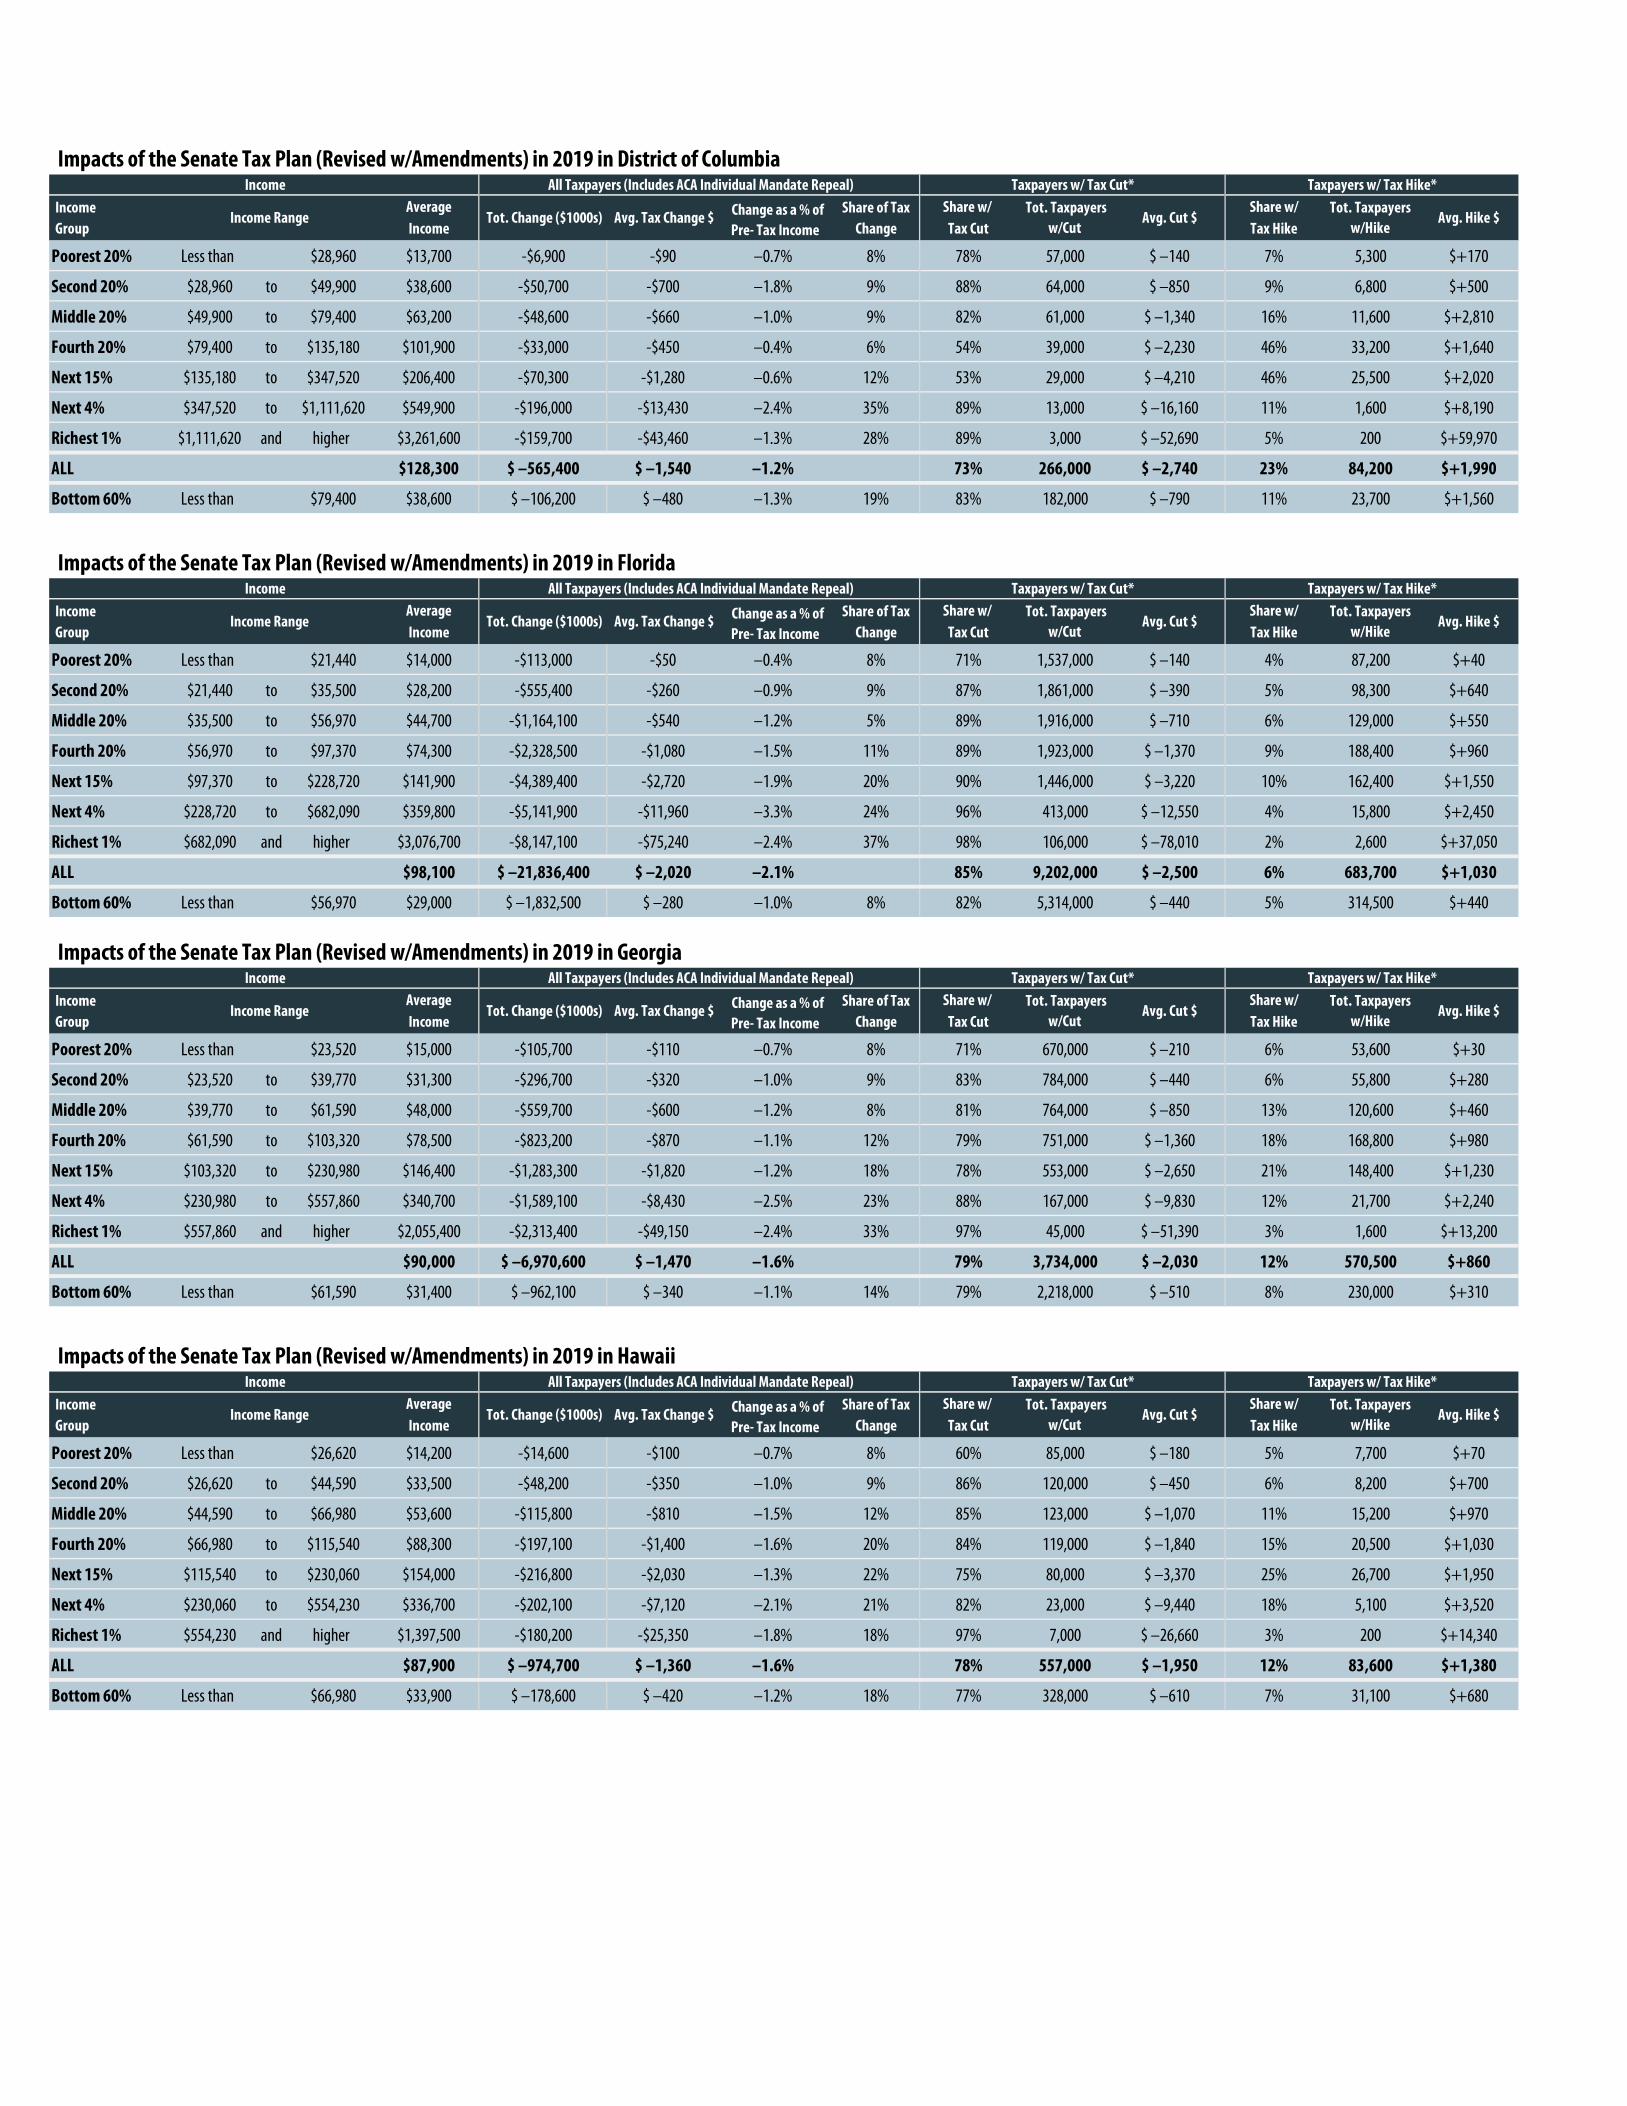
Impacts of the Senate Tax Plan (Revised w/Amendments) in 2019 in District of Columbia
Income Average Share of Tax Share w/ Share w/Group Income Change Tax Cut Tax Hike
Poorest 20% Less than $28,960 $13,700 -$6,900 -$90 –0.7% 8% 78% 57,000 $ –140 7% 5,300 $+170
Second 20% $28,960 to $49,900 $38,600 -$50,700 -$700 –1.8% 9% 88% 64,000 $ –850 9% 6,800 $+500
Middle 20% $49,900 to $79,400 $63,200 -$48,600 -$660 –1.0% 9% 82% 61,000 $ –1,340 16% 11,600 $+2,810
Fourth 20% $79,400 to $135,180 $101,900 -$33,000 -$450 –0.4% 6% 54% 39,000 $ –2,230 46% 33,200 $+1,640
Next 15% $135,180 to $347,520 $206,400 -$70,300 -$1,280 –0.6% 12% 53% 29,000 $ –4,210 46% 25,500 $+2,020
Next 4% $347,520 to $1,111,620 $549,900 -$196,000 -$13,430 –2.4% 35% 89% 13,000 $ –16,160 11% 1,600 $+8,190
Richest 1% $1,111,620 and higher $3,261,600 -$159,700 -$43,460 –1.3% 28% 89% 3,000 $ –52,690 5% 200 $+59,970
ALL $128,300 $ –565,400 $ –1,540 –1.2% 73% 266,000 $ –2,740 23% 84,200 $+1,990
Bottom 60% Less than $79,400 $38,600 $ –106,200 $ –480 –1.3% 19% 83% 182,000 $ –790 11% 23,700 $+1,560
Impacts of the Senate Tax Plan (Revised w/Amendments) in 2019 in Florida
Income Average Share of Tax Share w/ Share w/Group Income Change Tax Cut Tax Hike
Poorest 20% Less than $21,440 $14,000 -$113,000 -$50 –0.4% 8% 71% 1,537,000 $ –140 4% 87,200 $+40
Second 20% $21,440 to $35,500 $28,200 -$555,400 -$260 –0.9% 9% 87% 1,861,000 $ –390 5% 98,300 $+640
Middle 20% $35,500 to $56,970 $44,700 -$1,164,100 -$540 –1.2% 5% 89% 1,916,000 $ –710 6% 129,000 $+550
Fourth 20% $56,970 to $97,370 $74,300 -$2,328,500 -$1,080 –1.5% 11% 89% 1,923,000 $ –1,370 9% 188,400 $+960
Next 15% $97,370 to $228,720 $141,900 -$4,389,400 -$2,720 –1.9% 20% 90% 1,446,000 $ –3,220 10% 162,400 $+1,550
Next 4% $228,720 to $682,090 $359,800 -$5,141,900 -$11,960 –3.3% 24% 96% 413,000 $ –12,550 4% 15,800 $+2,450
Richest 1% $682,090 and higher $3,076,700 -$8,147,100 -$75,240 –2.4% 37% 98% 106,000 $ –78,010 2% 2,600 $+37,050
ALL $98,100 $ –21,836,400 $ –2,020 –2.1% 85% 9,202,000 $ –2,500 6% 683,700 $+1,030
Bottom 60% Less than $56,970 $29,000 $ –1,832,500 $ –280 –1.0% 8% 82% 5,314,000 $ –440 5% 314,500 $+440
Impacts of the Senate Tax Plan (Revised w/Amendments) in 2019 in Georgia
Income Average Share of Tax Share w/ Share w/Group Income Change Tax Cut Tax Hike
Poorest 20% Less than $23,520 $15,000 -$105,700 -$110 –0.7% 8% 71% 670,000 $ –210 6% 53,600 $+30
Second 20% $23,520 to $39,770 $31,300 -$296,700 -$320 –1.0% 9% 83% 784,000 $ –440 6% 55,800 $+280
Middle 20% $39,770 to $61,590 $48,000 -$559,700 -$600 –1.2% 8% 81% 764,000 $ –850 13% 120,600 $+460
Fourth 20% $61,590 to $103,320 $78,500 -$823,200 -$870 –1.1% 12% 79% 751,000 $ –1,360 18% 168,800 $+980
Next 15% $103,320 to $230,980 $146,400 -$1,283,300 -$1,820 –1.2% 18% 78% 553,000 $ –2,650 21% 148,400 $+1,230
Next 4% $230,980 to $557,860 $340,700 -$1,589,100 -$8,430 –2.5% 23% 88% 167,000 $ –9,830 12% 21,700 $+2,240
Richest 1% $557,860 and higher $2,055,400 -$2,313,400 -$49,150 –2.4% 33% 97% 45,000 $ –51,390 3% 1,600 $+13,200
ALL $90,000 $ –6,970,600 $ –1,470 –1.6% 79% 3,734,000 $ –2,030 12% 570,500 $+860
Bottom 60% Less than $61,590 $31,400 $ –962,100 $ –340 –1.1% 14% 79% 2,218,000 $ –510 8% 230,000 $+310
Impacts of the Senate Tax Plan (Revised w/Amendments) in 2019 in Hawaii
Income Average Share of Tax Share w/ Share w/Group Income Change Tax Cut Tax Hike
Poorest 20% Less than $26,620 $14,200 -$14,600 -$100 –0.7% 8% 60% 85,000 $ –180 5% 7,700 $+70
Second 20% $26,620 to $44,590 $33,500 -$48,200 -$350 –1.0% 9% 86% 120,000 $ –450 6% 8,200 $+700
Middle 20% $44,590 to $66,980 $53,600 -$115,800 -$810 –1.5% 12% 85% 123,000 $ –1,070 11% 15,200 $+970
Fourth 20% $66,980 to $115,540 $88,300 -$197,100 -$1,400 –1.6% 20% 84% 119,000 $ –1,840 15% 20,500 $+1,030
Next 15% $115,540 to $230,060 $154,000 -$216,800 -$2,030 –1.3% 22% 75% 80,000 $ –3,370 25% 26,700 $+1,950
Next 4% $230,060 to $554,230 $336,700 -$202,100 -$7,120 –2.1% 21% 82% 23,000 $ –9,440 18% 5,100 $+3,520
Richest 1% $554,230 and higher $1,397,500 -$180,200 -$25,350 –1.8% 18% 97% 7,000 $ –26,660 3% 200 $+14,340
ALL $87,900 $ –974,700 $ –1,360 –1.6% 78% 557,000 $ –1,950 12% 83,600 $+1,380
Bottom 60% Less than $66,980 $33,900 $ –178,600 $ –420 –1.2% 18% 77% 328,000 $ –610 7% 31,100 $+680
Income Range Tot. Change ($1000s) Avg. Tax Change $ Change as a % of Pre- Tax Income
Avg. Cut $ Avg. Hike $ Tot. Taxpayers
w/Cut Tot. Taxpayers
w/Hike
Income All Taxpayers (Includes ACA Individual Mandate Repeal) Taxpayers w/ Tax Cut* Taxpayers w/ Tax Hike*
Income All Taxpayers (Includes ACA Individual Mandate Repeal) Taxpayers w/ Tax Cut* Taxpayers w/ Tax Hike*
Income Range Tot. Change ($1000s) Avg. Tax Change $ Change as a % of Pre- Tax Income
Avg. Cut $
Income Range Tot. Change ($1000s) Avg. Tax Change $ Change as a % of Pre- Tax Income
Avg. Cut $ Avg. Hike $ Tot. Taxpayers
w/Cut Tot. Taxpayers
w/Hike
Avg. Hike $
Income All Taxpayers (Includes ACA Individual Mandate Repeal) Taxpayers w/ Tax Cut* Taxpayers w/ Tax Hike*
Tot. Taxpayers w/Cut
Tot. Taxpayers w/Hike
Income All Taxpayers (Includes ACA Individual Mandate Repeal) Taxpayers w/ Tax Cut* Taxpayers w/ Tax Hike*
Income Range Tot. Change ($1000s) Avg. Tax Change $ Change as a % of Pre- Tax Income
Avg. Cut $ Avg. Hike $ Tot. Taxpayers
w/Cut Tot. Taxpayers
w/Hike

Impacts of the Senate Tax Plan (Revised w/Amendments) in 2019 in Idaho
Income Average Share of Tax Share w/ Share w/Group Income Change Tax Cut Tax Hike
Poorest 20% Less than $21,910 $12,000 -$9,000 -$60 –0.5% 8% 61% 86,000 $ –170 7% 10,500 $+10
Second 20% $21,910 to $40,440 $29,600 -$44,900 -$290 –1.0% 9% 84% 132,000 $ –390 3% 5,300 $+110
Middle 20% $40,440 to $63,230 $49,900 -$112,300 -$670 –1.3% 11% 88% 149,000 $ –820 6% 10,100 $+250
Fourth 20% $63,230 to $94,400 $77,400 -$188,500 -$1,200 –1.6% 18% 89% 139,000 $ –1,450 10% 15,300 $+450
Next 15% $94,400 to $182,550 $125,400 -$237,900 -$2,030 –1.6% 22% 87% 102,000 $ –2,500 12% 14,000 $+1,170
Next 4% $182,550 to $484,120 $274,500 -$201,200 -$6,420 –2.3% 19% 84% 26,000 $ –7,960 16% 4,900 $+1,800
Richest 1% $484,120 and higher $1,493,800 -$264,800 -$34,120 –2.3% 25% 94% 7,000 $ –36,880 5% 400 $+13,240
ALL $78,700 $ –1,058,600 $ –1,350 –1.7% 82% 641,000 $ –1,750 8% 60,500 $+670
Bottom 60% Less than $63,230 $31,600 $ –166,200 $ –360 –1.1% 16% 78% 367,000 $ –510 6% 25,900 $+120
Impacts of the Senate Tax Plan (Revised w/Amendments) in 2019 in Illinois
Income Average Share of Tax Share w/ Share w/Group Income Change Tax Cut Tax Hike
Poorest 20% Less than $26,880 $15,800 -$137,600 -$120 –0.7% 8% 72% 841,000 $ –180 3% 34,200 $+10
Second 20% $26,880 to $46,230 $36,100 -$523,700 -$450 –1.2% 9% 87% 1,021,000 $ –550 5% 58,600 $+420
Middle 20% $46,230 to $73,810 $59,700 -$984,900 -$840 –1.4% 10% 85% 997,000 $ –1,130 11% 130,500 $+970
Fourth 20% $73,810 to $123,200 $94,900 -$1,640,800 -$1,400 –1.5% 16% 86% 1,010,000 $ –1,810 13% 147,800 $+1,170
Next 15% $123,200 to $262,750 $172,100 -$1,923,700 -$2,180 –1.3% 19% 77% 682,000 $ –3,330 22% 197,700 $+1,740
Next 4% $262,750 to $672,640 $405,700 -$2,627,000 -$11,200 –2.8% 26% 92% 215,000 $ –12,530 8% 19,200 $+3,610
Richest 1% $672,640 and higher $2,822,600 -$2,350,800 -$40,220 –1.4% 23% 82% 48,000 $ –49,640 17% 10,200 $+3,970
ALL $110,800 $ –10,188,700 $ –1,730 –1.6% 82% 4,814,000 $ –2,280 10% 598,200 $+1,300
Bottom 60% Less than $73,810 $37,200 $ –1,646,200 $ –470 –1.3% 16% 81% 2,859,000 $ –650 6% 223,300 $+680
Impacts of the Senate Tax Plan (Revised w/Amendments) in 2019 in Indiana
Income Average Share of Tax Share w/ Share w/Group Income Change Tax Cut Tax Hike
Poorest 20% Less than $24,730 $14,700 -$52,400 -$80 –0.6% 8% 74% 458,000 $ –150 5% 33,200 $+10
Second 20% $24,730 to $44,050 $35,300 -$254,900 -$410 –1.2% 9% 86% 543,000 $ –510 5% 30,500 $+190
Middle 20% $44,050 to $67,170 $54,900 -$484,600 -$780 –1.4% 10% 91% 571,000 $ –900 6% 36,000 $+370
Fourth 20% $67,170 to $105,420 $83,700 -$902,600 -$1,450 –1.7% 18% 93% 581,000 $ –1,620 5% 32,100 $+680
Next 15% $105,420 to $204,090 $141,500 -$1,172,000 -$2,510 –1.8% 23% 89% 417,000 $ –3,000 11% 50,100 $+1,520
Next 4% $204,090 to $518,040 $291,200 -$989,000 -$7,890 –2.7% 20% 91% 114,000 $ –8,860 8% 10,200 $+1,870
Richest 1% $518,040 and higher $1,616,600 -$1,212,500 -$38,640 –2.4% 24% 98% 31,000 $ –39,660 1% 500 $+24,400
ALL $86,200 $ –5,067,800 $ –1,610 –1.9% 87% 2,715,000 $ –1,940 6% 192,600 $+770
Bottom 60% Less than $67,170 $35,000 $ –791,900 $ –420 –1.2% 16% 84% 1,572,000 $ –550 5% 99,700 $+200
Impacts of the Senate Tax Plan (Revised w/Amendments) in 2019 in Iowa
Income Average Share of Tax Share w/ Share w/Group Income Change Tax Cut Tax Hike
Poorest 20% Less than $26,290 $14,600 -$27,400 -$90 –0.6% 8% 69% 206,000 $ –150 2% 4,700 $+10
Second 20% $26,290 to $46,760 $37,300 -$132,800 -$440 –1.2% 9% 93% 278,000 $ –490 2% 5,600 $+190
Middle 20% $46,760 to $70,350 $58,200 -$247,700 -$830 –1.4% 12% 87% 262,000 $ –1,000 10% 29,600 $+350
Fourth 20% $70,350 to $114,730 $89,600 -$415,800 -$1,390 –1.5% 20% 91% 274,000 $ –1,590 7% 21,200 $+890
Next 15% $114,730 to $194,770 $141,100 -$461,400 -$2,070 –1.5% 22% 89% 199,000 $ –2,470 11% 24,500 $+1,200
Next 4% $194,770 to $475,120 $275,300 -$361,300 -$5,880 –2.1% 17% 88% 54,000 $ –6,900 11% 6,900 $+1,970
Richest 1% $475,120 and higher $1,223,700 -$483,400 -$32,200 –2.6% 23% 99% 15,000 $ –32,880 1% 200 $+20,480
ALL $83,900 $ –2,129,700 $ –1,410 –1.7% 86% 1,288,000 $ –1,710 6% 92,700 $+830
Bottom 60% Less than $70,350 $36,800 $ –407,900 $ –450 –1.2% 19% 83% 746,000 $ –580 4% 39,900 $+290
Income Range Tot. Change ($1000s) Avg. Tax Change $ Change as a % of Pre- Tax Income
Avg. Cut $ Avg. Hike $ Tot. Taxpayers
w/Cut Tot. Taxpayers
w/Hike
Income All Taxpayers (Includes ACA Individual Mandate Repeal) Taxpayers w/ Tax Cut* Taxpayers w/ Tax Hike*
Income All Taxpayers (Includes ACA Individual Mandate Repeal) Taxpayers w/ Tax Cut* Taxpayers w/ Tax Hike*
Income Range Tot. Change ($1000s) Avg. Tax Change $ Change as a % of Pre- Tax Income
Avg. Cut $
Income Range Tot. Change ($1000s) Avg. Tax Change $ Change as a % of Pre- Tax Income
Avg. Cut $ Avg. Hike $ Tot. Taxpayers
w/Cut Tot. Taxpayers
w/Hike
Avg. Hike $
Income All Taxpayers (Includes ACA Individual Mandate Repeal) Taxpayers w/ Tax Cut* Taxpayers w/ Tax Hike*
Tot. Taxpayers w/Cut
Tot. Taxpayers w/Hike
Income All Taxpayers (Includes ACA Individual Mandate Repeal) Taxpayers w/ Tax Cut* Taxpayers w/ Tax Hike*
Income Range Tot. Change ($1000s) Avg. Tax Change $ Change as a % of Pre- Tax Income
Avg. Cut $ Avg. Hike $ Tot. Taxpayers
w/Cut Tot. Taxpayers
w/Hike
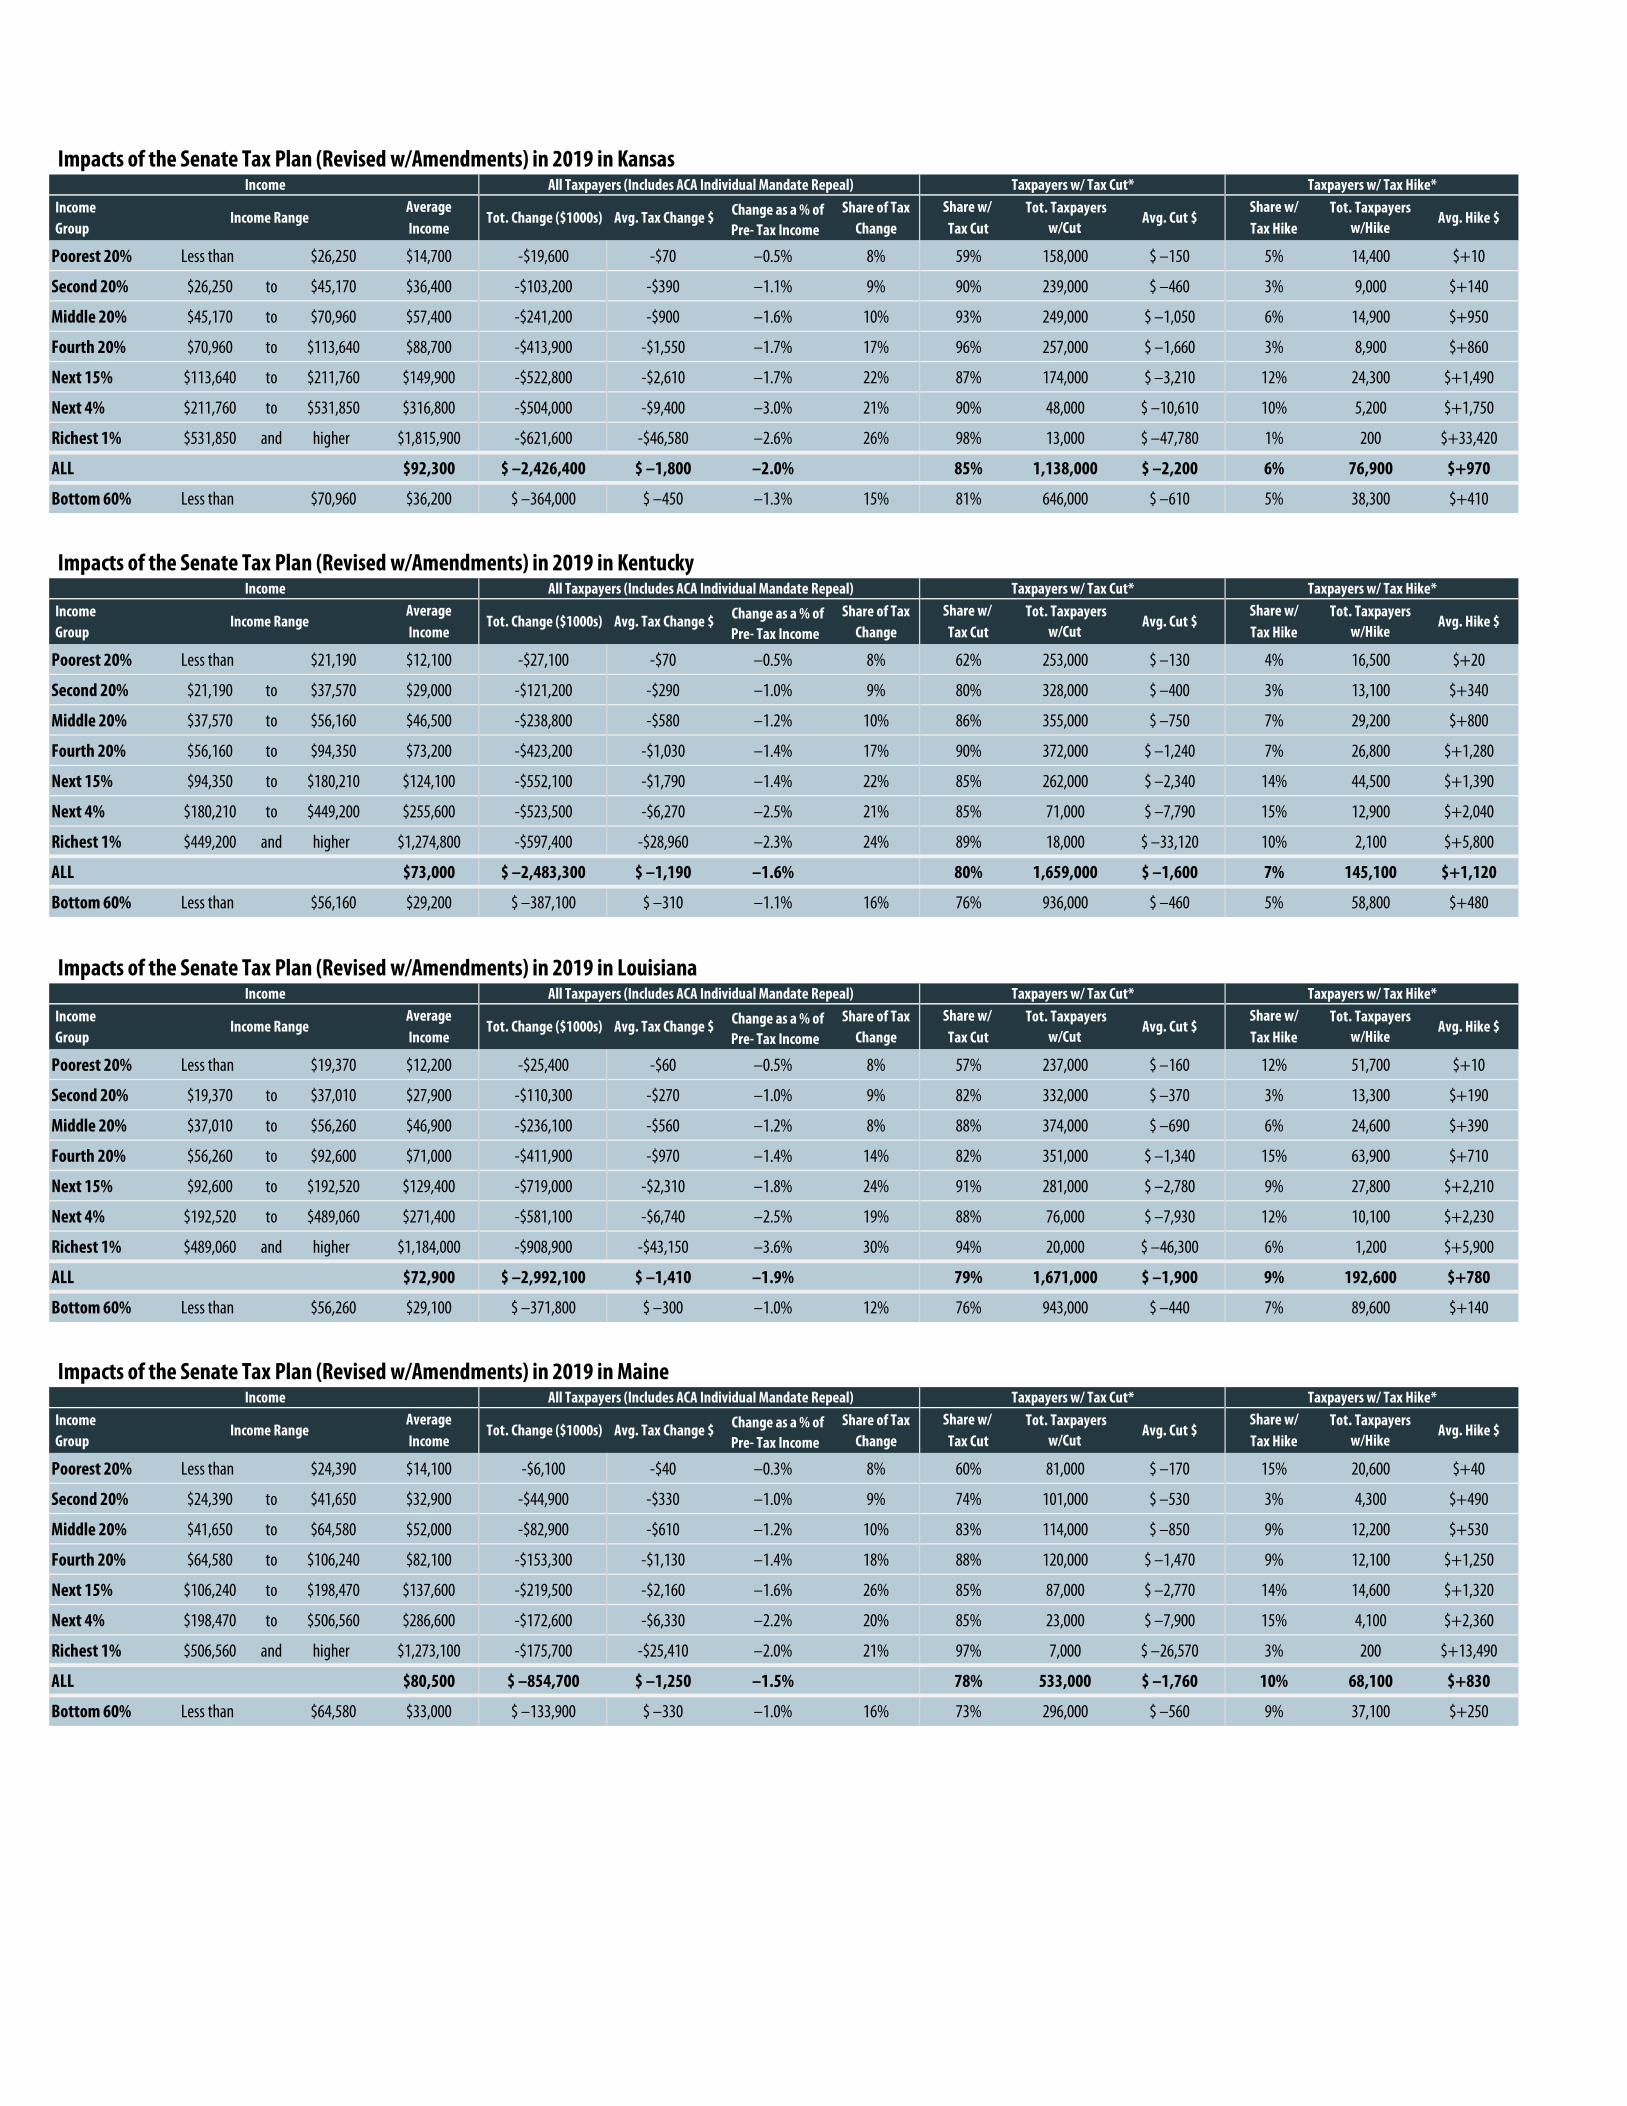
Impacts of the Senate Tax Plan (Revised w/Amendments) in 2019 in Kansas
Income Average Share of Tax Share w/ Share w/Group Income Change Tax Cut Tax Hike
Poorest 20% Less than $26,250 $14,700 -$19,600 -$70 –0.5% 8% 59% 158,000 $ –150 5% 14,400 $+10
Second 20% $26,250 to $45,170 $36,400 -$103,200 -$390 –1.1% 9% 90% 239,000 $ –460 3% 9,000 $+140
Middle 20% $45,170 to $70,960 $57,400 -$241,200 -$900 –1.6% 10% 93% 249,000 $ –1,050 6% 14,900 $+950
Fourth 20% $70,960 to $113,640 $88,700 -$413,900 -$1,550 –1.7% 17% 96% 257,000 $ –1,660 3% 8,900 $+860
Next 15% $113,640 to $211,760 $149,900 -$522,800 -$2,610 –1.7% 22% 87% 174,000 $ –3,210 12% 24,300 $+1,490
Next 4% $211,760 to $531,850 $316,800 -$504,000 -$9,400 –3.0% 21% 90% 48,000 $ –10,610 10% 5,200 $+1,750
Richest 1% $531,850 and higher $1,815,900 -$621,600 -$46,580 –2.6% 26% 98% 13,000 $ –47,780 1% 200 $+33,420
ALL $92,300 $ –2,426,400 $ –1,800 –2.0% 85% 1,138,000 $ –2,200 6% 76,900 $+970
Bottom 60% Less than $70,960 $36,200 $ –364,000 $ –450 –1.3% 15% 81% 646,000 $ –610 5% 38,300 $+410
Impacts of the Senate Tax Plan (Revised w/Amendments) in 2019 in Kentucky
Income Average Share of Tax Share w/ Share w/Group Income Change Tax Cut Tax Hike
Poorest 20% Less than $21,190 $12,100 -$27,100 -$70 –0.5% 8% 62% 253,000 $ –130 4% 16,500 $+20
Second 20% $21,190 to $37,570 $29,000 -$121,200 -$290 –1.0% 9% 80% 328,000 $ –400 3% 13,100 $+340
Middle 20% $37,570 to $56,160 $46,500 -$238,800 -$580 –1.2% 10% 86% 355,000 $ –750 7% 29,200 $+800
Fourth 20% $56,160 to $94,350 $73,200 -$423,200 -$1,030 –1.4% 17% 90% 372,000 $ –1,240 7% 26,800 $+1,280
Next 15% $94,350 to $180,210 $124,100 -$552,100 -$1,790 –1.4% 22% 85% 262,000 $ –2,340 14% 44,500 $+1,390
Next 4% $180,210 to $449,200 $255,600 -$523,500 -$6,270 –2.5% 21% 85% 71,000 $ –7,790 15% 12,900 $+2,040
Richest 1% $449,200 and higher $1,274,800 -$597,400 -$28,960 –2.3% 24% 89% 18,000 $ –33,120 10% 2,100 $+5,800
ALL $73,000 $ –2,483,300 $ –1,190 –1.6% 80% 1,659,000 $ –1,600 7% 145,100 $+1,120
Bottom 60% Less than $56,160 $29,200 $ –387,100 $ –310 –1.1% 16% 76% 936,000 $ –460 5% 58,800 $+480
Impacts of the Senate Tax Plan (Revised w/Amendments) in 2019 in Louisiana
Income Average Share of Tax Share w/ Share w/Group Income Change Tax Cut Tax Hike
Poorest 20% Less than $19,370 $12,200 -$25,400 -$60 –0.5% 8% 57% 237,000 $ –160 12% 51,700 $+10
Second 20% $19,370 to $37,010 $27,900 -$110,300 -$270 –1.0% 9% 82% 332,000 $ –370 3% 13,300 $+190
Middle 20% $37,010 to $56,260 $46,900 -$236,100 -$560 –1.2% 8% 88% 374,000 $ –690 6% 24,600 $+390
Fourth 20% $56,260 to $92,600 $71,000 -$411,900 -$970 –1.4% 14% 82% 351,000 $ –1,340 15% 63,900 $+710
Next 15% $92,600 to $192,520 $129,400 -$719,000 -$2,310 –1.8% 24% 91% 281,000 $ –2,780 9% 27,800 $+2,210
Next 4% $192,520 to $489,060 $271,400 -$581,100 -$6,740 –2.5% 19% 88% 76,000 $ –7,930 12% 10,100 $+2,230
Richest 1% $489,060 and higher $1,184,000 -$908,900 -$43,150 –3.6% 30% 94% 20,000 $ –46,300 6% 1,200 $+5,900
ALL $72,900 $ –2,992,100 $ –1,410 –1.9% 79% 1,671,000 $ –1,900 9% 192,600 $+780
Bottom 60% Less than $56,260 $29,100 $ –371,800 $ –300 –1.0% 12% 76% 943,000 $ –440 7% 89,600 $+140
Impacts of the Senate Tax Plan (Revised w/Amendments) in 2019 in Maine
Income Average Share of Tax Share w/ Share w/Group Income Change Tax Cut Tax Hike
Poorest 20% Less than $24,390 $14,100 -$6,100 -$40 –0.3% 8% 60% 81,000 $ –170 15% 20,600 $+40
Second 20% $24,390 to $41,650 $32,900 -$44,900 -$330 –1.0% 9% 74% 101,000 $ –530 3% 4,300 $+490
Middle 20% $41,650 to $64,580 $52,000 -$82,900 -$610 –1.2% 10% 83% 114,000 $ –850 9% 12,200 $+530
Fourth 20% $64,580 to $106,240 $82,100 -$153,300 -$1,130 –1.4% 18% 88% 120,000 $ –1,470 9% 12,100 $+1,250
Next 15% $106,240 to $198,470 $137,600 -$219,500 -$2,160 –1.6% 26% 85% 87,000 $ –2,770 14% 14,600 $+1,320
Next 4% $198,470 to $506,560 $286,600 -$172,600 -$6,330 –2.2% 20% 85% 23,000 $ –7,900 15% 4,100 $+2,360
Richest 1% $506,560 and higher $1,273,100 -$175,700 -$25,410 –2.0% 21% 97% 7,000 $ –26,570 3% 200 $+13,490
ALL $80,500 $ –854,700 $ –1,250 –1.5% 78% 533,000 $ –1,760 10% 68,100 $+830
Bottom 60% Less than $64,580 $33,000 $ –133,900 $ –330 –1.0% 16% 73% 296,000 $ –560 9% 37,100 $+250
Income Range Tot. Change ($1000s) Avg. Tax Change $ Change as a % of Pre- Tax Income
Avg. Cut $ Avg. Hike $ Tot. Taxpayers
w/Cut Tot. Taxpayers
w/Hike
Income All Taxpayers (Includes ACA Individual Mandate Repeal) Taxpayers w/ Tax Cut* Taxpayers w/ Tax Hike*
Income All Taxpayers (Includes ACA Individual Mandate Repeal) Taxpayers w/ Tax Cut* Taxpayers w/ Tax Hike*
Income Range Tot. Change ($1000s) Avg. Tax Change $ Change as a % of Pre- Tax Income
Avg. Cut $
Income Range Tot. Change ($1000s) Avg. Tax Change $ Change as a % of Pre- Tax Income
Avg. Cut $ Avg. Hike $ Tot. Taxpayers
w/Cut Tot. Taxpayers
w/Hike
Avg. Hike $
Income All Taxpayers (Includes ACA Individual Mandate Repeal) Taxpayers w/ Tax Cut* Taxpayers w/ Tax Hike*
Tot. Taxpayers w/Cut
Tot. Taxpayers w/Hike
Income All Taxpayers (Includes ACA Individual Mandate Repeal) Taxpayers w/ Tax Cut* Taxpayers w/ Tax Hike*
Income Range Tot. Change ($1000s) Avg. Tax Change $ Change as a % of Pre- Tax Income
Avg. Cut $ Avg. Hike $ Tot. Taxpayers
w/Cut Tot. Taxpayers
w/Hike
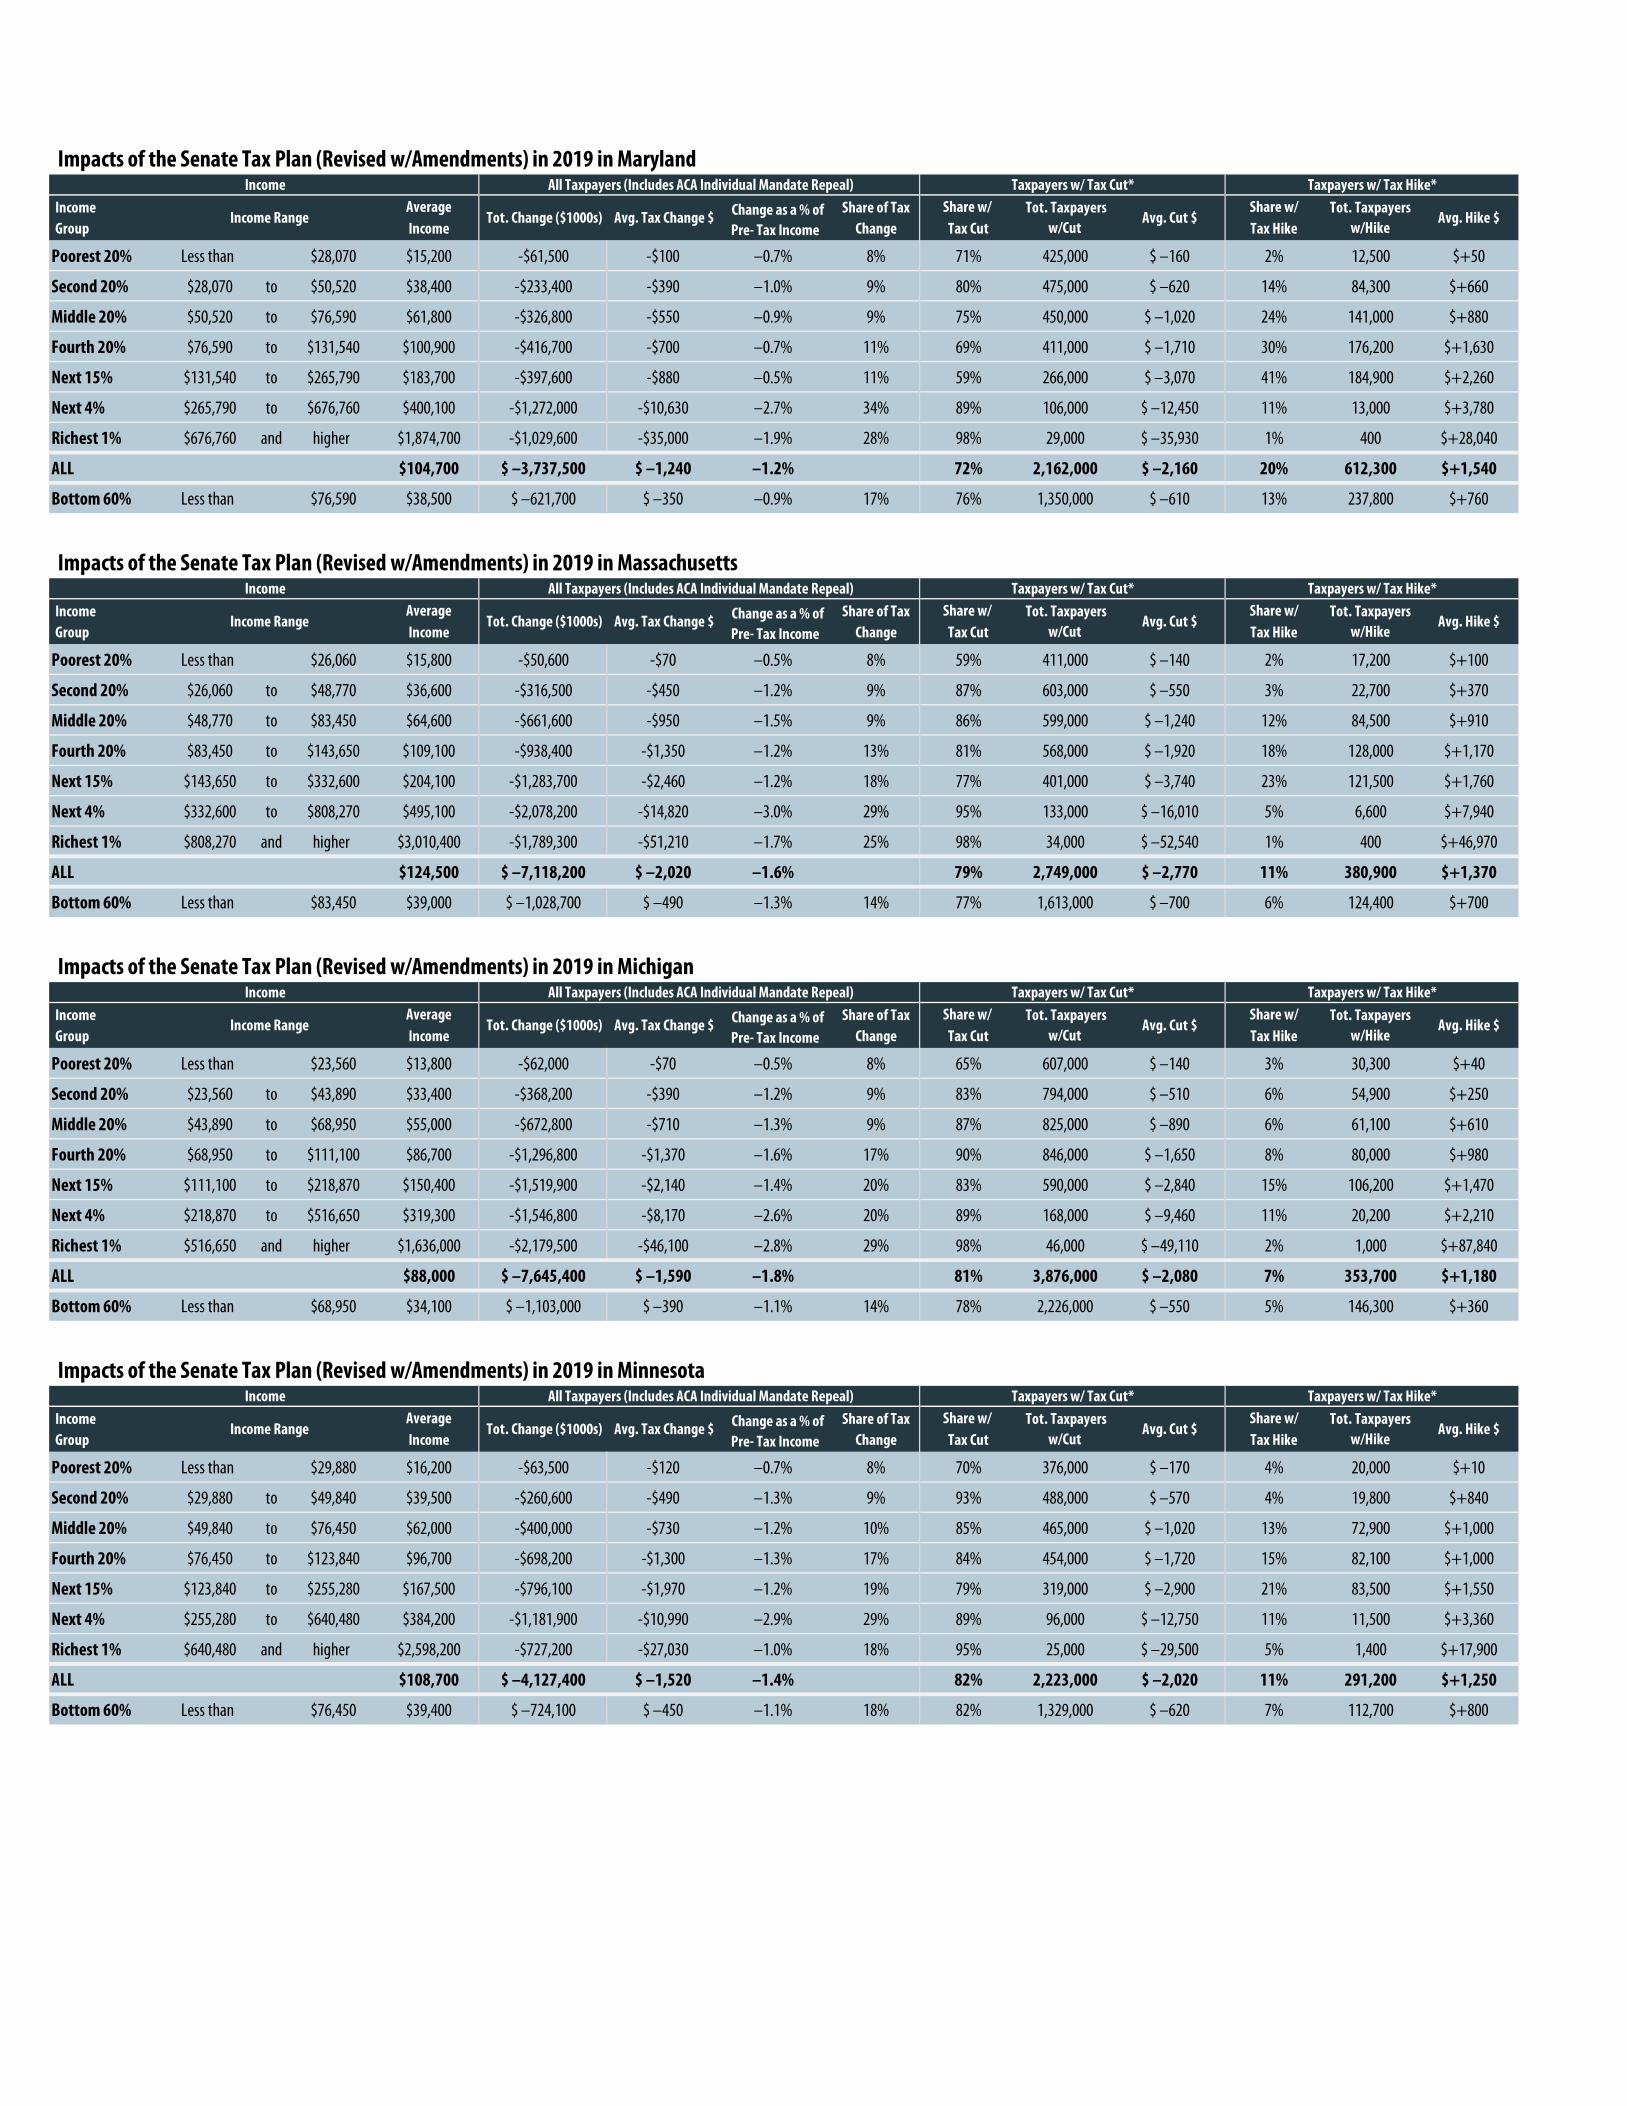
Impacts of the Senate Tax Plan (Revised w/Amendments) in 2019 in Maryland
Income Average Share of Tax Share w/ Share w/Group Income Change Tax Cut Tax Hike
Poorest 20% Less than $28,070 $15,200 -$61,500 -$100 –0.7% 8% 71% 425,000 $ –160 2% 12,500 $+50
Second 20% $28,070 to $50,520 $38,400 -$233,400 -$390 –1.0% 9% 80% 475,000 $ –620 14% 84,300 $+660
Middle 20% $50,520 to $76,590 $61,800 -$326,800 -$550 –0.9% 9% 75% 450,000 $ –1,020 24% 141,000 $+880
Fourth 20% $76,590 to $131,540 $100,900 -$416,700 -$700 –0.7% 11% 69% 411,000 $ –1,710 30% 176,200 $+1,630
Next 15% $131,540 to $265,790 $183,700 -$397,600 -$880 –0.5% 11% 59% 266,000 $ –3,070 41% 184,900 $+2,260
Next 4% $265,790 to $676,760 $400,100 -$1,272,000 -$10,630 –2.7% 34% 89% 106,000 $ –12,450 11% 13,000 $+3,780
Richest 1% $676,760 and higher $1,874,700 -$1,029,600 -$35,000 –1.9% 28% 98% 29,000 $ –35,930 1% 400 $+28,040
ALL $104,700 $ –3,737,500 $ –1,240 –1.2% 72% 2,162,000 $ –2,160 20% 612,300 $+1,540
Bottom 60% Less than $76,590 $38,500 $ –621,700 $ –350 –0.9% 17% 76% 1,350,000 $ –610 13% 237,800 $+760
Impacts of the Senate Tax Plan (Revised w/Amendments) in 2019 in Massachusetts
Income Average Share of Tax Share w/ Share w/Group Income Change Tax Cut Tax Hike
Poorest 20% Less than $26,060 $15,800 -$50,600 -$70 –0.5% 8% 59% 411,000 $ –140 2% 17,200 $+100
Second 20% $26,060 to $48,770 $36,600 -$316,500 -$450 –1.2% 9% 87% 603,000 $ –550 3% 22,700 $+370
Middle 20% $48,770 to $83,450 $64,600 -$661,600 -$950 –1.5% 9% 86% 599,000 $ –1,240 12% 84,500 $+910
Fourth 20% $83,450 to $143,650 $109,100 -$938,400 -$1,350 –1.2% 13% 81% 568,000 $ –1,920 18% 128,000 $+1,170
Next 15% $143,650 to $332,600 $204,100 -$1,283,700 -$2,460 –1.2% 18% 77% 401,000 $ –3,740 23% 121,500 $+1,760
Next 4% $332,600 to $808,270 $495,100 -$2,078,200 -$14,820 –3.0% 29% 95% 133,000 $ –16,010 5% 6,600 $+7,940
Richest 1% $808,270 and higher $3,010,400 -$1,789,300 -$51,210 –1.7% 25% 98% 34,000 $ –52,540 1% 400 $+46,970
ALL $124,500 $ –7,118,200 $ –2,020 –1.6% 79% 2,749,000 $ –2,770 11% 380,900 $+1,370
Bottom 60% Less than $83,450 $39,000 $ –1,028,700 $ –490 –1.3% 14% 77% 1,613,000 $ –700 6% 124,400 $+700
Impacts of the Senate Tax Plan (Revised w/Amendments) in 2019 in Michigan
Income Average Share of Tax Share w/ Share w/Group Income Change Tax Cut Tax Hike
Poorest 20% Less than $23,560 $13,800 -$62,000 -$70 –0.5% 8% 65% 607,000 $ –140 3% 30,300 $+40
Second 20% $23,560 to $43,890 $33,400 -$368,200 -$390 –1.2% 9% 83% 794,000 $ –510 6% 54,900 $+250
Middle 20% $43,890 to $68,950 $55,000 -$672,800 -$710 –1.3% 9% 87% 825,000 $ –890 6% 61,100 $+610
Fourth 20% $68,950 to $111,100 $86,700 -$1,296,800 -$1,370 –1.6% 17% 90% 846,000 $ –1,650 8% 80,000 $+980
Next 15% $111,100 to $218,870 $150,400 -$1,519,900 -$2,140 –1.4% 20% 83% 590,000 $ –2,840 15% 106,200 $+1,470
Next 4% $218,870 to $516,650 $319,300 -$1,546,800 -$8,170 –2.6% 20% 89% 168,000 $ –9,460 11% 20,200 $+2,210
Richest 1% $516,650 and higher $1,636,000 -$2,179,500 -$46,100 –2.8% 29% 98% 46,000 $ –49,110 2% 1,000 $+87,840
ALL $88,000 $ –7,645,400 $ –1,590 –1.8% 81% 3,876,000 $ –2,080 7% 353,700 $+1,180
Bottom 60% Less than $68,950 $34,100 $ –1,103,000 $ –390 –1.1% 14% 78% 2,226,000 $ –550 5% 146,300 $+360
Impacts of the Senate Tax Plan (Revised w/Amendments) in 2019 in Minnesota
Income Average Share of Tax Share w/ Share w/Group Income Change Tax Cut Tax Hike
Poorest 20% Less than $29,880 $16,200 -$63,500 -$120 –0.7% 8% 70% 376,000 $ –170 4% 20,000 $+10
Second 20% $29,880 to $49,840 $39,500 -$260,600 -$490 –1.3% 9% 93% 488,000 $ –570 4% 19,800 $+840
Middle 20% $49,840 to $76,450 $62,000 -$400,000 -$730 –1.2% 10% 85% 465,000 $ –1,020 13% 72,900 $+1,000
Fourth 20% $76,450 to $123,840 $96,700 -$698,200 -$1,300 –1.3% 17% 84% 454,000 $ –1,720 15% 82,100 $+1,000
Next 15% $123,840 to $255,280 $167,500 -$796,100 -$1,970 –1.2% 19% 79% 319,000 $ –2,900 21% 83,500 $+1,550
Next 4% $255,280 to $640,480 $384,200 -$1,181,900 -$10,990 –2.9% 29% 89% 96,000 $ –12,750 11% 11,500 $+3,360
Richest 1% $640,480 and higher $2,598,200 -$727,200 -$27,030 –1.0% 18% 95% 25,000 $ –29,500 5% 1,400 $+17,900
ALL $108,700 $ –4,127,400 $ –1,520 –1.4% 82% 2,223,000 $ –2,020 11% 291,200 $+1,250
Bottom 60% Less than $76,450 $39,400 $ –724,100 $ –450 –1.1% 18% 82% 1,329,000 $ –620 7% 112,700 $+800
Income Range Tot. Change ($1000s) Avg. Tax Change $ Change as a % of Pre- Tax Income
Avg. Cut $ Avg. Hike $ Tot. Taxpayers
w/Cut Tot. Taxpayers
w/Hike
Income All Taxpayers (Includes ACA Individual Mandate Repeal) Taxpayers w/ Tax Cut* Taxpayers w/ Tax Hike*
Income All Taxpayers (Includes ACA Individual Mandate Repeal) Taxpayers w/ Tax Cut* Taxpayers w/ Tax Hike*
Income Range Tot. Change ($1000s) Avg. Tax Change $ Change as a % of Pre- Tax Income
Avg. Cut $
Income Range Tot. Change ($1000s) Avg. Tax Change $ Change as a % of Pre- Tax Income
Avg. Cut $ Avg. Hike $ Tot. Taxpayers
w/Cut Tot. Taxpayers
w/Hike
Avg. Hike $
Income All Taxpayers (Includes ACA Individual Mandate Repeal) Taxpayers w/ Tax Cut* Taxpayers w/ Tax Hike*
Tot. Taxpayers w/Cut
Tot. Taxpayers w/Hike
Income All Taxpayers (Includes ACA Individual Mandate Repeal) Taxpayers w/ Tax Cut* Taxpayers w/ Tax Hike*
Income Range Tot. Change ($1000s) Avg. Tax Change $ Change as a % of Pre- Tax Income
Avg. Cut $ Avg. Hike $ Tot. Taxpayers
w/Cut Tot. Taxpayers
w/Hike

Impacts of the Senate Tax Plan (Revised w/Amendments) in 2019 in Mississippi
Income Average Share of Tax Share w/ Share w/Group Income Change Tax Cut Tax Hike
Poorest 20% Less than $18,880 $12,300 -$25,700 -$90 –0.8% 8% 71% 192,000 $ –170 2% 6,700 $+10
Second 20% $18,880 to $32,700 $24,900 -$61,100 -$220 –0.9% 9% 76% 211,000 $ –330 4% 10,300 $+90
Middle 20% $32,700 to $51,900 $42,400 -$136,900 -$500 –1.2% 10% 79% 216,000 $ –740 9% 24,900 $+640
Fourth 20% $51,900 to $90,950 $67,600 -$242,000 -$870 –1.3% 17% 84% 232,000 $ –1,200 11% 30,200 $+970
Next 15% $90,950 to $179,280 $118,200 -$315,500 -$1,560 –1.3% 22% 84% 170,000 $ –2,270 15% 30,900 $+2,190
Next 4% $179,280 to $379,140 $231,700 -$291,000 -$4,960 –2.1% 21% 89% 52,000 $ –5,750 10% 5,900 $+1,360
Richest 1% $379,140 and higher $1,187,000 -$346,300 -$25,200 –2.1% 24% 93% 13,000 $ –28,890 7% 900 $+24,200
ALL $67,800 $ –1,418,300 $ –1,020 –1.5% 78% 1,086,000 $ –1,460 8% 109,800 $+1,320
Bottom 60% Less than $51,900 $26,500 $ –223,700 $ –270 –1.0% 16% 76% 619,000 $ –420 5% 41,900 $+400
Impacts of the Senate Tax Plan (Revised w/Amendments) in 2019 in Missouri
Income Average Share of Tax Share w/ Share w/Group Income Change Tax Cut Tax Hike
Poorest 20% Less than $22,100 $13,200 -$31,800 -$50 –0.4% 8% 57% 336,000 $ –140 8% 48,200 $ —
Second 20% $22,100 to $40,660 $30,500 -$171,900 -$290 –1.0% 9% 83% 491,000 $ –390 3% 17,600 $+170
Middle 20% $40,660 to $62,990 $50,700 -$368,800 -$630 –1.2% 9% 89% 524,000 $ –790 7% 38,400 $+720
Fourth 20% $62,990 to $102,860 $79,800 -$714,200 -$1,230 –1.5% 17% 89% 518,000 $ –1,550 10% 55,900 $+1,240
Next 15% $102,860 to $205,050 $137,500 -$1,014,300 -$2,250 –1.6% 24% 89% 401,000 $ –2,710 10% 46,100 $+1,490
Next 4% $205,050 to $500,360 $296,900 -$881,200 -$7,400 –2.5% 21% 90% 107,000 $ –8,490 10% 11,600 $+2,330
Richest 1% $500,360 and higher $1,661,700 -$1,040,800 -$35,230 –2.1% 25% 90% 27,000 $ –39,970 10% 2,800 $+7,460
ALL $83,500 $ –4,222,700 $ –1,420 –1.7% 81% 2,404,000 $ –1,870 7% 220,600 $+980
Bottom 60% Less than $62,990 $31,400 $ –572,500 $ –320 –1.0% 14% 76% 1,351,000 $ –480 6% 104,200 $+300
Impacts of the Senate Tax Plan (Revised w/Amendments) in 2019 in Montana
Income Average Share of Tax Share w/ Share w/Group Income Change Tax Cut Tax Hike
Poorest 20% Less than $21,150 $11,400 -$3,700 -$40 –0.3% 8% 54% 54,000 $ –120 7% 6,900 $ —
Second 20% $21,150 to $37,440 $28,600 -$17,800 -$170 –0.6% 9% 78% 83,000 $ –260 7% 7,700 $+80
Middle 20% $37,440 to $57,670 $45,500 -$51,300 -$500 –1.1% 7% 86% 89,000 $ –670 9% 9,300 $+500
Fourth 20% $57,670 to $95,310 $76,000 -$117,700 -$1,100 –1.4% 17% 90% 97,000 $ –1,420 9% 9,200 $+1,780
Next 15% $95,310 to $187,800 $129,200 -$151,900 -$1,900 –1.5% 22% 82% 65,000 $ –2,610 17% 13,900 $+1,270
Next 4% $187,800 to $499,160 $284,400 -$162,800 -$7,530 –2.6% 24% 88% 19,000 $ –8,790 11% 2,400 $+2,080
Richest 1% $499,160 and higher $1,661,100 -$184,500 -$33,760 –2.0% 27% 95% 5,000 $ –36,720 5% 300 $+19,010
ALL $80,000 $ –689,600 $ –1,300 –1.6% 78% 412,000 $ –1,820 9% 49,700 $+1,000
Bottom 60% Less than $57,670 $28,600 $ –72,800 $ –230 –0.8% 11% 73% 226,000 $ –380 8% 23,900 $+220
Impacts of the Senate Tax Plan (Revised w/Amendments) in 2019 in Nebraska
Income Average Share of Tax Share w/ Share w/Group Income Change Tax Cut Tax Hike
Poorest 20% Less than $27,420 $15,200 -$19,000 -$110 –0.7% 8% 68% 123,000 $ –200 4% 7,100 $+10
Second 20% $27,420 to $45,430 $36,800 -$101,500 -$560 –1.5% 9% 92% 168,000 $ –650 3% 4,700 $+470
Middle 20% $45,430 to $73,300 $58,200 -$154,800 -$850 –1.5% 11% 93% 169,000 $ –960 4% 7,500 $+220
Fourth 20% $73,300 to $109,940 $88,600 -$236,300 -$1,300 –1.5% 16% 87% 158,000 $ –1,680 11% 20,500 $+1,160
Next 15% $109,940 to $205,260 $143,100 -$326,900 -$2,400 –1.7% 23% 85% 116,000 $ –3,060 15% 20,000 $+1,430
Next 4% $205,260 to $531,450 $302,300 -$257,100 -$7,050 –2.3% 18% 85% 31,000 $ –8,750 15% 5,600 $+2,300
Richest 1% $531,450 and higher $1,560,400 -$350,300 -$39,050 –2.5% 24% 96% 9,000 $ –42,140 4% 300 $+41,690
ALL $88,700 $ –1,445,900 $ –1,590 –1.8% 85% 774,000 $ –2,000 7% 65,700 $+1,260
Bottom 60% Less than $73,300 $36,800 $ –275,300 $ –510 –1.4% 19% 84% 460,000 $ –640 4% 19,300 $+210
Income Range Tot. Change ($1000s) Avg. Tax Change $ Change as a % of Pre- Tax Income
Avg. Cut $ Avg. Hike $ Tot. Taxpayers
w/Cut Tot. Taxpayers
w/Hike
Income All Taxpayers (Includes ACA Individual Mandate Repeal) Taxpayers w/ Tax Cut* Taxpayers w/ Tax Hike*
Income All Taxpayers (Includes ACA Individual Mandate Repeal) Taxpayers w/ Tax Cut* Taxpayers w/ Tax Hike*
Income Range Tot. Change ($1000s) Avg. Tax Change $ Change as a % of Pre- Tax Income
Avg. Cut $
Income Range Tot. Change ($1000s) Avg. Tax Change $ Change as a % of Pre- Tax Income
Avg. Cut $ Avg. Hike $ Tot. Taxpayers
w/Cut Tot. Taxpayers
w/Hike
Avg. Hike $
Income All Taxpayers (Includes ACA Individual Mandate Repeal) Taxpayers w/ Tax Cut* Taxpayers w/ Tax Hike*
Tot. Taxpayers w/Cut
Tot. Taxpayers w/Hike
Income All Taxpayers (Includes ACA Individual Mandate Repeal) Taxpayers w/ Tax Cut* Taxpayers w/ Tax Hike*
Income Range Tot. Change ($1000s) Avg. Tax Change $ Change as a % of Pre- Tax Income
Avg. Cut $ Avg. Hike $ Tot. Taxpayers
w/Cut Tot. Taxpayers
w/Hike
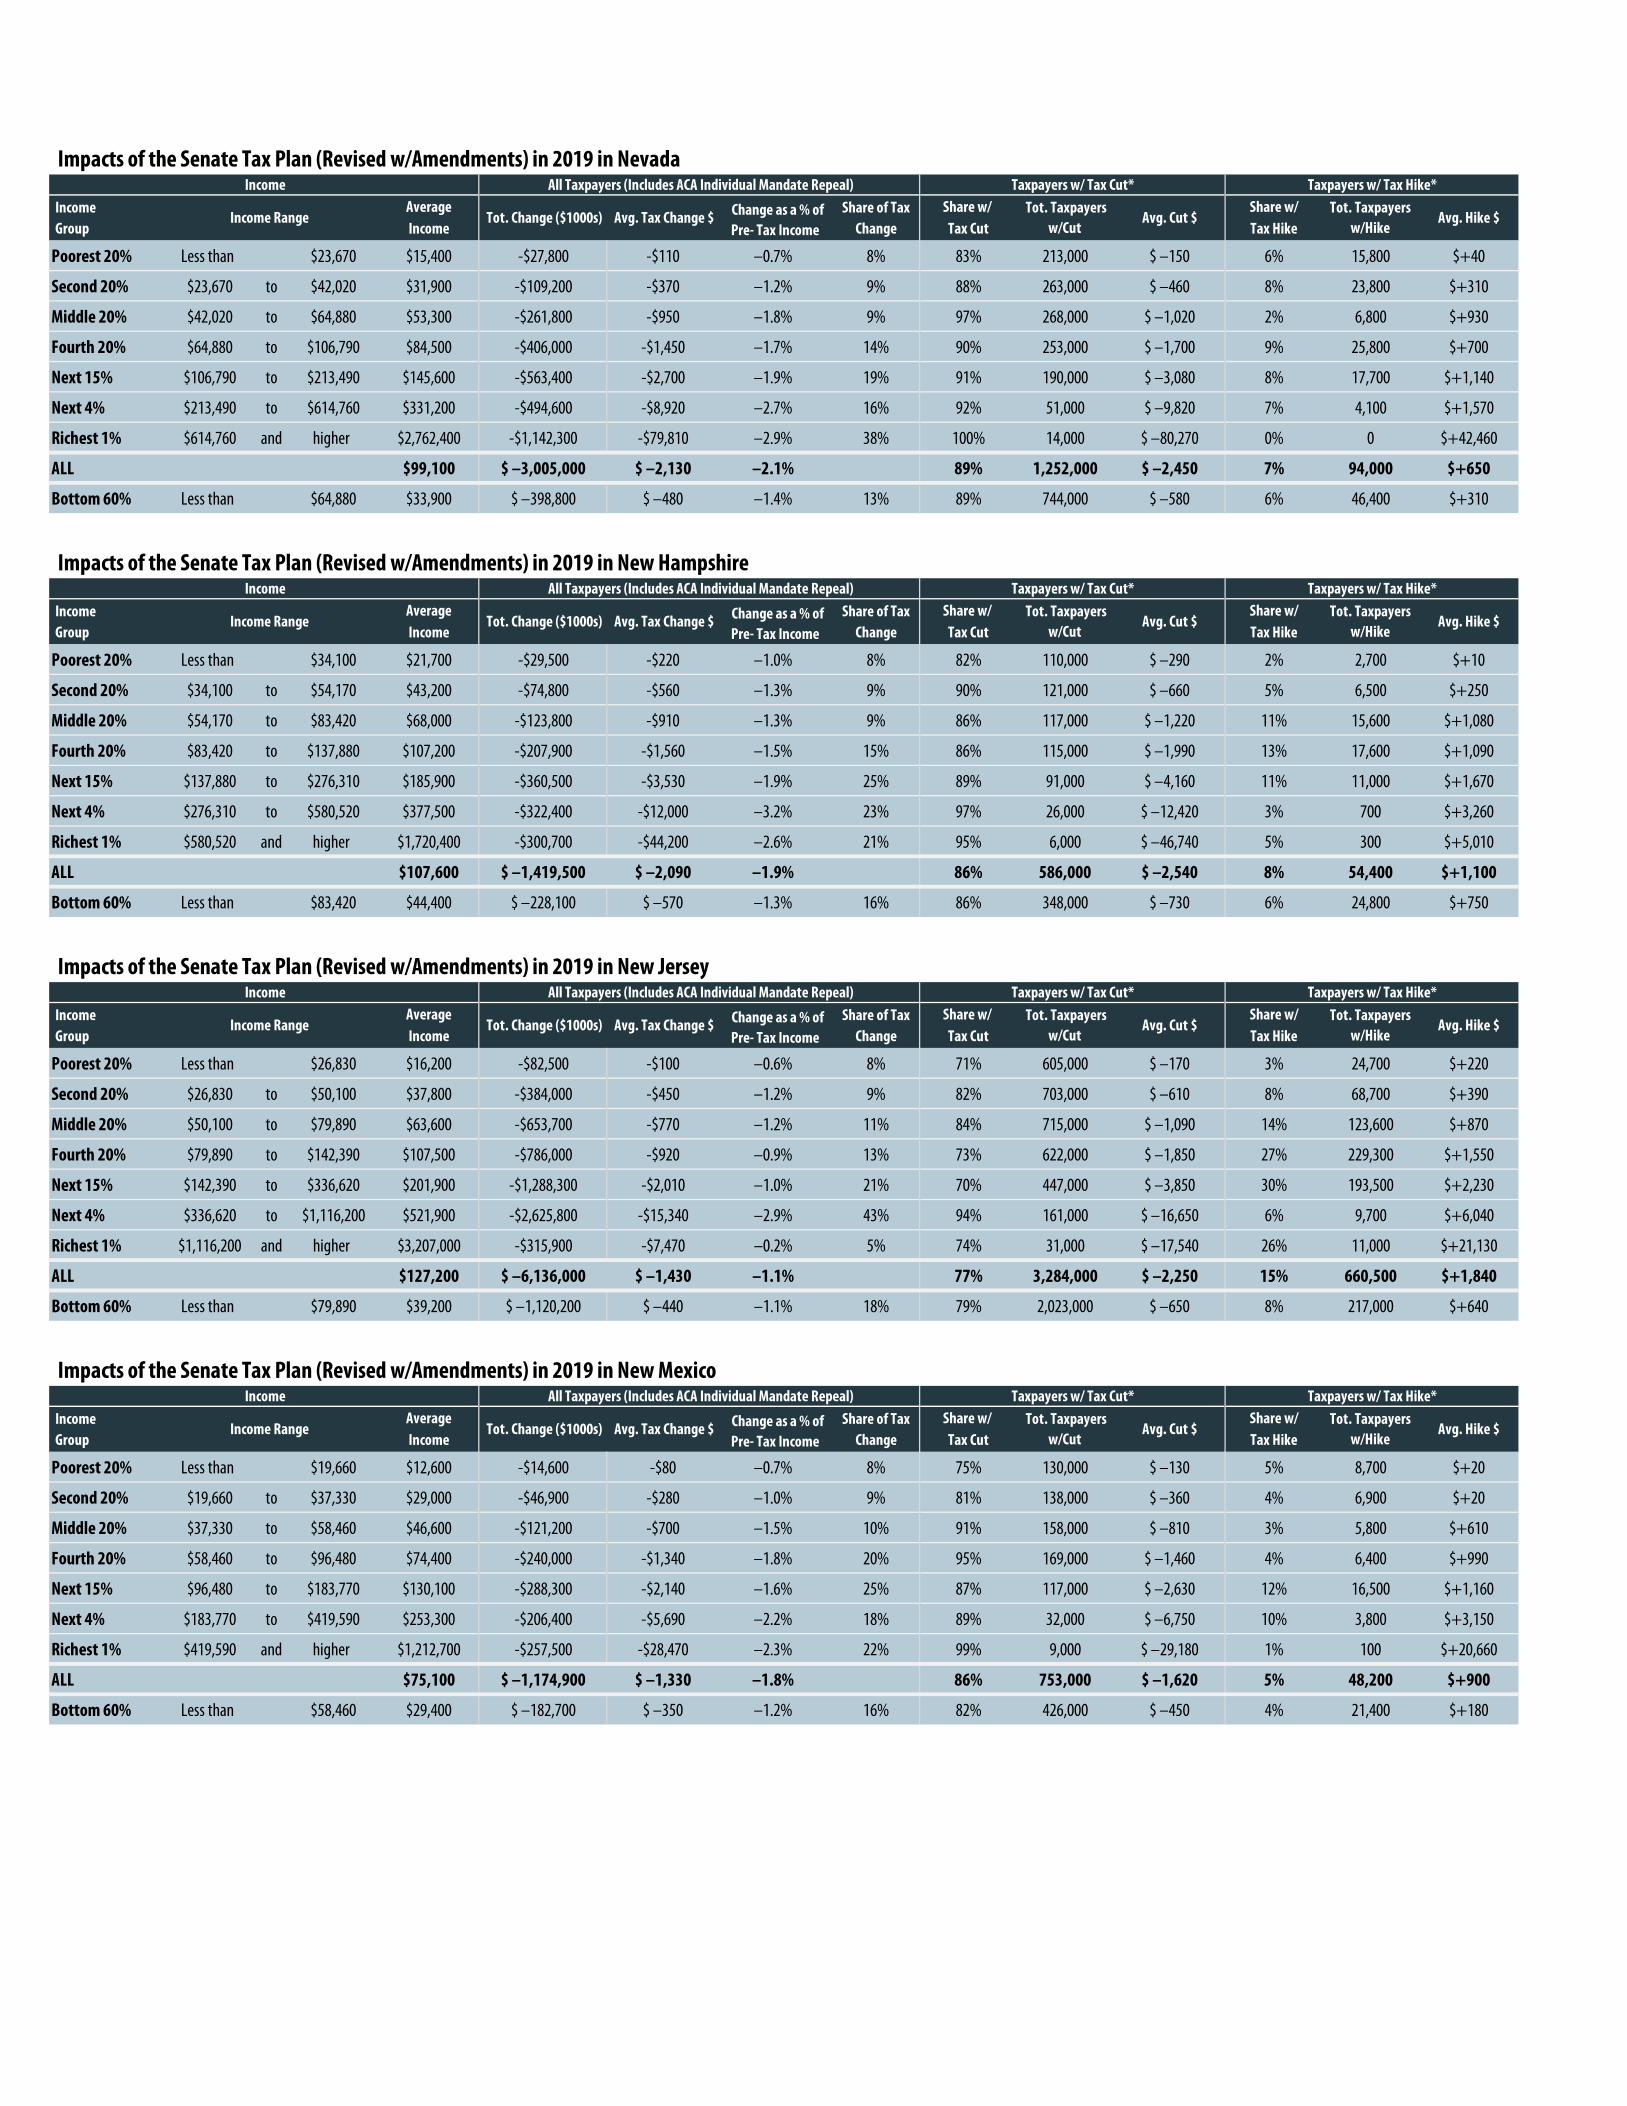
Impacts of the Senate Tax Plan (Revised w/Amendments) in 2019 in Nevada
Income Average Share of Tax Share w/ Share w/Group Income Change Tax Cut Tax Hike
Poorest 20% Less than $23,670 $15,400 -$27,800 -$110 –0.7% 8% 83% 213,000 $ –150 6% 15,800 $+40
Second 20% $23,670 to $42,020 $31,900 -$109,200 -$370 –1.2% 9% 88% 263,000 $ –460 8% 23,800 $+310
Middle 20% $42,020 to $64,880 $53,300 -$261,800 -$950 –1.8% 9% 97% 268,000 $ –1,020 2% 6,800 $+930
Fourth 20% $64,880 to $106,790 $84,500 -$406,000 -$1,450 –1.7% 14% 90% 253,000 $ –1,700 9% 25,800 $+700
Next 15% $106,790 to $213,490 $145,600 -$563,400 -$2,700 –1.9% 19% 91% 190,000 $ –3,080 8% 17,700 $+1,140
Next 4% $213,490 to $614,760 $331,200 -$494,600 -$8,920 –2.7% 16% 92% 51,000 $ –9,820 7% 4,100 $+1,570
Richest 1% $614,760 and higher $2,762,400 -$1,142,300 -$79,810 –2.9% 38% 100% 14,000 $ –80,270 0% 0 $+42,460
ALL $99,100 $ –3,005,000 $ –2,130 –2.1% 89% 1,252,000 $ –2,450 7% 94,000 $+650
Bottom 60% Less than $64,880 $33,900 $ –398,800 $ –480 –1.4% 13% 89% 744,000 $ –580 6% 46,400 $+310
Impacts of the Senate Tax Plan (Revised w/Amendments) in 2019 in New Hampshire
Income Average Share of Tax Share w/ Share w/Group Income Change Tax Cut Tax Hike
Poorest 20% Less than $34,100 $21,700 -$29,500 -$220 –1.0% 8% 82% 110,000 $ –290 2% 2,700 $+10
Second 20% $34,100 to $54,170 $43,200 -$74,800 -$560 –1.3% 9% 90% 121,000 $ –660 5% 6,500 $+250
Middle 20% $54,170 to $83,420 $68,000 -$123,800 -$910 –1.3% 9% 86% 117,000 $ –1,220 11% 15,600 $+1,080
Fourth 20% $83,420 to $137,880 $107,200 -$207,900 -$1,560 –1.5% 15% 86% 115,000 $ –1,990 13% 17,600 $+1,090
Next 15% $137,880 to $276,310 $185,900 -$360,500 -$3,530 –1.9% 25% 89% 91,000 $ –4,160 11% 11,000 $+1,670
Next 4% $276,310 to $580,520 $377,500 -$322,400 -$12,000 –3.2% 23% 97% 26,000 $ –12,420 3% 700 $+3,260
Richest 1% $580,520 and higher $1,720,400 -$300,700 -$44,200 –2.6% 21% 95% 6,000 $ –46,740 5% 300 $+5,010
ALL $107,600 $ –1,419,500 $ –2,090 –1.9% 86% 586,000 $ –2,540 8% 54,400 $+1,100
Bottom 60% Less than $83,420 $44,400 $ –228,100 $ –570 –1.3% 16% 86% 348,000 $ –730 6% 24,800 $+750
Impacts of the Senate Tax Plan (Revised w/Amendments) in 2019 in New Jersey
Income Average Share of Tax Share w/ Share w/Group Income Change Tax Cut Tax Hike
Poorest 20% Less than $26,830 $16,200 -$82,500 -$100 –0.6% 8% 71% 605,000 $ –170 3% 24,700 $+220
Second 20% $26,830 to $50,100 $37,800 -$384,000 -$450 –1.2% 9% 82% 703,000 $ –610 8% 68,700 $+390
Middle 20% $50,100 to $79,890 $63,600 -$653,700 -$770 –1.2% 11% 84% 715,000 $ –1,090 14% 123,600 $+870
Fourth 20% $79,890 to $142,390 $107,500 -$786,000 -$920 –0.9% 13% 73% 622,000 $ –1,850 27% 229,300 $+1,550
Next 15% $142,390 to $336,620 $201,900 -$1,288,300 -$2,010 –1.0% 21% 70% 447,000 $ –3,850 30% 193,500 $+2,230
Next 4% $336,620 to $1,116,200 $521,900 -$2,625,800 -$15,340 –2.9% 43% 94% 161,000 $ –16,650 6% 9,700 $+6,040
Richest 1% $1,116,200 and higher $3,207,000 -$315,900 -$7,470 –0.2% 5% 74% 31,000 $ –17,540 26% 11,000 $+21,130
ALL $127,200 $ –6,136,000 $ –1,430 –1.1% 77% 3,284,000 $ –2,250 15% 660,500 $+1,840
Bottom 60% Less than $79,890 $39,200 $ –1,120,200 $ –440 –1.1% 18% 79% 2,023,000 $ –650 8% 217,000 $+640
Impacts of the Senate Tax Plan (Revised w/Amendments) in 2019 in New Mexico
Income Average Share of Tax Share w/ Share w/Group Income Change Tax Cut Tax Hike
Poorest 20% Less than $19,660 $12,600 -$14,600 -$80 –0.7% 8% 75% 130,000 $ –130 5% 8,700 $+20
Second 20% $19,660 to $37,330 $29,000 -$46,900 -$280 –1.0% 9% 81% 138,000 $ –360 4% 6,900 $+20
Middle 20% $37,330 to $58,460 $46,600 -$121,200 -$700 –1.5% 10% 91% 158,000 $ –810 3% 5,800 $+610
Fourth 20% $58,460 to $96,480 $74,400 -$240,000 -$1,340 –1.8% 20% 95% 169,000 $ –1,460 4% 6,400 $+990
Next 15% $96,480 to $183,770 $130,100 -$288,300 -$2,140 –1.6% 25% 87% 117,000 $ –2,630 12% 16,500 $+1,160
Next 4% $183,770 to $419,590 $253,300 -$206,400 -$5,690 –2.2% 18% 89% 32,000 $ –6,750 10% 3,800 $+3,150
Richest 1% $419,590 and higher $1,212,700 -$257,500 -$28,470 –2.3% 22% 99% 9,000 $ –29,180 1% 100 $+20,660
ALL $75,100 $ –1,174,900 $ –1,330 –1.8% 86% 753,000 $ –1,620 5% 48,200 $+900
Bottom 60% Less than $58,460 $29,400 $ –182,700 $ –350 –1.2% 16% 82% 426,000 $ –450 4% 21,400 $+180
Income Range Tot. Change ($1000s) Avg. Tax Change $ Change as a % of Pre- Tax Income
Avg. Cut $ Avg. Hike $ Tot. Taxpayers
w/Cut Tot. Taxpayers
w/Hike
Income All Taxpayers (Includes ACA Individual Mandate Repeal) Taxpayers w/ Tax Cut* Taxpayers w/ Tax Hike*
Income All Taxpayers (Includes ACA Individual Mandate Repeal) Taxpayers w/ Tax Cut* Taxpayers w/ Tax Hike*
Income Range Tot. Change ($1000s) Avg. Tax Change $ Change as a % of Pre- Tax Income
Avg. Cut $
Income Range Tot. Change ($1000s) Avg. Tax Change $ Change as a % of Pre- Tax Income
Avg. Cut $ Avg. Hike $ Tot. Taxpayers
w/Cut Tot. Taxpayers
w/Hike
Avg. Hike $
Income All Taxpayers (Includes ACA Individual Mandate Repeal) Taxpayers w/ Tax Cut* Taxpayers w/ Tax Hike*
Tot. Taxpayers w/Cut
Tot. Taxpayers w/Hike
Income All Taxpayers (Includes ACA Individual Mandate Repeal) Taxpayers w/ Tax Cut* Taxpayers w/ Tax Hike*
Income Range Tot. Change ($1000s) Avg. Tax Change $ Change as a % of Pre- Tax Income
Avg. Cut $ Avg. Hike $ Tot. Taxpayers
w/Cut Tot. Taxpayers
w/Hike
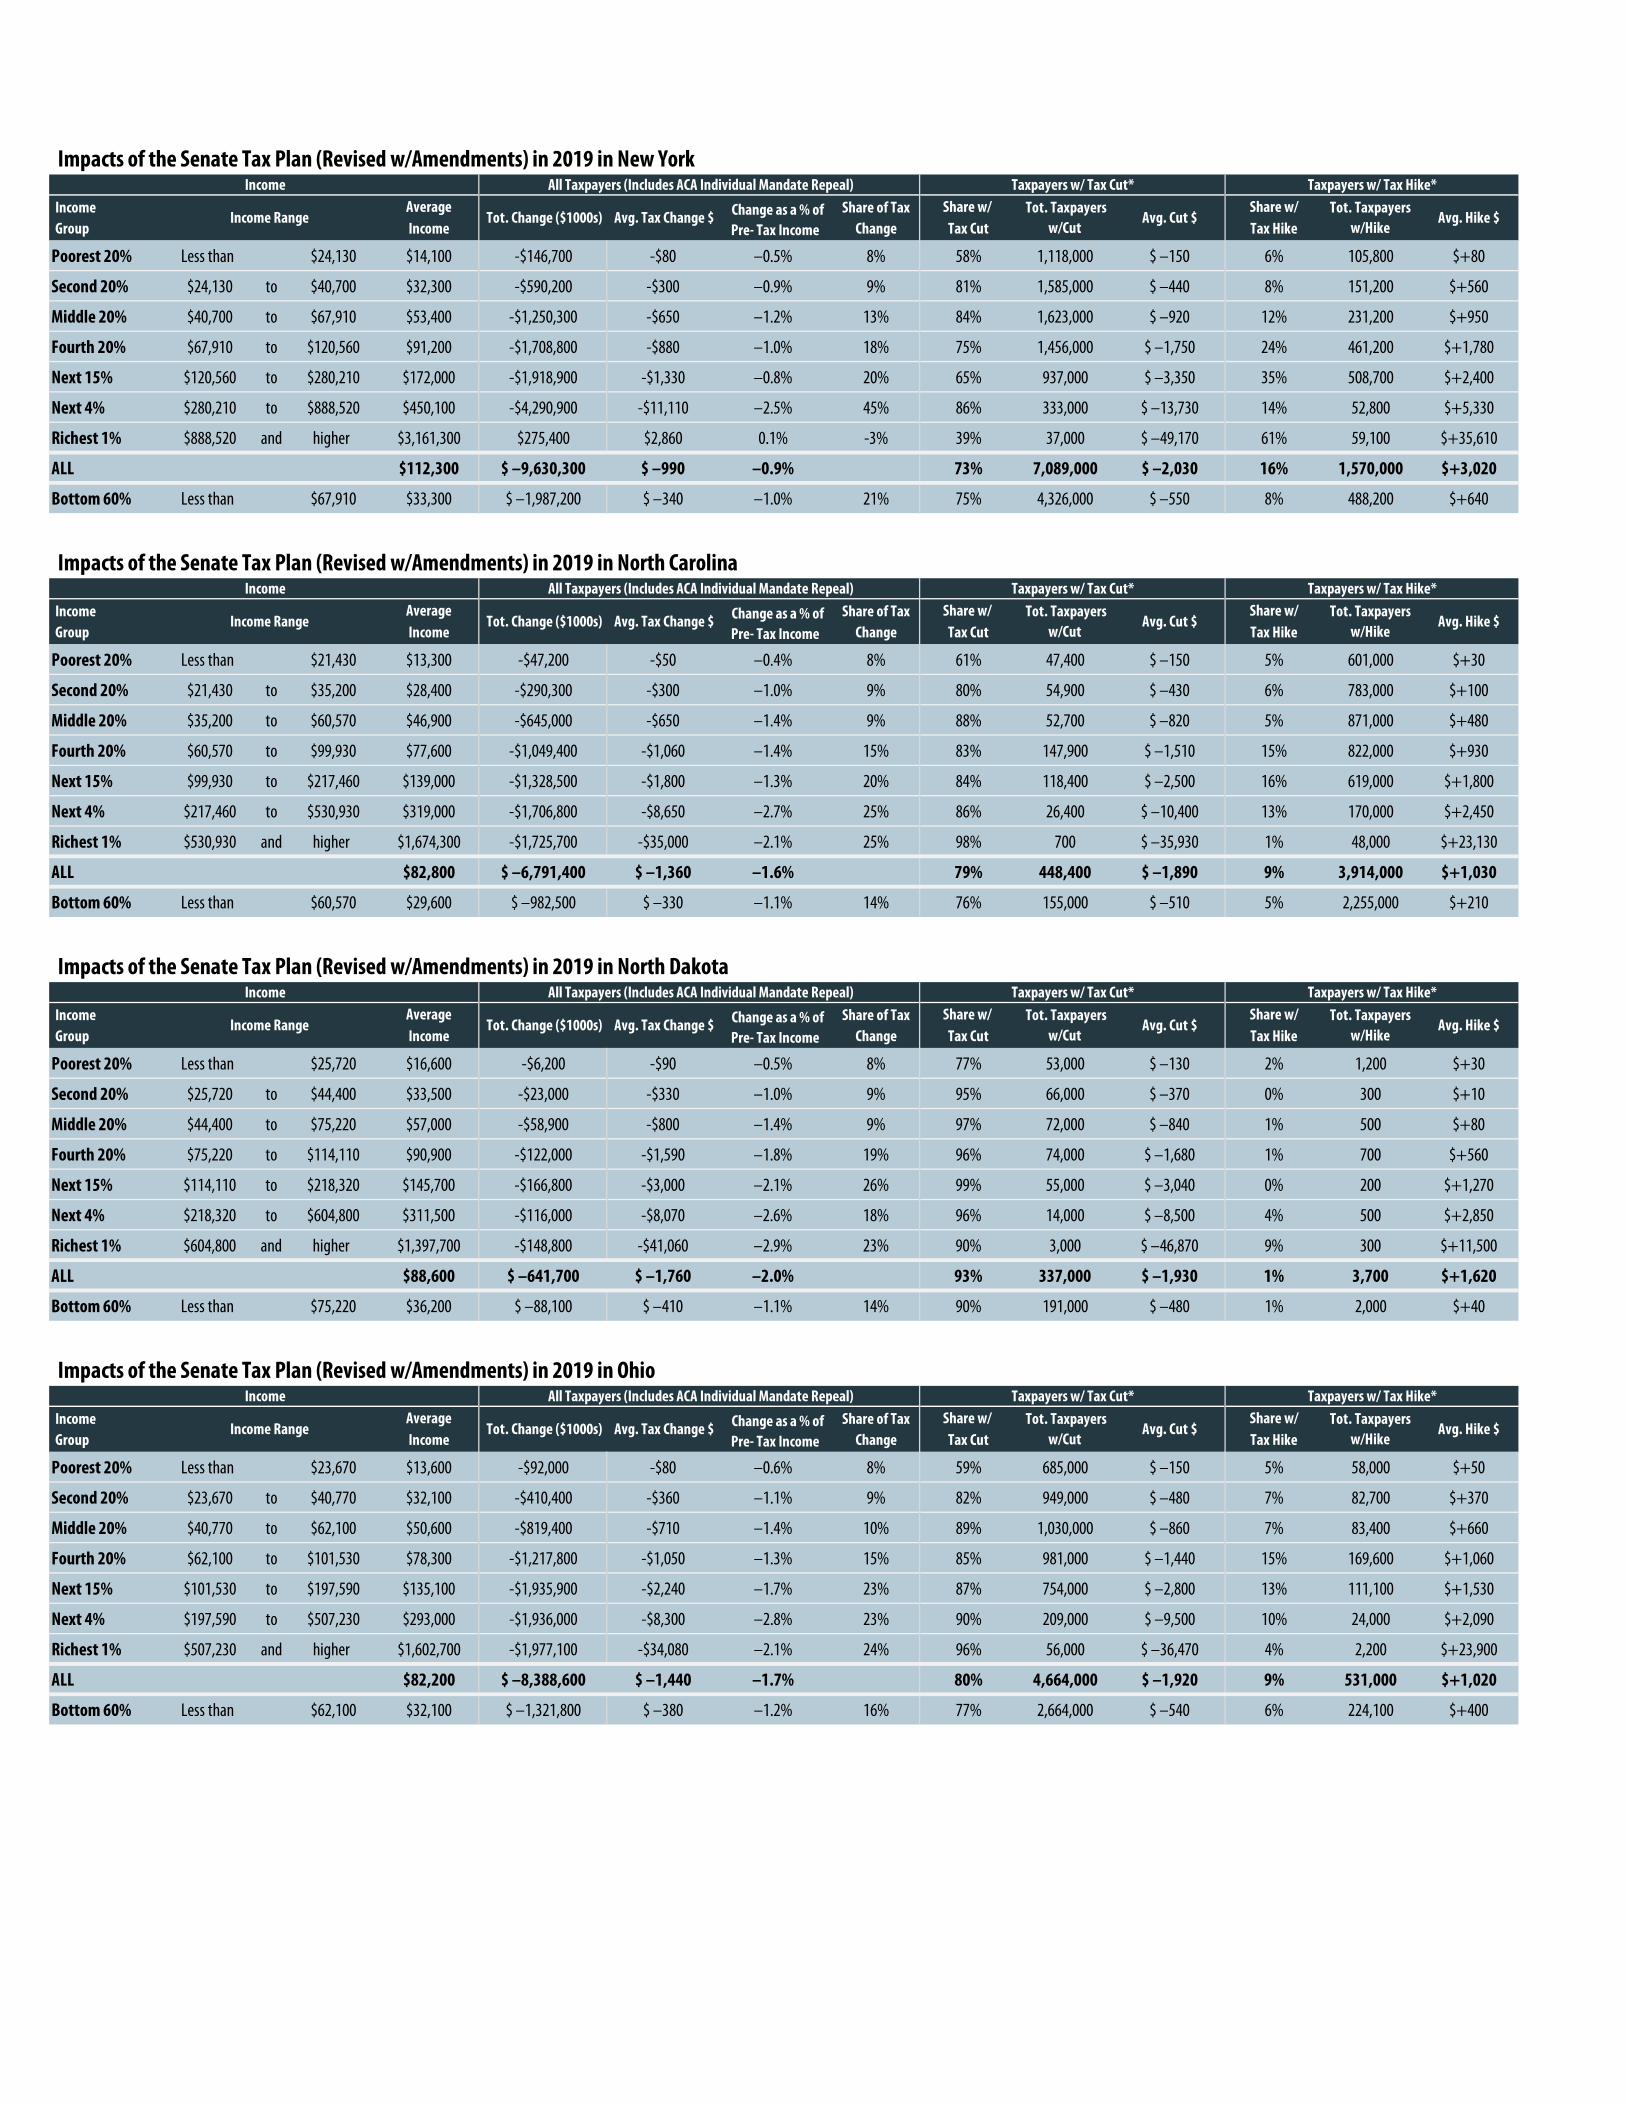
Impacts of the Senate Tax Plan (Revised w/Amendments) in 2019 in New York
Income Average Share of Tax Share w/ Share w/Group Income Change Tax Cut Tax Hike
Poorest 20% Less than $24,130 $14,100 -$146,700 -$80 –0.5% 8% 58% 1,118,000 $ –150 6% 105,800 $+80
Second 20% $24,130 to $40,700 $32,300 -$590,200 -$300 –0.9% 9% 81% 1,585,000 $ –440 8% 151,200 $+560
Middle 20% $40,700 to $67,910 $53,400 -$1,250,300 -$650 –1.2% 13% 84% 1,623,000 $ –920 12% 231,200 $+950
Fourth 20% $67,910 to $120,560 $91,200 -$1,708,800 -$880 –1.0% 18% 75% 1,456,000 $ –1,750 24% 461,200 $+1,780
Next 15% $120,560 to $280,210 $172,000 -$1,918,900 -$1,330 –0.8% 20% 65% 937,000 $ –3,350 35% 508,700 $+2,400
Next 4% $280,210 to $888,520 $450,100 -$4,290,900 -$11,110 –2.5% 45% 86% 333,000 $ –13,730 14% 52,800 $+5,330
Richest 1% $888,520 and higher $3,161,300 $275,400 $2,860 0.1% -3% 39% 37,000 $ –49,170 61% 59,100 $+35,610
ALL $112,300 $ –9,630,300 $ –990 –0.9% 73% 7,089,000 $ –2,030 16% 1,570,000 $+3,020
Bottom 60% Less than $67,910 $33,300 $ –1,987,200 $ –340 –1.0% 21% 75% 4,326,000 $ –550 8% 488,200 $+640
Impacts of the Senate Tax Plan (Revised w/Amendments) in 2019 in North Carolina
Income Average Share of Tax Share w/ Share w/Group Income Change Tax Cut Tax Hike
Poorest 20% Less than $21,430 $13,300 -$47,200 -$50 –0.4% 8% 61% 47,400 $ –150 5% 601,000 $+30
Second 20% $21,430 to $35,200 $28,400 -$290,300 -$300 –1.0% 9% 80% 54,900 $ –430 6% 783,000 $+100
Middle 20% $35,200 to $60,570 $46,900 -$645,000 -$650 –1.4% 9% 88% 52,700 $ –820 5% 871,000 $+480
Fourth 20% $60,570 to $99,930 $77,600 -$1,049,400 -$1,060 –1.4% 15% 83% 147,900 $ –1,510 15% 822,000 $+930
Next 15% $99,930 to $217,460 $139,000 -$1,328,500 -$1,800 –1.3% 20% 84% 118,400 $ –2,500 16% 619,000 $+1,800
Next 4% $217,460 to $530,930 $319,000 -$1,706,800 -$8,650 –2.7% 25% 86% 26,400 $ –10,400 13% 170,000 $+2,450
Richest 1% $530,930 and higher $1,674,300 -$1,725,700 -$35,000 –2.1% 25% 98% 700 $ –35,930 1% 48,000 $+23,130
ALL $82,800 $ –6,791,400 $ –1,360 –1.6% 79% 448,400 $ –1,890 9% 3,914,000 $+1,030
Bottom 60% Less than $60,570 $29,600 $ –982,500 $ –330 –1.1% 14% 76% 155,000 $ –510 5% 2,255,000 $+210
Impacts of the Senate Tax Plan (Revised w/Amendments) in 2019 in North Dakota
Income Average Share of Tax Share w/ Share w/Group Income Change Tax Cut Tax Hike
Poorest 20% Less than $25,720 $16,600 -$6,200 -$90 –0.5% 8% 77% 53,000 $ –130 2% 1,200 $+30
Second 20% $25,720 to $44,400 $33,500 -$23,000 -$330 –1.0% 9% 95% 66,000 $ –370 0% 300 $+10
Middle 20% $44,400 to $75,220 $57,000 -$58,900 -$800 –1.4% 9% 97% 72,000 $ –840 1% 500 $+80
Fourth 20% $75,220 to $114,110 $90,900 -$122,000 -$1,590 –1.8% 19% 96% 74,000 $ –1,680 1% 700 $+560
Next 15% $114,110 to $218,320 $145,700 -$166,800 -$3,000 –2.1% 26% 99% 55,000 $ –3,040 0% 200 $+1,270
Next 4% $218,320 to $604,800 $311,500 -$116,000 -$8,070 –2.6% 18% 96% 14,000 $ –8,500 4% 500 $+2,850
Richest 1% $604,800 and higher $1,397,700 -$148,800 -$41,060 –2.9% 23% 90% 3,000 $ –46,870 9% 300 $+11,500
ALL $88,600 $ –641,700 $ –1,760 –2.0% 93% 337,000 $ –1,930 1% 3,700 $+1,620
Bottom 60% Less than $75,220 $36,200 $ –88,100 $ –410 –1.1% 14% 90% 191,000 $ –480 1% 2,000 $+40
Impacts of the Senate Tax Plan (Revised w/Amendments) in 2019 in Ohio
Income Average Share of Tax Share w/ Share w/Group Income Change Tax Cut Tax Hike
Poorest 20% Less than $23,670 $13,600 -$92,000 -$80 –0.6% 8% 59% 685,000 $ –150 5% 58,000 $+50
Second 20% $23,670 to $40,770 $32,100 -$410,400 -$360 –1.1% 9% 82% 949,000 $ –480 7% 82,700 $+370
Middle 20% $40,770 to $62,100 $50,600 -$819,400 -$710 –1.4% 10% 89% 1,030,000 $ –860 7% 83,400 $+660
Fourth 20% $62,100 to $101,530 $78,300 -$1,217,800 -$1,050 –1.3% 15% 85% 981,000 $ –1,440 15% 169,600 $+1,060
Next 15% $101,530 to $197,590 $135,100 -$1,935,900 -$2,240 –1.7% 23% 87% 754,000 $ –2,800 13% 111,100 $+1,530
Next 4% $197,590 to $507,230 $293,000 -$1,936,000 -$8,300 –2.8% 23% 90% 209,000 $ –9,500 10% 24,000 $+2,090
Richest 1% $507,230 and higher $1,602,700 -$1,977,100 -$34,080 –2.1% 24% 96% 56,000 $ –36,470 4% 2,200 $+23,900
ALL $82,200 $ –8,388,600 $ –1,440 –1.7% 80% 4,664,000 $ –1,920 9% 531,000 $+1,020
Bottom 60% Less than $62,100 $32,100 $ –1,321,800 $ –380 –1.2% 16% 77% 2,664,000 $ –540 6% 224,100 $+400
Income Range Tot. Change ($1000s) Avg. Tax Change $ Change as a % of Pre- Tax Income
Avg. Cut $ Avg. Hike $ Tot. Taxpayers
w/Cut Tot. Taxpayers
w/Hike
Income All Taxpayers (Includes ACA Individual Mandate Repeal) Taxpayers w/ Tax Cut* Taxpayers w/ Tax Hike*
Income All Taxpayers (Includes ACA Individual Mandate Repeal) Taxpayers w/ Tax Cut* Taxpayers w/ Tax Hike*
Income Range Tot. Change ($1000s) Avg. Tax Change $ Change as a % of Pre- Tax Income
Avg. Cut $
Income Range Tot. Change ($1000s) Avg. Tax Change $ Change as a % of Pre- Tax Income
Avg. Cut $ Avg. Hike $ Tot. Taxpayers
w/Cut Tot. Taxpayers
w/Hike
Avg. Hike $
Income All Taxpayers (Includes ACA Individual Mandate Repeal) Taxpayers w/ Tax Cut* Taxpayers w/ Tax Hike*
Tot. Taxpayers w/Cut
Tot. Taxpayers w/Hike
Income All Taxpayers (Includes ACA Individual Mandate Repeal) Taxpayers w/ Tax Cut* Taxpayers w/ Tax Hike*
Income Range Tot. Change ($1000s) Avg. Tax Change $ Change as a % of Pre- Tax Income
Avg. Cut $ Avg. Hike $ Tot. Taxpayers
w/Cut Tot. Taxpayers
w/Hike

Impacts of the Senate Tax Plan (Revised w/Amendments) in 2019 in Oklahoma
Income Average Share of Tax Share w/ Share w/Group Income Change Tax Cut Tax Hike
Poorest 20% Less than $19,720 $12,000 -$21,500 -$70 –0.5% 8% 63% 208,000 $ –120 5% 16,100 $+10
Second 20% $19,720 to $33,930 $26,400 -$67,900 -$200 –0.8% 9% 79% 268,000 $ –280 4% 14,600 $+190
Middle 20% $33,930 to $53,650 $42,700 -$183,600 -$540 –1.3% 8% 89% 302,000 $ –650 6% 19,500 $+390
Fourth 20% $53,650 to $86,630 $70,300 -$409,100 -$1,150 –1.6% 18% 93% 332,000 $ –1,290 5% 17,000 $+750
Next 15% $86,630 to $177,400 $119,200 -$544,400 -$2,080 –1.7% 24% 90% 234,000 $ –2,450 9% 23,500 $+1,170
Next 4% $177,400 to $481,900 $262,000 -$423,400 -$5,900 –2.3% 18% 91% 65,000 $ –6,660 9% 6,400 $+1,590
Richest 1% $481,900 and higher $1,213,900 -$652,700 -$38,480 –3.2% 28% 97% 17,000 $ –39,710 2% 300 $+12,810
ALL $70,800 $ –2,302,800 $ –1,330 –1.9% 83% 1,426,000 $ –1,670 6% 97,400 $+660
Bottom 60% Less than $53,650 $27,200 $ –273,000 $ –270 –1.0% 12% 77% 778,000 $ –380 5% 50,200 $+210
Impacts of the Senate Tax Plan (Revised w/Amendments) in 2019 in Oregon
Income Average Share of Tax Share w/ Share w/Group Income Change Tax Cut Tax Hike
Poorest 20% Less than $24,530 $14,700 -$37,000 -$90 –0.6% 8% 67% 281,000 $ –150 3% 13,000 $+30
Second 20% $24,530 to $43,490 $33,100 -$125,200 -$300 –0.9% 9% 82% 345,000 $ –410 7% 29,800 $+350
Middle 20% $43,490 to $69,990 $54,900 -$344,500 -$820 –1.5% 12% 88% 370,000 $ –1,000 8% 33,400 $+570
Fourth 20% $69,990 to $114,800 $89,600 -$472,100 -$1,130 –1.3% 17% 83% 349,000 $ –1,560 16% 67,200 $+990
Next 15% $114,800 to $235,400 $159,100 -$587,200 -$1,870 –1.2% 21% 71% 222,000 $ –3,330 28% 89,500 $+1,700
Next 4% $235,400 to $656,460 $362,700 -$698,600 -$8,300 –2.3% 25% 86% 72,000 $ –10,190 14% 11,500 $+3,410
Richest 1% $656,460 and higher $1,858,200 -$503,500 -$23,490 –1.3% 18% 90% 19,000 $ –30,530 10% 2,100 $+40,360
ALL $95,100 $ –2,767,900 $ –1,310 –1.4% 79% 1,658,000 $ –1,900 12% 246,500 $+1,510
Bottom 60% Less than $69,990 $34,300 $ –506,700 $ –400 –1.2% 18% 79% 996,000 $ –560 6% 76,200 $+390
Impacts of the Senate Tax Plan (Revised w/Amendments) in 2019 in Pennsylvania
Income Average Share of Tax Share w/ Share w/Group Income Change Tax Cut Tax Hike
Poorest 20% Less than $23,900 $14,400 -$100,000 -$80 –0.5% 8% 65% 821,000 $ –150 3% 32,700 $+100
Second 20% $23,900 to $43,500 $33,700 -$376,600 -$300 –0.9% 9% 83% 1,053,000 $ –400 4% 51,500 $+450
Middle 20% $43,500 to $67,910 $54,200 -$878,100 -$690 –1.3% 8% 88% 1,117,000 $ –850 9% 112,600 $+410
Fourth 20% $67,910 to $111,490 $85,900 -$1,578,900 -$1,240 –1.4% 15% 89% 1,132,000 $ –1,540 10% 132,600 $+1,020
Next 15% $111,490 to $231,900 $153,100 -$2,131,700 -$2,240 –1.5% 20% 82% 781,000 $ –3,090 18% 169,600 $+1,650
Next 4% $231,900 to $575,640 $346,700 -$2,659,400 -$10,450 –3.0% 25% 90% 229,000 $ –11,800 10% 24,200 $+1,910
Richest 1% $575,640 and higher $1,865,300 -$2,709,100 -$42,210 –2.3% 26% 94% 60,000 $ –45,230 6% 3,500 $+6,900
ALL $92,300 $ –10,433,200 $ –1,620 –1.8% 81% 5,193,000 $ –2,120 8% 526,700 $+1,060
Bottom 60% Less than $67,910 $34,100 $ –1,354,700 $ –360 –1.0% 13% 79% 2,991,000 $ –500 5% 196,800 $+370
Impacts of the Senate Tax Plan (Revised w/Amendments) in 2019 in Rhode Island
Income Average Share of Tax Share w/ Share w/Group Income Change Tax Cut Tax Hike
Poorest 20% Less than $23,020 $12,800 -$6,300 -$60 –0.5% 8% 55% 57,000 $ –140 6% 6,200 $+20
Second 20% $23,020 to $40,070 $31,400 -$42,300 -$380 –1.2% 9% 85% 94,000 $ –480 2% 2,100 $+230
Middle 20% $40,070 to $69,480 $53,900 -$65,600 -$620 –1.2% 9% 85% 90,000 $ –860 11% 12,100 $+790
Fourth 20% $69,480 to $119,940 $89,700 -$106,800 -$1,000 –1.1% 15% 83% 89,000 $ –1,550 16% 17,700 $+1,650
Next 15% $119,940 to $222,840 $158,300 -$165,500 -$2,020 –1.3% 23% 80% 66,000 $ –2,840 20% 16,100 $+1,260
Next 4% $222,840 to $530,470 $321,200 -$158,000 -$7,360 –2.3% 22% 85% 18,000 $ –9,130 15% 3,200 $+2,620
Richest 1% $530,470 and higher $1,691,800 -$168,400 -$31,110 –1.8% 24% 97% 5,000 $ –32,120 2% 100 $+6,400
ALL $91,100 $ –713,000 $ –1,320 –1.5% 78% 419,000 $ –1,880 11% 57,500 $+1,200
Bottom 60% Less than $69,480 $32,800 $ –114,200 $ –360 –1.1% 16% 75% 241,000 $ –540 6% 20,400 $+500
Income Range Tot. Change ($1000s) Avg. Tax Change $ Change as a % of Pre- Tax Income
Avg. Cut $ Avg. Hike $ Tot. Taxpayers
w/Cut Tot. Taxpayers
w/Hike
Income All Taxpayers (Includes ACA Individual Mandate Repeal) Taxpayers w/ Tax Cut* Taxpayers w/ Tax Hike*
Income All Taxpayers (Includes ACA Individual Mandate Repeal) Taxpayers w/ Tax Cut* Taxpayers w/ Tax Hike*
Income Range Tot. Change ($1000s) Avg. Tax Change $ Change as a % of Pre- Tax Income
Avg. Cut $
Income Range Tot. Change ($1000s) Avg. Tax Change $ Change as a % of Pre- Tax Income
Avg. Cut $ Avg. Hike $ Tot. Taxpayers
w/Cut Tot. Taxpayers
w/Hike
Avg. Hike $
Income All Taxpayers (Includes ACA Individual Mandate Repeal) Taxpayers w/ Tax Cut* Taxpayers w/ Tax Hike*
Tot. Taxpayers w/Cut
Tot. Taxpayers w/Hike
Income All Taxpayers (Includes ACA Individual Mandate Repeal) Taxpayers w/ Tax Cut* Taxpayers w/ Tax Hike*
Income Range Tot. Change ($1000s) Avg. Tax Change $ Change as a % of Pre- Tax Income
Avg. Cut $ Avg. Hike $ Tot. Taxpayers
w/Cut Tot. Taxpayers
w/Hike
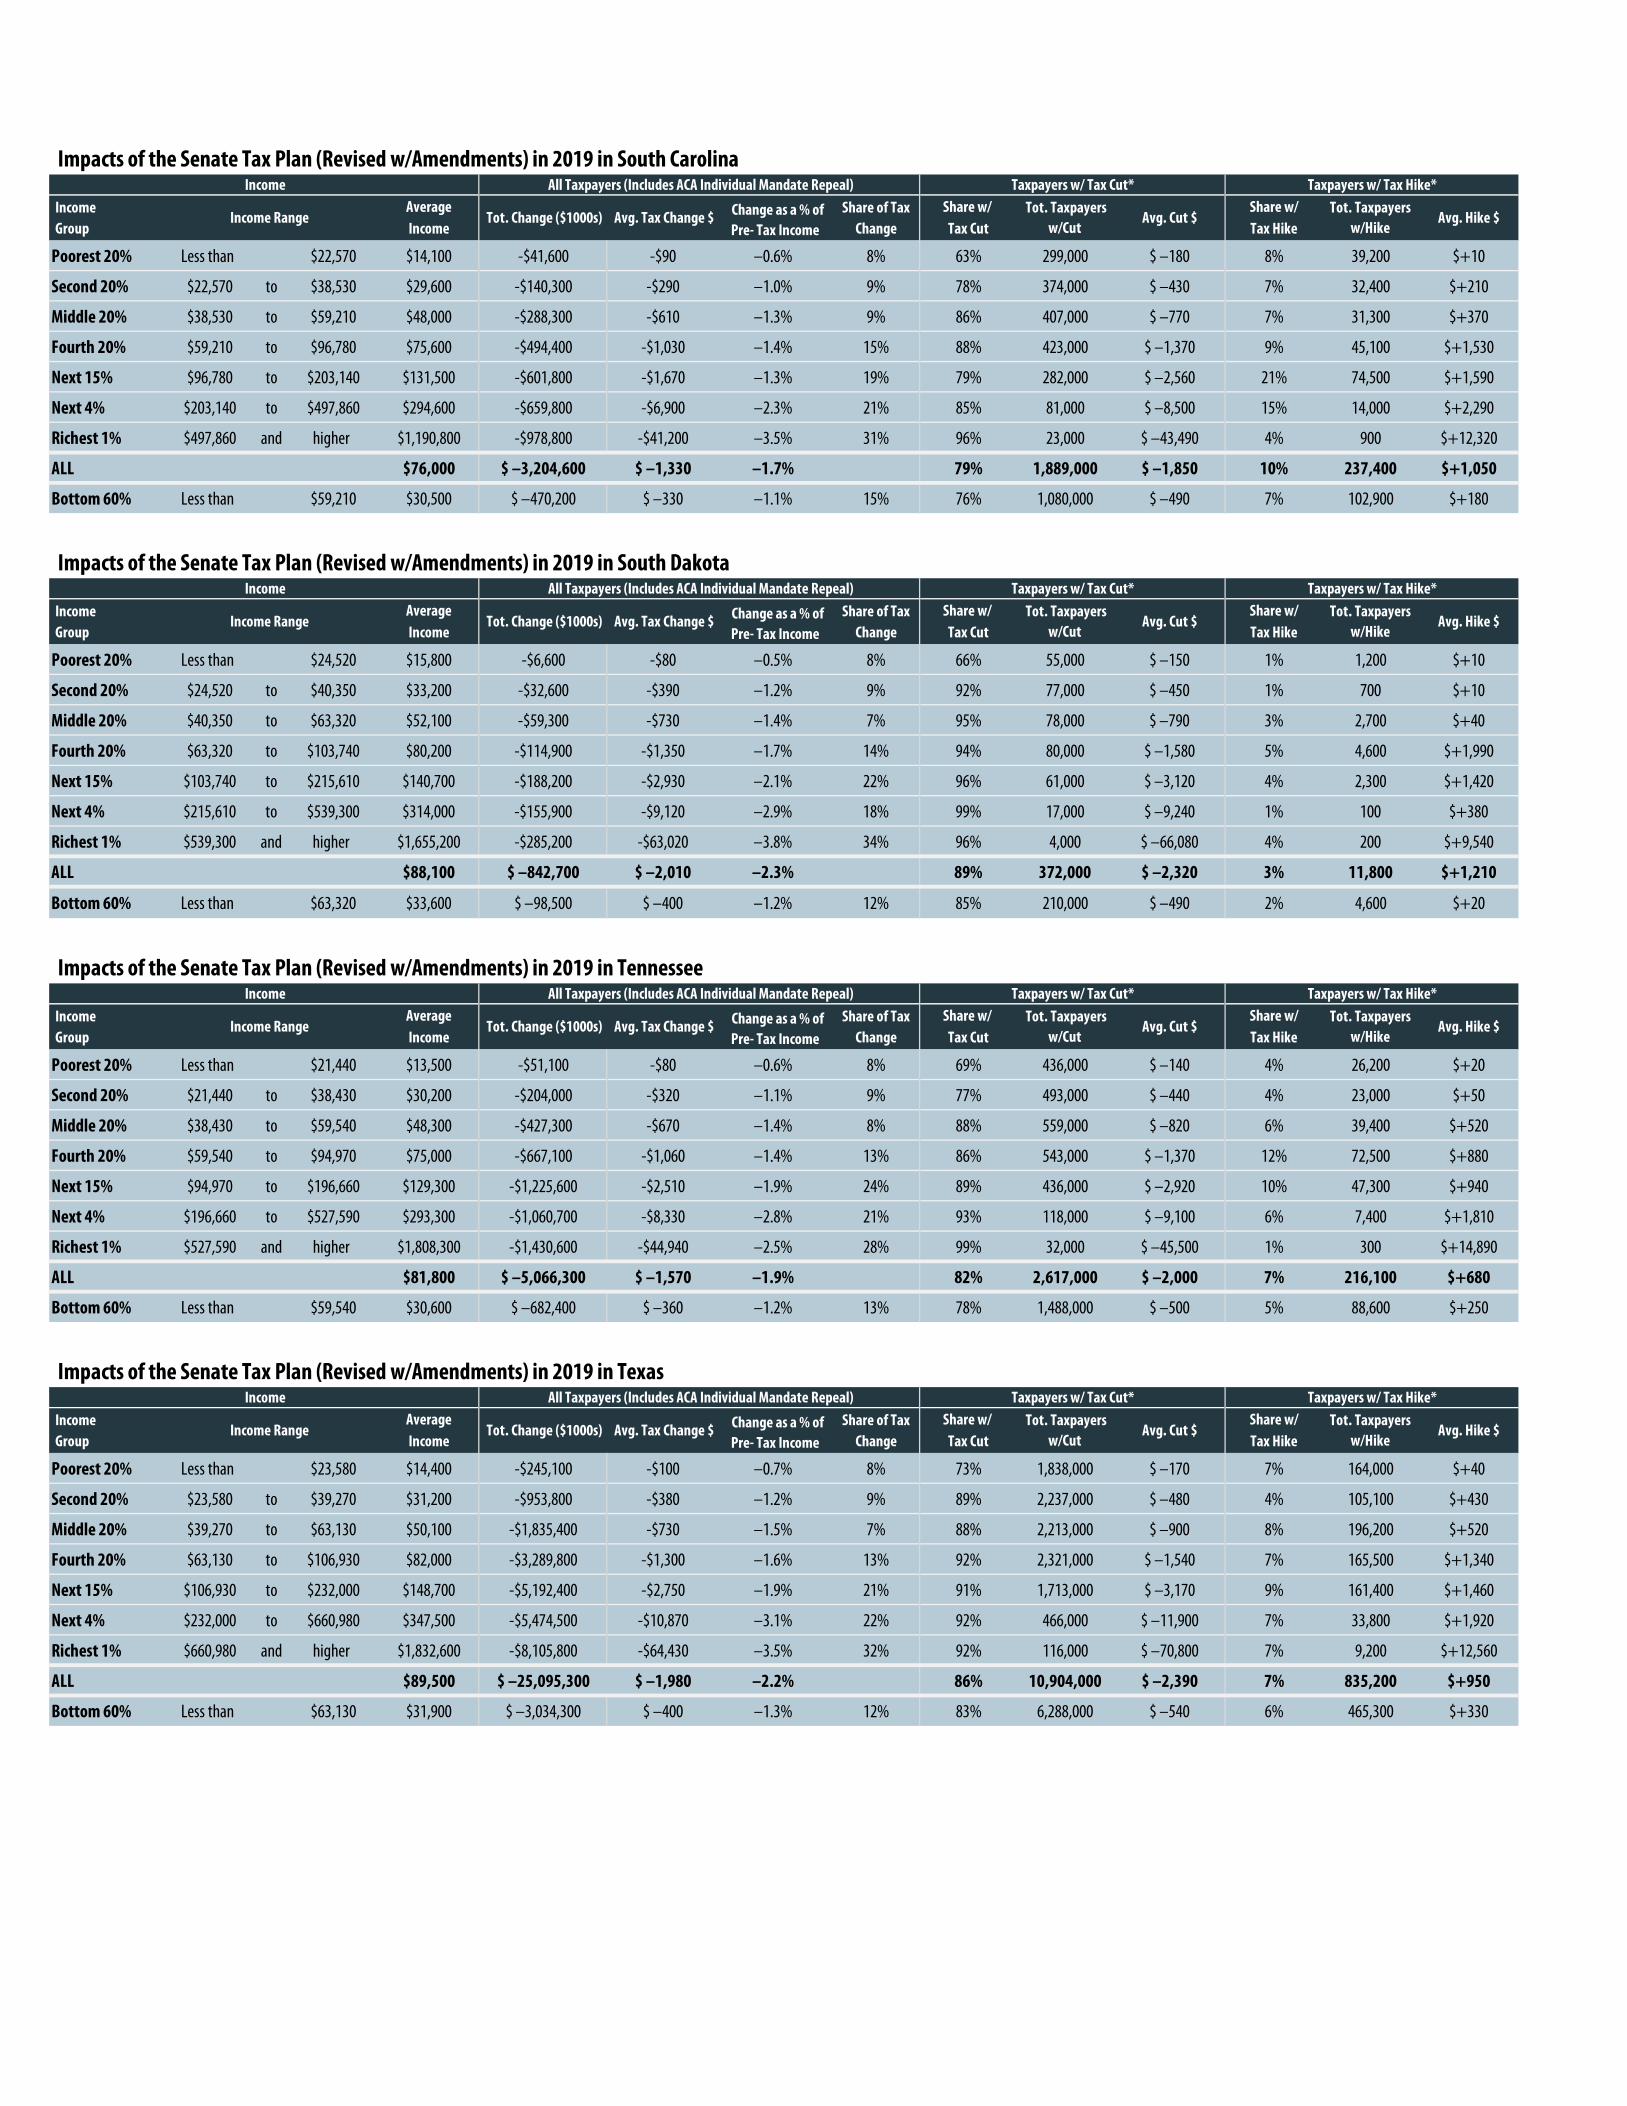
Impacts of the Senate Tax Plan (Revised w/Amendments) in 2019 in South Carolina
Income Average Share of Tax Share w/ Share w/Group Income Change Tax Cut Tax Hike
Poorest 20% Less than $22,570 $14,100 -$41,600 -$90 –0.6% 8% 63% 299,000 $ –180 8% 39,200 $+10
Second 20% $22,570 to $38,530 $29,600 -$140,300 -$290 –1.0% 9% 78% 374,000 $ –430 7% 32,400 $+210
Middle 20% $38,530 to $59,210 $48,000 -$288,300 -$610 –1.3% 9% 86% 407,000 $ –770 7% 31,300 $+370
Fourth 20% $59,210 to $96,780 $75,600 -$494,400 -$1,030 –1.4% 15% 88% 423,000 $ –1,370 9% 45,100 $+1,530
Next 15% $96,780 to $203,140 $131,500 -$601,800 -$1,670 –1.3% 19% 79% 282,000 $ –2,560 21% 74,500 $+1,590
Next 4% $203,140 to $497,860 $294,600 -$659,800 -$6,900 –2.3% 21% 85% 81,000 $ –8,500 15% 14,000 $+2,290
Richest 1% $497,860 and higher $1,190,800 -$978,800 -$41,200 –3.5% 31% 96% 23,000 $ –43,490 4% 900 $+12,320
ALL $76,000 $ –3,204,600 $ –1,330 –1.7% 79% 1,889,000 $ –1,850 10% 237,400 $+1,050
Bottom 60% Less than $59,210 $30,500 $ –470,200 $ –330 –1.1% 15% 76% 1,080,000 $ –490 7% 102,900 $+180
Impacts of the Senate Tax Plan (Revised w/Amendments) in 2019 in South Dakota
Income Average Share of Tax Share w/ Share w/Group Income Change Tax Cut Tax Hike
Poorest 20% Less than $24,520 $15,800 -$6,600 -$80 –0.5% 8% 66% 55,000 $ –150 1% 1,200 $+10
Second 20% $24,520 to $40,350 $33,200 -$32,600 -$390 –1.2% 9% 92% 77,000 $ –450 1% 700 $+10
Middle 20% $40,350 to $63,320 $52,100 -$59,300 -$730 –1.4% 7% 95% 78,000 $ –790 3% 2,700 $+40
Fourth 20% $63,320 to $103,740 $80,200 -$114,900 -$1,350 –1.7% 14% 94% 80,000 $ –1,580 5% 4,600 $+1,990
Next 15% $103,740 to $215,610 $140,700 -$188,200 -$2,930 –2.1% 22% 96% 61,000 $ –3,120 4% 2,300 $+1,420
Next 4% $215,610 to $539,300 $314,000 -$155,900 -$9,120 –2.9% 18% 99% 17,000 $ –9,240 1% 100 $+380
Richest 1% $539,300 and higher $1,655,200 -$285,200 -$63,020 –3.8% 34% 96% 4,000 $ –66,080 4% 200 $+9,540
ALL $88,100 $ –842,700 $ –2,010 –2.3% 89% 372,000 $ –2,320 3% 11,800 $+1,210
Bottom 60% Less than $63,320 $33,600 $ –98,500 $ –400 –1.2% 12% 85% 210,000 $ –490 2% 4,600 $+20
Impacts of the Senate Tax Plan (Revised w/Amendments) in 2019 in Tennessee
Income Average Share of Tax Share w/ Share w/Group Income Change Tax Cut Tax Hike
Poorest 20% Less than $21,440 $13,500 -$51,100 -$80 –0.6% 8% 69% 436,000 $ –140 4% 26,200 $+20
Second 20% $21,440 to $38,430 $30,200 -$204,000 -$320 –1.1% 9% 77% 493,000 $ –440 4% 23,000 $+50
Middle 20% $38,430 to $59,540 $48,300 -$427,300 -$670 –1.4% 8% 88% 559,000 $ –820 6% 39,400 $+520
Fourth 20% $59,540 to $94,970 $75,000 -$667,100 -$1,060 –1.4% 13% 86% 543,000 $ –1,370 12% 72,500 $+880
Next 15% $94,970 to $196,660 $129,300 -$1,225,600 -$2,510 –1.9% 24% 89% 436,000 $ –2,920 10% 47,300 $+940
Next 4% $196,660 to $527,590 $293,300 -$1,060,700 -$8,330 –2.8% 21% 93% 118,000 $ –9,100 6% 7,400 $+1,810
Richest 1% $527,590 and higher $1,808,300 -$1,430,600 -$44,940 –2.5% 28% 99% 32,000 $ –45,500 1% 300 $+14,890
ALL $81,800 $ –5,066,300 $ –1,570 –1.9% 82% 2,617,000 $ –2,000 7% 216,100 $+680
Bottom 60% Less than $59,540 $30,600 $ –682,400 $ –360 –1.2% 13% 78% 1,488,000 $ –500 5% 88,600 $+250
Impacts of the Senate Tax Plan (Revised w/Amendments) in 2019 in Texas
Income Average Share of Tax Share w/ Share w/Group Income Change Tax Cut Tax Hike
Poorest 20% Less than $23,580 $14,400 -$245,100 -$100 –0.7% 8% 73% 1,838,000 $ –170 7% 164,000 $+40
Second 20% $23,580 to $39,270 $31,200 -$953,800 -$380 –1.2% 9% 89% 2,237,000 $ –480 4% 105,100 $+430
Middle 20% $39,270 to $63,130 $50,100 -$1,835,400 -$730 –1.5% 7% 88% 2,213,000 $ –900 8% 196,200 $+520
Fourth 20% $63,130 to $106,930 $82,000 -$3,289,800 -$1,300 –1.6% 13% 92% 2,321,000 $ –1,540 7% 165,500 $+1,340
Next 15% $106,930 to $232,000 $148,700 -$5,192,400 -$2,750 –1.9% 21% 91% 1,713,000 $ –3,170 9% 161,400 $+1,460
Next 4% $232,000 to $660,980 $347,500 -$5,474,500 -$10,870 –3.1% 22% 92% 466,000 $ –11,900 7% 33,800 $+1,920
Richest 1% $660,980 and higher $1,832,600 -$8,105,800 -$64,430 –3.5% 32% 92% 116,000 $ –70,800 7% 9,200 $+12,560
ALL $89,500 $ –25,095,300 $ –1,980 –2.2% 86% 10,904,000 $ –2,390 7% 835,200 $+950
Bottom 60% Less than $63,130 $31,900 $ –3,034,300 $ –400 –1.3% 12% 83% 6,288,000 $ –540 6% 465,300 $+330
Income Range Tot. Change ($1000s) Avg. Tax Change $ Change as a % of Pre- Tax Income
Avg. Cut $ Avg. Hike $ Tot. Taxpayers
w/Cut Tot. Taxpayers
w/Hike
Income All Taxpayers (Includes ACA Individual Mandate Repeal) Taxpayers w/ Tax Cut* Taxpayers w/ Tax Hike*
Income All Taxpayers (Includes ACA Individual Mandate Repeal) Taxpayers w/ Tax Cut* Taxpayers w/ Tax Hike*
Income Range Tot. Change ($1000s) Avg. Tax Change $ Change as a % of Pre- Tax Income
Avg. Cut $
Income Range Tot. Change ($1000s) Avg. Tax Change $ Change as a % of Pre- Tax Income
Avg. Cut $ Avg. Hike $ Tot. Taxpayers
w/Cut Tot. Taxpayers
w/Hike
Avg. Hike $
Income All Taxpayers (Includes ACA Individual Mandate Repeal) Taxpayers w/ Tax Cut* Taxpayers w/ Tax Hike*
Tot. Taxpayers w/Cut
Tot. Taxpayers w/Hike
Income All Taxpayers (Includes ACA Individual Mandate Repeal) Taxpayers w/ Tax Cut* Taxpayers w/ Tax Hike*
Income Range Tot. Change ($1000s) Avg. Tax Change $ Change as a % of Pre- Tax Income
Avg. Cut $ Avg. Hike $ Tot. Taxpayers
w/Cut Tot. Taxpayers
w/Hike

Impacts of the Senate Tax Plan (Revised w/Amendments) in 2019 in Utah
Income Average Share of Tax Share w/ Share w/Group Income Change Tax Cut Tax Hike
Poorest 20% Less than $27,110 $16,200 -$24,400 -$100 –0.6% 8% 79% 202,000 $ –160 3% 7,700 $+280
Second 20% $27,110 to $47,210 $38,000 -$111,400 -$440 –1.1% 9% 89% 228,000 $ –560 7% 17,600 $+510
Middle 20% $47,210 to $76,020 $60,500 -$217,500 -$850 –1.4% 10% 89% 228,000 $ –1,050 9% 21,700 $+730
Fourth 20% $76,020 to $120,000 $95,300 -$279,400 -$1,090 –1.1% 13% 81% 206,000 $ –1,640 18% 46,800 $+1,140
Next 15% $120,000 to $234,160 $162,400 -$404,300 -$2,130 –1.3% 18% 82% 156,000 $ –2,890 18% 34,200 $+1,320
Next 4% $234,160 to $574,890 $334,100 -$455,800 -$8,670 –2.6% 21% 87% 46,000 $ –10,190 12% 6,400 $+1,970
Richest 1% $574,890 and higher $1,607,600 -$705,500 -$54,980 –3.4% 32% 97% 12,000 $ –56,760 1% 100 $+27,580
ALL $95,100 $ –2,198,100 $ –1,700 –1.8% 84% 1,078,000 $ –2,180 10% 134,500 $+1,050
Bottom 60% Less than $76,020 $38,300 $ –353,300 $ –460 –1.2% 16% 86% 658,000 $ –610 6% 47,000 $+570
Impacts of the Senate Tax Plan (Revised w/Amendments) in 2019 in Vermont
Income Average Share of Tax Share w/ Share w/Group Income Change Tax Cut Tax Hike
Poorest 20% Less than $27,140 $14,800 -$4,300 -$70 –0.5% 8% 65% 41,000 $ –150 0% 200 $+20
Second 20% $27,140 to $47,210 $38,200 -$22,200 -$350 –0.9% 9% 79% 50,000 $ –500 4% 2,700 $+220
Middle 20% $47,210 to $70,470 $56,500 -$52,500 -$850 –1.5% 11% 94% 58,000 $ –940 1% 600 $+500
Fourth 20% $70,470 to $114,080 $89,400 -$87,600 -$1,370 –1.5% 19% 88% 56,000 $ –1,720 10% 6,200 $+1,160
Next 15% $114,080 to $215,890 $149,300 -$103,600 -$2,190 –1.5% 22% 83% 39,000 $ –3,010 17% 8,100 $+1,720
Next 4% $215,890 to $517,790 $294,600 -$105,800 -$8,370 –2.8% 23% 96% 12,000 $ –8,790 4% 500 $+2,800
Richest 1% $517,790 and higher $1,166,800 -$85,300 -$25,920 –2.2% 18% 84% 3,000 $ –31,940 16% 500 $+6,310
ALL $86,000 $ –461,200 $ –1,460 –1.7% 82% 259,000 $ –1,910 6% 18,800 $+1,410
Bottom 60% Less than $70,470 $36,400 $ –79,000 $ –420 –1.2% 17% 79% 149,000 $ –580 2% 3,500 $+260
Impacts of the Senate Tax Plan (Revised w/Amendments) in 2019 in Virginia
Income Average Share of Tax Share w/ Share w/Group Income Change Tax Cut Tax Hike
Poorest 20% Less than $23,840 $14,700 -$47,300 -$60 –0.4% 8% 58% 481,000 $ –160 4% 29,700 $+280
Second 20% $23,840 to $43,260 $32,800 -$287,600 -$350 –1.1% 9% 85% 706,000 $ –490 7% 54,400 $+650
Middle 20% $43,260 to $71,390 $56,200 -$647,500 -$780 –1.4% 10% 87% 725,000 $ –1,010 10% 86,500 $+670
Fourth 20% $71,390 to $127,030 $95,500 -$955,100 -$1,150 –1.2% 14% 79% 652,000 $ –1,810 21% 170,800 $+1,180
Next 15% $127,030 to $267,900 $177,800 -$1,102,900 -$1,780 –1.0% 16% 69% 429,000 $ –3,330 31% 191,100 $+1,700
Next 4% $267,900 to $644,150 $381,000 -$1,722,100 -$10,340 –2.7% 26% 90% 149,000 $ –11,760 10% 16,700 $+2,090
Richest 1% $644,150 and higher $1,699,100 -$1,923,700 -$46,580 –2.7% 29% 94% 39,000 $ –50,090 6% 2,400 $+9,380
ALL $97,900 $ –6,685,900 $ –1,600 –1.6% 77% 3,181,000 $ –2,340 13% 551,600 $+1,240
Bottom 60% Less than $71,390 $34,600 $ –982,400 $ –400 –1.1% 15% 77% 1,912,000 $ –610 7% 170,600 $+600
Impacts of the Senate Tax Plan (Revised w/Amendments) in 2019 in Washington
Income Average Share of Tax Share w/ Share w/Group Income Change Tax Cut Tax Hike
Poorest 20% Less than $27,910 $16,400 -$85,000 -$120 –0.7% 8% 72% 523,000 $ –190 2% 17,100 $+20
Second 20% $27,910 to $49,180 $39,200 -$354,600 -$490 –1.2% 9% 91% 657,000 $ –580 4% 29,500 $+430
Middle 20% $49,180 to $79,230 $63,600 -$772,200 -$1,070 –1.7% 9% 87% 629,000 $ –1,330 11% 76,100 $+720
Fourth 20% $79,230 to $128,680 $100,900 -$1,126,700 -$1,560 –1.5% 13% 87% 632,000 $ –1,930 12% 85,700 $+960
Next 15% $128,680 to $264,170 $174,800 -$1,651,500 -$3,040 –1.7% 20% 89% 483,000 $ –3,740 11% 57,500 $+2,700
Next 4% $264,170 to $666,040 $383,300 -$1,772,700 -$12,260 –3.2% 21% 93% 134,000 $ –13,310 7% 10,200 $+1,200
Richest 1% $666,040 and higher $2,094,000 -$2,610,100 -$71,890 –3.4% 31% 97% 35,000 $ –74,570 3% 1,000 $+21,150
ALL $105,300 $ –8,372,400 $ –2,290 –2.2% 85% 3,093,000 $ –2,820 8% 277,100 $+1,210
Bottom 60% Less than $79,230 $39,700 $ –1,211,800 $ –560 –1.4% 14% 83% 1,809,000 $ –730 6% 122,700 $+550
Income Range Tot. Change ($1000s) Avg. Tax Change $ Change as a % of Pre- Tax Income
Avg. Cut $ Avg. Hike $ Tot. Taxpayers
w/Cut Tot. Taxpayers
w/Hike
Income All Taxpayers (Includes ACA Individual Mandate Repeal) Taxpayers w/ Tax Cut* Taxpayers w/ Tax Hike*
Income All Taxpayers (Includes ACA Individual Mandate Repeal) Taxpayers w/ Tax Cut* Taxpayers w/ Tax Hike*
Income Range Tot. Change ($1000s) Avg. Tax Change $ Change as a % of Pre- Tax Income
Avg. Cut $
Income Range Tot. Change ($1000s) Avg. Tax Change $ Change as a % of Pre- Tax Income
Avg. Cut $ Avg. Hike $ Tot. Taxpayers
w/Cut Tot. Taxpayers
w/Hike
Avg. Hike $
Income All Taxpayers (Includes ACA Individual Mandate Repeal) Taxpayers w/ Tax Cut* Taxpayers w/ Tax Hike*
Tot. Taxpayers w/Cut
Tot. Taxpayers w/Hike
Income All Taxpayers (Includes ACA Individual Mandate Repeal) Taxpayers w/ Tax Cut* Taxpayers w/ Tax Hike*
Income Range Tot. Change ($1000s) Avg. Tax Change $ Change as a % of Pre- Tax Income
Avg. Cut $ Avg. Hike $ Tot. Taxpayers
w/Cut Tot. Taxpayers
w/Hike
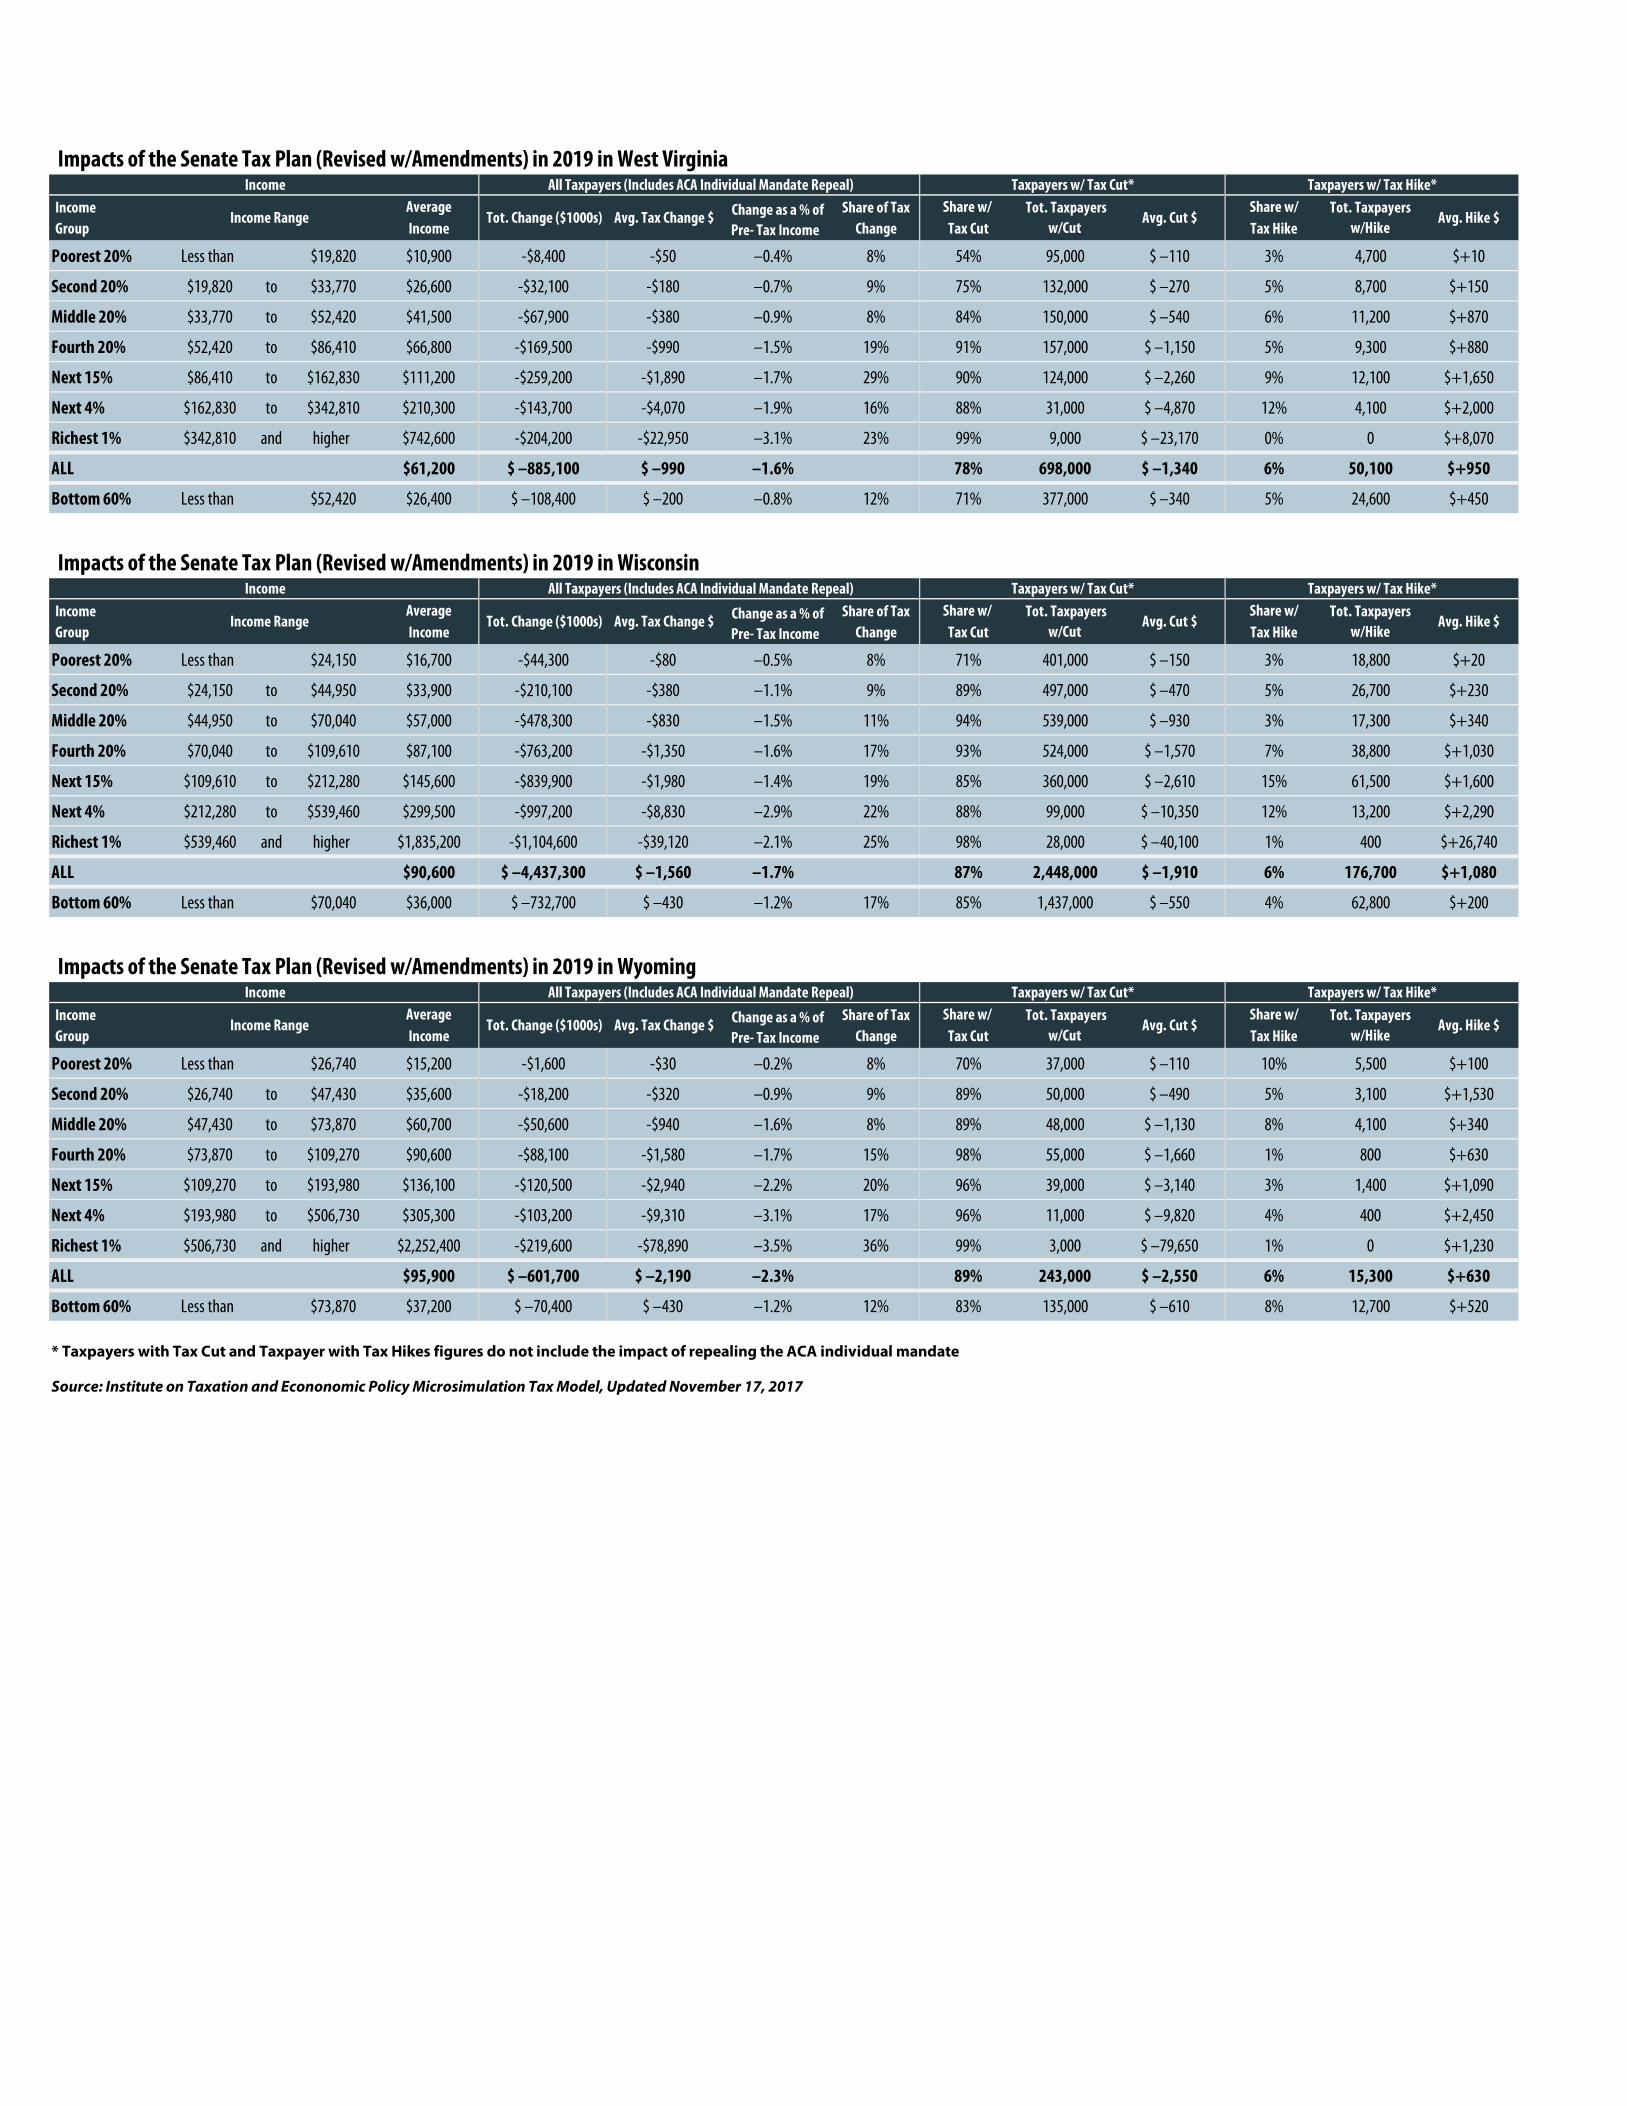
Impacts of the Senate Tax Plan (Revised w/Amendments) in 2019 in West Virginia
Income Average Share of Tax Share w/ Share w/Group Income Change Tax Cut Tax Hike
Poorest 20% Less than $19,820 $10,900 -$8,400 -$50 –0.4% 8% 54% 95,000 $ –110 3% 4,700 $+10
Second 20% $19,820 to $33,770 $26,600 -$32,100 -$180 –0.7% 9% 75% 132,000 $ –270 5% 8,700 $+150
Middle 20% $33,770 to $52,420 $41,500 -$67,900 -$380 –0.9% 8% 84% 150,000 $ –540 6% 11,200 $+870
Fourth 20% $52,420 to $86,410 $66,800 -$169,500 -$990 –1.5% 19% 91% 157,000 $ –1,150 5% 9,300 $+880
Next 15% $86,410 to $162,830 $111,200 -$259,200 -$1,890 –1.7% 29% 90% 124,000 $ –2,260 9% 12,100 $+1,650
Next 4% $162,830 to $342,810 $210,300 -$143,700 -$4,070 –1.9% 16% 88% 31,000 $ –4,870 12% 4,100 $+2,000
Richest 1% $342,810 and higher $742,600 -$204,200 -$22,950 –3.1% 23% 99% 9,000 $ –23,170 0% 0 $+8,070
ALL $61,200 $ –885,100 $ –990 –1.6% 78% 698,000 $ –1,340 6% 50,100 $+950
Bottom 60% Less than $52,420 $26,400 $ –108,400 $ –200 –0.8% 12% 71% 377,000 $ –340 5% 24,600 $+450
Impacts of the Senate Tax Plan (Revised w/Amendments) in 2019 in Wisconsin
Income Average Share of Tax Share w/ Share w/Group Income Change Tax Cut Tax Hike
Poorest 20% Less than $24,150 $16,700 -$44,300 -$80 –0.5% 8% 71% 401,000 $ –150 3% 18,800 $+20
Second 20% $24,150 to $44,950 $33,900 -$210,100 -$380 –1.1% 9% 89% 497,000 $ –470 5% 26,700 $+230
Middle 20% $44,950 to $70,040 $57,000 -$478,300 -$830 –1.5% 11% 94% 539,000 $ –930 3% 17,300 $+340
Fourth 20% $70,040 to $109,610 $87,100 -$763,200 -$1,350 –1.6% 17% 93% 524,000 $ –1,570 7% 38,800 $+1,030
Next 15% $109,610 to $212,280 $145,600 -$839,900 -$1,980 –1.4% 19% 85% 360,000 $ –2,610 15% 61,500 $+1,600
Next 4% $212,280 to $539,460 $299,500 -$997,200 -$8,830 –2.9% 22% 88% 99,000 $ –10,350 12% 13,200 $+2,290
Richest 1% $539,460 and higher $1,835,200 -$1,104,600 -$39,120 –2.1% 25% 98% 28,000 $ –40,100 1% 400 $+26,740
ALL $90,600 $ –4,437,300 $ –1,560 –1.7% 87% 2,448,000 $ –1,910 6% 176,700 $+1,080
Bottom 60% Less than $70,040 $36,000 $ –732,700 $ –430 –1.2% 17% 85% 1,437,000 $ –550 4% 62,800 $+200
Impacts of the Senate Tax Plan (Revised w/Amendments) in 2019 in Wyoming
Income Average Share of Tax Share w/ Share w/Group Income Change Tax Cut Tax Hike
Poorest 20% Less than $26,740 $15,200 -$1,600 -$30 –0.2% 8% 70% 37,000 $ –110 10% 5,500 $+100
Second 20% $26,740 to $47,430 $35,600 -$18,200 -$320 –0.9% 9% 89% 50,000 $ –490 5% 3,100 $+1,530
Middle 20% $47,430 to $73,870 $60,700 -$50,600 -$940 –1.6% 8% 89% 48,000 $ –1,130 8% 4,100 $+340
Fourth 20% $73,870 to $109,270 $90,600 -$88,100 -$1,580 –1.7% 15% 98% 55,000 $ –1,660 1% 800 $+630
Next 15% $109,270 to $193,980 $136,100 -$120,500 -$2,940 –2.2% 20% 96% 39,000 $ –3,140 3% 1,400 $+1,090
Next 4% $193,980 to $506,730 $305,300 -$103,200 -$9,310 –3.1% 17% 96% 11,000 $ –9,820 4% 400 $+2,450
Richest 1% $506,730 and higher $2,252,400 -$219,600 -$78,890 –3.5% 36% 99% 3,000 $ –79,650 1% 0 $+1,230
ALL $95,900 $ –601,700 $ –2,190 –2.3% 89% 243,000 $ –2,550 6% 15,300 $+630
Bottom 60% Less than $73,870 $37,200 $ –70,400 $ –430 –1.2% 12% 83% 135,000 $ –610 8% 12,700 $+520
* Taxpayers with Tax Cut and Taxpayer with Tax Hikes figures do not include the impact of repealing the ACA individual mandate
Source: Institute on Taxation and Econonomic Policy Microsimulation Tax Model, Updated November 17, 2017
Income Range Tot. Change ($1000s) Avg. Tax Change $ Change as a % of Pre- Tax Income
Avg. Cut $ Avg. Hike $ Tot. Taxpayers
w/Cut Tot. Taxpayers
w/Hike
Income All Taxpayers (Includes ACA Individual Mandate Repeal) Taxpayers w/ Tax Cut* Taxpayers w/ Tax Hike*
Income All Taxpayers (Includes ACA Individual Mandate Repeal) Taxpayers w/ Tax Cut* Taxpayers w/ Tax Hike*
Income Range Tot. Change ($1000s) Avg. Tax Change $ Change as a % of Pre- Tax Income
Avg. Cut $
Income Range Tot. Change ($1000s) Avg. Tax Change $ Change as a % of Pre- Tax Income
Avg. Cut $ Avg. Hike $ Tot. Taxpayers
w/Cut Tot. Taxpayers
w/Hike
Avg. Hike $
Income All Taxpayers (Includes ACA Individual Mandate Repeal) Taxpayers w/ Tax Cut* Taxpayers w/ Tax Hike*
Tot. Taxpayers w/Cut
Tot. Taxpayers w/Hike
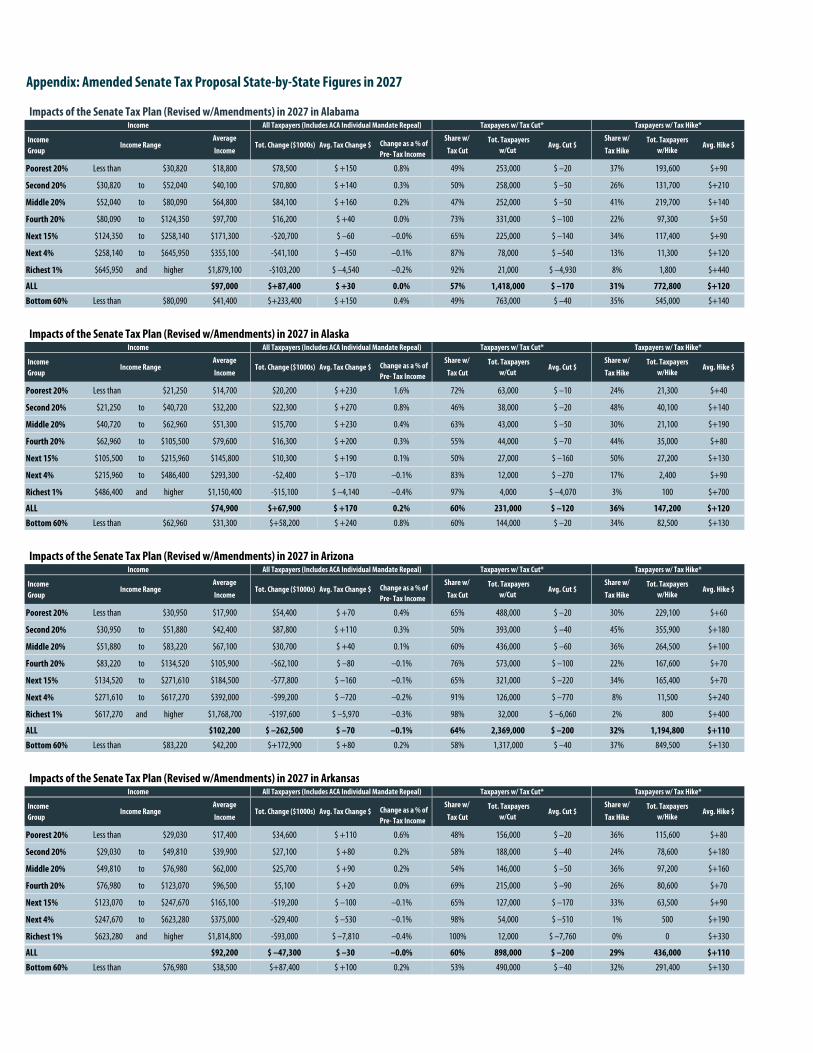
Appendix: Amended Senate Tax Proposal State-by-State Figures in 2027
Impacts of the Senate Tax Plan (Revised w/Amendments) in 2027 in Alabama
Income Average Share w/ Share w/
Group Income Tax Cut Tax Hike
Poorest 20% Less than $30,820 $18,800 $78,500 $ +150 0.8% 49% 253,000 $ –20 37% 193,600 $+90
Second 20% $30,820 to $52,040 $40,100 $70,800 $ +140 0.3% 50% 258,000 $ –50 26% 131,700 $+210
Middle 20% $52,040 to $80,090 $64,800 $84,100 $ +160 0.2% 47% 252,000 $ –50 41% 219,700 $+140
Fourth 20% $80,090 to $124,350 $97,700 $16,200 $ +40 0.0% 73% 331,000 $ –100 22% 97,300 $+50
Next 15% $124,350 to $258,140 $171,300 -$20,700 $ –60 –0.0% 65% 225,000 $ –140 34% 117,400 $+90
Next 4% $258,140 to $645,950 $355,100 -$41,100 $ –450 –0.1% 87% 78,000 $ –540 13% 11,300 $+120
Richest 1% $645,950 and higher $1,879,100 -$103,200 $ –4,540 –0.2% 92% 21,000 $ –4,930 8% 1,800 $+440
ALL $97,000 $+87,400 $ +30 0.0% 57% 1,418,000 $ –170 31% 772,800 $+120
Bottom 60% Less than $80,090 $41,400 $+233,400 $ +150 0.4% 49% 763,000 $ –40 35% 545,000 $+140
Impacts of the Senate Tax Plan (Revised w/Amendments) in 2027 in Alaska
Income Average Share w/ Share w/
Group Income Tax Cut Tax Hike
Poorest 20% Less than $21,250 $14,700 $20,200 $ +230 1.6% 72% 63,000 $ –10 24% 21,300 $+40
Second 20% $21,250 to $40,720 $32,200 $22,300 $ +270 0.8% 46% 38,000 $ –20 48% 40,100 $+140
Middle 20% $40,720 to $62,960 $51,300 $15,700 $ +230 0.4% 63% 43,000 $ –50 30% 21,100 $+190
Fourth 20% $62,960 to $105,500 $79,600 $16,300 $ +200 0.3% 55% 44,000 $ –70 44% 35,000 $+80
Next 15% $105,500 to $215,960 $145,800 $10,300 $ +190 0.1% 50% 27,000 $ –160 50% 27,200 $+130
Next 4% $215,960 to $486,400 $293,300 -$2,400 $ –170 –0.1% 83% 12,000 $ –270 17% 2,400 $+90
Richest 1% $486,400 and higher $1,150,400 -$15,100 $ –4,140 –0.4% 97% 4,000 $ –4,070 3% 100 $+700
ALL $74,900 $+67,900 $ +170 0.2% 60% 231,000 $ –120 36% 147,200 $+120
Bottom 60% Less than $62,960 $31,300 $+58,200 $ +240 0.8% 60% 144,000 $ –20 34% 82,500 $+130
Impacts of the Senate Tax Plan (Revised w/Amendments) in 2027 in Arizona
Income Average Share w/ Share w/
Group Income Tax Cut Tax Hike
Poorest 20% Less than $30,950 $17,900 $54,400 $ +70 0.4% 65% 488,000 $ –20 30% 229,100 $+60
Second 20% $30,950 to $51,880 $42,400 $87,800 $ +110 0.3% 50% 393,000 $ –40 45% 355,900 $+180
Middle 20% $51,880 to $83,220 $67,100 $30,700 $ +40 0.1% 60% 436,000 $ –60 36% 264,500 $+100
Fourth 20% $83,220 to $134,520 $105,900 -$62,100 $ –80 –0.1% 76% 573,000 $ –100 22% 167,600 $+70
Next 15% $134,520 to $271,610 $184,500 -$77,800 $ –160 –0.1% 65% 321,000 $ –220 34% 165,400 $+70
Next 4% $271,610 to $617,270 $392,000 -$99,200 $ –720 –0.2% 91% 126,000 $ –770 8% 11,500 $+240
Richest 1% $617,270 and higher $1,768,700 -$197,600 $ –5,970 –0.3% 98% 32,000 $ –6,060 2% 800 $+400
ALL $102,200 $ –262,500 $ –70 –0.1% 64% 2,369,000 $ –200 32% 1,194,800 $+110
Bottom 60% Less than $83,220 $42,200 $+172,900 $ +80 0.2% 58% 1,317,000 $ –40 37% 849,500 $+130
Impacts of the Senate Tax Plan (Revised w/Amendments) in 2027 in Arkansas
Income Average Share w/ Share w/
Group Income Tax Cut Tax Hike
Poorest 20% Less than $29,030 $17,400 $34,600 $ +110 0.6% 48% 156,000 $ –20 36% 115,600 $+80
Second 20% $29,030 to $49,810 $39,900 $27,100 $ +80 0.2% 58% 188,000 $ –40 24% 78,600 $+180
Middle 20% $49,810 to $76,980 $62,000 $25,700 $ +90 0.2% 54% 146,000 $ –50 36% 97,200 $+160
Fourth 20% $76,980 to $123,070 $96,500 $5,100 $ +20 0.0% 69% 215,000 $ –90 26% 80,600 $+70
Next 15% $123,070 to $247,670 $165,100 -$19,200 $ –100 –0.1% 65% 127,000 $ –170 33% 63,500 $+90
Next 4% $247,670 to $623,280 $375,000 -$29,400 $ –530 –0.1% 98% 54,000 $ –510 1% 500 $+190
Richest 1% $623,280 and higher $1,814,800 -$93,000 $ –7,810 –0.4% 100% 12,000 $ –7,760 0% 0 $+330
ALL $92,200 $ –47,300 $ –30 –0.0% 60% 898,000 $ –200 29% 436,000 $+110
Bottom 60% Less than $76,980 $38,500 $+87,400 $ +100 0.2% 53% 490,000 $ –40 32% 291,400 $+130
Income Range Tot. Change ($1000s) Avg. Tax Change $ Change as a % of Pre- Tax Income
Tot. Taxpayers w/Cut
Income All Taxpayers (Includes ACA Individual Mandate Repeal)
Income All Taxpayers (Includes ACA Individual Mandate Repeal)
Income Range Tot. Change ($1000s) Avg. Tax Change $ Change as a % of Pre- Tax Income
Tot. Taxpayers w/Cut
Avg. Hike $
Income All Taxpayers (Includes ACA Individual Mandate Repeal)
Income Range Tot. Change ($1000s) Avg. Tax Change $ Change as a % of Pre- Tax Income
Tot. Taxpayers w/Cut
Income Range Tot. Change ($1000s) Avg. Tax Change $ Change as a % of Pre- Tax Income
Tot. Taxpayers w/Cut
Avg. Cut $Tot. Taxpayers
w/Hike
Taxpayers w/ Tax Cut* Taxpayers w/ Tax Hike*
Avg. Cut $Tot. Taxpayers
w/HikeAvg. Hike $
Taxpayers w/ Tax Hike*
Avg. Cut $Tot. Taxpayers
w/Hike
Taxpayers w/ Tax Cut*
Avg. Hike $
Taxpayers w/ Tax Hike*
Avg. Hike $
Income All Taxpayers (Includes ACA Individual Mandate Repeal) Taxpayers w/ Tax Cut* Taxpayers w/ Tax Hike*
Avg. Cut $Tot. Taxpayers
w/Hike
Taxpayers w/ Tax Cut*
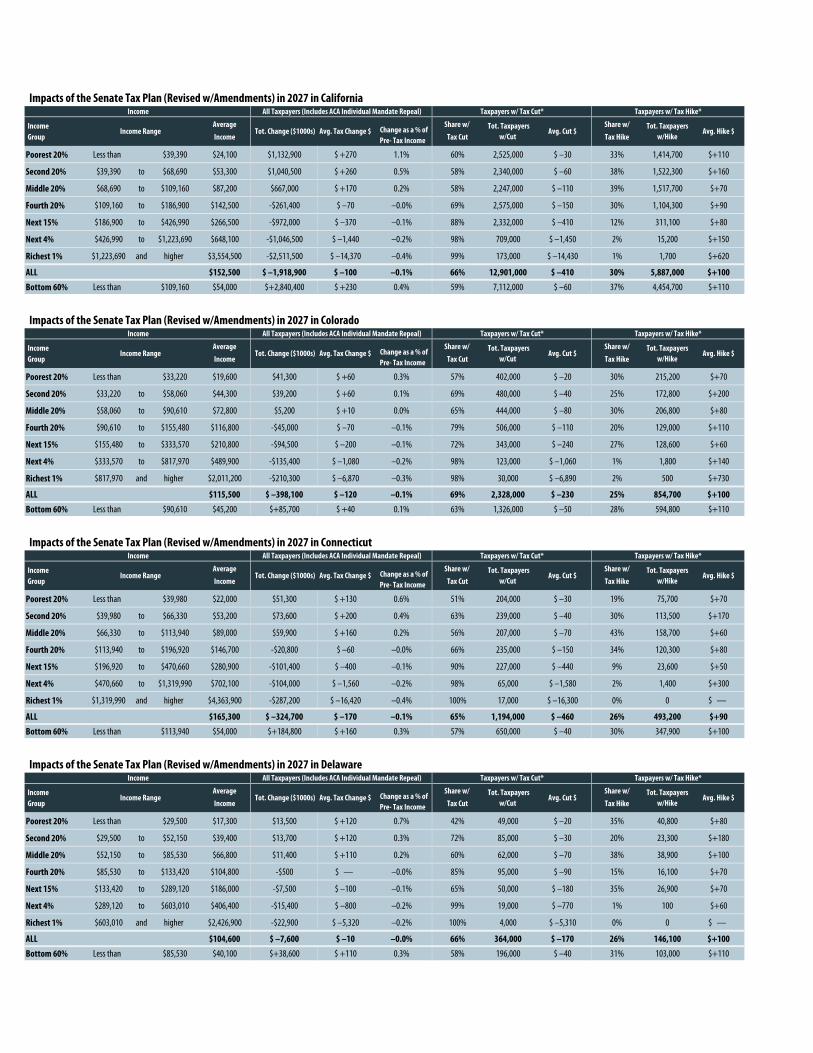
Impacts of the Senate Tax Plan (Revised w/Amendments) in 2027 in California
Income Average Share w/ Share w/
Group Income Tax Cut Tax Hike
Poorest 20% Less than $39,390 $24,100 $1,132,900 $ +270 1.1% 60% 2,525,000 $ –30 33% 1,414,700 $+110
Second 20% $39,390 to $68,690 $53,300 $1,040,500 $ +260 0.5% 58% 2,340,000 $ –60 38% 1,522,300 $+160
Middle 20% $68,690 to $109,160 $87,200 $667,000 $ +170 0.2% 58% 2,247,000 $ –110 39% 1,517,700 $+70
Fourth 20% $109,160 to $186,900 $142,500 -$261,400 $ –70 –0.0% 69% 2,575,000 $ –150 30% 1,104,300 $+90
Next 15% $186,900 to $426,990 $266,500 -$972,000 $ –370 –0.1% 88% 2,332,000 $ –410 12% 311,100 $+80
Next 4% $426,990 to $1,223,690 $648,100 -$1,046,500 $ –1,440 –0.2% 98% 709,000 $ –1,450 2% 15,200 $+150
Richest 1% $1,223,690 and higher $3,554,500 -$2,511,500 $ –14,370 –0.4% 99% 173,000 $ –14,430 1% 1,700 $+620
ALL $152,500 $ –1,918,900 $ –100 –0.1% 66% 12,901,000 $ –410 30% 5,887,000 $+100
Bottom 60% Less than $109,160 $54,000 $+2,840,400 $ +230 0.4% 59% 7,112,000 $ –60 37% 4,454,700 $+110
Impacts of the Senate Tax Plan (Revised w/Amendments) in 2027 in Colorado
Income Average Share w/ Share w/
Group Income Tax Cut Tax Hike
Poorest 20% Less than $33,220 $19,600 $41,300 $ +60 0.3% 57% 402,000 $ –20 30% 215,200 $+70
Second 20% $33,220 to $58,060 $44,300 $39,200 $ +60 0.1% 69% 480,000 $ –40 25% 172,800 $+200
Middle 20% $58,060 to $90,610 $72,800 $5,200 $ +10 0.0% 65% 444,000 $ –80 30% 206,800 $+80
Fourth 20% $90,610 to $155,480 $116,800 -$45,000 $ –70 –0.1% 79% 506,000 $ –110 20% 129,000 $+110
Next 15% $155,480 to $333,570 $210,800 -$94,500 $ –200 –0.1% 72% 343,000 $ –240 27% 128,600 $+60
Next 4% $333,570 to $817,970 $489,900 -$135,400 $ –1,080 –0.2% 98% 123,000 $ –1,060 1% 1,800 $+140
Richest 1% $817,970 and higher $2,011,200 -$210,300 $ –6,870 –0.3% 98% 30,000 $ –6,890 2% 500 $+730
ALL $115,500 $ –398,100 $ –120 –0.1% 69% 2,328,000 $ –230 25% 854,700 $+100
Bottom 60% Less than $90,610 $45,200 $+85,700 $ +40 0.1% 63% 1,326,000 $ –50 28% 594,800 $+110
Impacts of the Senate Tax Plan (Revised w/Amendments) in 2027 in Connecticut
Income Average Share w/ Share w/
Group Income Tax Cut Tax Hike
Poorest 20% Less than $39,980 $22,000 $51,300 $ +130 0.6% 51% 204,000 $ –30 19% 75,700 $+70
Second 20% $39,980 to $66,330 $53,200 $73,600 $ +200 0.4% 63% 239,000 $ –40 30% 113,500 $+170
Middle 20% $66,330 to $113,940 $89,000 $59,900 $ +160 0.2% 56% 207,000 $ –70 43% 158,700 $+60
Fourth 20% $113,940 to $196,920 $146,700 -$20,800 $ –60 –0.0% 66% 235,000 $ –150 34% 120,300 $+80
Next 15% $196,920 to $470,660 $280,900 -$101,400 $ –400 –0.1% 90% 227,000 $ –440 9% 23,600 $+50
Next 4% $470,660 to $1,319,990 $702,100 -$104,000 $ –1,560 –0.2% 98% 65,000 $ –1,580 2% 1,400 $+300
Richest 1% $1,319,990 and higher $4,363,900 -$287,200 $ –16,420 –0.4% 100% 17,000 $ –16,300 0% 0 $ —
ALL $165,300 $ –324,700 $ –170 –0.1% 65% 1,194,000 $ –460 26% 493,200 $+90
Bottom 60% Less than $113,940 $54,000 $+184,800 $ +160 0.3% 57% 650,000 $ –40 30% 347,900 $+100
Impacts of the Senate Tax Plan (Revised w/Amendments) in 2027 in Delaware
Income Average Share w/ Share w/
Group Income Tax Cut Tax Hike
Poorest 20% Less than $29,500 $17,300 $13,500 $ +120 0.7% 42% 49,000 $ –20 35% 40,800 $+80
Second 20% $29,500 to $52,150 $39,400 $13,700 $ +120 0.3% 72% 85,000 $ –30 20% 23,300 $+180
Middle 20% $52,150 to $85,530 $66,800 $11,400 $ +110 0.2% 60% 62,000 $ –70 38% 38,900 $+100
Fourth 20% $85,530 to $133,420 $104,800 -$500 $ — –0.0% 85% 95,000 $ –90 15% 16,100 $+70
Next 15% $133,420 to $289,120 $186,000 -$7,500 $ –100 –0.1% 65% 50,000 $ –180 35% 26,900 $+70
Next 4% $289,120 to $603,010 $406,400 -$15,400 $ –800 –0.2% 99% 19,000 $ –770 1% 100 $+60
Richest 1% $603,010 and higher $2,426,900 -$22,900 $ –5,320 –0.2% 100% 4,000 $ –5,310 0% 0 $ —
ALL $104,600 $ –7,600 $ –10 –0.0% 66% 364,000 $ –170 26% 146,100 $+100
Bottom 60% Less than $85,530 $40,100 $+38,600 $ +110 0.3% 58% 196,000 $ –40 31% 103,000 $+110
Income All Taxpayers (Includes ACA Individual Mandate Repeal) Taxpayers w/ Tax Cut* Taxpayers w/ Tax Hike*
Income All Taxpayers (Includes ACA Individual Mandate Repeal)
Avg. Hike $
Income All Taxpayers (Includes ACA Individual Mandate Repeal)
Income Range Tot. Change ($1000s) Avg. Tax Change $ Change as a % of Pre- Tax Income
Tot. Taxpayers w/Cut
Income Range Tot. Change ($1000s) Avg. Tax Change $ Change as a % of Pre- Tax Income
Tot. Taxpayers w/Cut
Avg. Cut $Tot. Taxpayers
w/Hike
Taxpayers w/ Tax Cut* Taxpayers w/ Tax Hike*
Avg. Cut $Tot. Taxpayers
w/Hike
Taxpayers w/ Tax Cut* Taxpayers w/ Tax Hike*
Avg. Hike $
Avg. Hike $
Income All Taxpayers (Includes ACA Individual Mandate Repeal)
Income Range Tot. Change ($1000s) Avg. Tax Change $ Change as a % of Pre- Tax Income
Tot. Taxpayers w/Cut
Income Range Tot. Change ($1000s) Avg. Tax Change $ Change as a % of Pre- Tax Income
Tot. Taxpayers w/Cut
Avg. Cut $Tot. Taxpayers
w/Hike
Taxpayers w/ Tax Cut* Taxpayers w/ Tax Hike*
Avg. Cut $Tot. Taxpayers
w/HikeAvg. Hike $
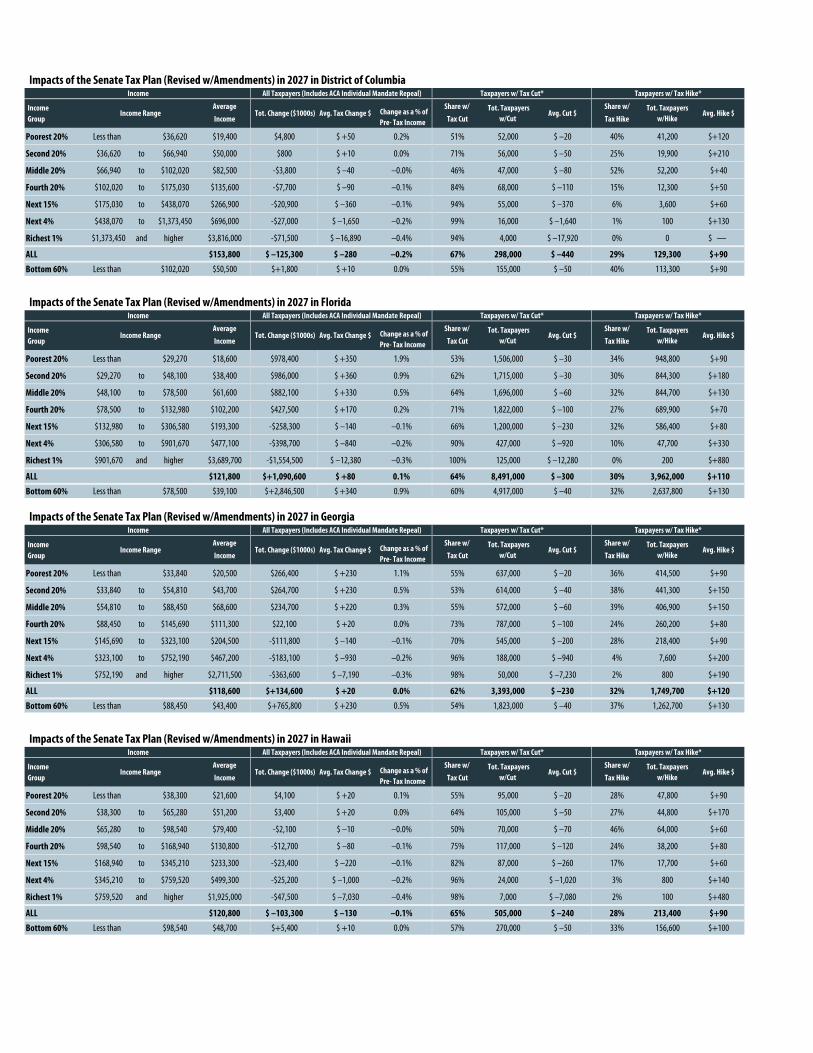
Impacts of the Senate Tax Plan (Revised w/Amendments) in 2027 in District of Columbia
Income Average Share w/ Share w/
Group Income Tax Cut Tax Hike
Poorest 20% Less than $36,620 $19,400 $4,800 $ +50 0.2% 51% 52,000 $ –20 40% 41,200 $+120
Second 20% $36,620 to $66,940 $50,000 $800 $ +10 0.0% 71% 56,000 $ –50 25% 19,900 $+210
Middle 20% $66,940 to $102,020 $82,500 -$3,800 $ –40 –0.0% 46% 47,000 $ –80 52% 52,200 $+40
Fourth 20% $102,020 to $175,030 $135,600 -$7,700 $ –90 –0.1% 84% 68,000 $ –110 15% 12,300 $+50
Next 15% $175,030 to $438,070 $266,900 -$20,900 $ –360 –0.1% 94% 55,000 $ –370 6% 3,600 $+60
Next 4% $438,070 to $1,373,450 $696,000 -$27,000 $ –1,650 –0.2% 99% 16,000 $ –1,640 1% 100 $+130
Richest 1% $1,373,450 and higher $3,816,000 -$71,500 $ –16,890 –0.4% 94% 4,000 $ –17,920 0% 0 $ —
ALL $153,800 $ –125,300 $ –280 –0.2% 67% 298,000 $ –440 29% 129,300 $+90
Bottom 60% Less than $102,020 $50,500 $+1,800 $ +10 0.0% 55% 155,000 $ –50 40% 113,300 $+90
Impacts of the Senate Tax Plan (Revised w/Amendments) in 2027 in Florida
Income Average Share w/ Share w/
Group Income Tax Cut Tax Hike
Poorest 20% Less than $29,270 $18,600 $978,400 $ +350 1.9% 53% 1,506,000 $ –30 34% 948,800 $+90
Second 20% $29,270 to $48,100 $38,400 $986,000 $ +360 0.9% 62% 1,715,000 $ –30 30% 844,300 $+180
Middle 20% $48,100 to $78,500 $61,600 $882,100 $ +330 0.5% 64% 1,696,000 $ –60 32% 844,700 $+130
Fourth 20% $78,500 to $132,980 $102,200 $427,500 $ +170 0.2% 71% 1,822,000 $ –100 27% 689,900 $+70
Next 15% $132,980 to $306,580 $193,300 -$258,300 $ –140 –0.1% 66% 1,200,000 $ –230 32% 586,400 $+80
Next 4% $306,580 to $901,670 $477,100 -$398,700 $ –840 –0.2% 90% 427,000 $ –920 10% 47,700 $+330
Richest 1% $901,670 and higher $3,689,700 -$1,554,500 $ –12,380 –0.3% 100% 125,000 $ –12,280 0% 200 $+880
ALL $121,800 $+1,090,600 $ +80 0.1% 64% 8,491,000 $ –300 30% 3,962,000 $+110
Bottom 60% Less than $78,500 $39,100 $+2,846,500 $ +340 0.9% 60% 4,917,000 $ –40 32% 2,637,800 $+130
Impacts of the Senate Tax Plan (Revised w/Amendments) in 2027 in Georgia
Income Average Share w/ Share w/
Group Income Tax Cut Tax Hike
Poorest 20% Less than $33,840 $20,500 $266,400 $ +230 1.1% 55% 637,000 $ –20 36% 414,500 $+90
Second 20% $33,840 to $54,810 $43,700 $264,700 $ +230 0.5% 53% 614,000 $ –40 38% 441,300 $+150
Middle 20% $54,810 to $88,450 $68,600 $234,700 $ +220 0.3% 55% 572,000 $ –60 39% 406,900 $+150
Fourth 20% $88,450 to $145,690 $111,300 $22,100 $ +20 0.0% 73% 787,000 $ –100 24% 260,200 $+80
Next 15% $145,690 to $323,100 $204,500 -$111,800 $ –140 –0.1% 70% 545,000 $ –200 28% 218,400 $+90
Next 4% $323,100 to $752,190 $467,200 -$183,100 $ –930 –0.2% 96% 188,000 $ –940 4% 7,600 $+200
Richest 1% $752,190 and higher $2,711,500 -$363,600 $ –7,190 –0.3% 98% 50,000 $ –7,230 2% 800 $+190
ALL $118,600 $+134,600 $ +20 0.0% 62% 3,393,000 $ –230 32% 1,749,700 $+120
Bottom 60% Less than $88,450 $43,400 $+765,800 $ +230 0.5% 54% 1,823,000 $ –40 37% 1,262,700 $+130
Impacts of the Senate Tax Plan (Revised w/Amendments) in 2027 in Hawaii
Income Average Share w/ Share w/
Group Income Tax Cut Tax Hike
Poorest 20% Less than $38,300 $21,600 $4,100 $ +20 0.1% 55% 95,000 $ –20 28% 47,800 $+90
Second 20% $38,300 to $65,280 $51,200 $3,400 $ +20 0.0% 64% 105,000 $ –50 27% 44,800 $+170
Middle 20% $65,280 to $98,540 $79,400 -$2,100 $ –10 –0.0% 50% 70,000 $ –70 46% 64,000 $+60
Fourth 20% $98,540 to $168,940 $130,800 -$12,700 $ –80 –0.1% 75% 117,000 $ –120 24% 38,200 $+80
Next 15% $168,940 to $345,210 $233,300 -$23,400 $ –220 –0.1% 82% 87,000 $ –260 17% 17,700 $+60
Next 4% $345,210 to $759,520 $499,300 -$25,200 $ –1,000 –0.2% 96% 24,000 $ –1,020 3% 800 $+140
Richest 1% $759,520 and higher $1,925,000 -$47,500 $ –7,030 –0.4% 98% 7,000 $ –7,080 2% 100 $+480
ALL $120,800 $ –103,300 $ –130 –0.1% 65% 505,000 $ –240 28% 213,400 $+90
Bottom 60% Less than $98,540 $48,700 $+5,400 $ +10 0.0% 57% 270,000 $ –50 33% 156,600 $+100
Income All Taxpayers (Includes ACA Individual Mandate Repeal) Taxpayers w/ Tax Cut* Taxpayers w/ Tax Hike*
Income All Taxpayers (Includes ACA Individual Mandate Repeal)
Avg. Hike $
Income All Taxpayers (Includes ACA Individual Mandate Repeal)
Income Range Tot. Change ($1000s) Avg. Tax Change $ Change as a % of Pre- Tax Income
Tot. Taxpayers w/Cut
Income Range Tot. Change ($1000s) Avg. Tax Change $ Change as a % of Pre- Tax Income
Tot. Taxpayers w/Cut
Avg. Cut $Tot. Taxpayers
w/Hike
Taxpayers w/ Tax Cut* Taxpayers w/ Tax Hike*
Avg. Cut $Tot. Taxpayers
w/Hike
Taxpayers w/ Tax Cut* Taxpayers w/ Tax Hike*
Avg. Hike $
Avg. Hike $
Income All Taxpayers (Includes ACA Individual Mandate Repeal)
Income Range Tot. Change ($1000s) Avg. Tax Change $ Change as a % of Pre- Tax Income
Tot. Taxpayers w/Cut
Income Range Tot. Change ($1000s) Avg. Tax Change $ Change as a % of Pre- Tax Income
Tot. Taxpayers w/Cut
Avg. Cut $Tot. Taxpayers
w/Hike
Taxpayers w/ Tax Cut* Taxpayers w/ Tax Hike*
Avg. Cut $Tot. Taxpayers
w/HikeAvg. Hike $
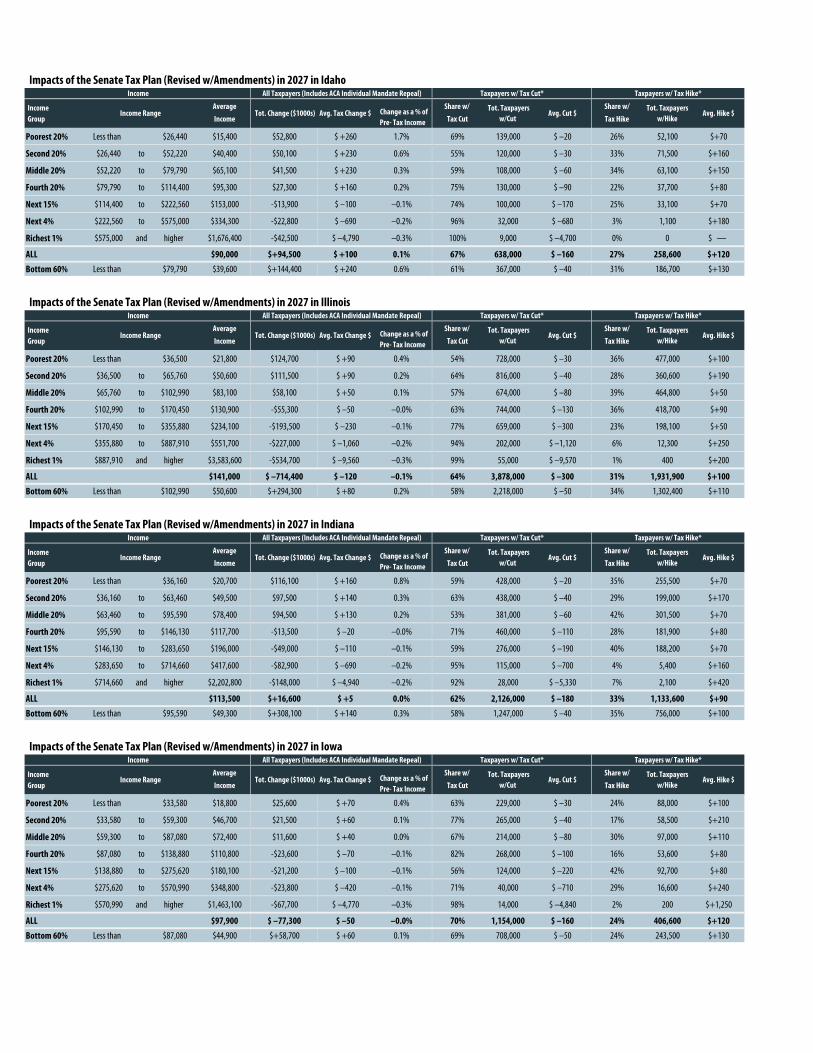
Impacts of the Senate Tax Plan (Revised w/Amendments) in 2027 in Idaho
Income Average Share w/ Share w/
Group Income Tax Cut Tax Hike
Poorest 20% Less than $26,440 $15,400 $52,800 $ +260 1.7% 69% 139,000 $ –20 26% 52,100 $+70
Second 20% $26,440 to $52,220 $40,400 $50,100 $ +230 0.6% 55% 120,000 $ –30 33% 71,500 $+160
Middle 20% $52,220 to $79,790 $65,100 $41,500 $ +230 0.3% 59% 108,000 $ –60 34% 63,100 $+150
Fourth 20% $79,790 to $114,400 $95,300 $27,300 $ +160 0.2% 75% 130,000 $ –90 22% 37,700 $+80
Next 15% $114,400 to $222,560 $153,000 -$13,900 $ –100 –0.1% 74% 100,000 $ –170 25% 33,100 $+70
Next 4% $222,560 to $575,000 $334,300 -$22,800 $ –690 –0.2% 96% 32,000 $ –680 3% 1,100 $+180
Richest 1% $575,000 and higher $1,676,400 -$42,500 $ –4,790 –0.3% 100% 9,000 $ –4,700 0% 0 $ —
ALL $90,000 $+94,500 $ +100 0.1% 67% 638,000 $ –160 27% 258,600 $+120
Bottom 60% Less than $79,790 $39,600 $+144,400 $ +240 0.6% 61% 367,000 $ –40 31% 186,700 $+130
Impacts of the Senate Tax Plan (Revised w/Amendments) in 2027 in Illinois
Income Average Share w/ Share w/
Group Income Tax Cut Tax Hike
Poorest 20% Less than $36,500 $21,800 $124,700 $ +90 0.4% 54% 728,000 $ –30 36% 477,000 $+100
Second 20% $36,500 to $65,760 $50,600 $111,500 $ +90 0.2% 64% 816,000 $ –40 28% 360,600 $+190
Middle 20% $65,760 to $102,990 $83,100 $58,100 $ +50 0.1% 57% 674,000 $ –80 39% 464,800 $+50
Fourth 20% $102,990 to $170,450 $130,900 -$55,300 $ –50 –0.0% 63% 744,000 $ –130 36% 418,700 $+90
Next 15% $170,450 to $355,880 $234,100 -$193,500 $ –230 –0.1% 77% 659,000 $ –300 23% 198,100 $+50
Next 4% $355,880 to $887,910 $551,700 -$227,000 $ –1,060 –0.2% 94% 202,000 $ –1,120 6% 12,300 $+250
Richest 1% $887,910 and higher $3,583,600 -$534,700 $ –9,560 –0.3% 99% 55,000 $ –9,570 1% 400 $+200
ALL $141,000 $ –714,400 $ –120 –0.1% 64% 3,878,000 $ –300 31% 1,931,900 $+100
Bottom 60% Less than $102,990 $50,600 $+294,300 $ +80 0.2% 58% 2,218,000 $ –50 34% 1,302,400 $+110
Impacts of the Senate Tax Plan (Revised w/Amendments) in 2027 in Indiana
Income Average Share w/ Share w/
Group Income Tax Cut Tax Hike
Poorest 20% Less than $36,160 $20,700 $116,100 $ +160 0.8% 59% 428,000 $ –20 35% 255,500 $+70
Second 20% $36,160 to $63,460 $49,500 $97,500 $ +140 0.3% 63% 438,000 $ –40 29% 199,000 $+170
Middle 20% $63,460 to $95,590 $78,400 $94,500 $ +130 0.2% 53% 381,000 $ –60 42% 301,500 $+70
Fourth 20% $95,590 to $146,130 $117,700 -$13,500 $ –20 –0.0% 71% 460,000 $ –110 28% 181,900 $+80
Next 15% $146,130 to $283,650 $196,000 -$49,000 $ –110 –0.1% 59% 276,000 $ –190 40% 188,200 $+70
Next 4% $283,650 to $714,660 $417,600 -$82,900 $ –690 –0.2% 95% 115,000 $ –700 4% 5,400 $+160
Richest 1% $714,660 and higher $2,202,800 -$148,000 $ –4,940 –0.2% 92% 28,000 $ –5,330 7% 2,100 $+420
ALL $113,500 $+16,600 $ +5 0.0% 62% 2,126,000 $ –180 33% 1,133,600 $+90
Bottom 60% Less than $95,590 $49,300 $+308,100 $ +140 0.3% 58% 1,247,000 $ –40 35% 756,000 $+100
Impacts of the Senate Tax Plan (Revised w/Amendments) in 2027 in Iowa
Income Average Share w/ Share w/
Group Income Tax Cut Tax Hike
Poorest 20% Less than $33,580 $18,800 $25,600 $ +70 0.4% 63% 229,000 $ –30 24% 88,000 $+100
Second 20% $33,580 to $59,300 $46,700 $21,500 $ +60 0.1% 77% 265,000 $ –40 17% 58,500 $+210
Middle 20% $59,300 to $87,080 $72,400 $11,600 $ +40 0.0% 67% 214,000 $ –80 30% 97,000 $+110
Fourth 20% $87,080 to $138,880 $110,800 -$23,600 $ –70 –0.1% 82% 268,000 $ –100 16% 53,600 $+80
Next 15% $138,880 to $275,620 $180,100 -$21,200 $ –100 –0.1% 56% 124,000 $ –220 42% 92,700 $+80
Next 4% $275,620 to $570,990 $348,800 -$23,800 $ –420 –0.1% 71% 40,000 $ –710 29% 16,600 $+240
Richest 1% $570,990 and higher $1,463,100 -$67,700 $ –4,770 –0.3% 98% 14,000 $ –4,840 2% 200 $+1,250
ALL $97,900 $ –77,300 $ –50 –0.0% 70% 1,154,000 $ –160 24% 406,600 $+120
Bottom 60% Less than $87,080 $44,900 $+58,700 $ +60 0.1% 69% 708,000 $ –50 24% 243,500 $+130
Income All Taxpayers (Includes ACA Individual Mandate Repeal) Taxpayers w/ Tax Cut* Taxpayers w/ Tax Hike*
Income All Taxpayers (Includes ACA Individual Mandate Repeal)
Avg. Hike $
Income All Taxpayers (Includes ACA Individual Mandate Repeal)
Income Range Tot. Change ($1000s) Avg. Tax Change $ Change as a % of Pre- Tax Income
Tot. Taxpayers w/Cut
Income Range Tot. Change ($1000s) Avg. Tax Change $ Change as a % of Pre- Tax Income
Tot. Taxpayers w/Cut
Avg. Cut $Tot. Taxpayers
w/Hike
Taxpayers w/ Tax Cut* Taxpayers w/ Tax Hike*
Avg. Cut $Tot. Taxpayers
w/Hike
Taxpayers w/ Tax Cut* Taxpayers w/ Tax Hike*
Avg. Hike $
Avg. Hike $
Income All Taxpayers (Includes ACA Individual Mandate Repeal)
Income Range Tot. Change ($1000s) Avg. Tax Change $ Change as a % of Pre- Tax Income
Tot. Taxpayers w/Cut
Income Range Tot. Change ($1000s) Avg. Tax Change $ Change as a % of Pre- Tax Income
Tot. Taxpayers w/Cut
Avg. Cut $Tot. Taxpayers
w/Hike
Taxpayers w/ Tax Cut* Taxpayers w/ Tax Hike*
Avg. Cut $Tot. Taxpayers
w/HikeAvg. Hike $
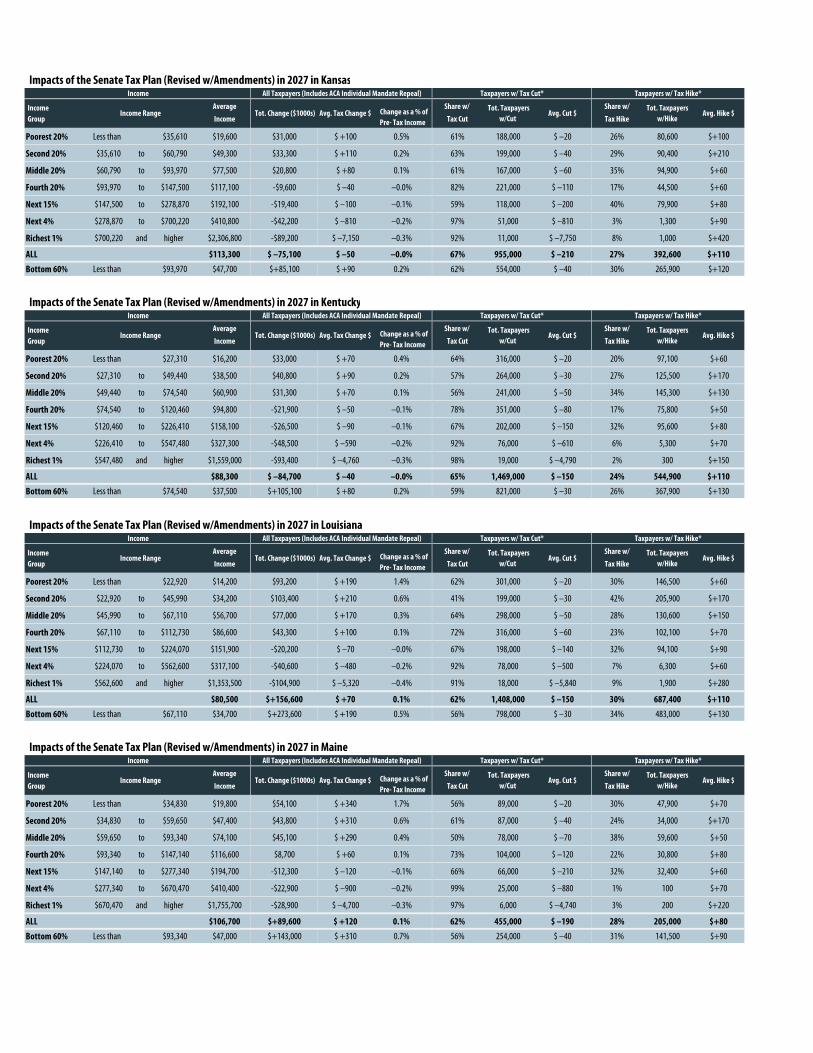
Impacts of the Senate Tax Plan (Revised w/Amendments) in 2027 in Kansas
Income Average Share w/ Share w/
Group Income Tax Cut Tax Hike
Poorest 20% Less than $35,610 $19,600 $31,000 $ +100 0.5% 61% 188,000 $ –20 26% 80,600 $+100
Second 20% $35,610 to $60,790 $49,300 $33,300 $ +110 0.2% 63% 199,000 $ –40 29% 90,400 $+210
Middle 20% $60,790 to $93,970 $77,500 $20,800 $ +80 0.1% 61% 167,000 $ –60 35% 94,900 $+60
Fourth 20% $93,970 to $147,500 $117,100 -$9,600 $ –40 –0.0% 82% 221,000 $ –110 17% 44,500 $+60
Next 15% $147,500 to $278,870 $192,100 -$19,400 $ –100 –0.1% 59% 118,000 $ –200 40% 79,900 $+80
Next 4% $278,870 to $700,220 $410,800 -$42,200 $ –810 –0.2% 97% 51,000 $ –810 3% 1,300 $+90
Richest 1% $700,220 and higher $2,306,800 -$89,200 $ –7,150 –0.3% 92% 11,000 $ –7,750 8% 1,000 $+420
ALL $113,300 $ –75,100 $ –50 –0.0% 67% 955,000 $ –210 27% 392,600 $+110
Bottom 60% Less than $93,970 $47,700 $+85,100 $ +90 0.2% 62% 554,000 $ –40 30% 265,900 $+120
Impacts of the Senate Tax Plan (Revised w/Amendments) in 2027 in Kentucky
Income Average Share w/ Share w/
Group Income Tax Cut Tax Hike
Poorest 20% Less than $27,310 $16,200 $33,000 $ +70 0.4% 64% 316,000 $ –20 20% 97,100 $+60
Second 20% $27,310 to $49,440 $38,500 $40,800 $ +90 0.2% 57% 264,000 $ –30 27% 125,500 $+170
Middle 20% $49,440 to $74,540 $60,900 $31,300 $ +70 0.1% 56% 241,000 $ –50 34% 145,300 $+130
Fourth 20% $74,540 to $120,460 $94,800 -$21,900 $ –50 –0.1% 78% 351,000 $ –80 17% 75,800 $+50
Next 15% $120,460 to $226,410 $158,100 -$26,500 $ –90 –0.1% 67% 202,000 $ –150 32% 95,600 $+80
Next 4% $226,410 to $547,480 $327,300 -$48,500 $ –590 –0.2% 92% 76,000 $ –610 6% 5,300 $+70
Richest 1% $547,480 and higher $1,559,000 -$93,400 $ –4,760 –0.3% 98% 19,000 $ –4,790 2% 300 $+150
ALL $88,300 $ –84,700 $ –40 –0.0% 65% 1,469,000 $ –150 24% 544,900 $+110
Bottom 60% Less than $74,540 $37,500 $+105,100 $ +80 0.2% 59% 821,000 $ –30 26% 367,900 $+130
Impacts of the Senate Tax Plan (Revised w/Amendments) in 2027 in Louisiana
Income Average Share w/ Share w/
Group Income Tax Cut Tax Hike
Poorest 20% Less than $22,920 $14,200 $93,200 $ +190 1.4% 62% 301,000 $ –20 30% 146,500 $+60
Second 20% $22,920 to $45,990 $34,200 $103,400 $ +210 0.6% 41% 199,000 $ –30 42% 205,900 $+170
Middle 20% $45,990 to $67,110 $56,700 $77,000 $ +170 0.3% 64% 298,000 $ –50 28% 130,600 $+150
Fourth 20% $67,110 to $112,730 $86,600 $43,300 $ +100 0.1% 72% 316,000 $ –60 23% 102,100 $+70
Next 15% $112,730 to $224,070 $151,900 -$20,200 $ –70 –0.0% 67% 198,000 $ –140 32% 94,100 $+90
Next 4% $224,070 to $562,600 $317,100 -$40,600 $ –480 –0.2% 92% 78,000 $ –500 7% 6,300 $+60
Richest 1% $562,600 and higher $1,353,500 -$104,900 $ –5,320 –0.4% 91% 18,000 $ –5,840 9% 1,900 $+280
ALL $80,500 $+156,600 $ +70 0.1% 62% 1,408,000 $ –150 30% 687,400 $+110
Bottom 60% Less than $67,110 $34,700 $+273,600 $ +190 0.5% 56% 798,000 $ –30 34% 483,000 $+130
Impacts of the Senate Tax Plan (Revised w/Amendments) in 2027 in Maine
Income Average Share w/ Share w/
Group Income Tax Cut Tax Hike
Poorest 20% Less than $34,830 $19,800 $54,100 $ +340 1.7% 56% 89,000 $ –20 30% 47,900 $+70
Second 20% $34,830 to $59,650 $47,400 $43,800 $ +310 0.6% 61% 87,000 $ –40 24% 34,000 $+170
Middle 20% $59,650 to $93,340 $74,100 $45,100 $ +290 0.4% 50% 78,000 $ –70 38% 59,600 $+50
Fourth 20% $93,340 to $147,140 $116,600 $8,700 $ +60 0.1% 73% 104,000 $ –120 22% 30,800 $+80
Next 15% $147,140 to $277,340 $194,700 -$12,300 $ –120 –0.1% 66% 66,000 $ –210 32% 32,400 $+60
Next 4% $277,340 to $670,470 $410,400 -$22,900 $ –900 –0.2% 99% 25,000 $ –880 1% 100 $+70
Richest 1% $670,470 and higher $1,755,700 -$28,900 $ –4,700 –0.3% 97% 6,000 $ –4,740 3% 200 $+220
ALL $106,700 $+89,600 $ +120 0.1% 62% 455,000 $ –190 28% 205,000 $+80
Bottom 60% Less than $93,340 $47,000 $+143,000 $ +310 0.7% 56% 254,000 $ –40 31% 141,500 $+90
Income All Taxpayers (Includes ACA Individual Mandate Repeal) Taxpayers w/ Tax Cut* Taxpayers w/ Tax Hike*
Income All Taxpayers (Includes ACA Individual Mandate Repeal)
Avg. Hike $
Income All Taxpayers (Includes ACA Individual Mandate Repeal)
Income Range Tot. Change ($1000s) Avg. Tax Change $ Change as a % of Pre- Tax Income
Tot. Taxpayers w/Cut
Income Range Tot. Change ($1000s) Avg. Tax Change $ Change as a % of Pre- Tax Income
Tot. Taxpayers w/Cut
Avg. Cut $Tot. Taxpayers
w/Hike
Taxpayers w/ Tax Cut* Taxpayers w/ Tax Hike*
Avg. Cut $Tot. Taxpayers
w/Hike
Taxpayers w/ Tax Cut* Taxpayers w/ Tax Hike*
Avg. Hike $
Avg. Hike $
Income All Taxpayers (Includes ACA Individual Mandate Repeal)
Income Range Tot. Change ($1000s) Avg. Tax Change $ Change as a % of Pre- Tax Income
Tot. Taxpayers w/Cut
Income Range Tot. Change ($1000s) Avg. Tax Change $ Change as a % of Pre- Tax Income
Tot. Taxpayers w/Cut
Avg. Cut $Tot. Taxpayers
w/Hike
Taxpayers w/ Tax Cut* Taxpayers w/ Tax Hike*
Avg. Cut $Tot. Taxpayers
w/HikeAvg. Hike $
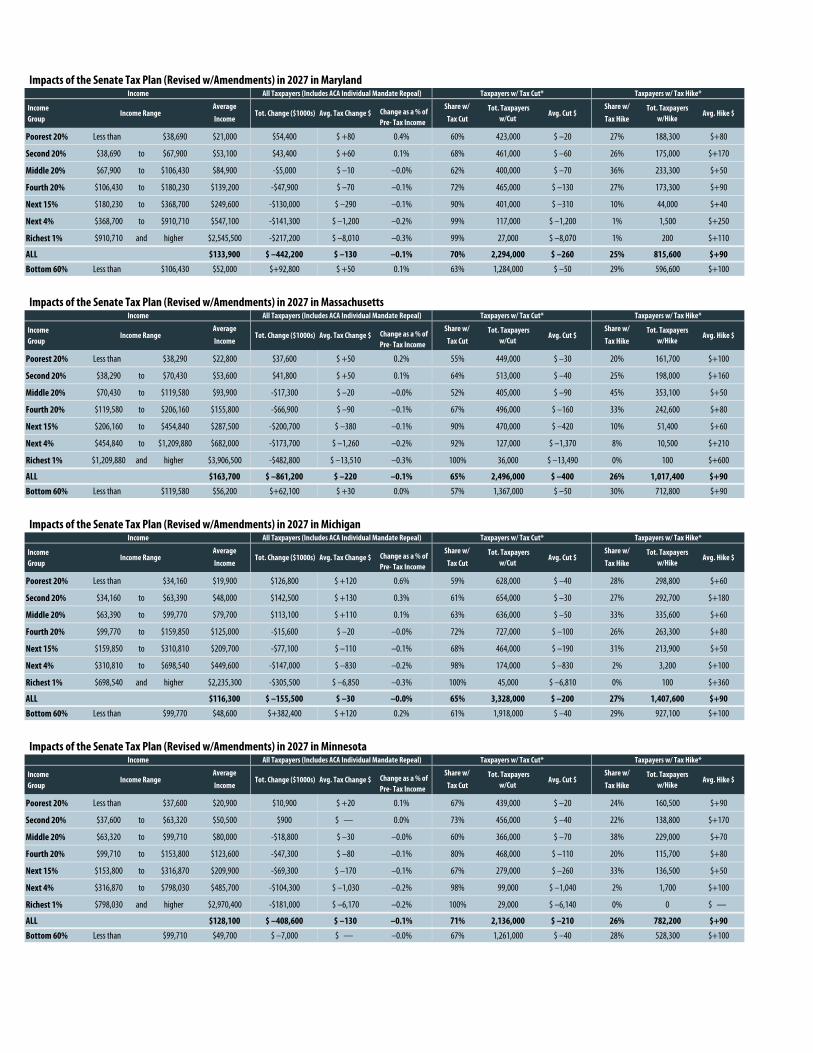
Impacts of the Senate Tax Plan (Revised w/Amendments) in 2027 in Maryland
Income Average Share w/ Share w/
Group Income Tax Cut Tax Hike
Poorest 20% Less than $38,690 $21,000 $54,400 $ +80 0.4% 60% 423,000 $ –20 27% 188,300 $+80
Second 20% $38,690 to $67,900 $53,100 $43,400 $ +60 0.1% 68% 461,000 $ –60 26% 175,000 $+170
Middle 20% $67,900 to $106,430 $84,900 -$5,000 $ –10 –0.0% 62% 400,000 $ –70 36% 233,300 $+50
Fourth 20% $106,430 to $180,230 $139,200 -$47,900 $ –70 –0.1% 72% 465,000 $ –130 27% 173,300 $+90
Next 15% $180,230 to $368,700 $249,600 -$130,000 $ –290 –0.1% 90% 401,000 $ –310 10% 44,000 $+40
Next 4% $368,700 to $910,710 $547,100 -$141,300 $ –1,200 –0.2% 99% 117,000 $ –1,200 1% 1,500 $+250
Richest 1% $910,710 and higher $2,545,500 -$217,200 $ –8,010 –0.3% 99% 27,000 $ –8,070 1% 200 $+110
ALL $133,900 $ –442,200 $ –130 –0.1% 70% 2,294,000 $ –260 25% 815,600 $+90
Bottom 60% Less than $106,430 $52,000 $+92,800 $ +50 0.1% 63% 1,284,000 $ –50 29% 596,600 $+100
Impacts of the Senate Tax Plan (Revised w/Amendments) in 2027 in Massachusetts
Income Average Share w/ Share w/
Group Income Tax Cut Tax Hike
Poorest 20% Less than $38,290 $22,800 $37,600 $ +50 0.2% 55% 449,000 $ –30 20% 161,700 $+100
Second 20% $38,290 to $70,430 $53,600 $41,800 $ +50 0.1% 64% 513,000 $ –40 25% 198,000 $+160
Middle 20% $70,430 to $119,580 $93,900 -$17,300 $ –20 –0.0% 52% 405,000 $ –90 45% 353,100 $+50
Fourth 20% $119,580 to $206,160 $155,800 -$66,900 $ –90 –0.1% 67% 496,000 $ –160 33% 242,600 $+80
Next 15% $206,160 to $454,840 $287,500 -$200,700 $ –380 –0.1% 90% 470,000 $ –420 10% 51,400 $+60
Next 4% $454,840 to $1,209,880 $682,000 -$173,700 $ –1,260 –0.2% 92% 127,000 $ –1,370 8% 10,500 $+210
Richest 1% $1,209,880 and higher $3,906,500 -$482,800 $ –13,510 –0.3% 100% 36,000 $ –13,490 0% 100 $+600
ALL $163,700 $ –861,200 $ –220 –0.1% 65% 2,496,000 $ –400 26% 1,017,400 $+90
Bottom 60% Less than $119,580 $56,200 $+62,100 $ +30 0.0% 57% 1,367,000 $ –50 30% 712,800 $+90
Impacts of the Senate Tax Plan (Revised w/Amendments) in 2027 in Michigan
Income Average Share w/ Share w/
Group Income Tax Cut Tax Hike
Poorest 20% Less than $34,160 $19,900 $126,800 $ +120 0.6% 59% 628,000 $ –40 28% 298,800 $+60
Second 20% $34,160 to $63,390 $48,000 $142,500 $ +130 0.3% 61% 654,000 $ –30 27% 292,700 $+180
Middle 20% $63,390 to $99,770 $79,700 $113,100 $ +110 0.1% 63% 636,000 $ –50 33% 335,600 $+60
Fourth 20% $99,770 to $159,850 $125,000 -$15,600 $ –20 –0.0% 72% 727,000 $ –100 26% 263,300 $+80
Next 15% $159,850 to $310,810 $209,700 -$77,100 $ –110 –0.1% 68% 464,000 $ –190 31% 213,900 $+50
Next 4% $310,810 to $698,540 $449,600 -$147,000 $ –830 –0.2% 98% 174,000 $ –830 2% 3,200 $+100
Richest 1% $698,540 and higher $2,235,300 -$305,500 $ –6,850 –0.3% 100% 45,000 $ –6,810 0% 100 $+360
ALL $116,300 $ –155,500 $ –30 –0.0% 65% 3,328,000 $ –200 27% 1,407,600 $+90
Bottom 60% Less than $99,770 $48,600 $+382,400 $ +120 0.2% 61% 1,918,000 $ –40 29% 927,100 $+100
Impacts of the Senate Tax Plan (Revised w/Amendments) in 2027 in Minnesota
Income Average Share w/ Share w/
Group Income Tax Cut Tax Hike
Poorest 20% Less than $37,600 $20,900 $10,900 $ +20 0.1% 67% 439,000 $ –20 24% 160,500 $+90
Second 20% $37,600 to $63,320 $50,500 $900 $ — 0.0% 73% 456,000 $ –40 22% 138,800 $+170
Middle 20% $63,320 to $99,710 $80,000 -$18,800 $ –30 –0.0% 60% 366,000 $ –70 38% 229,000 $+70
Fourth 20% $99,710 to $153,800 $123,600 -$47,300 $ –80 –0.1% 80% 468,000 $ –110 20% 115,700 $+80
Next 15% $153,800 to $316,870 $209,900 -$69,300 $ –170 –0.1% 67% 279,000 $ –260 33% 136,500 $+50
Next 4% $316,870 to $798,030 $485,700 -$104,300 $ –1,030 –0.2% 98% 99,000 $ –1,040 2% 1,700 $+100
Richest 1% $798,030 and higher $2,970,400 -$181,000 $ –6,170 –0.2% 100% 29,000 $ –6,140 0% 0 $ —
ALL $128,100 $ –408,600 $ –130 –0.1% 71% 2,136,000 $ –210 26% 782,200 $+90
Bottom 60% Less than $99,710 $49,700 $ –7,000 $ — –0.0% 67% 1,261,000 $ –40 28% 528,300 $+100
Income All Taxpayers (Includes ACA Individual Mandate Repeal) Taxpayers w/ Tax Cut* Taxpayers w/ Tax Hike*
Income All Taxpayers (Includes ACA Individual Mandate Repeal)
Avg. Hike $
Income All Taxpayers (Includes ACA Individual Mandate Repeal)
Income Range Tot. Change ($1000s) Avg. Tax Change $ Change as a % of Pre- Tax Income
Tot. Taxpayers w/Cut
Income Range Tot. Change ($1000s) Avg. Tax Change $ Change as a % of Pre- Tax Income
Tot. Taxpayers w/Cut
Avg. Cut $Tot. Taxpayers
w/Hike
Taxpayers w/ Tax Cut* Taxpayers w/ Tax Hike*
Avg. Cut $Tot. Taxpayers
w/Hike
Taxpayers w/ Tax Cut* Taxpayers w/ Tax Hike*
Avg. Hike $
Avg. Hike $
Income All Taxpayers (Includes ACA Individual Mandate Repeal)
Income Range Tot. Change ($1000s) Avg. Tax Change $ Change as a % of Pre- Tax Income
Tot. Taxpayers w/Cut
Income Range Tot. Change ($1000s) Avg. Tax Change $ Change as a % of Pre- Tax Income
Tot. Taxpayers w/Cut
Avg. Cut $Tot. Taxpayers
w/Hike
Taxpayers w/ Tax Cut* Taxpayers w/ Tax Hike*
Avg. Cut $Tot. Taxpayers
w/HikeAvg. Hike $
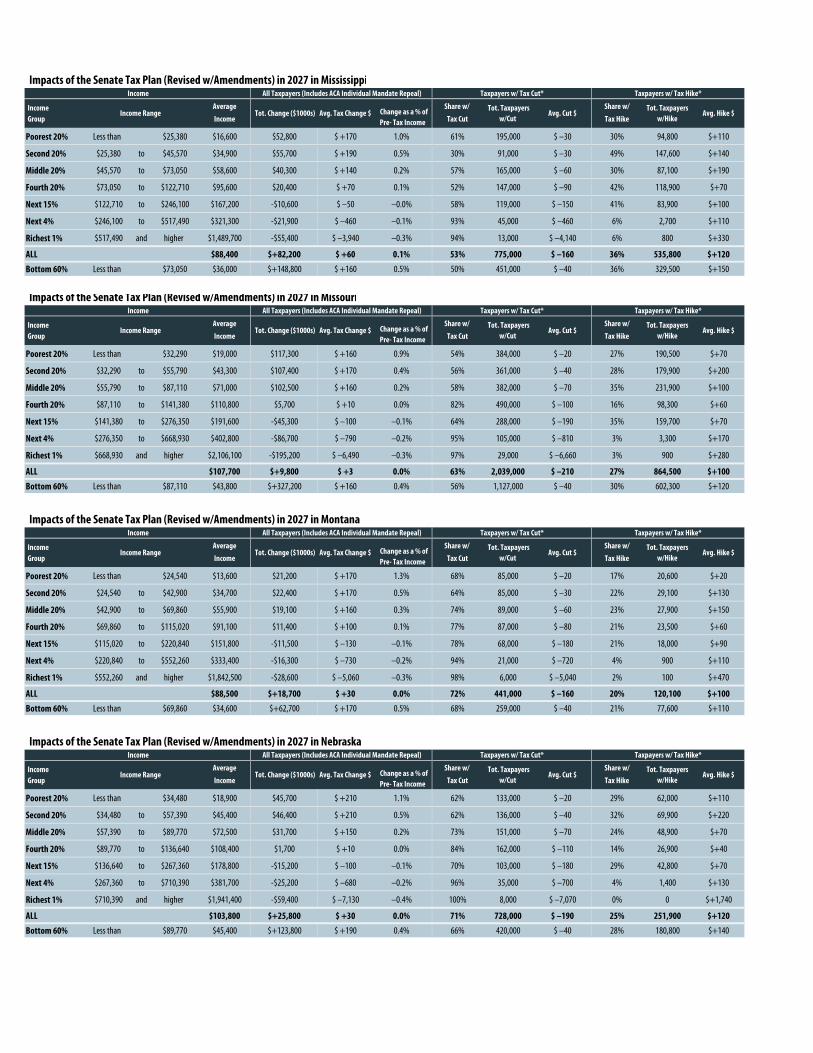
Impacts of the Senate Tax Plan (Revised w/Amendments) in 2027 in Mississippi
Income Average Share w/ Share w/
Group Income Tax Cut Tax Hike
Poorest 20% Less than $25,380 $16,600 $52,800 $ +170 1.0% 61% 195,000 $ –30 30% 94,800 $+110
Second 20% $25,380 to $45,570 $34,900 $55,700 $ +190 0.5% 30% 91,000 $ –30 49% 147,600 $+140
Middle 20% $45,570 to $73,050 $58,600 $40,300 $ +140 0.2% 57% 165,000 $ –60 30% 87,100 $+190
Fourth 20% $73,050 to $122,710 $95,600 $20,400 $ +70 0.1% 52% 147,000 $ –90 42% 118,900 $+70
Next 15% $122,710 to $246,100 $167,200 -$10,600 $ –50 –0.0% 58% 119,000 $ –150 41% 83,900 $+100
Next 4% $246,100 to $517,490 $321,300 -$21,900 $ –460 –0.1% 93% 45,000 $ –460 6% 2,700 $+110
Richest 1% $517,490 and higher $1,489,700 -$55,400 $ –3,940 –0.3% 94% 13,000 $ –4,140 6% 800 $+330
ALL $88,400 $+82,200 $ +60 0.1% 53% 775,000 $ –160 36% 535,800 $+120
Bottom 60% Less than $73,050 $36,000 $+148,800 $ +160 0.5% 50% 451,000 $ –40 36% 329,500 $+150
Impacts of the Senate Tax Plan (Revised w/Amendments) in 2027 in Missouri
Income Average Share w/ Share w/
Group Income Tax Cut Tax Hike
Poorest 20% Less than $32,290 $19,000 $117,300 $ +160 0.9% 54% 384,000 $ –20 27% 190,500 $+70
Second 20% $32,290 to $55,790 $43,300 $107,400 $ +170 0.4% 56% 361,000 $ –40 28% 179,900 $+200
Middle 20% $55,790 to $87,110 $71,000 $102,500 $ +160 0.2% 58% 382,000 $ –70 35% 231,900 $+100
Fourth 20% $87,110 to $141,380 $110,800 $5,700 $ +10 0.0% 82% 490,000 $ –100 16% 98,300 $+60
Next 15% $141,380 to $276,350 $191,600 -$45,300 $ –100 –0.1% 64% 288,000 $ –190 35% 159,700 $+70
Next 4% $276,350 to $668,930 $402,800 -$86,700 $ –790 –0.2% 95% 105,000 $ –810 3% 3,300 $+170
Richest 1% $668,930 and higher $2,106,100 -$195,200 $ –6,490 –0.3% 97% 29,000 $ –6,660 3% 900 $+280
ALL $107,700 $+9,800 $ +3 0.0% 63% 2,039,000 $ –210 27% 864,500 $+100
Bottom 60% Less than $87,110 $43,800 $+327,200 $ +160 0.4% 56% 1,127,000 $ –40 30% 602,300 $+120
Impacts of the Senate Tax Plan (Revised w/Amendments) in 2027 in Montana
Income Average Share w/ Share w/
Group Income Tax Cut Tax Hike
Poorest 20% Less than $24,540 $13,600 $21,200 $ +170 1.3% 68% 85,000 $ –20 17% 20,600 $+20
Second 20% $24,540 to $42,900 $34,700 $22,400 $ +170 0.5% 64% 85,000 $ –30 22% 29,100 $+130
Middle 20% $42,900 to $69,860 $55,900 $19,100 $ +160 0.3% 74% 89,000 $ –60 23% 27,900 $+150
Fourth 20% $69,860 to $115,020 $91,100 $11,400 $ +100 0.1% 77% 87,000 $ –80 21% 23,500 $+60
Next 15% $115,020 to $220,840 $151,800 -$11,500 $ –130 –0.1% 78% 68,000 $ –180 21% 18,000 $+90
Next 4% $220,840 to $552,260 $333,400 -$16,300 $ –730 –0.2% 94% 21,000 $ –720 4% 900 $+110
Richest 1% $552,260 and higher $1,842,500 -$28,600 $ –5,060 –0.3% 98% 6,000 $ –5,040 2% 100 $+470
ALL $88,500 $+18,700 $ +30 0.0% 72% 441,000 $ –160 20% 120,100 $+100
Bottom 60% Less than $69,860 $34,600 $+62,700 $ +170 0.5% 68% 259,000 $ –40 21% 77,600 $+110
Impacts of the Senate Tax Plan (Revised w/Amendments) in 2027 in Nebraska
Income Average Share w/ Share w/
Group Income Tax Cut Tax Hike
Poorest 20% Less than $34,480 $18,900 $45,700 $ +210 1.1% 62% 133,000 $ –20 29% 62,000 $+110
Second 20% $34,480 to $57,390 $45,400 $46,400 $ +210 0.5% 62% 136,000 $ –40 32% 69,900 $+220
Middle 20% $57,390 to $89,770 $72,500 $31,700 $ +150 0.2% 73% 151,000 $ –70 24% 48,900 $+70
Fourth 20% $89,770 to $136,640 $108,400 $1,700 $ +10 0.0% 84% 162,000 $ –110 14% 26,900 $+40
Next 15% $136,640 to $267,360 $178,800 -$15,200 $ –100 –0.1% 70% 103,000 $ –180 29% 42,800 $+70
Next 4% $267,360 to $710,390 $381,700 -$25,200 $ –680 –0.2% 96% 35,000 $ –700 4% 1,400 $+130
Richest 1% $710,390 and higher $1,941,400 -$59,400 $ –7,130 –0.4% 100% 8,000 $ –7,070 0% 0 $+1,740
ALL $103,800 $+25,800 $ +30 0.0% 71% 728,000 $ –190 25% 251,900 $+120
Bottom 60% Less than $89,770 $45,400 $+123,800 $ +190 0.4% 66% 420,000 $ –40 28% 180,800 $+140
Income All Taxpayers (Includes ACA Individual Mandate Repeal) Taxpayers w/ Tax Cut* Taxpayers w/ Tax Hike*
Income All Taxpayers (Includes ACA Individual Mandate Repeal)
Avg. Hike $
Income All Taxpayers (Includes ACA Individual Mandate Repeal)
Income Range Tot. Change ($1000s) Avg. Tax Change $ Change as a % of Pre- Tax Income
Tot. Taxpayers w/Cut
Income Range Tot. Change ($1000s) Avg. Tax Change $ Change as a % of Pre- Tax Income
Tot. Taxpayers w/Cut
Avg. Cut $Tot. Taxpayers
w/Hike
Taxpayers w/ Tax Cut* Taxpayers w/ Tax Hike*
Avg. Cut $Tot. Taxpayers
w/Hike
Taxpayers w/ Tax Cut* Taxpayers w/ Tax Hike*
Avg. Hike $
Avg. Hike $
Income All Taxpayers (Includes ACA Individual Mandate Repeal)
Income Range Tot. Change ($1000s) Avg. Tax Change $ Change as a % of Pre- Tax Income
Tot. Taxpayers w/Cut
Income Range Tot. Change ($1000s) Avg. Tax Change $ Change as a % of Pre- Tax Income
Tot. Taxpayers w/Cut
Avg. Cut $Tot. Taxpayers
w/Hike
Taxpayers w/ Tax Cut* Taxpayers w/ Tax Hike*
Avg. Cut $Tot. Taxpayers
w/HikeAvg. Hike $

Impacts of the Senate Tax Plan (Revised w/Amendments) in 2027 in Nevada
Income Average Share w/ Share w/
Group Income Tax Cut Tax Hike
Poorest 20% Less than $32,660 $21,700 $41,700 $ +110 0.5% 55% 205,000 $ –20 42% 156,400 $+100
Second 20% $32,660 to $59,650 $46,500 $37,500 $ +100 0.2% 66% 247,000 $ –40 32% 121,200 $+180
Middle 20% $59,650 to $96,810 $77,100 $19,300 $ +60 0.1% 60% 194,000 $ –60 39% 124,400 $+80
Fourth 20% $96,810 to $153,770 $120,900 -$20,000 $ –60 –0.0% 70% 243,000 $ –110 29% 98,800 $+80
Next 15% $153,770 to $304,470 $209,800 -$42,600 $ –180 –0.1% 72% 170,000 $ –220 27% 63,900 $+60
Next 4% $304,470 to $889,960 $476,200 -$46,600 $ –730 –0.2% 84% 53,000 $ –860 16% 10,000 $+280
Richest 1% $889,960 and higher $3,843,500 -$206,800 $ –13,440 –0.3% 100% 15,000 $ –13,290 0% 0 $+680
ALL $131,600 $ –214,700 $ –120 –0.1% 65% 1,127,000 $ –300 33% 574,700 $+110
Bottom 60% Less than $96,810 $47,100 $+98,500 $ +90 0.2% 60% 646,000 $ –40 38% 402,000 $+120
Impacts of the Senate Tax Plan (Revised w/Amendments) in 2027 in New Hampshire
Income Average Share w/ Share w/
Group Income Tax Cut Tax Hike
Poorest 20% Less than $48,940 $31,700 $15,700 $ +90 0.3% 71% 117,000 $ –30 25% 41,700 $+100
Second 20% $48,940 to $79,620 $64,900 $13,400 $ +90 0.1% 57% 85,000 $ –50 38% 57,800 $+90
Middle 20% $79,620 to $127,190 $102,700 $2,900 $ +20 0.0% 63% 87,000 $ –80 32% 44,200 $+40
Fourth 20% $127,190 to $204,530 $157,100 -$5,600 $ –40 –0.0% 46% 68,000 $ –170 54% 79,000 $+110
Next 15% $204,530 to $400,480 $268,700 -$29,700 $ –290 –0.1% 82% 85,000 $ –340 17% 17,200 $+70
Next 4% $400,480 to $854,970 $555,700 -$25,900 $ –970 –0.2% 88% 24,000 $ –1,110 12% 3,100 $+350
Richest 1% $854,970 and higher $2,554,300 -$48,700 $ –8,310 –0.3% 93% 5,000 $ –8,820 7% 400 $+210
ALL $147,400 $ –77,000 $ –100 –0.1% 64% 471,000 $ –270 33% 243,400 $+90
Bottom 60% Less than $127,190 $64,200 $+32,000 $ +70 0.1% 64% 289,000 $ –50 32% 143,700 $+80
Impacts of the Senate Tax Plan (Revised w/Amendments) in 2027 in New Jersey
Income Average Share w/ Share w/
Group Income Tax Cut Tax Hike
Poorest 20% Less than $36,900 $21,600 $145,600 $ +150 0.7% 50% 486,000 $ –20 36% 353,200 $+100
Second 20% $36,900 to $68,330 $51,600 $120,200 $ +130 0.2% 62% 591,000 $ –50 28% 270,400 $+160
Middle 20% $68,330 to $111,120 $87,500 $71,900 $ +80 0.1% 61% 583,000 $ –90 36% 340,700 $+50
Fourth 20% $111,120 to $188,540 $145,300 -$75,500 $ –90 –0.1% 66% 569,000 $ –150 34% 290,200 $+80
Next 15% $188,540 to $440,220 $266,700 -$232,100 $ –380 –0.1% 90% 555,000 $ –400 10% 60,800 $+50
Next 4% $440,220 to $1,412,880 $659,300 -$237,500 $ –1,390 –0.2% 98% 167,000 $ –1,400 2% 4,100 $+250
Richest 1% $1,412,880 and higher $3,808,700 -$388,900 $ –8,570 –0.2% 100% 45,000 $ –8,490 0% 0 $ —
ALL $158,300 $ –593,800 $ –130 –0.1% 65% 2,996,000 $ –340 29% 1,319,400 $+90
Bottom 60% Less than $111,120 $53,400 $+337,700 $ +120 0.2% 58% 1,660,000 $ –50 33% 964,300 $+100
Impacts of the Senate Tax Plan (Revised w/Amendments) in 2027 in New Mexico
Income Average Share w/ Share w/
Group Income Tax Cut Tax Hike
Poorest 20% Less than $25,230 $15,400 $16,100 $ +80 0.5% 70% 140,000 $ –20 26% 51,100 $+70
Second 20% $25,230 to $47,730 $37,600 $19,400 $ +100 0.3% 48% 92,000 $ –20 43% 83,000 $+130
Middle 20% $47,730 to $73,570 $59,000 $15,000 $ +80 0.1% 56% 102,000 $ –50 39% 70,300 $+140
Fourth 20% $73,570 to $127,680 $97,200 -$13,500 $ –70 –0.1% 80% 154,000 $ –90 19% 35,900 $+90
Next 15% $127,680 to $249,640 $169,200 -$14,300 $ –110 –0.1% 65% 81,000 $ –160 32% 39,900 $+90
Next 4% $249,640 to $513,930 $331,600 -$17,900 $ –520 –0.2% 91% 31,000 $ –540 8% 2,900 $+70
Richest 1% $513,930 and higher $1,411,100 -$39,300 $ –4,460 –0.3% 100% 9,000 $ –4,360 0% 0 $+500
ALL $90,000 $ –33,800 $ –40 –0.0% 65% 609,000 $ –150 30% 283,100 $+110
Bottom 60% Less than $73,570 $36,700 $+50,500 $ +90 0.2% 58% 334,000 $ –30 36% 204,400 $+120
Income All Taxpayers (Includes ACA Individual Mandate Repeal) Taxpayers w/ Tax Cut* Taxpayers w/ Tax Hike*
Income All Taxpayers (Includes ACA Individual Mandate Repeal)
Avg. Hike $
Income All Taxpayers (Includes ACA Individual Mandate Repeal)
Income Range Tot. Change ($1000s) Avg. Tax Change $ Change as a % of Pre- Tax Income
Tot. Taxpayers w/Cut
Income Range Tot. Change ($1000s) Avg. Tax Change $ Change as a % of Pre- Tax Income
Tot. Taxpayers w/Cut
Avg. Cut $Tot. Taxpayers
w/Hike
Taxpayers w/ Tax Cut* Taxpayers w/ Tax Hike*
Avg. Cut $Tot. Taxpayers
w/Hike
Taxpayers w/ Tax Cut* Taxpayers w/ Tax Hike*
Avg. Hike $
Avg. Hike $
Income All Taxpayers (Includes ACA Individual Mandate Repeal)
Income Range Tot. Change ($1000s) Avg. Tax Change $ Change as a % of Pre- Tax Income
Tot. Taxpayers w/Cut
Income Range Tot. Change ($1000s) Avg. Tax Change $ Change as a % of Pre- Tax Income
Tot. Taxpayers w/Cut
Avg. Cut $Tot. Taxpayers
w/Hike
Taxpayers w/ Tax Cut* Taxpayers w/ Tax Hike*
Avg. Cut $Tot. Taxpayers
w/HikeAvg. Hike $
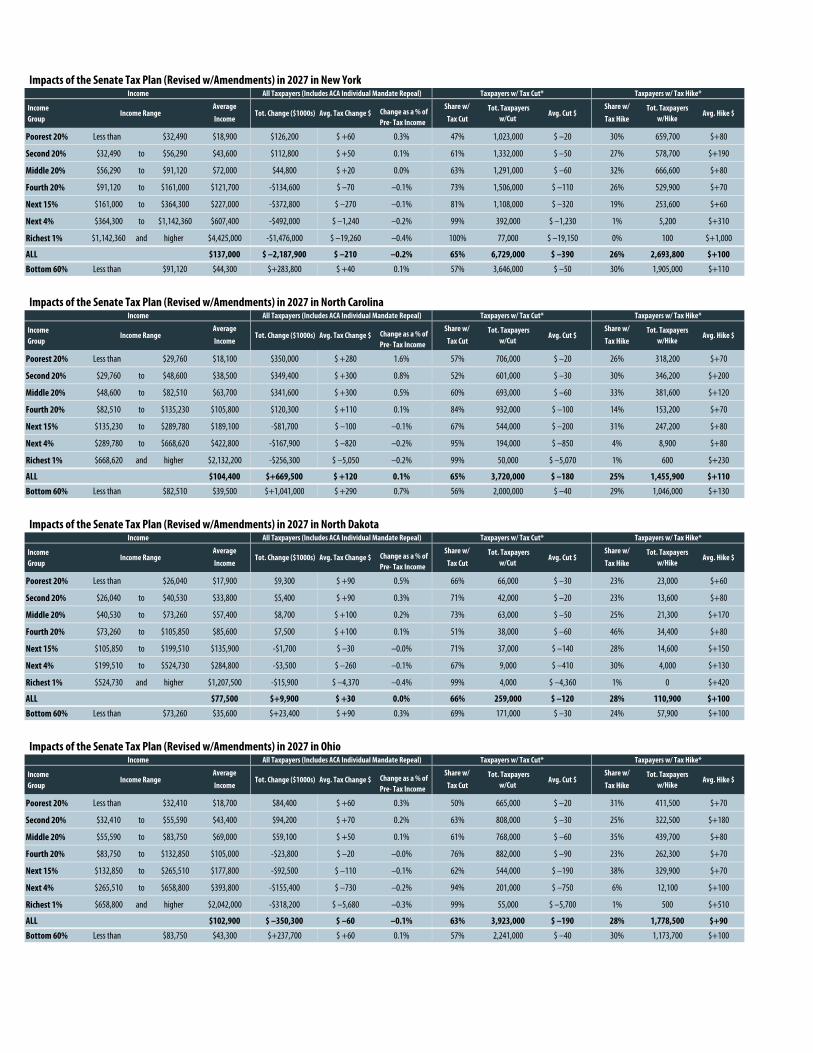
Impacts of the Senate Tax Plan (Revised w/Amendments) in 2027 in New York
Income Average Share w/ Share w/
Group Income Tax Cut Tax Hike
Poorest 20% Less than $32,490 $18,900 $126,200 $ +60 0.3% 47% 1,023,000 $ –20 30% 659,700 $+80
Second 20% $32,490 to $56,290 $43,600 $112,800 $ +50 0.1% 61% 1,332,000 $ –50 27% 578,700 $+190
Middle 20% $56,290 to $91,120 $72,000 $44,800 $ +20 0.0% 63% 1,291,000 $ –60 32% 666,600 $+80
Fourth 20% $91,120 to $161,000 $121,700 -$134,600 $ –70 –0.1% 73% 1,506,000 $ –110 26% 529,900 $+70
Next 15% $161,000 to $364,300 $227,000 -$372,800 $ –270 –0.1% 81% 1,108,000 $ –320 19% 253,600 $+60
Next 4% $364,300 to $1,142,360 $607,400 -$492,000 $ –1,240 –0.2% 99% 392,000 $ –1,230 1% 5,200 $+310
Richest 1% $1,142,360 and higher $4,425,000 -$1,476,000 $ –19,260 –0.4% 100% 77,000 $ –19,150 0% 100 $+1,000
ALL $137,000 $ –2,187,900 $ –210 –0.2% 65% 6,729,000 $ –390 26% 2,693,800 $+100
Bottom 60% Less than $91,120 $44,300 $+283,800 $ +40 0.1% 57% 3,646,000 $ –50 30% 1,905,000 $+110
Impacts of the Senate Tax Plan (Revised w/Amendments) in 2027 in North Carolina
Income Average Share w/ Share w/
Group Income Tax Cut Tax Hike
Poorest 20% Less than $29,760 $18,100 $350,000 $ +280 1.6% 57% 706,000 $ –20 26% 318,200 $+70
Second 20% $29,760 to $48,600 $38,500 $349,400 $ +300 0.8% 52% 601,000 $ –30 30% 346,200 $+200
Middle 20% $48,600 to $82,510 $63,700 $341,600 $ +300 0.5% 60% 693,000 $ –60 33% 381,600 $+120
Fourth 20% $82,510 to $135,230 $105,800 $120,300 $ +110 0.1% 84% 932,000 $ –100 14% 153,200 $+70
Next 15% $135,230 to $289,780 $189,100 -$81,700 $ –100 –0.1% 67% 544,000 $ –200 31% 247,200 $+80
Next 4% $289,780 to $668,620 $422,800 -$167,900 $ –820 –0.2% 95% 194,000 $ –850 4% 8,900 $+80
Richest 1% $668,620 and higher $2,132,200 -$256,300 $ –5,050 –0.2% 99% 50,000 $ –5,070 1% 600 $+230
ALL $104,400 $+669,500 $ +120 0.1% 65% 3,720,000 $ –180 25% 1,455,900 $+110
Bottom 60% Less than $82,510 $39,500 $+1,041,000 $ +290 0.7% 56% 2,000,000 $ –40 29% 1,046,000 $+130
Impacts of the Senate Tax Plan (Revised w/Amendments) in 2027 in North Dakota
Income Average Share w/ Share w/
Group Income Tax Cut Tax Hike
Poorest 20% Less than $26,040 $17,900 $9,300 $ +90 0.5% 66% 66,000 $ –30 23% 23,000 $+60
Second 20% $26,040 to $40,530 $33,800 $5,400 $ +90 0.3% 71% 42,000 $ –20 23% 13,600 $+80
Middle 20% $40,530 to $73,260 $57,400 $8,700 $ +100 0.2% 73% 63,000 $ –50 25% 21,300 $+170
Fourth 20% $73,260 to $105,850 $85,600 $7,500 $ +100 0.1% 51% 38,000 $ –60 46% 34,400 $+80
Next 15% $105,850 to $199,510 $135,900 -$1,700 $ –30 –0.0% 71% 37,000 $ –140 28% 14,600 $+150
Next 4% $199,510 to $524,730 $284,800 -$3,500 $ –260 –0.1% 67% 9,000 $ –410 30% 4,000 $+130
Richest 1% $524,730 and higher $1,207,500 -$15,900 $ –4,370 –0.4% 99% 4,000 $ –4,360 1% 0 $+420
ALL $77,500 $+9,900 $ +30 0.0% 66% 259,000 $ –120 28% 110,900 $+100
Bottom 60% Less than $73,260 $35,600 $+23,400 $ +90 0.3% 69% 171,000 $ –30 24% 57,900 $+100
Impacts of the Senate Tax Plan (Revised w/Amendments) in 2027 in Ohio
Income Average Share w/ Share w/
Group Income Tax Cut Tax Hike
Poorest 20% Less than $32,410 $18,700 $84,400 $ +60 0.3% 50% 665,000 $ –20 31% 411,500 $+70
Second 20% $32,410 to $55,590 $43,400 $94,200 $ +70 0.2% 63% 808,000 $ –30 25% 322,500 $+180
Middle 20% $55,590 to $83,750 $69,000 $59,100 $ +50 0.1% 61% 768,000 $ –60 35% 439,700 $+80
Fourth 20% $83,750 to $132,850 $105,000 -$23,800 $ –20 –0.0% 76% 882,000 $ –90 23% 262,300 $+70
Next 15% $132,850 to $265,510 $177,800 -$92,500 $ –110 –0.1% 62% 544,000 $ –190 38% 329,900 $+70
Next 4% $265,510 to $658,800 $393,800 -$155,400 $ –730 –0.2% 94% 201,000 $ –750 6% 12,100 $+100
Richest 1% $658,800 and higher $2,042,000 -$318,200 $ –5,680 –0.3% 99% 55,000 $ –5,700 1% 500 $+510
ALL $102,900 $ –350,300 $ –60 –0.1% 63% 3,923,000 $ –190 28% 1,778,500 $+90
Bottom 60% Less than $83,750 $43,300 $+237,700 $ +60 0.1% 57% 2,241,000 $ –40 30% 1,173,700 $+100
Income All Taxpayers (Includes ACA Individual Mandate Repeal) Taxpayers w/ Tax Cut* Taxpayers w/ Tax Hike*
Income All Taxpayers (Includes ACA Individual Mandate Repeal)
Avg. Hike $
Income All Taxpayers (Includes ACA Individual Mandate Repeal)
Income Range Tot. Change ($1000s) Avg. Tax Change $ Change as a % of Pre- Tax Income
Tot. Taxpayers w/Cut
Income Range Tot. Change ($1000s) Avg. Tax Change $ Change as a % of Pre- Tax Income
Tot. Taxpayers w/Cut
Avg. Cut $Tot. Taxpayers
w/Hike
Taxpayers w/ Tax Cut* Taxpayers w/ Tax Hike*
Avg. Cut $Tot. Taxpayers
w/Hike
Taxpayers w/ Tax Cut* Taxpayers w/ Tax Hike*
Avg. Hike $
Avg. Hike $
Income All Taxpayers (Includes ACA Individual Mandate Repeal)
Income Range Tot. Change ($1000s) Avg. Tax Change $ Change as a % of Pre- Tax Income
Tot. Taxpayers w/Cut
Income Range Tot. Change ($1000s) Avg. Tax Change $ Change as a % of Pre- Tax Income
Tot. Taxpayers w/Cut
Avg. Cut $Tot. Taxpayers
w/Hike
Taxpayers w/ Tax Cut* Taxpayers w/ Tax Hike*
Avg. Cut $Tot. Taxpayers
w/HikeAvg. Hike $
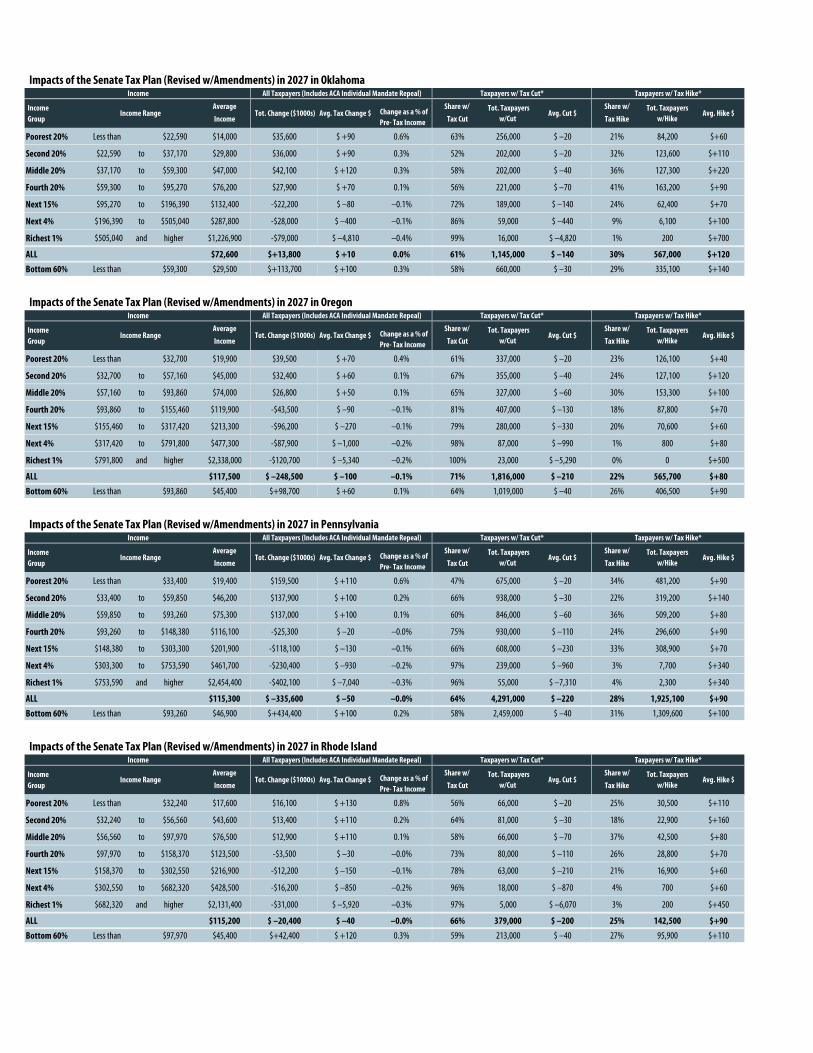
Impacts of the Senate Tax Plan (Revised w/Amendments) in 2027 in Oklahoma
Income Average Share w/ Share w/
Group Income Tax Cut Tax Hike
Poorest 20% Less than $22,590 $14,000 $35,600 $ +90 0.6% 63% 256,000 $ –20 21% 84,200 $+60
Second 20% $22,590 to $37,170 $29,800 $36,000 $ +90 0.3% 52% 202,000 $ –20 32% 123,600 $+110
Middle 20% $37,170 to $59,300 $47,000 $42,100 $ +120 0.3% 58% 202,000 $ –40 36% 127,300 $+220
Fourth 20% $59,300 to $95,270 $76,200 $27,900 $ +70 0.1% 56% 221,000 $ –70 41% 163,200 $+90
Next 15% $95,270 to $196,390 $132,400 -$22,200 $ –80 –0.1% 72% 189,000 $ –140 24% 62,400 $+70
Next 4% $196,390 to $505,040 $287,800 -$28,000 $ –400 –0.1% 86% 59,000 $ –440 9% 6,100 $+100
Richest 1% $505,040 and higher $1,226,900 -$79,000 $ –4,810 –0.4% 99% 16,000 $ –4,820 1% 200 $+700
ALL $72,600 $+13,800 $ +10 0.0% 61% 1,145,000 $ –140 30% 567,000 $+120
Bottom 60% Less than $59,300 $29,500 $+113,700 $ +100 0.3% 58% 660,000 $ –30 29% 335,100 $+140
Impacts of the Senate Tax Plan (Revised w/Amendments) in 2027 in Oregon
Income Average Share w/ Share w/
Group Income Tax Cut Tax Hike
Poorest 20% Less than $32,700 $19,900 $39,500 $ +70 0.4% 61% 337,000 $ –20 23% 126,100 $+40
Second 20% $32,700 to $57,160 $45,000 $32,400 $ +60 0.1% 67% 355,000 $ –40 24% 127,100 $+120
Middle 20% $57,160 to $93,860 $74,000 $26,800 $ +50 0.1% 65% 327,000 $ –60 30% 153,300 $+100
Fourth 20% $93,860 to $155,460 $119,900 -$43,500 $ –90 –0.1% 81% 407,000 $ –130 18% 87,800 $+70
Next 15% $155,460 to $317,420 $213,300 -$96,200 $ –270 –0.1% 79% 280,000 $ –330 20% 70,600 $+60
Next 4% $317,420 to $791,800 $477,300 -$87,900 $ –1,000 –0.2% 98% 87,000 $ –990 1% 800 $+80
Richest 1% $791,800 and higher $2,338,000 -$120,700 $ –5,340 –0.2% 100% 23,000 $ –5,290 0% 0 $+500
ALL $117,500 $ –248,500 $ –100 –0.1% 71% 1,816,000 $ –210 22% 565,700 $+80
Bottom 60% Less than $93,860 $45,400 $+98,700 $ +60 0.1% 64% 1,019,000 $ –40 26% 406,500 $+90
Impacts of the Senate Tax Plan (Revised w/Amendments) in 2027 in Pennsylvania
Income Average Share w/ Share w/
Group Income Tax Cut Tax Hike
Poorest 20% Less than $33,400 $19,400 $159,500 $ +110 0.6% 47% 675,000 $ –20 34% 481,200 $+90
Second 20% $33,400 to $59,850 $46,200 $137,900 $ +100 0.2% 66% 938,000 $ –30 22% 319,200 $+140
Middle 20% $59,850 to $93,260 $75,300 $137,000 $ +100 0.1% 60% 846,000 $ –60 36% 509,200 $+80
Fourth 20% $93,260 to $148,380 $116,100 -$25,300 $ –20 –0.0% 75% 930,000 $ –110 24% 296,600 $+90
Next 15% $148,380 to $303,300 $201,900 -$118,100 $ –130 –0.1% 66% 608,000 $ –230 33% 308,900 $+70
Next 4% $303,300 to $753,590 $461,700 -$230,400 $ –930 –0.2% 97% 239,000 $ –960 3% 7,700 $+340
Richest 1% $753,590 and higher $2,454,400 -$402,100 $ –7,040 –0.3% 96% 55,000 $ –7,310 4% 2,300 $+340
ALL $115,300 $ –335,600 $ –50 –0.0% 64% 4,291,000 $ –220 28% 1,925,100 $+90
Bottom 60% Less than $93,260 $46,900 $+434,400 $ +100 0.2% 58% 2,459,000 $ –40 31% 1,309,600 $+100
Impacts of the Senate Tax Plan (Revised w/Amendments) in 2027 in Rhode Island
Income Average Share w/ Share w/
Group Income Tax Cut Tax Hike
Poorest 20% Less than $32,240 $17,600 $16,100 $ +130 0.8% 56% 66,000 $ –20 25% 30,500 $+110
Second 20% $32,240 to $56,560 $43,600 $13,400 $ +110 0.2% 64% 81,000 $ –30 18% 22,900 $+160
Middle 20% $56,560 to $97,970 $76,500 $12,900 $ +110 0.1% 58% 66,000 $ –70 37% 42,500 $+80
Fourth 20% $97,970 to $158,370 $123,500 -$3,500 $ –30 –0.0% 73% 80,000 $ –110 26% 28,800 $+70
Next 15% $158,370 to $302,550 $216,900 -$12,200 $ –150 –0.1% 78% 63,000 $ –210 21% 16,900 $+60
Next 4% $302,550 to $682,320 $428,500 -$16,200 $ –850 –0.2% 96% 18,000 $ –870 4% 700 $+60
Richest 1% $682,320 and higher $2,131,400 -$31,000 $ –5,920 –0.3% 97% 5,000 $ –6,070 3% 200 $+450
ALL $115,200 $ –20,400 $ –40 –0.0% 66% 379,000 $ –200 25% 142,500 $+90
Bottom 60% Less than $97,970 $45,400 $+42,400 $ +120 0.3% 59% 213,000 $ –40 27% 95,900 $+110
Income All Taxpayers (Includes ACA Individual Mandate Repeal) Taxpayers w/ Tax Cut* Taxpayers w/ Tax Hike*
Income All Taxpayers (Includes ACA Individual Mandate Repeal)
Avg. Hike $
Income All Taxpayers (Includes ACA Individual Mandate Repeal)
Income Range Tot. Change ($1000s) Avg. Tax Change $ Change as a % of Pre- Tax Income
Tot. Taxpayers w/Cut
Income Range Tot. Change ($1000s) Avg. Tax Change $ Change as a % of Pre- Tax Income
Tot. Taxpayers w/Cut
Avg. Cut $Tot. Taxpayers
w/Hike
Taxpayers w/ Tax Cut* Taxpayers w/ Tax Hike*
Avg. Cut $Tot. Taxpayers
w/Hike
Taxpayers w/ Tax Cut* Taxpayers w/ Tax Hike*
Avg. Hike $
Avg. Hike $
Income All Taxpayers (Includes ACA Individual Mandate Repeal)
Income Range Tot. Change ($1000s) Avg. Tax Change $ Change as a % of Pre- Tax Income
Tot. Taxpayers w/Cut
Income Range Tot. Change ($1000s) Avg. Tax Change $ Change as a % of Pre- Tax Income
Tot. Taxpayers w/Cut
Avg. Cut $Tot. Taxpayers
w/Hike
Taxpayers w/ Tax Cut* Taxpayers w/ Tax Hike*
Avg. Cut $Tot. Taxpayers
w/HikeAvg. Hike $
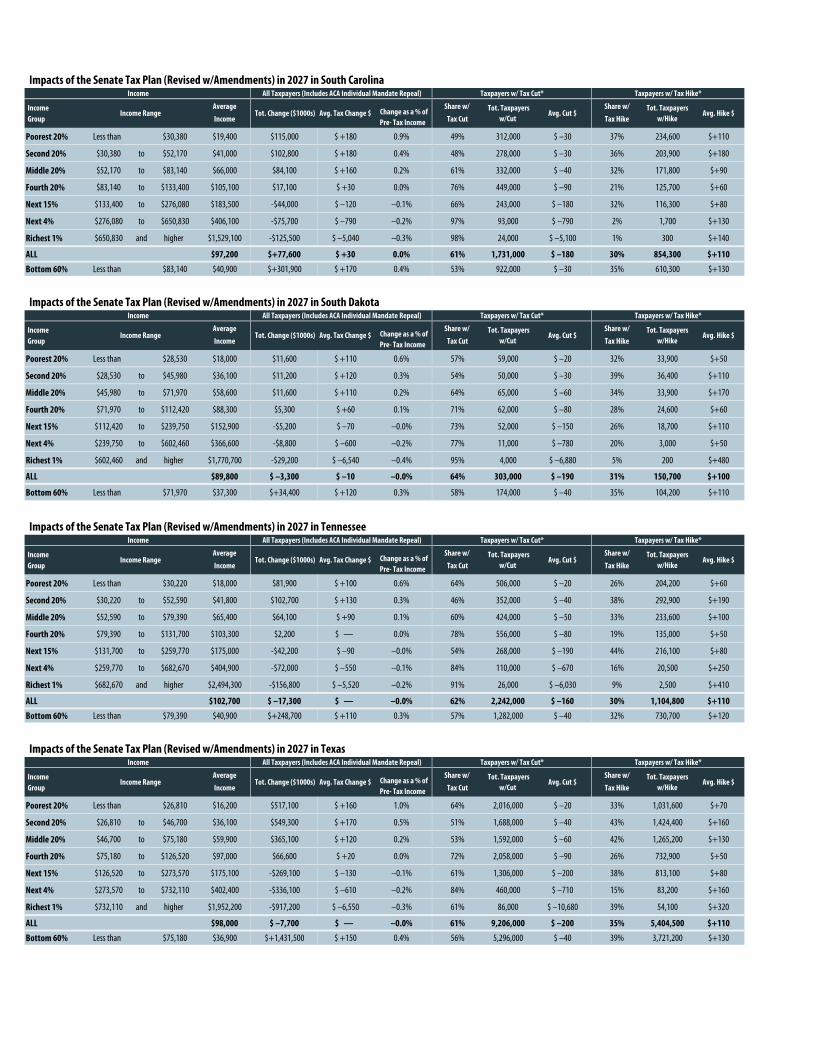
Impacts of the Senate Tax Plan (Revised w/Amendments) in 2027 in South Carolina
Income Average Share w/ Share w/
Group Income Tax Cut Tax Hike
Poorest 20% Less than $30,380 $19,400 $115,000 $ +180 0.9% 49% 312,000 $ –30 37% 234,600 $+110
Second 20% $30,380 to $52,170 $41,000 $102,800 $ +180 0.4% 48% 278,000 $ –30 36% 203,900 $+180
Middle 20% $52,170 to $83,140 $66,000 $84,100 $ +160 0.2% 61% 332,000 $ –40 32% 171,800 $+90
Fourth 20% $83,140 to $133,400 $105,100 $17,100 $ +30 0.0% 76% 449,000 $ –90 21% 125,700 $+60
Next 15% $133,400 to $276,080 $183,500 -$44,000 $ –120 –0.1% 66% 243,000 $ –180 32% 116,300 $+80
Next 4% $276,080 to $650,830 $406,100 -$75,700 $ –790 –0.2% 97% 93,000 $ –790 2% 1,700 $+130
Richest 1% $650,830 and higher $1,529,100 -$125,500 $ –5,040 –0.3% 98% 24,000 $ –5,100 1% 300 $+140
ALL $97,200 $+77,600 $ +30 0.0% 61% 1,731,000 $ –180 30% 854,300 $+110
Bottom 60% Less than $83,140 $40,900 $+301,900 $ +170 0.4% 53% 922,000 $ –30 35% 610,300 $+130
Impacts of the Senate Tax Plan (Revised w/Amendments) in 2027 in South Dakota
Income Average Share w/ Share w/
Group Income Tax Cut Tax Hike
Poorest 20% Less than $28,530 $18,000 $11,600 $ +110 0.6% 57% 59,000 $ –20 32% 33,900 $+50
Second 20% $28,530 to $45,980 $36,100 $11,200 $ +120 0.3% 54% 50,000 $ –30 39% 36,400 $+110
Middle 20% $45,980 to $71,970 $58,600 $11,600 $ +110 0.2% 64% 65,000 $ –60 34% 33,900 $+170
Fourth 20% $71,970 to $112,420 $88,300 $5,300 $ +60 0.1% 71% 62,000 $ –80 28% 24,600 $+60
Next 15% $112,420 to $239,750 $152,900 -$5,200 $ –70 –0.0% 73% 52,000 $ –150 26% 18,700 $+110
Next 4% $239,750 to $602,460 $366,600 -$8,800 $ –600 –0.2% 77% 11,000 $ –780 20% 3,000 $+50
Richest 1% $602,460 and higher $1,770,700 -$29,200 $ –6,540 –0.4% 95% 4,000 $ –6,880 5% 200 $+480
ALL $89,800 $ –3,300 $ –10 –0.0% 64% 303,000 $ –190 31% 150,700 $+100
Bottom 60% Less than $71,970 $37,300 $+34,400 $ +120 0.3% 58% 174,000 $ –40 35% 104,200 $+110
Impacts of the Senate Tax Plan (Revised w/Amendments) in 2027 in Tennessee
Income Average Share w/ Share w/
Group Income Tax Cut Tax Hike
Poorest 20% Less than $30,220 $18,000 $81,900 $ +100 0.6% 64% 506,000 $ –20 26% 204,200 $+60
Second 20% $30,220 to $52,590 $41,800 $102,700 $ +130 0.3% 46% 352,000 $ –40 38% 292,900 $+190
Middle 20% $52,590 to $79,390 $65,400 $64,100 $ +90 0.1% 60% 424,000 $ –50 33% 233,600 $+100
Fourth 20% $79,390 to $131,700 $103,300 $2,200 $ — 0.0% 78% 556,000 $ –80 19% 135,000 $+50
Next 15% $131,700 to $259,770 $175,000 -$42,200 $ –90 –0.0% 54% 268,000 $ –190 44% 216,100 $+80
Next 4% $259,770 to $682,670 $404,900 -$72,000 $ –550 –0.1% 84% 110,000 $ –670 16% 20,500 $+250
Richest 1% $682,670 and higher $2,494,300 -$156,800 $ –5,520 –0.2% 91% 26,000 $ –6,030 9% 2,500 $+410
ALL $102,700 $ –17,300 $ — –0.0% 62% 2,242,000 $ –160 30% 1,104,800 $+110
Bottom 60% Less than $79,390 $40,900 $+248,700 $ +110 0.3% 57% 1,282,000 $ –40 32% 730,700 $+120
Impacts of the Senate Tax Plan (Revised w/Amendments) in 2027 in Texas
Income Average Share w/ Share w/
Group Income Tax Cut Tax Hike
Poorest 20% Less than $26,810 $16,200 $517,100 $ +160 1.0% 64% 2,016,000 $ –20 33% 1,031,600 $+70
Second 20% $26,810 to $46,700 $36,100 $549,300 $ +170 0.5% 51% 1,688,000 $ –40 43% 1,424,400 $+160
Middle 20% $46,700 to $75,180 $59,900 $365,100 $ +120 0.2% 53% 1,592,000 $ –60 42% 1,265,200 $+130
Fourth 20% $75,180 to $126,520 $97,000 $66,600 $ +20 0.0% 72% 2,058,000 $ –90 26% 732,900 $+50
Next 15% $126,520 to $273,570 $175,100 -$269,100 $ –130 –0.1% 61% 1,306,000 $ –200 38% 813,100 $+80
Next 4% $273,570 to $732,110 $402,400 -$336,100 $ –610 –0.2% 84% 460,000 $ –710 15% 83,200 $+160
Richest 1% $732,110 and higher $1,952,200 -$917,200 $ –6,550 –0.3% 61% 86,000 $ –10,680 39% 54,100 $+320
ALL $98,000 $ –7,700 $ — –0.0% 61% 9,206,000 $ –200 35% 5,404,500 $+110
Bottom 60% Less than $75,180 $36,900 $+1,431,500 $ +150 0.4% 56% 5,296,000 $ –40 39% 3,721,200 $+130
Income All Taxpayers (Includes ACA Individual Mandate Repeal) Taxpayers w/ Tax Cut* Taxpayers w/ Tax Hike*
Income All Taxpayers (Includes ACA Individual Mandate Repeal)
Avg. Hike $
Income All Taxpayers (Includes ACA Individual Mandate Repeal)
Income Range Tot. Change ($1000s) Avg. Tax Change $ Change as a % of Pre- Tax Income
Tot. Taxpayers w/Cut
Income Range Tot. Change ($1000s) Avg. Tax Change $ Change as a % of Pre- Tax Income
Tot. Taxpayers w/Cut
Avg. Cut $Tot. Taxpayers
w/Hike
Taxpayers w/ Tax Cut* Taxpayers w/ Tax Hike*
Avg. Cut $Tot. Taxpayers
w/Hike
Taxpayers w/ Tax Cut* Taxpayers w/ Tax Hike*
Avg. Hike $
Avg. Hike $
Income All Taxpayers (Includes ACA Individual Mandate Repeal)
Income Range Tot. Change ($1000s) Avg. Tax Change $ Change as a % of Pre- Tax Income
Tot. Taxpayers w/Cut
Income Range Tot. Change ($1000s) Avg. Tax Change $ Change as a % of Pre- Tax Income
Tot. Taxpayers w/Cut
Avg. Cut $Tot. Taxpayers
w/Hike
Taxpayers w/ Tax Cut* Taxpayers w/ Tax Hike*
Avg. Cut $Tot. Taxpayers
w/HikeAvg. Hike $
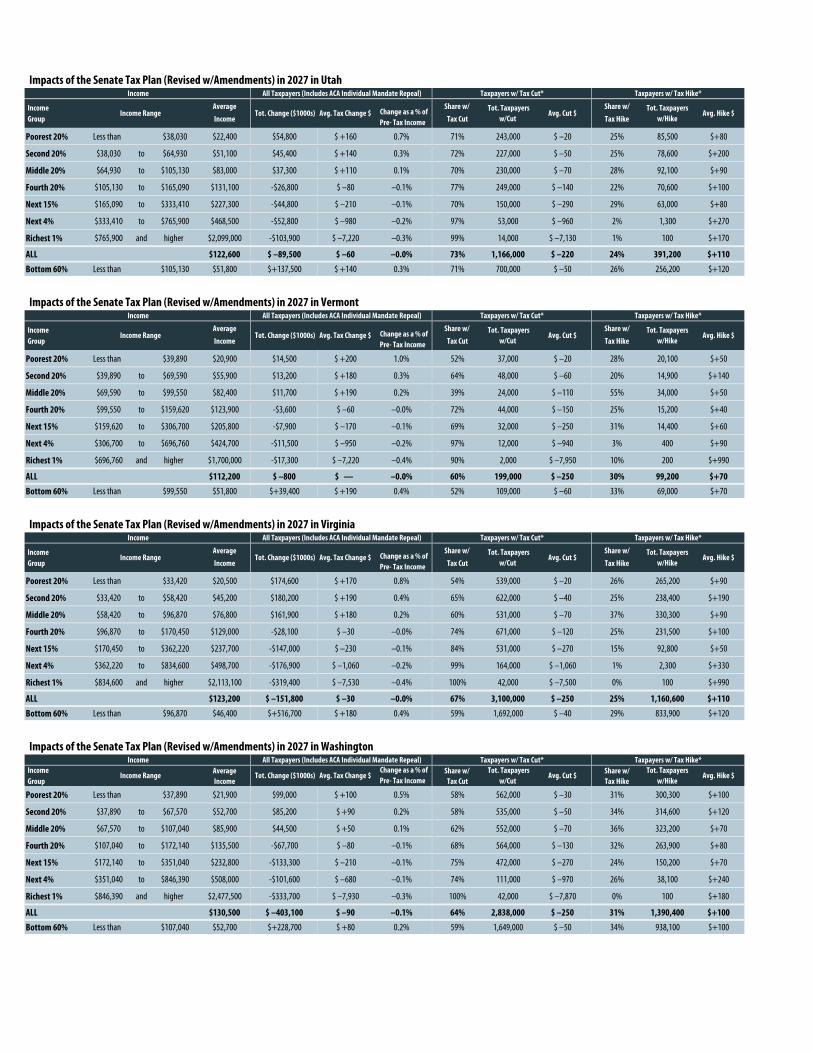
Impacts of the Senate Tax Plan (Revised w/Amendments) in 2027 in Utah
Income Average Share w/ Share w/
Group Income Tax Cut Tax Hike
Poorest 20% Less than $38,030 $22,400 $54,800 $ +160 0.7% 71% 243,000 $ –20 25% 85,500 $+80
Second 20% $38,030 to $64,930 $51,100 $45,400 $ +140 0.3% 72% 227,000 $ –50 25% 78,600 $+200
Middle 20% $64,930 to $105,130 $83,000 $37,300 $ +110 0.1% 70% 230,000 $ –70 28% 92,100 $+90
Fourth 20% $105,130 to $165,090 $131,100 -$26,800 $ –80 –0.1% 77% 249,000 $ –140 22% 70,600 $+100
Next 15% $165,090 to $333,410 $227,300 -$44,800 $ –210 –0.1% 70% 150,000 $ –290 29% 63,000 $+80
Next 4% $333,410 to $765,900 $468,500 -$52,800 $ –980 –0.2% 97% 53,000 $ –960 2% 1,300 $+270
Richest 1% $765,900 and higher $2,099,000 -$103,900 $ –7,220 –0.3% 99% 14,000 $ –7,130 1% 100 $+170
ALL $122,600 $ –89,500 $ –60 –0.0% 73% 1,166,000 $ –220 24% 391,200 $+110
Bottom 60% Less than $105,130 $51,800 $+137,500 $ +140 0.3% 71% 700,000 $ –50 26% 256,200 $+120
Impacts of the Senate Tax Plan (Revised w/Amendments) in 2027 in Vermont
Income Average Share w/ Share w/
Group Income Tax Cut Tax Hike
Poorest 20% Less than $39,890 $20,900 $14,500 $ +200 1.0% 52% 37,000 $ –20 28% 20,100 $+50
Second 20% $39,890 to $69,590 $55,900 $13,200 $ +180 0.3% 64% 48,000 $ –60 20% 14,900 $+140
Middle 20% $69,590 to $99,550 $82,400 $11,700 $ +190 0.2% 39% 24,000 $ –110 55% 34,000 $+50
Fourth 20% $99,550 to $159,620 $123,900 -$3,600 $ –60 –0.0% 72% 44,000 $ –150 25% 15,200 $+40
Next 15% $159,620 to $306,700 $205,800 -$7,900 $ –170 –0.1% 69% 32,000 $ –250 31% 14,400 $+60
Next 4% $306,700 to $696,760 $424,700 -$11,500 $ –950 –0.2% 97% 12,000 $ –940 3% 400 $+90
Richest 1% $696,760 and higher $1,700,000 -$17,300 $ –7,220 –0.4% 90% 2,000 $ –7,950 10% 200 $+990
ALL $112,200 $ –800 $ — –0.0% 60% 199,000 $ –250 30% 99,200 $+70
Bottom 60% Less than $99,550 $51,800 $+39,400 $ +190 0.4% 52% 109,000 $ –60 33% 69,000 $+70
Impacts of the Senate Tax Plan (Revised w/Amendments) in 2027 in Virginia
Income Average Share w/ Share w/
Group Income Tax Cut Tax Hike
Poorest 20% Less than $33,420 $20,500 $174,600 $ +170 0.8% 54% 539,000 $ –20 26% 265,200 $+90
Second 20% $33,420 to $58,420 $45,200 $180,200 $ +190 0.4% 65% 622,000 $ –40 25% 238,400 $+190
Middle 20% $58,420 to $96,870 $76,800 $161,900 $ +180 0.2% 60% 531,000 $ –70 37% 330,300 $+90
Fourth 20% $96,870 to $170,450 $129,000 -$28,100 $ –30 –0.0% 74% 671,000 $ –120 25% 231,500 $+100
Next 15% $170,450 to $362,220 $237,700 -$147,000 $ –230 –0.1% 84% 531,000 $ –270 15% 92,800 $+50
Next 4% $362,220 to $834,600 $498,700 -$176,900 $ –1,060 –0.2% 99% 164,000 $ –1,060 1% 2,300 $+330
Richest 1% $834,600 and higher $2,113,100 -$319,400 $ –7,530 –0.4% 100% 42,000 $ –7,500 0% 100 $+990
ALL $123,200 $ –151,800 $ –30 –0.0% 67% 3,100,000 $ –250 25% 1,160,600 $+110
Bottom 60% Less than $96,870 $46,400 $+516,700 $ +180 0.4% 59% 1,692,000 $ –40 29% 833,900 $+120
Impacts of the Senate Tax Plan (Revised w/Amendments) in 2027 in Washington
Income Average Share w/ Share w/Group Income Tax Cut Tax Hike
Poorest 20% Less than $37,890 $21,900 $99,000 $ +100 0.5% 58% 562,000 $ –30 31% 300,300 $+100
Second 20% $37,890 to $67,570 $52,700 $85,200 $ +90 0.2% 58% 535,000 $ –50 34% 314,600 $+120
Middle 20% $67,570 to $107,040 $85,900 $44,500 $ +50 0.1% 62% 552,000 $ –70 36% 323,200 $+70
Fourth 20% $107,040 to $172,140 $135,500 -$67,700 $ –80 –0.1% 68% 564,000 $ –130 32% 263,900 $+80
Next 15% $172,140 to $351,040 $232,800 -$133,300 $ –210 –0.1% 75% 472,000 $ –270 24% 150,200 $+70
Next 4% $351,040 to $846,390 $508,000 -$101,600 $ –680 –0.1% 74% 111,000 $ –970 26% 38,100 $+240
Richest 1% $846,390 and higher $2,477,500 -$333,700 $ –7,930 –0.3% 100% 42,000 $ –7,870 0% 100 $+180
ALL $130,500 $ –403,100 $ –90 –0.1% 64% 2,838,000 $ –250 31% 1,390,400 $+100
Bottom 60% Less than $107,040 $52,700 $+228,700 $ +80 0.2% 59% 1,649,000 $ –50 34% 938,100 $+100
Income All Taxpayers (Includes ACA Individual Mandate Repeal) Taxpayers w/ Tax Cut* Taxpayers w/ Tax Hike*
Income All Taxpayers (Includes ACA Individual Mandate Repeal)
Avg. Hike $
Income All Taxpayers (Includes ACA Individual Mandate Repeal)
Income Range Tot. Change ($1000s) Avg. Tax Change $ Change as a % of Pre- Tax Income
Tot. Taxpayers w/Cut
Income Range Tot. Change ($1000s) Avg. Tax Change $ Change as a % of Pre- Tax Income
Tot. Taxpayers w/Cut
Avg. Cut $Tot. Taxpayers
w/Hike
Taxpayers w/ Tax Cut* Taxpayers w/ Tax Hike*
Avg. Cut $Tot. Taxpayers
w/Hike
Taxpayers w/ Tax Cut* Taxpayers w/ Tax Hike*
Avg. Hike $
Avg. Hike $
Income All Taxpayers (Includes ACA Individual Mandate Repeal)
Income Range Tot. Change ($1000s) Avg. Tax Change $ Change as a % of Pre- Tax Income
Tot. Taxpayers w/Cut
Income Range Tot. Change ($1000s) Avg. Tax Change $ Change as a % of Pre- Tax Income
Tot. Taxpayers w/Cut
Avg. Cut $Tot. Taxpayers
w/Hike
Taxpayers w/ Tax Cut* Taxpayers w/ Tax Hike*
Avg. Cut $Tot. Taxpayers
w/HikeAvg. Hike $
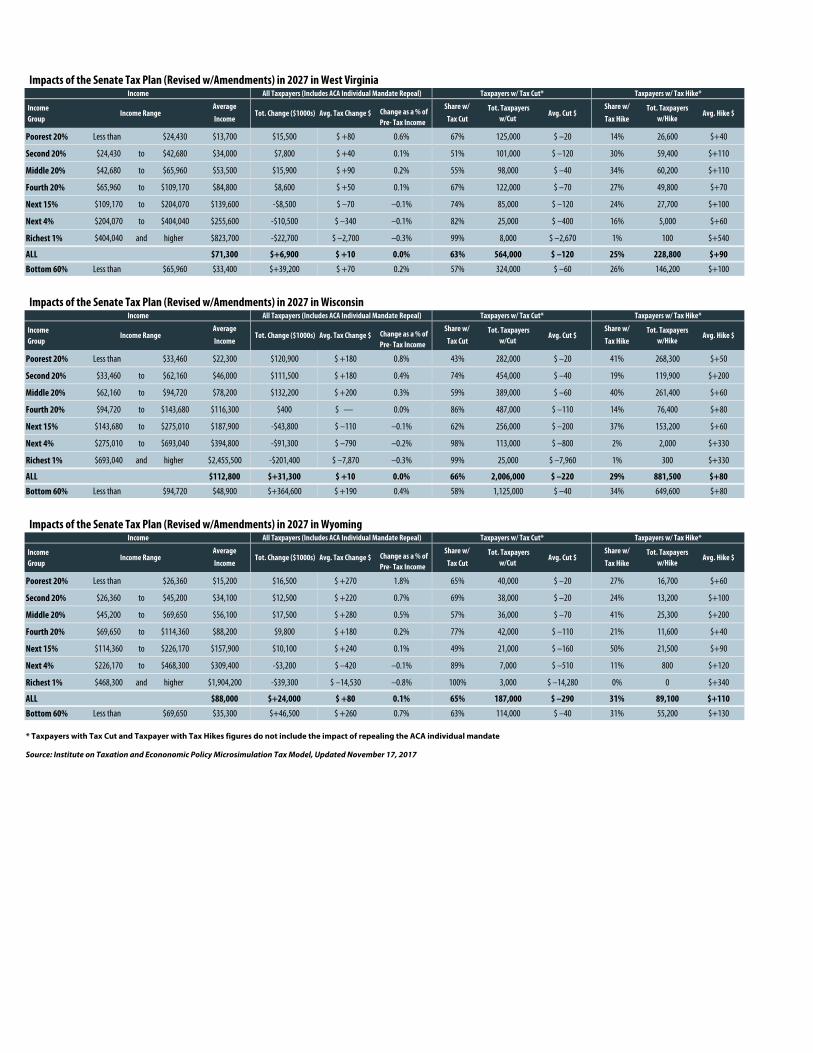
Impacts of the Senate Tax Plan (Revised w/Amendments) in 2027 in West Virginia
Income Average Share w/ Share w/
Group Income Tax Cut Tax Hike
Poorest 20% Less than $24,430 $13,700 $15,500 $ +80 0.6% 67% 125,000 $ –20 14% 26,600 $+40
Second 20% $24,430 to $42,680 $34,000 $7,800 $ +40 0.1% 51% 101,000 $ –120 30% 59,400 $+110
Middle 20% $42,680 to $65,960 $53,500 $15,900 $ +90 0.2% 55% 98,000 $ –40 34% 60,200 $+110
Fourth 20% $65,960 to $109,170 $84,800 $8,600 $ +50 0.1% 67% 122,000 $ –70 27% 49,800 $+70
Next 15% $109,170 to $204,070 $139,600 -$8,500 $ –70 –0.1% 74% 85,000 $ –120 24% 27,700 $+100
Next 4% $204,070 to $404,040 $255,600 -$10,500 $ –340 –0.1% 82% 25,000 $ –400 16% 5,000 $+60
Richest 1% $404,040 and higher $823,700 -$22,700 $ –2,700 –0.3% 99% 8,000 $ –2,670 1% 100 $+540
ALL $71,300 $+6,900 $ +10 0.0% 63% 564,000 $ –120 25% 228,800 $+90
Bottom 60% Less than $65,960 $33,400 $+39,200 $ +70 0.2% 57% 324,000 $ –60 26% 146,200 $+100
Impacts of the Senate Tax Plan (Revised w/Amendments) in 2027 in Wisconsin
Income Average Share w/ Share w/
Group Income Tax Cut Tax Hike
Poorest 20% Less than $33,460 $22,300 $120,900 $ +180 0.8% 43% 282,000 $ –20 41% 268,300 $+50
Second 20% $33,460 to $62,160 $46,000 $111,500 $ +180 0.4% 74% 454,000 $ –40 19% 119,900 $+200
Middle 20% $62,160 to $94,720 $78,200 $132,200 $ +200 0.3% 59% 389,000 $ –60 40% 261,400 $+60
Fourth 20% $94,720 to $143,680 $116,300 $400 $ — 0.0% 86% 487,000 $ –110 14% 76,400 $+80
Next 15% $143,680 to $275,010 $187,900 -$43,800 $ –110 –0.1% 62% 256,000 $ –200 37% 153,200 $+60
Next 4% $275,010 to $693,040 $394,800 -$91,300 $ –790 –0.2% 98% 113,000 $ –800 2% 2,000 $+330
Richest 1% $693,040 and higher $2,455,500 -$201,400 $ –7,870 –0.3% 99% 25,000 $ –7,960 1% 300 $+330
ALL $112,800 $+31,300 $ +10 0.0% 66% 2,006,000 $ –220 29% 881,500 $+80
Bottom 60% Less than $94,720 $48,900 $+364,600 $ +190 0.4% 58% 1,125,000 $ –40 34% 649,600 $+80
Impacts of the Senate Tax Plan (Revised w/Amendments) in 2027 in Wyoming
Income Average Share w/ Share w/
Group Income Tax Cut Tax Hike
Poorest 20% Less than $26,360 $15,200 $16,500 $ +270 1.8% 65% 40,000 $ –20 27% 16,700 $+60
Second 20% $26,360 to $45,200 $34,100 $12,500 $ +220 0.7% 69% 38,000 $ –20 24% 13,200 $+100
Middle 20% $45,200 to $69,650 $56,100 $17,500 $ +280 0.5% 57% 36,000 $ –70 41% 25,300 $+200
Fourth 20% $69,650 to $114,360 $88,200 $9,800 $ +180 0.2% 77% 42,000 $ –110 21% 11,600 $+40
Next 15% $114,360 to $226,170 $157,900 $10,100 $ +240 0.1% 49% 21,000 $ –160 50% 21,500 $+90
Next 4% $226,170 to $468,300 $309,400 -$3,200 $ –420 –0.1% 89% 7,000 $ –510 11% 800 $+120
Richest 1% $468,300 and higher $1,904,200 -$39,300 $ –14,530 –0.8% 100% 3,000 $ –14,280 0% 0 $+340
ALL $88,000 $+24,000 $ +80 0.1% 65% 187,000 $ –290 31% 89,100 $+110
Bottom 60% Less than $69,650 $35,300 $+46,500 $ +260 0.7% 63% 114,000 $ –40 31% 55,200 $+130
* Taxpayers with Tax Cut and Taxpayer with Tax Hikes figures do not include the impact of repealing the ACA individual mandate
Source: Institute on Taxation and Econonomic Policy Microsimulation Tax Model, Updated November 17, 2017
Tot. Taxpayers w/Cut
Income Range Tot. Change ($1000s) Avg. Tax Change $ Change as a % of Pre- Tax Income
Tot. Taxpayers w/Cut
Income All Taxpayers (Includes ACA Individual Mandate Repeal)
Income Range Tot. Change ($1000s) Avg. Tax Change $ Change as a % of Pre- Tax Income
Tot. Taxpayers w/Cut
Avg. Cut $
Avg. Hike $
Income All Taxpayers (Includes ACA Individual Mandate Repeal)
Tot. Taxpayers w/Hike
Avg. Hike $
Income All Taxpayers (Includes ACA Individual Mandate Repeal)
Income Range Tot. Change ($1000s) Avg. Tax Change $ Change as a % of Pre- Tax Income
Tot. Taxpayers w/Hike
Taxpayers w/ Tax Cut* Taxpayers w/ Tax Hike*
Avg. Cut $Tot. Taxpayers
w/Hike
Taxpayers w/ Tax Cut* Taxpayers w/ Tax Hike*
Taxpayers w/ Tax Cut* Taxpayers w/ Tax Hike*
Avg. Hike $Avg. Cut $