Embed Size (px)
Citation preview

November 27, 2012Washington, D.C.
Using Online Evidence Based Needs Assessments To Plan, To Fund and To Actuate Care and Prevention Services
Facilitated by:
Jesse Thomas, RDE Systems, Patterson, New Jersey
Tim Sullivan, Hennepin County Human Services and Public Health Department
Claire Husted, Health Planning & Grant Writing Consultant
Michael McNeill, Wake County Human Services, Raleigh, North Carolina
Slides will be available at: USCA.e2community.com
Disclosures
This continuing education activity is managed and accredited by Professional Education Service Group. The information presented in this activity represents the opinion of the author(s) or faculty. Neither PESG, nor any accrediting organization endorses any commercial products displayed or mentioned in conjunction with this activity.
Commercial Support was not received for this activity.
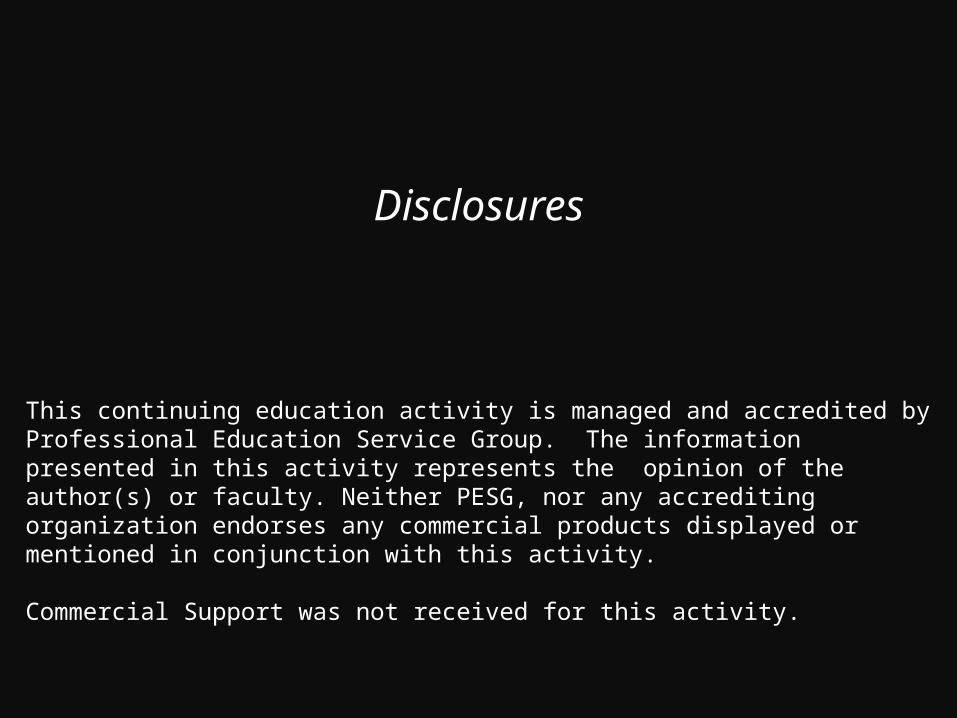
Disclosures
Jesse Thomas, Employee, RDE Systems, Inc.
Claire Hustead, Self-employed consultant.
Tim Sullivan has no financial interest or relationship to disclose.
Michael McNeill has no financial interest or relationship to disclose.
Professional Education Services Group staff have no financial interest or relationships to disclose.

Learning Objectives
At the conclusion of this activity, the participant will be able to:
1. see how a paradigm of improved data collection strengthens grant applications, provides answers to community planning bodies, illuminates counterintuitive insights important for the description of barriers and helps positively to influence health planning and policy recommendations.
2. Describe both how to adopt and to adapt strategies and tools to deliver web-based technology to the community and planning bodies while overcoming digital divides and perceptions of digital divides.
3. understand the challenges and benefits of an innovative program for web-based data collection and build upon lessons learned by modifying tools used by other programs.

Obtaining CME / CE Credit
If you would like to receive continuing education credit for this activity, please visit:
http://www.pesgce.com/RyanWhite2012
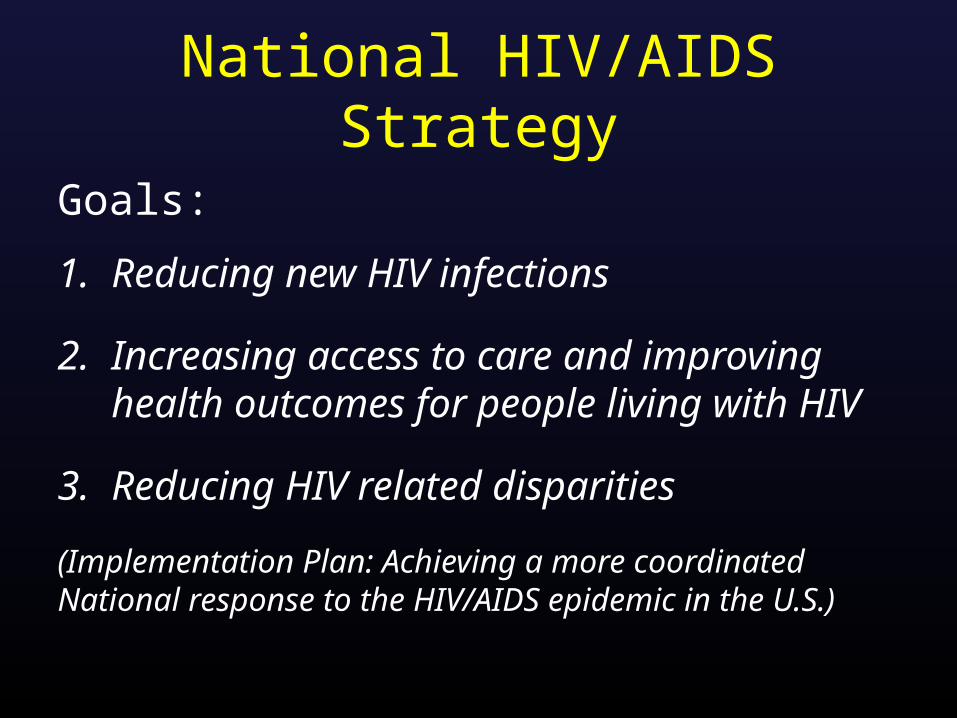
National HIV/AIDS Strategy
Goals:
1. Reducing new HIV infections
2. Increasing access to care and improving health outcomes for people living with HIV
3. Reducing HIV related disparities
(Implementation Plan: Achieving a more coordinated National response to the HIV/AIDS epidemic in the U.S.)
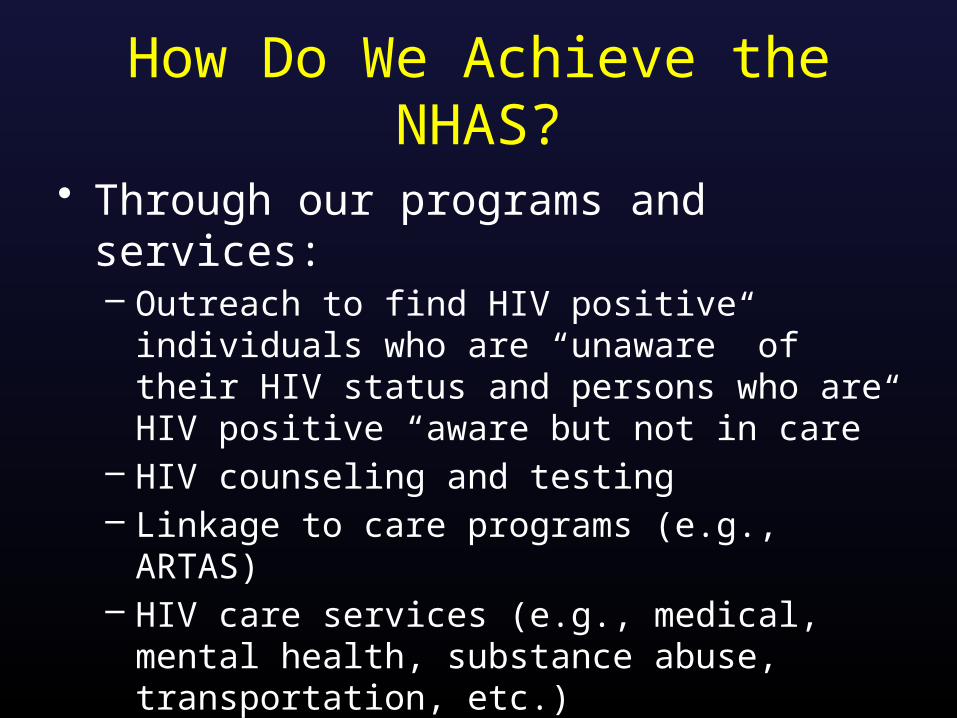
How Do We Achieve the NHAS?
• Through our programs and services:– Outreach to find HIV positive individuals who are
“unaware” of their HIV status and persons who are HIV positive “aware but not in care”
– HIV counseling and testing – Linkage to care programs (e.g., ARTAS)– HIV care services (e.g., medical, mental health,
substance abuse, transportation, etc.)– Treatment adherence and retention programs
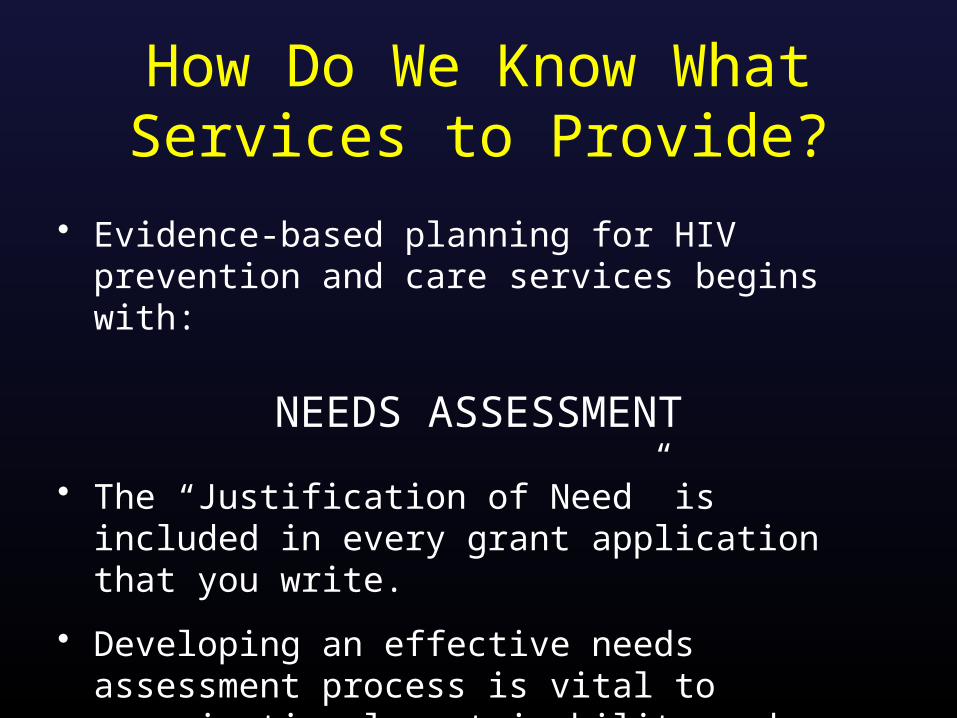
How Do We Know What Services to Provide?
• Evidence-based planning for HIV prevention and care services begins with:
NEEDS ASSESSMENT
• The “Justification of Need” is included in every grant application that you write.
• Developing an effective needs assessment process is vital to organizational sustainability and delivering high quality, effective programs.
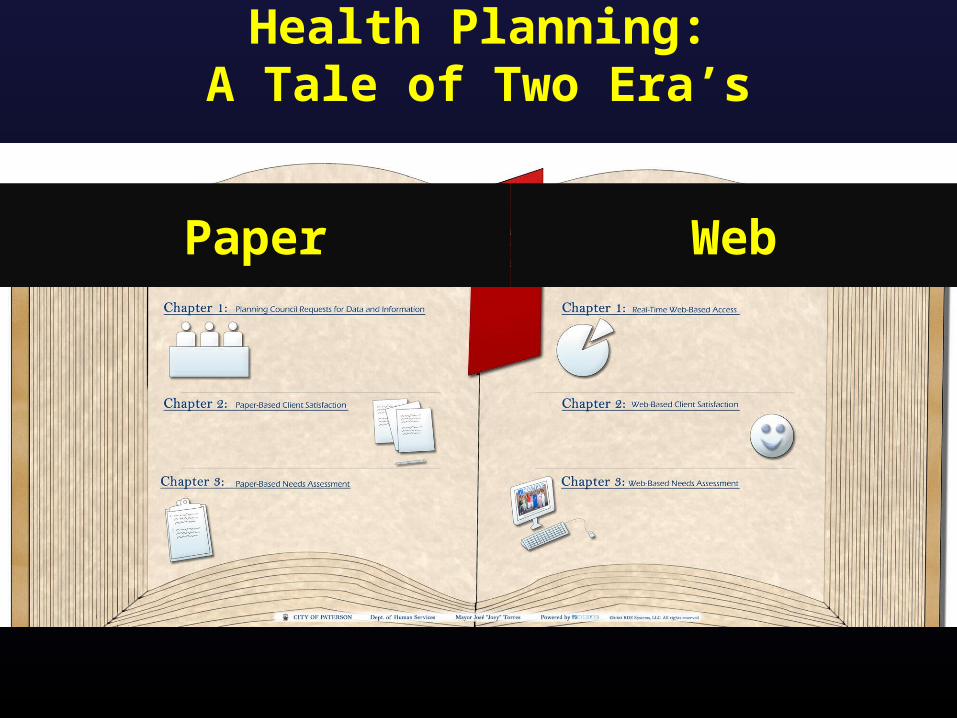
Health Planning:A Tale of Two Era’s
Paper Web
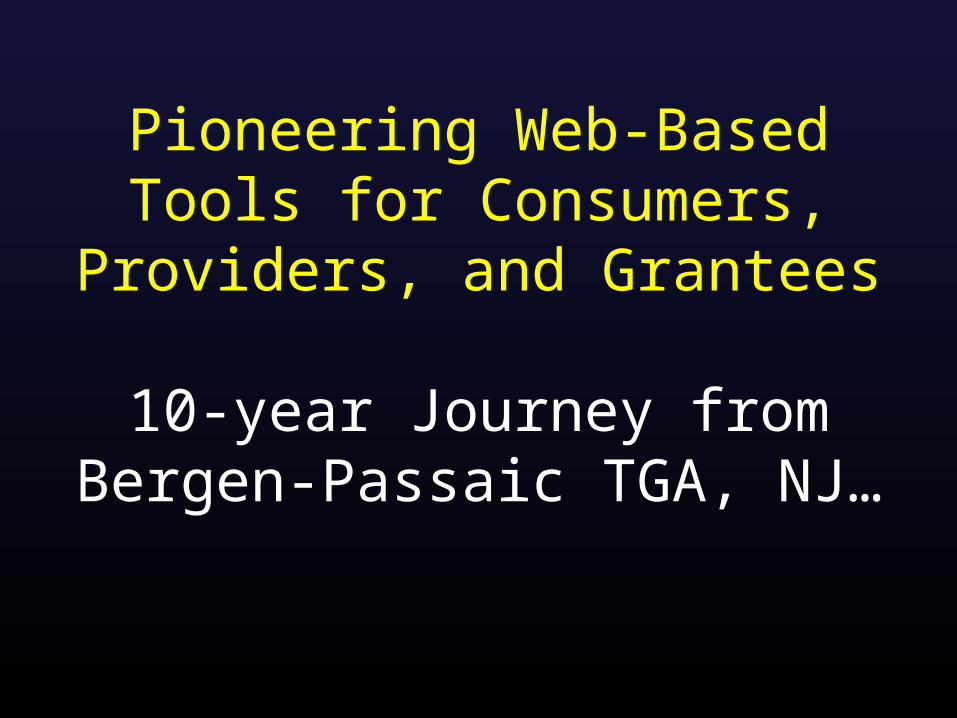
Pioneering Web-Based Tools for Consumers, Providers, and
Grantees
10-year Journey from Bergen-Passaic TGA, NJ…

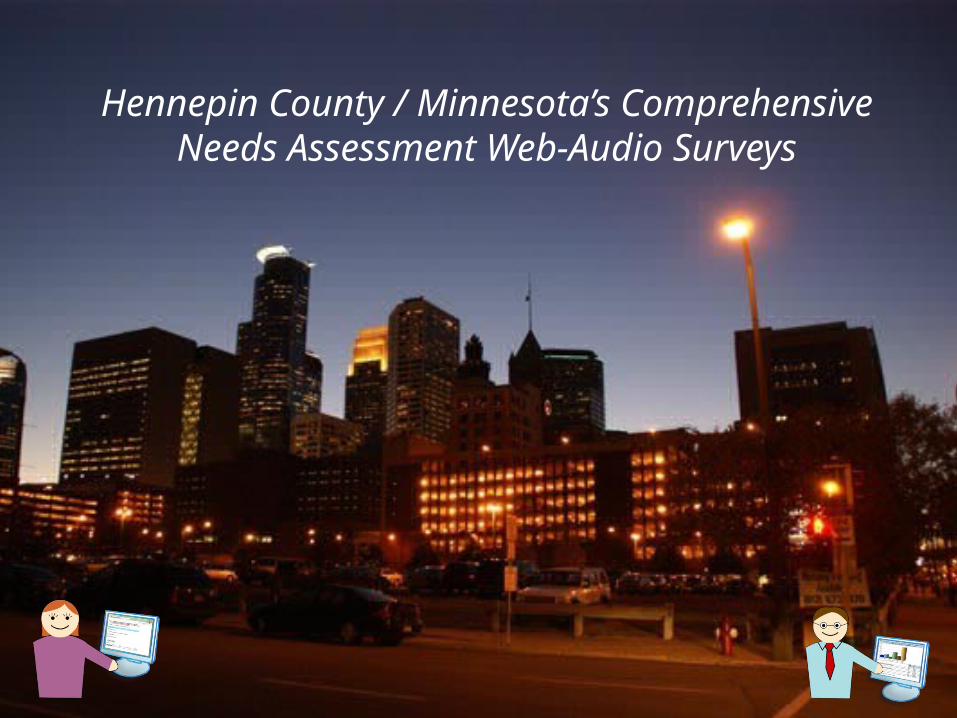
Hennepin County / Minnesota’s Comprehensive Needs Assessment Web-Audio Surveys
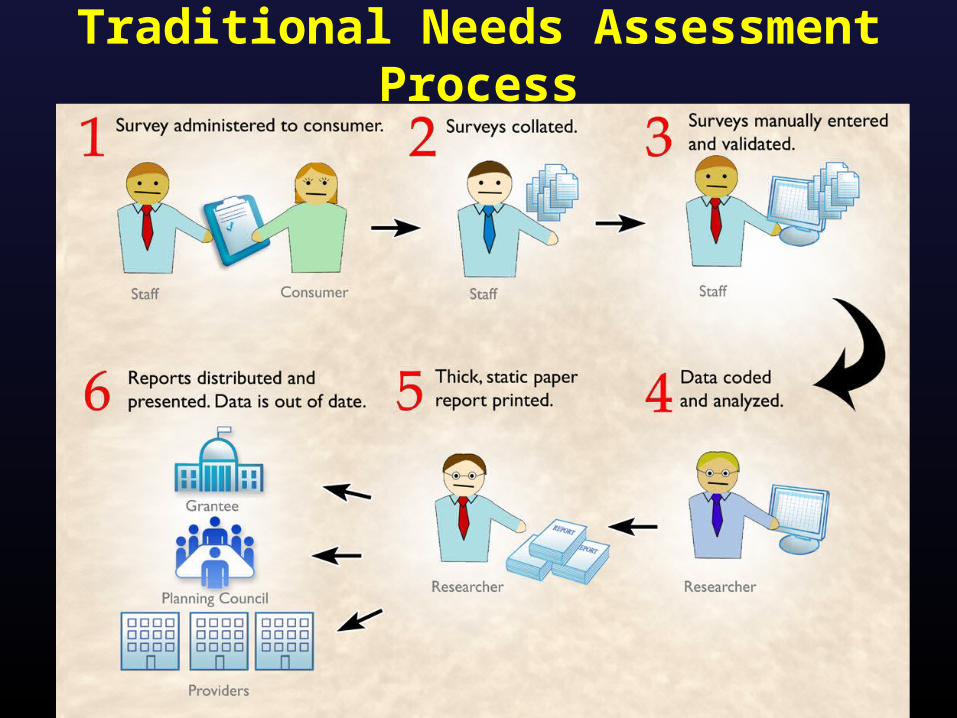
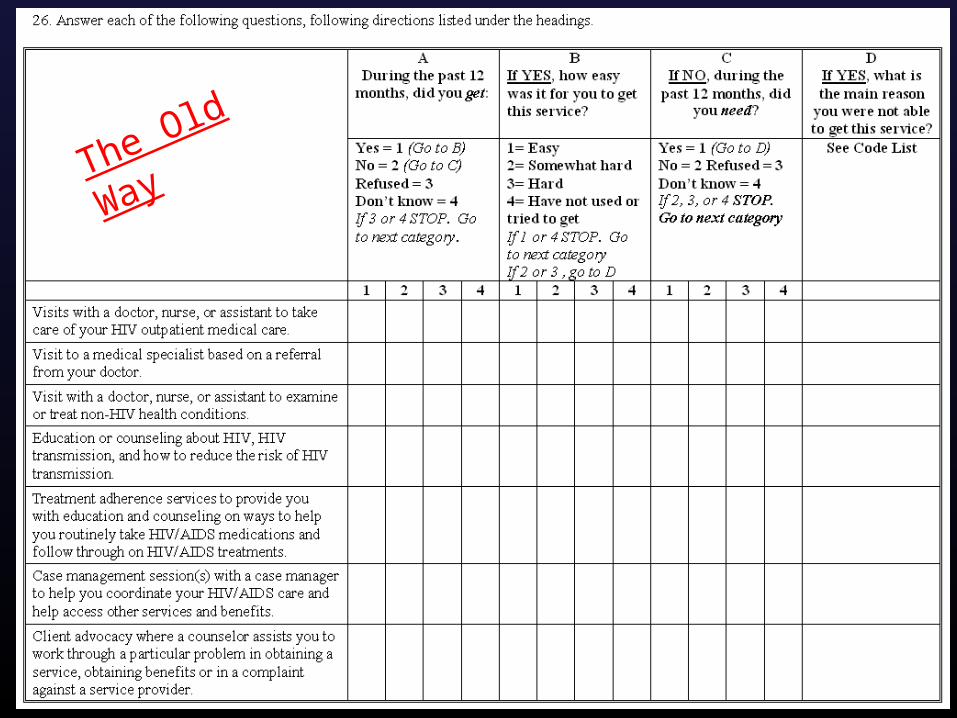
Traditional Needs Assessment Process
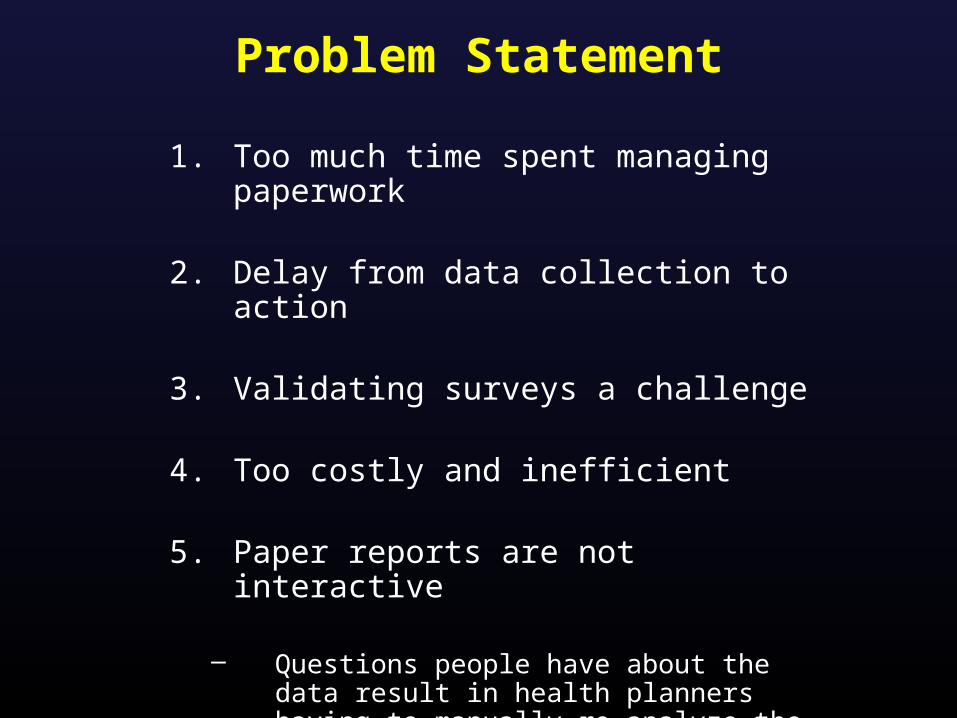
Problem Statement
1. Too much time spent managing paperwork
2. Delay from data collection to action
3. Validating surveys a challenge
4. Too costly and inefficient
5. Paper reports are not interactive
– Questions people have about the data result in health planners having to manually re-analyze the data
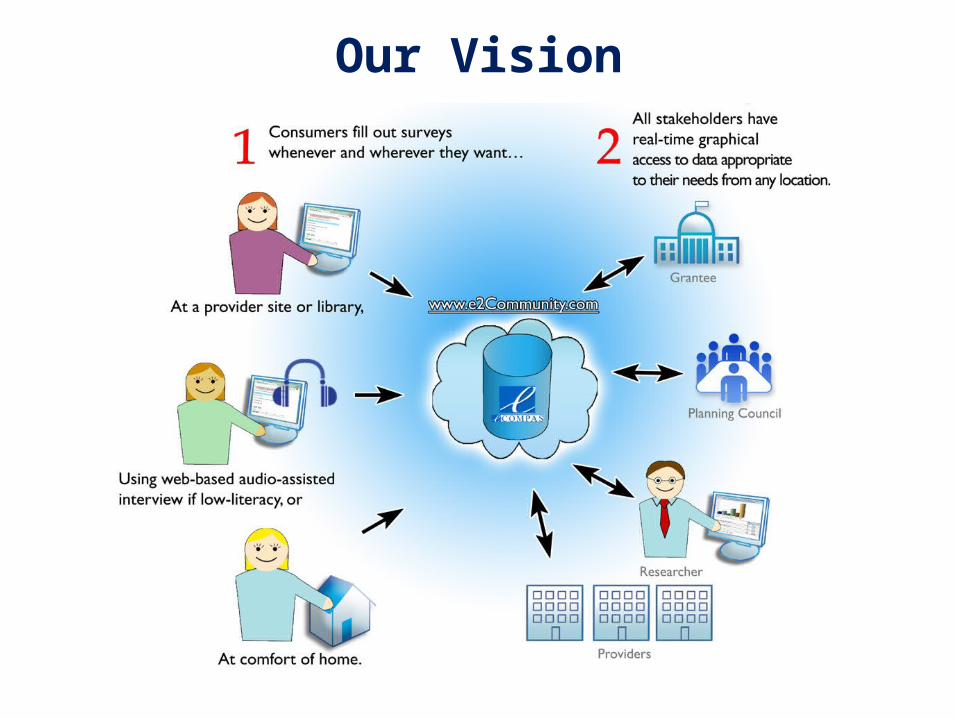
Our Vision
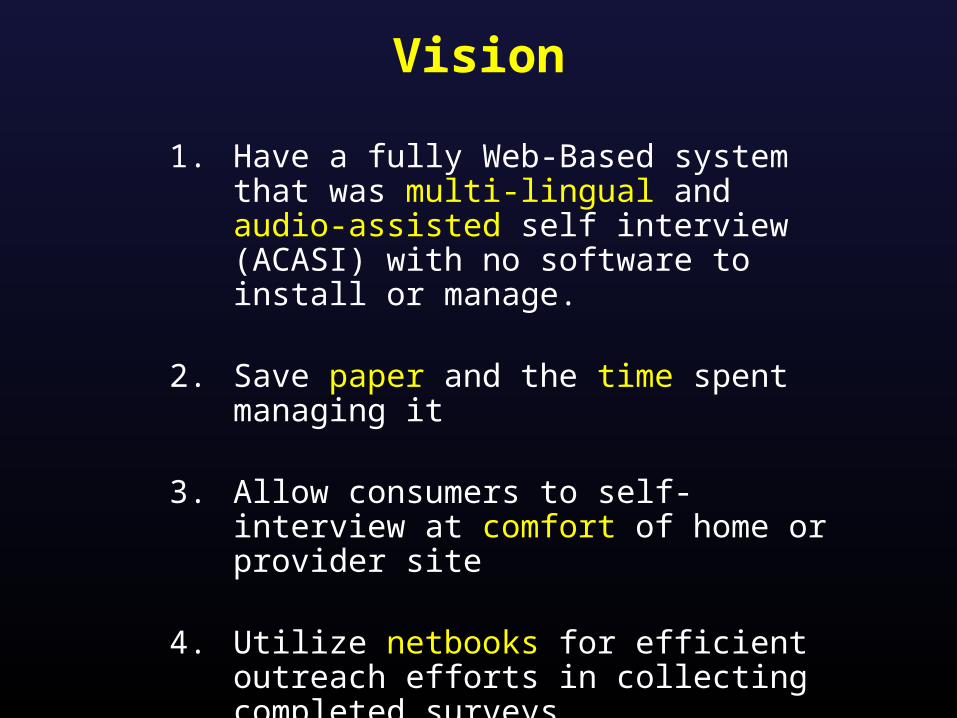
Vision
1. Have a fully Web-Based system that was multi-lingual and audio-assisted self interview (ACASI) with no software to install or manage.
2. Save paper and the time spent managing it
3. Allow consumers to self-interview at comfort of home or provider site
4. Utilize netbooks for efficient outreach efforts in collecting completed surveys
5. Realize cost-savings
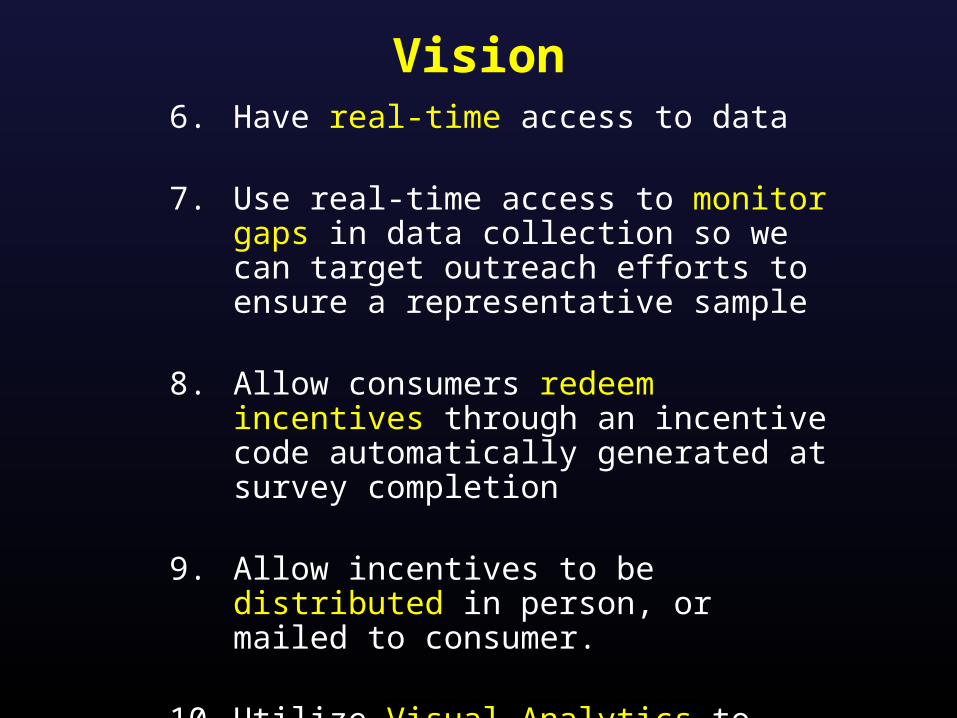
Vision6. Have real-time access to data
7. Use real-time access to monitor gaps in data collection so we can target outreach efforts to ensure a representative sample
8. Allow consumers redeem incentives through an incentive code automatically generated at survey completion
9. Allow incentives to be distributed in person, or mailed to consumer.
10. Utilize Visual Analytics to make data more actionable in real-time for better planning, decision making, and grant applications.

Vision Accomplished?
Yes!
With some unanticipated benefits too…
How did we do it?
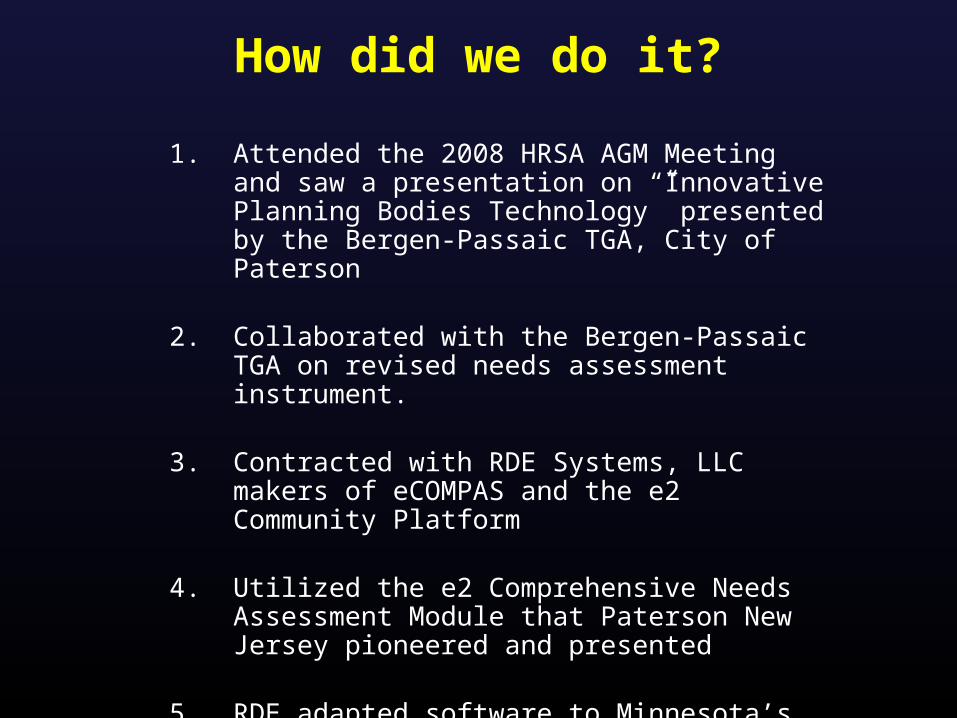
1. Attended the 2008 HRSA AGM Meeting and saw a presentation on “Innovative Planning Bodies Technology” presented by the Bergen-Passaic TGA, City of Paterson
2. Collaborated with the Bergen-Passaic TGA on revised needs assessment instrument.
3. Contracted with RDE Systems, LLC makers of eCOMPAS and the e2 Community Platform
4. Utilized the e2 Comprehensive Needs Assessment Module that Paterson New Jersey pioneered and presented
5. RDE adapted software to Minnesota’s unique needs and vision.
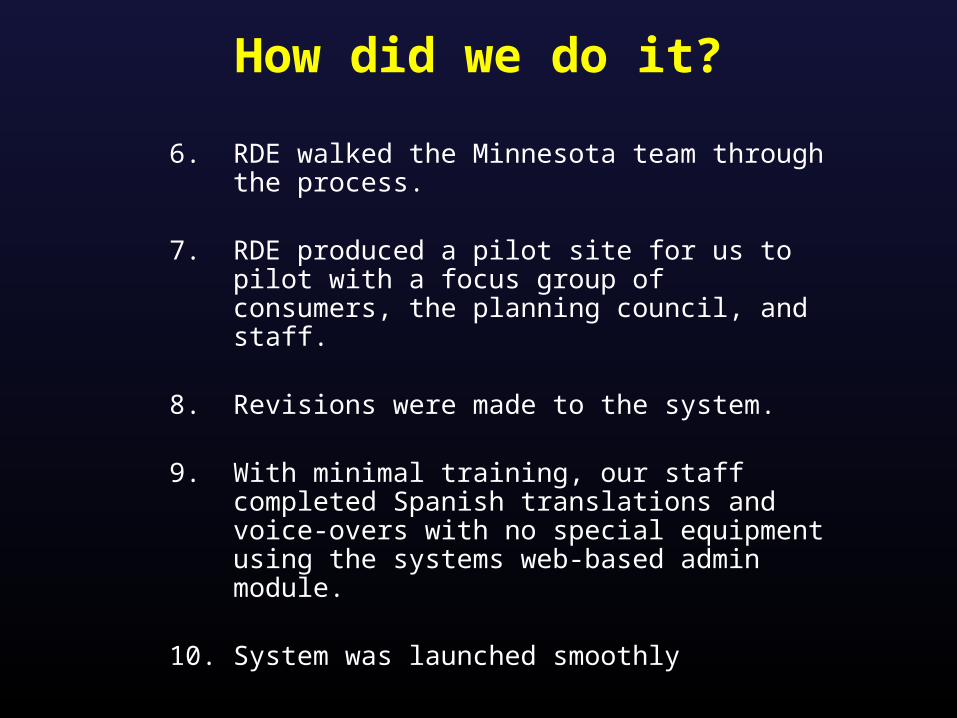
How did we do it?
6. RDE walked the Minnesota team through the process.
7. RDE produced a pilot site for us to pilot with a focus group of consumers, the planning council, and staff.
8. Revisions were made to the system.
9. With minimal training, our staff completed Spanish translations and voice-overs with no special equipment using the systems web-based admin module.
10. System was launched smoothly
11. System continued to be enhanced with ideas that RDE had (free of charge).

Social Marketing
The Old Way
NextQuestion
NextQuestion
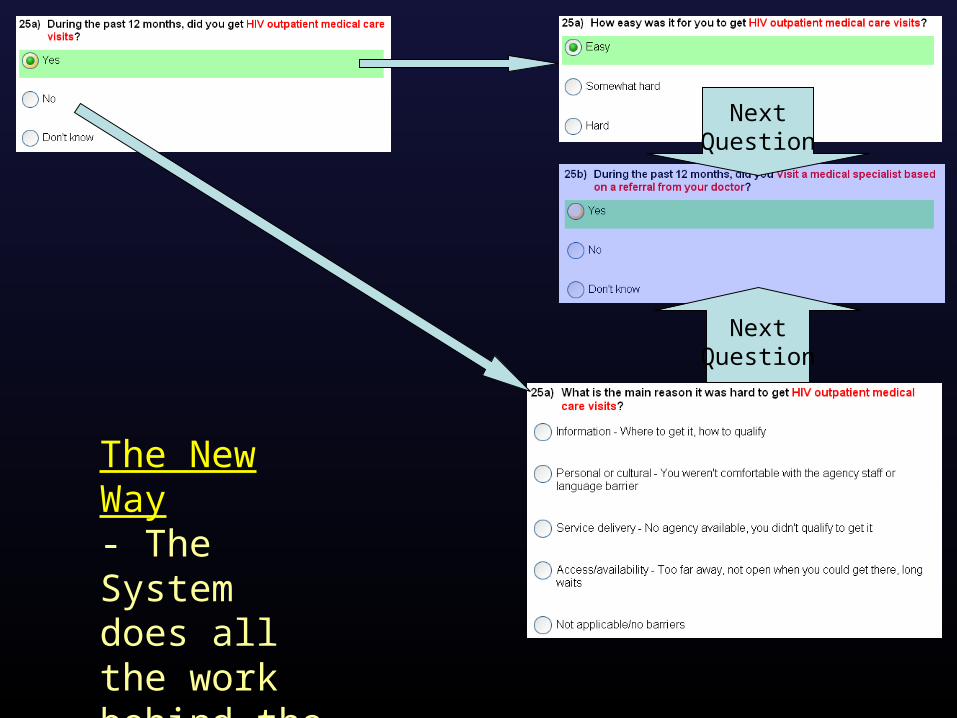
The New Way- The System does all the work behind the scenes.
Demo
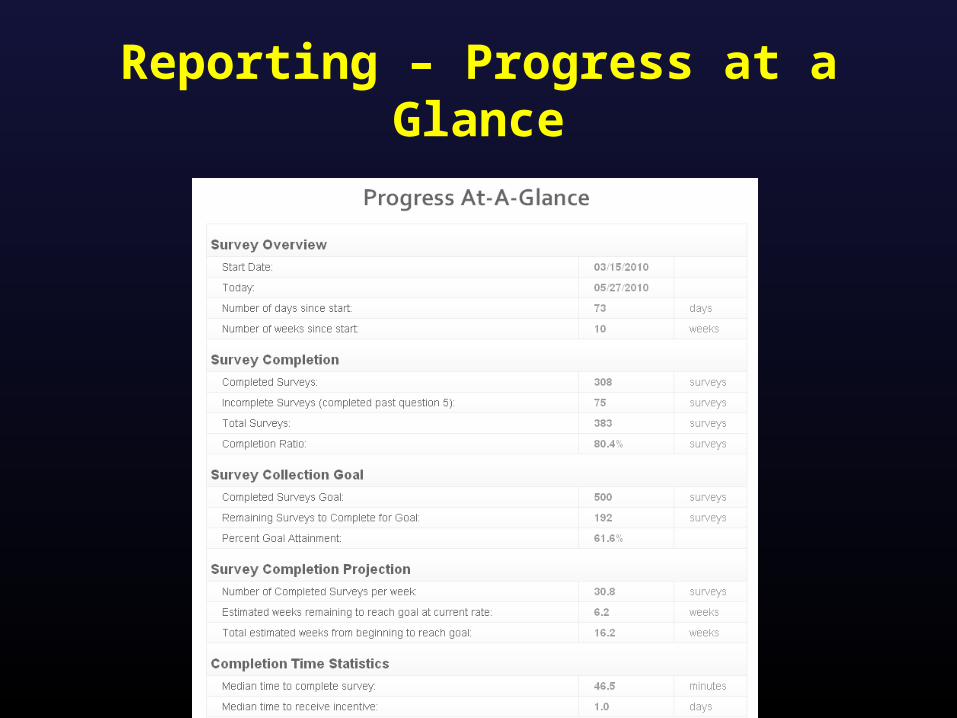
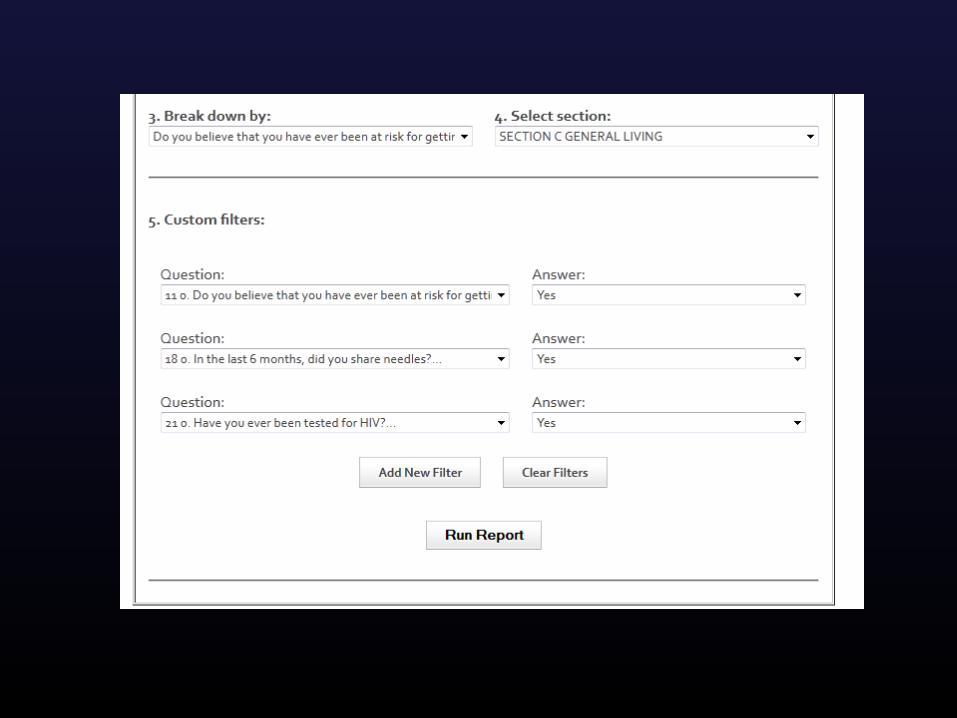
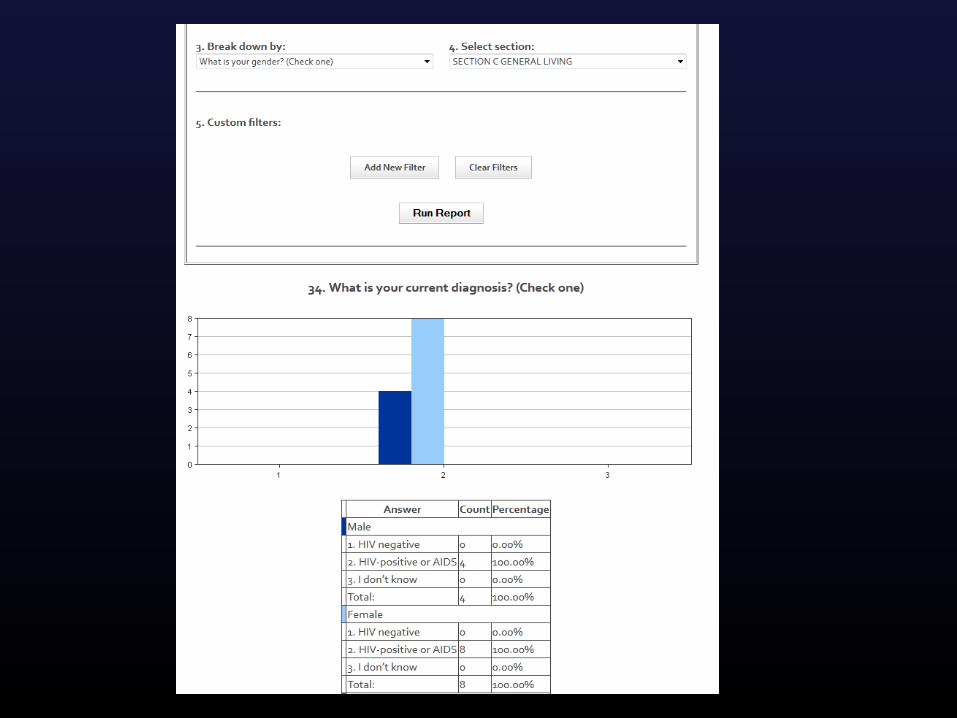
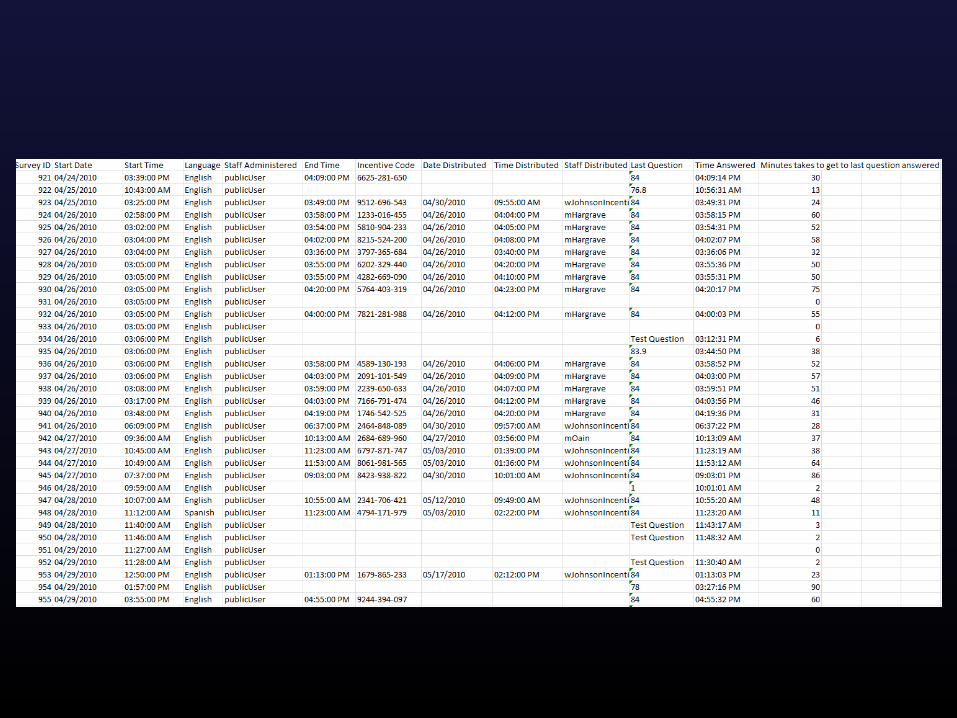
Reporting – Progress at a Glance

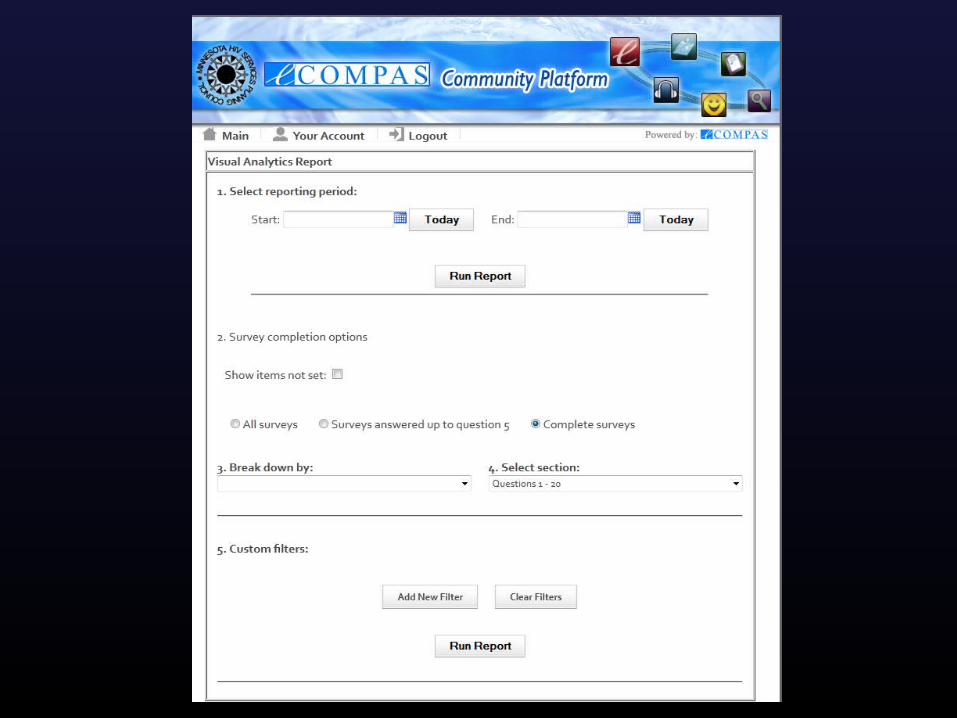
Visual Analytics

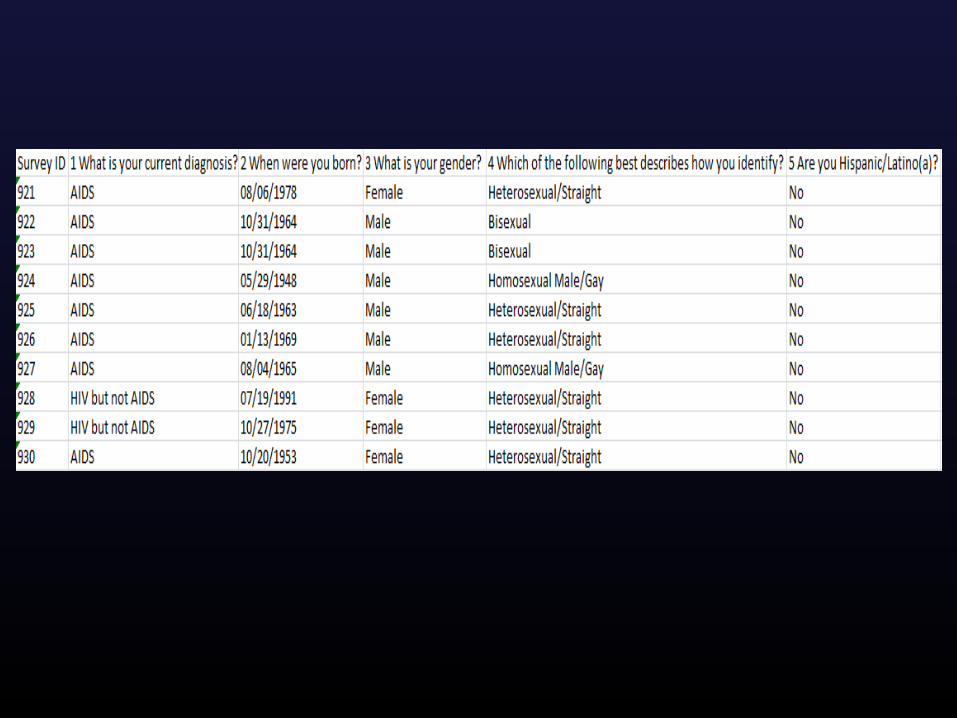
Excel Data Extract

Results
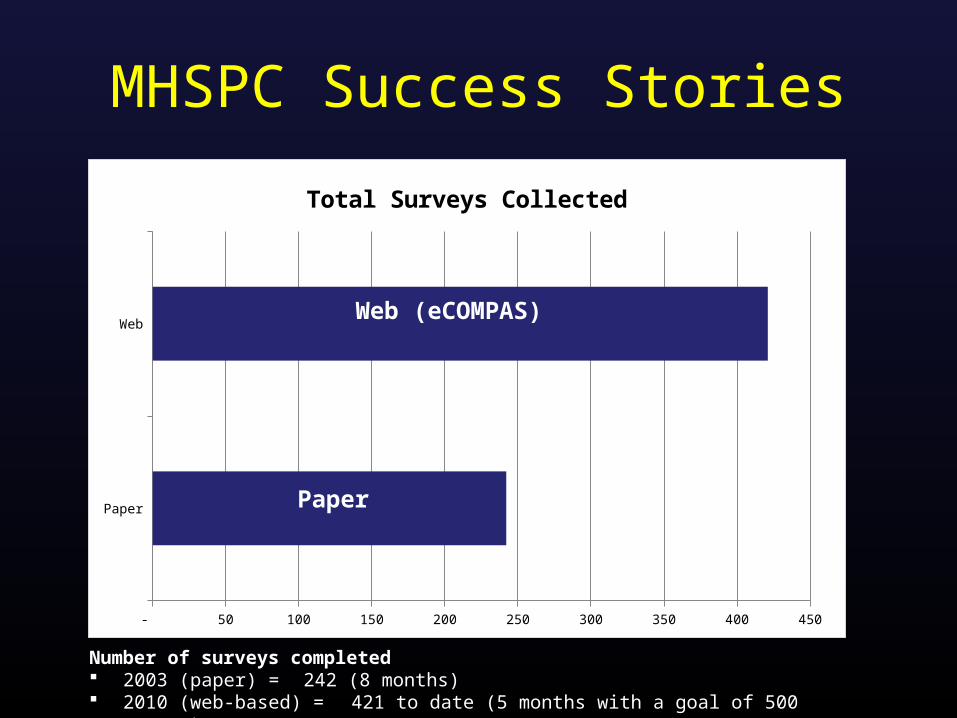
MHSPC Success Stories
Paper
Web
- 50 100 150 200 250 300 350 400 450
Total Surveys Collected
Paper
Web (eCOMPAS)
Number of surveys completed 2003 (paper) = 242 (8 months) 2010 (web-based) = 421 to date (5 months with a goal of 500 surveys)
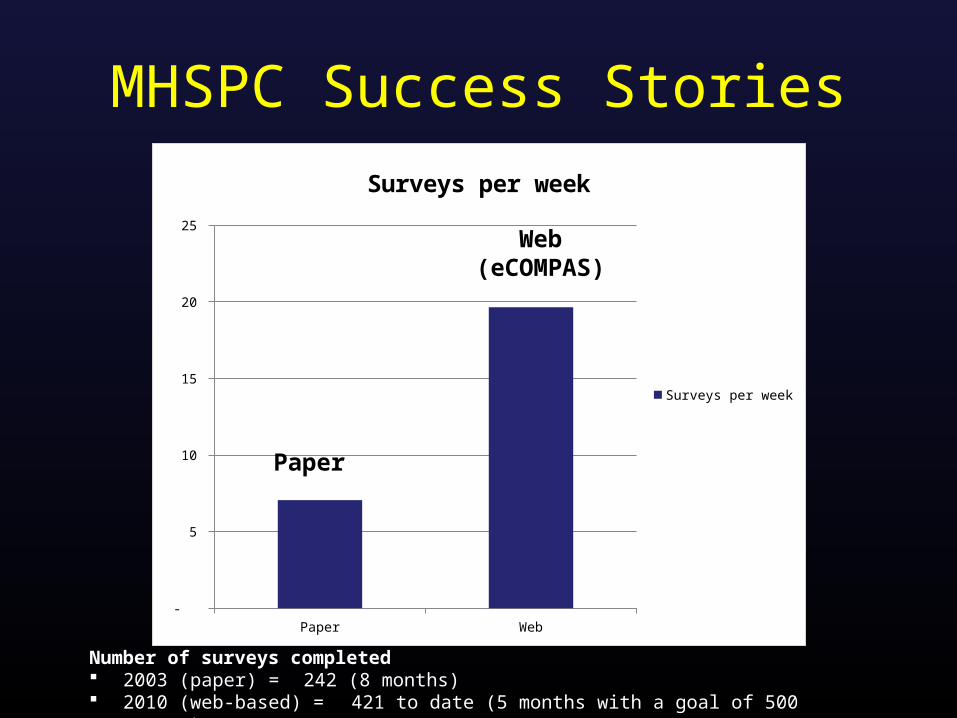
Paper Web -
5
10
15
20
25
Surveys per week
Surveys per week
MHSPC Success Stories
Paper
Web(eCOMPAS)
Number of surveys completed 2003 (paper) = 242 (8 months) 2010 (web-based) = 421 to date (5 months with a goal of 500 surveys)
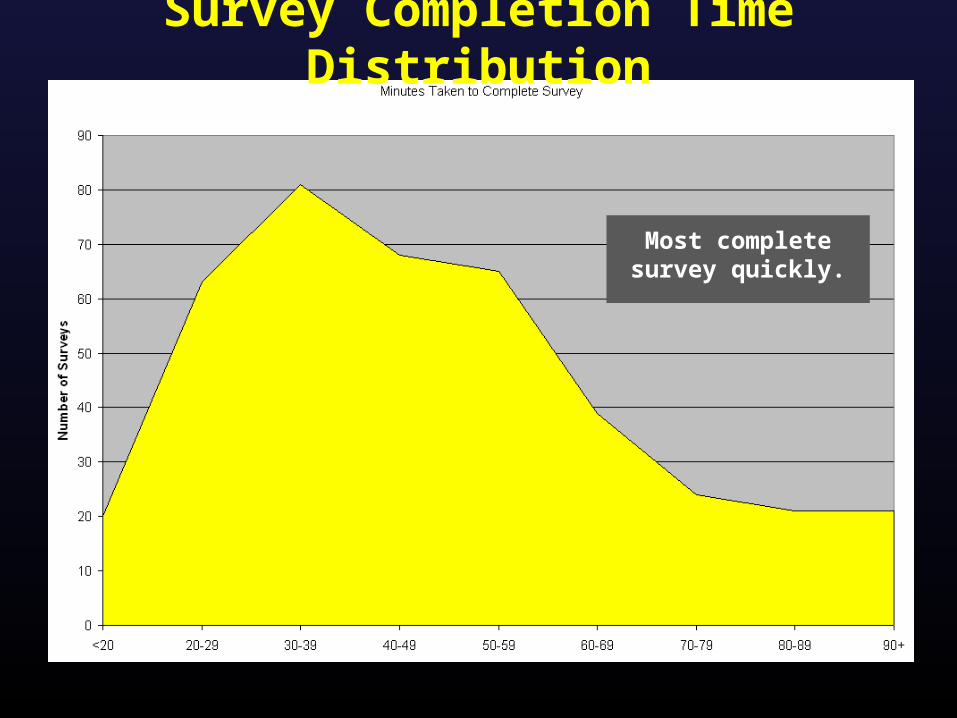
Survey Completion Time Distribution
Most complete survey quickly.

Compared to 2003, big difference!
Paper
Web
Web
Web
Web
Innovative Use of Inexpensive Netbooks

Before Netbooks and eCOMPAS
After Netbooks and eCOMPAS
2003: Survey required 6 interviewers to conduct face-to-face interviews
2010: Majority of respondents (69%) did so from a private/public computer.
The remaining 21% participated in a session led by one of six volunteer consumer ambassadors
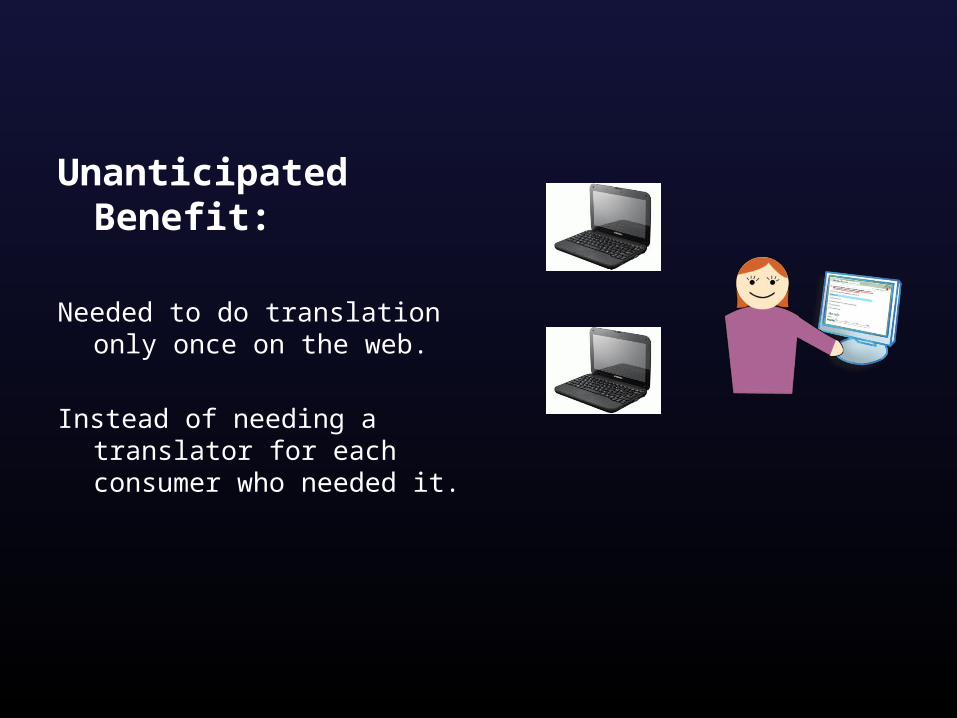
Unanticipated Benefit:
Needed to do translation only once on the web.
Instead of needing a translator for each consumer who needed it.
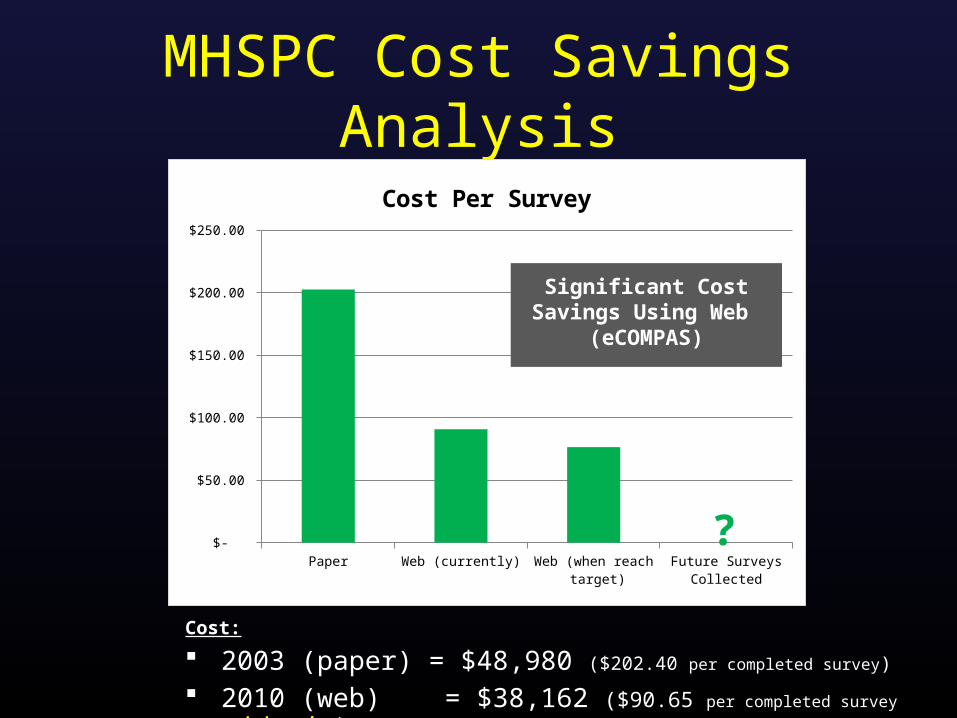
MHSPC Cost Savings Analysis
Cost:
2003 (paper) = $48,980 ($202.40 per completed survey)
2010 (web) = $38,162 ($90.65 per completed survey and dropping)
Paper
Web
(cur
rent
ly)
Web
(whe
n re
ach
targ
et)
Futur
e Sur
veys
Coll
ecte
d $-
$50.00
$100.00
$150.00
$200.00
$250.00
Cost Per Survey
?
Significant Cost Savings Using Web (eCOMPAS)
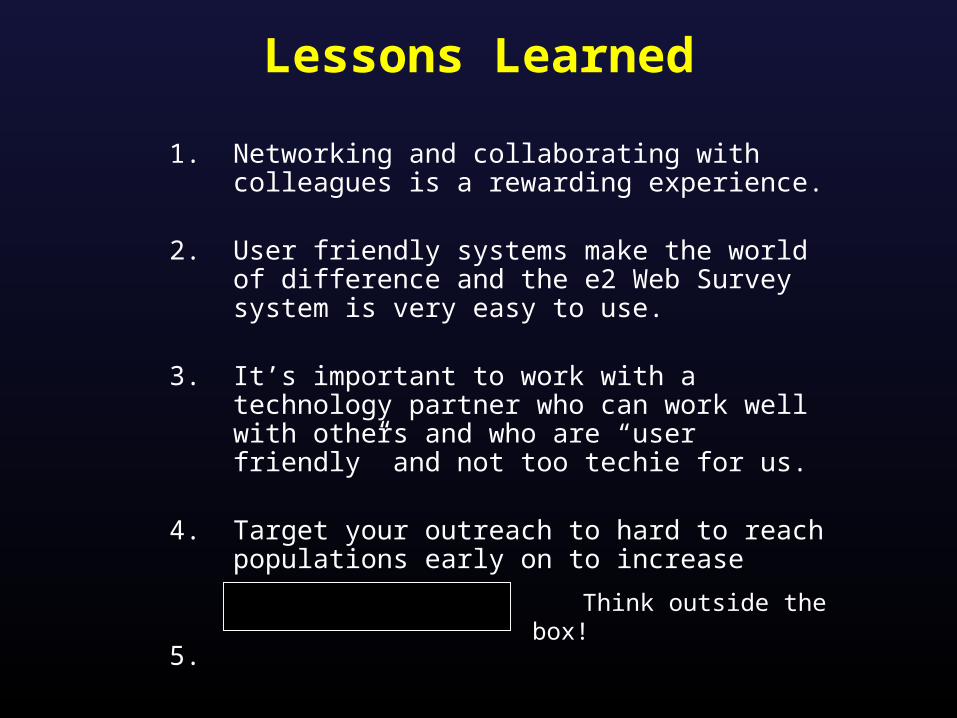
Lessons Learned
1. Networking and collaborating with colleagues is a rewarding experience.
2. User friendly systems make the world of difference and the e2 Web Survey system is very easy to use.
3. It’s important to work with a technology partner who can work well with others and who are “user friendly” and not too techie for us.
4. Target your outreach to hard to reach populations early on to increase success.
5. Think outside the box!

Riverside-San Bernardino, CaliforniaTransitional Grant Area (TGA)

Purpose of TGA’s Needs Assessment
• Understand the needs of persons living with HIV (PLWH) in order to plan service delivery
• Identify: o Service needso Barriers to Careo Gaps in Care
• Use data to set priorities, allocate resources, and support other funding efforts
• Understand the needs of persons who are unaware of their HIV statustatus

The TGA’s 2011 Process
• Hired consultant who had done the 2008 needs assessment (January 2011)
• Utilized 2008 needs assessment survey as starting point for revisions
• Met with health department staff to discuss “prevention questions” to be added
• RDE Systems input survey questions into eCompas• Pilot of survey and revisions• Go live (March 15, 2011)
The TGA’s 2011 Process, continued• A graphic designer created a marketing flier and business
card for broad distribution with community input focusing on being attractive especially to Latinos and African Americans
• TGA had a press release announcing the survey in local newspapers
• Worked with traditional CBOs to get the word out• Survey closed May 15, 2011• Preliminary data analysis showed an underrepresentation
of non-Hispanic African Americans/Blacks and we re-opened the survey for 1 week in June to address this.
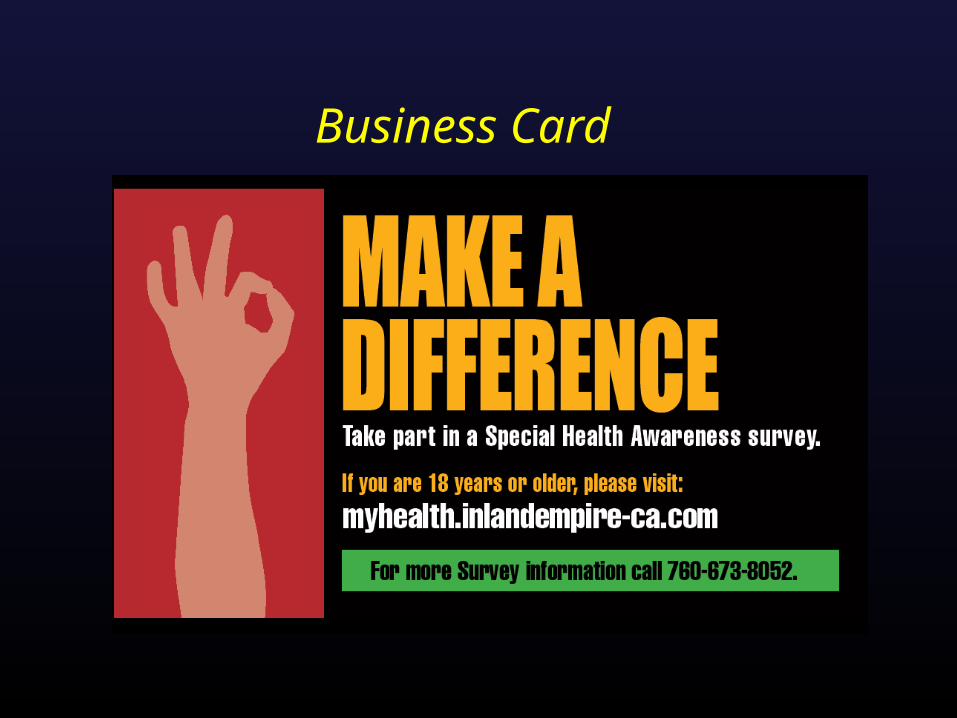
Business Card
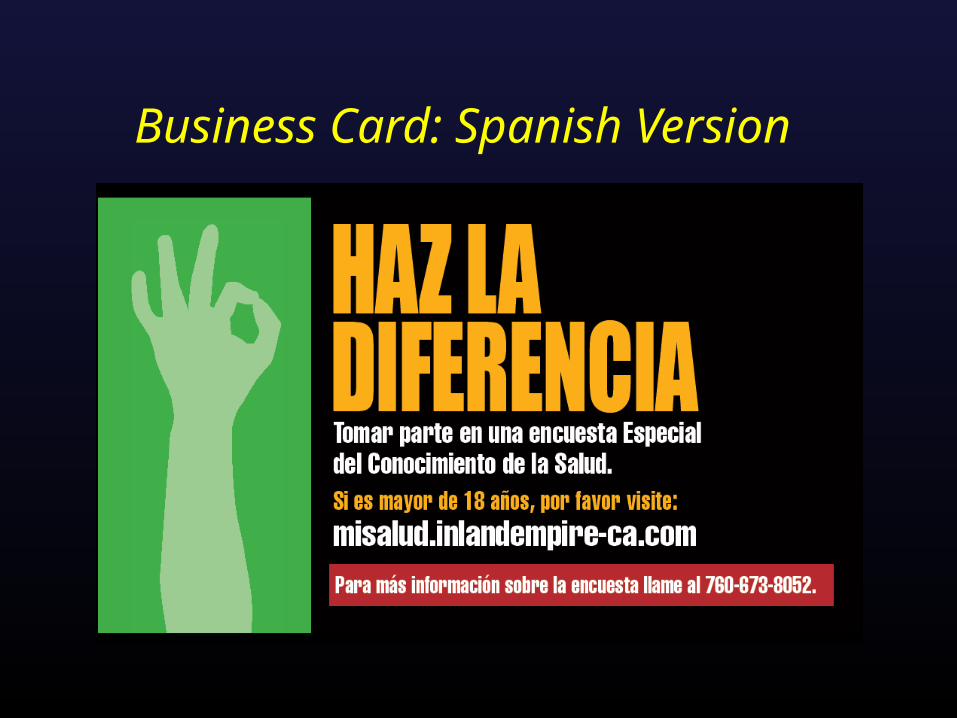
Business Card: Spanish Version
The “Nitty Gritty”
• Daily tracked the demographic characteristics and regional location of respondents
• Provided on site access to survey via WiFi hotspot and two laptop computers for respondents
• Traveled extensively throughout the two counties providing on-site access for persons without a computer
• Increased promotion efforts and targeted specific geographic regions as well as populations based on review of real time demographics
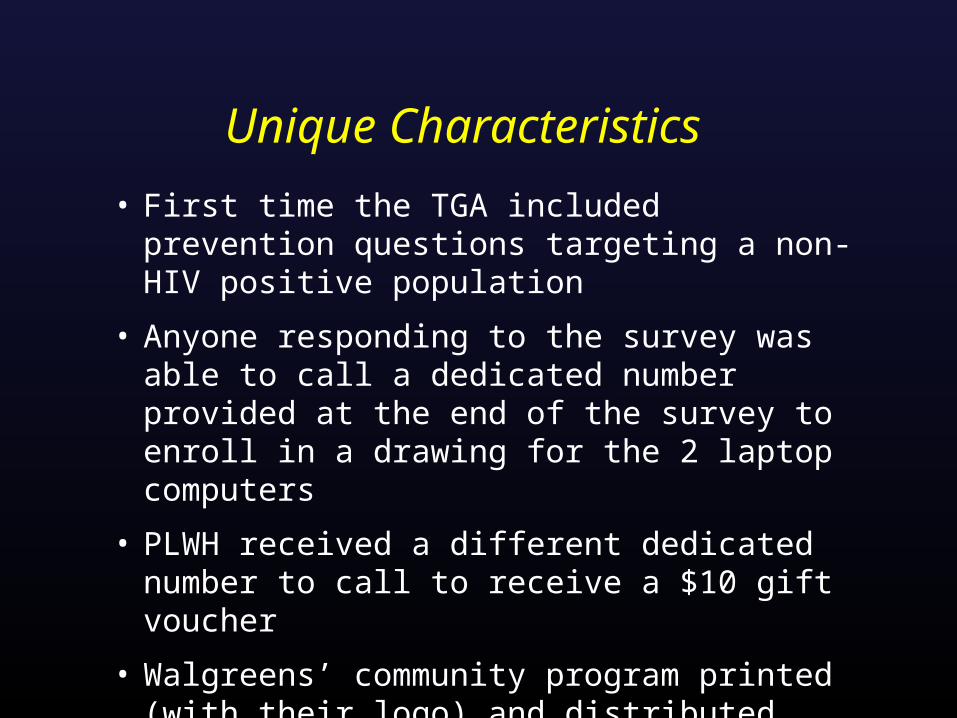
Unique Characteristics
• First time the TGA included prevention questions targeting a non-HIV positive population
• Anyone responding to the survey was able to call a dedicated number provided at the end of the survey to enroll in a drawing for the 2 laptop computers
• PLWH received a different dedicated number to call to receive a $10 gift voucher
• Walgreens’ community program printed (with their logo) and distributed fliers in select locations
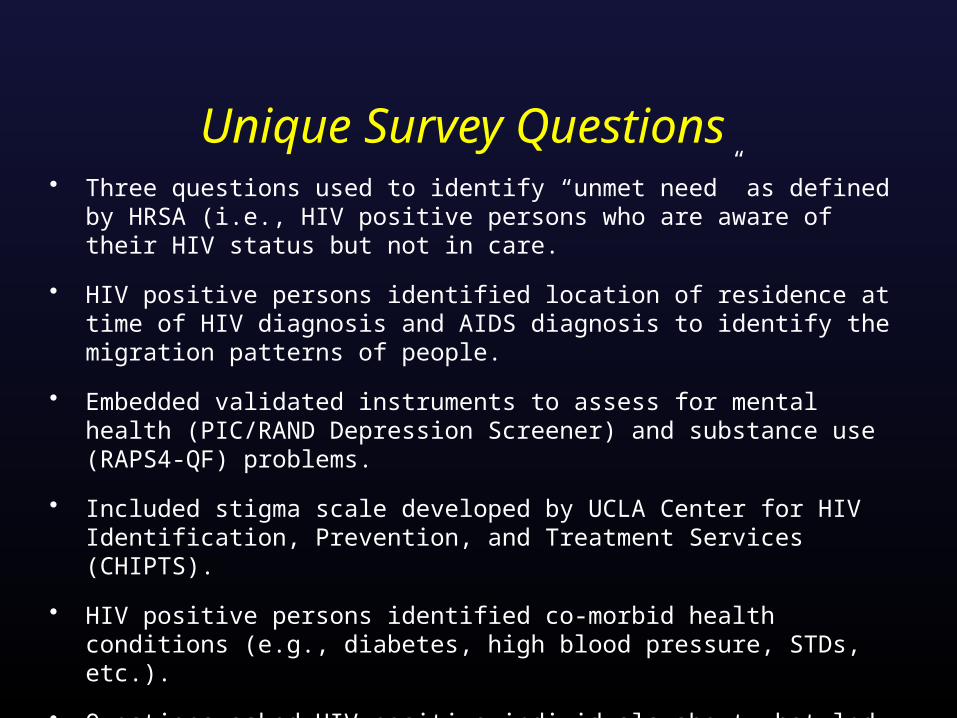
Unique Survey Questions• Three questions used to identify “unmet need” as defined by HRSA (i.e., HIV
positive persons who are aware of their HIV status but not in care.
• HIV positive persons identified location of residence at time of HIV diagnosis and AIDS diagnosis to identify the migration patterns of people.
• Embedded validated instruments to assess for mental health (PIC/RAND Depression Screener) and substance use (RAPS4-QF) problems.
• Included stigma scale developed by UCLA Center for HIV Identification, Prevention, and Treatment Services (CHIPTS).
• HIV positive persons identified co-morbid health conditions (e.g., diabetes, high blood pressure, STDs, etc.).
• Questions asked HIV positive individuals about what led them to being tested in the first place and if they had ever had an HIV test prior to testing positive
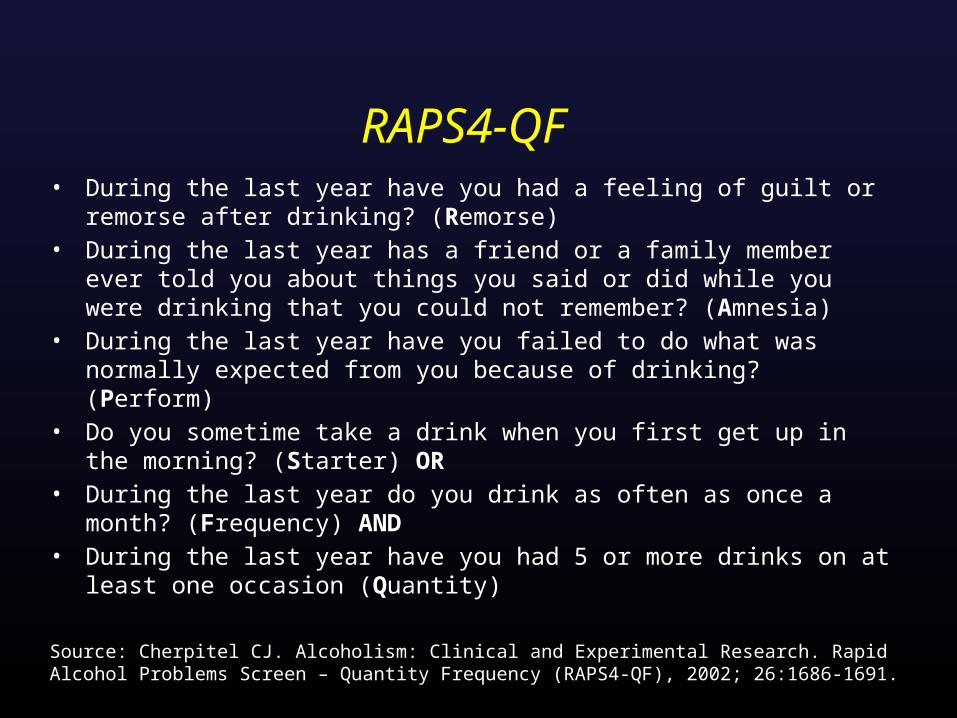
RAPS4-QF• During the last year have you had a feeling of guilt or remorse after drinking?
(Remorse) • During the last year has a friend or a family member ever told you about
things you said or did while you were drinking that you could not remember? (Amnesia)
• During the last year have you failed to do what was normally expected from you because of drinking? (Perform)
• Do you sometime take a drink when you first get up in the morning? (Starter) OR
• During the last year do you drink as often as once a month? (Frequency) AND
• During the last year have you had 5 or more drinks on at least one occasion (Quantity)
Source: Cherpitel CJ. Alcoholism: Clinical and Experimental Research. Rapid Alcohol Problems Screen – Quantity Frequency (RAPS4-QF), 2002; 26:1686-1691.
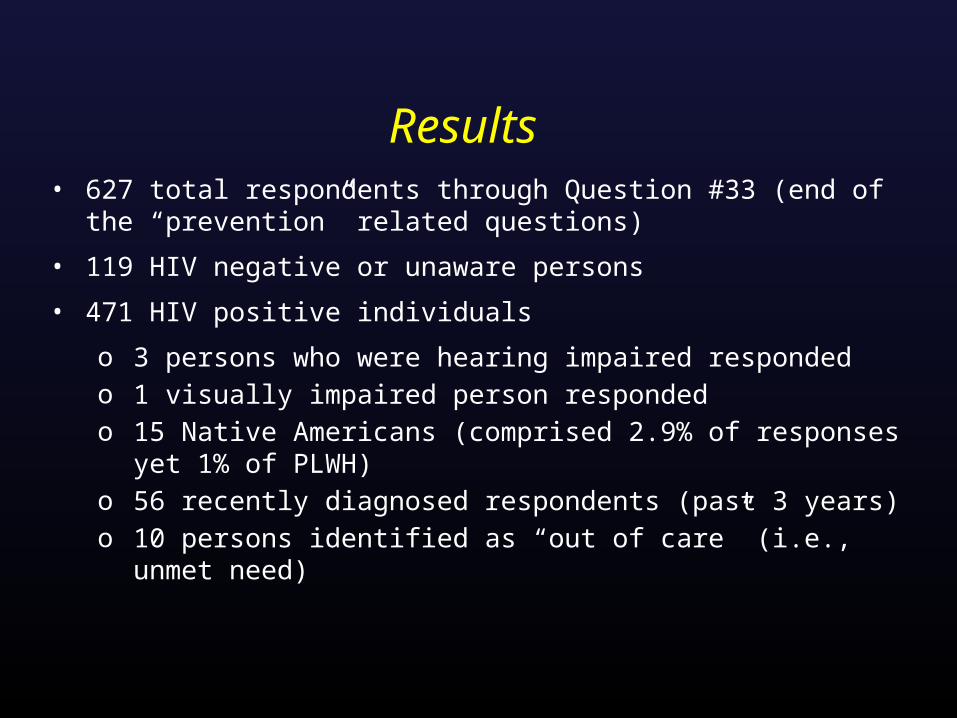
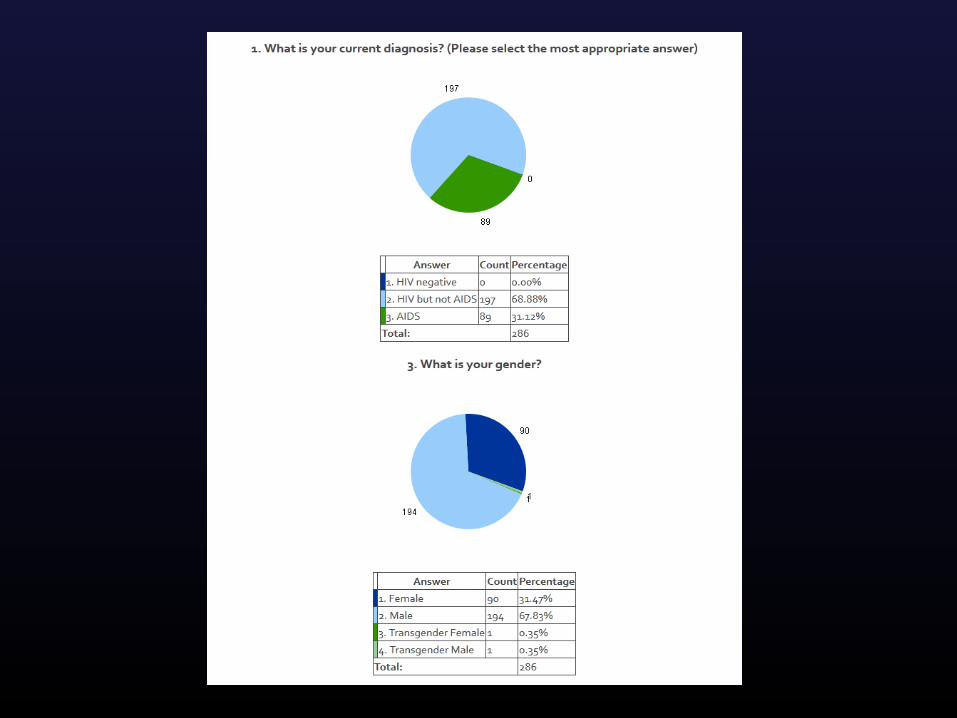
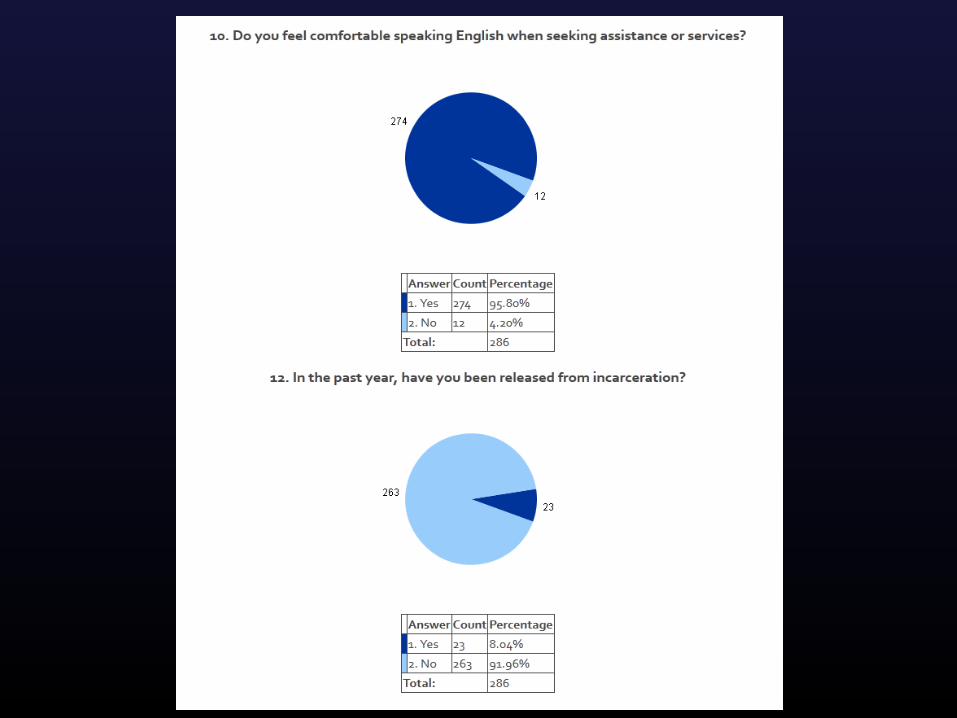
Results• 627 total respondents through Question #33 (end of the “prevention”
related questions)
• 119 HIV negative or unaware persons
• 471 HIV positive individuals
o 3 persons who were hearing impaired respondedo 1 visually impaired person respondedo 15 Native Americans (comprised 2.9% of responses yet 1% of
PLWH)o 56 recently diagnosed respondents (past 3 years)o 10 persons identified as “out of care” (i.e., unmet need)
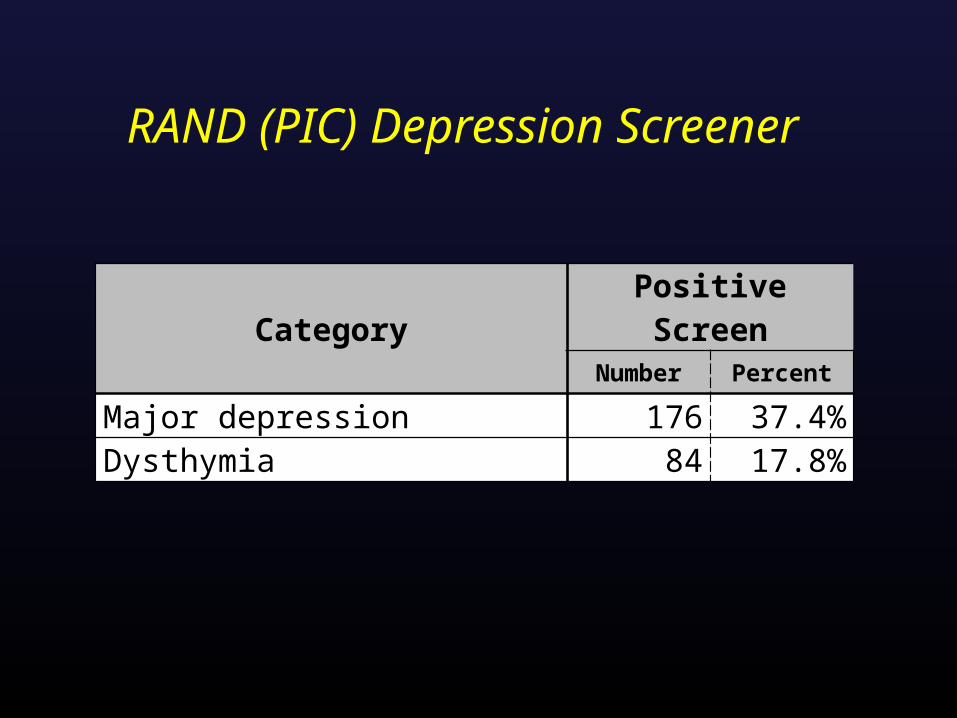
RAND (PIC) Depression Screener
Category Positive ScreenNumber Percent
Major depression 176 37.4%Dysthymia 84 17.8%
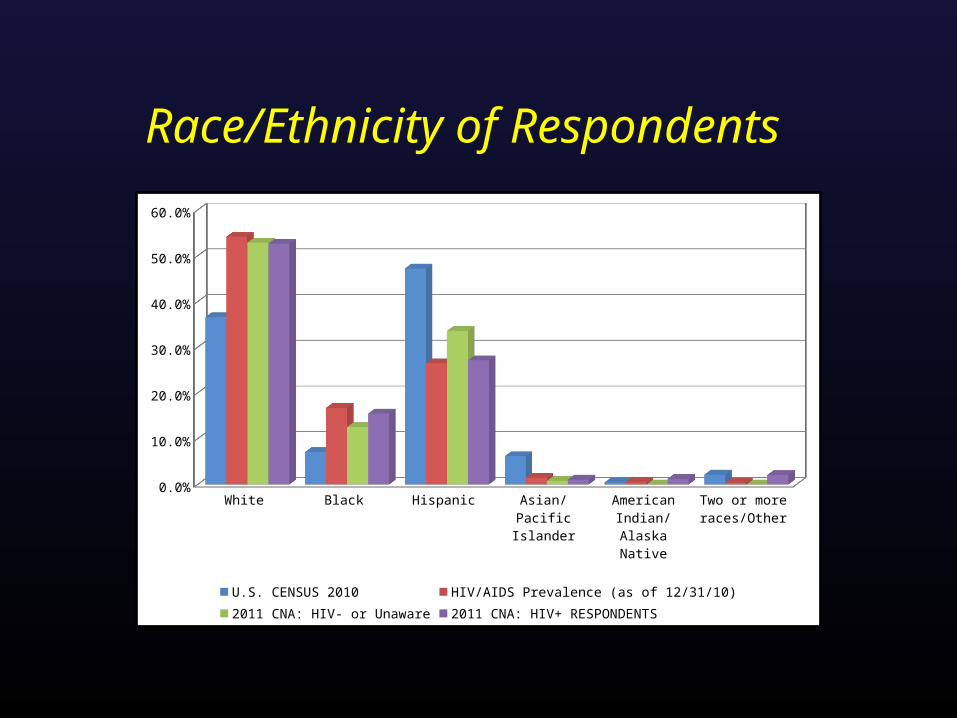
Race/Ethnicity of Respondents
White
Black
Hispan
ic
Asian/ P
acific Is
lander
American
Indian
/ Alas
ka Nati
ve
Two or m
ore rac
es/Other
0.0%
10.0%
20.0%
30.0%
40.0%
50.0%
60.0%
U.S. CENSUS 2010 HIV/AIDS Prevalence (as of 12/31/10)2011 CNA: HIV- or Unaware 2011 CNA: HIV+ RESPONDENTS
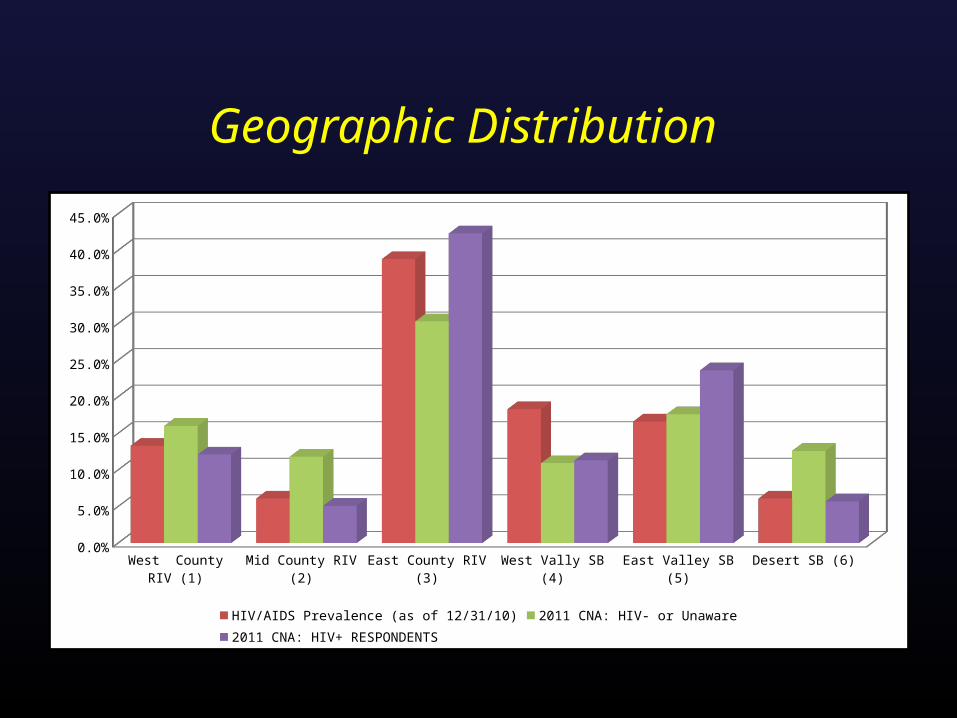
Geographic Distribution
West County RIV (1) Mid County RIV (2) East County RIV (3) West Vally SB (4) East Valley SB (5) Desert SB (6)0.0%
5.0%
10.0%
15.0%
20.0%
25.0%
30.0%
35.0%
40.0%
45.0%
HIV/AIDS Prevalence (as of 12/31/10) 2011 CNA: HIV- or Unaware 2011 CNA: HIV+ RESPONDENTS
Lessons Learned: Benefits• An entirely online survey allows complete anonymity for the respondent as
well as convenience to complete the survey in the comfort of his/her own home.
• Eliminates the need for data entry of a paper survey into a spreadsheet or database in order to conduct analysis of the data;
• Fewer people are needed to assist with the survey administration; however there is an increased need for promotion;
• Tracking demographic data of survey respondents is real-time and simplified to enhance ability to target underrepresented populations; and
• Even though the survey incentive was reduced to $10 from previous surveys
($25) due to limited resources, respondents were appreciative of the incentive and some level of incentive should continue in future surveys.
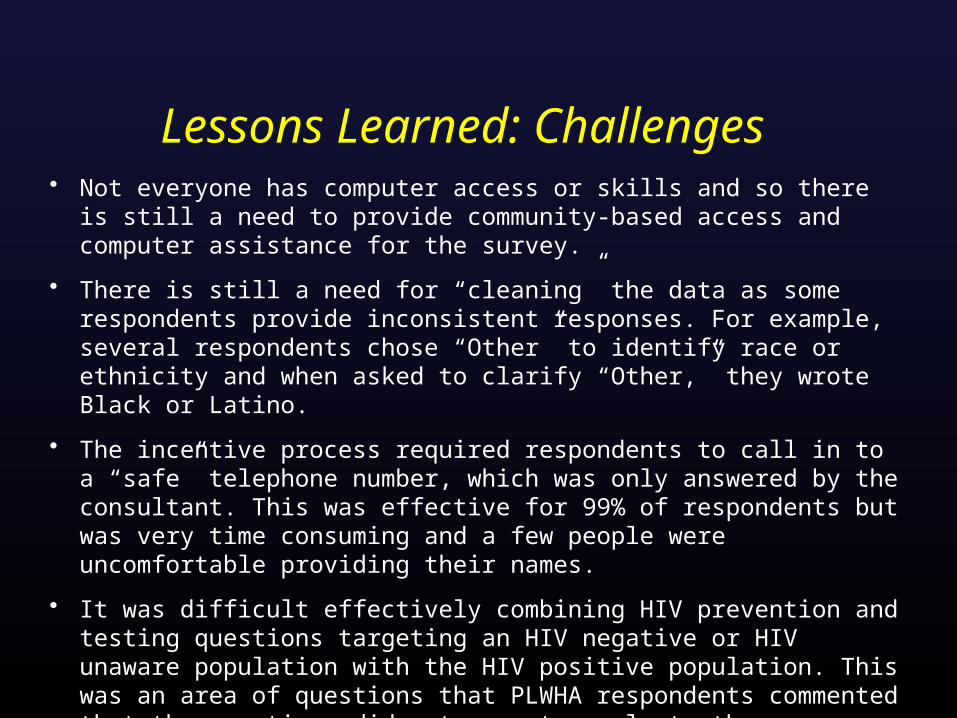
Lessons Learned: Challenges• Not everyone has computer access or skills and so there is still a need to
provide community-based access and computer assistance for the survey.
• There is still a need for “cleaning” the data as some respondents provide inconsistent responses. For example, several respondents chose “Other” to identify race or ethnicity and when asked to clarify “Other,” they wrote Black or Latino.
• The incentive process required respondents to call in to a “safe” telephone number, which was only answered by the consultant. This was effective for 99% of respondents but was very time consuming and a few people were uncomfortable providing their names.
• It was difficult effectively combining HIV prevention and testing questions targeting an HIV negative or HIV unaware population with the HIV positive population. This was an area of questions that PLWHA respondents commented that the questions did not seem to apply to them.
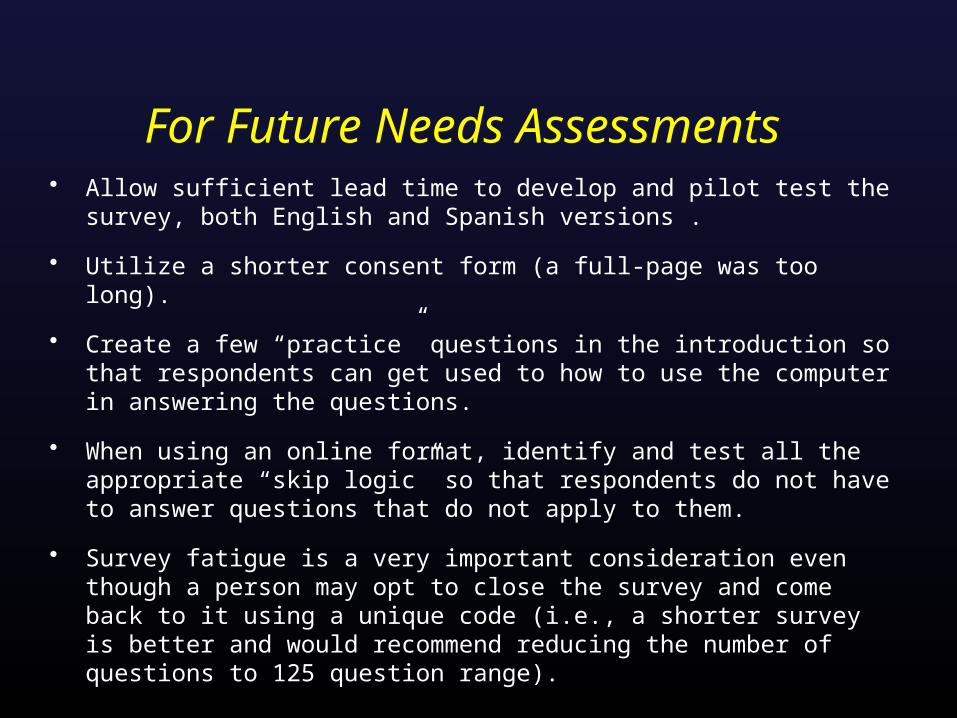
For Future Needs Assessments• Allow sufficient lead time to develop and pilot test the survey, both English
and Spanish versions .
• Utilize a shorter consent form (a full-page was too long).
• Create a few “practice” questions in the introduction so that respondents can get used to how to use the computer in answering the questions.
• When using an online format, identify and test all the appropriate “skip logic” so that respondents do not have to answer questions that do not apply to them.
• Survey fatigue is a very important consideration even though a person may opt to close the survey and come back to it using a unique code (i.e., a shorter survey is better and would recommend reducing the number of questions to 125 question range).

Region 6, North Carolina
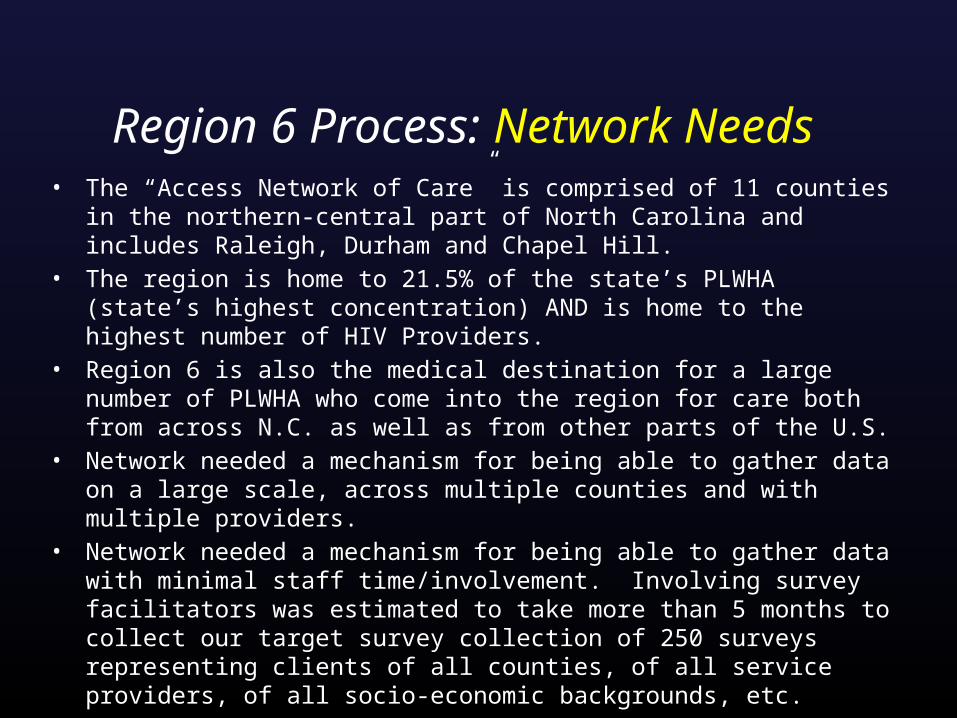
Region 6 Process: Network Needs• The “Access Network of Care” is comprised of 11 counties in the northern-
central part of North Carolina and includes Raleigh, Durham and Chapel Hill.• The region is home to 21.5% of the state’s PLWHA (state’s highest
concentration) AND is home to the highest number of HIV Providers.• Region 6 is also the medical destination for a large number of PLWHA who
come into the region for care both from across N.C. as well as from other parts of the U.S.
• Network needed a mechanism for being able to gather data on a large scale, across multiple counties and with multiple providers.
• Network needed a mechanism for being able to gather data with minimal staff time/involvement. Involving survey facilitators was estimated to take more than 5 months to collect our target survey collection of 250 surveys representing clients of all counties, of all service providers, of all socio-economic backgrounds, etc.
• Factoring in the need for bi-lingual staff only added to the length of time necessary to gather a sufficient amount of data
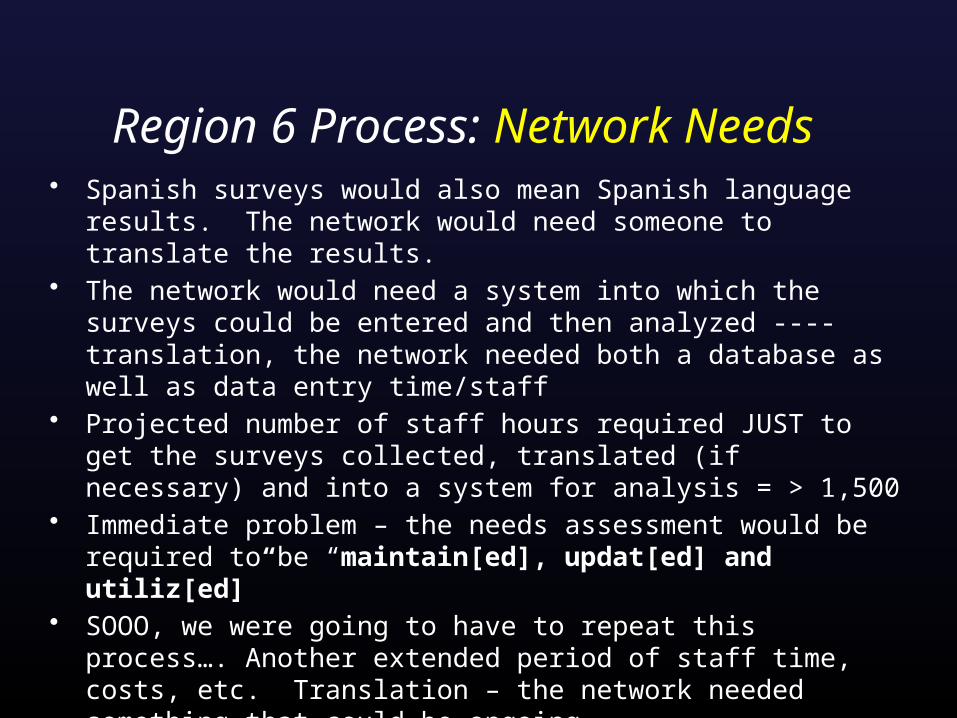
Region 6 Process: Network Needs• Spanish surveys would also mean Spanish language results. The
network would need someone to translate the results.• The network would need a system into which the surveys could be
entered and then analyzed ---- translation, the network needed both a database as well as data entry time/staff
• Projected number of staff hours required JUST to get the surveys collected, translated (if necessary) and into a system for analysis = > 1,500
• Immediate problem – the needs assessment would be required to be “maintain[ed], updat[ed] and utiliz[ed]”
• SOOO, we were going to have to repeat this process…. Another extended period of staff time, costs, etc. Translation – the network needed something that could be ongoing
Region 6 Process: A History• July 2010 – Identified consultant; presented plan for focus groups
and survey solicitation at July 2010 All Networks’ Meeting.• Summer/Fall of 2010 – Consultant met with network/identified focus
group target populations (6 groups identified)/began work on survey instrument/held training for survey facilitators
• Held 1 focus group• Created a 21 question survey• January 2011, discontinued relationship with consultant
Region 6 Process: A History• Refocused efforts. Hired consultants to complete remaining 5 focus groups• Reviewed our 21 question survey. Survey was lacking in a number of areas
important to regional providers: incarceration information, pediatric/youth information, housing info, nutrition, HIV counseling and testing, prevention, etc. were missing from the survey.
• Referenced All Grantees’ Meeting presentations on On-line Needs Assessments – with the help of the software vendor that presented at the All Grantees’ Meeting we contacted Hennepin County Minnesota (one of the programs featured at the AGM session on Needs Assessments)
• Reviewed Survey questionnaire Hennepin County (which had conducted a statewide needs assessment survey for Minnesota)
• Extracted relevant questions from Hennepin County’s instrument. Created an 82 question survey for our region.
Region 6 Process: A History• Network reviewed survey – too long• Trimmed to 76 questions – still considered too long – no agreement
on what to cut.• Survey finalized / everyone still agreeing that it was too long. • Focus Groups Completed / consultant writes portion of needs
assessment documenting focus group data• Hired consultant to write Epidemiological Profile section of needs
assessment.• Now, just needed a way to capture surveys…..
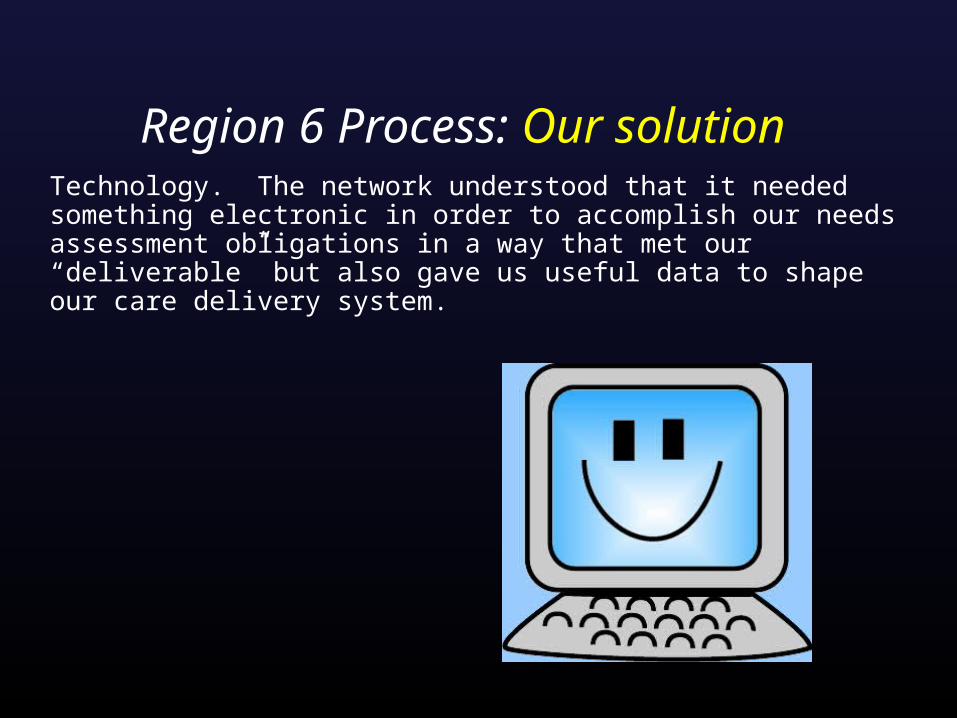
Region 6 Process: Our solutionTechnology. The network understood that it needed something electronic in order to accomplish our needs assessment obligations in a way that met our “deliverable” but also gave us useful data to shape our care delivery system.
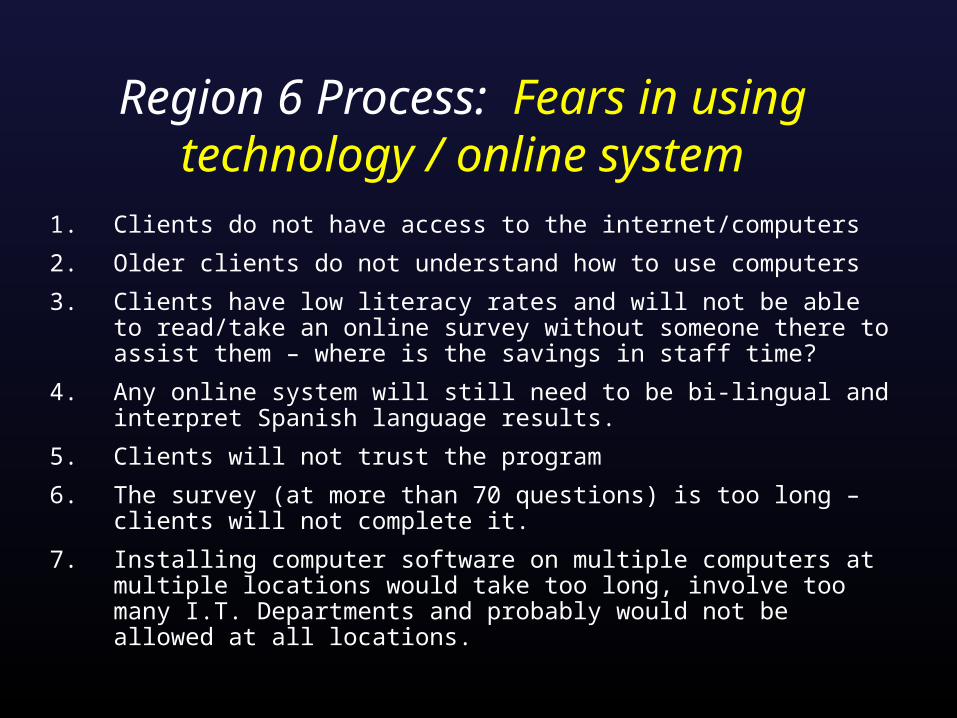
Region 6 Process: Fears in using technology / online system
1. Clients do not have access to the internet/computers
2. Older clients do not understand how to use computers
3. Clients have low literacy rates and will not be able to read/take an online survey without someone there to assist them – where is the savings in staff time?
4. Any online system will still need to be bi-lingual and interpret Spanish language results.
5. Clients will not trust the program
6. The survey (at more than 70 questions) is too long – clients will not complete it.
7. Installing computer software on multiple computers at multiple locations would take too long, involve too many I.T. Departments and probably would not be allowed at all locations.
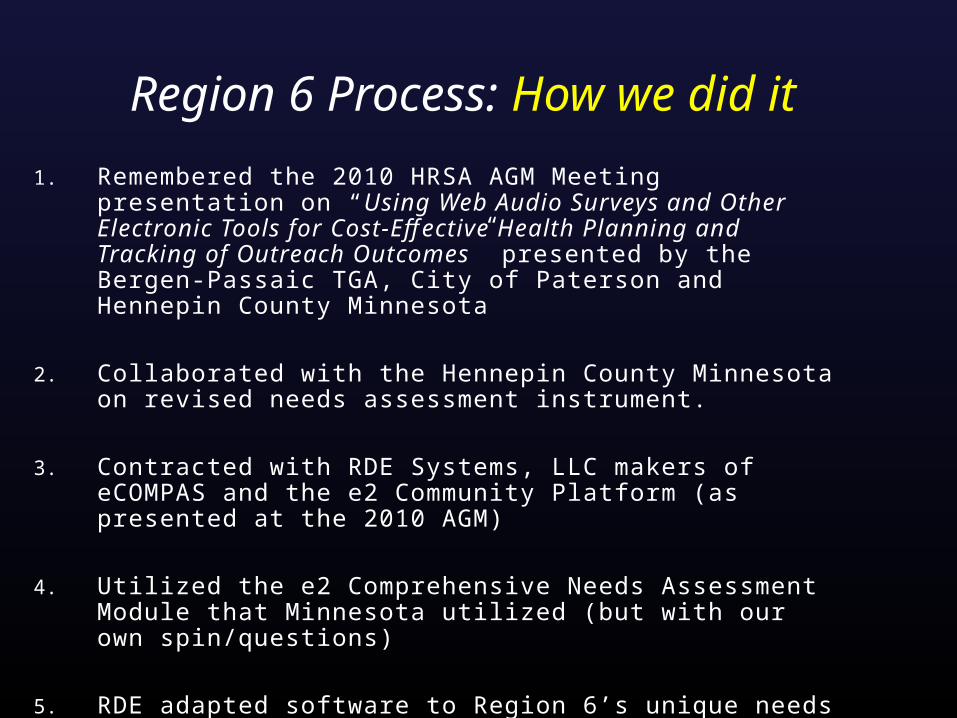
Region 6 Process: How we did it
1. Remembered the 2010 HRSA AGM Meeting presentation on “Using Web Audio Surveys and Other Electronic Tools for Cost-Effective Health Planning and Tracking of Outreach Outcomes” presented by the Bergen-Passaic TGA, City of Paterson and Hennepin County Minnesota
2. Collaborated with the Hennepin County Minnesota on revised needs assessment instrument.
3. Contracted with RDE Systems, LLC makers of eCOMPAS and the e2 Community Platform (as presented at the 2010 AGM)
4. Utilized the e2 Comprehensive Needs Assessment Module that Minnesota utilized (but with our own spin/questions)
5. RDE adapted software to Region 6’s unique needs and vision.

Region 6 Process: How we did it
6. RDE walked us through the process – created our survey online, walked us through the recording process (for the audio feature of the survey).
7. RDE produced a pilot site for us to pilot with a focus group of consumers, the network, and staff.
8. Revisions were made to the system.9. Coordinated with two regional individuals to record
the questions/answers --- one recorded them in English, one in Spanish.
10. Added our own spin by recording “welcome videos” utilizing individuals known locally and trusted by anticipated survey participants.
11. System was launched smoothly
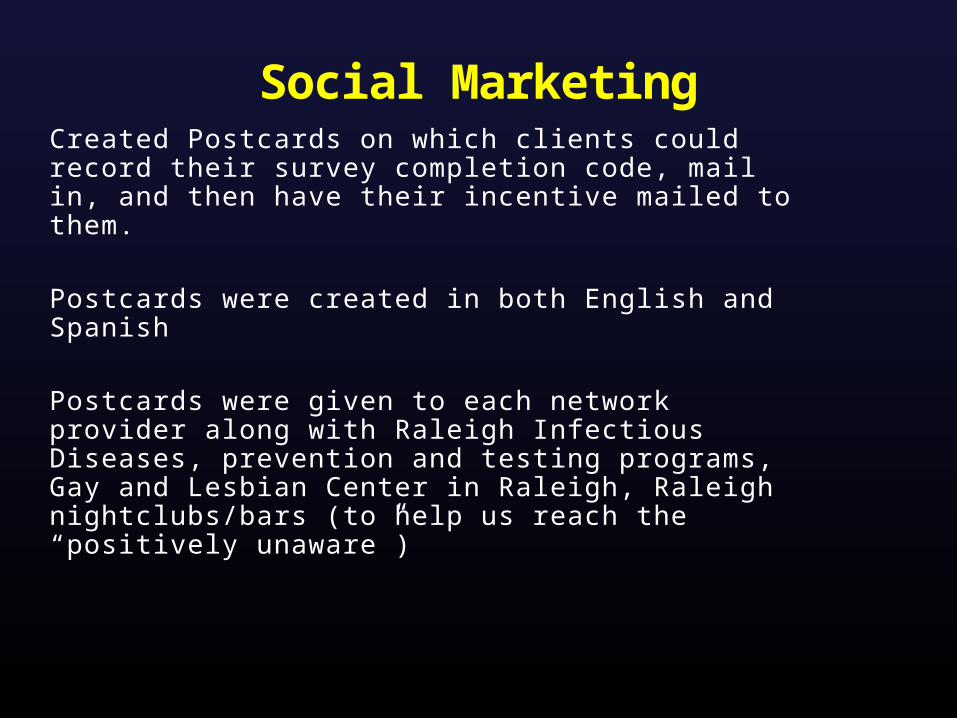
Social MarketingCreated Postcards on which clients could record their survey completion code, mail in, and then have their incentive mailed to them.
Postcards were created in both English and Spanish
Postcards were given to each network provider along with Raleigh Infectious Diseases, prevention and testing programs, Gay and Lesbian Center in Raleigh, Raleigh nightclubs/bars (to help us reach the “positively unaware”)
Results
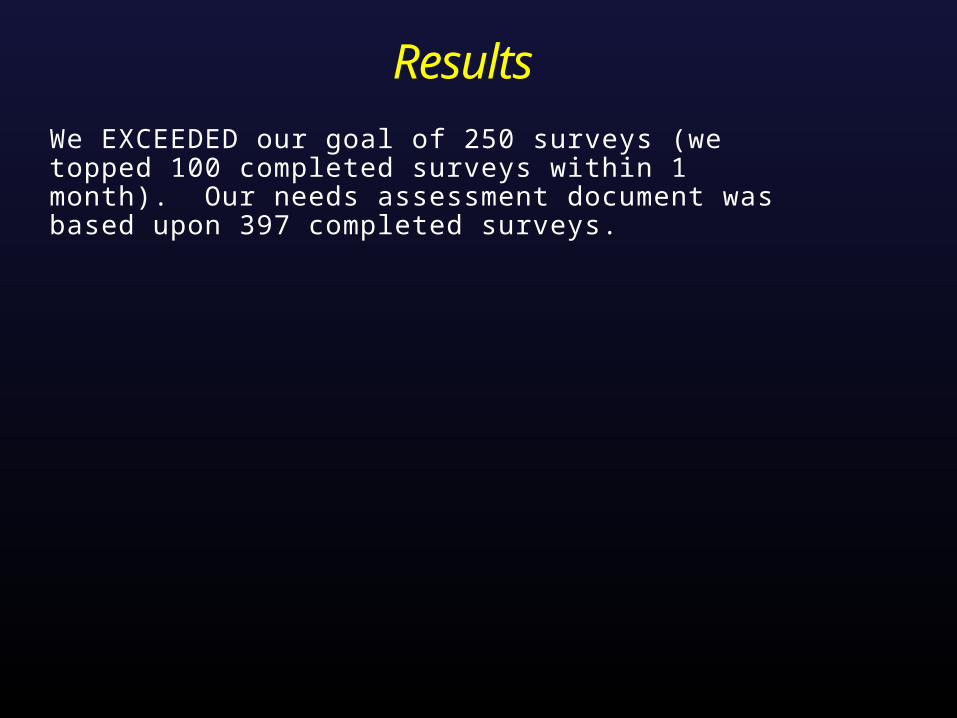
We EXCEEDED our goal of 250 surveys (we topped 100 completed surveys within 1 month). Our needs assessment document was based upon 397 completed surveys.
Projected 1,000 Hours of Staff Time Saved
Results/Myths dispelled
1. Clients do not have access to the internet/computers
Nearly 400 clients completed the survey… 180% more than our goal!!!!
2. Older clients do not understand how to use computers
68.7% of those completing the survey were 40 and older. 36.7% were 50 and older. The oldest was over 80.
3. Clients have low literacy rates and will not be able to read/take an online survey without someone to assist them – where is the savings in staff time?
System read aloud to the clients. Limited need for assistance. Savings in staff time ABUNDANT!
Results/Myths dispelled4. Any online system will still need to be bi-lingual and interpret
Spanish language results.
The questions and answers appear and are read in both Spanish and English languages.
5. Clients will not trust the program
No reported client fears. More than 450 have completed the survey to date.
6. The survey is too long – clients will not complete it.
82.1% of those beginning the survey completed the survey. The median time necessary to complete the survey is 21 minutes…. About 7-9 minutes longer than it averaged a focus group to take the 21 question paper survey.
7. Installing computer software is going to be a problem.
Web-based system. Nothing to install.
Results/Myths dispelled
7. Clients will not complete the survey without an incentive.
> 11% of those completing the survey declined their incentive – totaling $520 – which was extended to other survey participants.
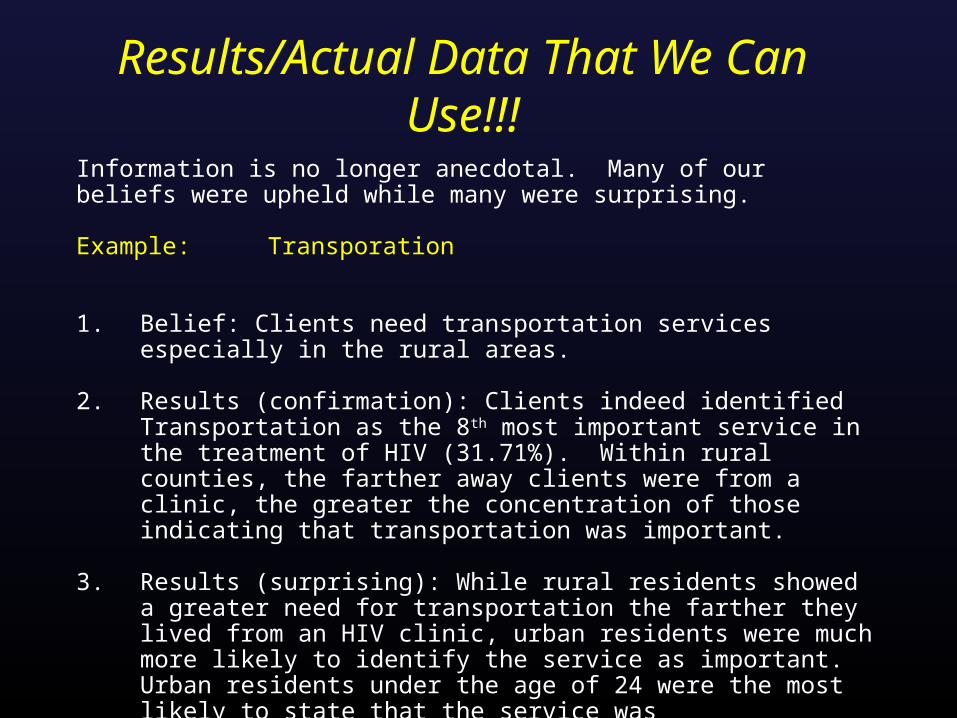
Results/Actual Data That We Can Use!!!
Information is no longer anecdotal. Many of our beliefs were upheld while many were surprising.
Example: Transporation
1. Belief: Clients need transportation services especially in the rural areas.
2. Results (confirmation): Clients indeed identified Transportation as the 8th most important service in the treatment of HIV (31.71%). Within rural counties, the farther away clients were from a clinic, the greater the concentration of those indicating that transportation was important.
3. Results (surprising): While rural residents showed a greater need for transportation the farther they lived from an HIV clinic, urban residents were much more likely to identify the service as important. Urban residents under the age of 24 were the most likely to state that the service was needed/important.
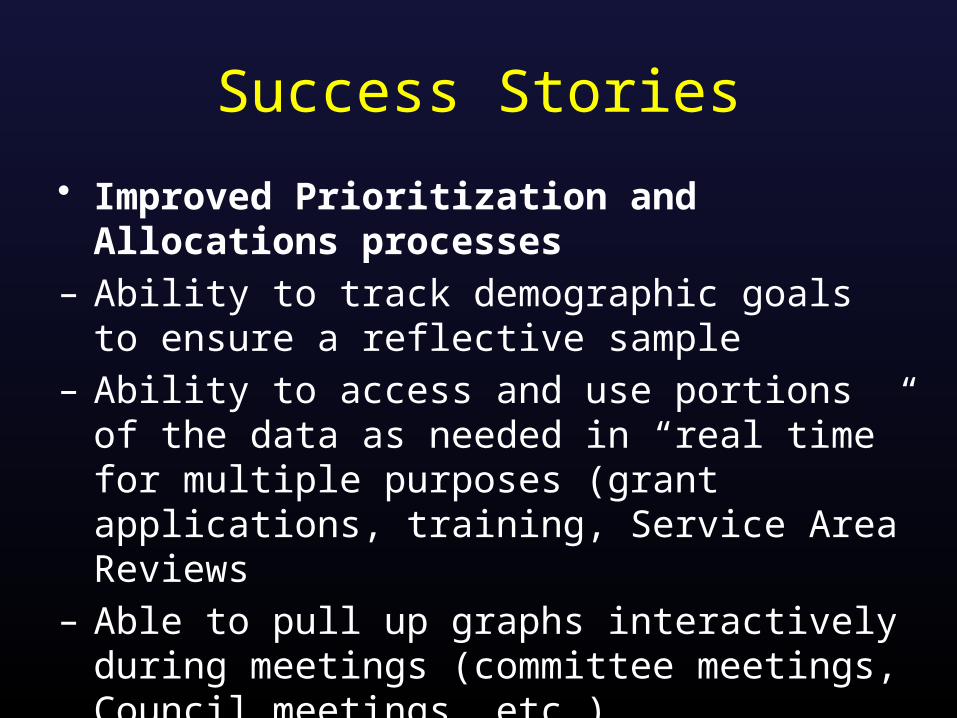
Success Stories
• Improved Prioritization and Allocations processes
– Ability to track demographic goals to ensure a reflective sample
– Ability to access and use portions of the data as needed in “real time” for multiple purposes (grant applications, training, Service Area Reviews
– Able to pull up graphs interactively during meetings (committee meetings, Council meetings, etc.)
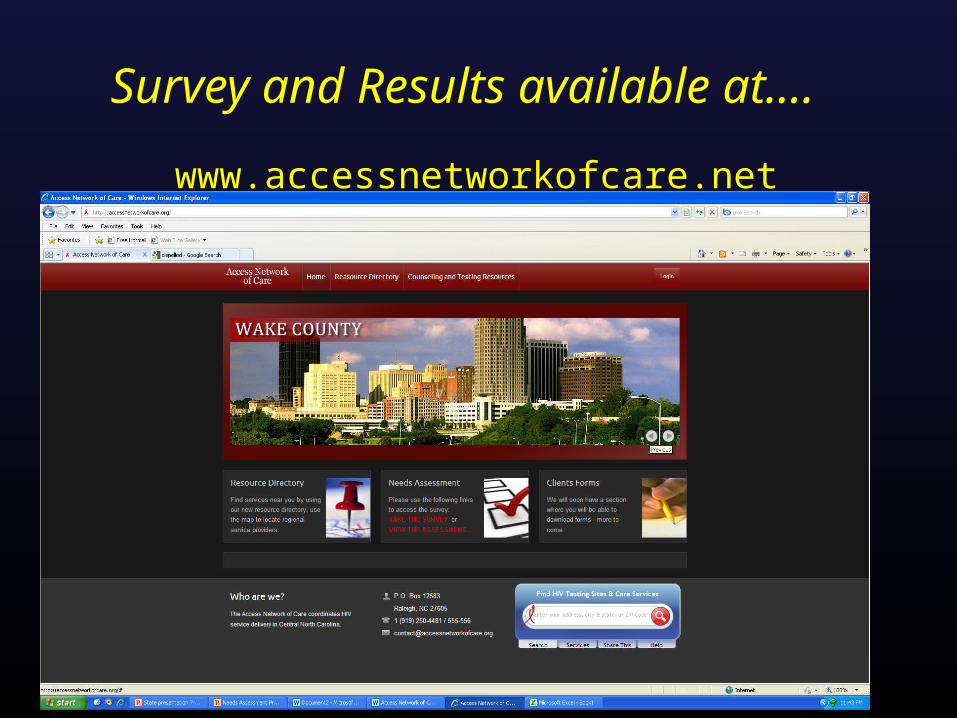
Survey and Results available at….
www.accessnetworkofcare.net

132,000 pages of paper saved
and counting…
Thanks!
Thanks!

Where We Are Going
1. Client Satisfaction
2. Rolling Needs Assessment
3. Tailored Action Buttons
4. Online, Interactive Resource Guide
5. The Collaboration Continues… (e.g., screenings added to next round)

Practical Lessons for Replication1. Find a few key champions on the planning body,
grantee, and quality team.
2. Utilize a web-based architecture to minimize management and maintenance headaches and costs.
3. Choose a systems partner and consultant who operates on a human-centered approach (not technical approach) and has experience with surveying special populations.
4. Just do it. Don’t be paralyzed with logistics. Evolve protocol and system based on experience.

Lesson: How did we accomplish this?
One bite at a time.

Q&A

Thank you for your time!