Embed Size (px)
Citation preview
Wisconsin Elections Commissioners
Ann S. Jacobs, chair | Marge Bostelmann | Julie M. Glancey | Dean Knudson | Robert Spindell | Mark L. Thomsen _________________________________________________________________________________________________________
Administrator Meagan Wolfe
November 3, 2020
Election Data Report February 3, 2021

November 3, 2020 Election Data Report Page 2
Page 2
TABLE OF CONTENTS
SECTION PAGE
EXECUTIVE SUMMARY 3
ELECTION DATA
General Information 4
Election Preparation 5
Absentee Voting 11
Special Voting Deputies 14
Indefinitely Confined Voters 15
E.R.I.C. Movers List Voters 18
SUPPLEMENTAL DATA 21
November 3, 2020 Election Data Report Page 3
Page 3
I. Executive Summary
In the 2020 General Election, Wisconsin clerks and their staffs demonstrated nearly limitless dedication to successfully serve a record number of voters during a global pandemic. These local election officials, in 1,850 municipalities and 72 counties, have the statutory responsibility to perform the hard work of running elections in Wisconsin. Thousands of election officials across the state worked countless nights and weekends to deliver a well-administered election despite the challenges of an ongoing pandemic, a battle against election misinformation, and a heightened level of scrutiny which often unfairly villainized them for simply doing their jobs. Local election officials received support from the small staff of just 31 full-time employees at the Wisconsin Elections Commission who provided around-the-clock training and technical support. In the lead up to the General Election, some election officials worked more than 50 consecutive days without pause. They deserve our gratitude.
The data contained in this report represents the labor of tens of thousands of volunteer poll workers and officials in every town, village, city, and county in Wisconsin. The figures are exceptional:
• Nearly 3.3 million Wisconsin residents voted in the General Election – representing more than 72% of the state’s Voting Age Population of 4,536,417.
• An entirely new absentee ballot tracking system on MyVote Wisconsin was used more than 1.5 million times by Wisconsin voters.
• Wisconsin Elections Commission staff responded to over 300 calls and emails per hour on Election Day.
• Clerks in nearly every town, village, and city in Wisconsin processed more absentee ballot requests than ever before – nearly 2 million statewide.
• In-person voting on Election Day more than tripled between April and November, which required election officials to manage both the increase in absentee voting and prepare for high voter turnout on November 3.
Despite these superlatives, this report does not conclude that the 2020 General Election was without difficulties or room for improvement. The massive increase in by-mail absentee voting this year revealed public confusion about the process and differing opinions about previously obscure statutory provisions. More than a quarter-million Wisconsin voters chose to certify they were indefinitely confined under Wis. Stat. § 6.86(2)(a), generating controversy over their right to do so. Likewise, long-term care facilities accustomed to the assistance of Special Voting Deputies had to make do without hands-on support. The concerns expressed by many residents after the election – founded or not – suggest election officials should continue to seek greater transparency, simplicity, and clarity in election processes. Sharing data openly, as with this report, is one step toward that goal.
November 3, 2020 Election Data Report Page 4
Page 4
II. Election Data
A. General Information
The 2020 General Election saw record voter turnout despite the ongoing COVID-19 pandemic. Having experienced the April 7 Spring Election and Presidential Preference Primary, both voters and election officials modified their behavior for the General Election. As compared with April, a greater percentage of voters chose to vote in person at their local polling place. Voters who chose to vote absentee submitted their requests well in advance of the deadline as compared with the many last-minute requests received near April 7. Finally, the General Election saw a smaller percentage of voters claiming indefinitely confined status than did in April. Election officials were likewise better prepared for November, with ample time to prepare for increased mail volume and refined plans to establish safe polling places in a pandemic.
This report summarizes data regarding voter behavior in the 2020 General Election. Most of the data contained in this report was recorded by town, village, city, or county clerks in the statewide voter registration and election administration system. Although this report aggregates the information at a high level, nearly all the information contained within can be broken down by county, municipality, and reporting unit, down to individual voters.
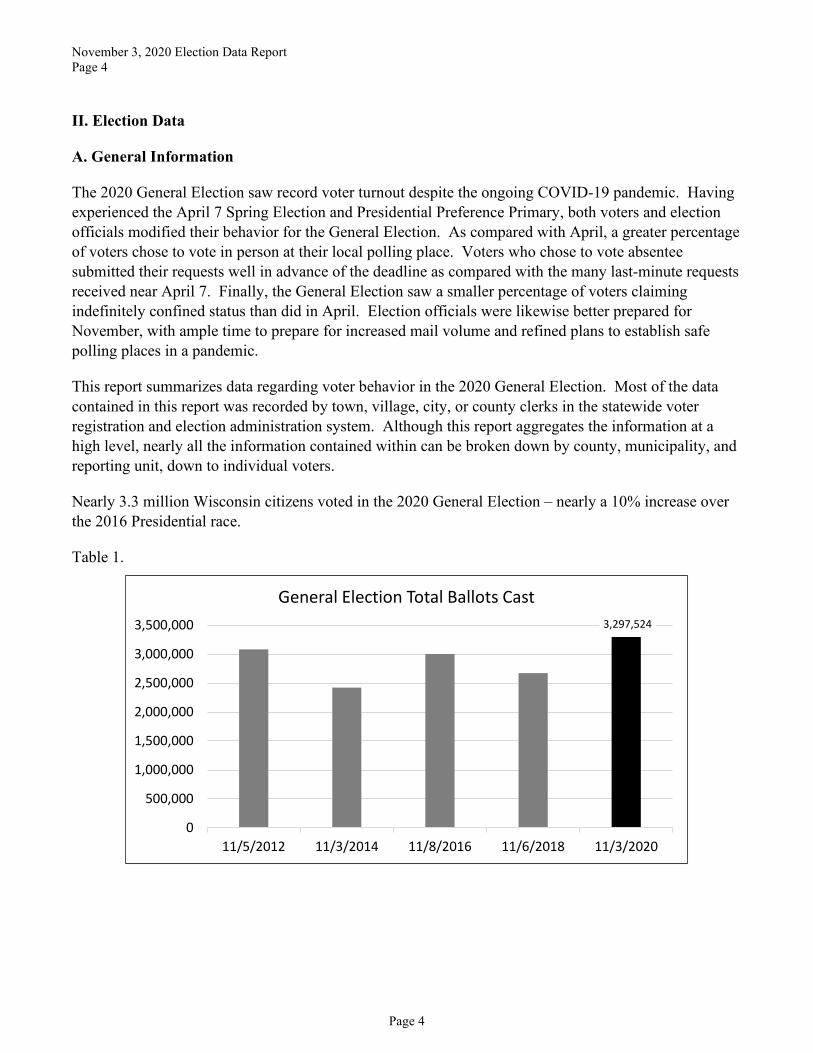
Nearly 3.3 million Wisconsin citizens voted in the 2020 General Election – nearly a 10% increase over the 2016 Presidential race.
Table 1.
3,297,524
0
500,000
1,000,000
1,500,000
2,000,000
2,500,000
3,000,000
3,500,000
11/5/2012 11/3/2014 11/8/2016 11/6/2018 11/3/2020
General Election Total Ballots Cast

November 3, 2020 Election Data Report Page 5
Page 5
B. Election Preparation
In preparation for the General Election, the WEC implemented many improvements based on lessons learned in April. Between April and November, the WEC expanded the Clerk Advisory Committee program, implemented biweekly meetings with County Clerks, and introduced open Q&A sessions for all election officials. In response to clerk and voter requests, the WEC developed voter education and poll worker training materials, implemented USPS mail tracking tools, and reinforced monitoring of election systems. Local clerks across the state contributed to these initiatives while simultaneously managing absentee ballot requests, establishing safe polling places, recruiting, and training poll workers, and continuous maintenance of the voter registration list.
Maintenance of the voter registration list is a never-ending process conducted almost entirely by clerks at the local level. The statewide voter registration system is a living, dynamic system where data is entered daily and each of the 1,850 municipal clerks are responsible for examining voter records to ensure the accuracy of the registration lists, poll books, and absentee ballot logs. WEC provides the technological framework for this process and monitors compliance to make sure appropriate action is taken.
When a voter record requires attention, the clerk responsible for maintaining that record receives an electronic alert in the voter registration database through a process called “registration list alerts.” In the months before a major election there are many registration list alerts, as voters are re-registering at new addresses to prepare for election day. The number of alerts reaches almost zero on the days that poll books are printed. This data, along with all election data, is also available for parties, candidates, media, and the public to purchase and analyze through the WEC’s data request system. Registration list alerts fall in three categories as follows:
a) New Voter Registrations. On 10/15/2020 these alerts represented 98.8% of the total registration list alerts. For any voter who moves or changes their name, the clerk must merge their new record with their former record. There are thousands of these coming in every day, especially during open registration, because as voters submit a new registration either through MyVote, or by mail, that new registration creates a registration list alert. There were fewer new registration list alerts after the close of online/by-mail voter registration on October 14, 2020.
b) Deceased. On 10/15/2020, 0.9% of the total registration list alerts were due to possible death matches in the system. This data comes from the Wisconsin Department of Health Services monthly. In addition to the data about deceased voters provided to clerks through the registration list alert process, they may also independently receive this information from obituaries and other sources.
c) Felon. On 10/15/2020 this represented 0.2% of the total registration list alerts. This data comes from the Wisconsin Department of Corrections nightly and identifies all Wisconsin residents whose voting rights have been restricted due to a felony conviction.
November 3, 2020 Election Data Report Page 6
Page 6
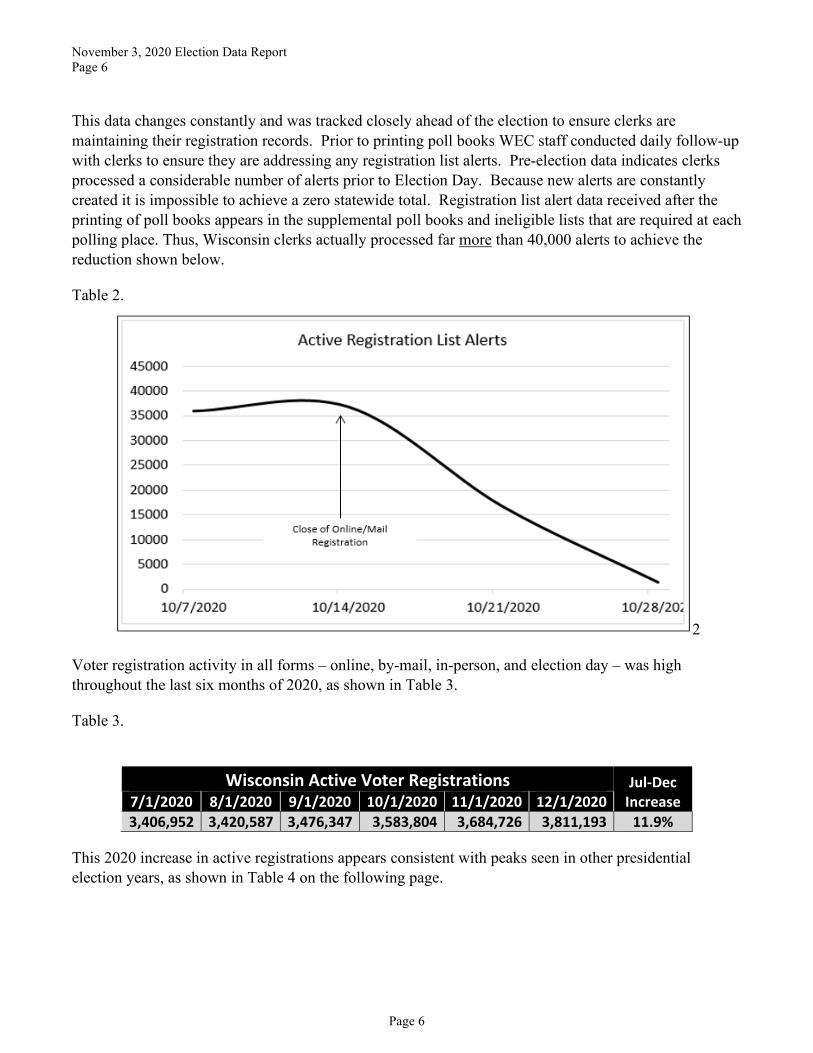
This data changes constantly and was tracked closely ahead of the election to ensure clerks are maintaining their registration records. Prior to printing poll books WEC staff conducted daily follow-up with clerks to ensure they are addressing any registration list alerts. Pre-election data indicates clerks processed a considerable number of alerts prior to Election Day. Because new alerts are constantly created it is impossible to achieve a zero statewide total. Registration list alert data received after the printing of poll books appears in the supplemental poll books and ineligible lists that are required at each polling place. Thus, Wisconsin clerks actually processed far more than 40,000 alerts to achieve the reduction shown below.
Table 2.
2
Voter registration activity in all forms – online, by-mail, in-person, and election day – was high throughout the last six months of 2020, as shown in Table 3.
Table 3.
Wisconsin Active Voter Registrations Jul-Dec Increase 7/1/2020 8/1/2020 9/1/2020 10/1/2020 11/1/2020 12/1/2020
3,406,952 3,420,587 3,476,347 3,583,804 3,684,726 3,811,193 11.9%
This 2020 increase in active registrations appears consistent with peaks seen in other presidential election years, as shown in Table 4 on the following page.

November 3, 2020 Election Data Report Page 7
Page 7
Table 4.
Throughout the summer and fall of 2020, WEC staff also worked closely with the USPS, meeting weekly to improve service and investigate concerns over by-mail absentee ballots. With the assistance of the USPS Lakeland and Northland Districts, the WEC implemented absentee ballot tracking from USPS via their Intelligent Barcode and Informed Visibility mail tracking system. These systems provided Wisconsin voters one-way visibility for outgoing ballots coming from their municipal clerk, but future iterations will provide more detail and an option for two-way tracking. In the weeks ahead of Election Day, ballot tracking turned out to be one of the most popular tools on the MyVote Wisconsin website.
Table 5.
Top Ten Visited Pages (myvote.wi.gov) Number of Unique Sessions 10/11/2020-11/5/2020
1. My Voter Info 2,507,692 2. Track My Ballot 1,520,268 3. Where is my Polling Place 1,201,563 4. Register to Vote 1,070,632 5. Request an Absentee 642,456 6. Find My Municipal Clerk 274,444 7. What is on My Ballot 428,550 8. Update Name/Address 355,192 9. Absentee Options 67,163 10. Be a Poll Worker 46,690
2,000,0002,200,0002,400,0002,600,0002,800,0003,000,0003,200,0003,400,0003,600,0003,800,0004,000,000
Wisconsin Registered Voters 2008-2020

November 3, 2020 Election Data Report Page 8
Page 8
Finally, the WEC implemented additional tracking tools to enable early detection of technical issues and improve redundancy of elections systems. These changes provided technical staff greater insight into the internal processes of the voter registration database and offered near-real-time data on system performance. Fortunately, the 2020 General Election was uneventful from a technical standpoint, with no service interruptions or other problems. Approaching Election Day, the MyVote Wisconsin website averaged nearly 100,000 unique sessions per day, with more than 400,000 sessions on November 3, 2020. 1
Table 6.
Public interest in the MyVote Wisconsin website has steadily increased since its inception, however the addition of ballot tracking seems to have generated significantly more traffic for the site. Table 7.
1 A session is the entire time a single device spends on a website, which can include multiple pageviews or transactions. A user who disconnects and reconnects, or who remains inactive for 30 minutes, creates a new session.
108,294
170,546
445,415
0
100000
200000
300000
400000
500000
Nov-2016 Nov-2018 Nov-2020
MyVote Wisconsin Election Day Traffic(Unique Sessions)
November 3, 2020 Election Data Report Page 9
Page 9
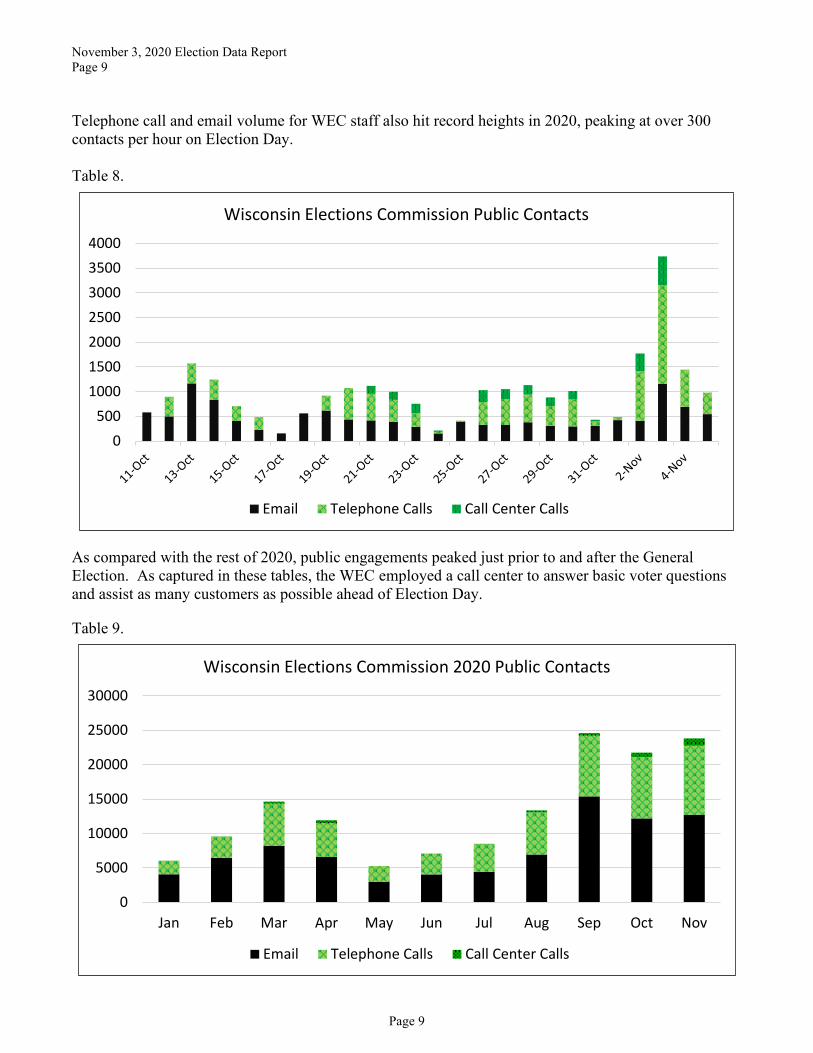
Telephone call and email volume for WEC staff also hit record heights in 2020, peaking at over 300 contacts per hour on Election Day. Table 8.
As compared with the rest of 2020, public engagements peaked just prior to and after the General Election. As captured in these tables, the WEC employed a call center to answer basic voter questions and assist as many customers as possible ahead of Election Day.
Table 9.
0500
1000150020002500300035004000
Wisconsin Elections Commission Public Contacts
Email Telephone Calls Call Center Calls
0
5000
10000
15000
20000
25000
30000
Jan Feb Mar Apr May Jun Jul Aug Sep Oct Nov
Wisconsin Elections Commission 2020 Public Contacts
Email Telephone Calls Call Center Calls
November 3, 2020 Election Data Report Page 10
Page 10
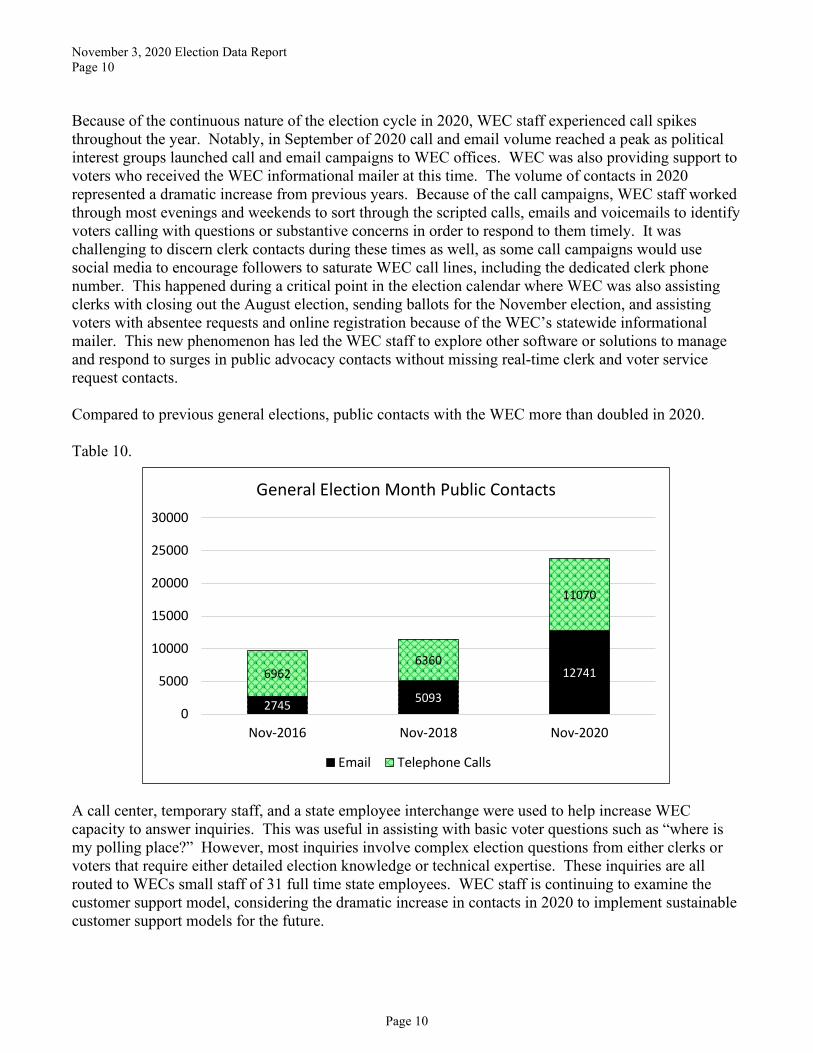
Because of the continuous nature of the election cycle in 2020, WEC staff experienced call spikes throughout the year. Notably, in September of 2020 call and email volume reached a peak as political interest groups launched call and email campaigns to WEC offices. WEC was also providing support to voters who received the WEC informational mailer at this time. The volume of contacts in 2020 represented a dramatic increase from previous years. Because of the call campaigns, WEC staff worked through most evenings and weekends to sort through the scripted calls, emails and voicemails to identify voters calling with questions or substantive concerns in order to respond to them timely. It was challenging to discern clerk contacts during these times as well, as some call campaigns would use social media to encourage followers to saturate WEC call lines, including the dedicated clerk phone number. This happened during a critical point in the election calendar where WEC was also assisting clerks with closing out the August election, sending ballots for the November election, and assisting voters with absentee requests and online registration because of the WEC’s statewide informational mailer. This new phenomenon has led the WEC staff to explore other software or solutions to manage and respond to surges in public advocacy contacts without missing real-time clerk and voter service request contacts. Compared to previous general elections, public contacts with the WEC more than doubled in 2020. Table 10.
A call center, temporary staff, and a state employee interchange were used to help increase WEC capacity to answer inquiries. This was useful in assisting with basic voter questions such as “where is my polling place?” However, most inquiries involve complex election questions from either clerks or voters that require either detailed election knowledge or technical expertise. These inquiries are all routed to WECs small staff of 31 full time state employees. WEC staff is continuing to examine the customer support model, considering the dramatic increase in contacts in 2020 to implement sustainable customer support models for the future.
2745 5093
1274169626360
11070
0
5000
10000
15000
20000
25000
30000
Nov-2016 Nov-2018 Nov-2020
General Election Month Public Contacts
Email Telephone Calls

November 3, 2020 Election Data Report Page 11
Page 11
B. Absentee Voting
Absentee voting remained exceptionally popular for the 2020 General Election but to a lesser degree than in April. Instead, voting at the polls on Election Day increased from 25% of ballots cast on April 7 to just over 40% on November 3. This figure, however, remains well below Wisconsin’s historical average of 70%-80% election day voting. Table 11.
Table 12. Table 13.
22.5%
4.3% 5.6%15.5%
6.7% 12.6% 18.9%
4.8%
6.9% 5.3%
6.2%
5.4%
62.0%40.8%
72.7%88.8% 89.1%
78.3%87.9%
25.4%40.3%
0.0%
10.0%
20.0%
30.0%
40.0%
50.0%
60.0%
70.0%
80.0%
90.0%
100.0%
11/8/2016 4/4/2017 4/3/2018 11/6/2018 4/2/2019 4/7/2020 11/3/2020
Voting Methods 2016-2020
In Person Absentee By Mail Absentee Election Day
0
500,000
1,000,000
1,500,000
2,000,000
2,500,000
Absentee Ballots Cast
0
500,000
1,000,000
1,500,000
2,000,000
2,500,000
Election Day Ballots Cast
November 3, 2020 Election Data Report Page 12
Page 12
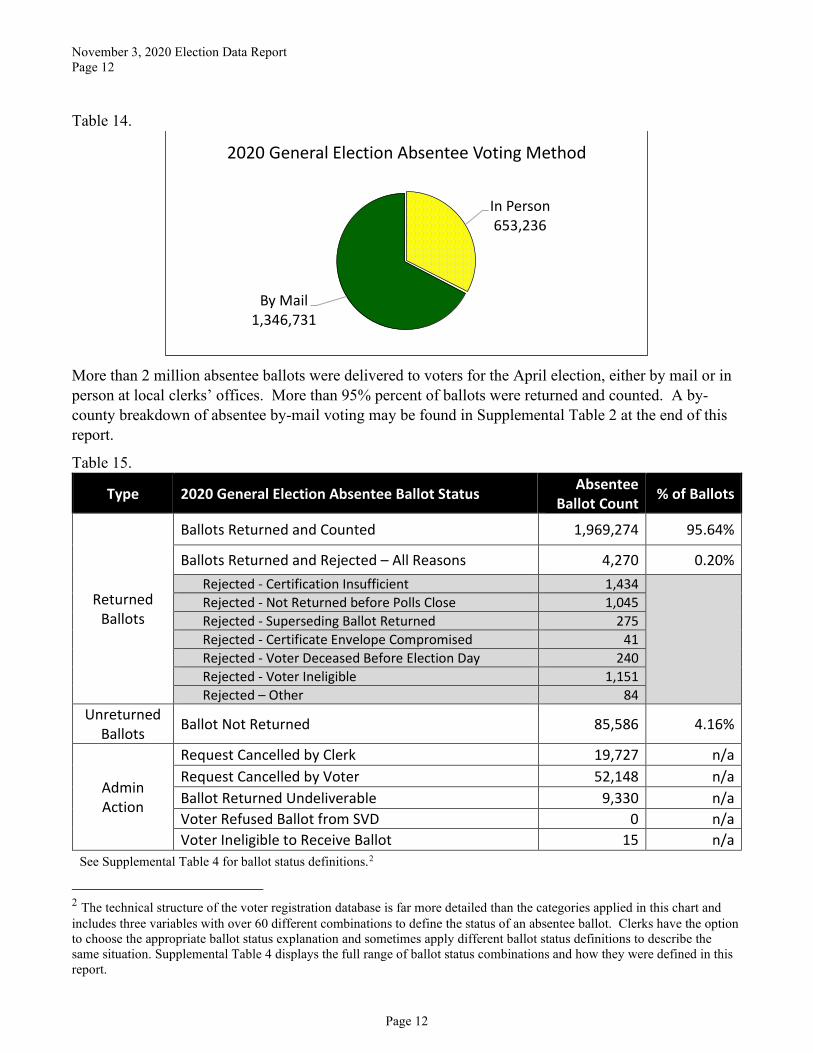
Table 14.
More than 2 million absentee ballots were delivered to voters for the April election, either by mail or in person at local clerks’ offices. More than 95% percent of ballots were returned and counted. A by-county breakdown of absentee by-mail voting may be found in Supplemental Table 2 at the end of this report.
Table 15.
Type 2020 General Election Absentee Ballot Status Absentee Ballot Count % of Ballots
Returned Ballots
Ballots Returned and Counted 1,969,274 95.64%
Ballots Returned and Rejected – All Reasons 4,270 0.20% Rejected - Certification Insufficient 1,434
Rejected - Not Returned before Polls Close 1,045 Rejected - Superseding Ballot Returned 275 Rejected - Certificate Envelope Compromised 41 Rejected - Voter Deceased Before Election Day 240 Rejected - Voter Ineligible 1,151 Rejected – Other 84
Unreturned Ballots Ballot Not Returned 85,586 4.16%
Admin Action
Request Cancelled by Clerk 19,727 n/a Request Cancelled by Voter 52,148 n/a Ballot Returned Undeliverable 9,330 n/a Voter Refused Ballot from SVD 0 n/a Voter Ineligible to Receive Ballot 15 n/a
See Supplemental Table 4 for ballot status definitions.2
2 The technical structure of the voter registration database is far more detailed than the categories applied in this chart and includes three variables with over 60 different combinations to define the status of an absentee ballot. Clerks have the option to choose the appropriate ballot status explanation and sometimes apply different ballot status definitions to describe the same situation. Supplemental Table 4 displays the full range of ballot status combinations and how they were defined in this report.
In Person653,236
By Mail1,346,731
2020 General Election Absentee Voting Method
November 3, 2020 Election Data Report Page 13
Page 13
News reports and social media rumors of postal service problems may have contributed to a shift away from voting by mail. Some clerks reported that voters were cancelling their by-mail absentee ballot requests in favor of voting in-person absentee or in-person on Election Day. While these reports are anecdotal, more than 52,000 cancelled absentee ballot requests seem to support this claim.
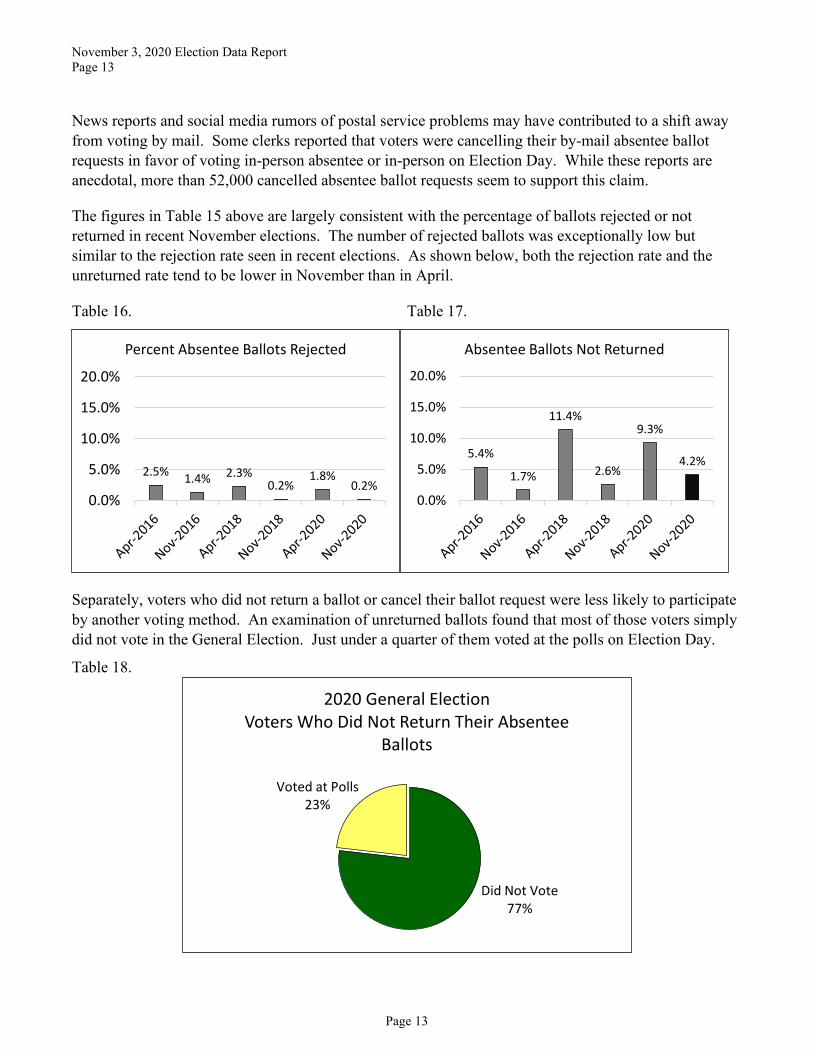
The figures in Table 15 above are largely consistent with the percentage of ballots rejected or not returned in recent November elections. The number of rejected ballots was exceptionally low but similar to the rejection rate seen in recent elections. As shown below, both the rejection rate and the unreturned rate tend to be lower in November than in April.
Table 16. Table 17.
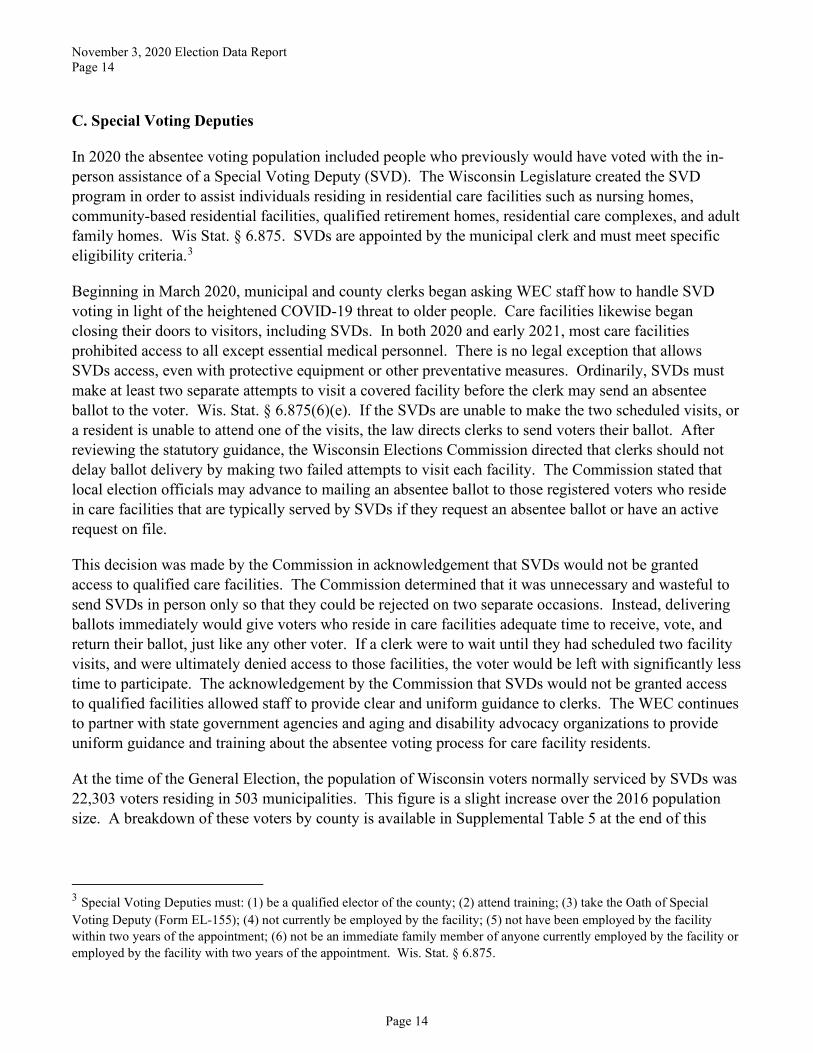
Separately, voters who did not return a ballot or cancel their ballot request were less likely to participate by another voting method. An examination of unreturned ballots found that most of those voters simply did not vote in the General Election. Just under a quarter of them voted at the polls on Election Day.
Table 18.
2.5% 1.4% 2.3%0.2%
1.8%0.2%
0.0%
5.0%
10.0%
15.0%
20.0%
Percent Absentee Ballots Rejected
5.4%
1.7%
11.4%
2.6%
9.3%
4.2%
0.0%
5.0%
10.0%
15.0%
20.0%
Absentee Ballots Not Returned
Did Not Vote77%
Voted at Polls23%
2020 General ElectionVoters Who Did Not Return Their Absentee
Ballots
November 3, 2020 Election Data Report Page 14
Page 14
C. Special Voting Deputies
In 2020 the absentee voting population included people who previously would have voted with the in-person assistance of a Special Voting Deputy (SVD). The Wisconsin Legislature created the SVD program in order to assist individuals residing in residential care facilities such as nursing homes, community-based residential facilities, qualified retirement homes, residential care complexes, and adult family homes. Wis Stat. § 6.875. SVDs are appointed by the municipal clerk and must meet specific eligibility criteria.3
Beginning in March 2020, municipal and county clerks began asking WEC staff how to handle SVD voting in light of the heightened COVID-19 threat to older people. Care facilities likewise began closing their doors to visitors, including SVDs. In both 2020 and early 2021, most care facilities prohibited access to all except essential medical personnel. There is no legal exception that allows SVDs access, even with protective equipment or other preventative measures. Ordinarily, SVDs must make at least two separate attempts to visit a covered facility before the clerk may send an absentee ballot to the voter. Wis. Stat. § 6.875(6)(e). If the SVDs are unable to make the two scheduled visits, or a resident is unable to attend one of the visits, the law directs clerks to send voters their ballot. After reviewing the statutory guidance, the Wisconsin Elections Commission directed that clerks should not delay ballot delivery by making two failed attempts to visit each facility. The Commission stated that local election officials may advance to mailing an absentee ballot to those registered voters who reside in care facilities that are typically served by SVDs if they request an absentee ballot or have an active request on file.
This decision was made by the Commission in acknowledgement that SVDs would not be granted access to qualified care facilities. The Commission determined that it was unnecessary and wasteful to send SVDs in person only so that they could be rejected on two separate occasions. Instead, delivering ballots immediately would give voters who reside in care facilities adequate time to receive, vote, and return their ballot, just like any other voter. If a clerk were to wait until they had scheduled two facility visits, and were ultimately denied access to those facilities, the voter would be left with significantly less time to participate. The acknowledgement by the Commission that SVDs would not be granted access to qualified facilities allowed staff to provide clear and uniform guidance to clerks. The WEC continues to partner with state government agencies and aging and disability advocacy organizations to provide uniform guidance and training about the absentee voting process for care facility residents.
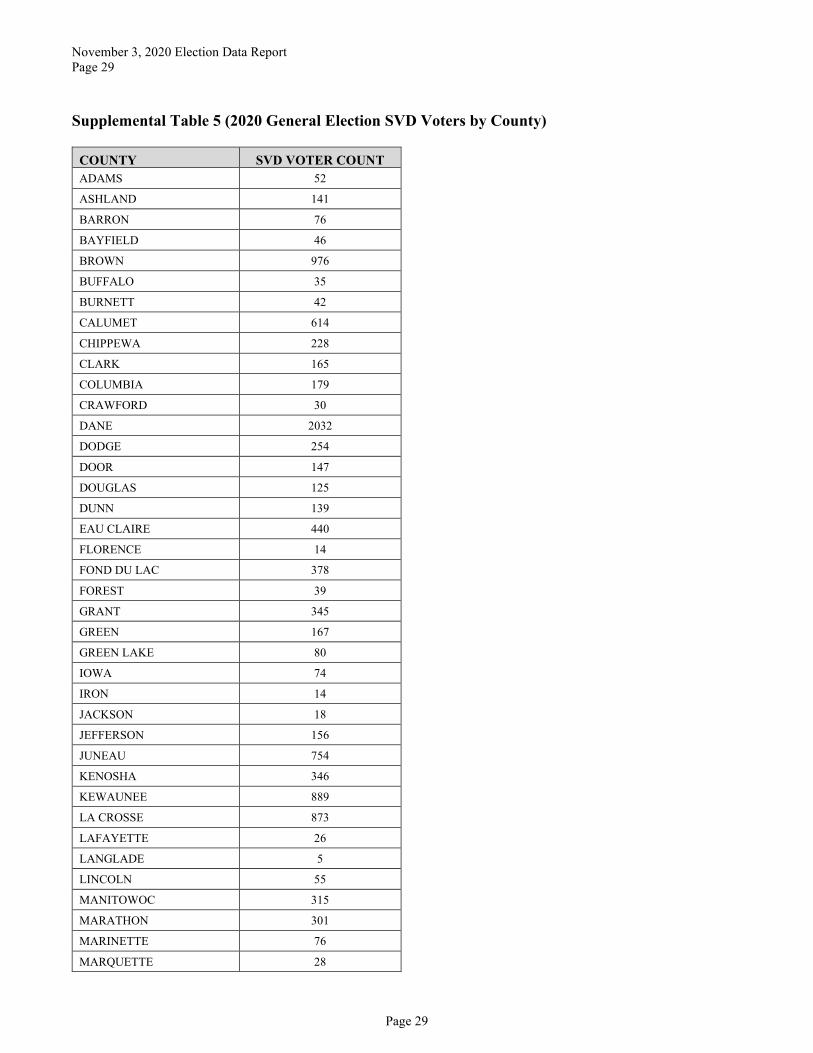
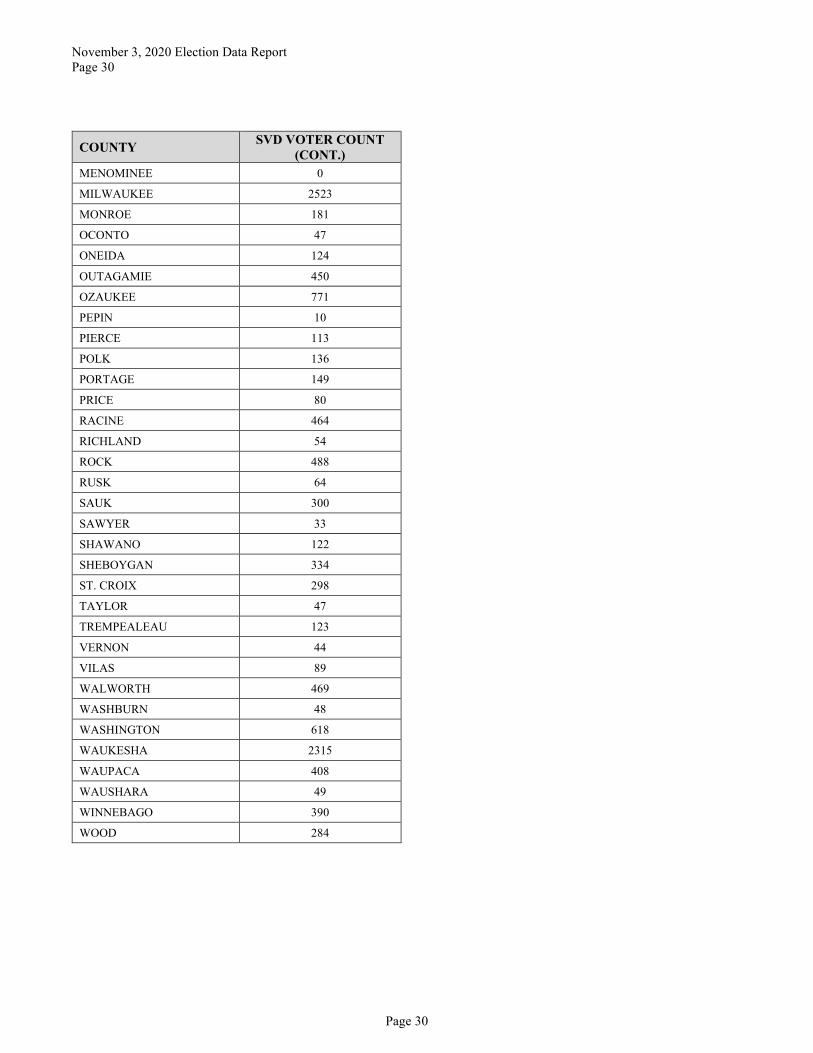
At the time of the General Election, the population of Wisconsin voters normally serviced by SVDs was 22,303 voters residing in 503 municipalities. This figure is a slight increase over the 2016 population size. A breakdown of these voters by county is available in Supplemental Table 5 at the end of this
3 Special Voting Deputies must: (1) be a qualified elector of the county; (2) attend training; (3) take the Oath of Special Voting Deputy (Form EL-155); (4) not currently be employed by the facility; (5) not have been employed by the facility within two years of the appointment; (6) not be an immediate family member of anyone currently employed by the facility or employed by the facility with two years of the appointment. Wis. Stat. § 6.875.

November 3, 2020 Election Data Report Page 15
Page 15
report. The data below shows the population that was scheduled to be served by SVDs, plus those active registered voters who previously were served by SVD but this year requested a by-mail absentee ballot.
Table 19. Special Voting Deputy Population Size November 2016: 21,703 November 2020: 22,303
Table 20.
D. Indefinitely Confined Voters
Another group generating considerable interest in 2020 was the subset of voters who certified they were indefinitely confined. The Wisconsin statutes state that an elector who is indefinitely confined because of age, physical illness or infirmity or is disabled for an indefinite period may by signing a statement to that effect require that an absentee ballot be sent to the elector automatically for every election. Wis. Stat. § 6.86(2)(a). 2011 Wisconsin Act 23, the voter photo ID law, exempted voters who certify that they are indefinitely confined from providing their clerk with a copy of their acceptable photo ID in order to receive an absentee ballot; instead, state law allows their witness to verify their identity.
As the pandemic worsened in March 2020 and Wisconsin went into a lockdown, many voters looked at their options for absentee voting in light of technological challenges to providing their municipal clerk with a copy of their photo ID. This was especially true for voters without ready access to a smartphone, digital camera, scanner, or photocopying machine. There was a great deal of public discussion about whether the pandemic and stay-at-home order meant all, or most, voters were indefinitely confined. At its meeting of March 27, 2020, the Wisconsin Elections Commission adopted the following guidance related to the use of indefinitely confined status to assist local election officials working with absentee voters:
Indefinitely Confined
18489
Presidential Only
3
Regular3807
s
November 3, 2020 Election Data Report Page 16
Page 16
1. Designation of indefinitely confined status is for each individual voter to make based upon their current circumstance. It does not require permanent or total inability to travel outside of the residence. The designation is appropriate for electors who are indefinitely confined because of age, physical illness or infirmity or are disabled for an indefinite period.
2. Indefinitely confined status shall not be used by electors simply as a means to avoid the photo ID requirement without regard to whether they are indefinitely confined because of age, physical illness, infirmity or disability.
This guidance was and is consistent with and supplements previous statements of the WEC related to absentee voters who may qualify as indefinitely confined or “permanent” absentee voters.
Due to the heightened interest in this subset of ballots, WEC staff examined the available data regarding indefinitely confined voting in the General Election. It is important to note that Wisconsin election systems do not associate “indefinitely confined” status with a voter record. The status is associated only with an active absentee application and does not exist independently of the absentee ballot process.
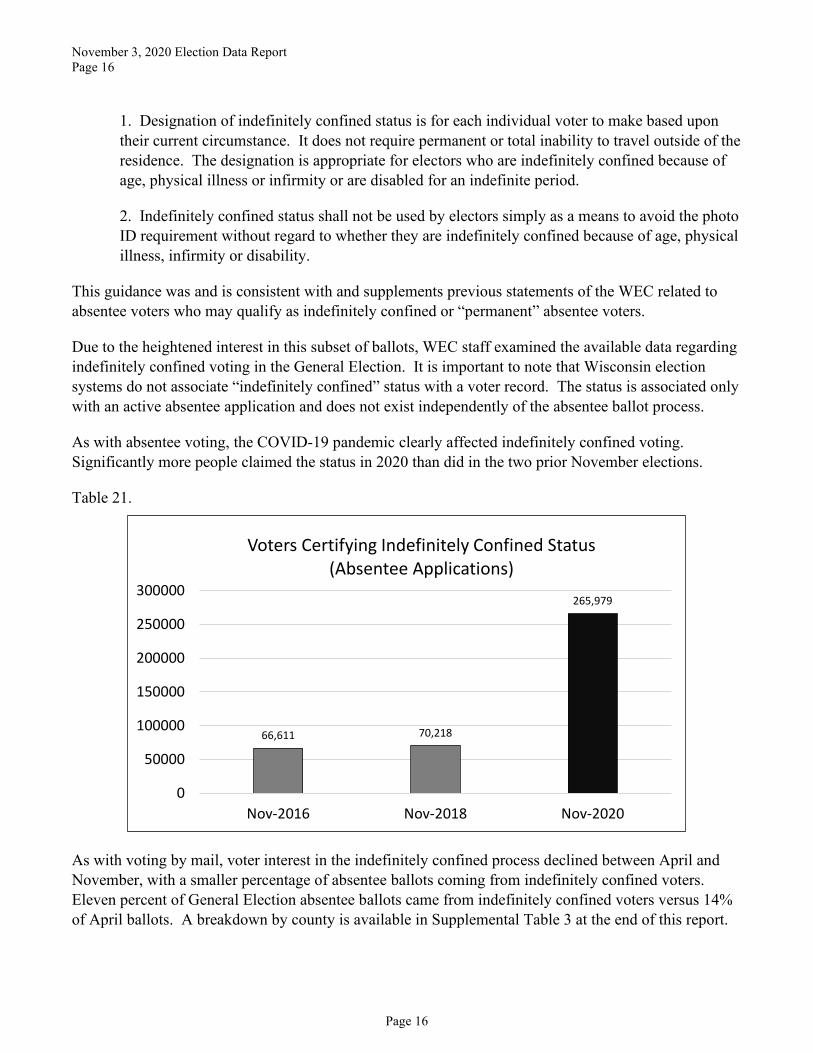
As with absentee voting, the COVID-19 pandemic clearly affected indefinitely confined voting. Significantly more people claimed the status in 2020 than did in the two prior November elections.
Table 21.
As with voting by mail, voter interest in the indefinitely confined process declined between April and November, with a smaller percentage of absentee ballots coming from indefinitely confined voters. Eleven percent of General Election absentee ballots came from indefinitely confined voters versus 14% of April ballots. A breakdown by county is available in Supplemental Table 3 at the end of this report.
66,611 70,218
265,979
0
50000
100000
150000
200000
250000
300000
Nov-2016 Nov-2018 Nov-2020
Voters Certifying Indefinitely Confined Status(Absentee Applications)
November 3, 2020 Election Data Report Page 17
Page 17
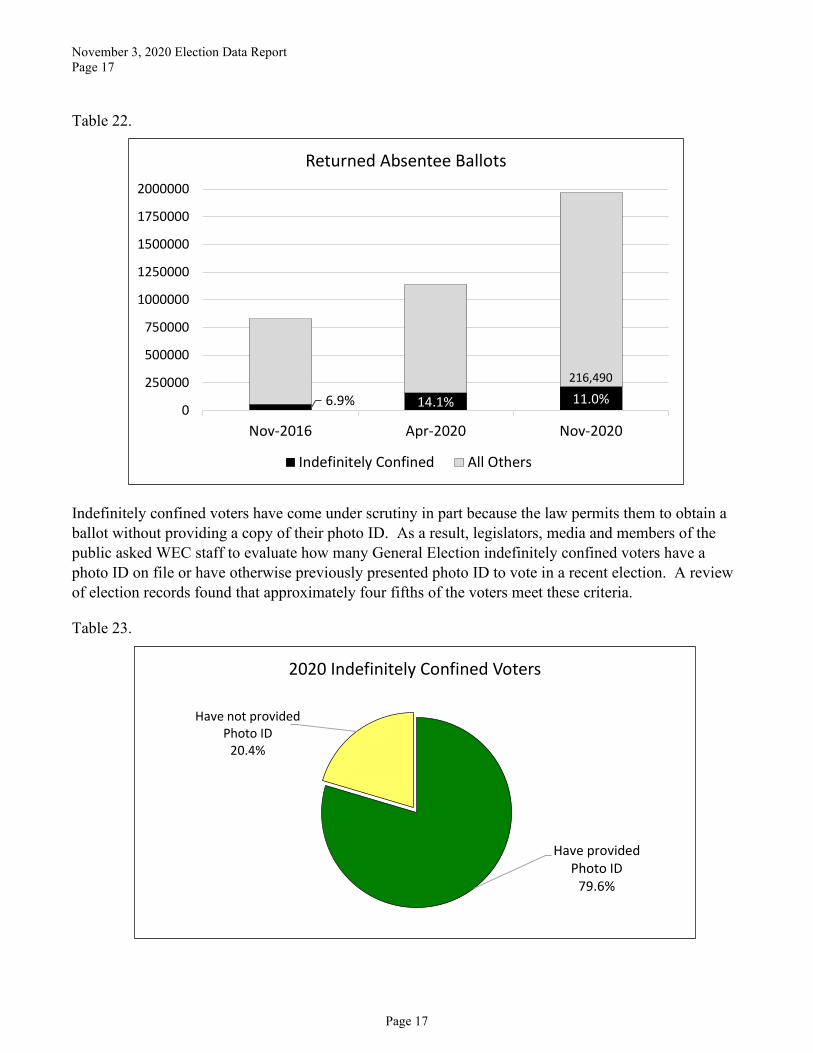
Table 22.
Indefinitely confined voters have come under scrutiny in part because the law permits them to obtain a ballot without providing a copy of their photo ID. As a result, legislators, media and members of the public asked WEC staff to evaluate how many General Election indefinitely confined voters have a photo ID on file or have otherwise previously presented photo ID to vote in a recent election. A review of election records found that approximately four fifths of the voters meet these criteria.
Table 23.
6.9% 14.1% 11.0%0
250000
500000
750000
1000000
1250000
1500000
1750000
2000000
Nov-2016 Apr-2020 Nov-2020
Returned Absentee Ballots
Indefinitely Confined All Others
216,490
Have provided Photo ID
79.6%
Have not provided Photo ID
20.4%
2020 Indefinitely Confined Voters
November 3, 2020 Election Data Report Page 18
Page 18
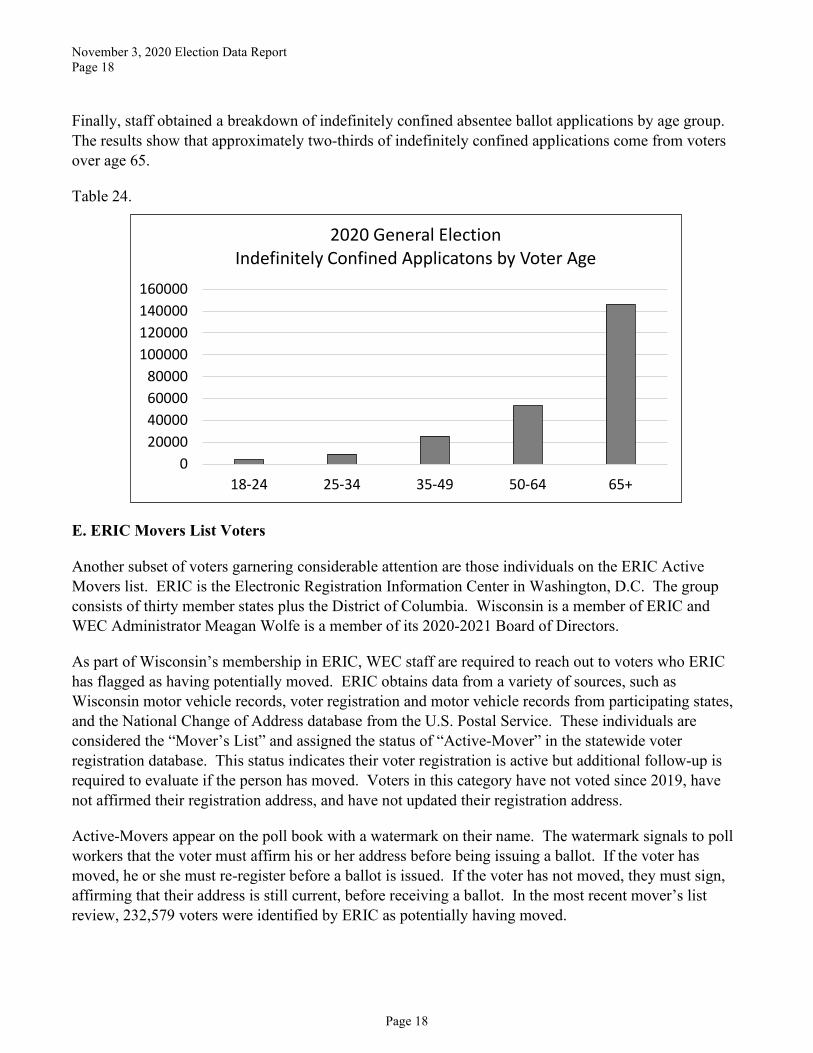
Finally, staff obtained a breakdown of indefinitely confined absentee ballot applications by age group. The results show that approximately two-thirds of indefinitely confined applications come from voters over age 65.
Table 24.
E. ERIC Movers List Voters
Another subset of voters garnering considerable attention are those individuals on the ERIC Active Movers list. ERIC is the Electronic Registration Information Center in Washington, D.C. The group consists of thirty member states plus the District of Columbia. Wisconsin is a member of ERIC and WEC Administrator Meagan Wolfe is a member of its 2020-2021 Board of Directors.
As part of Wisconsin’s membership in ERIC, WEC staff are required to reach out to voters who ERIC has flagged as having potentially moved. ERIC obtains data from a variety of sources, such as Wisconsin motor vehicle records, voter registration and motor vehicle records from participating states, and the National Change of Address database from the U.S. Postal Service. These individuals are considered the “Mover’s List” and assigned the status of “Active-Mover” in the statewide voter registration database. This status indicates their voter registration is active but additional follow-up is required to evaluate if the person has moved. Voters in this category have not voted since 2019, have not affirmed their registration address, and have not updated their registration address.
Active-Movers appear on the poll book with a watermark on their name. The watermark signals to poll workers that the voter must affirm his or her address before being issuing a ballot. If the voter has moved, he or she must re-register before a ballot is issued. If the voter has not moved, they must sign, affirming that their address is still current, before receiving a ballot. In the most recent mover’s list review, 232,579 voters were identified by ERIC as potentially having moved.
020000400006000080000
100000120000140000160000
18-24 25-34 35-49 50-64 65+
2020 General ElectionIndefinitely Confined Applicatons by Voter Age

November 3, 2020 Election Data Report Page 19
Page 19
There was extensive litigation in 2019 and 2020 regarding the ERIC Active Movers list and whether the WEC was required to deactivate those voters under Wis. Stat. § 6.50(3). While the Ozaukee County Circuit Court initially ordered the WEC to deactivate the voters, the Wisconsin Court of Appeals District 4 unanimously reversed that order and found that WEC does not have that statutory authority to deactivate those voters. The Wisconsin Supreme Court accepted the case on appeal and in September of 2020 heard oral arguments but has not yet issued a decision. The WEC is currently bound by the Court of Appeals decision, meaning it may not take action on 2019 Mover records or on future Movers data until the Wisconsin Supreme Court renders their decision.
As a result of this litigation, there was also a great deal of public misunderstanding about the purpose of the list and who was on the list. It was not uncommon to see false claims that there were more than 200,000 deceased or ineligible voters on Wisconsin’s registration list.
The number of people in “Active-Mover” status continually declines as voters either verify their status or their registration is inactivated. As of this report, the original Active-Mover group of 232,579 voters has declined to fewer than 72,000, none of whom voted in 2020. Table 25 depicts the size of the Active-Movers group over time. The current breakdown of the original group is shown below in Table 26. A detailed analysis of this data is provided as a separate memo for the Commission’s February 3, 2021 meeting.
Table 25.
232,579
129,16390,665
71,579
0
50,000
100,000
150,000
200,000
250,000
Original Report May 2020 November 2020 January 2021
ERIC Active-Mover's Group Size
November 3, 2020 Election Data Report Page 20
Page 20
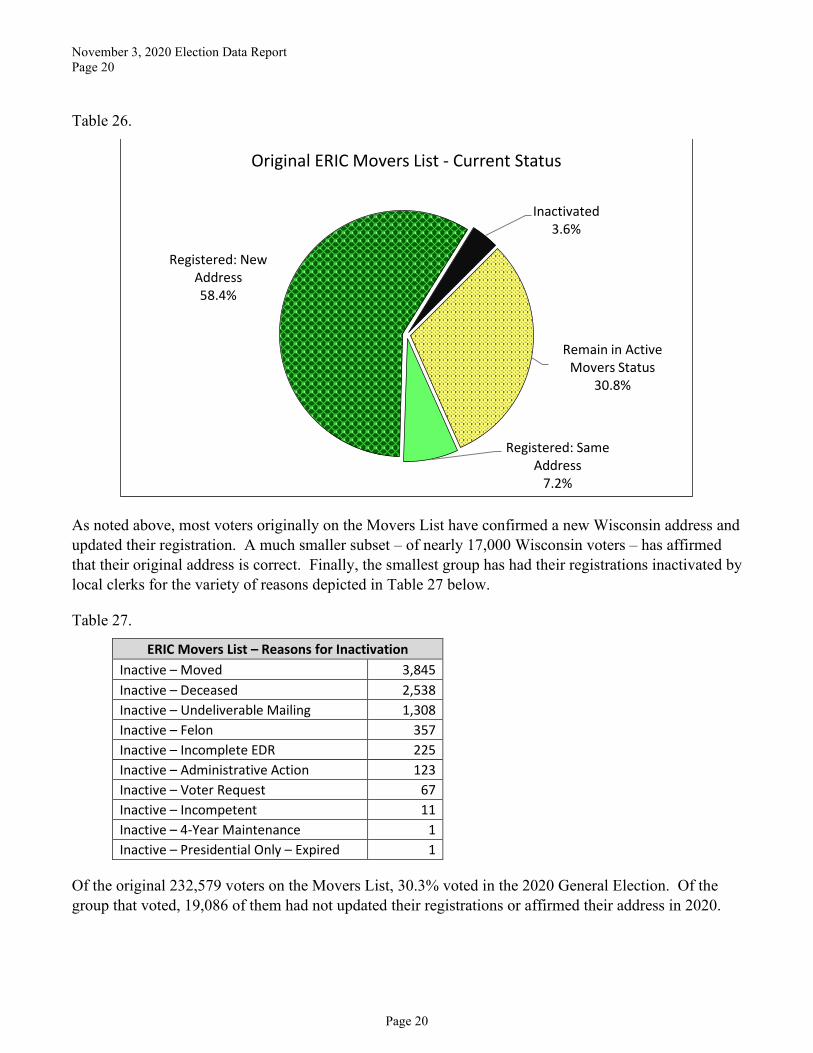
Table 26.
As noted above, most voters originally on the Movers List have confirmed a new Wisconsin address and updated their registration. A much smaller subset – of nearly 17,000 Wisconsin voters – has affirmed that their original address is correct. Finally, the smallest group has had their registrations inactivated by local clerks for the variety of reasons depicted in Table 27 below.
Table 27.
ERIC Movers List – Reasons for Inactivation Inactive – Moved 3,845 Inactive – Deceased 2,538 Inactive – Undeliverable Mailing 1,308 Inactive – Felon 357 Inactive – Incomplete EDR 225 Inactive – Administrative Action 123 Inactive – Voter Request 67 Inactive – Incompetent 11 Inactive – 4-Year Maintenance 1 Inactive – Presidential Only – Expired 1
Of the original 232,579 voters on the Movers List, 30.3% voted in the 2020 General Election. Of the group that voted, 19,086 of them had not updated their registrations or affirmed their address in 2020.
Remain in Active Movers Status
30.8%
Registered: Same Address
7.2%
Registered: New Address58.4%
Inactivated3.6%
Original ERIC Movers List - Current Status
November 3, 2020 Election Data Report Page 21
Page 21
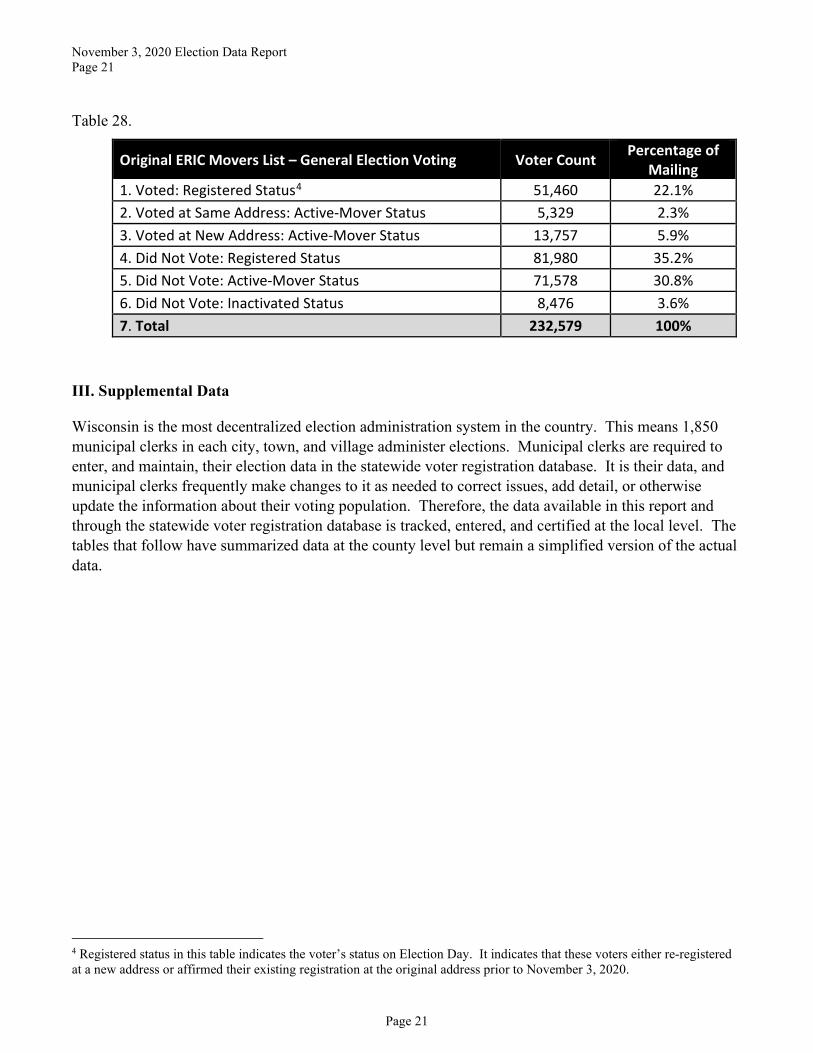
Table 28.
Original ERIC Movers List – General Election Voting Voter Count Percentage of Mailing
1. Voted: Registered Status4 51,460 22.1% 2. Voted at Same Address: Active-Mover Status 5,329 2.3% 3. Voted at New Address: Active-Mover Status 13,757 5.9% 4. Did Not Vote: Registered Status 81,980 35.2% 5. Did Not Vote: Active-Mover Status 71,578 30.8% 6. Did Not Vote: Inactivated Status 8,476 3.6% 7. Total 232,579 100%
III. Supplemental Data
Wisconsin is the most decentralized election administration system in the country. This means 1,850 municipal clerks in each city, town, and village administer elections. Municipal clerks are required to enter, and maintain, their election data in the statewide voter registration database. It is their data, and municipal clerks frequently make changes to it as needed to correct issues, add detail, or otherwise update the information about their voting population. Therefore, the data available in this report and through the statewide voter registration database is tracked, entered, and certified at the local level. The tables that follow have summarized data at the county level but remain a simplified version of the actual data.
4 Registered status in this table indicates the voter’s status on Election Day. It indicates that these voters either re-registered at a new address or affirmed their existing registration at the original address prior to November 3, 2020.

November 3, 2020 Election Data Report Page 22
Page 22
Supplemental Table 1 (List of Graphics and Charts) Table 1 General Election Total Ballots Cast Table 2 Active Registration List Alerts 10/7/2020 to 10/28/2020
Table 3 Wisconsin Voter Registration Jul-Dec 2020 Table 4 Wisconsin Voter Registration 2008-2020
Table 5 Top Ten Visited Pages (myvote.wi.gov) 10/11/2020 to 11/5/2020 Table 6 MyVote Wisconsin Unique Sessions 10/11/2020 to 11/5/2020
Table 7 MyVote Wisconsin Unique Sessions 2016, 2018, 2020 Table 8 Wisconsin Elections Commission Public Contacts 10/11/2020 to 11/5/2020
Table 9 Wisconsin Elections Commission 2020 Public Contacts Table 10 General Election Monthly Public Contacts 2016, 2018, 2020
Table 11 Voting Method by Election 2016-2020 Table 12 Absentee Ballots Cast 2016-2020
Table 13 Election Day Ballots Cast 2016-2020 Table 14 2020 General Election Absentee Voting Method Table 15 2020 General Election Absentee Ballot Status
Table 16 Percent Absentee Ballots Rejected 2016-2020 Table 17 Absentee Ballots Not Returned 2016-2020
Table 18 2020 General Election Voters Who Did Not Return Their Absentee Ballots Table 19 SVD Voting Population November 2016 and November 2020
Table 20 2020 General Election SVD Voting Population Table 21 Voters Certifying Indefinitely Confined Status General Elections 2016-2020
Table 22 Returned Absentee Ballots 2016-2020 Table 23 2020 Indefinitely Confined Voters
Table 24 2020 General Election Indefinitely Confined Applications by Voter Age Table 25 Active-Mover’s Group Size
Table 26 Original ERIC Movers List - Current Status Table 27 ERIC Movers List Reasons for Inactivation
Table 28 Original ERIC Movers List - General Election Voting Supplemental Table 1 List of Graphs and Charts
Supplemental Table 2 Absentee Voting by Mail by County Supplemental Table 3 Indefinitely Confined Absentee Ballot Requests by County
Supplemental Table 4 Absentee Ballot Status Definitions Supplemental Table 5 2020 General Election SVD Voters by County
November 3, 2020 Election Data Report Page 23
Page 23
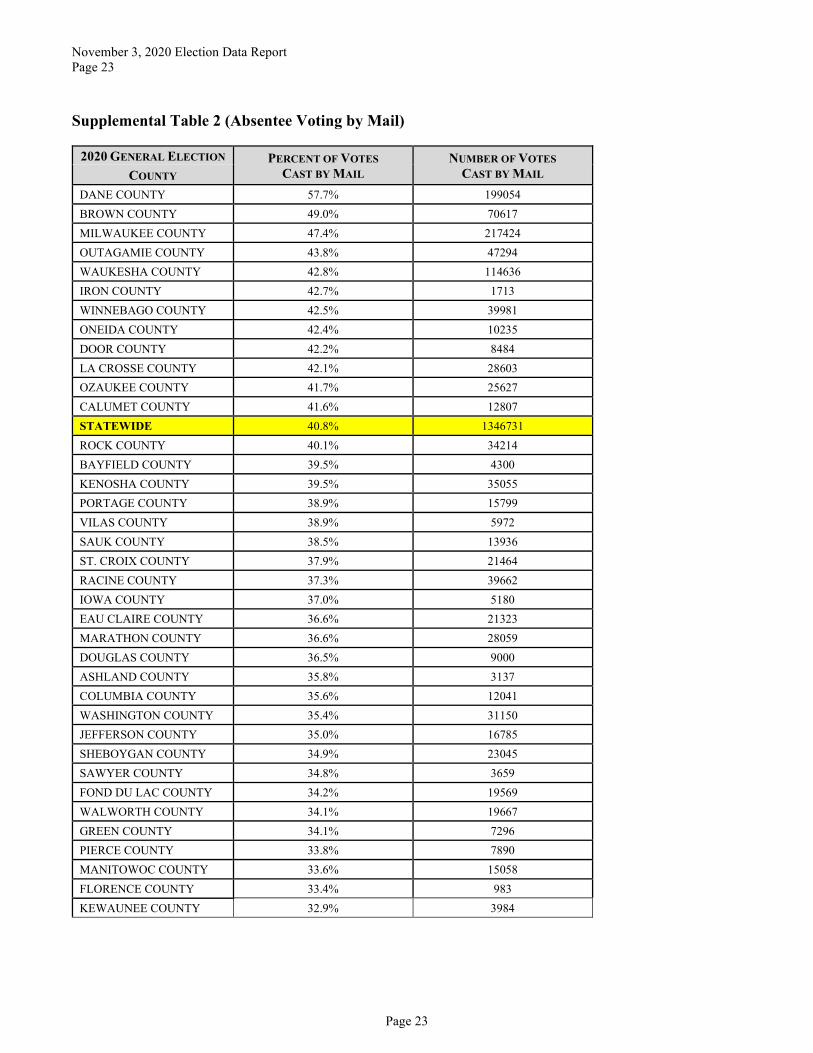
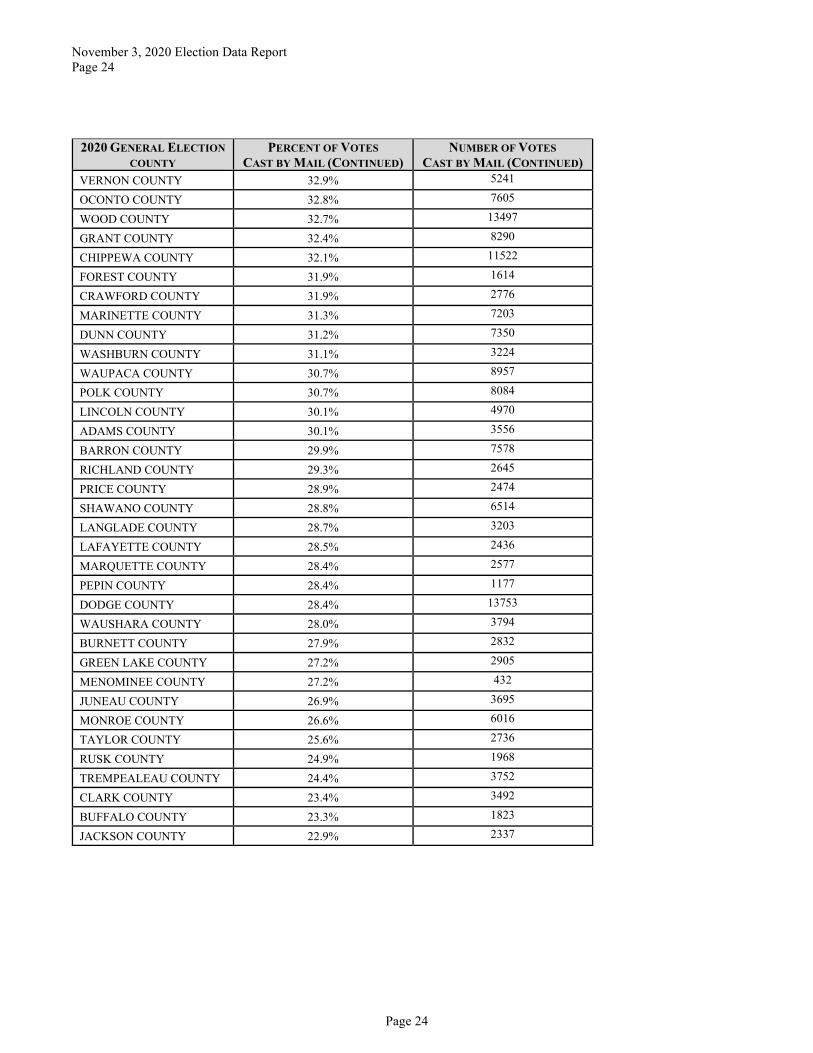
Supplemental Table 2 (Absentee Voting by Mail)
2020 GENERAL ELECTION PERCENT OF VOTES CAST BY MAIL
NUMBER OF VOTES CAST BY MAIL COUNTY
DANE COUNTY 57.7% 199054 BROWN COUNTY 49.0% 70617 MILWAUKEE COUNTY 47.4% 217424 OUTAGAMIE COUNTY 43.8% 47294 WAUKESHA COUNTY 42.8% 114636 IRON COUNTY 42.7% 1713 WINNEBAGO COUNTY 42.5% 39981 ONEIDA COUNTY 42.4% 10235 DOOR COUNTY 42.2% 8484 LA CROSSE COUNTY 42.1% 28603 OZAUKEE COUNTY 41.7% 25627 CALUMET COUNTY 41.6% 12807 STATEWIDE 40.8% 1346731 ROCK COUNTY 40.1% 34214 BAYFIELD COUNTY 39.5% 4300 KENOSHA COUNTY 39.5% 35055 PORTAGE COUNTY 38.9% 15799 VILAS COUNTY 38.9% 5972 SAUK COUNTY 38.5% 13936 ST. CROIX COUNTY 37.9% 21464 RACINE COUNTY 37.3% 39662 IOWA COUNTY 37.0% 5180 EAU CLAIRE COUNTY 36.6% 21323 MARATHON COUNTY 36.6% 28059 DOUGLAS COUNTY 36.5% 9000 ASHLAND COUNTY 35.8% 3137 COLUMBIA COUNTY 35.6% 12041 WASHINGTON COUNTY 35.4% 31150 JEFFERSON COUNTY 35.0% 16785 SHEBOYGAN COUNTY 34.9% 23045 SAWYER COUNTY 34.8% 3659 FOND DU LAC COUNTY 34.2% 19569 WALWORTH COUNTY 34.1% 19667 GREEN COUNTY 34.1% 7296 PIERCE COUNTY 33.8% 7890 MANITOWOC COUNTY 33.6% 15058 FLORENCE COUNTY 33.4% 983 KEWAUNEE COUNTY 32.9% 3984
November 3, 2020 Election Data Report Page 24
Page 24
2020 GENERAL ELECTION COUNTY
PERCENT OF VOTES CAST BY MAIL (CONTINUED)
NUMBER OF VOTES CAST BY MAIL (CONTINUED)
VERNON COUNTY 32.9% 5241
OCONTO COUNTY 32.8% 7605
WOOD COUNTY 32.7% 13497
GRANT COUNTY 32.4% 8290
CHIPPEWA COUNTY 32.1% 11522
FOREST COUNTY 31.9% 1614
CRAWFORD COUNTY 31.9% 2776
MARINETTE COUNTY 31.3% 7203
DUNN COUNTY 31.2% 7350
WASHBURN COUNTY 31.1% 3224
WAUPACA COUNTY 30.7% 8957
POLK COUNTY 30.7% 8084
LINCOLN COUNTY 30.1% 4970
ADAMS COUNTY 30.1% 3556
BARRON COUNTY 29.9% 7578
RICHLAND COUNTY 29.3% 2645
PRICE COUNTY 28.9% 2474
SHAWANO COUNTY 28.8% 6514
LANGLADE COUNTY 28.7% 3203
LAFAYETTE COUNTY 28.5% 2436
MARQUETTE COUNTY 28.4% 2577
PEPIN COUNTY 28.4% 1177
DODGE COUNTY 28.4% 13753
WAUSHARA COUNTY 28.0% 3794
BURNETT COUNTY 27.9% 2832
GREEN LAKE COUNTY 27.2% 2905
MENOMINEE COUNTY 27.2% 432
JUNEAU COUNTY 26.9% 3695
MONROE COUNTY 26.6% 6016
TAYLOR COUNTY 25.6% 2736
RUSK COUNTY 24.9% 1968
TREMPEALEAU COUNTY 24.4% 3752
CLARK COUNTY 23.4% 3492
BUFFALO COUNTY 23.3% 1823
JACKSON COUNTY 22.9% 2337
November 3, 2020 Election Data Report Page 25
Page 25
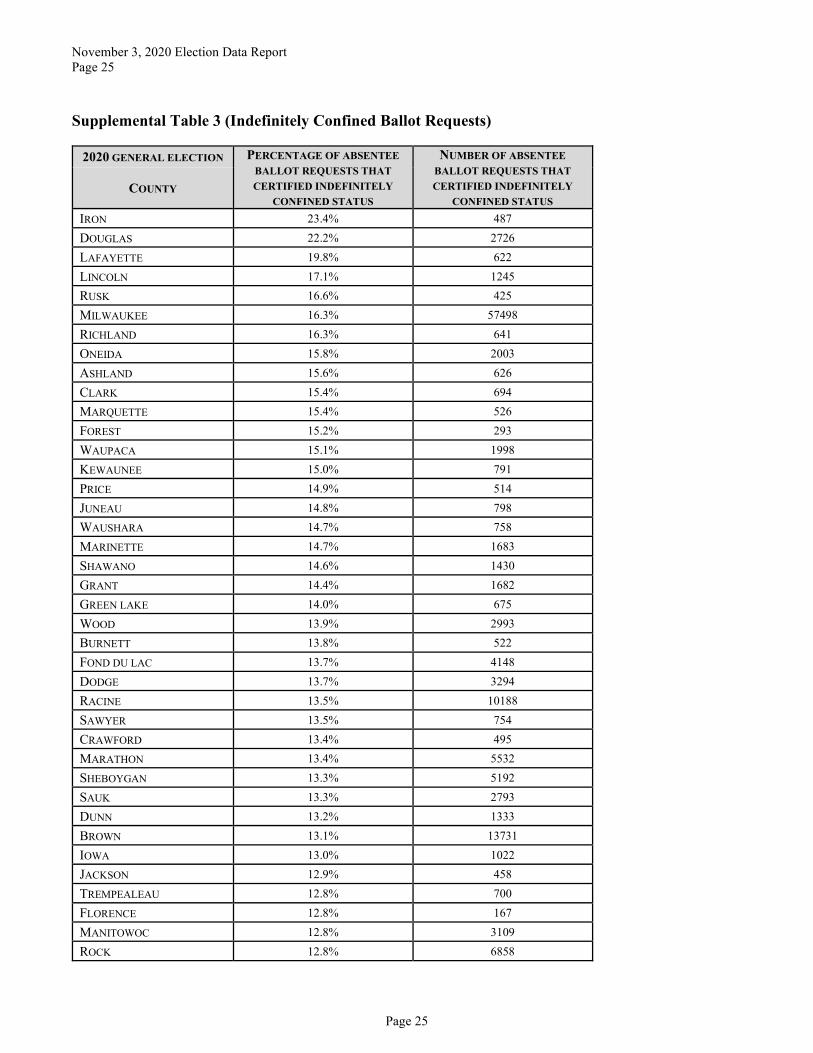
Supplemental Table 3 (Indefinitely Confined Ballot Requests)
2020 GENERAL ELECTION PERCENTAGE OF ABSENTEE BALLOT REQUESTS THAT CERTIFIED INDEFINITELY
CONFINED STATUS
NUMBER OF ABSENTEE BALLOT REQUESTS THAT CERTIFIED INDEFINITELY
CONFINED STATUS COUNTY
IRON 23.4% 487 DOUGLAS 22.2% 2726 LAFAYETTE 19.8% 622 LINCOLN 17.1% 1245 RUSK 16.6% 425 MILWAUKEE 16.3% 57498 RICHLAND 16.3% 641 ONEIDA 15.8% 2003 ASHLAND 15.6% 626 CLARK 15.4% 694 MARQUETTE 15.4% 526 FOREST 15.2% 293 WAUPACA 15.1% 1998 KEWAUNEE 15.0% 791 PRICE 14.9% 514 JUNEAU 14.8% 798 WAUSHARA 14.7% 758 MARINETTE 14.7% 1683 SHAWANO 14.6% 1430 GRANT 14.4% 1682 GREEN LAKE 14.0% 675 WOOD 13.9% 2993 BURNETT 13.8% 522 FOND DU LAC 13.7% 4148 DODGE 13.7% 3294 RACINE 13.5% 10188 SAWYER 13.5% 754 CRAWFORD 13.4% 495 MARATHON 13.4% 5532 SHEBOYGAN 13.3% 5192 SAUK 13.3% 2793 DUNN 13.2% 1333 BROWN 13.1% 13731 IOWA 13.0% 1022 JACKSON 12.9% 458 TREMPEALEAU 12.8% 700 FLORENCE 12.8% 167 MANITOWOC 12.8% 3109 ROCK 12.8% 6858
November 3, 2020 Election Data Report Page 26
Page 26
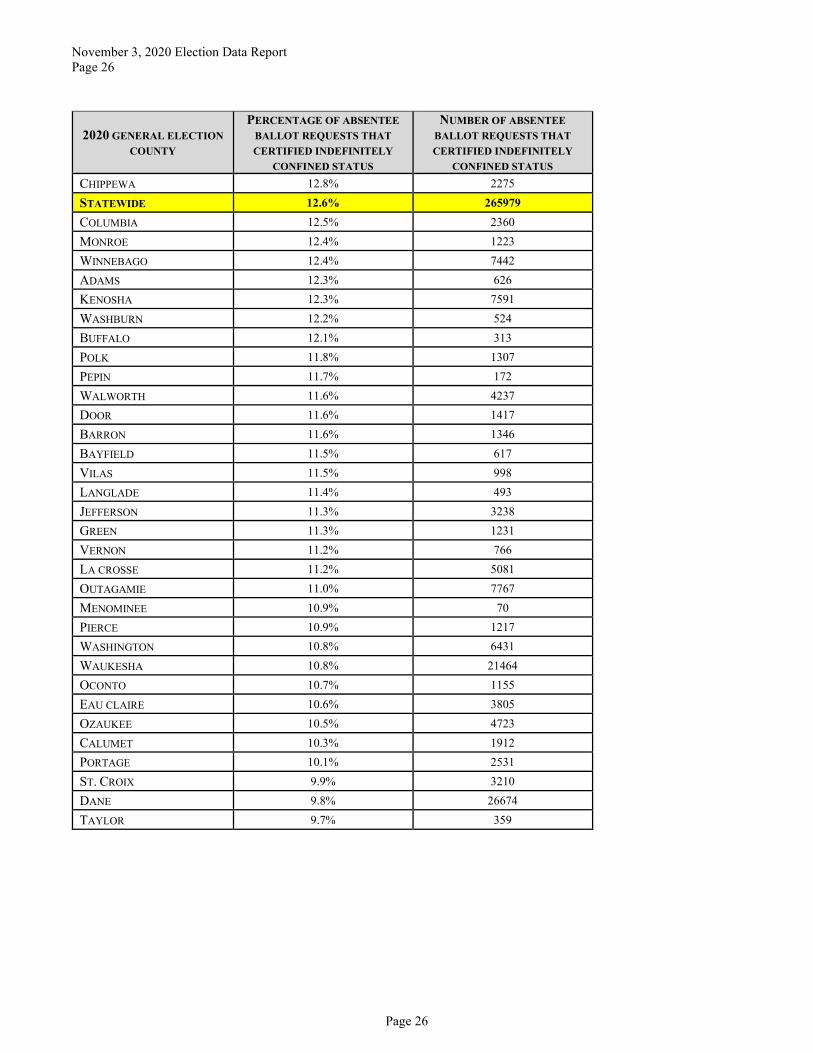
2020 GENERAL ELECTION COUNTY
PERCENTAGE OF ABSENTEE BALLOT REQUESTS THAT CERTIFIED INDEFINITELY
CONFINED STATUS
NUMBER OF ABSENTEE BALLOT REQUESTS THAT CERTIFIED INDEFINITELY
CONFINED STATUS CHIPPEWA 12.8% 2275 STATEWIDE 12.6% 265979 COLUMBIA 12.5% 2360 MONROE 12.4% 1223 WINNEBAGO 12.4% 7442 ADAMS 12.3% 626 KENOSHA 12.3% 7591 WASHBURN 12.2% 524 BUFFALO 12.1% 313 POLK 11.8% 1307 PEPIN 11.7% 172 WALWORTH 11.6% 4237 DOOR 11.6% 1417 BARRON 11.6% 1346 BAYFIELD 11.5% 617 VILAS 11.5% 998 LANGLADE 11.4% 493 JEFFERSON 11.3% 3238 GREEN 11.3% 1231 VERNON 11.2% 766 LA CROSSE 11.2% 5081 OUTAGAMIE 11.0% 7767 MENOMINEE 10.9% 70 PIERCE 10.9% 1217 WASHINGTON 10.8% 6431 WAUKESHA 10.8% 21464 OCONTO 10.7% 1155 EAU CLAIRE 10.6% 3805 OZAUKEE 10.5% 4723 CALUMET 10.3% 1912 PORTAGE 10.1% 2531 ST. CROIX 9.9% 3210 DANE 9.8% 26674 TAYLOR 9.7% 359
November 3, 2020 Election Data Report Page 27
Page 27
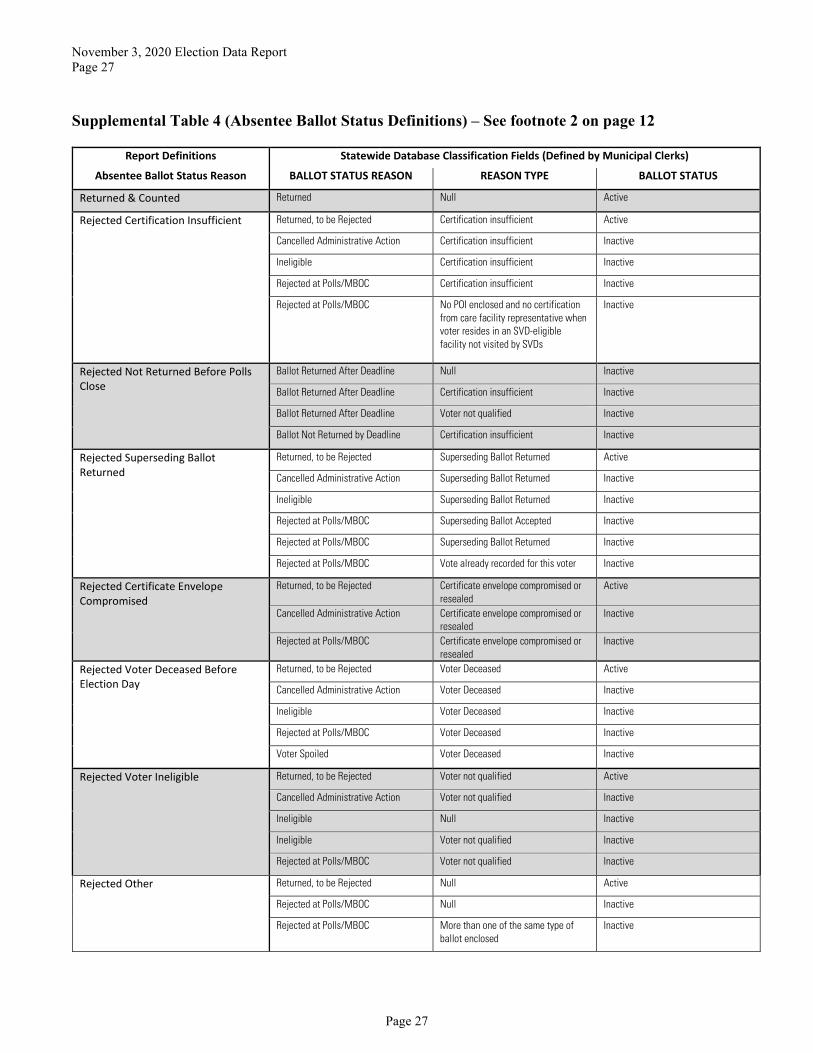
Supplemental Table 4 (Absentee Ballot Status Definitions) – See footnote 2 on page 12
Report Definitions Statewide Database Classification Fields (Defined by Municipal Clerks)
Absentee Ballot Status Reason BALLOT STATUS REASON REASON TYPE BALLOT STATUS
Returned & Counted Returned Null Active
Rejected Certification Insufficient Returned, to be Rejected Certification insufficient Active
Cancelled Administrative Action Certification insufficient Inactive
Ineligible Certification insufficient Inactive
Rejected at Polls/MBOC Certification insufficient Inactive
Rejected at Polls/MBOC No POI enclosed and no certification from care facility representative when voter resides in an SVD-eligible facility not visited by SVDs
Inactive
Rejected Not Returned Before Polls Close
Ballot Returned After Deadline Null Inactive
Ballot Returned After Deadline Certification insufficient Inactive
Ballot Returned After Deadline Voter not qualified Inactive
Ballot Not Returned by Deadline Certification insufficient Inactive
Rejected Superseding Ballot Returned
Returned, to be Rejected Superseding Ballot Returned Active
Cancelled Administrative Action Superseding Ballot Returned Inactive
Ineligible Superseding Ballot Returned Inactive
Rejected at Polls/MBOC Superseding Ballot Accepted Inactive
Rejected at Polls/MBOC Superseding Ballot Returned Inactive
Rejected at Polls/MBOC Vote already recorded for this voter Inactive
Rejected Certificate Envelope Compromised
Returned, to be Rejected Certificate envelope compromised or resealed
Active
Cancelled Administrative Action Certificate envelope compromised or resealed
Inactive
Rejected at Polls/MBOC Certificate envelope compromised or resealed
Inactive
Rejected Voter Deceased Before Election Day
Returned, to be Rejected Voter Deceased Active
Cancelled Administrative Action Voter Deceased Inactive
Ineligible Voter Deceased Inactive
Rejected at Polls/MBOC Voter Deceased Inactive
Voter Spoiled Voter Deceased Inactive
Rejected Voter Ineligible Returned, to be Rejected Voter not qualified Active
Cancelled Administrative Action Voter not qualified Inactive
Ineligible Null Inactive
Ineligible Voter not qualified Inactive
Rejected at Polls/MBOC Voter not qualified Inactive
Rejected Other Returned, to be Rejected Null Active
Rejected at Polls/MBOC Null Inactive
Rejected at Polls/MBOC More than one of the same type of ballot enclosed
Inactive

November 3, 2020 Election Data Report Page 28
Page 28
Report Definitions Statewide Database Classification Fields (Defined by Municipal Clerks)
Absentee Ballot Status Reason BALLOT STATUS REASON REASON TYPE BALLOT STATUS
Ballot Not Returned Not Returned Null Active
Not Returned Voter not qualified Active
Not Returned, sent to voter for resolution
Null Active
Not Returned, sent to voter for resolution
Certification insufficient Active
Ballot Not Received Null Inactive
Ballot Not Received Certification insufficient Inactive
Ballot Not Returned By Deadline Null Inactive
Admin: Clerk Cancelled Cancelled Administrative Action Null Inactive
Voter Moved Null Inactive
Admin: Voter Cancelled Voter Refused Null Active
Voter Request Null Inactive
Voter Request Certification insufficient Inactive
Voter Request Superseding Ballot Accepted Inactive
Voter Request Superseding Ballot Returned Inactive
Voter Request Voter not qualified Inactive
Voter Spoiled Null Inactive
Voter Spoiled Certificate envelope compromised or resealed
Inactive
Voter Spoiled Certification insufficient Inactive
Voter Spoiled Superseding Ballot Returned Inactive
Admin: Undeliverable Undeliverable Null Inactive
Undeliverable Certification insufficient Inactive
Undeliverable Superseding Ballot Accepted Inactive
Undeliverable Superseding Ballot Returned Inactive
Undeliverable Voter deceased Inactive
Undeliverable Voter not qualified Inactive
Admin: Voter Ineligible Voter Moved Voter not qualified Inactive
Voter Spoiled Voter not qualified Inactive
November 3, 2020 Election Data Report Page 29
Page 29
Supplemental Table 5 (2020 General Election SVD Voters by County)
COUNTY SVD VOTER COUNT ADAMS 52
ASHLAND 141
BARRON 76
BAYFIELD 46
BROWN 976
BUFFALO 35
BURNETT 42
CALUMET 614
CHIPPEWA 228
CLARK 165
COLUMBIA 179
CRAWFORD 30
DANE 2032
DODGE 254
DOOR 147
DOUGLAS 125
DUNN 139
EAU CLAIRE 440
FLORENCE 14
FOND DU LAC 378
FOREST 39
GRANT 345
GREEN 167
GREEN LAKE 80
IOWA 74
IRON 14
JACKSON 18
JEFFERSON 156
JUNEAU 754
KENOSHA 346
KEWAUNEE 889
LA CROSSE 873
LAFAYETTE 26
LANGLADE 5
LINCOLN 55
MANITOWOC 315
MARATHON 301
MARINETTE 76
MARQUETTE 28
November 3, 2020 Election Data Report Page 30
Page 30
COUNTY SVD VOTER COUNT (CONT.)
MENOMINEE 0
MILWAUKEE 2523
MONROE 181
OCONTO 47
ONEIDA 124
OUTAGAMIE 450
OZAUKEE 771
PEPIN 10
PIERCE 113
POLK 136
PORTAGE 149
PRICE 80
RACINE 464
RICHLAND 54
ROCK 488
RUSK 64
SAUK 300
SAWYER 33
SHAWANO 122
SHEBOYGAN 334
ST. CROIX 298
TAYLOR 47
TREMPEALEAU 123
VERNON 44
VILAS 89
WALWORTH 469
WASHBURN 48
WASHINGTON 618
WAUKESHA 2315
WAUPACA 408
WAUSHARA 49
WINNEBAGO 390
WOOD 284