Embed Size (px)
Citation preview
A Case Study for Substation Lightning Protection and Risk Evaluation
November 8, 2016
Stephen Chuang, P.Eng.Electrical Engineer

• Introduction on substation lightning protection, the rolling sphere method and the fixed angle method
• Case Study – lightning shield design for a Substation• Keraunic level and ground flash density• Risk tolerance of lightning strokes in a substation
• Failure rate between the rolling sphere method and the fixed angle method
• Consequences of outages in an event of a lightning stroke
• Conclusion
2
Content of the Presentation
3
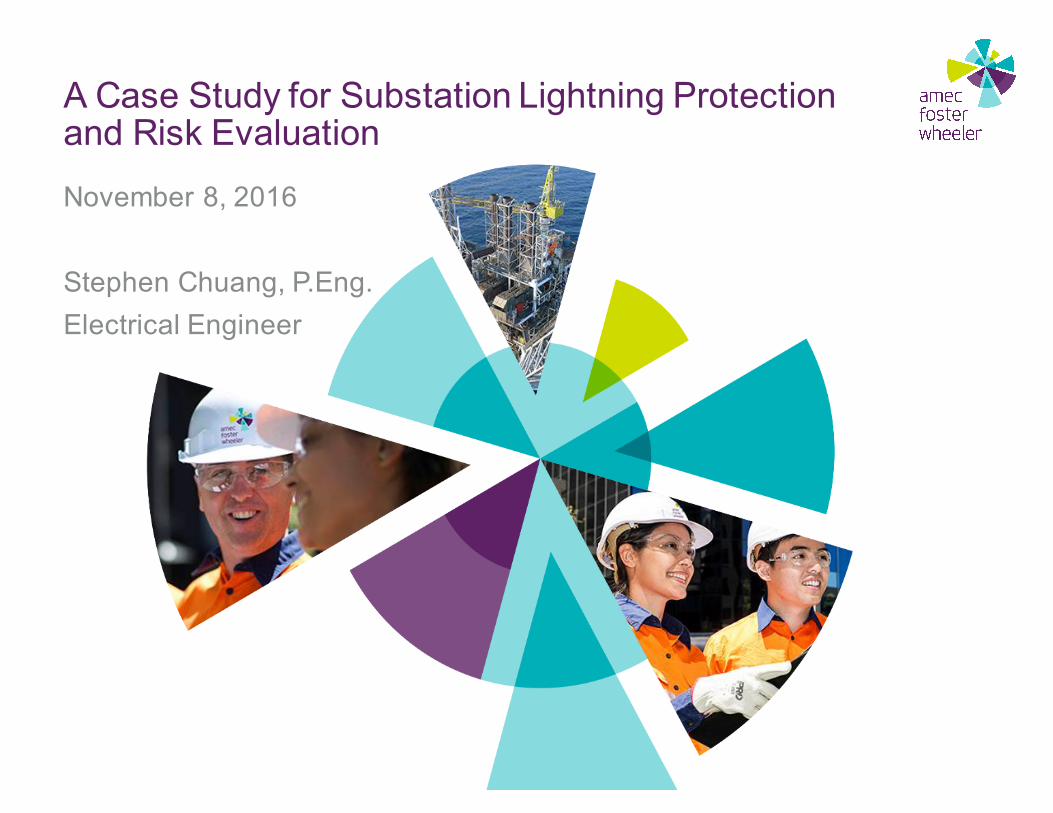
Overview – Lightning Protection
Overhead shield wire through the line
Surge arrester to protect transient and switching over voltage
Lightning masts and shield wires to prevent direct lightning stroke to the substation

• An imaginary sphere of prescribed radius over the surface of a substation • The sphere will roll up and over all grounded metal objects intended for
lightning shielding• A piece of equipment is protected from a direct stroke if it remains below the
curved surface of the sphere by virtue of the sphere being elevated by shield wires or other devices
4
Rolling Sphere Method
5
Rolling Sphere Method
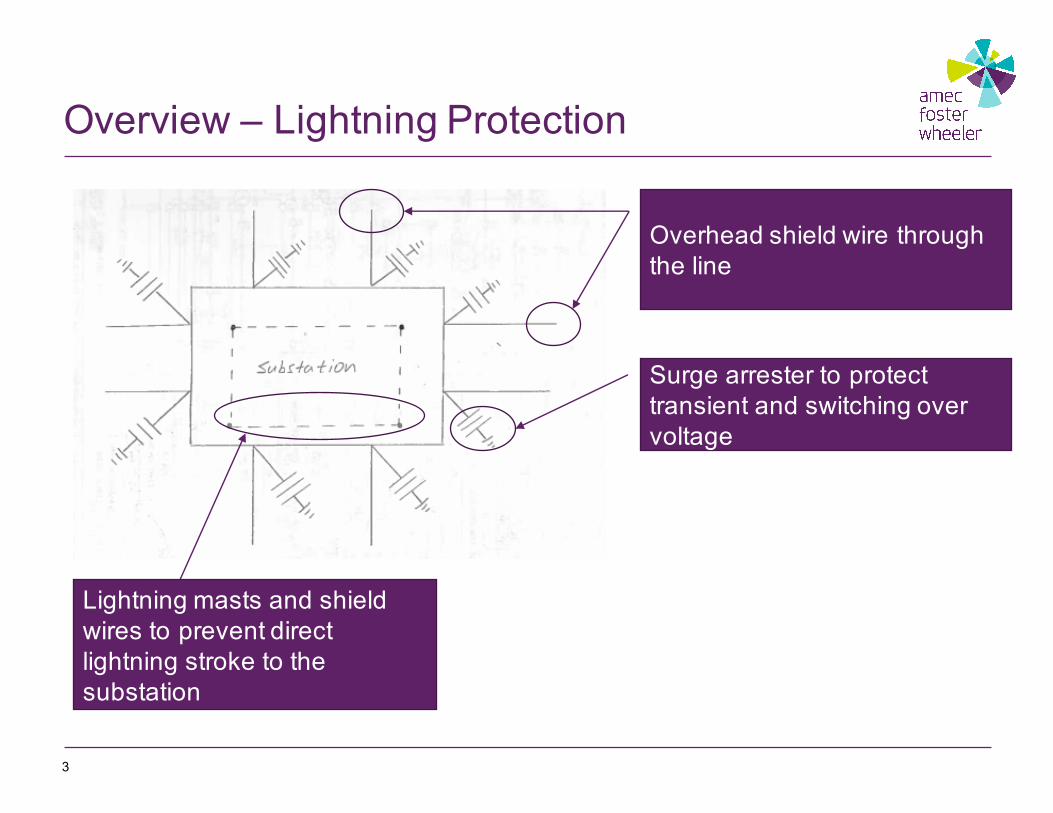
Stroke current (Is) is then defined as:
The equation for stroke current is:
𝐼s =1.1(𝐵𝐼𝐿)
𝑍𝑠2
=2.2(𝐵𝐼𝐿)
𝑍s
or
𝐼s =0.94 𝐶𝐹𝑂 1.1
𝑍s2
=2.068(𝐶𝐹𝑂)
𝑍s
• Surge impedance (Zs)• Basic insulation level (BIL)• Allowable stroke current (Is)• Negative polarity critical flashover voltage (CFO)

6
Rolling Sphere Method
The equation for surge impedance is:
𝑍s = 60 ln2ℎ𝑅c
ln(2ℎ𝑟)
Rc = corona radiusr = radius of the conductorh = average height of conductor
Strike distance S (radius of the sphere)
𝑆m = 8𝑘𝐼?.@A as in meter𝑆𝑓 = 26.25𝑘𝐼?.@A as in feet
k = 1 for shield wiresk = 1.2 for lightning masts

7
Rolling Sphere Method
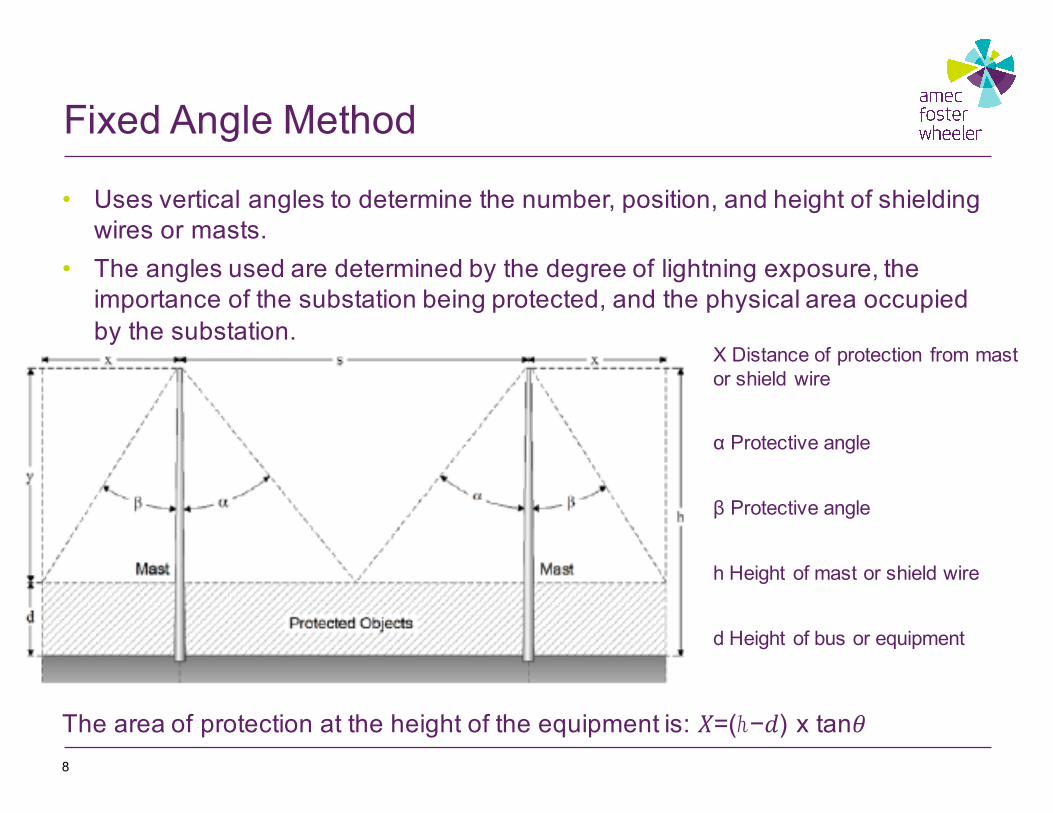
• Uses vertical angles to determine the number, position, and height of shielding wires or masts.
• The angles used are determined by the degree of lightning exposure, the importance of the substation being protected, and the physical area occupied by the substation.
The area of protection at the height of the equipment is: 𝑋=(ℎ−𝑑) x tan𝜃8
Fixed Angle Method
X Distance of protection from mast or shield wire
α Protective angle
β Protective angle
h Height of mast or shield wire
d Height of bus or equipment

9
Fixed Angle Method
• Finding the area of protection X allows us to draw the protection circles for the mast.
• Protective angle changes as the height of the structure increases.

Rolling sphere method• Requires surge impedance, BIL, to determine stroke current• Allows strokes that will not cause flashover or damage to enter shielded area• Failure rate is small (0.05%)
Fixed angle method• “Rule of thumb” method• Uses vertical angles to determine:
• Total number of protection devices• Position• Height
• With a protective angle of α and β = 45⁰ and height of mast up to 15 m (49 ft) the failure rate is approximately 0.2%.
10
Comparison between the Two Methods

11
Case Study – Lightning Shield Design

12
Case Study – Existing StationThe load has now exceeded the station’s firm capacity
T1 is a 60/12 kV transformer

13
Case Study – Decommission
Decommission all 12 kV equipment (and certain associated 25 kV equipment)
Replace Transformer

14
Case Study – Scope Addition
Also add new 25 kV busbars to replace 12 kV busbars
15
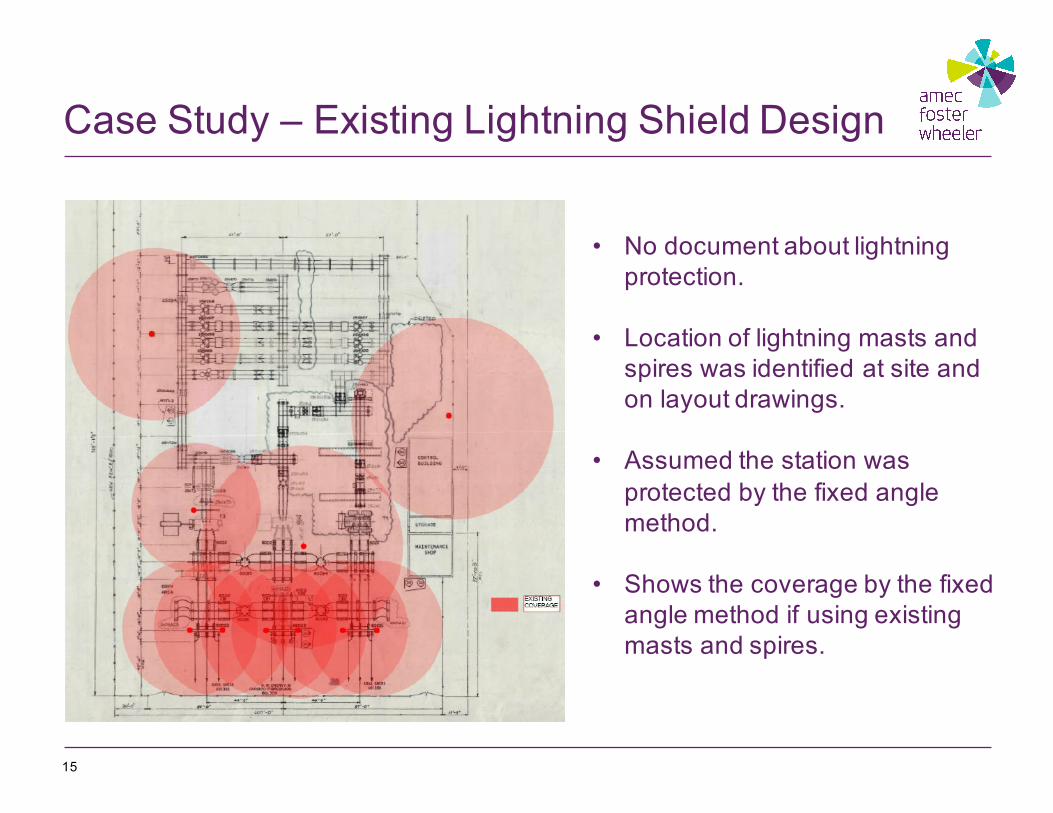
Case Study – Existing Lightning Shield Design
• No document about lightning protection.
• Location of lightning masts and spires was identified at site and on layout drawings.
• Assumed the station was protected by the fixed angle method.
• Shows the coverage by the fixed angle method if using existing masts and spires.
16
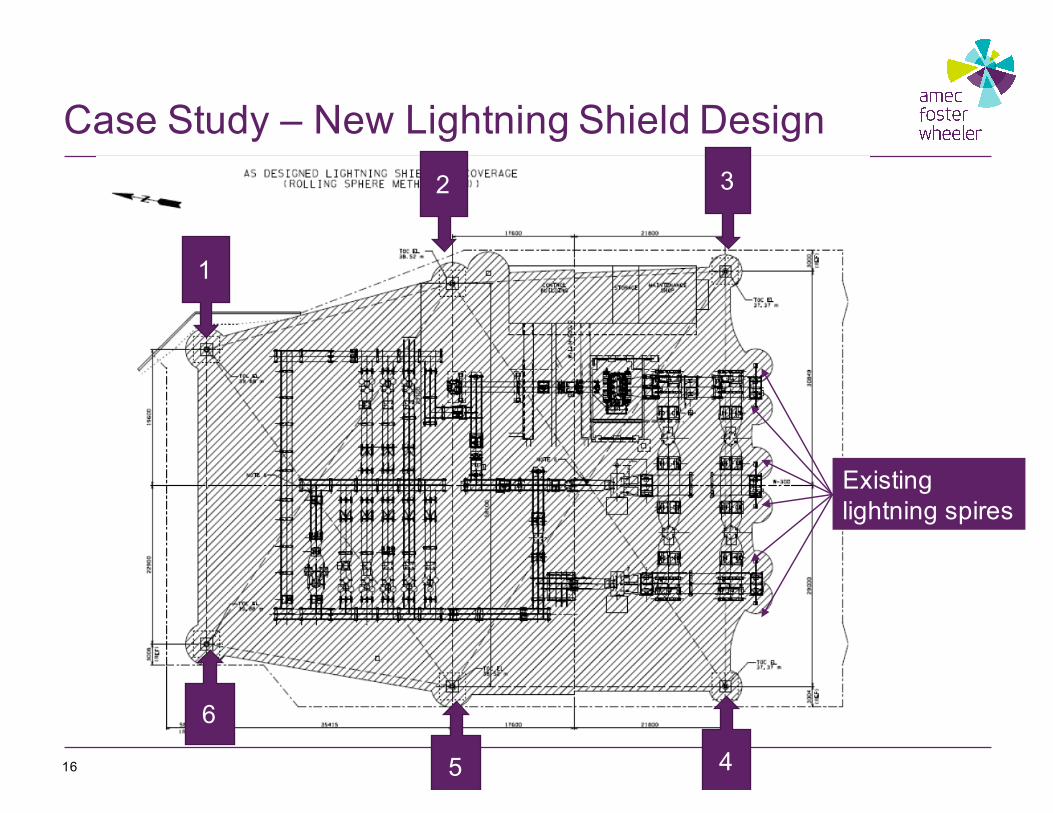
Case Study – New Lightning Shield Design2 3
45
6
1
Existing lightning spires

17
Case Study – Staging Plan

18
Case Study – Shielding Coverage Without Shield Wires

The average annual number of thunderstorm days or hours for a given locality. A thunderstorm day is a day (24 hours) during which thunder has been heard at least once.
19
Keraunic Level
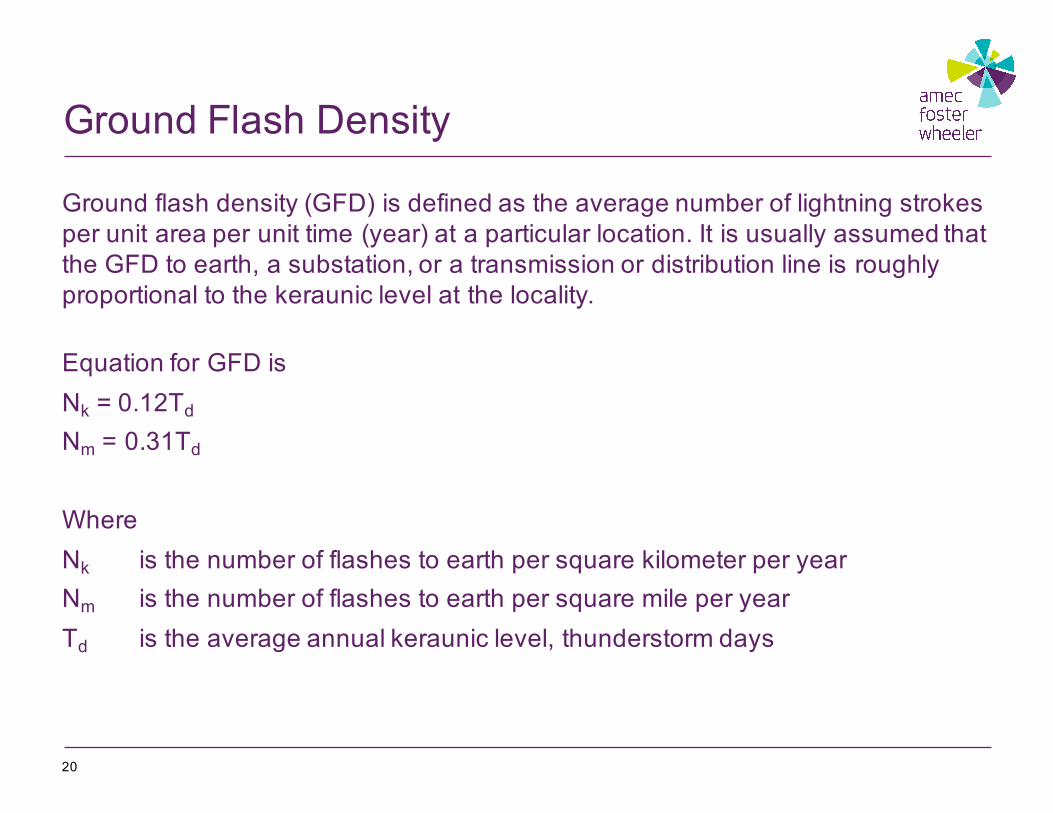
Ground flash density (GFD) is defined as the average number of lightning strokes per unit area per unit time (year) at a particular location. It is usually assumed that the GFD to earth, a substation, or a transmission or distribution line is roughly proportional to the keraunic level at the locality.
Equation for GFD isNk = 0.12Td
Nm = 0.31Td
WhereNk is the number of flashes to earth per square kilometer per yearNm is the number of flashes to earth per square mile per yearTd is the average annual keraunic level, thunderstorm days
20
Ground Flash Density

21
Ground Flash Density

For Canadian cities, GFD information can also be found on Environment Canada https://ec.gc.ca/foudre-lightning/default.asp?lang=EN&n=4871AAE6-1
22
Ground Flash Density

There is no known method of providing 100% shielding. There will always be a risk even if the station is fully shielded.
IEC Standard 62305-2 – 2010 identifies the tolerable risk RT for a substation, where the risk level is affected by different type of losses.
Tolerable risk (RT) for a substation is defined in L2, loss of service to the public
23
Failure Rate for a Substation
Types of loss RT (y-1)
L1 Loss of human life or permanent injuries 10-5
L2 Loss of service to the public 10-3
L3 Loss of cultural heritage 10-4
L4 Loss of economic value Cost/benefit comparison

To calculate the failure rate (tolerable risk) of a substation, we need to know:• GFD of the area• The area of the station • Failure rate of the station without shielding coverage• Failure rate of the design method we apply
For our case study, failure rate of the station without shielding coverage is:X = 0.04 flashes/km2/year x 0.002930 km2
= 1.17 x 10⁻⁴ flashes/year or 8,532 years between flashes
An example of using the rolling sphere method can reduce the failure rate to:X = 1.172 x 10⁻⁴ flashes/year x 0.0005 (failure rate)
= 5.86 x 10⁻⁸ flashes/year or 17,064,846 years between flashes
24
Failure Rate for a Substation

25
Case Study (option 1)
Replaced one lightning mast to provide shielding coverage to transformers

26
Case Study (option 2)
An additional lightning mast is added to increase shielding coverage

To find out the failure rate of this station, we have to identify:
The failure rate will be:
The probability of the lightning stroke within the shielded area OR
The probability of the lightning stroke within the unshielded area
27
Failure Rate for a Substation (Fixed Angle Method)
Shielded Area (m2) Unshielded Area (m2)
No additional lightning mast (Option 1)
1010 1920
One additional lightning mast (Option 2)
1581 1349
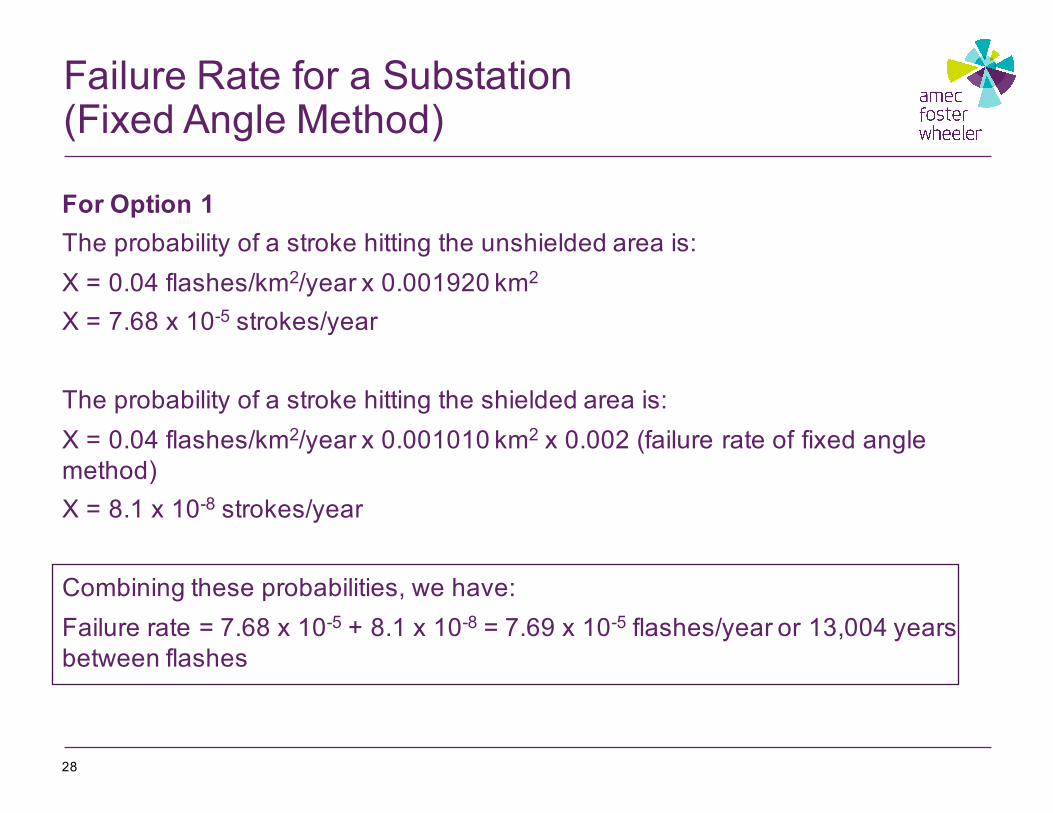
For Option 1The probability of a stroke hitting the unshielded area is:X = 0.04 flashes/km2/year x 0.001920 km2
X = 7.68 x 10⁻⁵ strokes/year
The probability of a stroke hitting the shielded area is:X = 0.04 flashes/km2/year x 0.001010 km2 x 0.002 (failure rate of fixed angle method)X = 8.1 x 10⁻⁸ strokes/year
Combining these probabilities, we have:Failure rate = 7.68 x 10⁻⁵ + 8.1 x 10-8 = 7.69 x 10⁻⁵ flashes/year or 13,004 years between flashes
28
Failure Rate for a Substation (Fixed Angle Method)
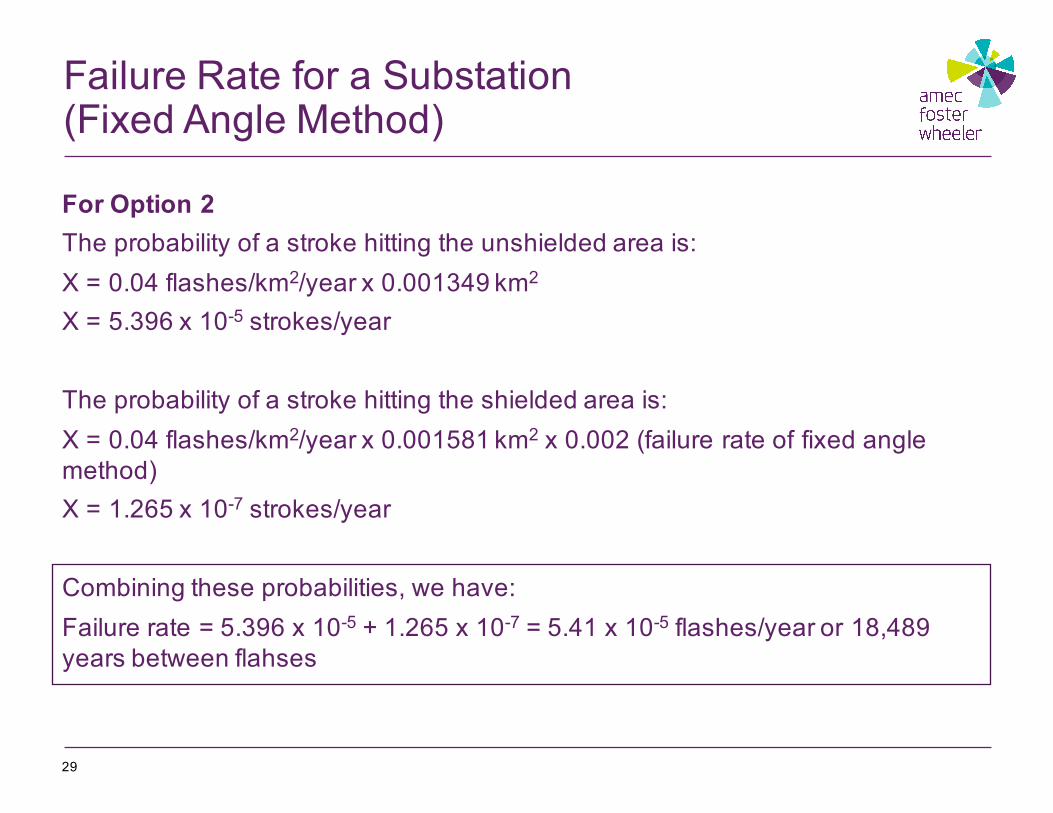
For Option 2The probability of a stroke hitting the unshielded area is:X = 0.04 flashes/km2/year x 0.001349 km2
X = 5.396 x 10⁻⁵ strokes/year
The probability of a stroke hitting the shielded area is:X = 0.04 flashes/km2/year x 0.001581 km2 x 0.002 (failure rate of fixed angle method)X = 1.265 x 10⁻⁷ strokes/year
Combining these probabilities, we have:Failure rate = 5.396 x 10⁻⁵ + 1.265 x 10-7 = 5.41 x 10⁻⁵ flashes/year or 18,489 years between flahses
29
Failure Rate for a Substation (Fixed Angle Method)

• Comparison of failure rates for various protection methods
• Use of the rolling sphere method and the fixed angle method all have failure rates that are several magnitude lower than IEC requirement
30
Failure Rate for a Substation (Comparison)
Method Failure Rate (y-1)
IEC 62305-2 L2 10-3
Lightning Protection – Rolling Sphere Method 5.86 x 10⁻⁸
Lightning Protection – Fixed Angle Method, Option 1 7.69 x 10⁻⁵
Lightning Protection – Fixed Angle Method, Option 2 5.41 x 10⁻⁵

31
Consequences of Outages in the Event of a Lightning Stroke
Main 25 kV bus area is exposed

• A real case study for a substation built in BC Central Interior• Highlights the importance of preparing the construction staging plan in the early
stages of projects• Fixed angle method sometimes is a more practical approach where existing
facility are located in areas with low incidence of lightning strokes
32
Conclusions