Embed Size (px)
Citation preview
United States Department of AgricultureNational Agricultural Statistics ServiceNational Agricultural Statistics Service
NOVEMBER CROP PRODUCTIONNOVEMBER CROP PRODUCTION
Executive Summaryy
NOVEMBER 9, 2011 8:30 AM
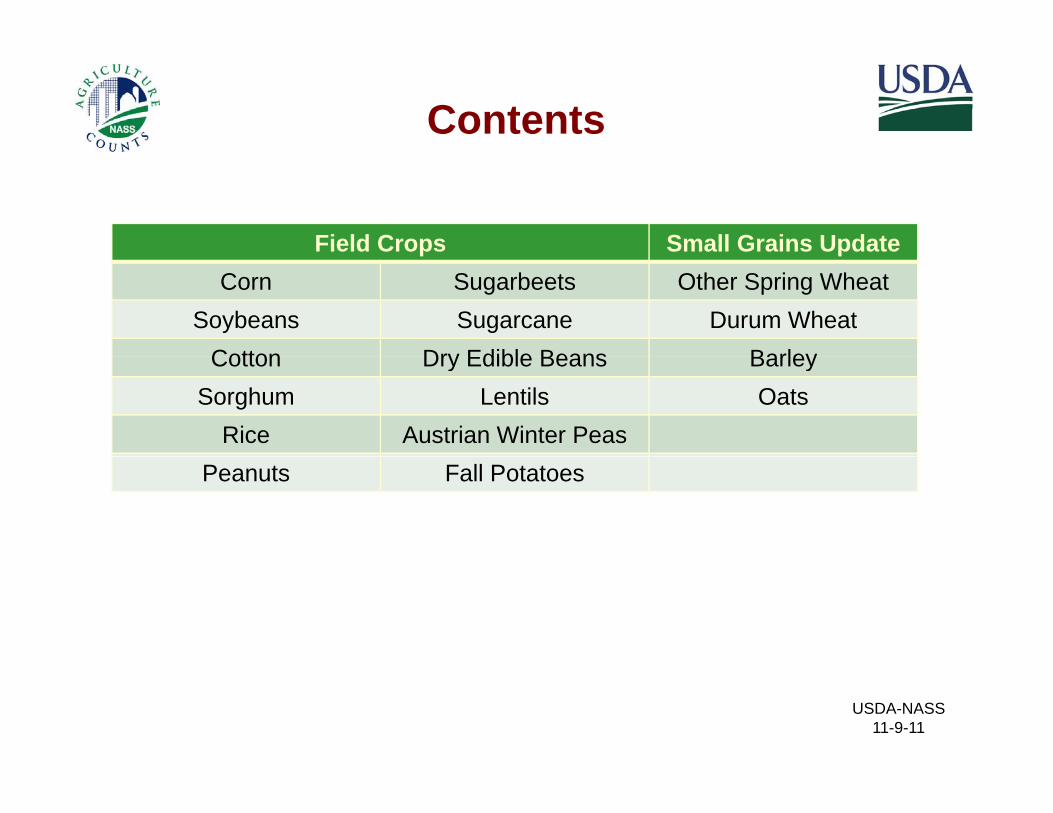
Contents
Field Crops Small Grains UpdateCorn Sugarbeets Other Spring Wheat
Soybeans Sugarcane Durum WheatCotton Dry Edible Beans BarleyCotton Dry Edible Beans Barley
Sorghum Lentils OatsRice Austrian Winter Peas
Peanuts Fall Potatoes
USDA-NASS 11-9-11
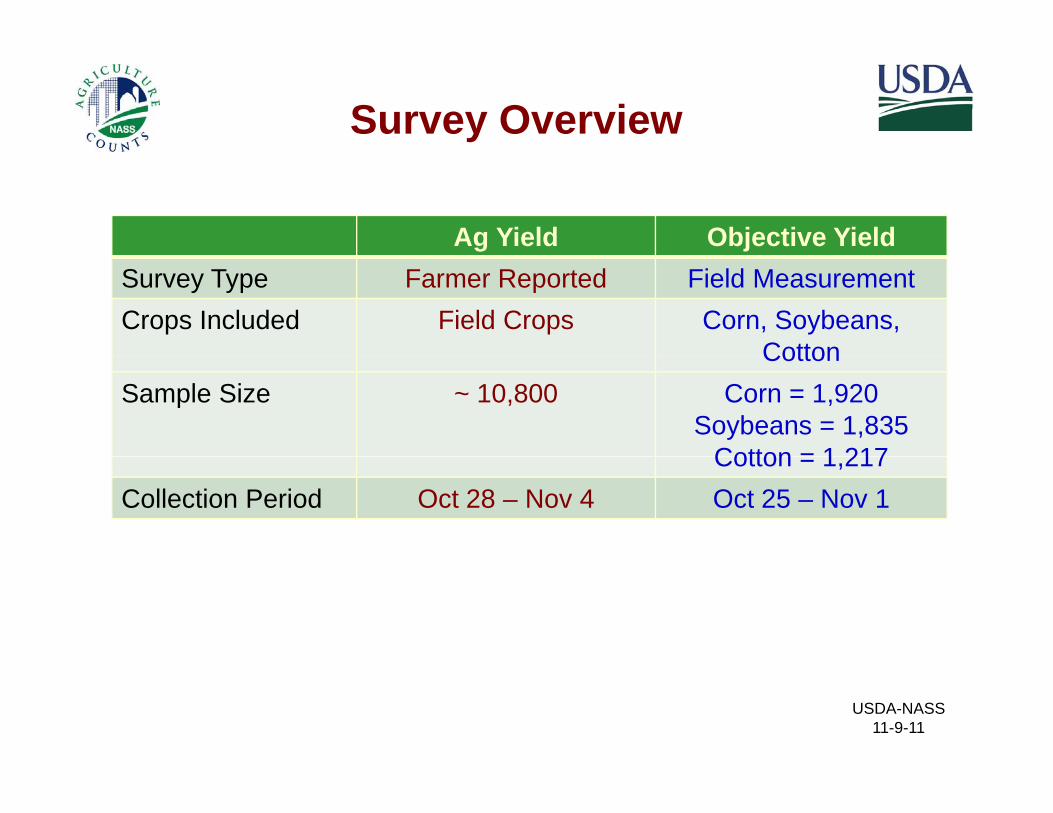
Survey Overview
Ag Yield Objective YieldSurvey Type Farmer Reported Field MeasurementCrops Included Field Crops Corn, Soybeans,
CottonCottonSample Size ~ 10,800 Corn = 1,920
Soybeans = 1,835Cotton = 1 217Cotton = 1,217
Collection Period Oct 28 – Nov 4 Oct 25 – Nov 1
USDA-NASS 11-9-11
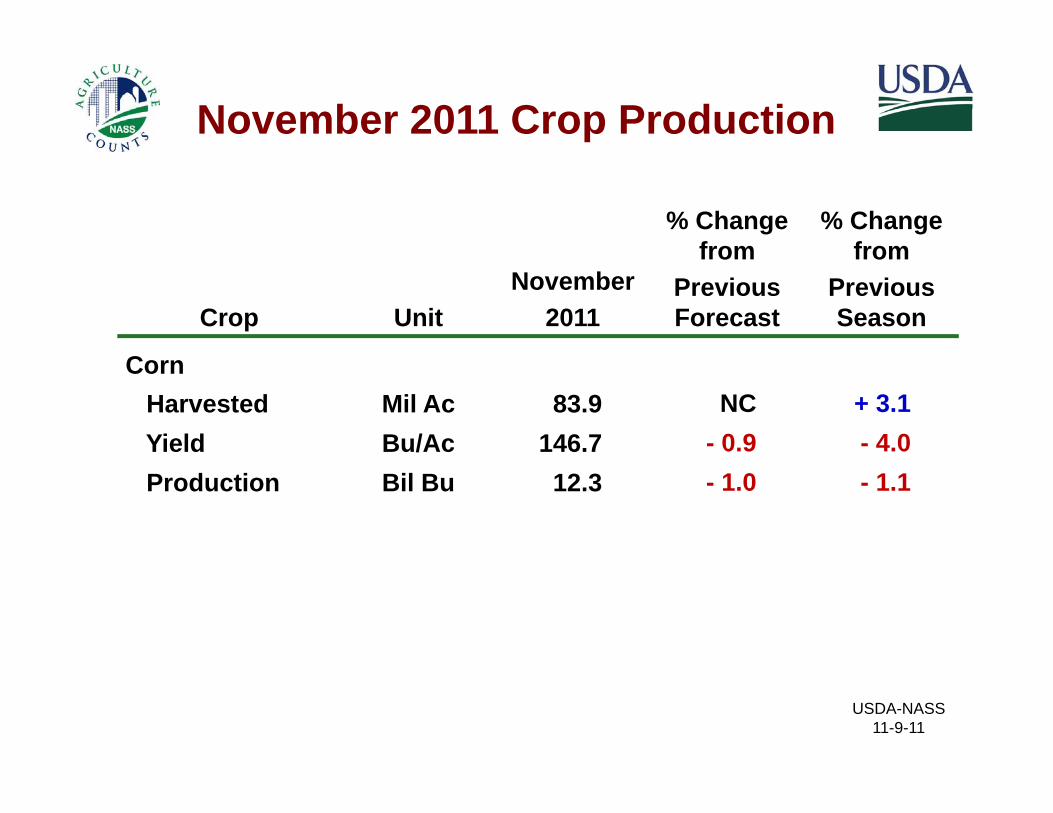
November 2011 Crop Production
% Change from
% Change from
Crop UnitNovember
2011
from Previous Forecast
from Previous Season
CCornHarvested Mil Ac 83.9 NC + 3.1Yield Bu/Ac 146.7 - 0.9 - 4.0Production Bil Bu 12.3 - 1.0 - 1.1
USDA-NASS 11-9-11
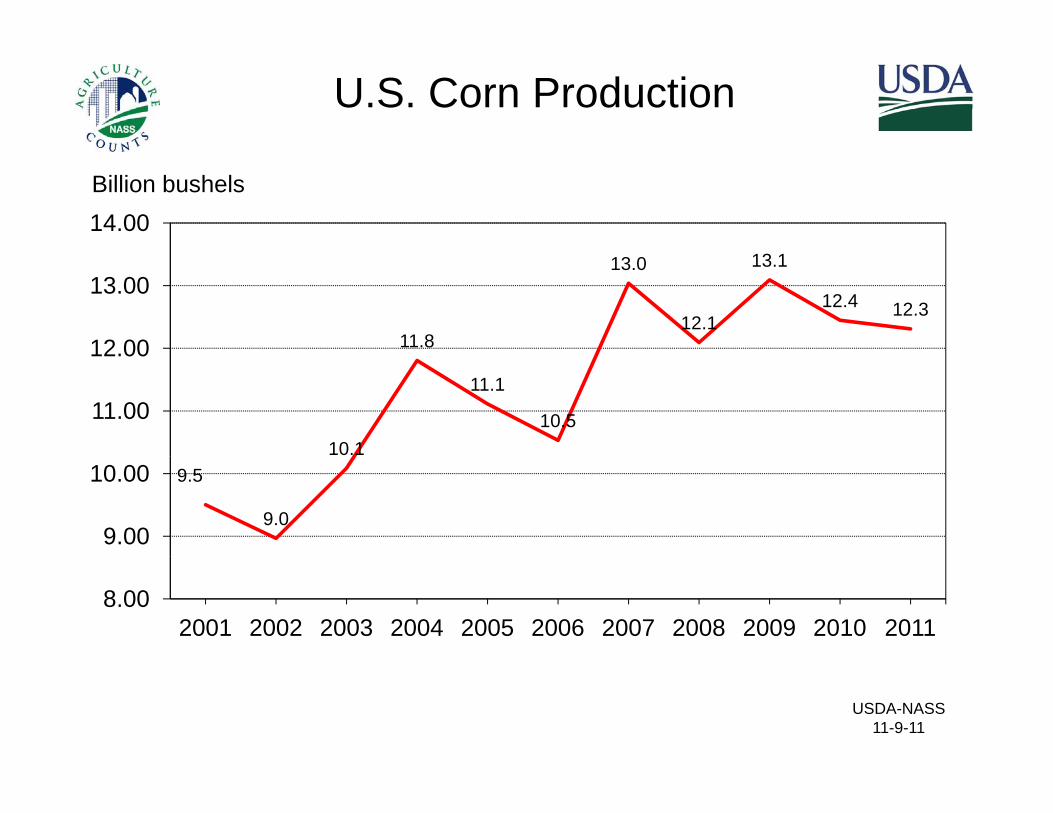
U.S. Corn Production
13 0 13 1
14.00Billion bushels
11.8
13.0
12.1
13.1
12.4 12.3
12.00
13.00
10.1
11.1
10.511.00
9.5
9.09.00
10.00
8.002001 2002 2003 2004 2005 2006 2007 2008 2009 2010 2011
USDA-NASS 11-9-11
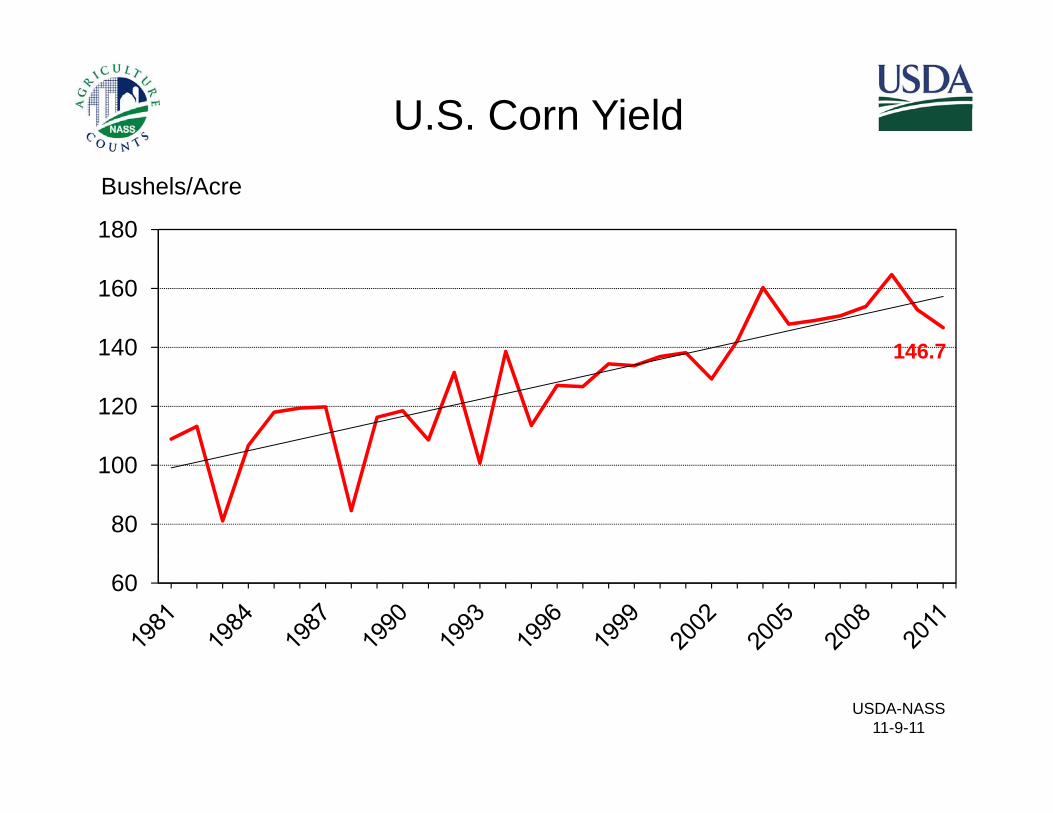
U.S. Corn Yield
180
Bushels/Acre
146.7140
160
146.7
100
120
80
100
60
USDA-NASS 11-9-11
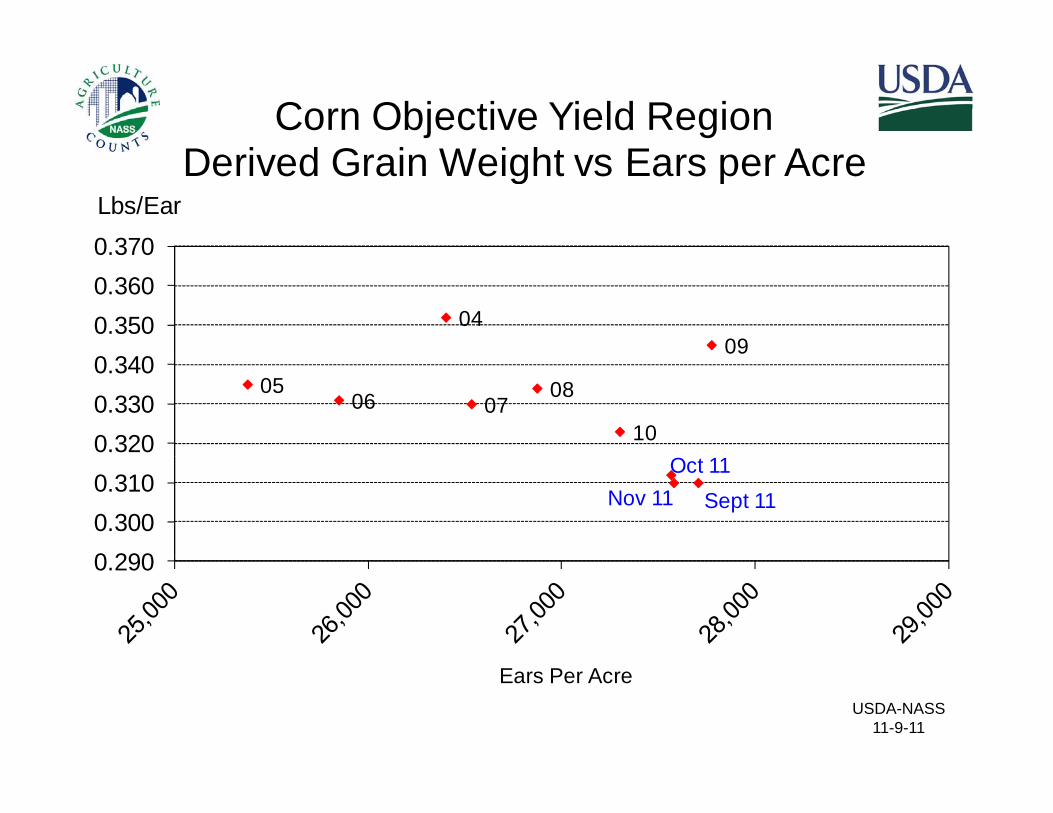
Corn Objective Yield RegionDerived Grain Weight vs Ears per Acre
0.370Lbs/Ear
Derived Grain Weight vs Ears per Acre
0409
0 3400.3500.360
0506 07
08
100.3200.3300.340
Sept 11Oct 11
Nov 11
0 2900.3000.310
0.290
USDA-NASS 11-9-11
Ears Per Acre
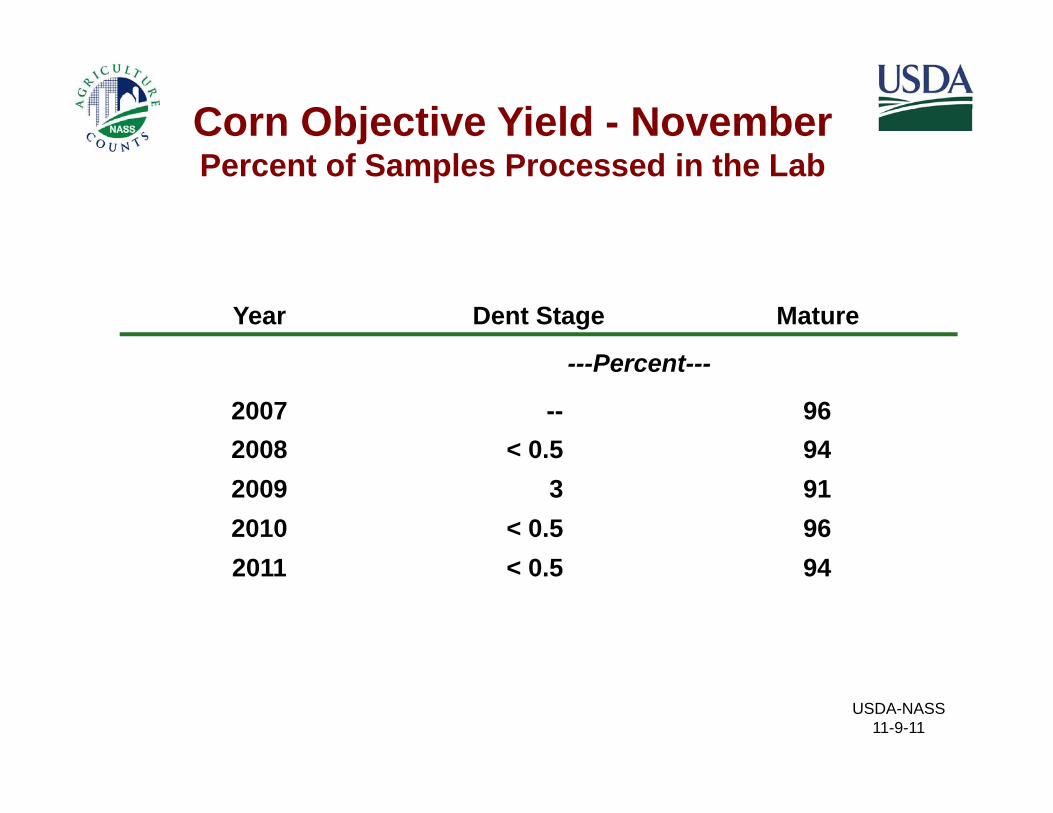
Corn Objective Yield - NovemberP t f S l P d i th L bPercent of Samples Processed in the Lab
Year Dent Stage Mature
P t---Percent---
2007 -- 962008 < 0.5 942008 0.5 942009 3 912010 < 0.5 962011 < 0.5 94
USDA-NASS 11-9-11
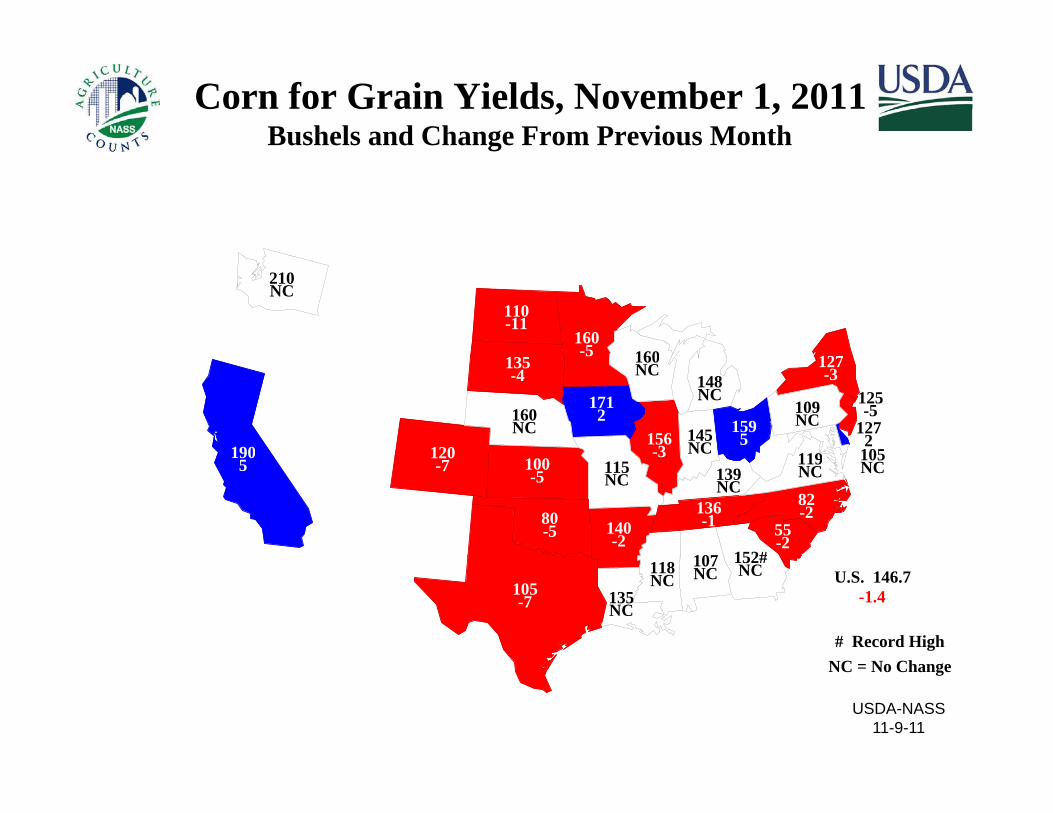
Corn for Grain Yields, November 1, 2011Bushels and Change From Previous Month
160-5 127
110-11
13
210NC
160
190 1201272156
-3145NC
1712
105
148NC
160NC
125-5
127-3
1595
109NC
135-4
119
160NC
107
140-2
1905
120-7
152#
3100-5 139
NC
105NC115
NC82-280
-5 55-2
136-1
119NC
107NC
152#NC
135NC
118NC U.S. 146.7
-1.4
# Record High
105-7
USDA-NASS 11-9-11
NC = No Change
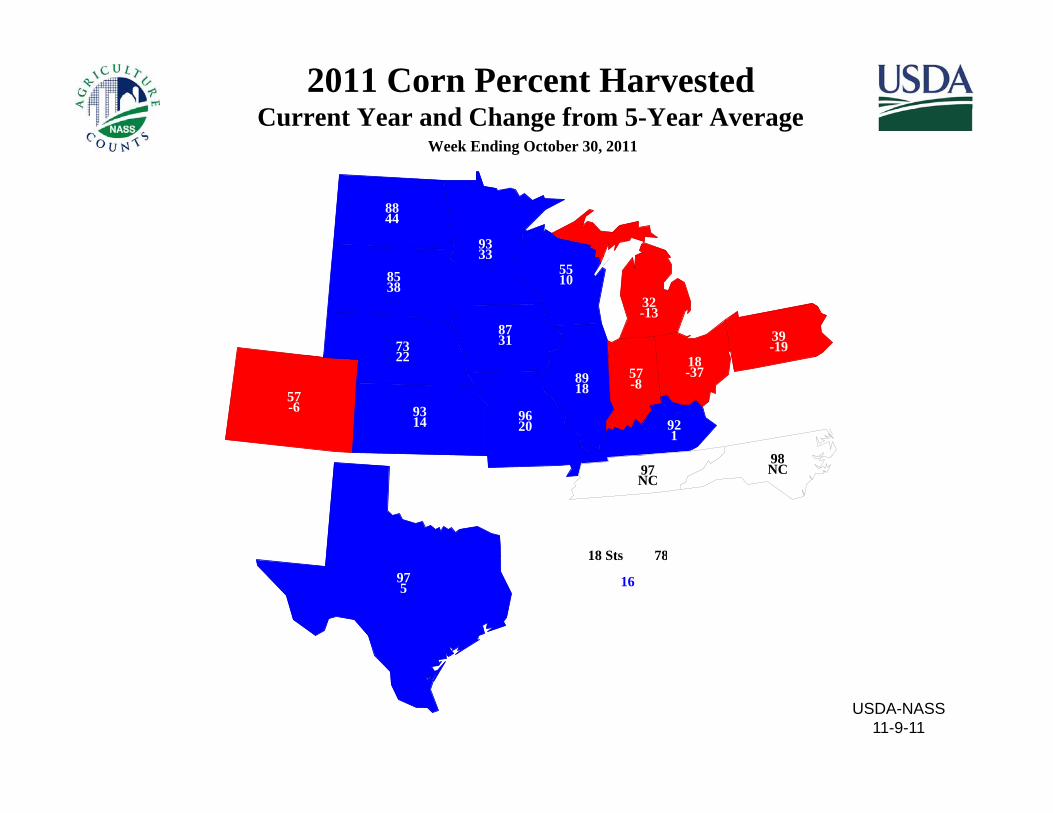
2011 Corn Percent HarvestedCurrent Year and Change from 5-Year Average
Week Ending October 30, 2011
9333
8844
8731
32-13
33
7322 18
39-19
8538
5510
57-6
8918
57-8
9314 92
19620
22
98
18-37
98NC97
NC
18 Sts 78975
18 Sts 78
16
USDA-NASS 11-9-11
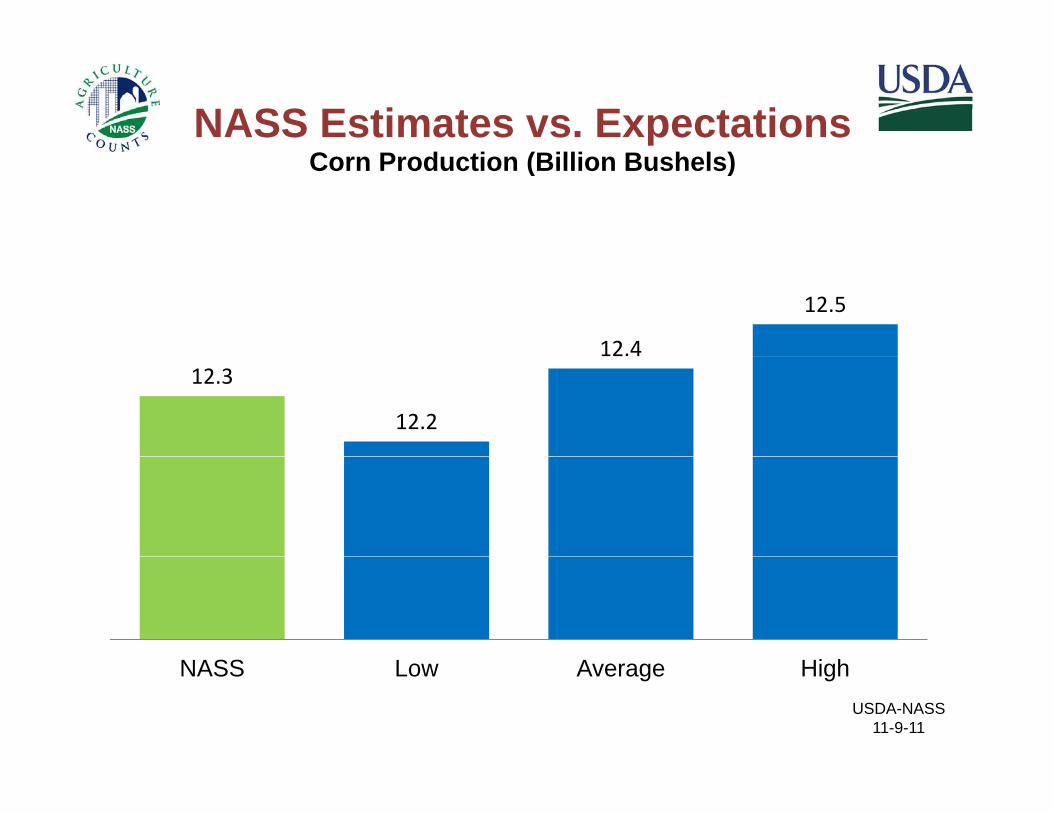
NASS Estimates vs. ExpectationsCorn Production (Billion Bushels)Corn Production (Billion Bushels)
12.4
12.5
12.3
12.2
USDA-NASS 11-9-11
NASS Low Average High
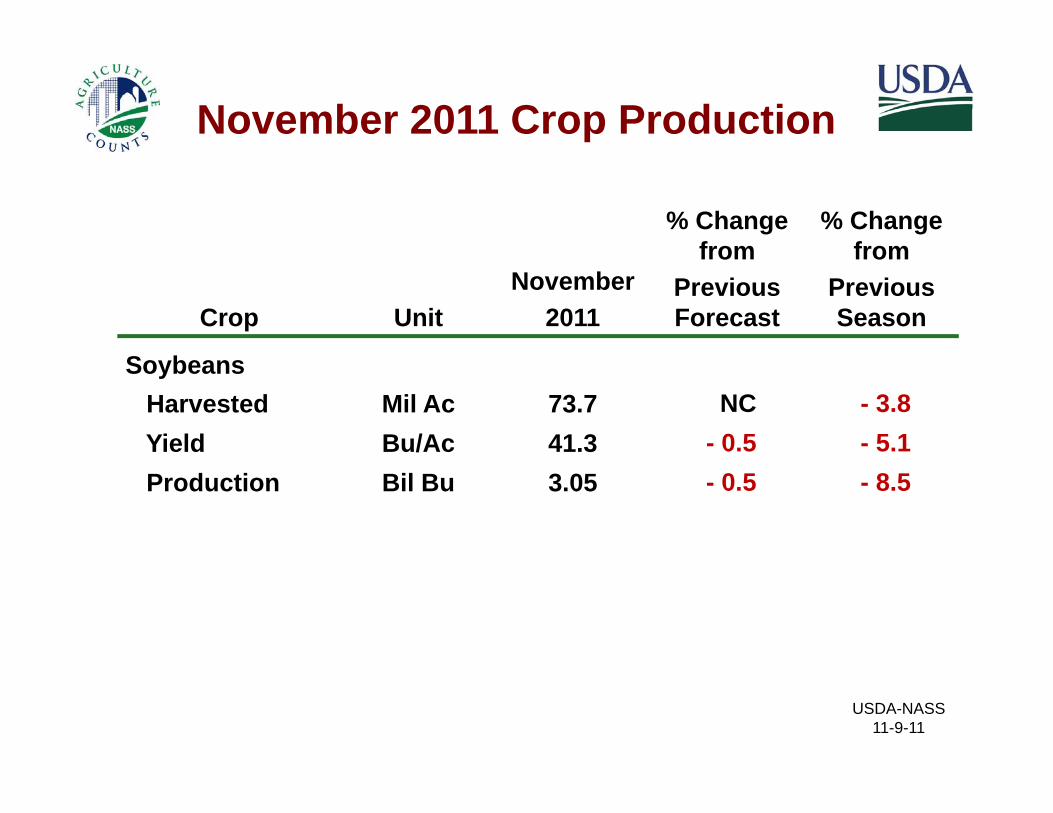
November 2011 Crop Production
% Change from
% Change from
Crop UnitNovember
2011
from Previous Forecast
from Previous Season
S bSoybeansHarvested Mil Ac 73.7 NC - 3.8Yield Bu/Ac 41.3 - 0.5 - 5.1Production Bil Bu 3.05 - 0.5 - 8.5
USDA-NASS 11-9-11
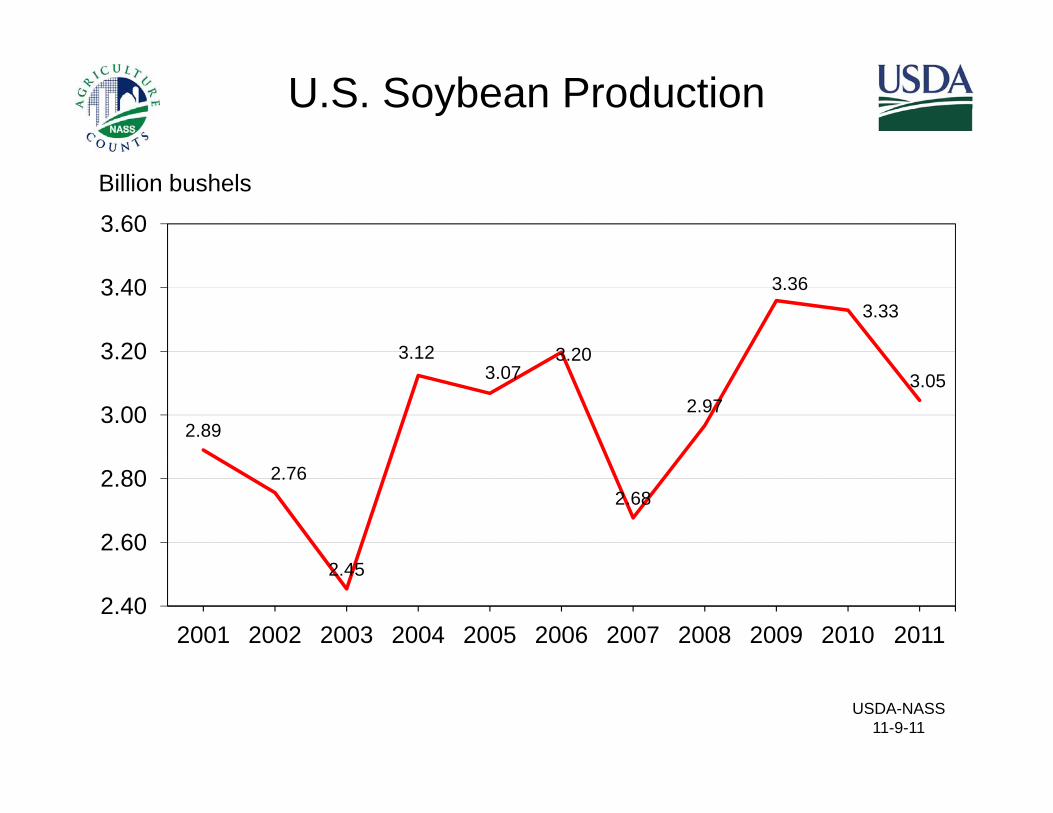
U.S. Soybean Production
3.60
Billion bushels
3.12 3 20
3.363.33
3.20
3.40
2.89
3.123.07
3.20
2.973.05
3.00
3.20
2.762.68
2.60
2.80
2.45
2.402001 2002 2003 2004 2005 2006 2007 2008 2009 2010 2011
USDA-NASS 11-9-11
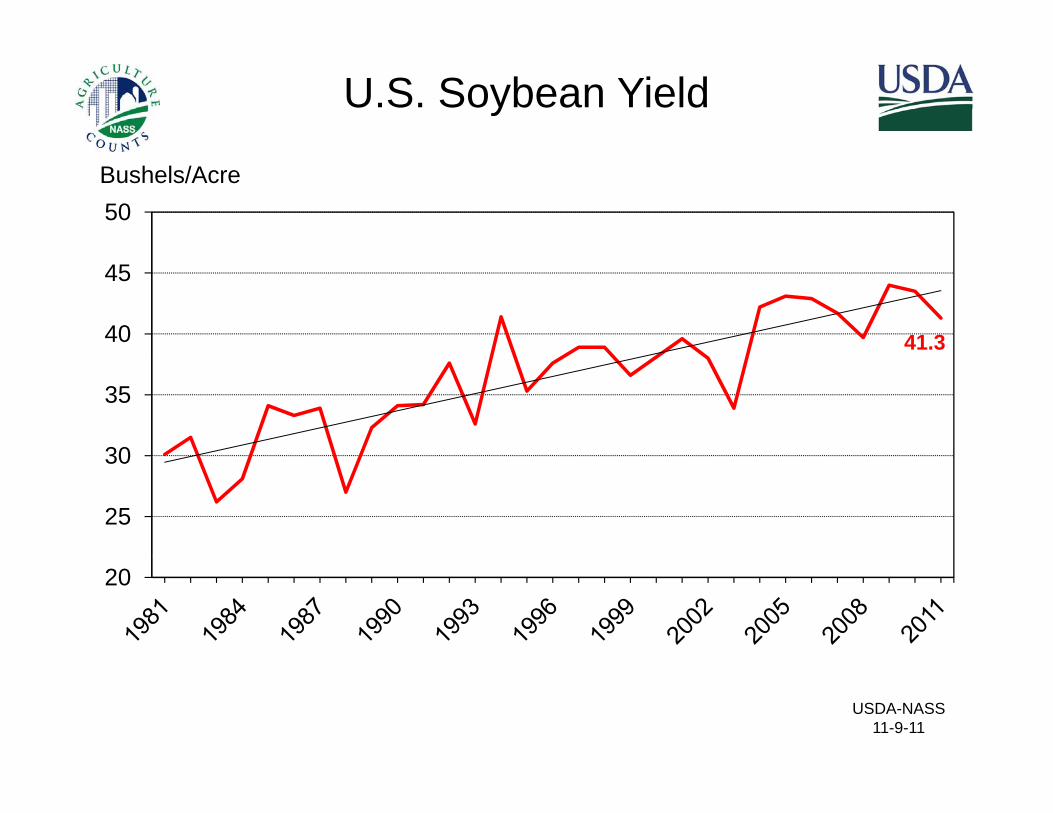
U.S. Soybean Yield
50Bushels/Acre
41.340
45
30
35
25
30
20
USDA-NASS 11-9-11
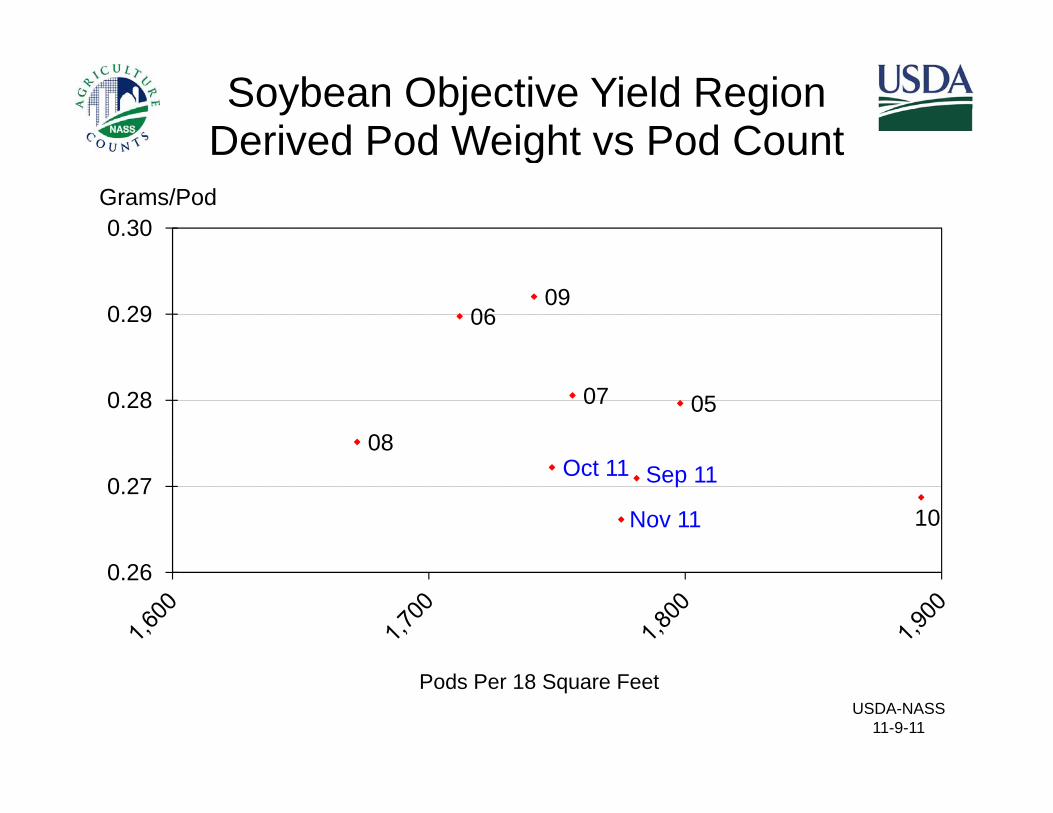
Soybean Objective Yield RegionDerived Pod Weight vs Pod Count
0.30Grams/Pod
g
0609
0.29
0507
08
0.28
10
Sep 11Oct 11
Nov 110.27
0.26
USDA-NASS 11-9-11
Pods Per 18 Square Feet
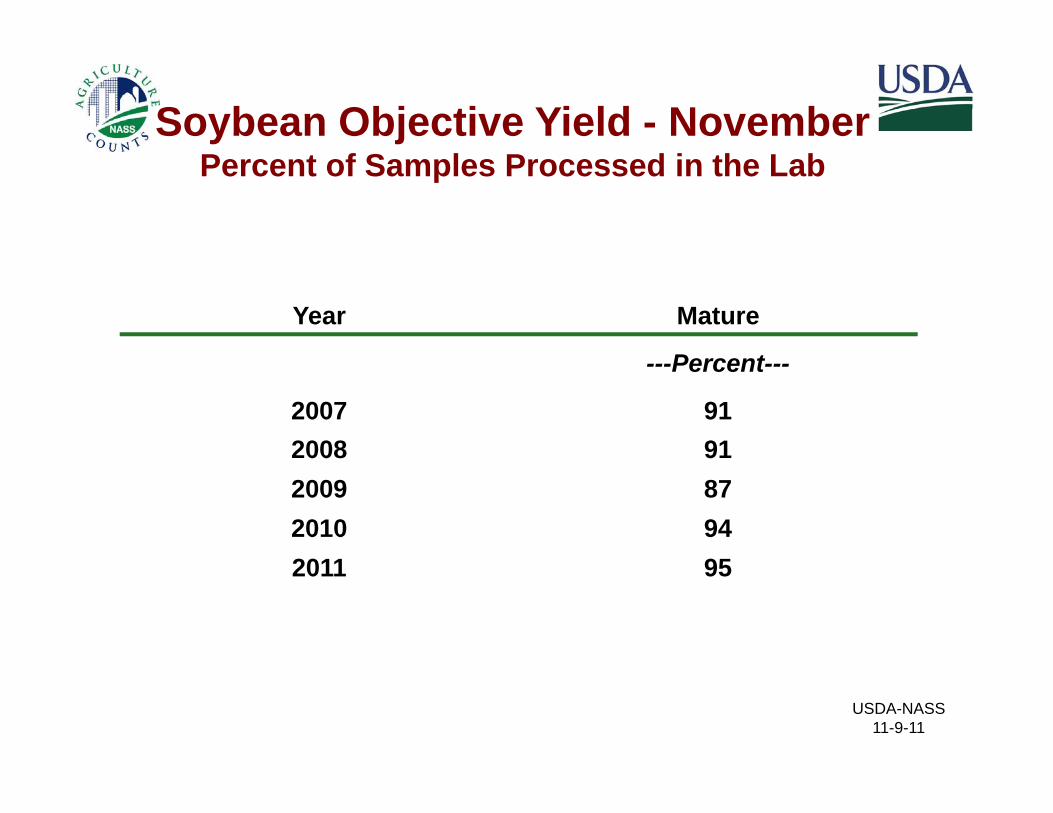
Soybean Objective Yield - November P t f S l P d i th L bPercent of Samples Processed in the Lab
Year Mature
P t---Percent---
2007 912008 912008 912009 872010 942011 95
USDA-NASS 11-9-11
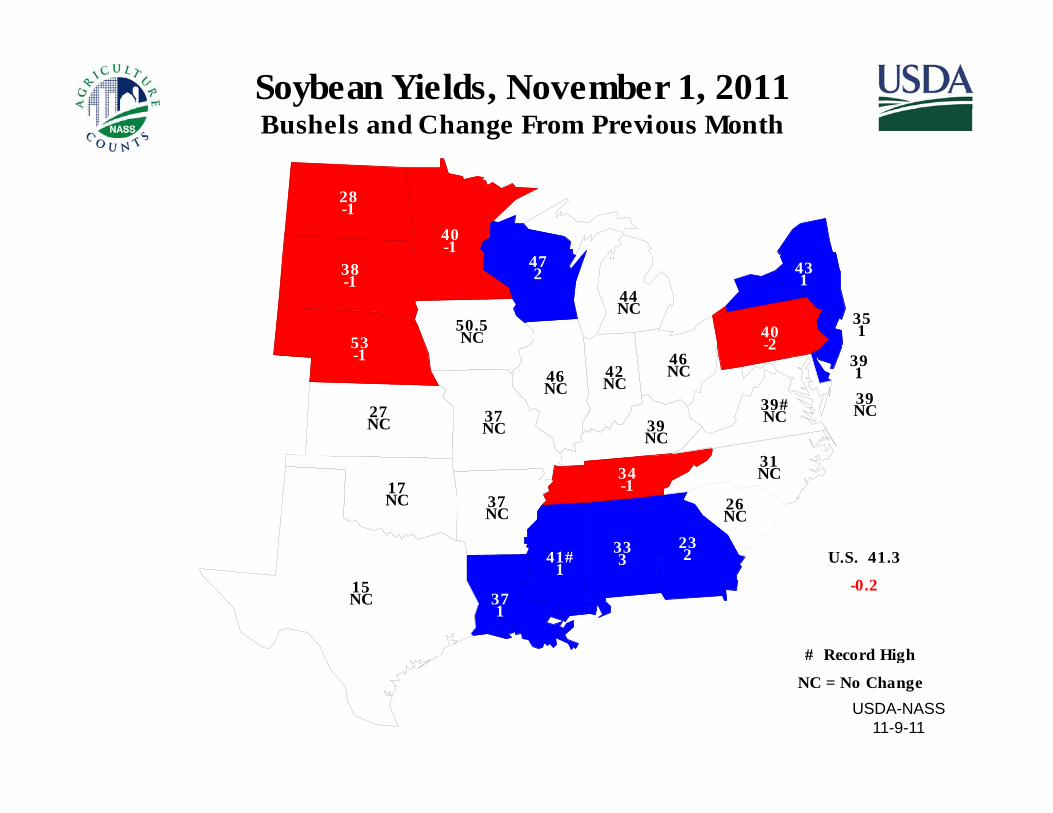
Soybean Yields, November 1, 2011Bushels and Change From Previous Month
40-1
28-1
47
39
50.5NC
44NC
53-1
351
431
46
40-2
38-1
472
39146
NC42NC
27NC 39
NC
39NC37
NC
-1
31
46NC
39#NC
333
37NC
23241#
31NC
17NC 26
NC
U S 41 3
34-1
3 2
371
41#1
U.S. 41.3
-0.2
# Record High
15NC
USDA-NASS 11-9-11
# Record High
NC = No Change
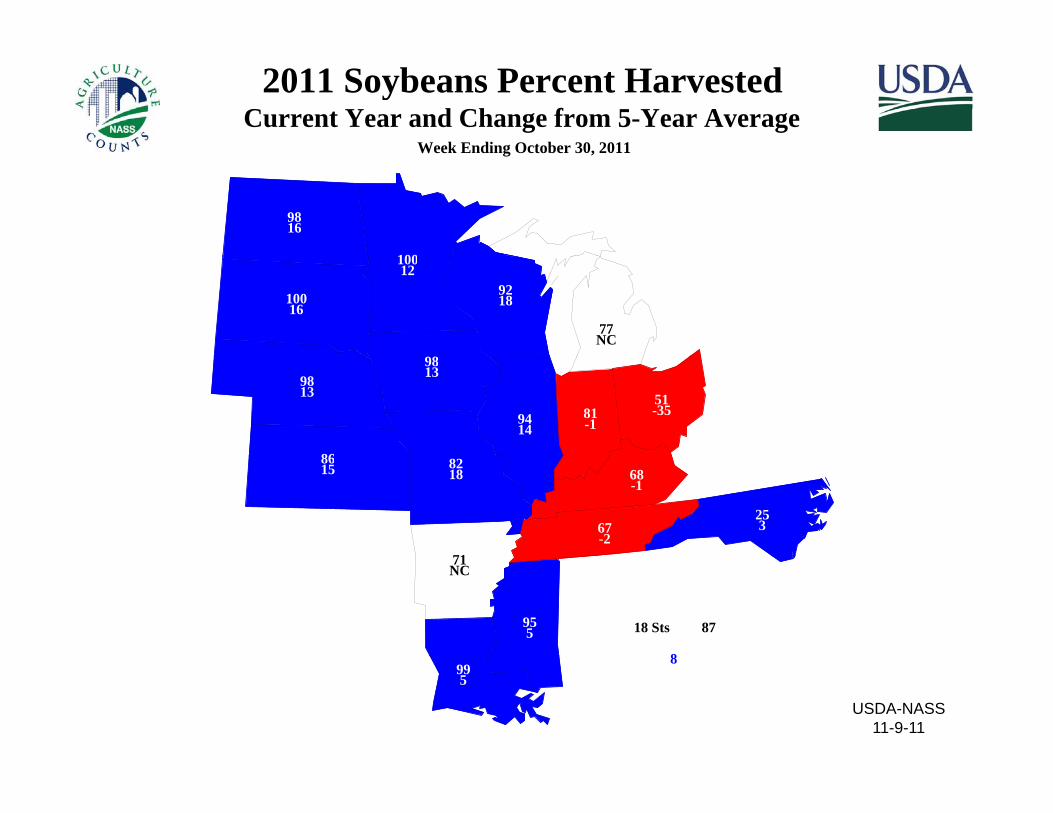
2011 Soybeans Percent HarvestedCurrent Year and Change from 5-Year Average
Week Ending October 30, 2011
100
9816
98
77NC
10012
10016
9218
9414
81-1
9813
86
9813 51
-35
71
8615 68
-18218
25367
-271NC
955 18 Sts 87
8
USDA-NASS 11-9-11
995
8
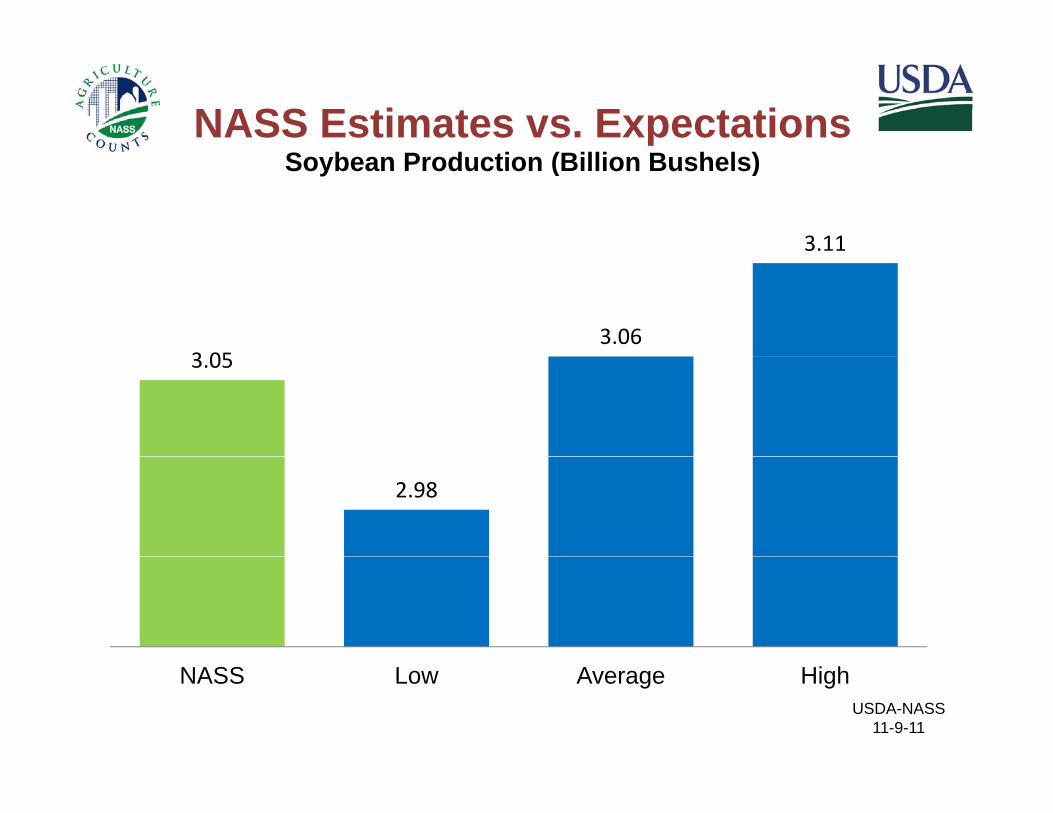
NASS Estimates vs. ExpectationsSo bean Prod ction (Billion B shels)
3.11
Soybean Production (Billion Bushels)
3 053.06
3.05
2.98
USDA-NASS 11-9-11
NASS Low Average High
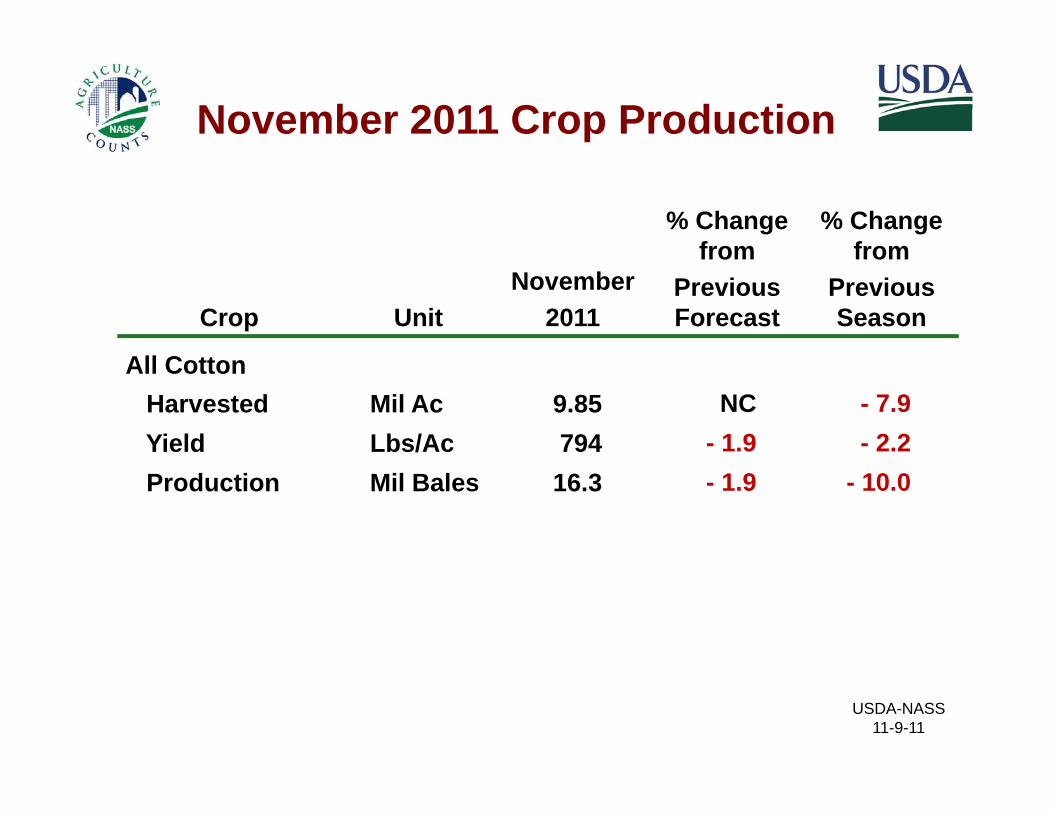
November 2011 Crop Production
% Change from
% Change from
Crop UnitNovember
2011
from Previous Forecast
from Previous Season
All C ttAll CottonHarvested Mil Ac 9.85 NC - 7.9Yield Lbs/Ac 794 - 1.9 - 2.2Production Mil Bales 16.3 - 1.9 - 10.0
USDA-NASS 11-9-11
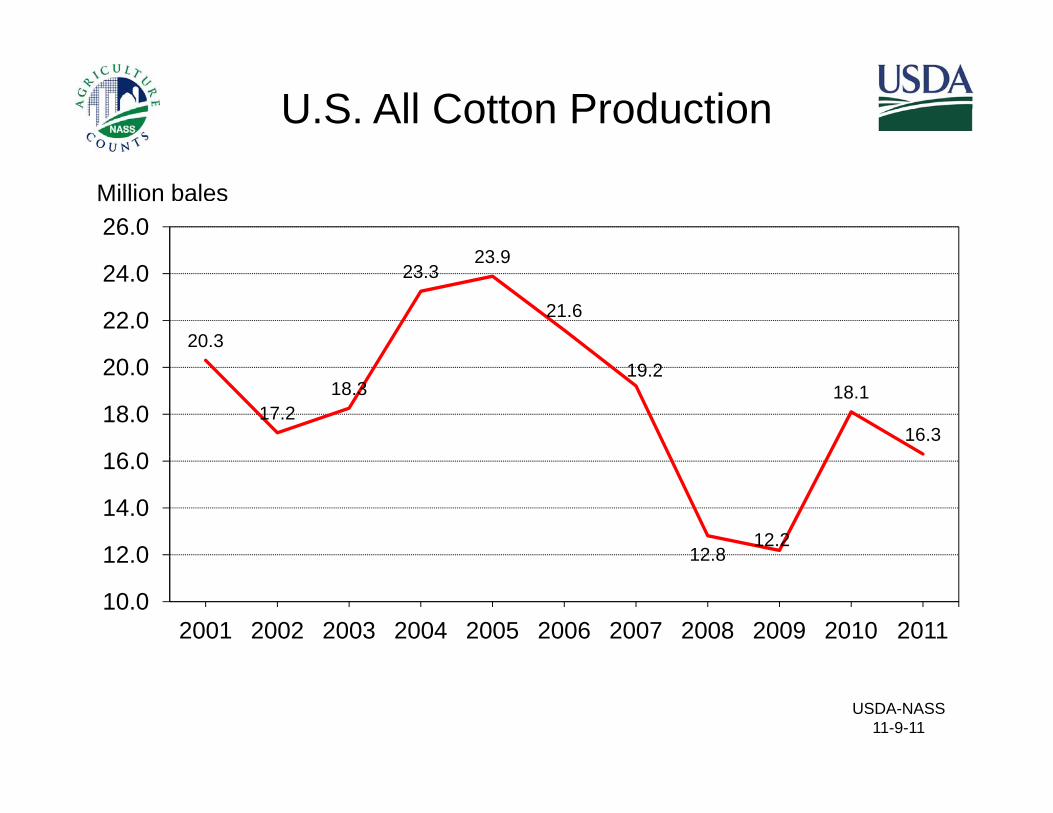
U.S. All Cotton Production
23 926.0Million bales
20.3
23.323.9
21.622.0
24.0
17.218.3
19.218.1
16.316 0
18.0
20.0
12 812.2
12 0
14.0
16.0
12.8
10.0
12.0
2001 2002 2003 2004 2005 2006 2007 2008 2009 2010 2011
USDA-NASS 11-9-11
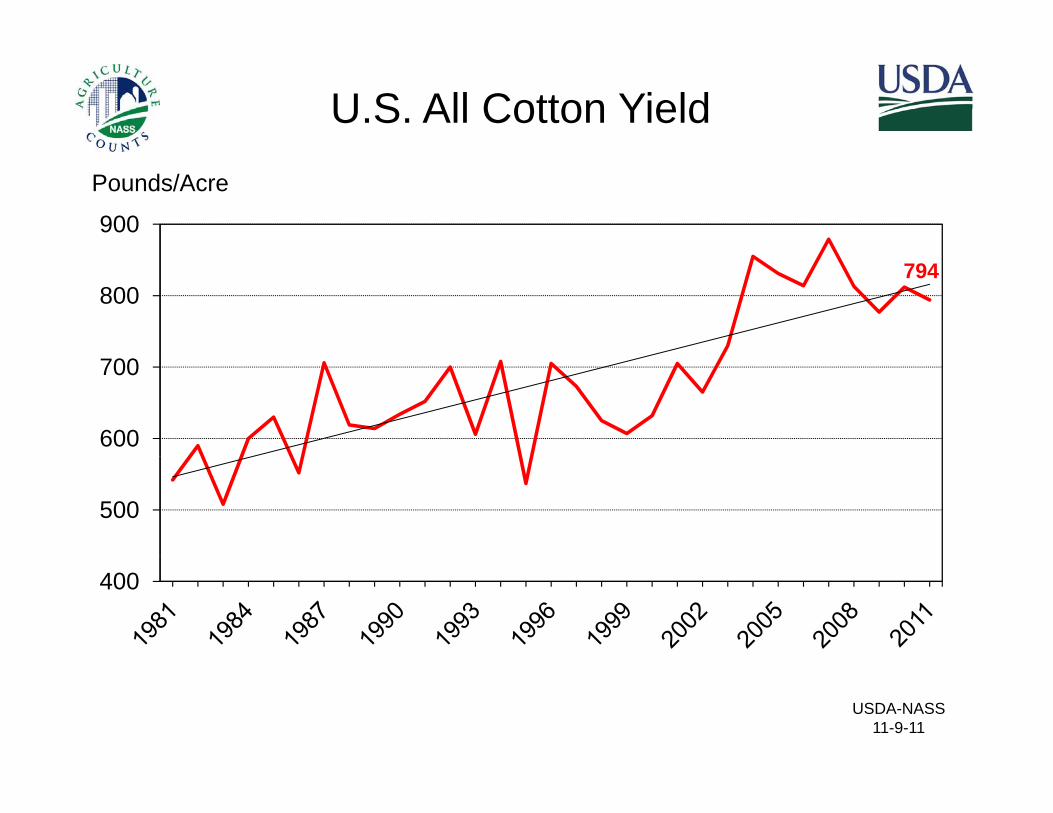
U.S. All Cotton Yield
900
Pounds/Acre
794800
600
700
500
400
USDA-NASS 11-9-11
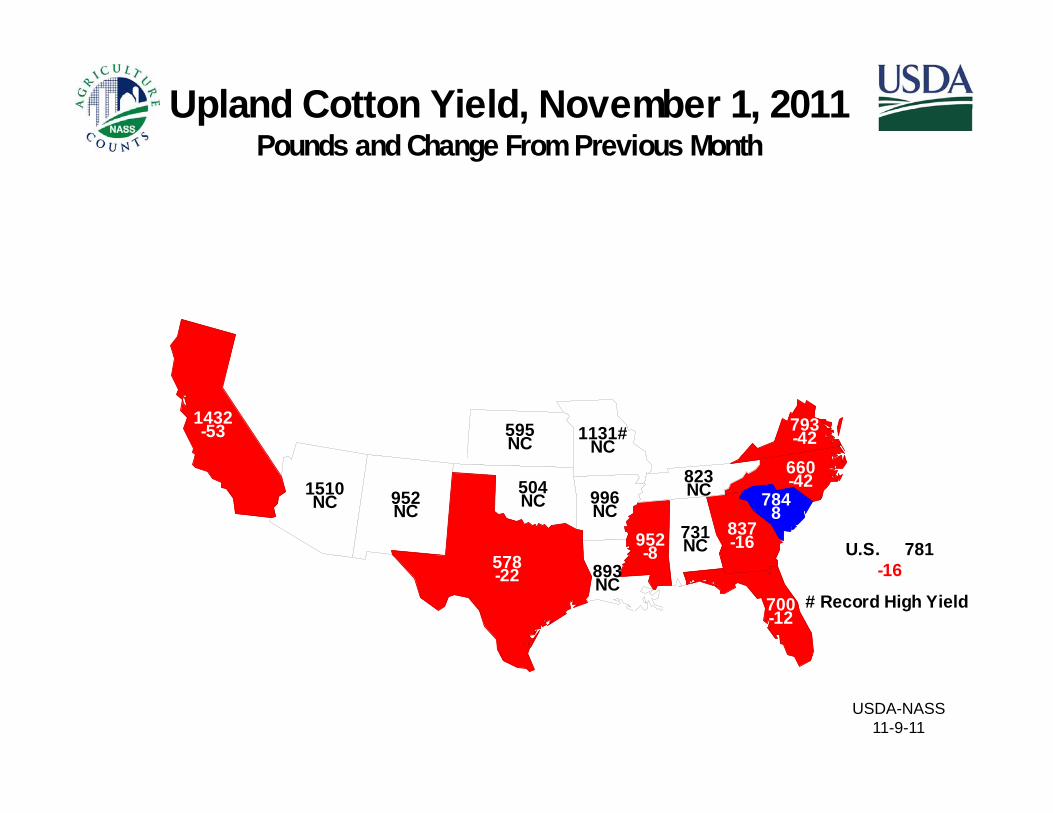
Upland Cotton Yield, November 1, 2011Pounds and Change From Previous Monthg
1432-53 595
NC 1131#NC
793-42
731NC
1510NC 996
NC837-16952
-8
952NC
660-42504
NC 7848
U.S. 781
823NC
578
700-12
893NC
8-16
# Record High Yield
578-22
USDA-NASS 11-9-11
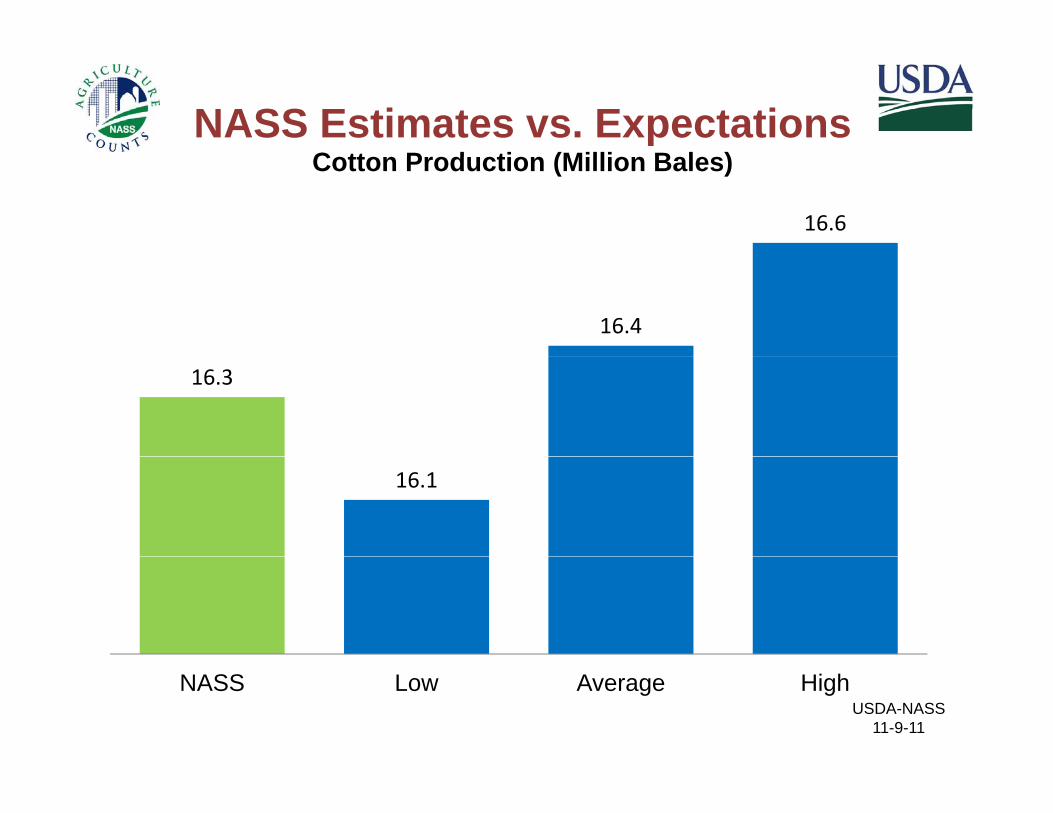
NASS Estimates vs. ExpectationsCotton Prod ction (Million Bales)
16.6
Cotton Production (Million Bales)
16.4
16.3
16.1
USDA-NASS 11-9-11
NASS Low Average High
November 2011 Crop Production
% Change from
% Change from
Crop UnitNovember
2011
from Previous Forecast
from Previous Season
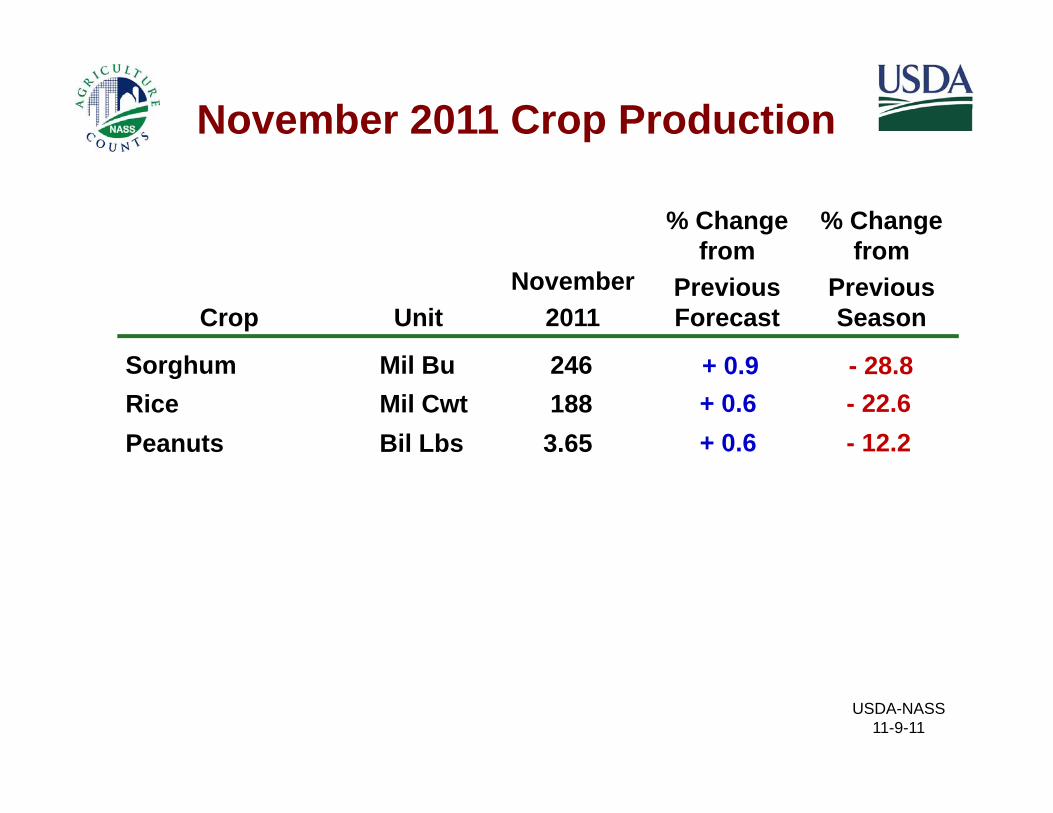
S h Mil B 246 0 9 28 8Sorghum Mil Bu 246 + 0.9 - 28.8Rice Mil Cwt 188 + 0.6 - 22.6Peanuts Bil Lbs 3.65 + 0.6 - 12.2
USDA-NASS 11-9-11
November 2011 Crop Production
% Change from
% Change from
Crop UnitNovember
2011
from Previous Forecast
from Previous Season
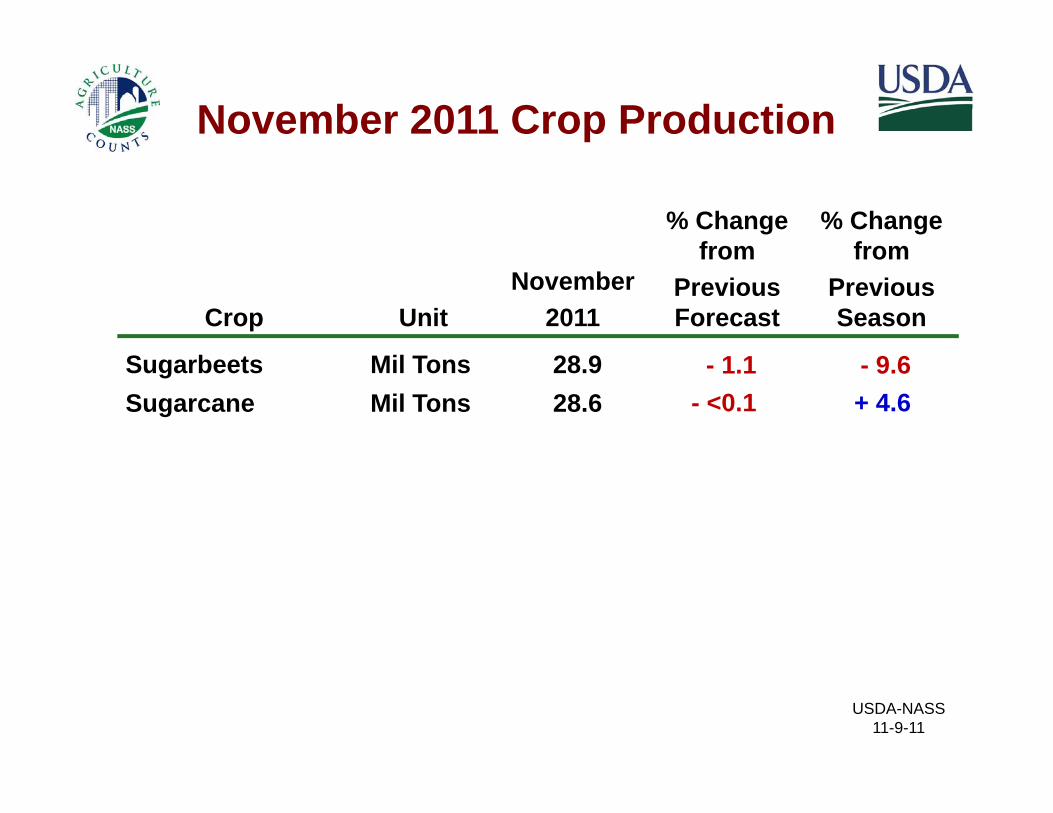
S b t Mil T 28 9 1 1 9 6Sugarbeets Mil Tons 28.9 - 1.1 - 9.6Sugarcane Mil Tons 28.6 - <0.1 + 4.6
USDA-NASS 11-9-11
November 2011 Crop Production
% Change from
% Change from
Crop UnitNovember
2011
from Previous Forecast
from Previous Season
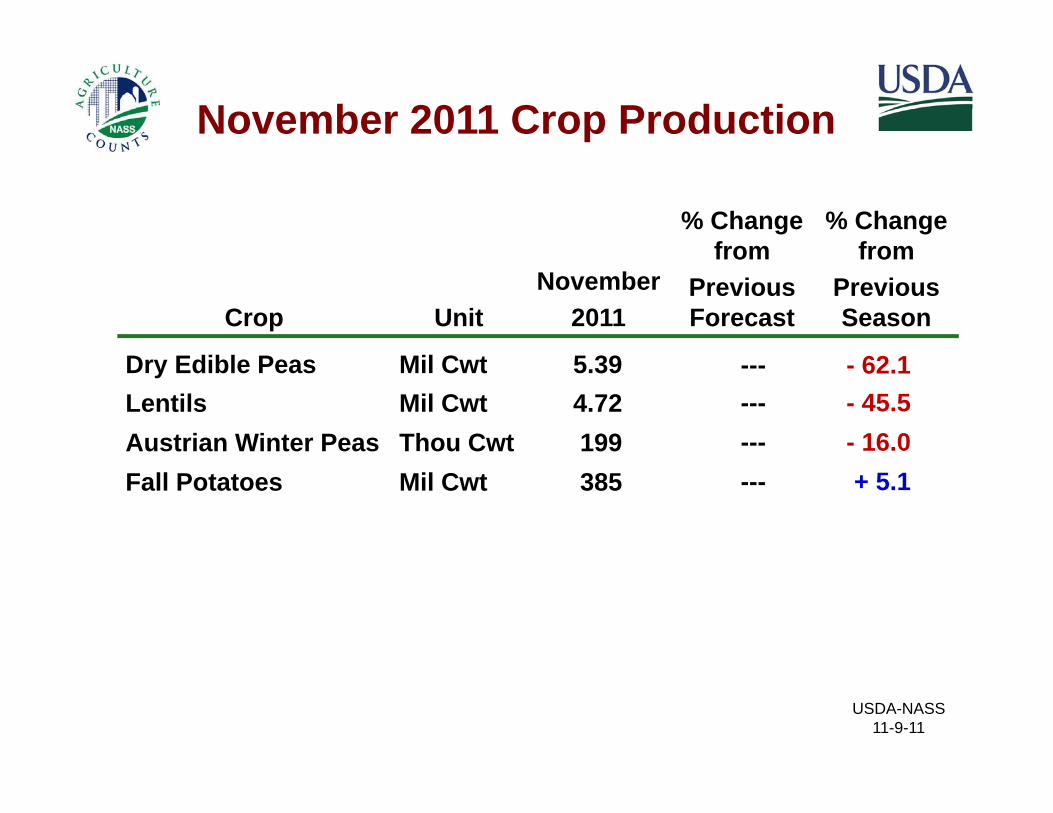
D Edibl P Mil C t 5 39 62 1Dry Edible Peas Mil Cwt 5.39 --- - 62.1Lentils Mil Cwt 4.72 --- - 45.5Austrian Winter Peas Thou Cwt 199 --- - 16.0Fall Potatoes Mil Cwt 385 --- + 5.1
USDA-NASS 11-9-11
Small Grains Annual Summary% Change
from Previous
% Change from
Previous Crop Unit 2011 Estimate Season
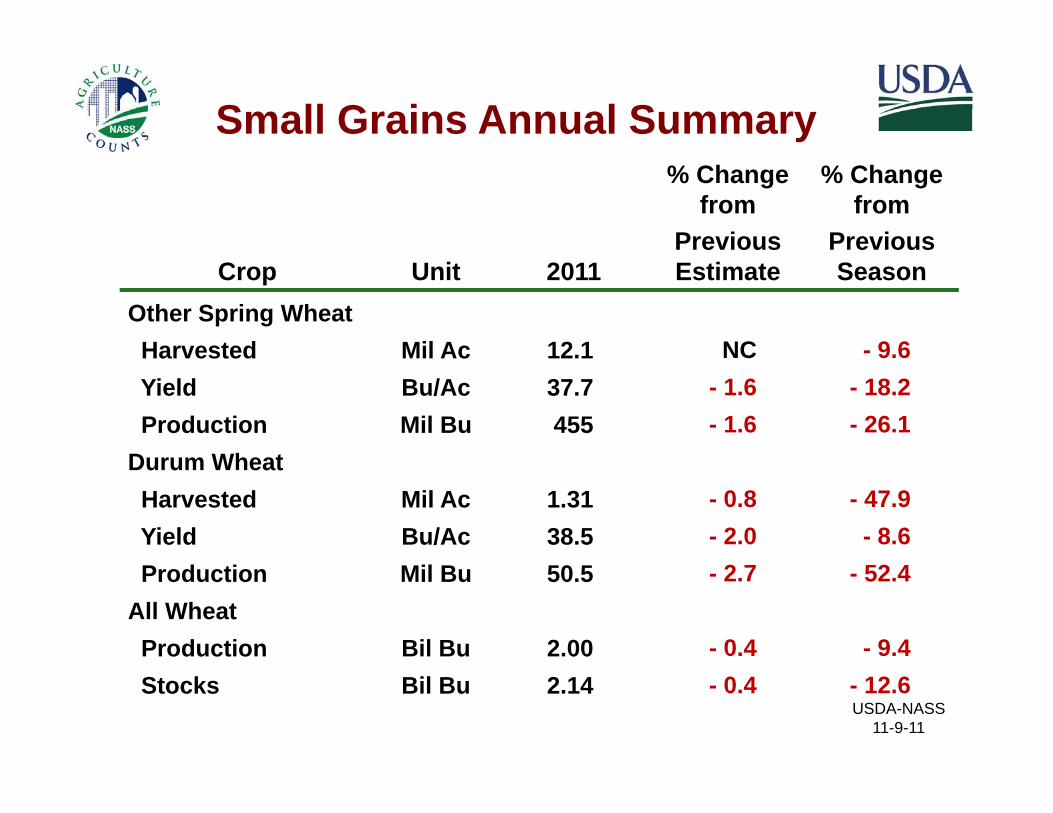
Other Spring WheatHarvested Mil Ac 12.1 NC - 9.6Harvested Mil Ac 12.1 NC 9.6Yield Bu/Ac 37.7 - 1.6 - 18.2Production Mil Bu 455 - 1.6 - 26.1
D Wh tDurum WheatHarvested Mil Ac 1.31 - 0.8 - 47.9Yield Bu/Ac 38.5 - 2.0 - 8.6Production Mil Bu 50.5 - 2.7 - 52.4
All WheatProduction Bil Bu 2.00 - 0.4 - 9.4
USDA-NASS 11-9-11
Production Bil Bu 2.00Stocks Bil Bu 2.14 - 0.4 - 12.6
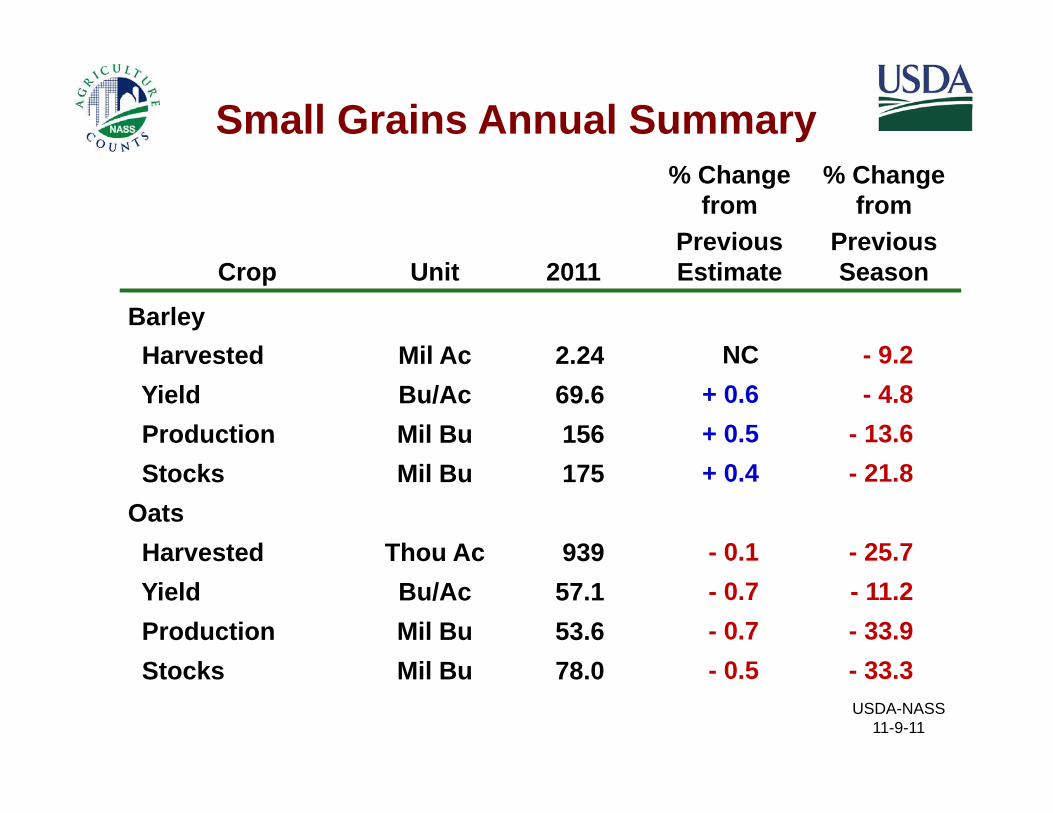
Small Grains Annual Summary% Change
from Previous
% Change from
Previous Crop Unit 2011 Estimate Season
BarleyHarvested Mil Ac 2 24 NC - 9 2Harvested Mil Ac 2.24 NC - 9.2Yield Bu/Ac 69.6 + 0.6 - 4.8Production Mil Bu 156 + 0.5 - 13.6Stocks Mil Bu 175 + 0.4 - 21.8
OatsHarvested Thou Ac 939 - 0 1 - 25 7Harvested Thou Ac 939 0.1 25.7Yield Bu/Ac 57.1 - 0.7 - 11.2Production Mil Bu 53.6 - 0.7 - 33.9
USDA-NASS 11-9-11
Stocks Mil Bu 78.0 - 0.5 - 33.3
United States Department of AgricultureNational Agricultural Statistics ServiceNational Agricultural Statistics Service
Upcoming Reports
Nov 18 Cattle on FeedNov 18 Cattle on Feed
Nov 30 Agricultural Prices
Dec 9 Crop Production
USDA-NASS 11-9-11