Embed Size (px)
Citation preview
ANALYST CERTIFICATIONS AND IMPORTANT DISCLOSURES ARE IN THE DISCLOSURE APPENDIX. FOR OTHER
IMPORTANT DISCLOSURES, PLEASE REFER TO https://firesearchdisclosure.credit-suisse.com.
CREDIT SUISSE SECURITIES RESEARCH & ANALYTICS BEYOND INFORMATION®
Client-Driven Solutions, Insights, and Access
November Manufacturing PMI Roundup
Welcome, but Somewhat Puzzling Strength
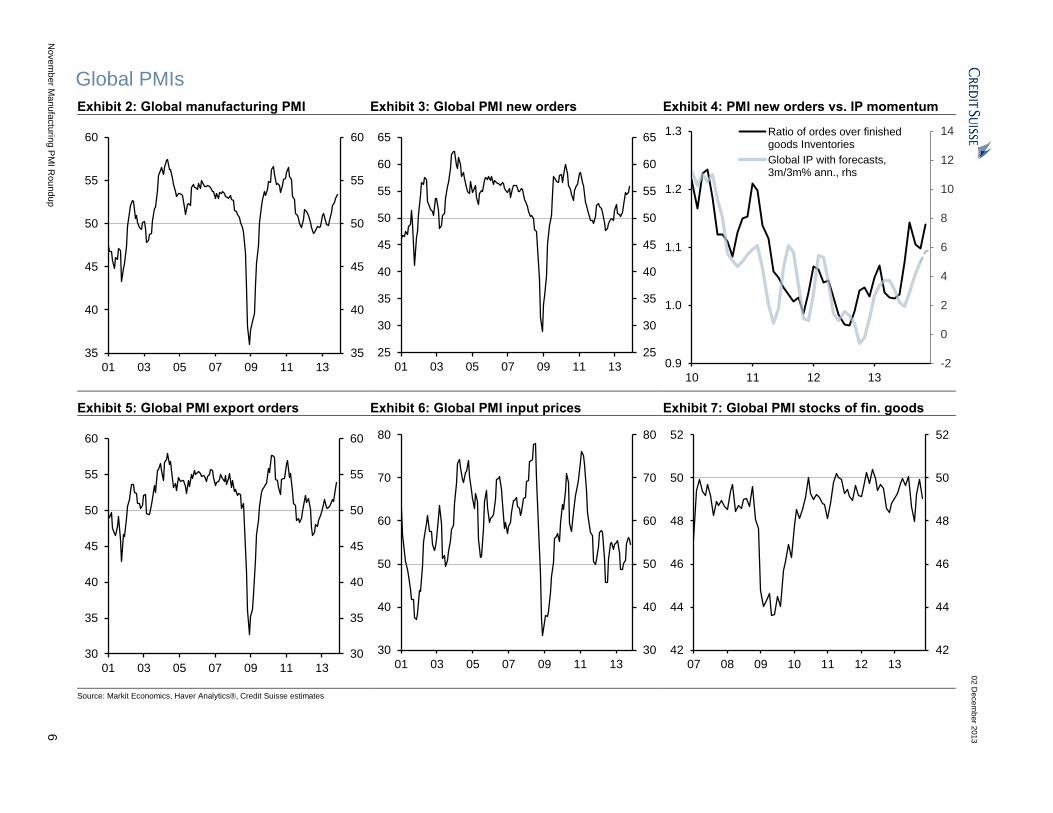
The global manufacturing PMI increased further for the sixth consecutive
month in November to 53.4 from 53.01. The index reached its highest level
since May 2011 and is running above its long-term average of 51.5. This is
consistent with our view that the pace of global industrial activity is running
above trend.
The monthly advance was mainly driven by developed markets – especially the
US and Japan – but emerging markets have also contributed positively to the
monthly rise. This is encouraging, but one of the puzzles inasmuch as global
trade has been lackluster over the last two years.
The new orders component of the survey confirmed the rebound observed in
October, while the stocks of finished goods fell on the month. Such a mix is
generally indicative of a positive production outlook in the short term. We
would note, though, that our latest CS Basic Materials Index (CSBMI) (Cruising
Along) is pointing to a softening in industrial activity in the coming months. This
is another puzzle.
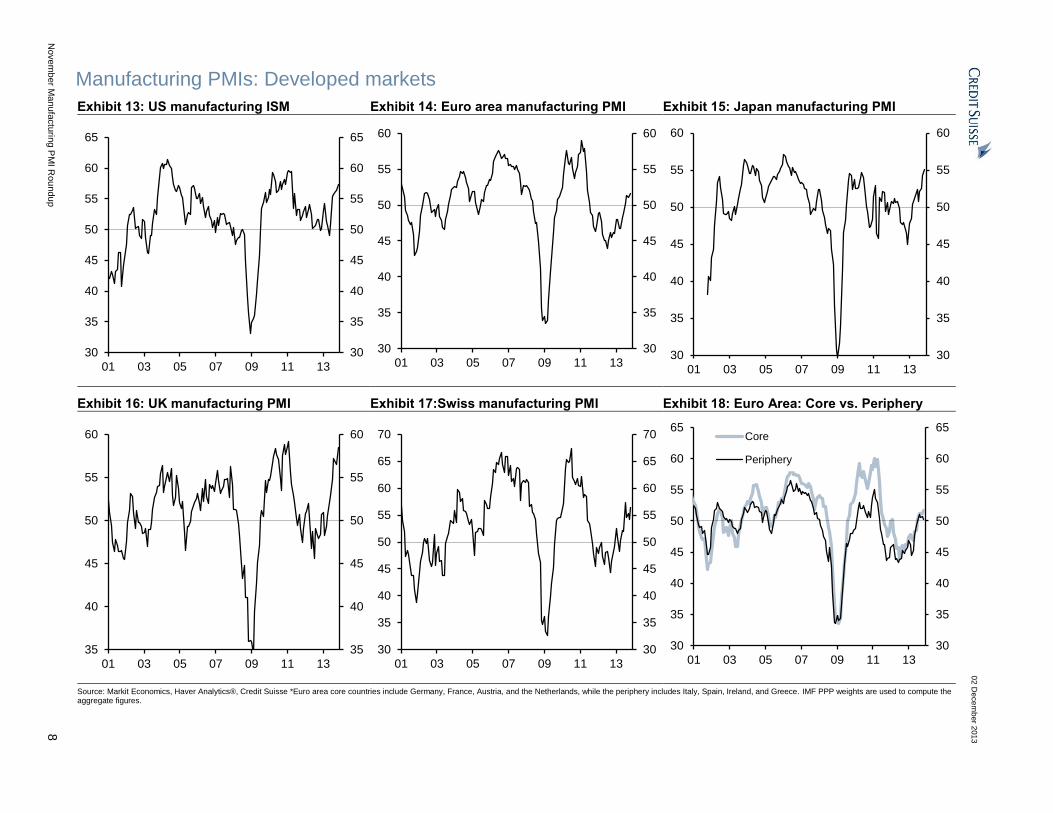
In the US, November ISM manufacturing registered its sixth consecutive
increase, rising 0.9 points to 57.3, the highest level since April 2011. New
orders, the leading indicator, rose a robust 3.0 points to 63.6, recording a notable
fourth consecutive print above 60. The new orders-inventory spread widened to
13.1 after narrowing over the previous two months. This may suggest the recent
strong inventory gains in both hard data and the survey data have not resulted in
an “oversupply” condition. Consistent with that story, the ISM customer inventory
index declined on the month, to a subdued level of 45.0. Additionally, stronger
foreign demand was manifest in the report. New Export Orders notched another
impressive increase; the November index printed at 59.5, among the better levels
of the current expansion. Foreign demand appears to be a key driver behind the
firmer readings in overall new orders.
A conspicuous gap has opened up between the ISM and hard data on US
industrial production and durable goods. The puzzle isn’t readily explained, but
we would note ISM has had a stronger relationship with global measures
of activity than US measures of activity in recent years. This may be part of
the story. Recent ISM strength may be more indicative of a global rebound than
a specific US rebound.
The euro area PMI has continued to hover around a level consistent with
sluggish growth for the fourth consecutive month. After a compelling
improvement observed last Spring, current dynamics are consistent with our
view that the pace of the recovery should be modest. Despite certain
normalization in economic conditions, a number of negative factors appear to be
keeping the Eurozone’s growth prospects constrained in coming months. In
details, the November manufacturing PMI increased slightly to 51.6 from 51.3,
the highest level reached since June 2011. The output component rose a touch
1 Please refer to the Technical Note on page 4 on the methodology used in constructing our global manufacturing PMIs.
Research Analysts
Neal Soss
+1 212 325 3335
Axel Lang
+44 20 7883 3738
Isaac Lebwohl
+1 212 538 1906
Natig Mustafayev
+44 20 7888 1065
02 December 2013
Economics Research
http://www.credit-suisse.com/researchandanalytics

02 December 2013
November Manufacturing PMI Roundup 2
to 53.1 from 52.9 and the new orders index was also up, to 52.3 from 51.9, mainly thanks
to a robust export market. On the other hand, the stock of finished goods has crept up
marginally higher while employment remains stuck at unsatisfactory levels.
At the country level, divergent dynamics are reappearing after several months of
synchronized improvement. In Germany, the index increased by one point to 52.7, its
highest level since June 2011. The output and new orders components, respectively, rose
to a healthy 54.9 and 54.5 (from 53.6 and 52.5) while inventories increased at a more
moderate pace. The French index fell to 48.4 from 49.1. The cyclical weakness of that
economy was again apparent in the PMI report, which has remained below the 50-line
since July 2011. The details of the survey were unpromising: new orders declined to 46.8
from 48.3, output fell to 48.0 from 49.0, and inventories rose slightly at 47.1 from 46.6.
Similarly, the Spanish PMI returned below the 50-line, falling by 2.5 points to 48.6, its
lowest level since May. Domestic new orders (-4.7 points) were the main drag this month
as Spain’s export market appears resilient at 53.7. Output consequently corrected
significantly by almost 3 points to 48.8. On the other hand, the Italian index showed signs
of resilience, increasing to 51.4 after 50.7 in October. The improvement was mainly due to
the employment index, which rose above 50 for the first time since May 2011. New orders
remained unchanged but new export orders rose solidly to a high 57.2, suggesting some
weakness stemming from domestic demand. Finally, the Greek PMI increased to 49.2
from 47.3, its highest level since August 2009, indicating that economic conditions are
stabilizing across all the sectors of the economy.
In the UK, the November PMI was solid, reaching 58.4, its highest level since February
2011. In addition, the new orders component was the highest since July 1994. The
employment index was also very strong, and new orders minus stocks of finished goods
(which we use as a cyclical indicator) was at levels indicating a solid expansion.
Japan’s PMI advanced further in November to 55.1 from 54.2, reaching the highest
level since July 2006. The move in the forward-looking new orders index was similarly
encouraging: new orders rose 1.7 points to 58.4, also a multiyear high. New export orders
were stronger in November, while the stock of finished goods fell slightly on the month.
Separately, industrial production rose just 0.5% mom in October after a 1.3% mom gain in
September. There seems relatively limited room for a major acceleration in the production
recovery in the winter. A fading-out of the boost from the yen’s depreciation, and a sign of
a local peak in Q4 hinted by the global leading indicator of the production cycle (CSBMI),
do not augur well for strong production increases in Japan in the coming months.
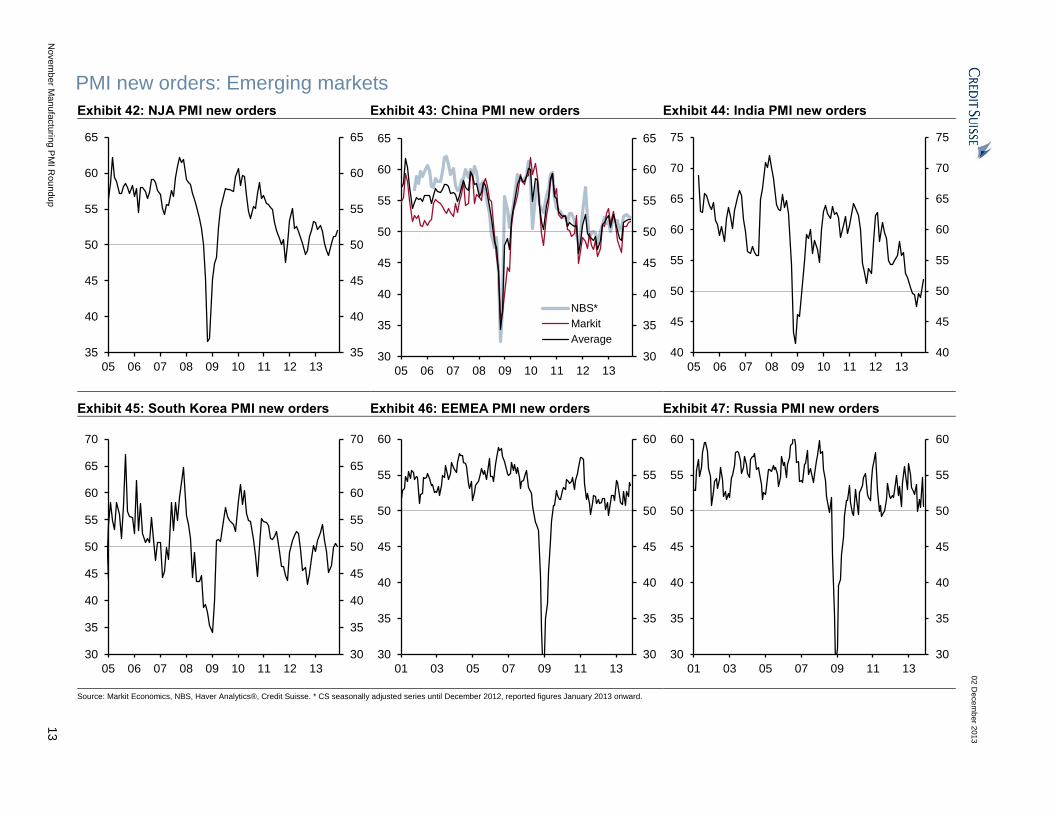
EM’s aggregate PMI increased further for the fourth consecutive month to an eight-
month high of 51.2 in November from 51.0 in October, driven by the pick-up in the
NJA and EEMEA (excluding Russia) regions. This result is in line with our VAR analysis
published in the report Pulse of Global Industry: Tentative Signs of a 4Q Peak in IP
Momentum (page 23) as the emerging markets have been benefiting from the pick-up in
economic activity in developed markets since 3Q 2013. It is worth highlighting that in
November, the manufacturing PMI declined only in Brazil and Russia, and remained
broadly unchanged in China.
In China, the official NBS PMI remained unchanged at 51.4 in November, while
Markit/HSBC PMI edged slightly lower. The official NBS PMI remained flat in November
at a 19-month high of 51.4 after increasing for four consecutive months from its recent
trough in June. Meanwhile, the Markit/HSBC PMI declined only marginally by 0.1 index-
points from a seven-month peak of 50.9 in October. According to our economists, both
indices confirm that the Chinese economy sustained its growth momentum in November
and the ongoing trend can be characterized as one of a weak expansion without a further
upward momentum (see China: NBS PMI showed sustained growth stabilisation).
The authors of this report wish to
acknowledge the contribution made
by Pawel Chmielniak, an employee
of CRISIL Global Research and
Analytics, a business division of
CRISIL Limited, a third-party
provider of research services to
Credit Suisse, in preparing the EM
section of this report.

02 December 2013
November Manufacturing PMI Roundup 3
In the rest of the NJA region, the manufacturing PMI improved in all countries of the
region with India recording the most notable increase in November. India’s
manufacturing PMI rebounded in recent months from a 54-month low of 48.5 in August to
an eight-month high of 51.3 in November. The sharp pick-up was mainly driven by output
and forward-looking new orders components, however, we should note that PMI still
remained relatively weak compared to an average of 53.0 in 1Q 2013. In Korea, the
manufacturing PMI increased slightly for the fourth consecutive month to 50.4 in
November from 50.2 in October, however, we note that new export orders declined
sharply from a 31-month high of 53.7 in October to 51.9 in November. Taiwan’s
manufacturing PMI remained elevated and picked up slightly from 53.0 to a 20-month high
of 53.4 in November, driven mainly by current output and new orders components.
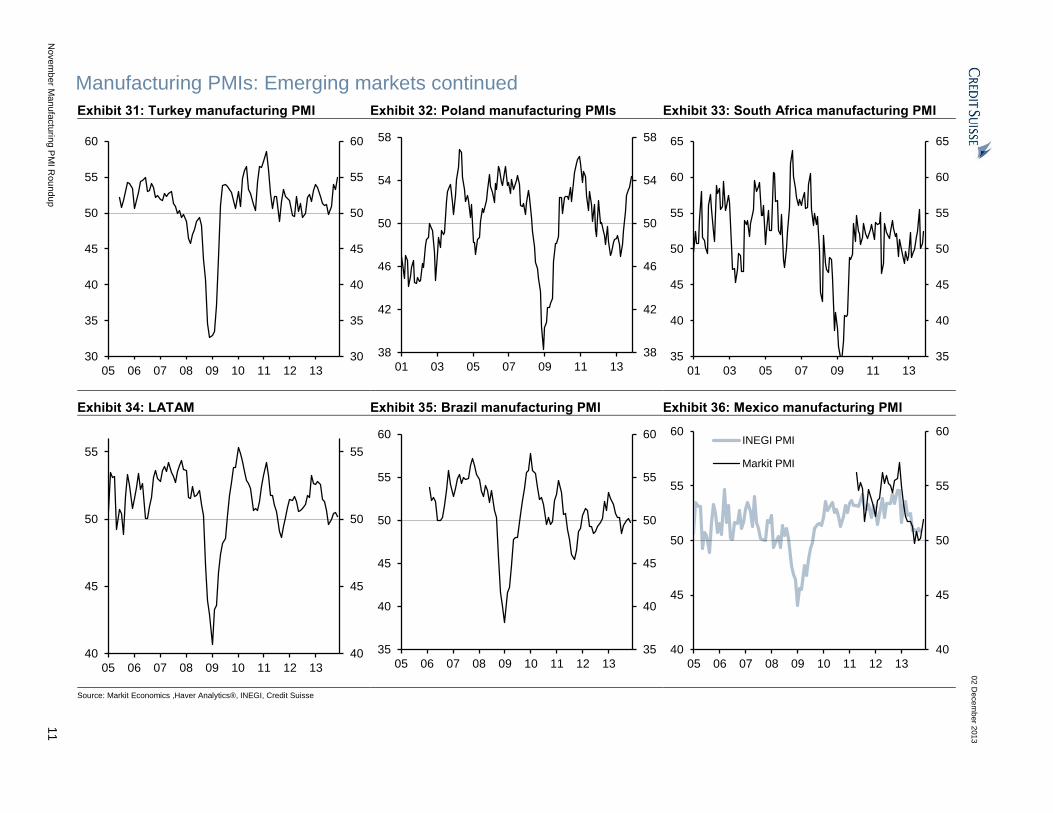
In Latin America, Brazil’s manufacturing PMI declined slightly from 50.2 in October to
49.7 in November. We note that 2H 2013 PMI readings in Brazil have been weaker
compared to 1H 2013. In Mexico, the manufacturing PMI improved significantly from 50.2
in October to an eight-month high of 51.9 in November, confirming that Mexico’s economy
has been recovering in recent months. Mexico’s November PMI by INEGI will be released
on 4 December.
The EEMEA region’s manufacturing PMI declined modestly to 52.0 in November
from a 30-month high of 52.4 in October, led by a sharp decline in Russia’s PMI
despite the pick-up in the rest of the region. The manufacturing PMI improved
modestly in CE3 countries and significantly in Turkey and South Africa. The forward-
looking PMI new orders index, however, was down by 0.5 points to 53.5 in November,
suggesting a more subdued pace of expansion in the coming months.
In Russia, the manufacturing PMI declined significantly from an eight-month high of 51.8,
back to 49.4 in November. The decrease was driven by broad-based deceleration of
almost all PMI components. This outturn confirms very weak economic activity in the
manufacturing sector despite stable oil prices, revival in economic activity among trading
partners and a weaker Rouble. Turkey’s manufacturing PMI improved to a 32-month high
of 55.0 in November from 53.3 in October, driven mainly by current output, new orders and
new export orders components. In South Africa, the Kagiso manufacturing PMI increased
from 50.7 in October to 52.4 in November, driven by acceleration in all PMI components.
In CE3 countries, the most notable pick-up was recorded in Hungary, as the manufacturing
PMI rebounded from a three-month low of 51.1 in October to 52.6 in November. Meanwhile,
Czech and Polish PMIs continued increasing and reached multi-year highs in November. In
Poland, the manufacturing PMI increased for the seventh consecutive month from 53.4 in
October to 54.4 in November, the highest reading since April 2011. We note the elevated
readings for both current output and new orders in Poland, as they increased to 56.9 and
57.2, respectively. The Czech Republic’s manufacturing PMI picked up to a 30-month high
of 55.4 in November from 54.5 a month earlier. The increase was driven by output, new
orders and new export orders components. We maintain our view that the pickup in
manufacturing activity in CE3 countries is driven by a rebound in Germany, which is likely to
continue in the coming months, as Germany’s Ifo expectations indicator picked up sharply in
November after moderating modestly in October.
Overall, November PMI reports are consistent with our expectation of a continued
rebound in global IP growth toward the end of this year. However, we expect global IP
growth to plateau in Q1 2014 following the strong pick-up in H2 2013. This is further
confirmed by our Basic Material Indicator (CSBMI), which reached a local peak in
September. The CSBMI generally leads IP growth dynamics by about two months. Our
current expectation is for the IP to slow toward its trend growth rate by next spring before
picking up again in the summer (see our November 25 report Pulse of Global Industry:
Cruising Along).
02 December 2013
November Manufacturing PMI Roundup 4
Technical Note
We report global aggregates based on our own calculation. The main differences between
the calculation of our global aggregates and those reported by Markit Economics include
the following:
1) We use the US ISM Manufacturing Index and the average of the China official NBS
(Credit Suisse adjusted) and the HSBC/Markit PMI surveys in our calculation, while
Markit Economics includes the US Markit PMI and China HSBC/Markit surveys.
The US ISM has more than a 55-year track record, while the Markit PMI data dates only
from May 2007. We may need a bit more time to assess the reliability of Markit PMIs. At this
stage, it seems sensible to include ISM in computing aggregate global and regional PMIs.
The China NBS PMI headline, new orders, and export orders indices retain residual
seasonality. We seasonally adjust the NSA PMIs using the PBoC’s bespoke X12
package until December 2012. Since January 2013, the NBS survey sample size has
increased significantly from 820 to 3,000, which raises the question of how comparable
the new readings are with the historical data before the change. For this reason, we
have not seasonally adjusted the NSA NBS PMIs after the sample increase, but use
the reported figures directly. In addition, the NBS PMI is focused more on large
companies and SOEs, but the Markit survey is more focused on small- and medium-
sized companies and private businesses. By using the average of these two surveys,
our approach should provide a proxy in capturing the bigger picture.
2) Rolling IMF PPP weights are used to compute our regional and global figures, while
fixed GDP shares in 2010 are used in calculating Markit’s global aggregates. We think
PPP weights are more appropriate for computing aggregate manufacturing PMI. For
example, China industrial production in dollar terms accounted for about 18% of global
industrial production in 2011. Fixed GDP shares in 2010 give China about a 7.9%
weight, while rolling PPP weights assign a 14% weight to China.
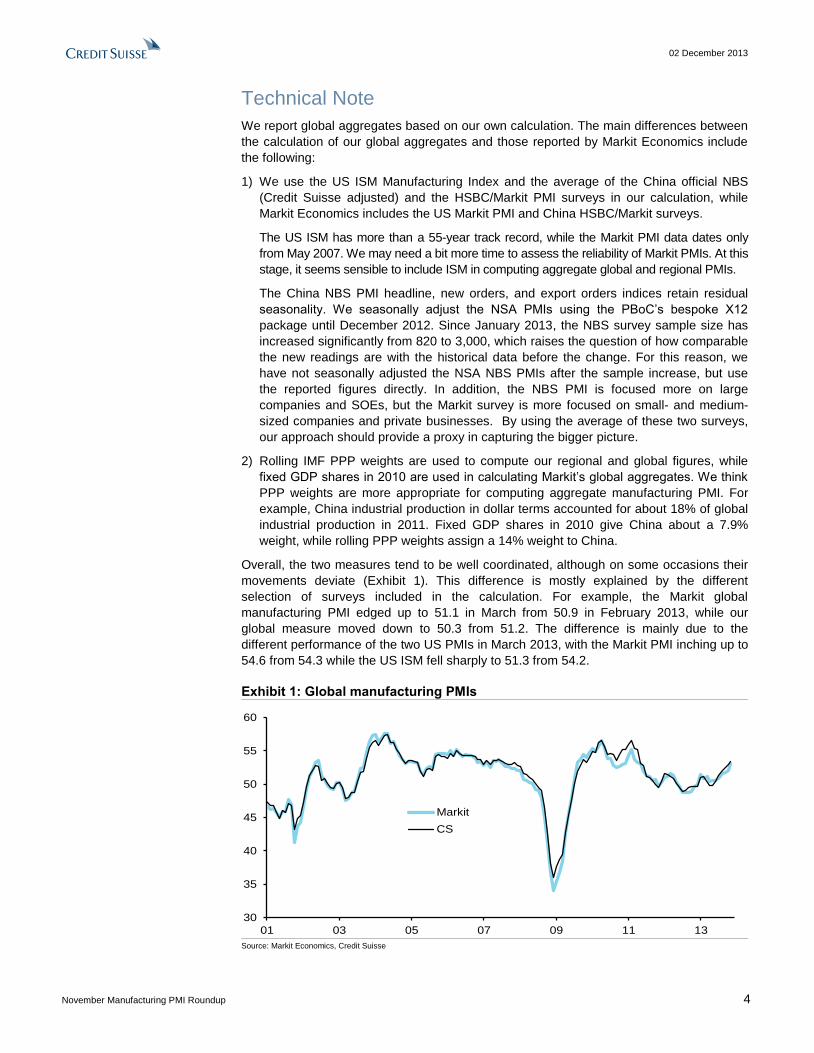
Overall, the two measures tend to be well coordinated, although on some occasions their
movements deviate (Exhibit 1). This difference is mostly explained by the different
selection of surveys included in the calculation. For example, the Markit global
manufacturing PMI edged up to 51.1 in March from 50.9 in February 2013, while our
global measure moved down to 50.3 from 51.2. The difference is mainly due to the
different performance of the two US PMIs in March 2013, with the Markit PMI inching up to
54.6 from 54.3 while the US ISM fell sharply to 51.3 from 54.2.
Exhibit 1: Global manufacturing PMIs
30
35
40
45
50
55
60
01 03 05 07 09 11 13
Markit
CS
Source: Markit Economics, Credit Suisse

02 December 2013
November Manufacturing PMI Roundup 5
Table of Contents
Technical Note 4
Global PMIs 6
DM/EM PMIs 7
Manufacturing PMIs: Developed markets 8
Manufacturing PMIs: Developed markets continued 9
Manufacturing PMIs: Emerging markets 10
Manufacturing PMIs: Emerging markets continued 11
PMI new orders: Developed markets 12
PMI new orders: Emerging markets 13
PMI new orders: Emerging markets continued 14
PMI export orders: Developed markets 15
PMI export orders: Emerging markets 16
PMI export orders: Emerging markets continued 17
PMI inventories: Developed markets 18
PMI inventories: Emerging markets 19
PMI inventories: Emerging markets continued 20
PMI input prices: Developed markets 21
PMI input prices: Emerging markets 22
PMI input prices: Emerging markets continued 23
02
De
ce
mb
er 2
01
3
Nove
mb
er M
anufa
ctu
ring P
MI R
ou
ndu
p
6
Global PMIs
Exhibit 2: Global manufacturing PMI Exhibit 3: Global PMI new orders Exhibit 4: PMI new orders vs. IP momentum
35
40
45
50
55
60
35
40
45
50
55
60
01 03 05 07 09 11 13
25
30
35
40
45
50
55
60
65
25
30
35
40
45
50
55
60
65
01 03 05 07 09 11 13
-2
0
2
4
6
8
10
12
14
0.9
1.0
1.1
1.2
1.3
10 11 12 13
Ratio of ordes over finishedgoods Inventories
Global IP with forecasts,3m/3m% ann., rhs
Exhibit 5: Global PMI export orders Exhibit 6: Global PMI input prices Exhibit 7: Global PMI stocks of fin. goods
30
35
40
45
50
55
60
30
35
40
45
50
55
60
01 03 05 07 09 11 13
30
40
50
60
70
80
30
40
50
60
70
80
01 03 05 07 09 11 13
42
44
46
48
50
52
42
44
46
48
50
52
07 08 09 10 11 12 13
Source: Markit Economics, Haver Analytics®, Credit Suisse estimates

02
De
ce
mb
er 2
01
3
Nove
mb
er M
anufa
ctu
ring P
MI R
ou
ndu
p
7
DM/EM PMIs
Exhibit 8: DM/EM Manufacturing PMIs Exhibit 9: DM/EM PMI new orders Exhibit 10: DM/EM PMI export orders
30
35
40
45
50
55
60
30
35
40
45
50
55
60
01 03 05 07 09 11 13
EM DM
25
30
35
40
45
50
55
60
65
25
30
35
40
45
50
55
60
65
01 03 05 07 09 11 13
EM DM
30
35
40
45
50
55
60
65
30
35
40
45
50
55
60
65
01 03 05 07 09 11 13
EM DM
Exhibit 11: DM/EM PMI input prices Exhibit 12: DM/EM PMI stocks of fin. goods
25
30
35
40
45
50
55
60
65
70
75
80
85
25
30
35
40
45
50
55
60
65
70
75
80
85
01 03 05 07 09 11 13
EM DM
40
42
44
46
48
50
52
54
40
42
44
46
48
50
52
54
06 07 08 09 10 11 12 13 14
EM DM
Source: Markit Economics, NBS, CLIC, Haver Analytics®, INEGI, Credit Suisse * DM includes Australia, Canada, Denmark, Euro Area, Japan, New Zealand, Switzerland, the UK, and the US. EM includes China (CS SA PMI), India, Singapore, Korea, Taiwan, Czech Republic, Hungary, Poland, Russia, South Africa, Turkey, Mexico (INEGI PMI), and Brazil. IMF PPP weights are used to compute regional aggregate figures.
02
De
ce
mb
er 2
01
3
Nove
mb
er M
anufa
ctu
ring P
MI R
ou
ndu
p
8
Manufacturing PMIs: Developed markets
Exhibit 13: US manufacturing ISM Exhibit 14: Euro area manufacturing PMI Exhibit 15: Japan manufacturing PMI
30
35
40
45
50
55
60
65
30
35
40
45
50
55
60
65
01 03 05 07 09 11 13
30
35
40
45
50
55
60
30
35
40
45
50
55
60
01 03 05 07 09 11 13
30
35
40
45
50
55
60
30
35
40
45
50
55
60
01 03 05 07 09 11 13
Exhibit 16: UK manufacturing PMI Exhibit 17:Swiss manufacturing PMI Exhibit 18: Euro Area: Core vs. Periphery
35
40
45
50
55
60
35
40
45
50
55
60
01 03 05 07 09 11 13
30
35
40
45
50
55
60
65
70
30
35
40
45
50
55
60
65
70
01 03 05 07 09 11 13
30
35
40
45
50
55
60
65
30
35
40
45
50
55
60
65
01 03 05 07 09 11 13
Core
Periphery
Source: Markit Economics, Haver Analytics®, Credit Suisse *Euro area core countries include Germany, France, Austria, and the Netherlands, while the periphery includes Italy, Spain, Ireland, and Greece. IMF PPP weights are used to compute the aggregate figures.

02
De
ce
mb
er 2
01
3
Nove
mb
er M
anufa
ctu
ring P
MI R
ou
ndu
p
9
Manufacturing PMIs: Developed markets continued Exhibit 19: Germany manufacturing PMI Exhibit 20: France manufacturing PMI Exhibit 21: Italy manufacturing PMI
30
35
40
45
50
55
60
65
30
35
40
45
50
55
60
65
01 03 05 07 09 11 13
30
35
40
45
50
55
60
30
35
40
45
50
55
60
01 03 05 07 09 11 13
30
35
40
45
50
55
60
30
35
40
45
50
55
60
01 03 05 07 09 11 13
Exhibit 22: Spain manufacturing PMI Exhibit 23: Ireland manufacturing PMI Exhibit 24: Greece manufacturing PMI
25
30
35
40
45
50
55
60
25
30
35
40
45
50
55
60
01 03 05 07 09 11 13
30
35
40
45
50
55
60
30
35
40
45
50
55
60
01 03 05 07 09 11 13
35
40
45
50
55
60
35
40
45
50
55
60
01 03 05 07 09 11 13
Source: Markit Economics, Haver Analytics®, Credit Suisse

02
De
ce
mb
er 2
01
3
Nove
mb
er M
anufa
ctu
ring P
MI R
ou
ndu
p
10
Manufacturing PMIs: Emerging markets
Exhibit 25: NJA manufacturing PMI Exhibit 26: China manufacturing PMIs Exhibit 27: India manufacturing PMI
40
45
50
55
60
40
45
50
55
60
05 06 07 08 09 10 11 12 13
35
40
45
50
55
60
35
40
45
50
55
60
05 06 07 08 09 10 11 12 13
NBS*
Markit
Average
44
46
48
50
52
54
56
58
60
62
44
46
48
50
52
54
56
58
60
62
05 06 07 08 09 10 11 12 13
Exhibit 28: South Korea manufacturing PMI Exhibit 29: EEMEA manufacturing PMI Exhibit 30: Russia manufacturing PMI
38
42
46
50
54
58
62
38
42
46
50
54
58
62
05 06 07 08 09 10 11 12 13
35
40
45
50
55
60
35
40
45
50
55
60
01 03 05 07 09 11 13
30
35
40
45
50
55
60
30
35
40
45
50
55
60
01 03 05 07 09 11 13
Source: Markit Economics, NBS, Haver Analytics®, Credit Suisse . * CS seasonally adjusted series until December 2012, reported figures January 2013 onward.
02
De
ce
mb
er 2
01
3
Nove
mb
er M
anufa
ctu
ring P
MI R
ou
ndu
p
11
Manufacturing PMIs: Emerging markets continued
Exhibit 31: Turkey manufacturing PMI Exhibit 32: Poland manufacturing PMIs Exhibit 33: South Africa manufacturing PMI
30
35
40
45
50
55
60
30
35
40
45
50
55
60
05 06 07 08 09 10 11 12 13
38
42
46
50
54
58
38
42
46
50
54
58
01 03 05 07 09 11 13
35
40
45
50
55
60
65
35
40
45
50
55
60
65
01 03 05 07 09 11 13
Exhibit 34: LATAM Exhibit 35: Brazil manufacturing PMI Exhibit 36: Mexico manufacturing PMI
40
45
50
55
40
45
50
55
05 06 07 08 09 10 11 12 13
35
40
45
50
55
60
35
40
45
50
55
60
05 06 07 08 09 10 11 12 13
40
45
50
55
60
40
45
50
55
60
05 06 07 08 09 10 11 12 13
INEGI PMI
Markit PMI
Source: Markit Economics ,Haver Analytics®, INEGI, Credit Suisse

02
De
ce
mb
er 2
01
3
Nove
mb
er M
anufa
ctu
ring P
MI R
ou
ndu
p
12
PMI new orders: Developed markets
Exhibit 37: US ISM new orders Exhibit 38: Euro area PMI new orders Exhibit 39: Japan PMI new orders
20
30
40
50
60
70
20
30
40
50
60
70
01 03 05 07 09 11 13
25
30
35
40
45
50
55
60
65
25
30
35
40
45
50
55
60
65
01 03 05 07 09 11 13
15
20
25
30
35
40
45
50
55
60
65
15
20
25
30
35
40
45
50
55
60
65
01 03 05 07 09 11 13
Exhibit 40: Germany PMI new orders Exhibit 41: UK PMI new orders
20
30
40
50
60
20
30
40
50
60
01 03 05 07 09 11 13
30
35
40
45
50
55
60
65
30
35
40
45
50
55
60
65
01 03 05 07 09 11 13
Source: Markit Economics, Haver Analytics®, Credit Suisse
02
De
ce
mb
er 2
01
3
Nove
mb
er M
anufa
ctu
ring P
MI R
ou
ndu
p
13
PMI new orders: Emerging markets
Exhibit 42: NJA PMI new orders Exhibit 43: China PMI new orders Exhibit 44: India PMI new orders
35
40
45
50
55
60
65
35
40
45
50
55
60
65
05 06 07 08 09 10 11 12 13
30
35
40
45
50
55
60
65
30
35
40
45
50
55
60
65
05 06 07 08 09 10 11 12 13
NBS*
Markit
Average
40
45
50
55
60
65
70
75
40
45
50
55
60
65
70
75
05 06 07 08 09 10 11 12 13
Exhibit 45: South Korea PMI new orders Exhibit 46: EEMEA PMI new orders Exhibit 47: Russia PMI new orders
30
35
40
45
50
55
60
65
70
30
35
40
45
50
55
60
65
70
05 06 07 08 09 10 11 12 13
30
35
40
45
50
55
60
30
35
40
45
50
55
60
01 03 05 07 09 11 13
30
35
40
45
50
55
60
30
35
40
45
50
55
60
01 03 05 07 09 11 13
Source: Markit Economics, NBS, Haver Analytics®, Credit Suisse. * CS seasonally adjusted series until December 2012, reported figures January 2013 onward.

02
De
ce
mb
er 2
01
3
Nove
mb
er M
anufa
ctu
ring P
MI R
ou
ndu
p
14
PMI new orders: Emerging markets continued
Exhibit 48: Turkey PMI new orders Exhibit 49: Poland PMI new orders Exhibit 50: South Africa PMI new orders
20
30
40
50
60
20
30
40
50
60
05 06 07 08 09 10 11 12 13
30
35
40
45
50
55
60
30
35
40
45
50
55
60
01 03 05 07 09 11 13
30
40
50
60
70
30
40
50
60
70
01 03 05 07 09 11 13
Exhibit 51: LATAM PMI new orders Exhibit 52: Brazil PMI new orders Exhibit 53: Mexico new orders
35
40
45
50
55
60
35
40
45
50
55
60
05 06 07 08 09 10 11 12 13
30
35
40
45
50
55
60
30
35
40
45
50
55
60
05 06 07 08 09 10 11 12 13
42
46
50
54
58
62
42
46
50
54
58
62
05 06 07 08 09 10 11 12 13
INEGI PMI
Markit PMI
Source: Markit Economics, NBS, CLIC, INEGI, Haver Analytics®, Credit Suisse

02
De
ce
mb
er 2
01
3
Nove
mb
er M
anufa
ctu
ring P
MI R
ou
ndu
p
15
PMI export orders: Developed markets
Exhibit 54: US ISM export orders Exhibit 55: Euro area PMI export orders Exhibit 56: Japan PMI export orders
35
40
45
50
55
60
65
35
40
45
50
55
60
65
01 03 05 07 09 11 13
30
35
40
45
50
55
60
30
35
40
45
50
55
60
01 03 05 07 09 11 13
20
30
40
50
60
20
30
40
50
60
01 03 05 07 09 11 13
Exhibit 57: Germany PMI export orders Exhibit 58: UK PMI export orders
20
30
40
50
60
20
30
40
50
60
01 03 05 07 09 11 13
35
40
45
50
55
60
35
40
45
50
55
60
01 03 05 07 09 11 13
Source: Markit Economics, Haver Analytics®, Credit Suisse

02
De
ce
mb
er 2
01
3
Nove
mb
er M
anufa
ctu
ring P
MI R
ou
ndu
p
16
PMI export orders: Emerging markets
Exhibit 59: NJA PMI export orders Exhibit 60: China PMI export orders Exhibit 61: India PMI export orders
35
40
45
50
55
60
35
40
45
50
55
60
05 06 07 08 09 10 11 12 13
25
30
35
40
45
50
55
60
25
30
35
40
45
50
55
60
05 06 07 08 09 10 11 12 13
NBS*
Markit
Average
40
45
50
55
60
40
45
50
55
60
05 06 07 08 09 10 11 12 13
Exhibit 62: South Korea PMI export orders Exhibit 63: EEMEA PMI export orders Exhibit 64: Russia PMI export orders
40
45
50
55
60
40
45
50
55
60
05 06 07 08 09 10 11 12 13
30
35
40
45
50
55
30
35
40
45
50
55
01 03 05 07 09 11 13
25
30
35
40
45
50
55
25
30
35
40
45
50
55
01 03 05 07 09 11 13

02
De
ce
mb
er 2
01
3
Nove
mb
er M
anufa
ctu
ring P
MI R
ou
ndu
p
17
PMI export orders: Emerging markets continued
Exhibit 65: Turkey PMI export orders Exhibit 66: Poland PMI export orders Exhibit 67: Brazil PMI export orders
30
35
40
45
50
55
60
30
35
40
45
50
55
60
05 06 07 08 09 10 11 12 13
30
35
40
45
50
55
60
30
35
40
45
50
55
60
01 03 05 07 09 11 13
30
35
40
45
50
55
30
35
40
45
50
55
05 06 07 08 09 10 11 12 13
.Source: Markit Economics, NBS, CLIC, Haver Analytics®, Credit Suisse

02
De
ce
mb
er 2
01
3
Nove
mb
er M
anufa
ctu
ring P
MI R
ou
ndu
p
18
PMI inventories: Developed markets
Exhibit 68: US Markit stocks of finished goods Exhibit 69: Euro area PMI stocks of fin. goods Exhibit 70: Japan PMI stocks of fin. goods
30
35
40
45
50
55
30
35
40
45
50
55
07 08 09 10 11 12 13
40
42
44
46
48
50
52
40
42
44
46
48
50
52
01 03 05 07 09 11 13
44
46
48
50
52
54
56
44
46
48
50
52
54
56
01 03 05 07 09 11 13
Exhibit 71: Germany PMI stocks of fin. goods Exhibit 72: UK PMI stocks of fin. goods Exhibit 73: Swiss PMI stocks of fin. goods
36
38
40
42
44
46
48
50
52
54
36
38
40
42
44
46
48
50
52
54
01 03 05 07 09 11 13
38
40
42
44
46
48
50
52
54
38
40
42
44
46
48
50
52
54
01 03 05 07 09 11 13
38
42
46
50
54
58
38
42
46
50
54
58
01 03 05 07 09 11 13
Source: Markit Economics, Haver Analytics®, Credit Suisse
02
De
ce
mb
er 2
01
3
Nove
mb
er M
anufa
ctu
ring P
MI R
ou
ndu
p
19
PMI inventories: Emerging markets
Exhibit 74: NJA PMI stocks of fin. goods Exhibit 75: China PMI stocks of fin. goods Exhibit 76: India PMI stocks of fin. goods
44
46
48
50
52
44
46
48
50
52
05 06 07 08 09 10 11 12 13
42
44
46
48
50
52
54
42
44
46
48
50
52
54
05 06 07 08 09 10 11 12 13
NBS PMI
Markit PMI
44
46
48
50
52
54
44
46
48
50
52
54
05 06 07 08 09 10 11 12 13
Exhibit 77: South Korea PMI stk. of fin. goods Exhibit 78: EEMEA stk. fin. goods Exhibit 79: Russia PMI stocks of fin. goods
38
42
46
50
54
58
38
42
46
50
54
58
05 06 07 08 09 10 11 12 13
42
44
46
48
50
52
42
44
46
48
50
52
01 03 05 07 09 11 13
42
44
46
48
50
52
54
42
44
46
48
50
52
54
01 03 05 07 09 11 13
.Source: Markit Economics, NBS, CLIC, Haver Analytics®, Credit Suisse
02
De
ce
mb
er 2
01
3
Nove
mb
er M
anufa
ctu
ring P
MI R
ou
ndu
p
20
PMI inventories: Emerging markets continued
Exhibit 80: Turkey PMI stocks of fin. goods Exhibit 81: Poland PMI stocks of fin. goods Exhibit 82: South Africa PMI stk. of purchases
40
42
44
46
48
50
52
54
40
42
44
46
48
50
52
54
05 06 07 08 09 10 11 12 13
40
42
44
46
48
50
52
40
42
44
46
48
50
52
01 03 05 07 09 11 13
30
40
50
60
70
30
40
50
60
70
01 03 05 07 09 11 13
Exhibit 83: LATAM PMI stk. of fin. goods Exhibit 84: Brazil stocks of fin. goods Exhibit 85: Mexico PMI stocks of fin. goods
46
48
50
52
46
48
50
52
05 06 07 08 09 10 11 12 13
44
46
48
50
52
44
46
48
50
52
05 06 07 08 09 10 11 12 13
40
45
50
55
60
44
46
48
50
52
54
56
05 06 07 08 09 10 11 12 13
INEG PMI
Markit PMI
Source: Markit Economics, NBS, CLIC, INEGI, Haver Analytics®, Credit Suisse

02
De
ce
mb
er 2
01
3
Nove
mb
er M
anufa
ctu
ring P
MI R
ou
ndu
p
21
PMI input prices: Developed markets
Exhibit 86: US ISM input prices Exhibit 87: Euro area PMI input prices Exhibit 88: Japan PMI input prices
30
35
40
45
50
55
60
65
10
20
30
40
50
60
70
80
90
01 03 05 07 09 11 13
20
30
40
50
60
70
80
20
30
40
50
60
70
80
01 03 05 07 09 11 13
30
35
40
45
50
55
60
65
70
75
80
30
35
40
45
50
55
60
65
70
75
80
01 03 05 07 09 11 13
Exhibit 89: Germany PMI input prices Exhibit 90: UK PMI input prices Exhibit 91: Swiss PMI input prices
20
30
40
50
60
70
80
90
20
30
40
50
60
70
80
90
01 03 05 07 09 11 13
30
40
50
60
70
80
30
40
50
60
70
80
01 03 05 07 09 11 13
40
42
44
46
48
50
52
54
56
58
20
30
40
50
60
70
80
01 03 05 07 09 11 13
Source: Markit Economics, Haver Analytics®, Credit Suisse

02
De
ce
mb
er 2
01
3
Nove
mb
er M
anufa
ctu
ring P
MI R
ou
ndu
p
22
PMI input prices: Emerging markets
Exhibit 92: NJA PMI input prices Exhibit 93: China PMI input prices Exhibit 94: India PMI input prices
30
40
50
60
70
80
30
40
50
60
70
80
05 06 07 08 09 10 11 12 13
10
20
30
40
50
60
70
80
90
10
20
30
40
50
60
70
80
90
05 06 07 08 09 10 11 12 13
NBS PMI
Markit PMI
40
45
50
55
60
65
70
40
45
50
55
60
65
70
05 06 07 08 09 10 11 12 13
Exhibit 95: South Korea PMI input prices Exhibit 96: EEMEA PMI input prices Exhibit 97: Russia PMI input prices
40
45
50
55
60
65
70
40
45
50
55
60
65
70
05 06 07 08 09 10 11 12 13
40
45
50
55
60
65
70
75
80
40
45
50
55
60
65
70
75
80
01 03 05 07 09 11 13
40
45
50
55
60
65
70
75
80
40
45
50
55
60
65
70
75
80
01 03 05 07 09 11 13
Source: Markit Economics, NBS, CLIC, Haver Analytics®, Credit Suisse

02
De
ce
mb
er 2
01
3
Nove
mb
er M
anufa
ctu
ring P
MI R
ou
ndu
p
23
PMI input prices: Emerging markets continued
Exhibit 98: Turkey PMI input prices Exhibit 99: Poland PMI input prices Exhibit 100: Brazil PMI input prices
40
50
60
70
80
90
40
50
60
70
80
90
05 06 07 08 09 10 11 12 13
40
45
50
55
60
65
70
75
80
40
45
50
55
60
65
70
75
80
01 03 05 07 09 11 13
40
45
50
55
60
65
70
75
40
45
50
55
60
65
70
75
05 06 07 08 09 10 11 12 13
Source: Thomson Reuters DataStream, Haver Analytics®, Credit Suisse

European Economics team: Coverage of regions, institutions, themes and countries
HEAD OF EUROPEAN ECONOMICS Neville Hill
REGION THEME COUNTRY
Euro area Cyclical outlook Austria Greece Spain
[email protected] [email protected] [email protected] [email protected] [email protected]
+44 20 7888 1334 +44 20 7888 1334 +44 20 7888 1383 +44 20 7888 6827 +44 20 7888 6827
[email protected] [email protected] [email protected]
Northern euro area +44 20 7883 4192 Belgium +44 20 7888 7536 +44 20 7888 1383
[email protected] [email protected]
+44 20 7888 1383 Inflation +44 20 7883 3738 Ireland Sweden
[email protected] [email protected] [email protected]
Southern euro area +44 20 7883 4192 Cyprus +44 20 7883 7360 +44 20 7883 4192
[email protected] [email protected] [email protected] [email protected]
+44 20 7888 6827 +44 20 7888 1334 +44 20 7888 7536 +44 20 7888 1334 Switzerland
Scandinavia Fiscal policy Denmark Italy +44 20 7883 4192
[email protected] [email protected] [email protected] [email protected]
+44 20 7883 4192 +44 20 7888 6827 +44 20 7883 4192 +44 20 7883 4192 UK
[email protected] [email protected]
INSTITUTION Monetary policy Finland +44 20 7888 6827 +44 20 7888 1334
[email protected] [email protected] [email protected]
European Central Bank +44 20 7888 1383 +44 20 7883 4192 Netherlands +44 20 7883 7360
[email protected] [email protected] [email protected]
+44 20 7888 1383 +44 20 7888 1334 France +44 20 7888 1383
European Commission/EFSF/ESM "The periphery" +44 20 7888 6827 Norway
[email protected] [email protected] [email protected] [email protected]
+44 20 7888 6827 +44 20 7883 3738 +33 1 7039 0103 +44 20 7883 4192
Bank of England +44 20 7888 6827 Germany Portugal
[email protected] [email protected] [email protected]
+44 20 7888 1334 +44 20 7888 1383 +44 20 7883 3738

GLOBAL FIXED INCOME AND ECONOMIC RESEARCH
Dr. Neal Soss, Managing Director Chief Economist and Global Head of Economic Research
+1 212 325 3335 [email protected]
Eric Miller, Managing Director Global Head of Fixed Income and Economic Research
+1 212 538 6480 [email protected]
US ECONOMICS
Dr. Neal Soss, Managing Director
Head of US Economics
+1 212 325 3335
Jay Feldman, Director
+1 212 325 7634
Dana Saporta, Director
+1 212 538 3163
dana.saporta@credit-
suisse.com
Isaac Lebwohl, Associate
+1 212 538 1906
isaac.lebwohl@credit-
suisse.com
LATIN AMERICA ECONOMICS AND STRATEGY
Alonso Cervera, Managing Director
Head of Non-Brazil Latam Economics
+52 55 5283 3845
Mexico, Chile
Casey Reckman, Vice President
+1 212 325 5570
Argentina, Venezuela
Daniel Chodos, Vice President
+1 212 325 7708
Latam Strategy
Juan Lorenzo Maldonado, Associate
+1 212 325 4245
Colombia, Peru
Di Fu, Analyst
+1 212 538 4125
Nilson Teixeira, Managing Director
Head of Brazil Economics
+55 11 3701 6288
Daniel Lavarda, Vice President
+55 11 3701 6352
Brazil
Iana Ferrao, Associate
+55 11 3701 6345
Brazil
Leonardo Fonseca, Associate
+55 11 3701 6348
Brazil
Paulo Coutinho, Associate
+55 11 3701-6353
Brazil
EURO AREA AND UK ECONOMICS
Neville Hill, Managing Director
Head of European Economics
+44 20 7888 1334
Christel Aranda-Hassel, Director
+44 20 7888 1383
Giovanni Zanni, Director
+44 20 7888 6827
Violante di Canossa, Vice President
+44 20 7883 4192
Axel Lang, Associate
+44 20 7883 3738
Steven Bryce, Analyst
+44 20 7883 7360
Mirco Bulega, Analyst
+44 20 7883 9315
EASTERN EUROPE, MIDDLE EAST & AFRICA ECONOMICS AND STRATEGY
Berna Bayazitoglu, Managing Director
Head of EEMEA Economics
+44 20 7883 3431
Turkey
Sergei Voloboev, Director
+44 20 7888 3694
Russia, Ukraine, Kazakhstan
Carlos Teixeira, Director
+27 11 012 8054
South Africa
Gergely Hudecz, Vice President
+33 1 7039 0103
Czech Republic, Hungary, Poland
Alexey Pogorelov, Vice President
+7 495 967 8772
Russia, Ukraine, Kazakhstan
Shahzad Hasan, Vice President
+44 20 7883 1184
EEMEA Strategy
Natig Mustafayev, Associate
+44 20 7888 1065
EM and EEMEA cross-country analysis
Nimrod Mevorach, Associate
+44 20 7888 1257
EEMEA Strategy, Israel
JAPAN ECONOMICS AND STRATEGY
Hiromichi Shirakawa, Managing Director
+81 3 4550 7117
Takashi Shiono, Associate
+81 3 4550 7189
Tomohiro Miyasaka, Director
+81 3 4550 7171
NON-JAPAN ASIA ECONOMICS
Dong Tao. Managing Director
Head of NJA Economics
+852 2101 7469
China
Robert Prior-Wandesforde, Director
+65 6212 3707
Regional, India, Indonesia, Australia
Christiaan Tuntono, Vice President
+852 2101 7409
Hong Kong, Korea, Taiwan
Santitarn Sathirathai, Vice President
+65 6212 5675
Regional, Malaysia, Thailand
Michael Wan, Analyst
+65 6212 3418
Singapore, Philippines
Weishen Deng, Analyst
+852 2101 7162
China

..
Disclosure Appendix
Analyst Certification The analysts identified in this report each certify, with respect to the companies or securities that the individual analyzes, that (1) the views expressed in this report accurately reflect his or her personal views about all of the subject companies and securities and (2) no part of his or her compensation was, is or will be directly or indirectly related to the specific recommendations or views expressed in this report. References in this report to Credit Suisse include all of the subsidiaries and affiliates of Credit Suisse operating under its investment banking division. For more information on our structure, please use the following link: https://www.credit-suisse.com/who_we_are/en/This report may contain material that is not directed to, or intended for distribution to or use by, any person or entity who is a citizen or resident of or located in any locality, state, country or other jurisdiction where such distribution, publication, availability or use would be contrary to law or regulation or which would subject Credit Suisse AG or its affiliates ("CS") to any registration or licensing requirement within such jurisdiction. All material presented in this report, unless specifically indicated otherwise, is under copyright to CS. None of the material, nor its content, nor any copy of it, may be altered in any way, transmitted to, copied or distributed to any other party, without the prior express written permission of CS. All trademarks, service marks and logos used in this report are trademarks or service marks or registered trademarks or service marks of CS or its affiliates. The information, tools and material presented in this report are provided to you for information purposes only and are not to be used or considered as an offer or the solicitation of an offer to sell or to buy or subscribe for securities or other financial instruments. CS may not have taken any steps to ensure that the securities referred to in this report are suitable for any particular investor. CS will not treat recipients of this report as its customers by virtue of their receiving this report. The investments and services contained or referred to in this report may not be suitable for you and it is recommended that you consult an independent investment advisor if you are in doubt about such investments or investment services. Nothing in this report constitutes investment, legal, accounting or tax advice, or a representation that any investment or strategy is suitable or appropriate to your individual circumstances, or otherwise constitutes a personal recommendation to you. CS does not advise on the tax consequences of investments and you are advised to contact an independent tax adviser. Please note in particular that the bases and levels of taxation may change. Information and opinions presented in this report have been obtained or derived from sources believed by CS to be reliable, but CS makes no representation as to their accuracy or completeness. CS accepts no liability for loss arising from the use of the material presented in this report, except that this exclusion of liability does not apply to the extent that such liability arises under specific statutes or regulations applicable to CS. This report is not to be relied upon in substitution for the exercise of independent judgment. CS may have issued, and may in the future issue, other communications that are inconsistent with, and reach different conclusions from, the information presented in this report. Those communications reflect the different assumptions, views and analytical methods of the analysts who prepared them and CS is under no obligation to ensure that such other communications are brought to the attention of any recipient of this report. CS may, to the extent permitted by law, participate or invest in financing transactions with the issuer(s) of the securities referred to in this report, perform services for or solicit business from such issuers, and/or have a position or holding, or other material interest, or effect transactions, in such securities or options thereon, or other investments related thereto. In addition, it may make markets in the securities mentioned in the material presented in this report. CS may have, within the last three years, served as manager or co-manager of a public offering of securities for, or currently may make a primary market in issues of, any or all of the entities mentioned in this report or may be providing, or have provided within the previous 12 months, significant advice or investment services in relation to the investment concerned or a related investment. Additional information is, subject to duties of confidentiality, available on request. Some investments referred to in this report will be offered solely by a single entity and in the case of some investments solely by CS, or an associate of CS or CS may be the only market maker in such investments. Past performance should not be taken as an indication or guarantee of future performance, and no representation or warranty, express or implied, is made regarding future performance. Information, opinions and estimates contained in this report reflect a judgment at its original date of publication by CS and are subject to change without notice. The price, value of and income from any of the securities or financial instruments mentioned in this report can fall as well as rise. The value of securities and financial instruments is subject to exchange rate fluctuation that may have a positive or adverse effect on the price or income of such securities or financial instruments. Investors in securities such as ADR's, the values of which are influenced by currency volatility, effectively assume this risk. Structured securities are complex instruments, typically involve a high degree of risk and are intended for sale only to sophisticated investors who are capable of understanding and assuming the risks involved. The market value of any structured security may be affected by changes in economic, financial and political factors (including, but not limited to, spot and forward interest and exchange rates), time to maturity, market conditions and volatility, and the credit quality of any issuer or reference issuer. Any investor interested in purchasing a structured product should conduct their own investigation and analysis of the product and consult with their own professional advisers as to the risks involved in making such a purchase. Some investments discussed in this report may have a high level of volatility. High volatility investments may experience sudden and large falls in their value causing losses when that investment is realised. Those losses may equal your original investment. Indeed, in the case of some investments the potential losses may exceed the amount of initial investment and, in such circumstances, you may be required to pay more money to support those losses. Income yields from investments may fluctuate and, in consequence, initial capital paid to make the investment may be used as part of that income yield. Some investments may not be readily realisable and it may be difficult to sell or realise those investments, similarly it may prove difficult for you to obtain reliable information about the value, or risks, to which such an investment is exposed. This report may provide the addresses of, or contain hyperlinks to, websites. Except to the extent to which the report refers to website material of CS, CS has not reviewed any such site and takes no responsibility for the content contained therein. Such address or hyperlink (including addresses or hyperlinks to CS's own website material) is provided solely for your convenience and information and the content of any such website does not in any way form part of this document. Accessing such website or following such link through this report or CS's website shall be at your own risk. This report is issued and distributed in Europe (except Switzerland) by Credit Suisse Securities (Europe) Limited, One Cabot Square, London E14 4QJ, England, which is authorised by the Prudential Regulation Authority ("PRA") and regulated by the Financial Conduct Authority ("FCA") and the PRA. This report is being distributed in Germany by Credit Suisse Securities (Europe) Limited Niederlassung Frankfurt am Main regulated by the Bundesanstalt fuer Finanzdienstleistungsaufsicht ("BaFin"). This report is being distributed in the United States and Canada by Credit Suisse Securities (USA) LLC; in Switzerland by Credit Suisse AG; in Brazil by Banco de Investimentos Credit Suisse (Brasil) S.A or its affiliates; in Mexico by Banco Credit Suisse (México), S.A. (transactions related to the securities mentioned in this report will only be effected in compliance with applicable regulation); in Japan by Credit Suisse Securities (Japan) Limited, Financial Instruments Firm, Director-General of Kanto Local Finance Bureau (Kinsho) No. 66, a member of Japan Securities Dealers Association, The Financial Futures Association of Japan, Japan Investment Advisers Association, Type II Financial Instruments Firms Association; elsewhere in Asia/ Pacific by whichever of the following is the appropriately authorised entity in the relevant jurisdiction: Credit Suisse (Hong Kong) Limited, Credit Suisse Equities (Australia) Limited, Credit Suisse Securities (Thailand) Limited, having registered address at 990 Abdulrahim Place, 27 Floor, Unit 2701, Rama IV Road, Silom, Bangrak, Bangkok 10500, Thailand, Tel. +66 2614 6000, Credit Suisse Securities (Malaysia) Sdn Bhd, Credit Suisse AG, Singapore Branch, Credit Suisse Securities (India) Private Limited regulated by the Securities and Exchange Board of India (registration Nos. INB230970637; INF230970637; INB010970631; INF010970631), having registered address at 9th Floor, Ceejay House, Dr.A.B. Road, Worli, Mumbai - 18, India, T- +91-22 6777 3777, Credit Suisse Securities (Europe) Limited, Seoul Branch, Credit Suisse AG, Taipei Securities Branch, PT Credit Suisse Securities Indonesia, Credit Suisse Securities (Philippines ) Inc., and elsewhere in the world by the relevant authorised affiliate of the above. Research on Taiwanese securities produced by Credit Suisse AG, Taipei Securities Branch has been prepared by a registered Senior Business Person. Research provided to residents of Malaysia is authorised by the Head of Research for Credit Suisse Securities (Malaysia) Sdn Bhd, to whom they should direct any queries on +603 2723 2020. This report has been prepared and issued for distribution in Singapore to institutional investors, accredited investors and expert investors (each as defined under the Financial Advisers Regulations) only, and is also distributed by Credit Suisse AG, Singapore branch to overseas investors (as defined under the Financial Advisers Regulations). By virtue of your status as an institutional investor, accredited investor, expert investor or overseas investor, Credit Suisse AG, Singapore branch is exempted from complying with certain compliance requirements under the Financial Advisers Act, Chapter 110 of Singapore (the "FAA"), the Financial Advisers Regulations and the relevant Notices and Guidelines issued thereunder, in respect of any financial advisory service which Credit Suisse AG, Singapore branch may provide to you. This research may not conform to Canadian disclosure requirements. In jurisdictions where CS is not already registered or licensed to trade in securities, transactions will only be effected in accordance with applicable securities legislation, which will vary from jurisdiction to jurisdiction and may require that the trade be made in accordance with applicable exemptions from registration or licensing requirements. Non-U.S. customers wishing to effect a transaction should contact a CS entity in their local jurisdiction unless governing law permits otherwise. U.S. customers wishing to effect a transaction should do so only by contacting a representative at Credit Suisse Securities (USA) LLC in the U.S. Please note that this research was originally prepared and issued by CS for distribution to their market professional and institutional investor customers. Recipients who are not market professional or institutional investor customers of CS should seek the advice of their independent financial advisor prior to taking any investment decision based on this report or for any necessary explanation of its contents. This research may relate to investments or services of a person outside of the UK or to other matters which are not authorised by the PRA and regulated by the FCA and the PRA or in respect of which the protections of the PRA and FCA for private customers and/or the UK compensation scheme may not be available, and further details as to where this may be the case are available upon request in respect of this report. CS may provide various services to US municipal entities or obligated persons ("municipalities"), including suggesting individual transactions or trades and entering into such transactions. Any services CS provides to municipalities are not viewed as "advice" within the meaning of Section 975 of the Dodd-Frank Wall Street Reform and Consumer Protection Act. CS is providing any such services and related information solely on an arm's length basis and not as an advisor or fiduciary to the municipality. In connection with the provision of the any such services, there is no agreement, direct or indirect, between any municipality (including the officials, management, employees or agents thereof) and CS for CS to provide advice to the municipality. Municipalities should consult with their financial, accounting and legal advisors regarding any such services provided by CS. In addition, CS is not acting for direct or indirect compensation to solicit the municipality on behalf of an unaffiliated broker, dealer, municipal securities dealer, municipal advisor, or investment adviser for the purpose of obtaining or retaining an engagement by the municipality for or in connection with Municipal Financial Products, the issuance of municipal securities, or of an investment adviser to provide investment advisory services to or on behalf of the municipality. If this report is being distributed by a financial institution other than Credit Suisse AG, or its affiliates, that financial institution is solely responsible for distribution. Clients of that institution should contact that institution to effect a transaction in the securities mentioned in this report or require further information. This report does not constitute investment advice by Credit Suisse to the clients of the distributing financial institution, and neither Credit Suisse AG, its affiliates, and their respective officers, directors and employees accept any liability whatsoever for any direct or consequential loss arising from their use of this report or its content. Principal is not guaranteed. Commission is the commission rate or the amount agreed with a customer when setting up an account or at any time after that. Copyright © 2013 CREDIT SUISSE AG and/or its affiliates. All rights reserved.
Investment principal on bonds can be eroded depending on sale price or market price. In addition, there are bonds on which investment principal can be eroded due to changes in redemption amounts. Care is required when investing in such instruments. When you purchase non-listed Japanese fixed income securities (Japanese government bonds, Japanese municipal bonds, Japanese government guaranteed bonds, Japanese corporate bonds) from CS as a seller, you will be requested to pay the purchase price only.


![Rebound of us_supplier_industry_final[1]](https://img.pdfslide.net/doc/110x75/5410260d7bef0a3e088b8281/rebound-of-ussupplierindustryfinal1.jpg)