Embed Size (px)
Citation preview
CITY OF HARTFORD NR 217 WATERSHED-BASED SOLUTION FEASIBILITY
Wisconsin Wastewater Operators’ Association 47th Annual MeetingOctober 22nd to 25th 2013
Dave Arnott – Ruekert & Mielke, Inc.
Paul Sebo – Washington County Land and Water Conservation Division
October 24, 2013
TOPICS COVERED1. Background2. Mass Balance3. Adaptive Mgt. & Nutrient Trading4. Adaptive Management Eligibility5. Watershed-Based Solutions6. Unit Reductions & Extrapolation7. Unit Cost Comparison 8. Watershed Disadvantages9. Conservation and WI Runoff Rule10. Federal & State Grant Programs11. County Grant Programs12. Conclusions and Next Steps
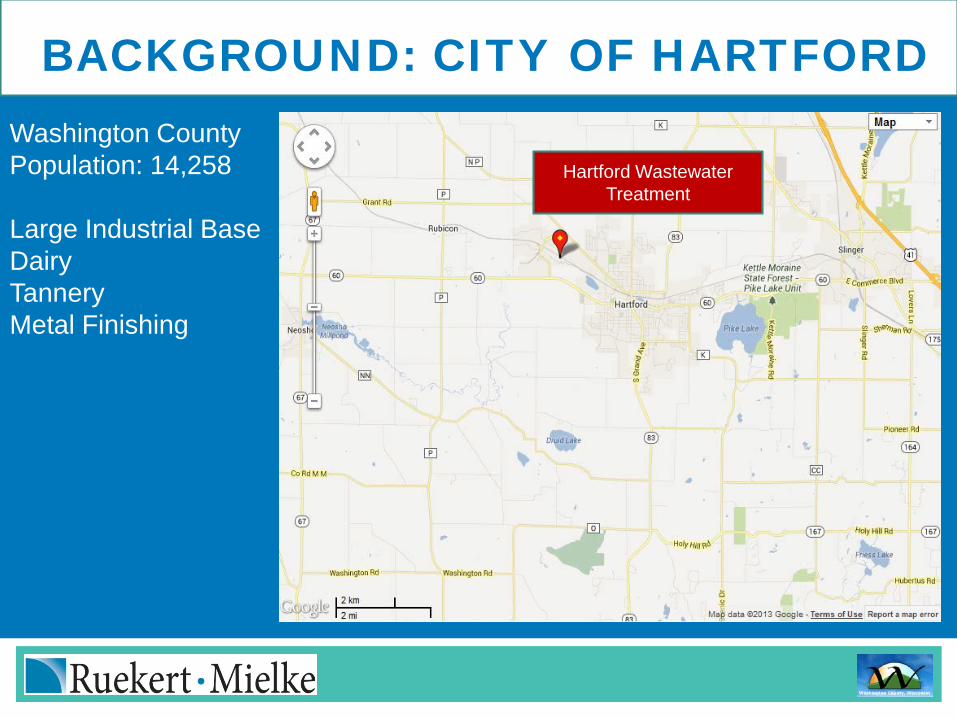
BACKGROUND: CITY OF HARTFORDWashington CountyPopulation: 14,258
Large Industrial BaseDairyTanneryMetal Finishing
Hartford Wastewater Treatment
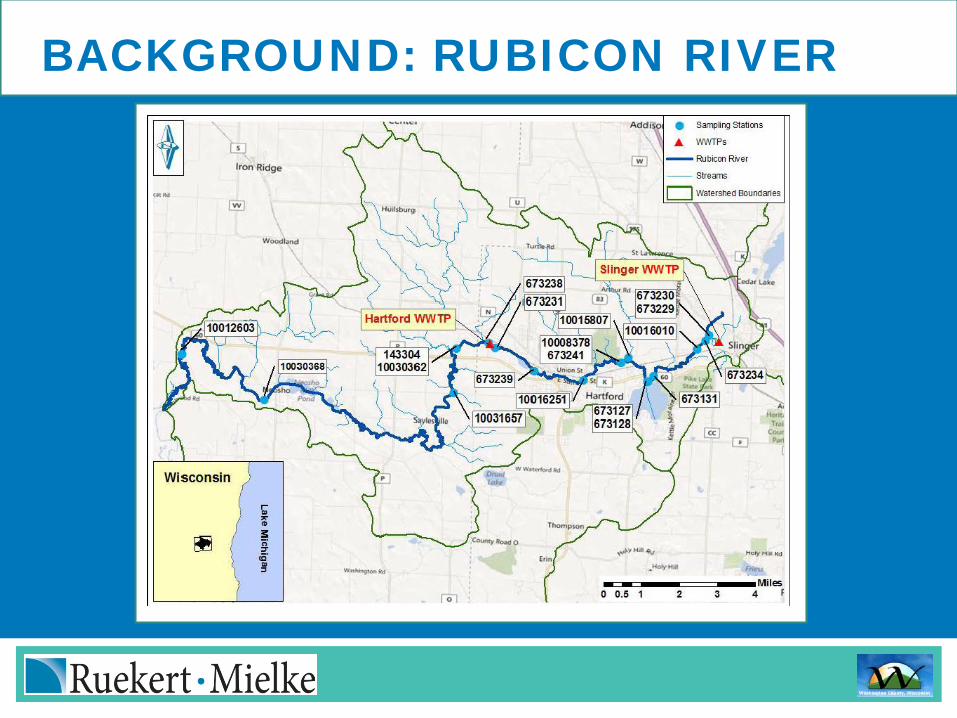
BACKGROUND: RUBICON RIVER
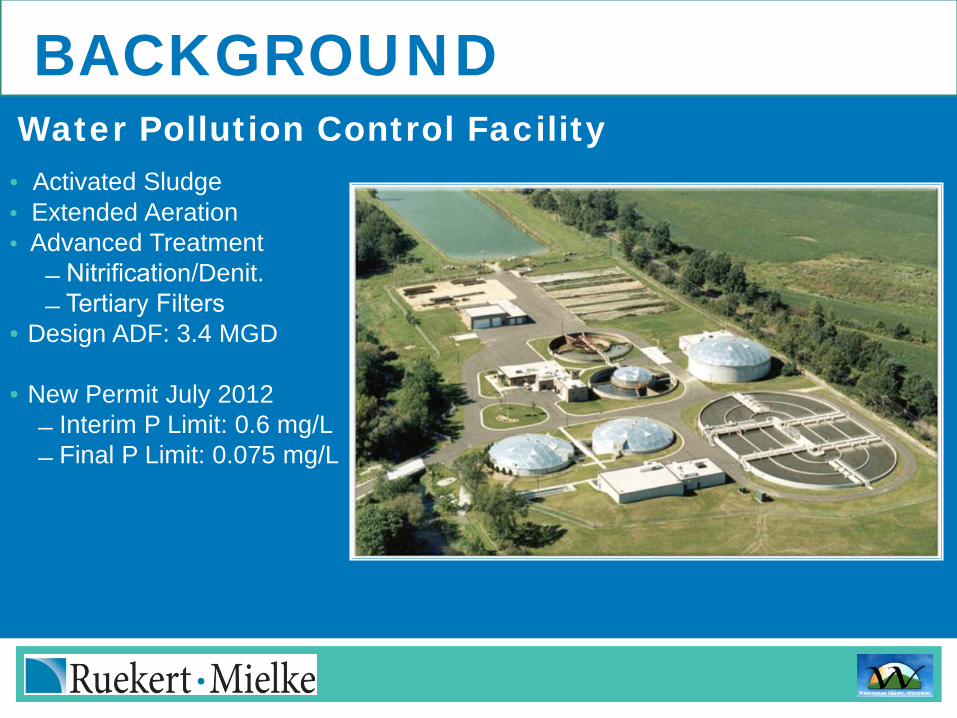
BACKGROUNDWater Pollution Control Facility
• Activated Sludge• Extended Aeration• Advanced Treatment
Nitrification/Denit. Tertiary Filters
• Design ADF: 3.4 MGD
• New Permit July 2012 Interim P Limit: 0.6 mg/L Final P Limit: 0.075 mg/L
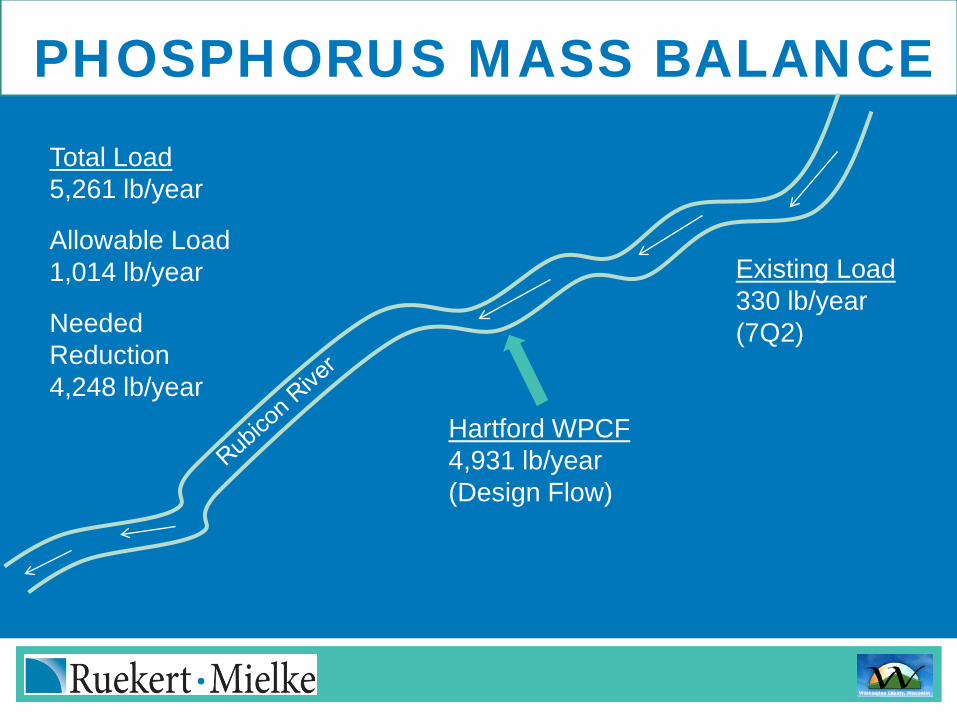
PHOSPHORUS MASS BALANCE
Existing Load330 lb/year(7Q2)
Total Load5,261 lb/year
Allowable Load1,014 lb/year
Needed Reduction4,248 lb/year
Hartford WPCF4,931 lb/year(Design Flow)
ADAPTIVE MGT & NUTRIENT TRADINGAdaptive Mgt.Work to Reduce Runoff in Watershed
Nutrient TradingBuy/Sell Credits
ADAPTIVE MANAGEMENT ELIGIBILITY
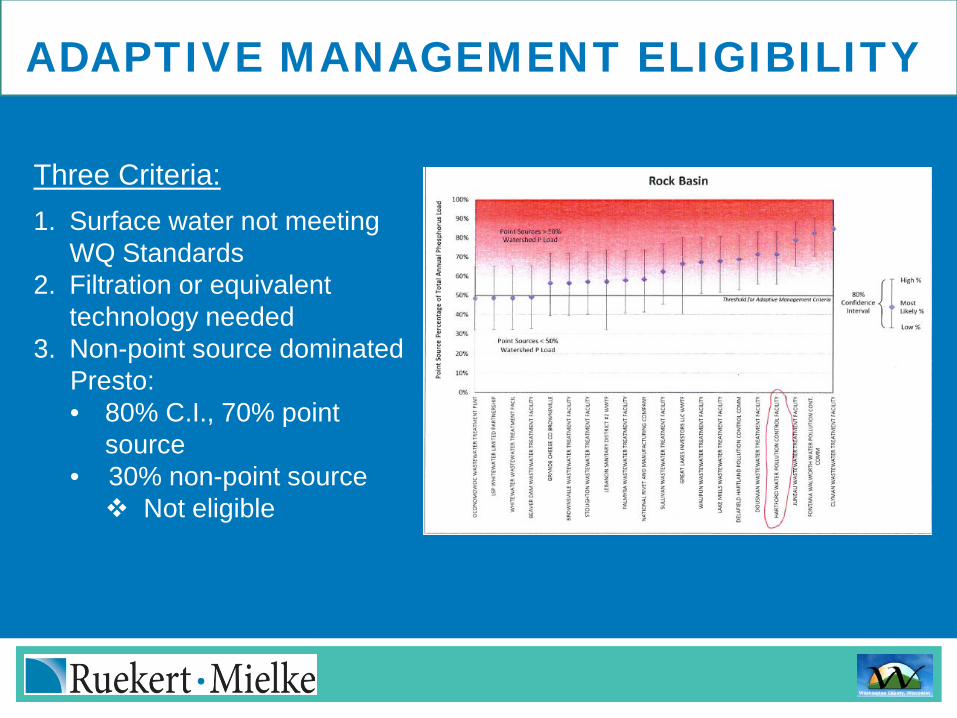
Three Criteria:1. Surface water not meeting
WQ Standards2. Filtration or equivalent
technology needed3. Non-point source dominated
Presto:• 80% C.I., 70% point
source• 30% non-point source Not eligible
ADAPTIVE MANAGEMENT ELIGIBILITY
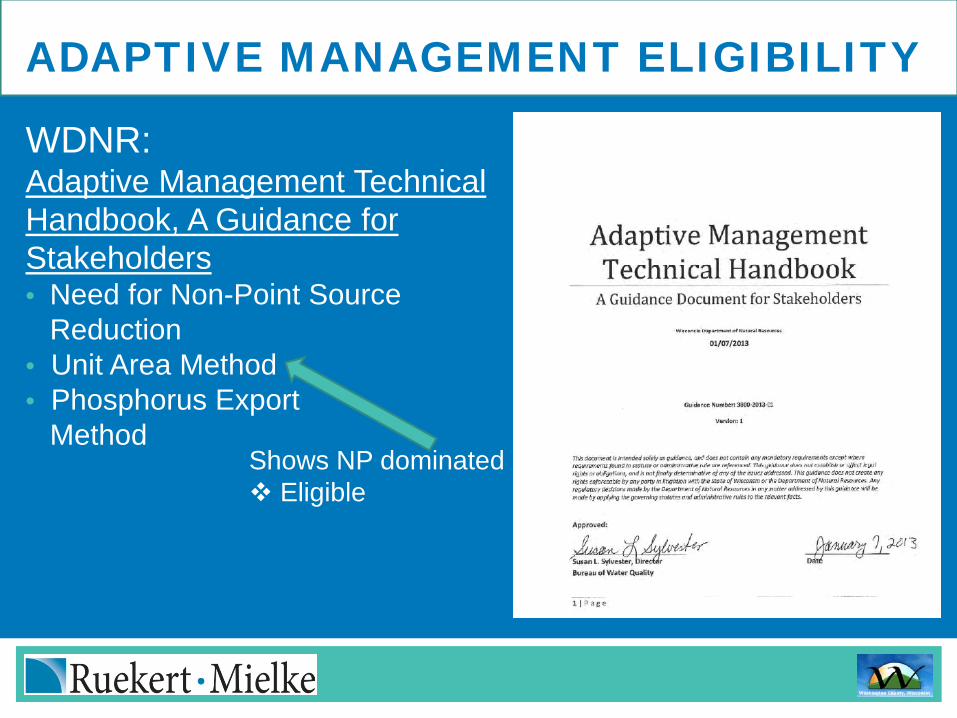
WDNR: Adaptive Management Technical Handbook, A Guidance for Stakeholders• Need for Non-Point Source
Reduction• Unit Area Method• Phosphorus Export
MethodShows NP dominated Eligible
ADAPTIVE MANAGEMENT VS TRADING
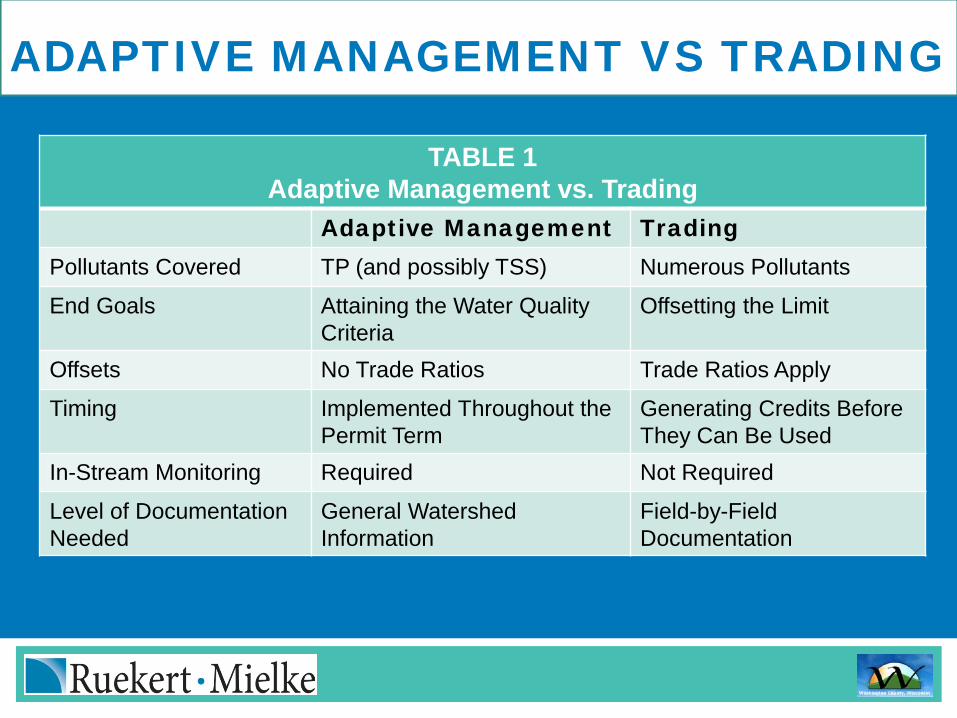
TABLE 1Adaptive Management vs. Trading
Adaptive Management TradingPollutants Covered TP (and possibly TSS) Numerous Pollutants
End Goals Attaining the Water Quality Criteria
Offsetting the Limit
Offsets No Trade Ratios Trade Ratios Apply
Timing Implemented Throughout the Permit Term
Generating Credits Before They Can Be Used
In-Stream Monitoring Required Not Required
Level of Documentation Needed
General Watershed Information
Field-by-FieldDocumentation
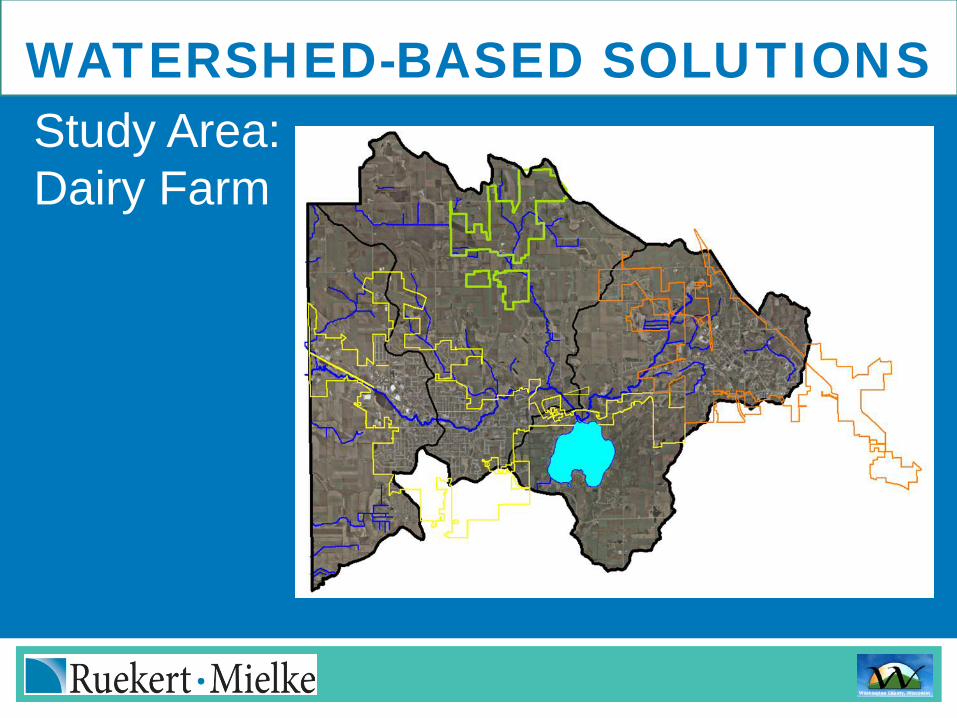
WATERSHED-BASED SOLUTIONSStudy Area:Dairy Farm
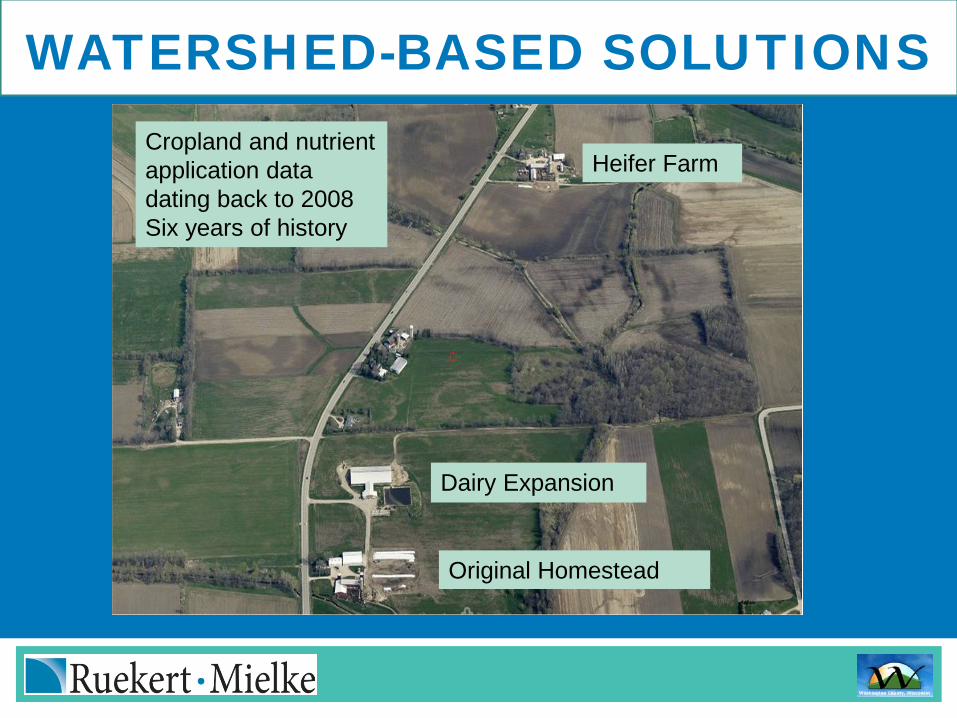
WATERSHED-BASED SOLUTIONSCropland and nutrientapplication datadating back to 2008 Six years of history
Heifer Farm
Original Homestead
Dairy Expansion
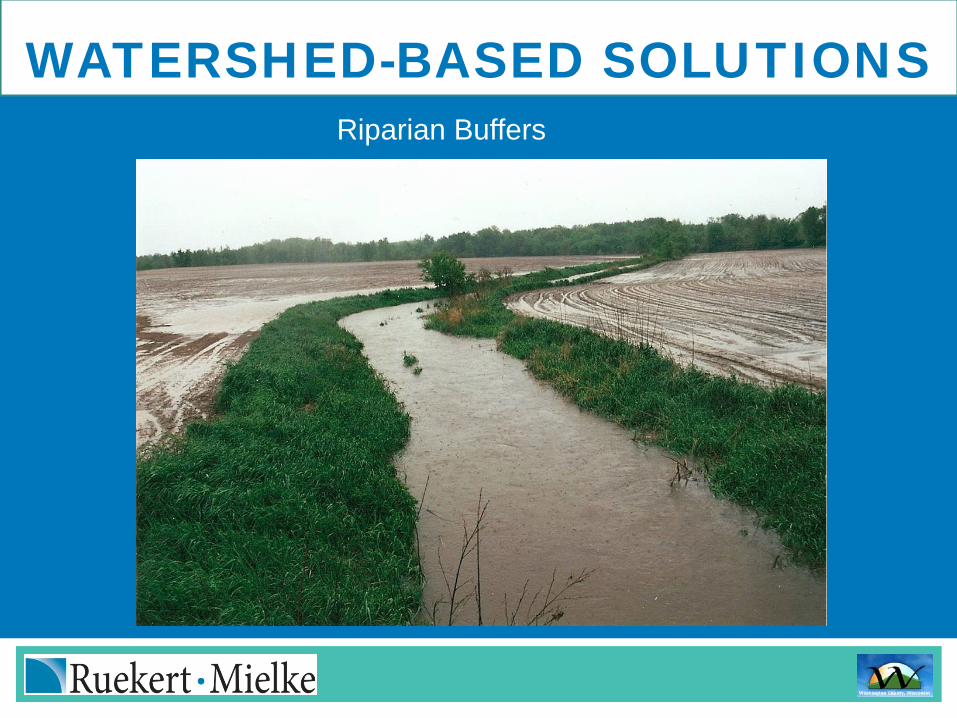
WATERSHED-BASED SOLUTIONSRiparian Buffers
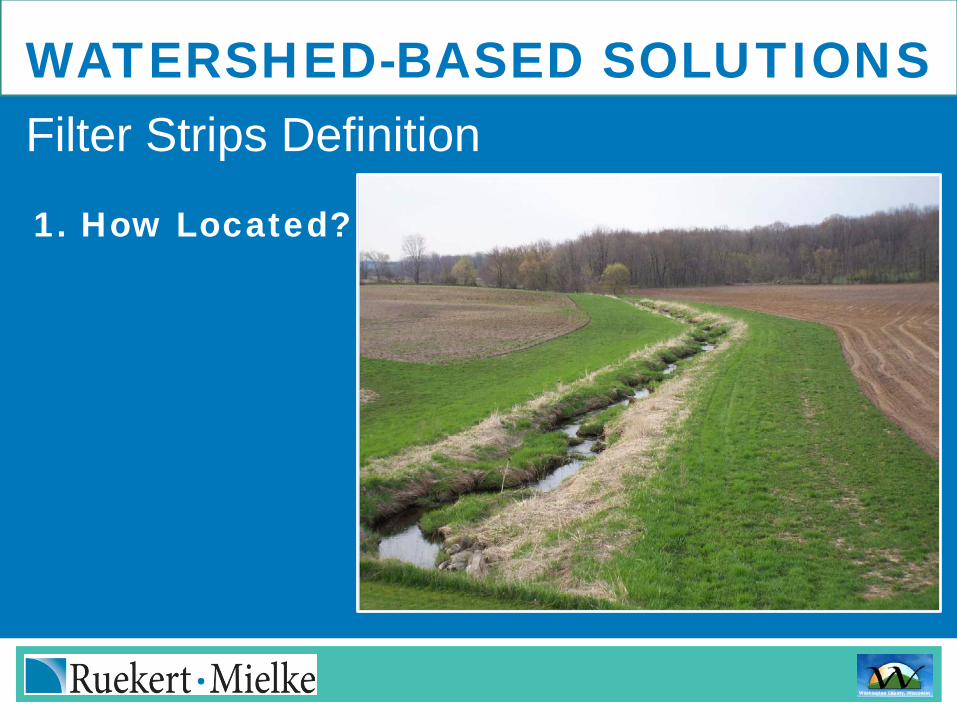
WATERSHED-BASED SOLUTIONSFilter Strips Definition
1. How Located?
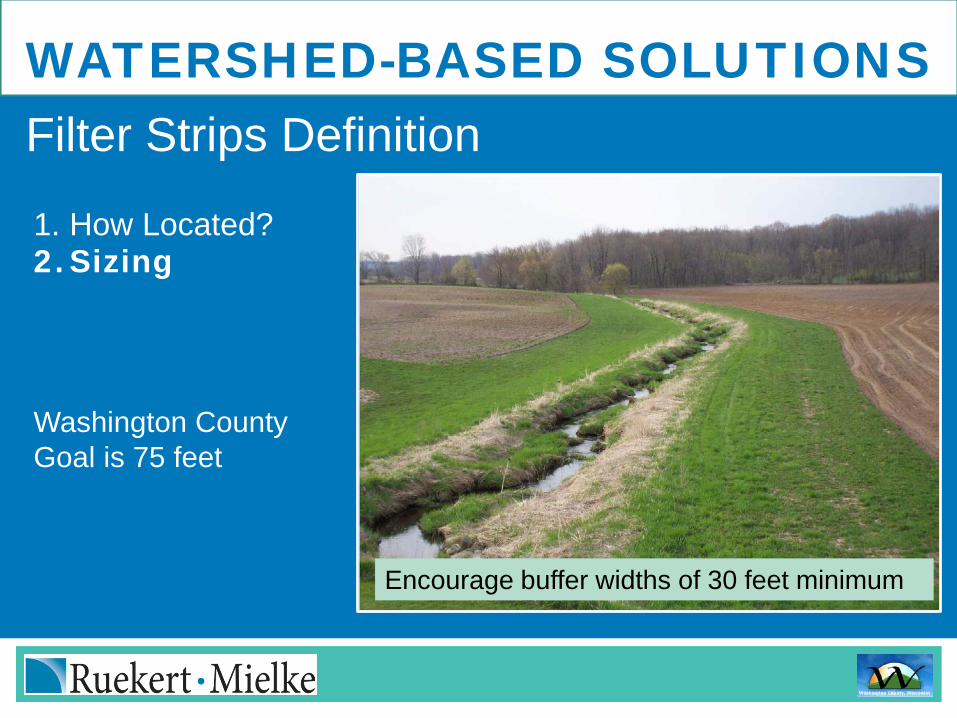
WATERSHED-BASED SOLUTIONSFilter Strips Definition
1. How Located?2.Sizing
Encourage buffer widths of 30 feet minimum
Washington County Goal is 75 feet
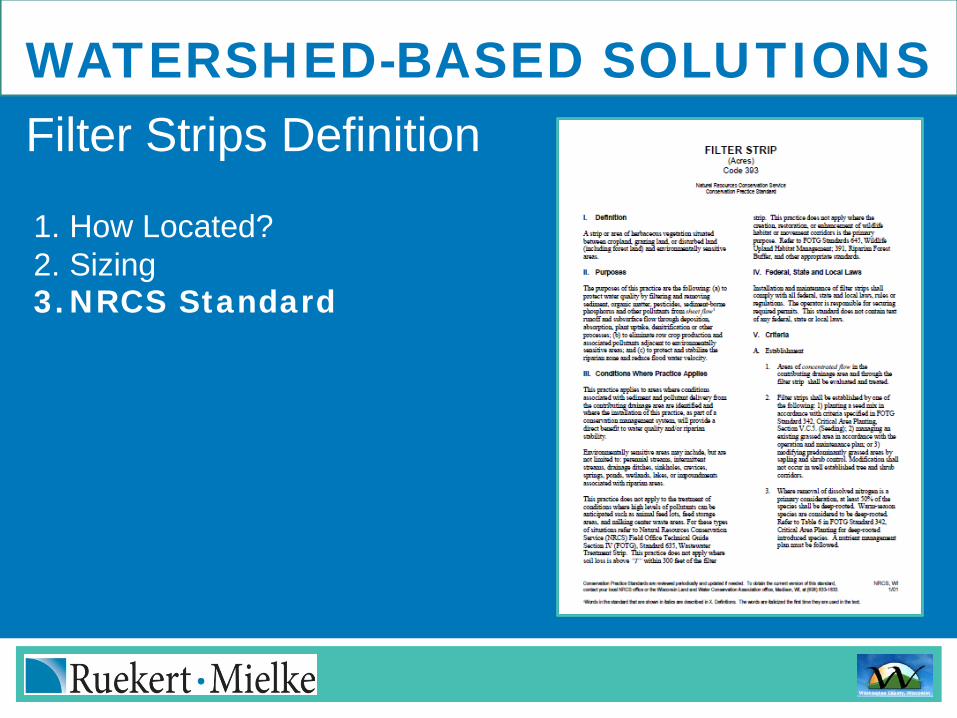
WATERSHED-BASED SOLUTIONSFilter Strips Definition
1. How Located?2. Sizing3.NRCS Standard
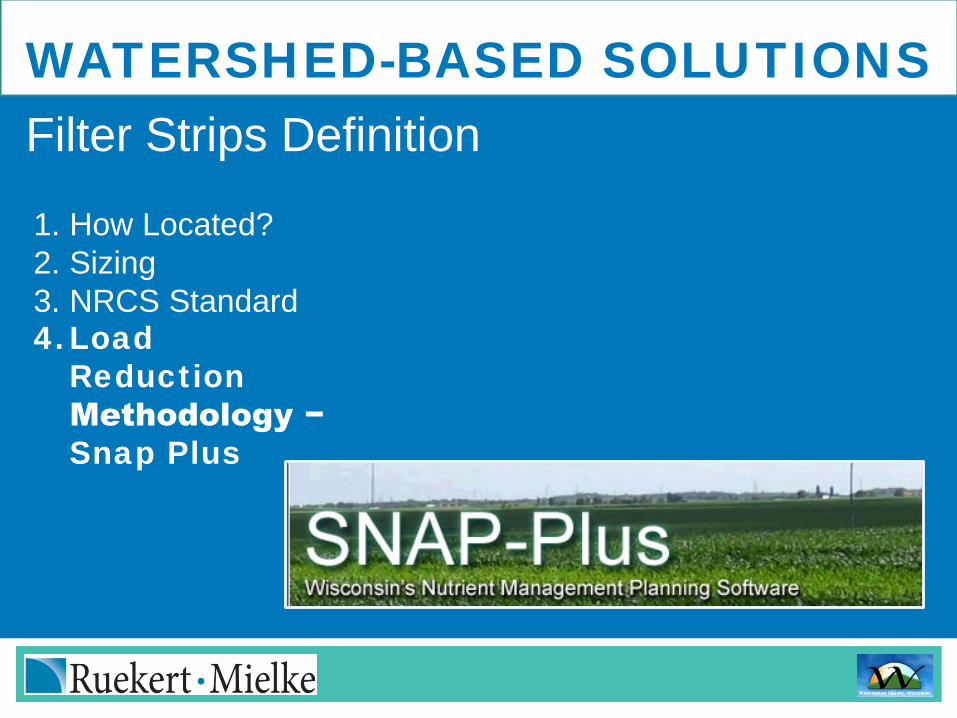
WATERSHED-BASED SOLUTIONSFilter Strips Definition
1. How Located?2. Sizing3. NRCS Standard4.Load
Reduction Methodology −Snap Plus
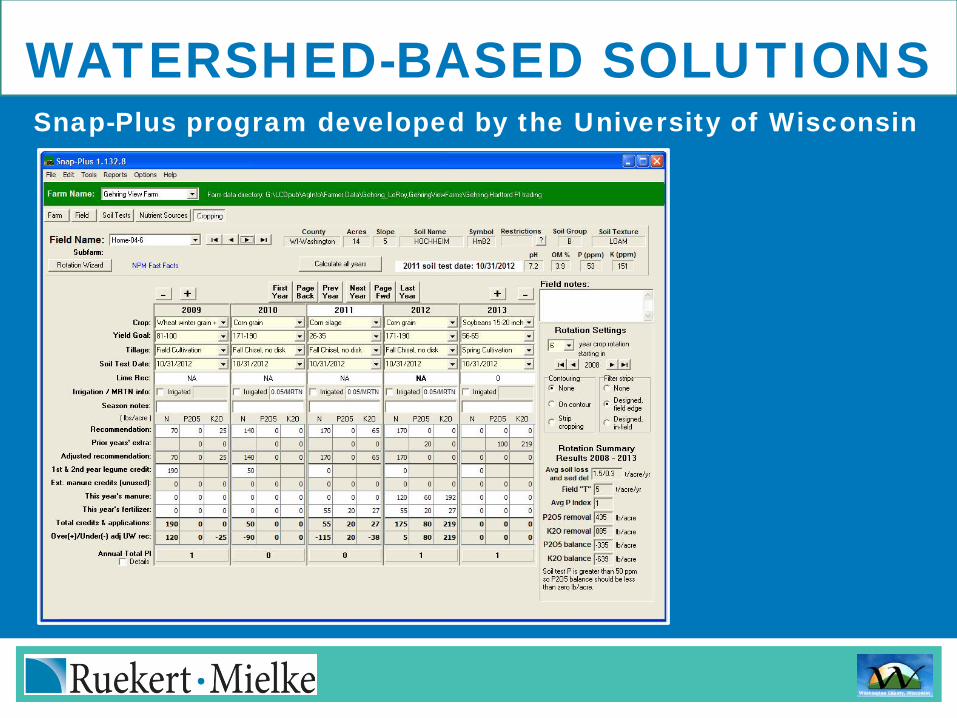
Snap-Plus program developed by the University of Wisconsin
WATERSHED-BASED SOLUTIONS
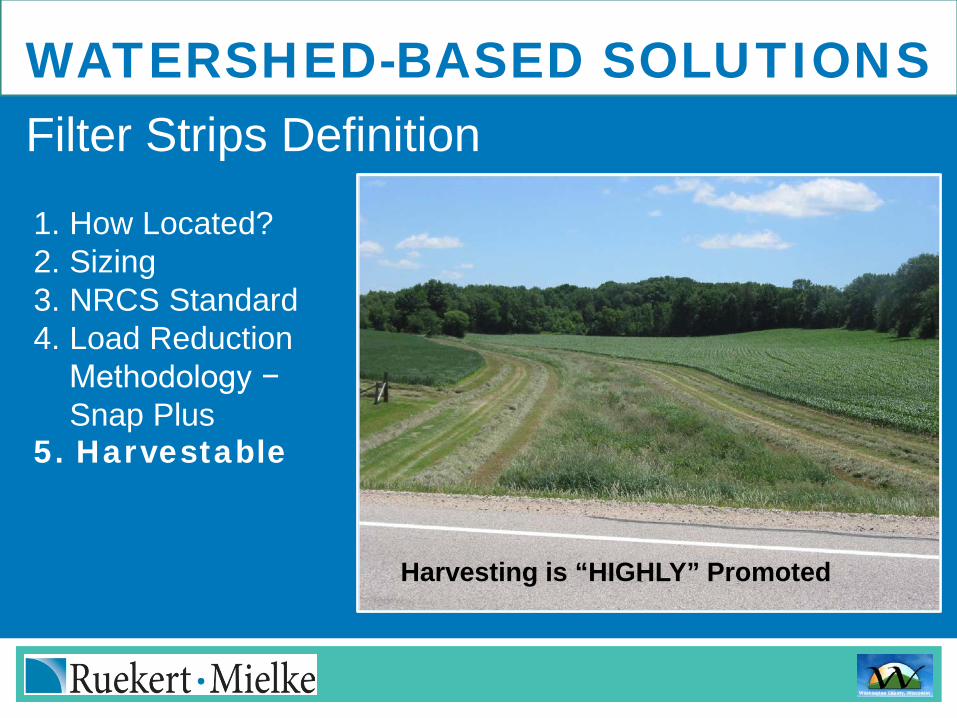
WATERSHED-BASED SOLUTIONSFilter Strips Definition
1. How Located?2. Sizing3. NRCS Standard4. Load Reduction
Methodology −Snap Plus
5. Harvestable
Harvesting is “HIGHLY” Promoted
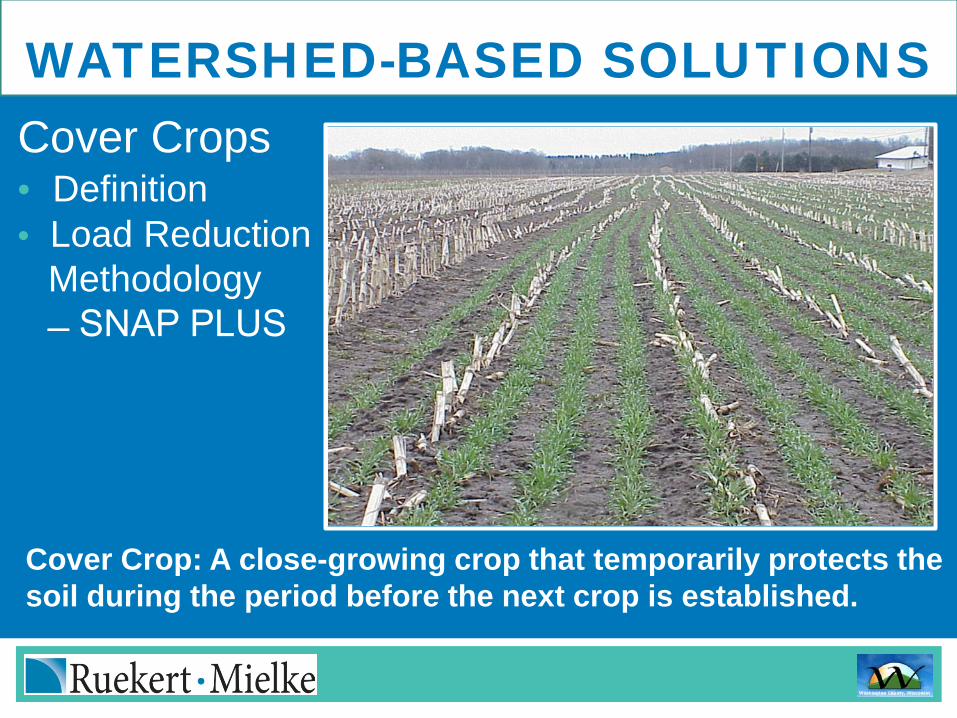
WATERSHED-BASED SOLUTIONSCover Crops• Definition• Load Reduction
Methodology SNAP PLUS
Cover Crop: A close-growing crop that temporarily protects the soil during the period before the next crop is established.
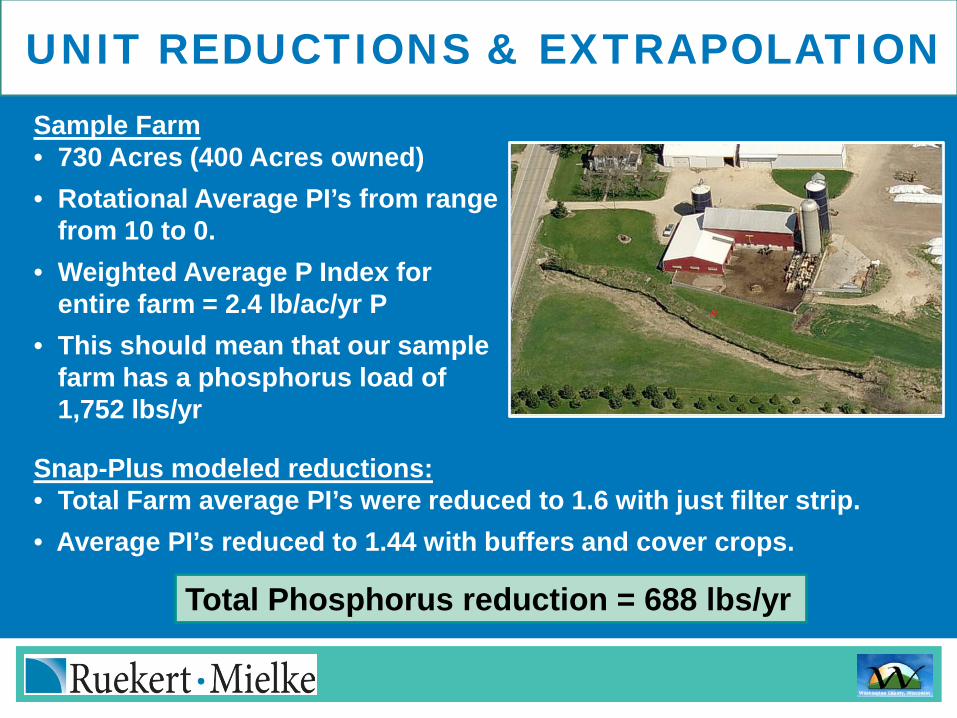
UNIT REDUCTIONS & EXTRAPOLATIONSample Farm• 730 Acres (400 Acres owned)• Rotational Average PI’s from range
from 10 to 0.• Weighted Average P Index for
entire farm = 2.4 lb/ac/yr P• This should mean that our sample
farm has a phosphorus load of 1,752 lbs/yr
Total Phosphorus reduction = 688 lbs/yr
Snap-Plus modeled reductions:• Total Farm average PI’s were reduced to 1.6 with just filter strip.• Average PI’s reduced to 1.44 with buffers and cover crops.
UNIT REDUCTIONS & EXTRAPOLATION
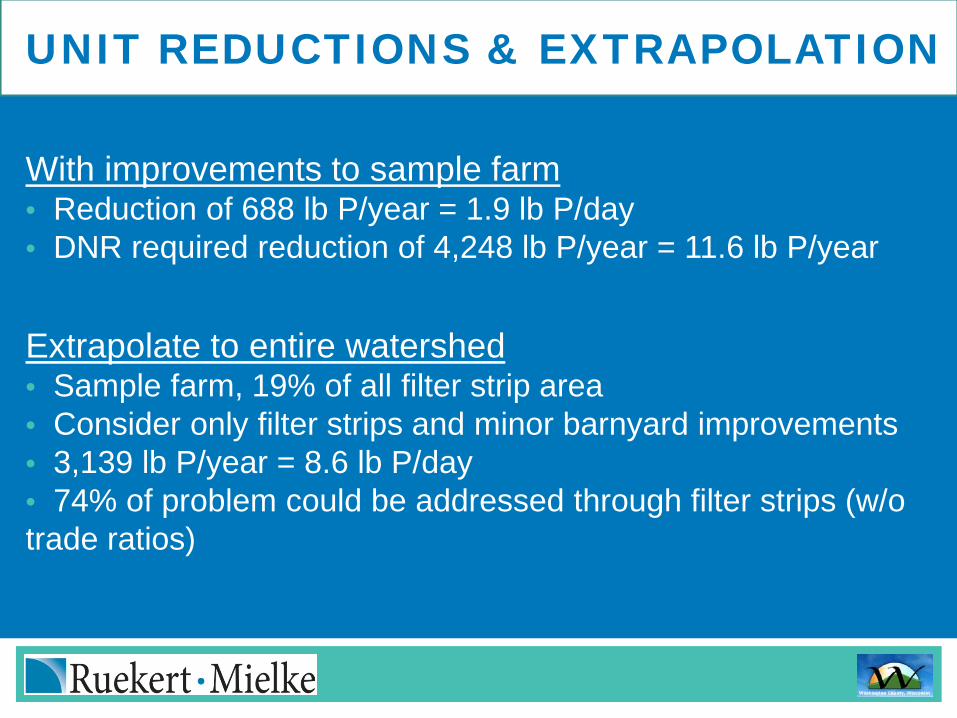
With improvements to sample farm• Reduction of 688 lb P/year = 1.9 lb P/day • DNR required reduction of 4,248 lb P/year = 11.6 lb P/year
Extrapolate to entire watershed• Sample farm, 19% of all filter strip area• Consider only filter strips and minor barnyard improvements• 3,139 lb P/year = 8.6 lb P/day• 74% of problem could be addressed through filter strips (w/o trade ratios)
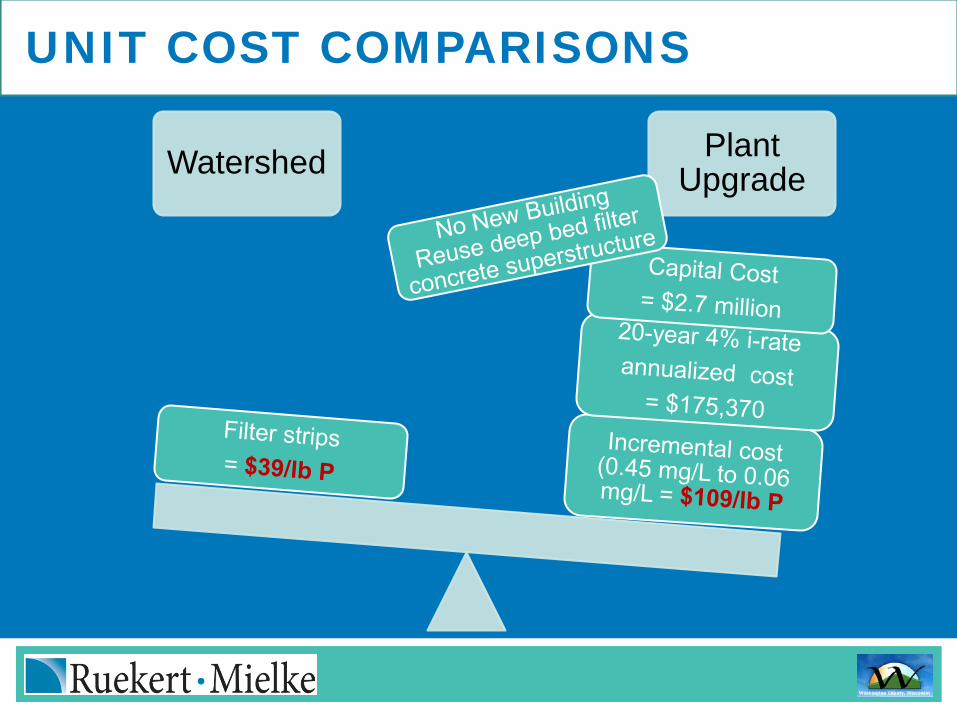
UNIT COST COMPARISONS
Watershed Plant Upgrade
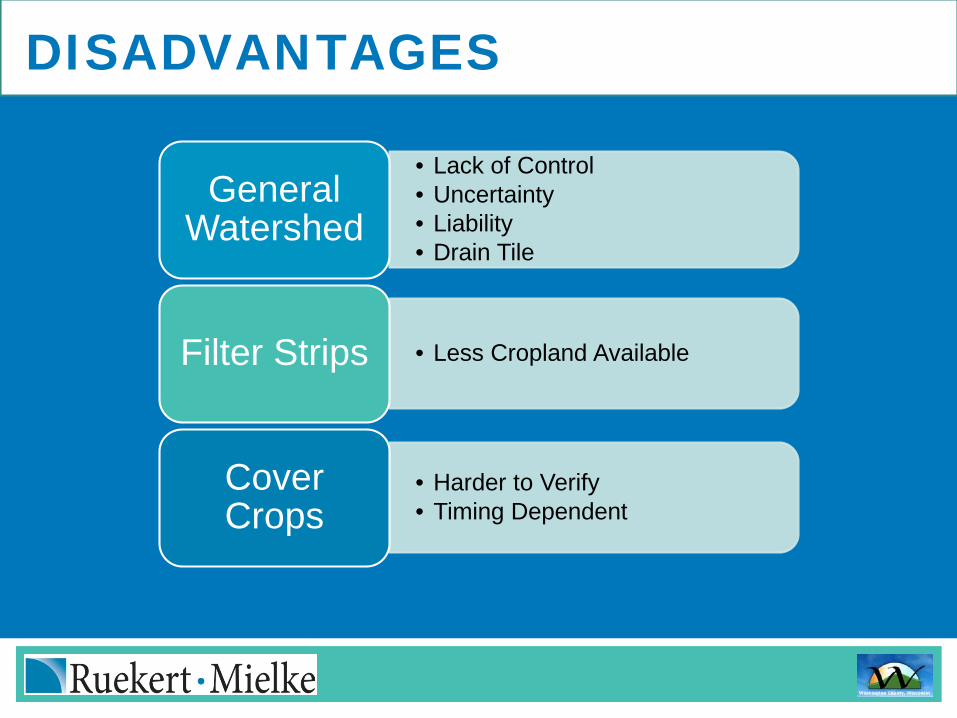
DISADVANTAGES
• Lack of Control• Uncertainty• Liability• Drain Tile
General Watershed
• Less Cropland AvailableFilter Strips
• Harder to Verify• Timing Dependent
Cover Crops
CONSERVATION AND WI RUNOFF RULEThe Washington County Land & Water Conservation Division (LWCD) relies on partnerships with local farmers and landowners by offering:
• Technical Assistance• Financial Assistance• Education
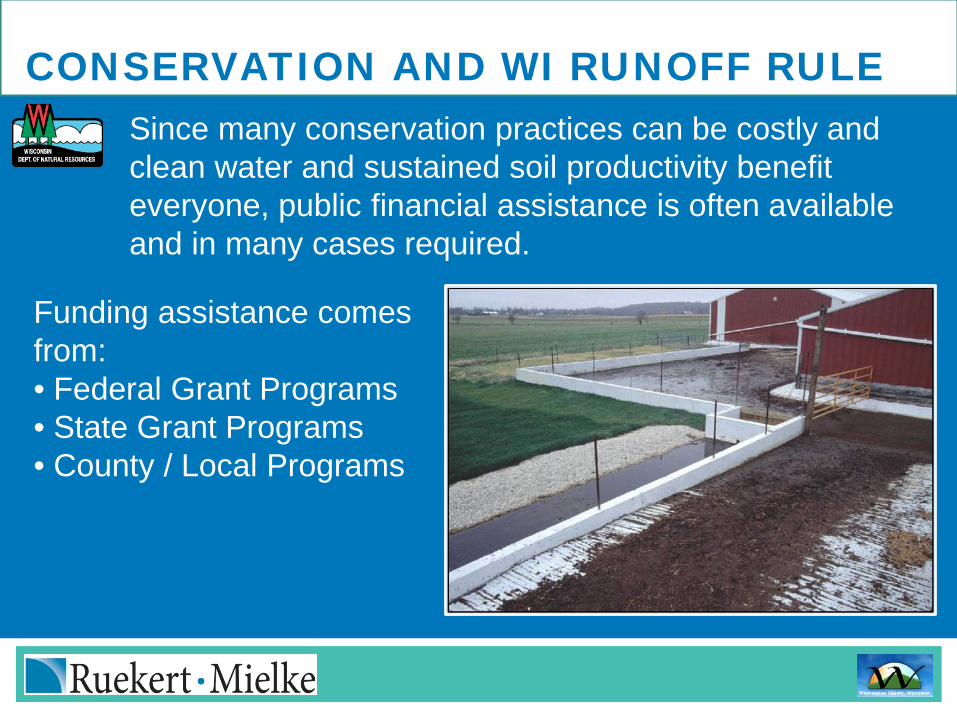
CONSERVATION AND WI RUNOFF RULESince many conservation practices can be costly and clean water and sustained soil productivity benefit everyone, public financial assistance is often available and in many cases required.
Funding assistance comes from:• Federal Grant Programs• State Grant Programs• County / Local Programs
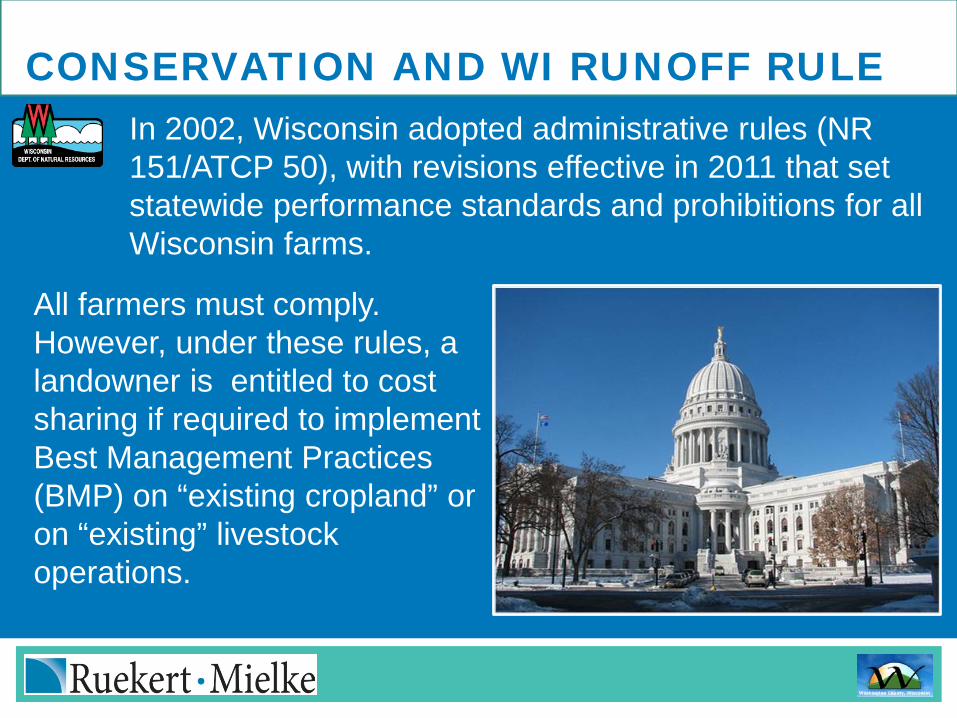
CONSERVATION AND WI RUNOFF RULEIn 2002, Wisconsin adopted administrative rules (NR 151/ATCP 50), with revisions effective in 2011 that set statewide performance standards and prohibitions for all Wisconsin farms.
All farmers must comply. However, under these rules, a landowner is entitled to cost sharing if required to implement Best Management Practices (BMP) on “existing cropland” or on “existing” livestock operations.
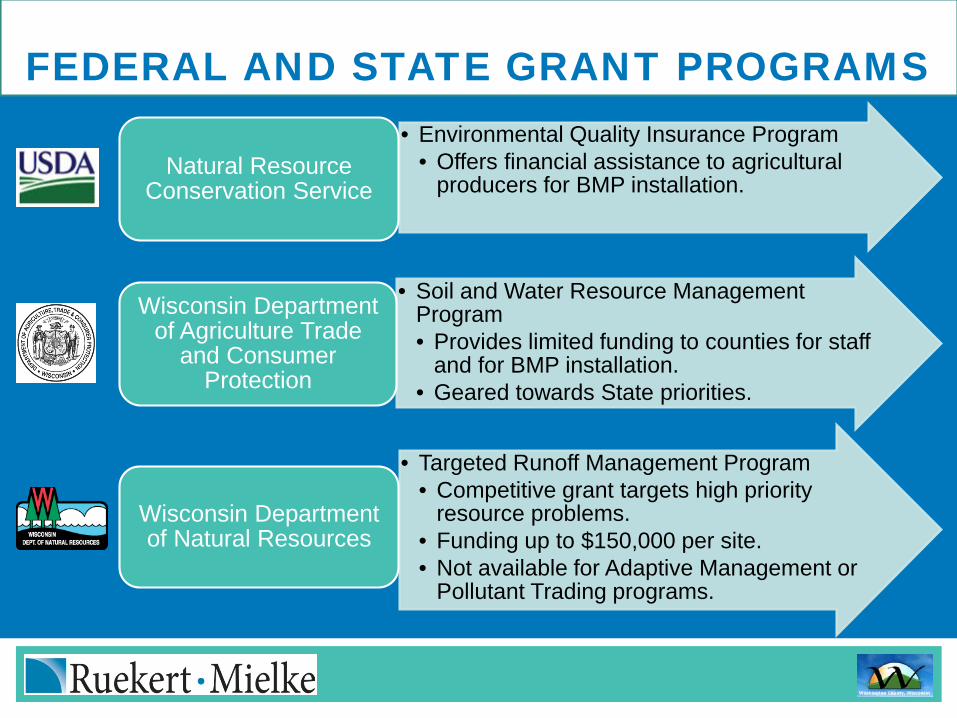
FEDERAL AND STATE GRANT PROGRAMS• Environmental Quality Insurance Program
• Offers financial assistance to agricultural producers for BMP installation.
Natural Resource Conservation Service
• Soil and Water Resource Management Program• Provides limited funding to counties for staff
and for BMP installation.• Geared towards State priorities.
Wisconsin Department of Agriculture Trade
and Consumer Protection
• Targeted Runoff Management Program• Competitive grant targets high priority
resource problems.• Funding up to $150,000 per site.• Not available for Adaptive Management or
Pollutant Trading programs.
Wisconsin Department of Natural Resources
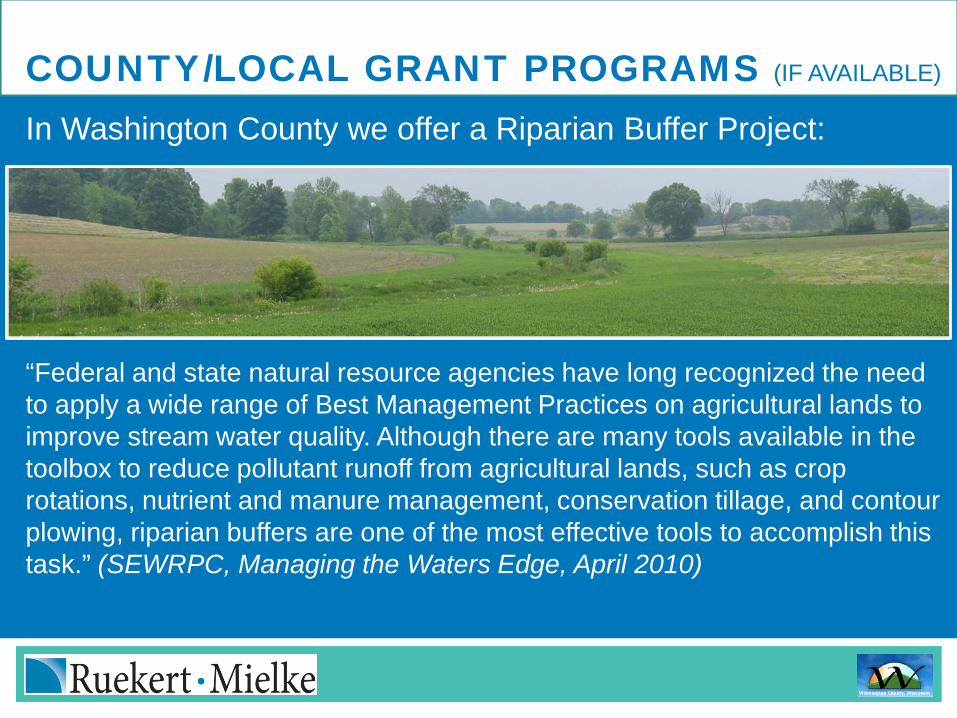
COUNTY/LOCAL GRANT PROGRAMS (IF AVAILABLE)
“Federal and state natural resource agencies have long recognized the need to apply a wide range of Best Management Practices on agricultural lands to improve stream water quality. Although there are many tools available in the toolbox to reduce pollutant runoff from agricultural lands, such as crop rotations, nutrient and manure management, conservation tillage, and contour plowing, riparian buffers are one of the most effective tools to accomplish this task.” (SEWRPC, Managing the Waters Edge, April 2010)
In Washington County we offer a Riparian Buffer Project:
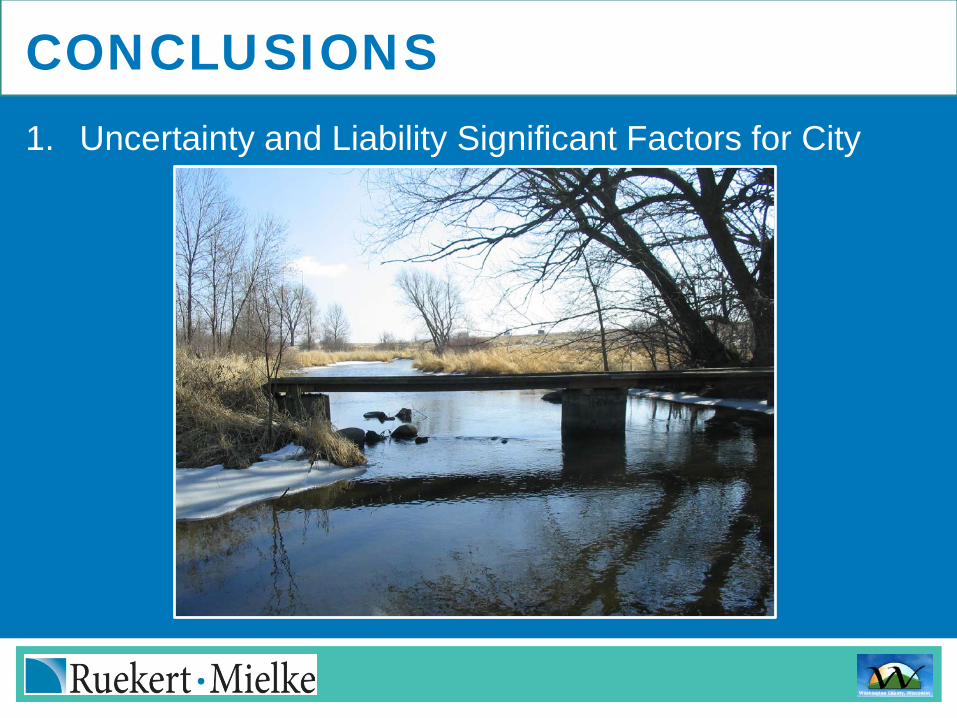
CONCLUSIONS1. Uncertainty and Liability Significant Factors for City
CONCLUSIONS
1. Uncertainty and Liability Significant Factors for City2. Unit Cost of Phosphorus Reduction
Relatively Low with Plant Upgrade
CONCLUSIONS
1. Uncertainty and Liability Significant Factors for City
2. Unit Cost of Phosphorus Reduction Relatively Low with Plant Upgrade
3. Watershed Used as Secondary Solution-Reduce Extent of Plant Upgrade
CONCLUSIONS
1. Uncertainty and Liability Significant Factors for City
2. Unit Cost of Phosphorus Reduction Relatively Low with Plant Upgrade
3. Watershed Used as Secondary Solution-Reduce Extent of Plant Upgrade
4. Watershed Used as Insurance
CONCLUSIONS
1. Uncertainty and Liability Significant Factors for City
2. Unit Cost of Phosphorus Reduction Relatively Low with Plant Upgrade
3. Watershed Used as Secondary Solution-Reduce Extent of Plant Upgrade
4. Watershed Used as Insurance5. Watershed Used for Public Relations
NEXT STEPS
City Implement Optimization Plan− Greater Degree of
Bio-Phosphorus from Oxidation Basin
Progress Report Due:June 30, 2014− Identify Compliance
Strategy

QUESTIONS