Embed Size (px)
Citation preview
10/15/2018
1
Nutrient ManagementNathan Mueller & Laura Thompson, Nebraska Extension Educators
Nutrient Management Philosophies
Sufficiency
• Nutrient only applied if cropresponse expected
• Research based calibration –fertilizer amount for optimumyields at different soil test levels
• “Fertilizer the crop”• Economical and environmentallysound
• Most profit from fertilizer input
Build and Maintain
• Sets a soil test level goal
• Recommends fertilizer to build thesoil test level at or above the pointof economic maximum yield
• “Fertilizing the soil”• Build rate applies more fertilizer thanis needed for crop response andprofit in a given year
• Maintenance rate equal removal rateof crop
Source: Martha Mamo, UNL
© 2018 University of Nebraska – Lincoln
10/15/2018
2
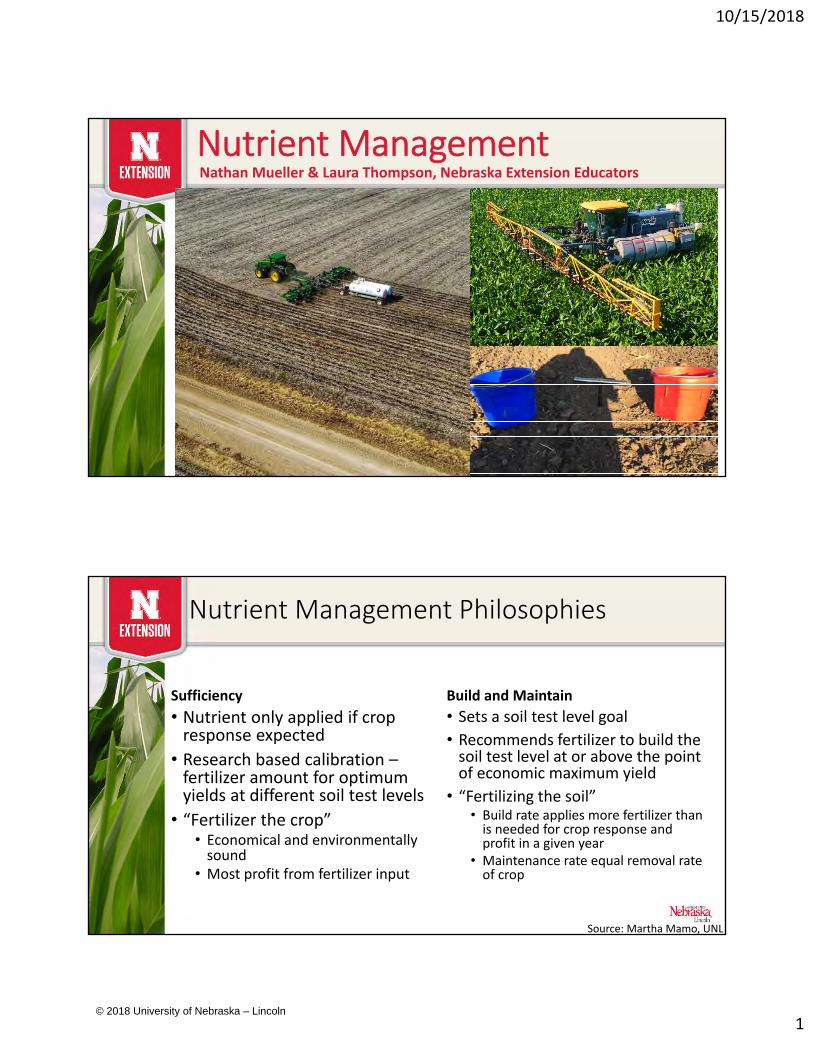
Nutrient Management Philosophies
Yield Goal = 220 bpa Build rate = 6 years
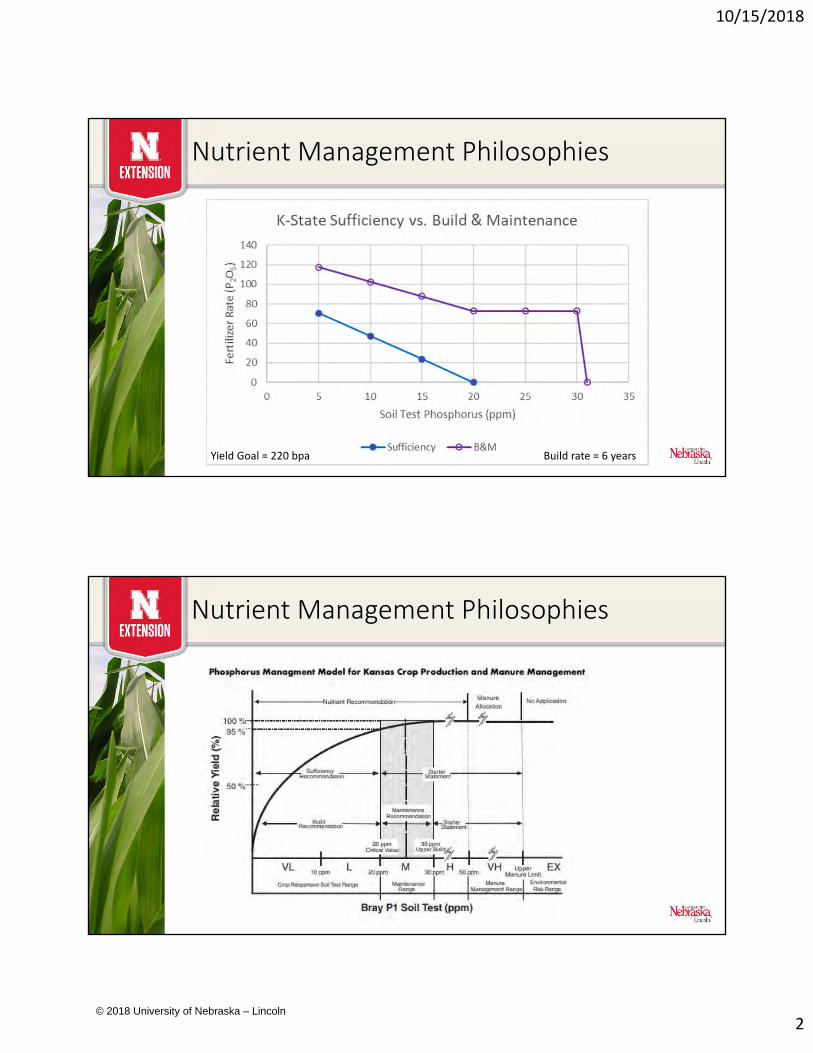
Nutrient Management Philosophies
© 2018 University of Nebraska – Lincoln
10/15/2018
3
Soil Sampling for Precision Ag
Nathan Mueller
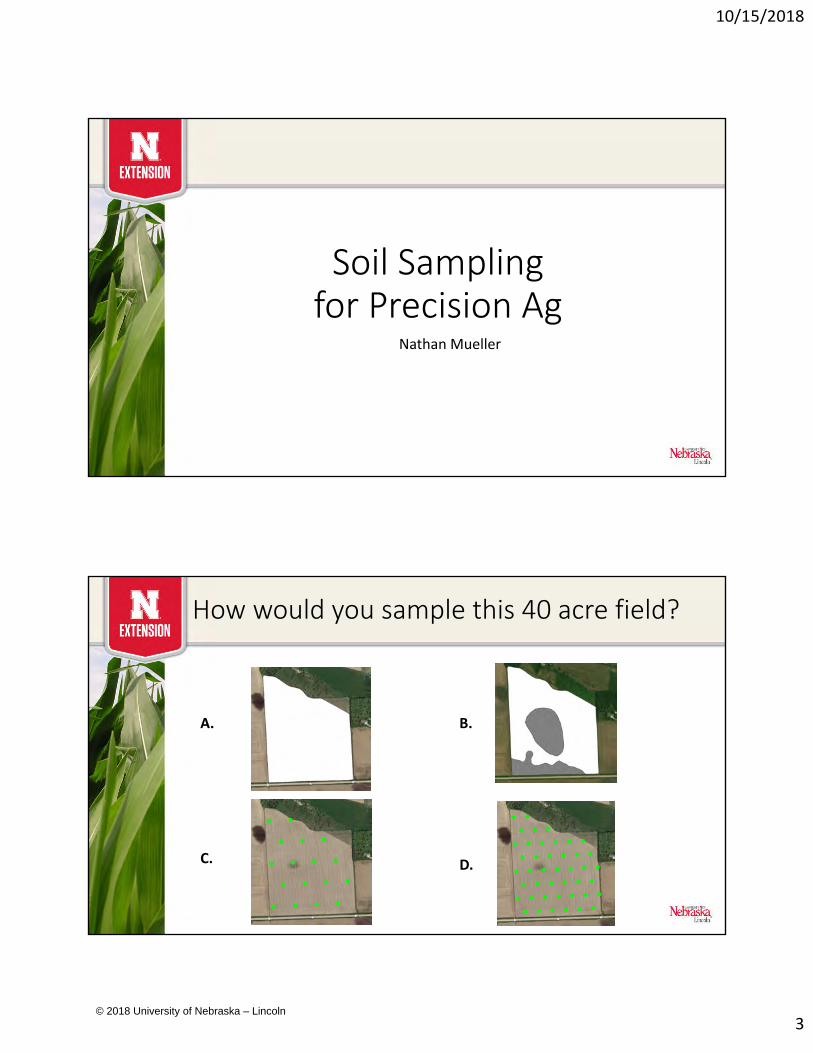
How would you sample this 40 acre field?
A.
C.
B.
D.
© 2018 University of Nebraska – Lincoln
10/15/2018
4
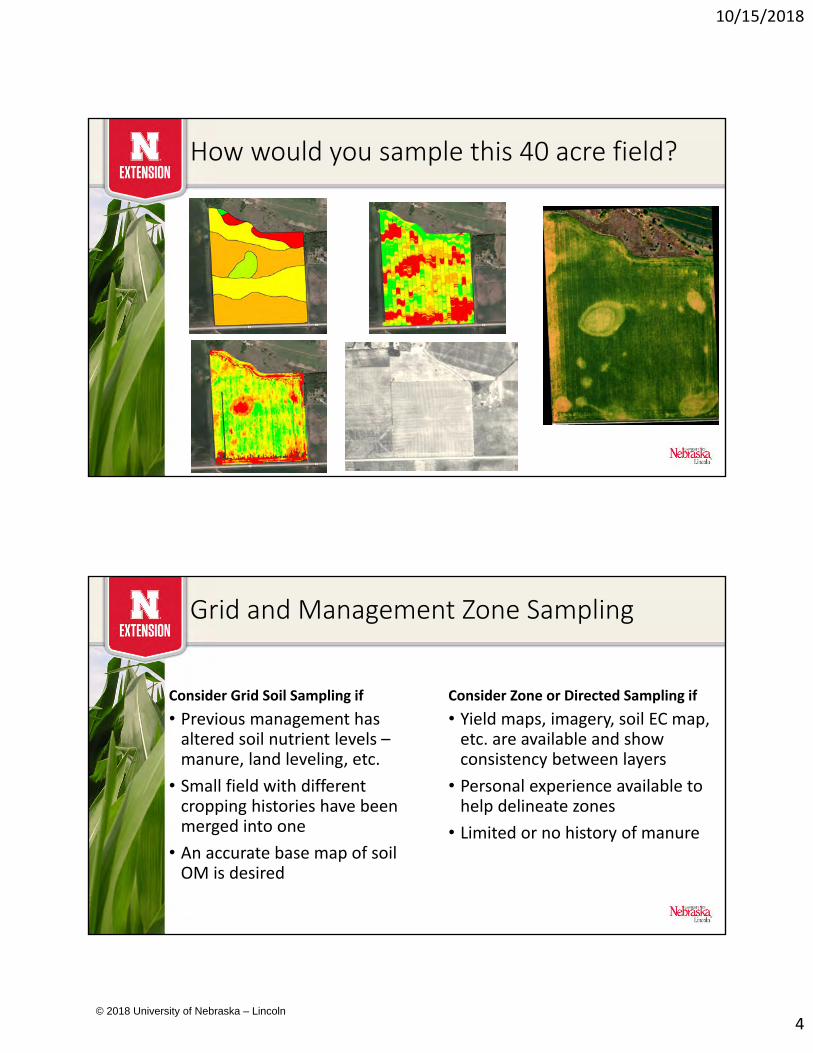
How would you sample this 40 acre field?
Grid and Management Zone Sampling
Consider Grid Soil Sampling if
• Previous management hasaltered soil nutrient levels –manure, land leveling, etc.
• Small field with differentcropping histories have beenmerged into one
• An accurate base map of soilOM is desired
Consider Zone or Directed Sampling if
• Yield maps, imagery, soil EC map,etc. are available and showconsistency between layers
• Personal experience available tohelp delineate zones
• Limited or no history of manure
© 2018 University of Nebraska – Lincoln
10/15/2018
5
Grid Soil Sampling
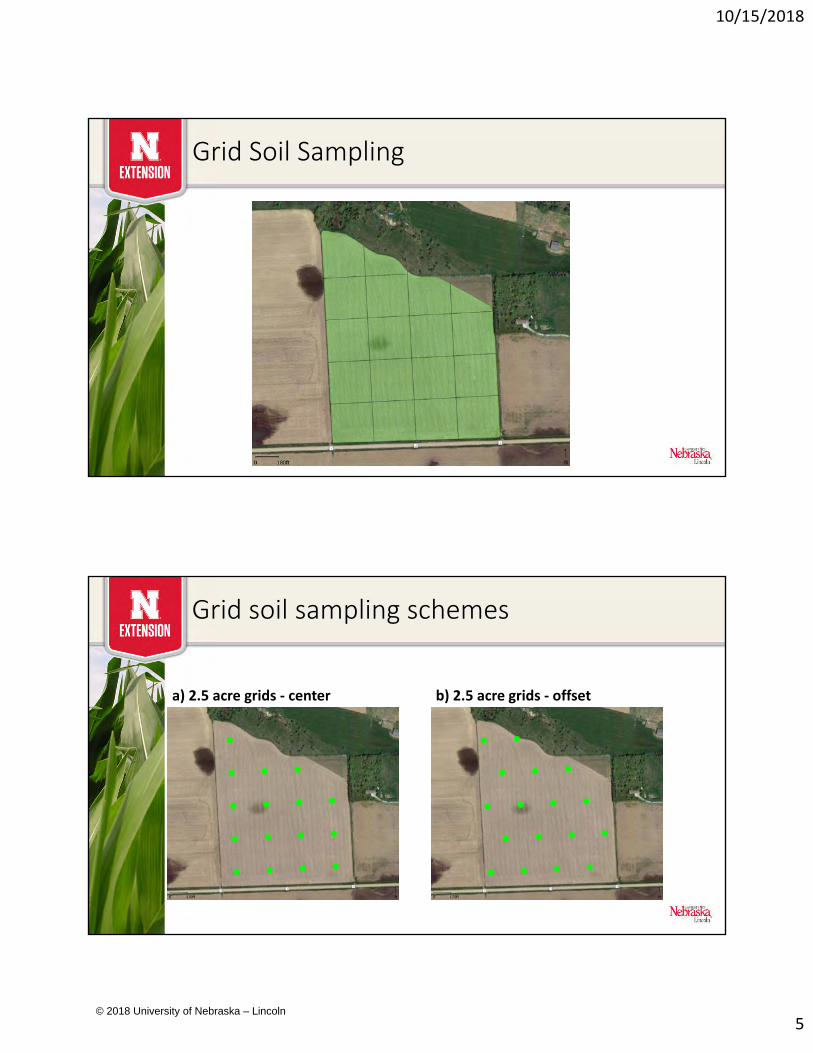
Grid soil sampling schemes
a) 2.5 acre grids ‐ center b) 2.5 acre grids ‐ offset
© 2018 University of Nebraska – Lincoln
10/15/2018
6
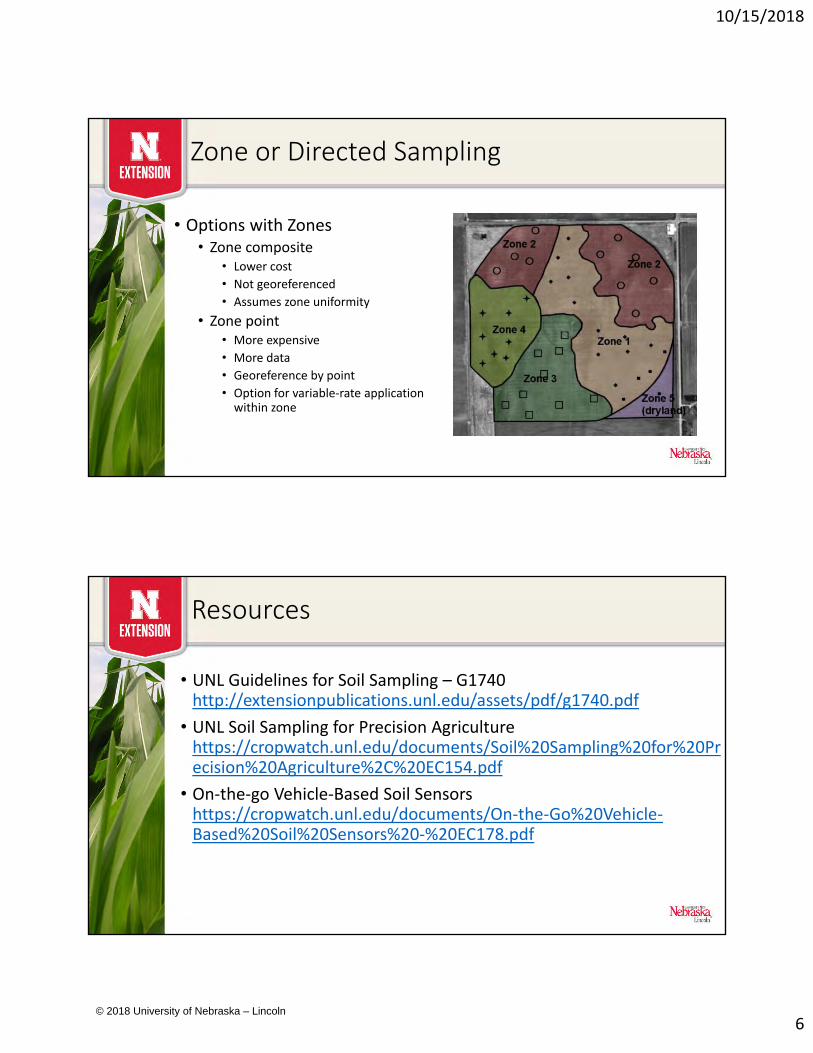
Zone or Directed Sampling
• Options with Zones• Zone composite
• Lower cost
• Not georeferenced
• Assumes zone uniformity
• Zone point• More expensive
• More data
• Georeference by point
• Option for variable‐rate applicationwithin zone
Resources
• UNL Guidelines for Soil Sampling – G1740http://extensionpublications.unl.edu/assets/pdf/g1740.pdf
• UNL Soil Sampling for Precision Agriculturehttps://cropwatch.unl.edu/documents/Soil%20Sampling%20for%20Precision%20Agriculture%2C%20EC154.pdf
• On‐the‐go Vehicle‐Based Soil Sensorshttps://cropwatch.unl.edu/documents/On‐the‐Go%20Vehicle‐Based%20Soil%20Sensors%20‐%20EC178.pdf
© 2018 University of Nebraska – Lincoln
10/15/2018
7
Summary – Grid and Zone Sampling
• Oversampling would give us information to determine the best option
• Use guidelines to determine if grid or zone sampling is likely the bestoptio
• New technologies on the horizon
Nutrient StratificationNathan Mueller
© 2018 University of Nebraska – Lincoln
10/15/2018
8
Overview – Nutrient Stratification
• Non‐uniform nutrient distribution/concentration with soil depth
• Typically refers to higher nutrient concentration of less mobilenutrients, phosphorus and potassium, near the surface.
• Is there an agronomic concern?
• Could this be an environmental concern?
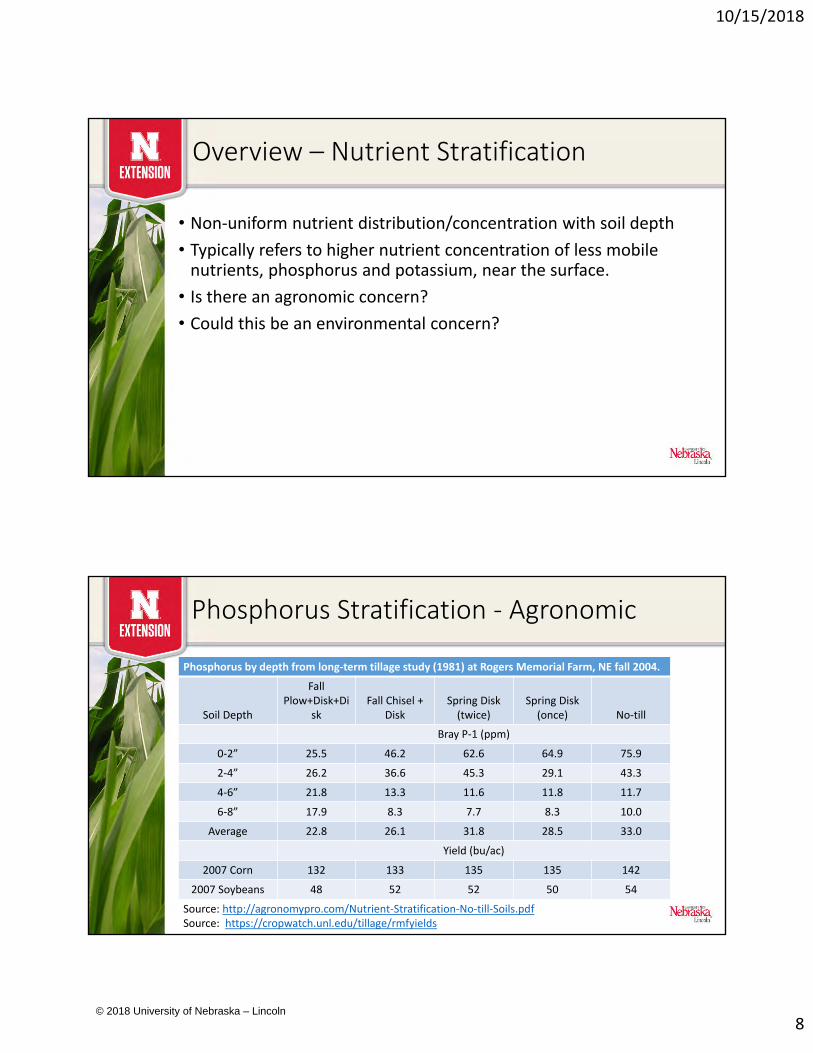
Phosphorus Stratification ‐ Agronomic
Phosphorus by depth from long‐term tillage study (1981) at Rogers Memorial Farm, NE fall 2004.
Soil Depth
FallPlow+Disk+Di
skFall Chisel +
DiskSpring Disk (twice)
Spring Disk (once) No‐till
Bray P‐1 (ppm)
0‐2” 25.5 46.2 62.6 64.9 75.9
2‐4” 26.2 36.6 45.3 29.1 43.3
4‐6” 21.8 13.3 11.6 11.8 11.7
6‐8” 17.9 8.3 7.7 8.3 10.0
Average 22.8 26.1 31.8 28.5 33.0
Yield (bu/ac)
2007 Corn 132 133 135 135 142
2007 Soybeans 48 52 52 50 54
Source: http://agronomypro.com/Nutrient‐Stratification‐No‐till‐Soils.pdfSource: https://cropwatch.unl.edu/tillage/rmfyields
© 2018 University of Nebraska – Lincoln
10/15/2018
9
Phosphorus stratification ‐ Environmental
• No‐till phosphorus stratification – increased potential for dissolved reactive P runoff
• Runoff from no‐till soils can have dissolved organic and inorganic phosphorus that came from soil near the surface (0‐1”)
• One‐Time Tillage of No‐Till: Effects on Nutrients, Mycorrhizae, and Phosphorus Uptake (Garcia et al., 2007)
• Research at ENREC and Rogers Memorial Farm
• “Result do not indicated any advantage of one‐time tillage of no‐till if runoff P loss is not a concern”
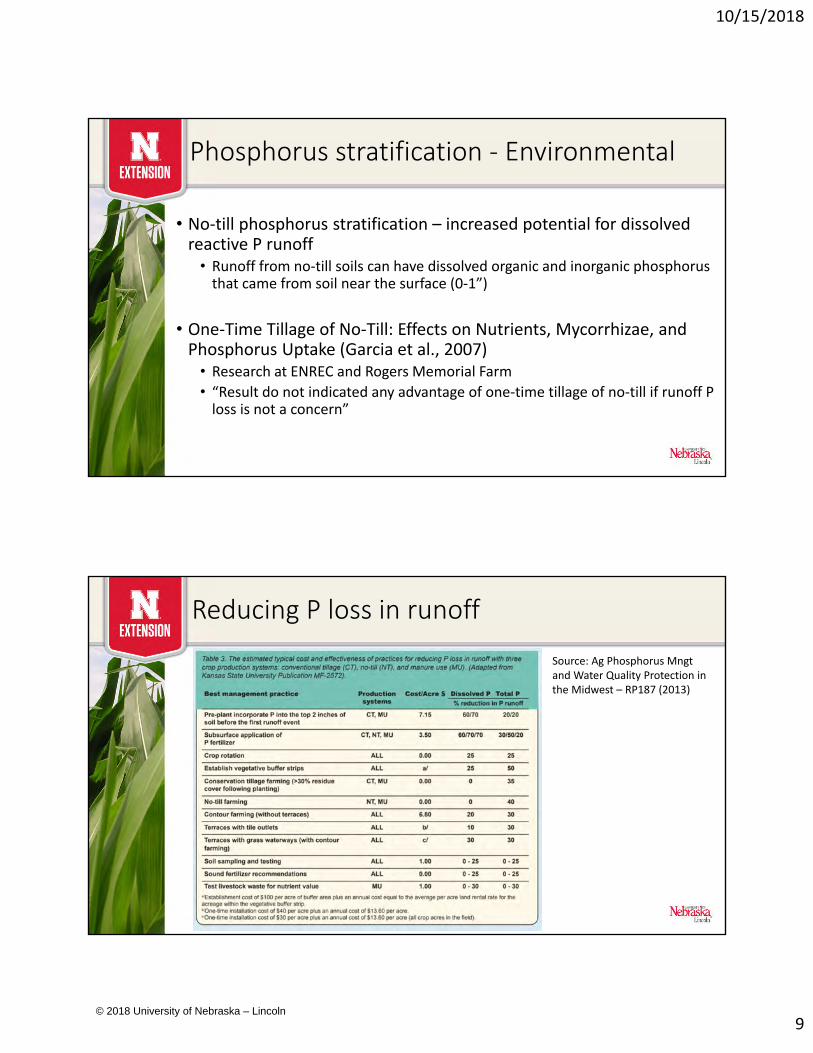
Reducing P loss in runoff
Source: Ag Phosphorus Mngtand Water Quality Protection in the Midwest – RP187 (2013)
© 2018 University of Nebraska – Lincoln
10/15/2018
10
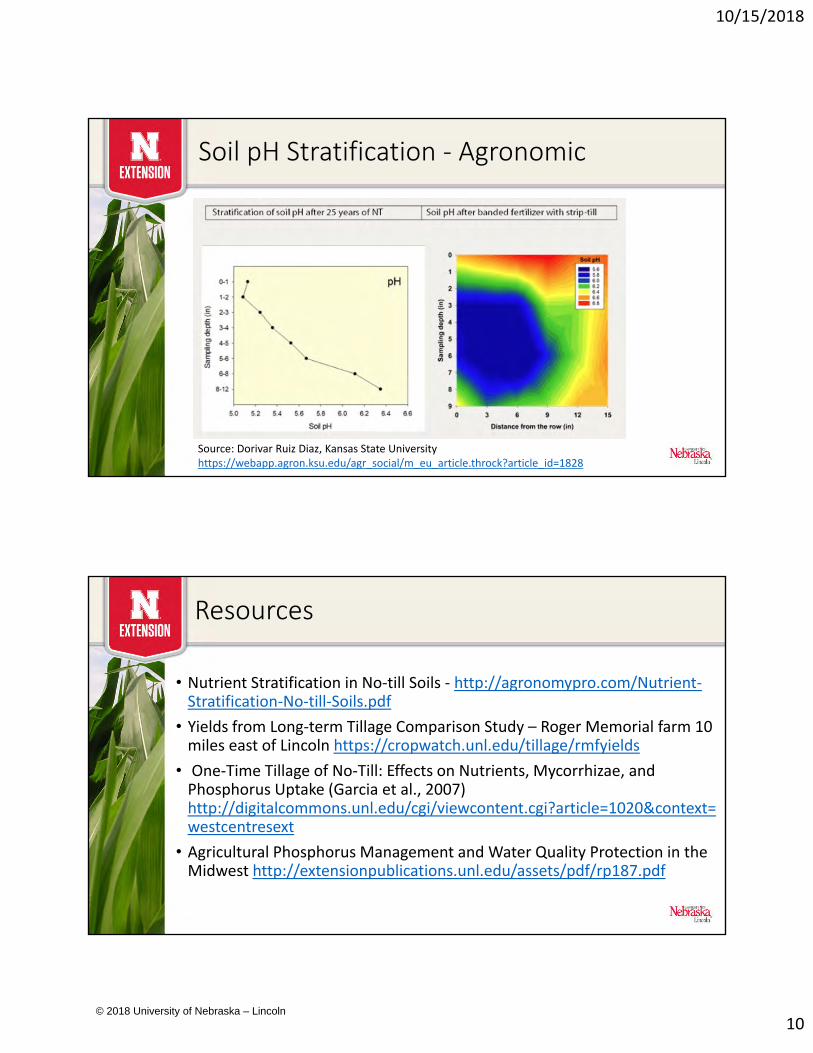
Soil pH Stratification ‐ Agronomic
Source: Dorivar Ruiz Diaz, Kansas State University https://webapp.agron.ksu.edu/agr_social/m_eu_article.throck?article_id=1828
Resources
• Nutrient Stratification in No‐till Soils ‐ http://agronomypro.com/Nutrient‐Stratification‐No‐till‐Soils.pdf
• Yields from Long‐term Tillage Comparison Study – Roger Memorial farm 10 miles east of Lincoln https://cropwatch.unl.edu/tillage/rmfyields
• One‐Time Tillage of No‐Till: Effects on Nutrients, Mycorrhizae, and Phosphorus Uptake (Garcia et al., 2007) http://digitalcommons.unl.edu/cgi/viewcontent.cgi?article=1020&context=westcentresext
• Agricultural Phosphorus Management and Water Quality Protection in the Midwest http://extensionpublications.unl.edu/assets/pdf/rp187.pdf
© 2018 University of Nebraska – Lincoln
10/15/2018
11
Summary – Nutrient Stratification
• Usually not a agronomic issue
• Can be a environmental issue with phosphorus• Numerous ways to manage dissolved and total P
Subsoil SamplingNathan Mueller
© 2018 University of Nebraska – Lincoln
10/15/2018
12
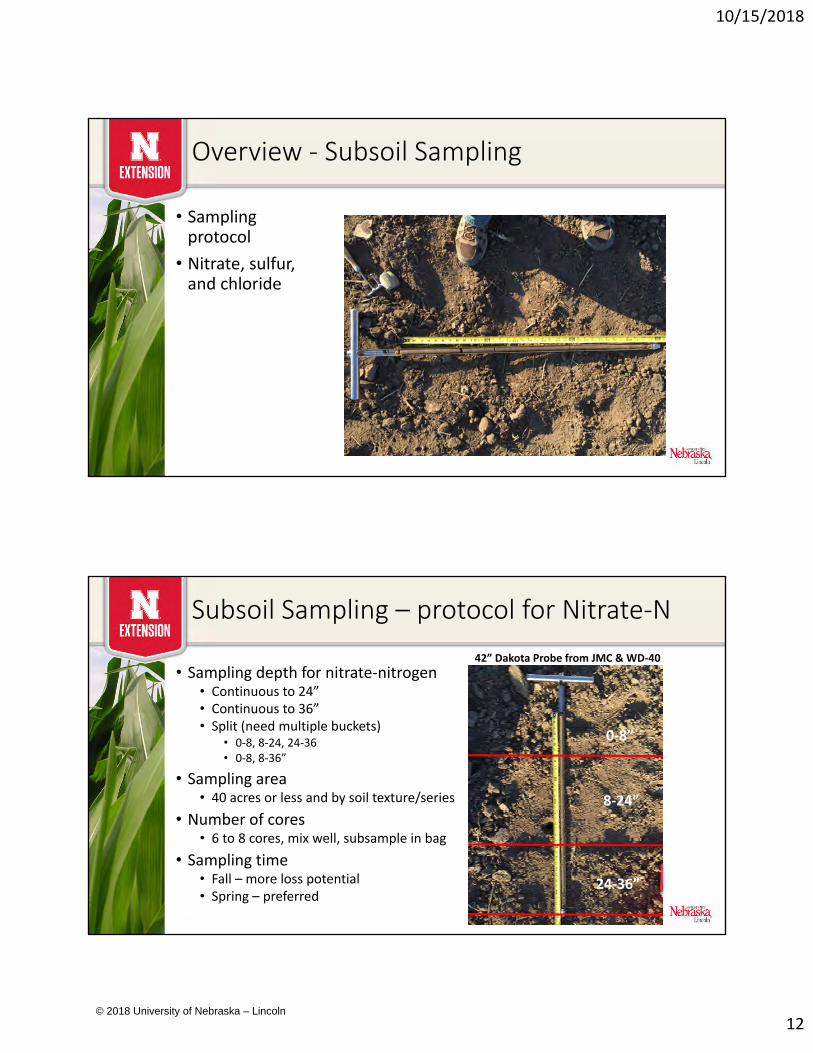
Overview ‐ Subsoil Sampling
• Samplingprotocol
• Nitrate, sulfur,and chloride
Subsoil Sampling – protocol for Nitrate‐N
• Sampling depth for nitrate‐nitrogen• Continuous to 24”• Continuous to 36”• Split (need multiple buckets)
• 0‐8, 8‐24, 24‐36• 0‐8, 8‐36”
• Sampling area• 40 acres or less and by soil texture/series
• Number of cores• 6 to 8 cores, mix well, subsample in bag
• Sampling time• Fall – more loss potential• Spring – preferred
0‐8”
8‐24”
24‐36”
42” Dakota Probe from JMC & WD‐40
© 2018 University of Nebraska – Lincoln
10/15/2018
13
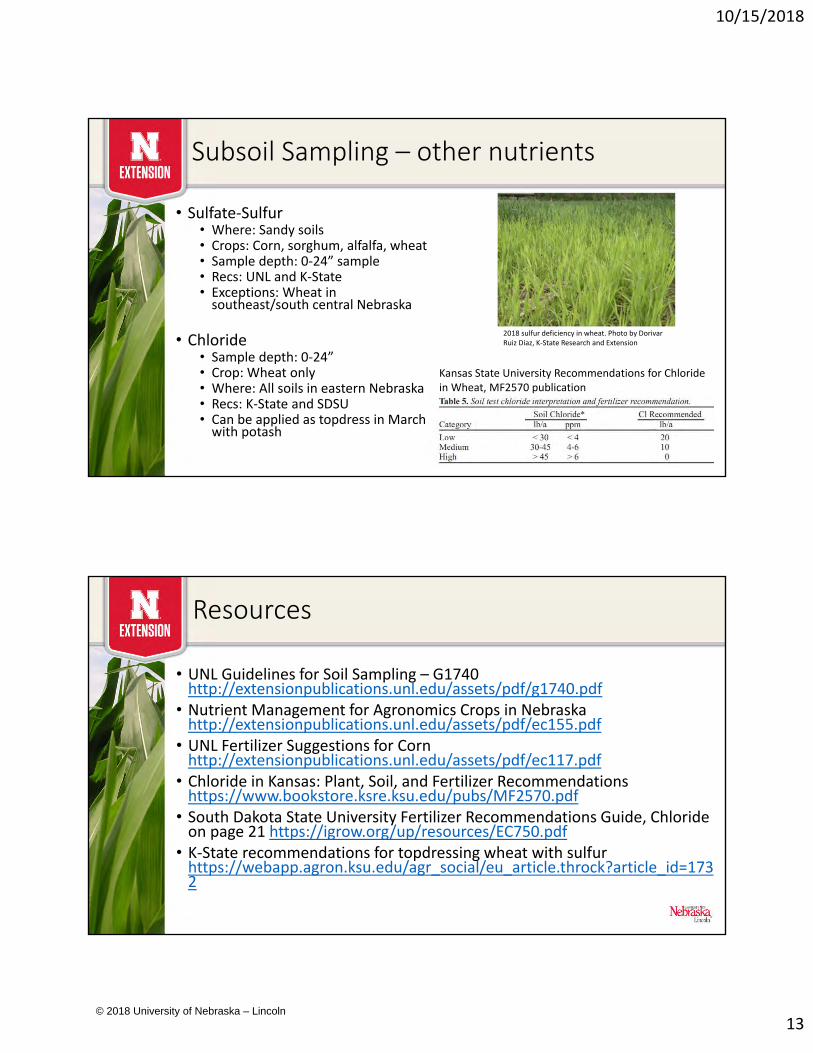
Subsoil Sampling – other nutrients
• Sulfate‐Sulfur• Where: Sandy soils• Crops: Corn, sorghum, alfalfa, wheat• Sample depth: 0‐24” sample • Recs: UNL and K‐State• Exceptions: Wheat in southeast/south central Nebraska
• Chloride• Sample depth: 0‐24”• Crop: Wheat only• Where: All soils in eastern Nebraska• Recs: K‐State and SDSU• Can be applied as topdress in March with potash
Kansas State University Recommendations for Chloride in Wheat, MF2570 publication
2018 sulfur deficiency in wheat. Photo by Dorivar Ruiz Diaz, K‐State Research and Extension
Resources
• UNL Guidelines for Soil Sampling – G1740 http://extensionpublications.unl.edu/assets/pdf/g1740.pdf
• Nutrient Management for Agronomics Crops in Nebraska http://extensionpublications.unl.edu/assets/pdf/ec155.pdf
• UNL Fertilizer Suggestions for Corn http://extensionpublications.unl.edu/assets/pdf/ec117.pdf
• Chloride in Kansas: Plant, Soil, and Fertilizer Recommendations https://www.bookstore.ksre.ksu.edu/pubs/MF2570.pdf
• South Dakota State University Fertilizer Recommendations Guide, Chloride on page 21 https://igrow.org/up/resources/EC750.pdf
• K‐State recommendations for topdressing wheat with sulfur https://webapp.agron.ksu.edu/agr_social/eu_article.throck?article_id=1732
© 2018 University of Nebraska – Lincoln
10/15/2018
14
Summary – Subsoil sampling
• Subsoil sampling for nitrate – 6 to 8 cores, from 40 acres or less and by soil texture, at 24” minimum depth
• Other nutrients to consider when analyzing when subsoil sampling• Sulfur – sandy soils for corn, sorghum, alfalfa, and wheat and for wheat in southeast and south central Nebraska
• Chloride – wheat in eastern Nebraska
Precision Ag Soil MappingNathan Mueller
© 2018 University of Nebraska – Lincoln
10/15/2018
15
Overview – Precision Ag Soil Mapping
• Soil mapping units and inclusions
• Soil EC for precision mapping
• Soil EC and yield relationship
• Using soil EC maps
Soil associations
© 2018 University of Nebraska – Lincoln
10/15/2018
16
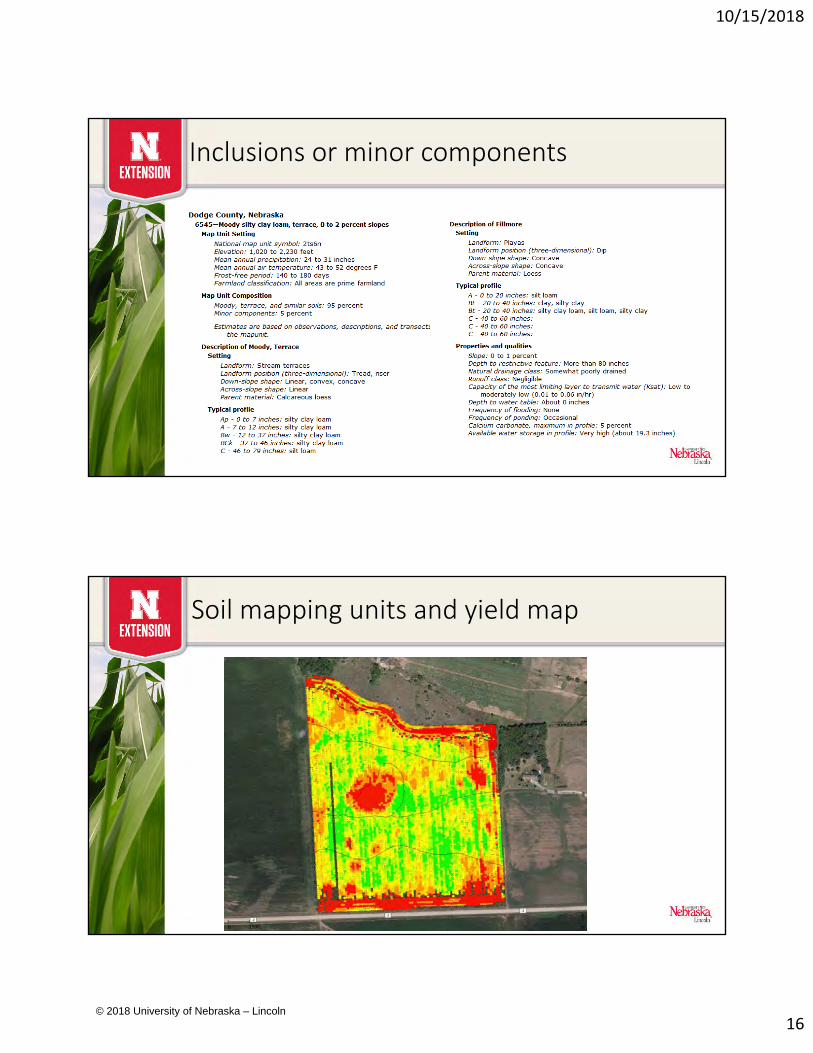
Inclusions or minor components
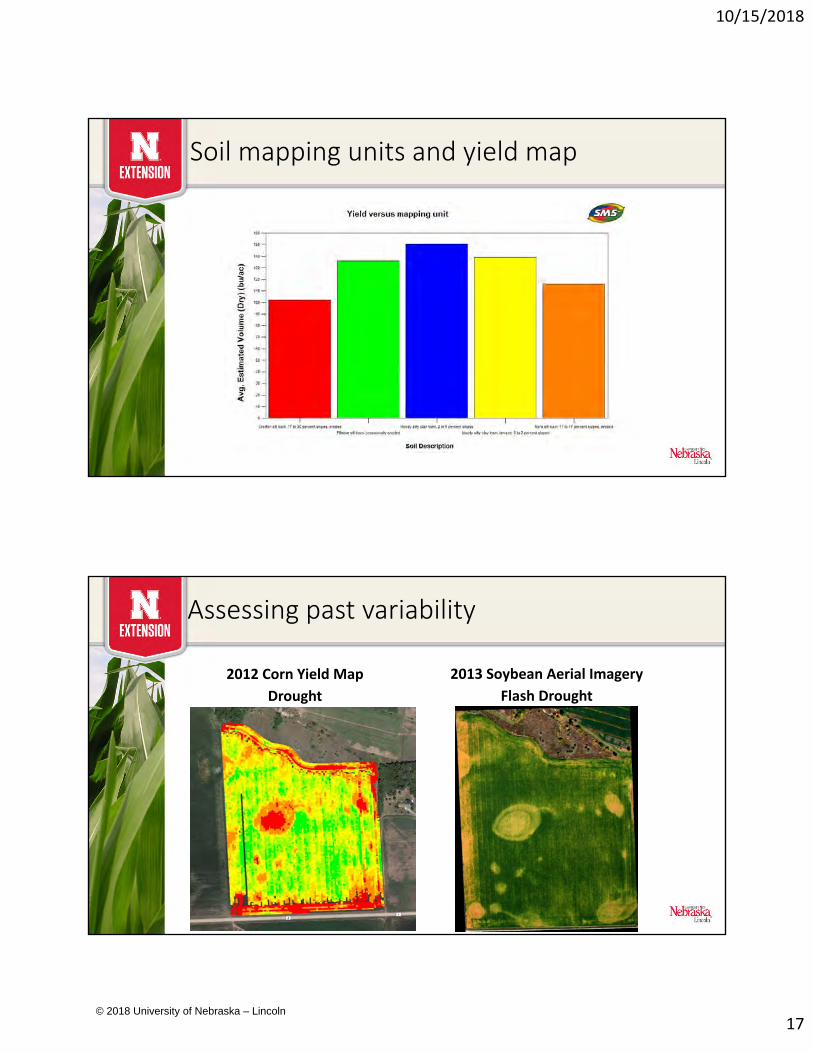
Soil mapping units and yield map
© 2018 University of Nebraska – Lincoln
10/15/2018
17
Soil mapping units and yield map
Assessing past variability
2012 Corn Yield Map
Drought
2013 Soybean Aerial Imagery
Flash Drought
© 2018 University of Nebraska – Lincoln
10/15/2018
18
Soil EC Mapping
• Electrical conductivity is the ability to transmit an electrical current (mS/m)
• Sand (low)• Silt• Clay• Saline soils (high)
• Methods for measuring• Veris platform using coulters (contact)• Electromagnetic sleds (non‐contact)
• Delineate ¼ acre inclusions vs. 2.5 – 4 acres inclusions
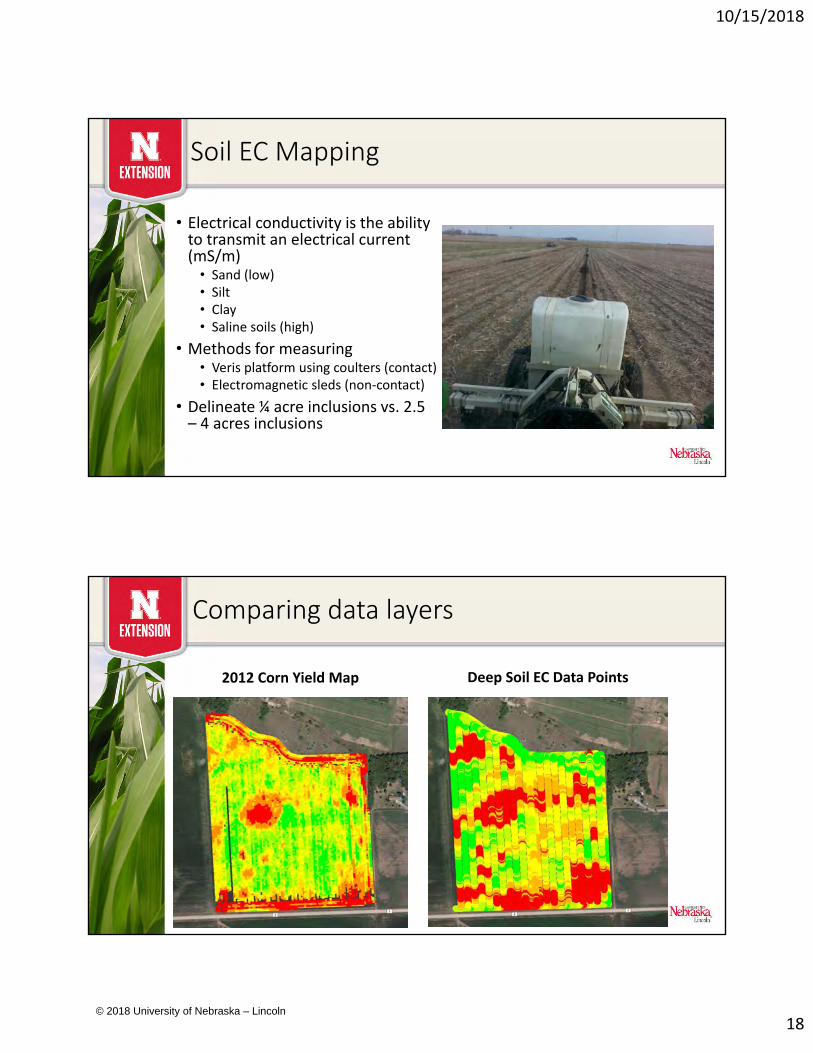
Comparing data layers
2012 Corn Yield Map Deep Soil EC Data Points
© 2018 University of Nebraska – Lincoln
10/15/2018
19
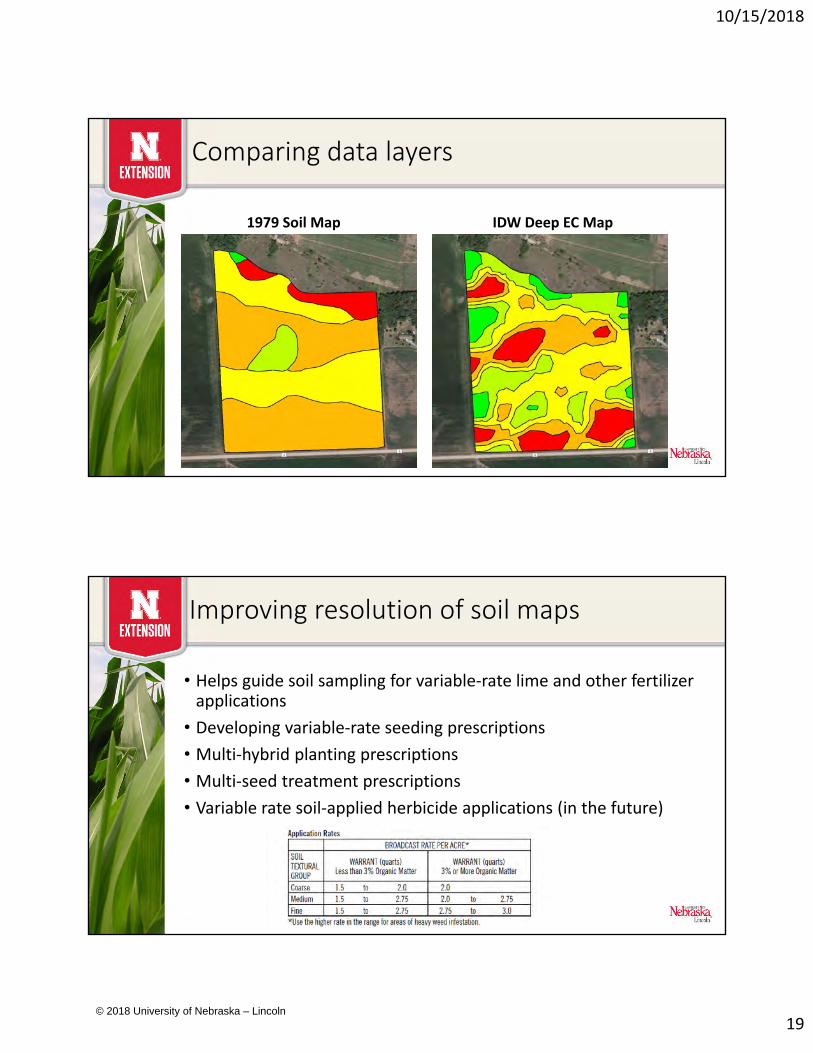
Comparing data layers
1979 Soil Map IDW Deep EC Map
Improving resolution of soil maps
• Helps guide soil sampling for variable‐rate lime and other fertilizerapplications
• Developing variable‐rate seeding prescriptions
• Multi‐hybrid planting prescriptions
• Multi‐seed treatment prescriptions
• Variable rate soil‐applied herbicide applications (in the future)
© 2018 University of Nebraska – Lincoln
10/15/2018
20
Resources
• On‐the‐go Vehicle‐Based Soil Sensors https://cropwatch.unl.edu/documents/On‐the‐Go%20Vehicle‐Based%20Soil%20Sensors%20‐%20EC178.pdf
• Veris technologies https://www.veristech.com/
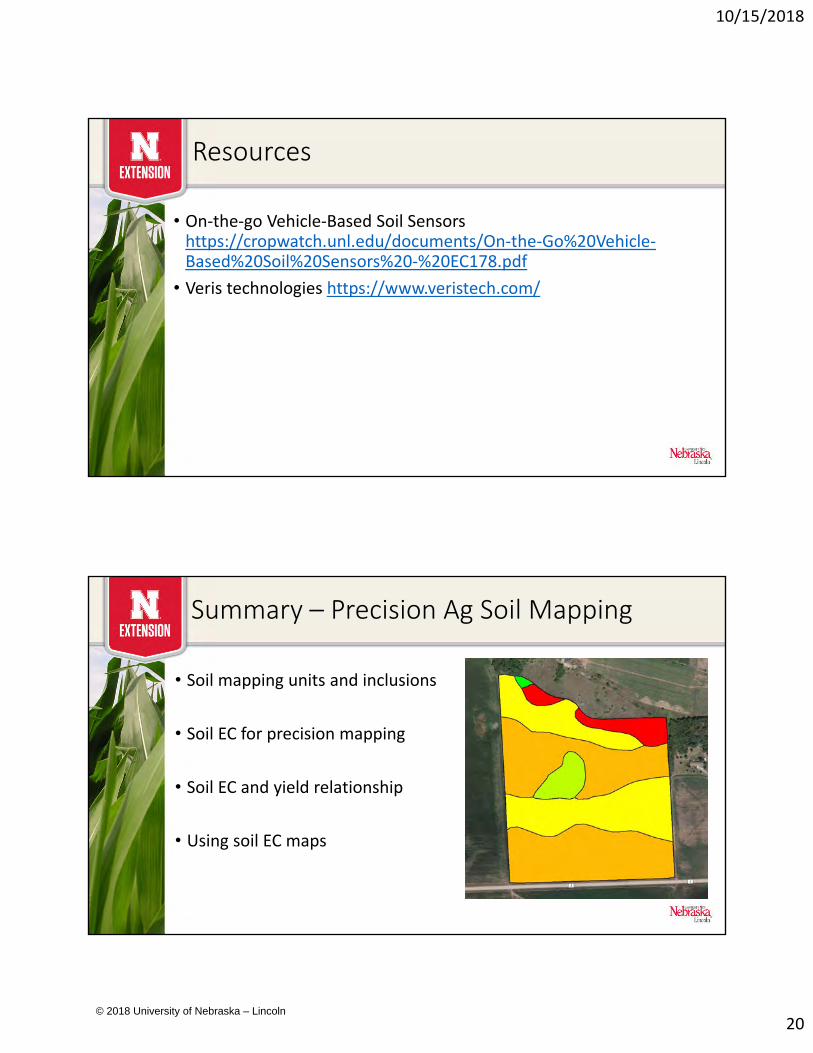
Summary – Precision Ag Soil Mapping
• Soil mapping units and inclusions
• Soil EC for precision mapping
• Soil EC and yield relationship
• Using soil EC maps
© 2018 University of Nebraska – Lincoln
10/15/2018
21
Field Variability and Management
Harvest Stand Count
Foliar Nitrogen (%)
Moisture (%)
Yield (bu/ac)†
Marginal Net Return‡ ($/ac)
210 lb N/ac Preplant 32,250 A* 3.04 B 15.5 B 216 B 610.98 B70 lb N/ac Preplant + 110 lb N/ac Sidedress
32,833 A 3.27 AB 15.9 A 239 A 691.72 A
70 lb N/ac Preplant + 140 lb N/ac Sidedress
31,667 A 3.44 A 16.2 A 243 A 696.25 A
70 lb N/ac Preplant + 170 lb N/ac Sidedress
31,833 A 3.29 AB 16.2 A 251 A 710.89 A
P-Value 0.113 0.054 0.001 0.0007 0.0009
Results:*Values with the same letter are not significantly different at a 90% confidence level.†Bushels per acre corrected to 15.5% moisture.‡Marginal net return based on $3.15/bu corn and $0.33/lb N.
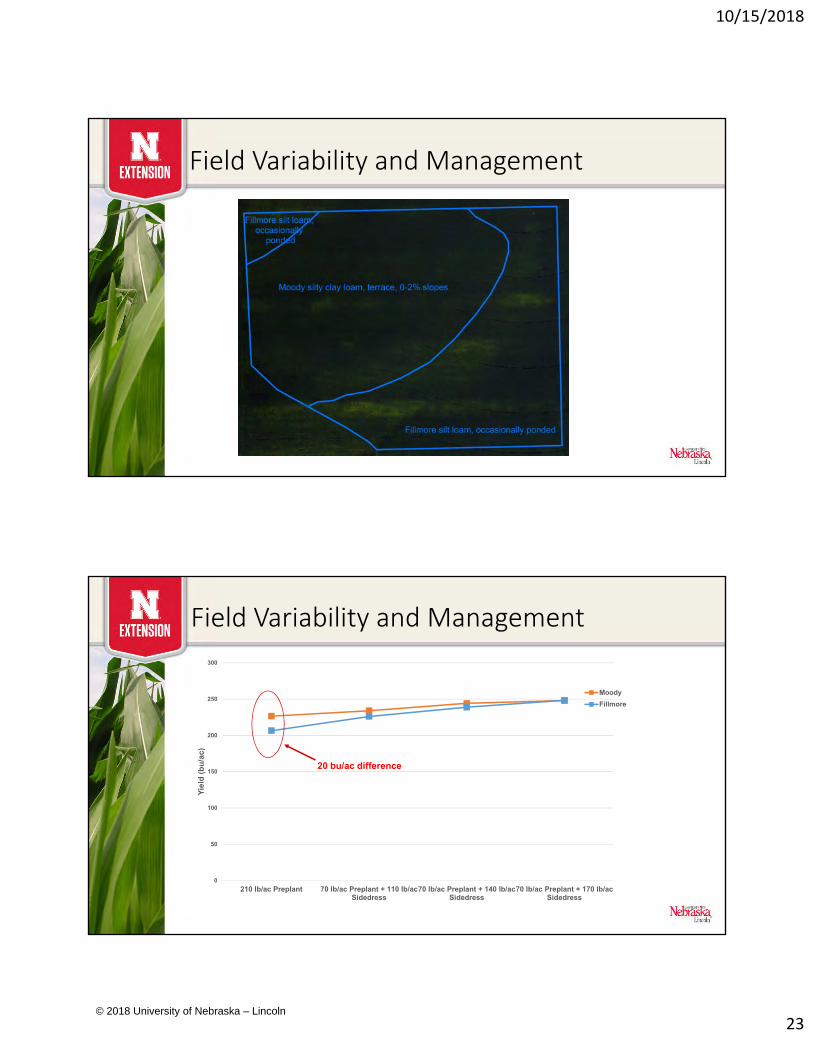
Field Variability and Management
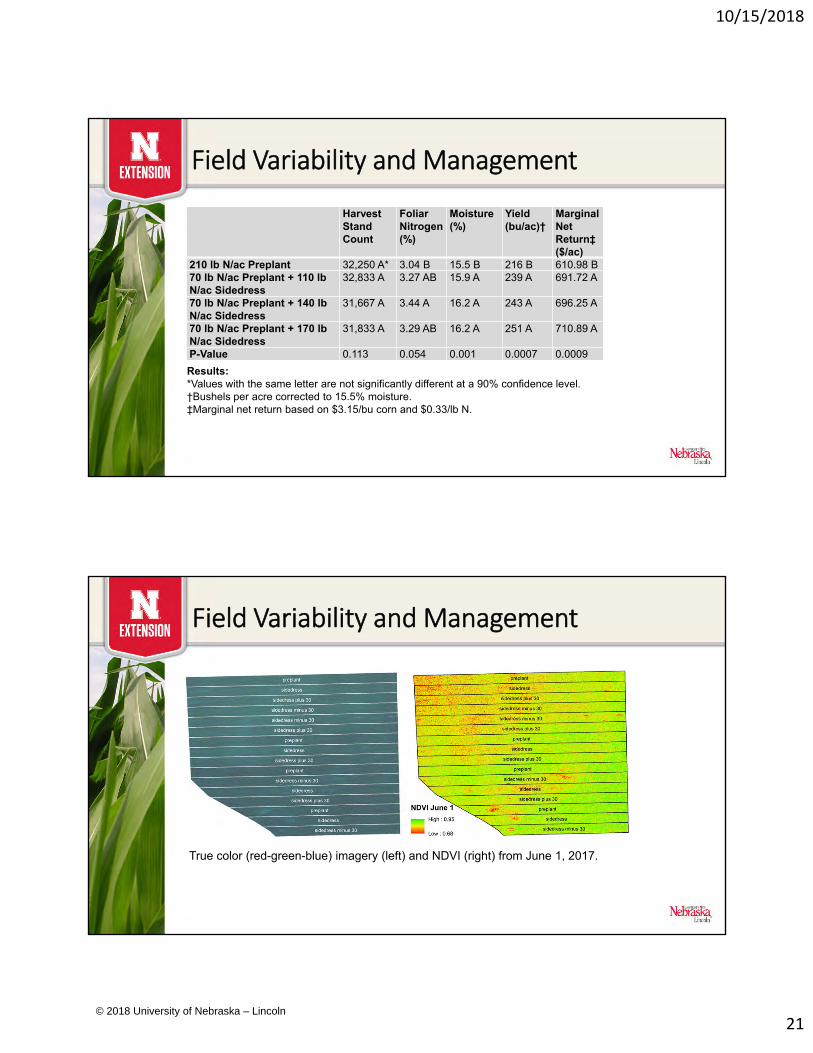
True color (red-green-blue) imagery (left) and NDVI (right) from June 1, 2017.
© 2018 University of Nebraska – Lincoln
10/15/2018
22
Field Variability and Management
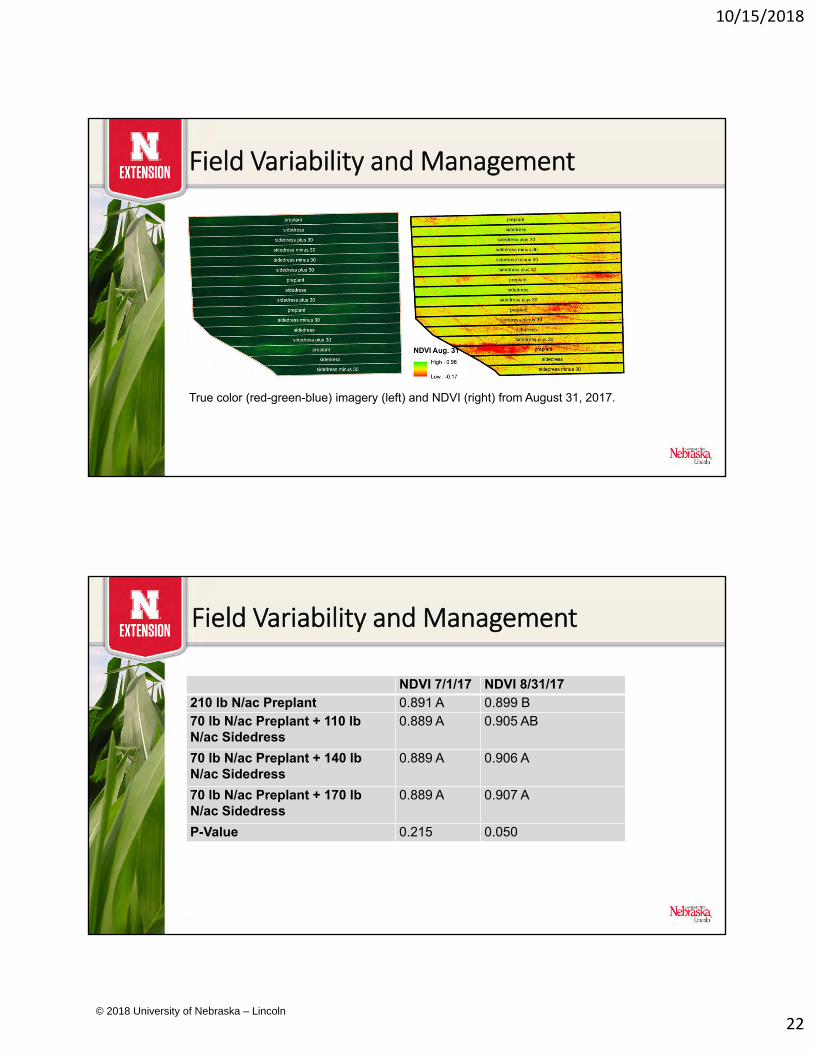
True color (red-green-blue) imagery (left) and NDVI (right) from August 31, 2017.
Field Variability and Management
NDVI 7/1/17 NDVI 8/31/17210 lb N/ac Preplant 0.891 A 0.899 B70 lb N/ac Preplant + 110 lbN/ac Sidedress
0.889 A 0.905 AB
70 lb N/ac Preplant + 140 lb N/ac Sidedress
0.889 A 0.906 A
70 lb N/ac Preplant + 170 lb N/ac Sidedress
0.889 A 0.907 A
P-Value 0.215 0.050
© 2018 University of Nebraska – Lincoln
10/15/2018
23
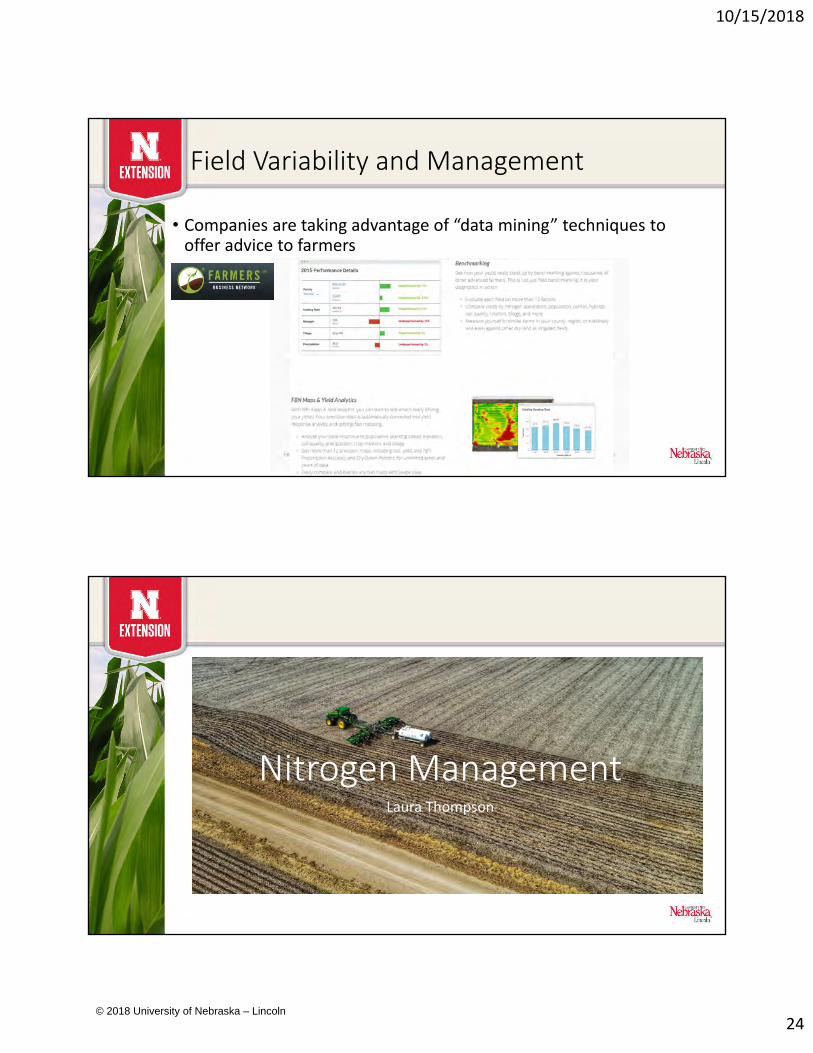
Field Variability and Management
Field Variability and Management
0
50
100
150
200
250
300
210 lb/ac Preplant 70 lb/ac Preplant + 110 lb/acSidedress
70 lb/ac Preplant + 140 lb/acSidedress
70 lb/ac Preplant + 170 lb/acSidedress
Yie
ld (
bu
/ac)
Moody
Fillmore
20 bu/ac difference
© 2018 University of Nebraska – Lincoln
10/15/2018
24
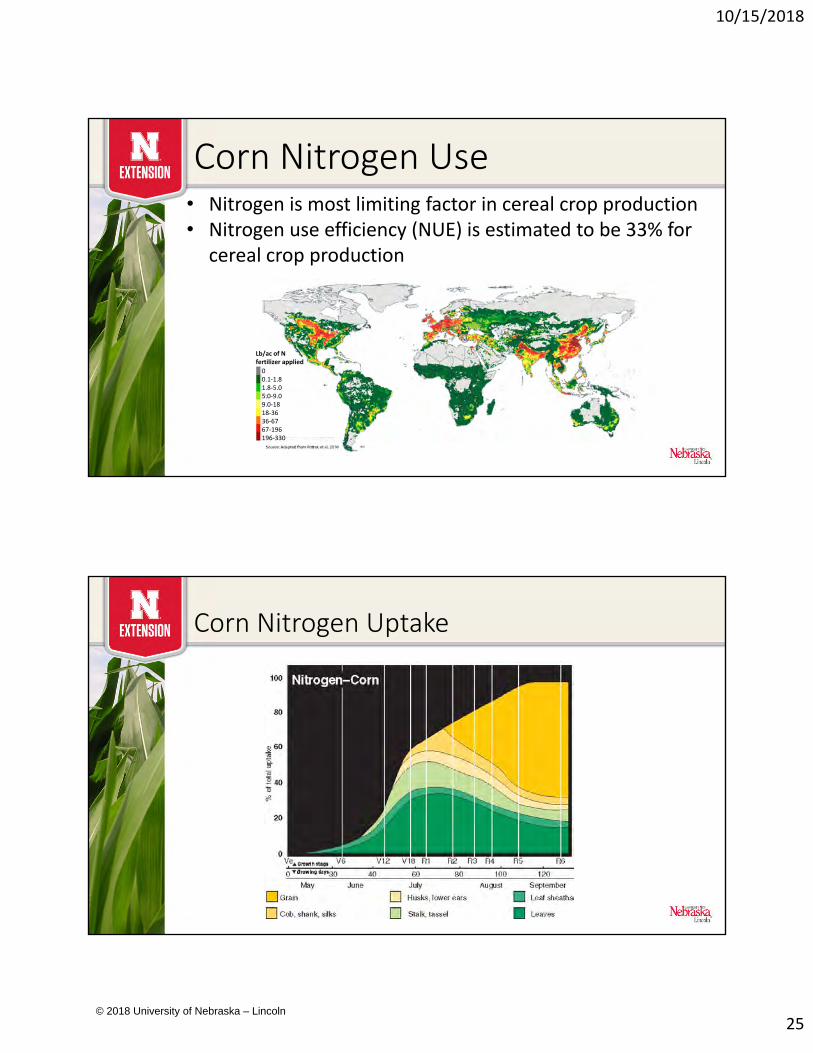
Field Variability and Management
• Companies are taking advantage of “data mining” techniques to offer advice to farmers
Nitrogen ManagementLaura Thompson
© 2018 University of Nebraska – Lincoln
10/15/2018
25
• Nitrogen is most limiting factor in cereal crop production• Nitrogen use efficiency (NUE) is estimated to be 33% for
cereal crop production
00.1‐1.81.8‐5.05.0‐9.09.0‐1818‐3636‐6767‐196196‐330
Lb/ac of N fertilizer applied
Corn Nitrogen Use
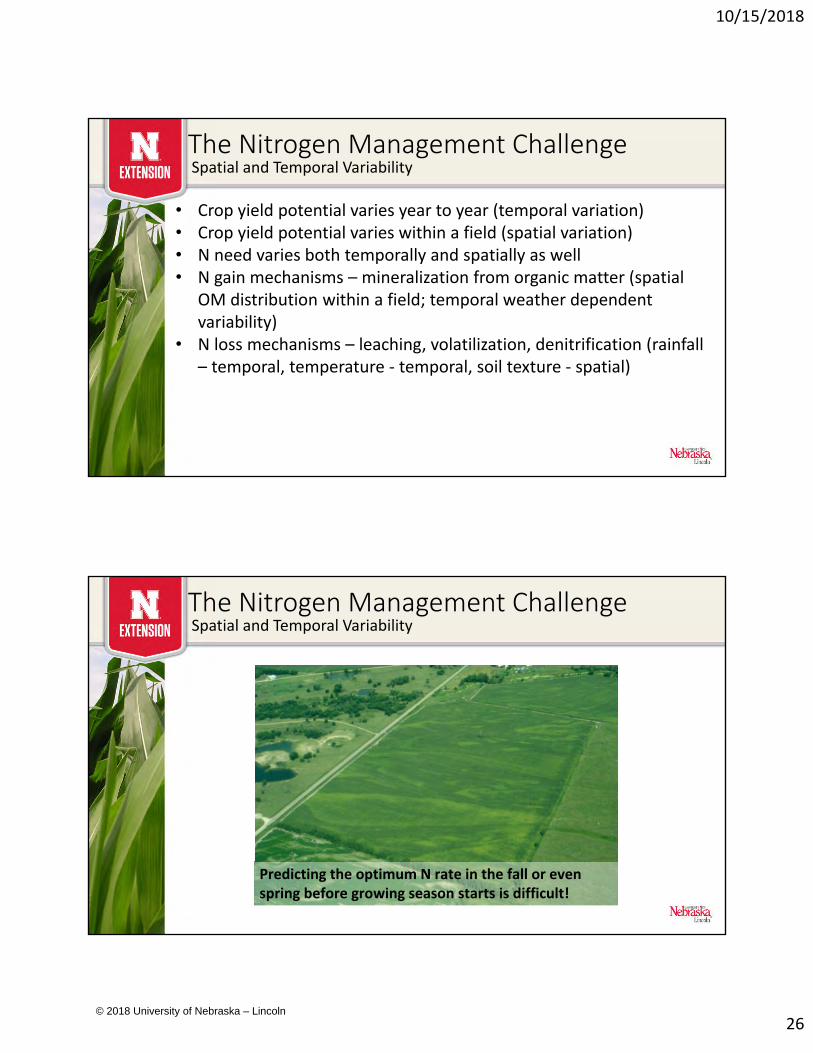
Corn Nitrogen Uptake
© 2018 University of Nebraska – Lincoln
10/15/2018
26
The Nitrogen Management Challenge
• Crop yield potential varies year to year (temporal variation)• Crop yield potential varies within a field (spatial variation)• N need varies both temporally and spatially as well• N gain mechanisms – mineralization from organic matter (spatial
OM distribution within a field; temporal weather dependent variability)
• N loss mechanisms – leaching, volatilization, denitrification (rainfall – temporal, temperature ‐ temporal, soil texture ‐ spatial)
Spatial and Temporal Variability
The Nitrogen Management ChallengeSpatial and Temporal Variability
Predicting the optimum N rate in the fall or even spring before growing season starts is difficult!
© 2018 University of Nebraska – Lincoln
10/15/2018
27
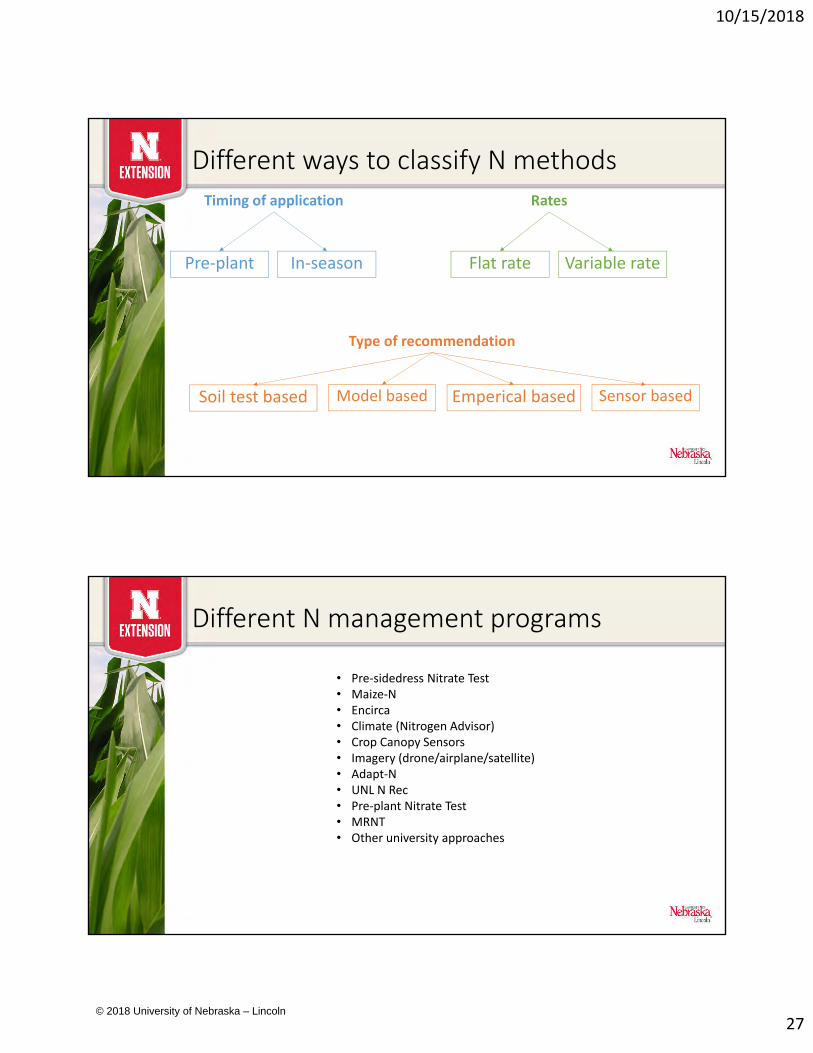
Different ways to classify N methodsTiming of application
Pre‐plant In‐season
Rates
Flat rate Variable rate
Type of recommendation
Soil test based Model based Sensor basedEmperical based
Different N management programs
• Pre‐sidedress Nitrate Test• Maize‐N• Encirca• Climate (Nitrogen Advisor)• Crop Canopy Sensors• Imagery (drone/airplane/satellite)• Adapt‐N• UNL N Rec• Pre‐plant Nitrate Test• MRNT• Other university approaches
© 2018 University of Nebraska – Lincoln
10/15/2018
28
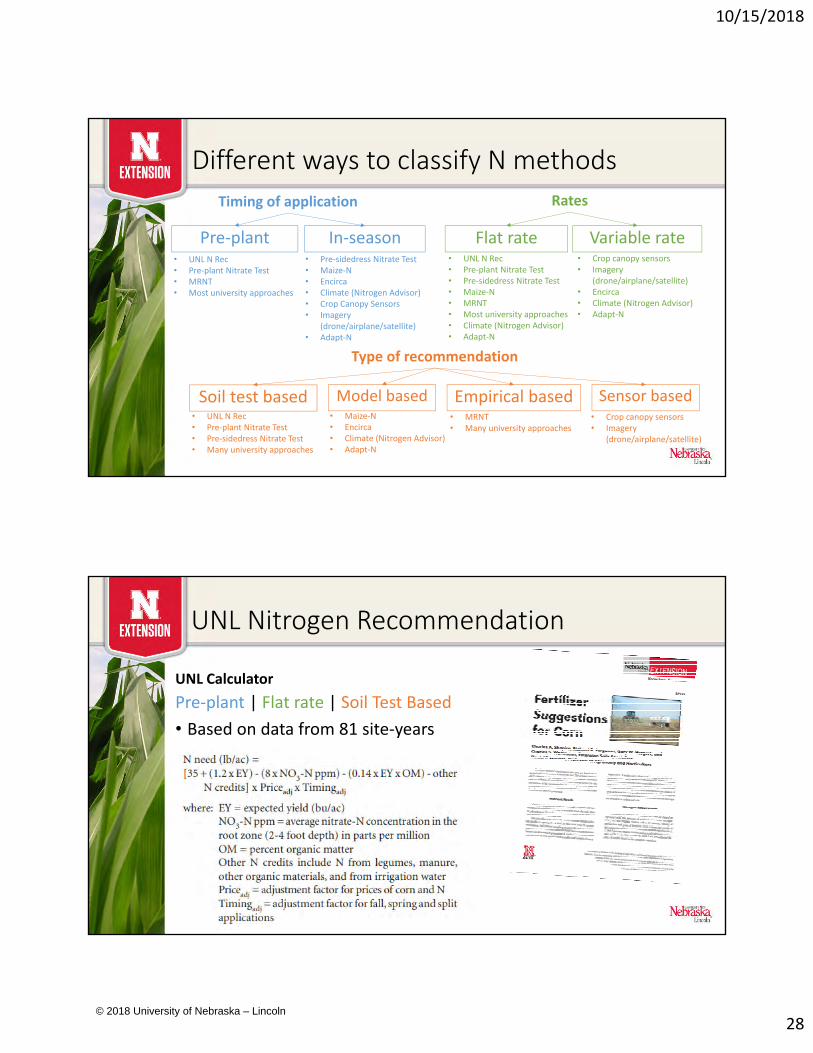
Different ways to classify N methods
Timing of application
Pre‐plant In‐season
Rates
Flat rate Variable rate
Type of recommendation
Soil test based Model based Sensor basedEmpirical based• Crop canopy sensors• Imagery
(drone/airplane/satellite)
• UNL N Rec• Pre‐plant Nitrate Test• Pre‐sidedress Nitrate Test• Many university approaches
• Maize‐N• Encirca• Climate (Nitrogen Advisor)• Adapt‐N
• MRNT• Many university approaches
• UNL N Rec• Pre‐plant Nitrate Test• Pre‐sidedress Nitrate Test• Maize‐N• MRNT• Most university approaches• Climate (Nitrogen Advisor)• Adapt‐N
• Crop canopy sensors• Imagery
(drone/airplane/satellite)• Encirca• Climate (Nitrogen Advisor)• Adapt‐N
• UNL N Rec• Pre‐plant Nitrate Test• MRNT• Most university approaches
• Pre‐sidedress Nitrate Test• Maize‐N• Encirca• Climate (Nitrogen Advisor)• Crop Canopy Sensors• Imagery
(drone/airplane/satellite)• Adapt‐N
UNL Nitrogen Recommendation
UNL Calculator
Pre‐plant | Flat rate | Soil Test Based
• Based on data from 81 site‐years
© 2018 University of Nebraska – Lincoln
10/15/2018
29
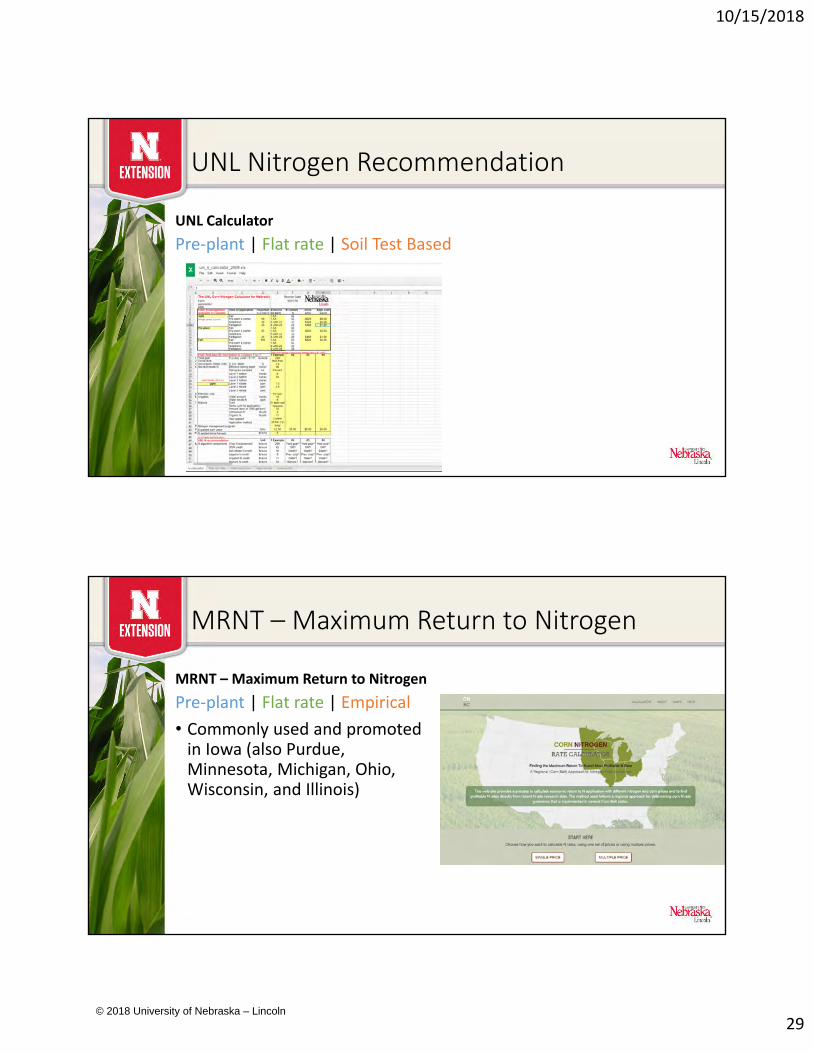
UNL Nitrogen Recommendation
UNL Calculator
Pre‐plant | Flat rate | Soil Test Based
MRNT – Maximum Return to Nitrogen
MRNT – Maximum Return to Nitrogen
Pre‐plant | Flat rate | Empirical
• Commonly used and promoted in Iowa (also Purdue, Minnesota, Michigan, Ohio, Wisconsin, and Illinois)
© 2018 University of Nebraska – Lincoln
10/15/2018
30
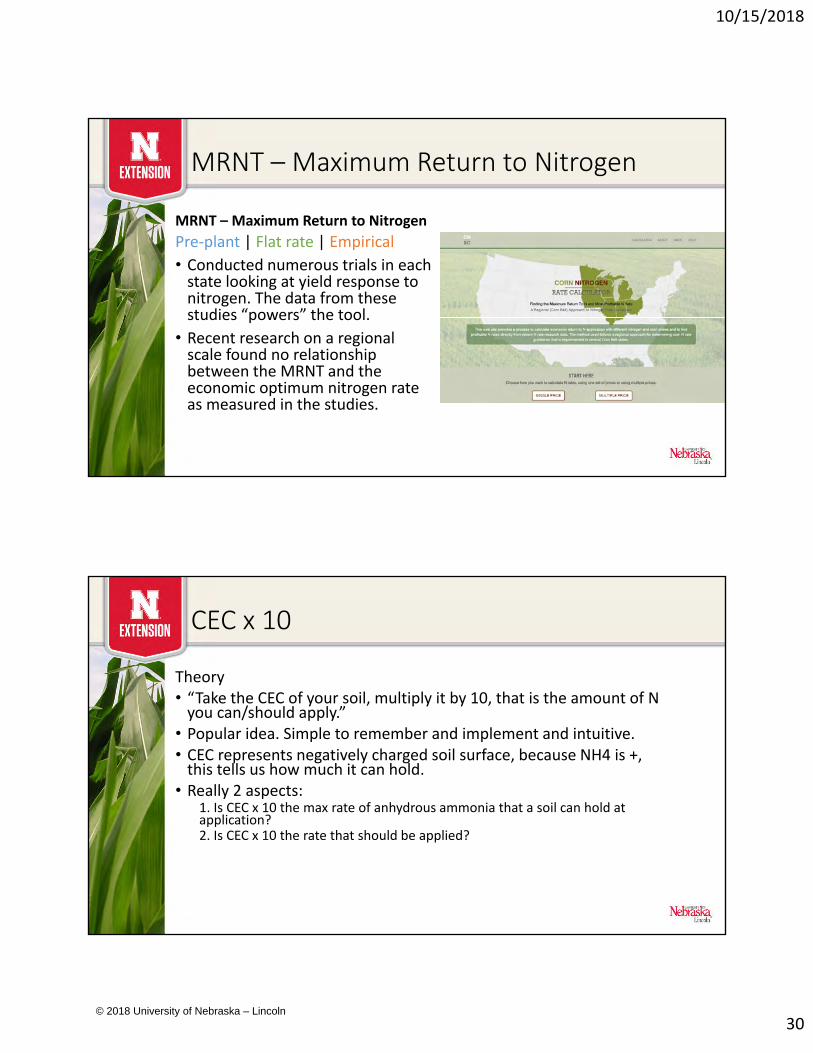
MRNT – Maximum Return to Nitrogen
MRNT – Maximum Return to Nitrogen
Pre‐plant | Flat rate | Empirical
• Conducted numerous trials in each state looking at yield response to nitrogen. The data from these studies “powers” the tool.
• Recent research on a regional scale found no relationship between the MRNT and the economic optimum nitrogen rate as measured in the studies.
CEC x 10
Theory• “Take the CEC of your soil, multiply it by 10, that is the amount of N you can/should apply.”
• Popular idea. Simple to remember and implement and intuitive.• CEC represents negatively charged soil surface, because NH4 is +, this tells us how much it can hold.
• Really 2 aspects:1. Is CEC x 10 the max rate of anhydrous ammonia that a soil can hold at application?2. Is CEC x 10 the rate that should be applied?
© 2018 University of Nebraska – Lincoln
10/15/2018
31
CEC x 10
1. Is CEC x 10 the max rate of anhydrous ammonia that a soil can hold at application?
• Not necessarily.
• Many factors impact including temperature and pH.
• Some studies have shown good correlation between CEC and NH3 retained by soil.Others have shown poor correlation.
• The application of NH3 results in an increase in the effective CEC of the soil at the site ofadsorption, caused by the increase in pH from the alkaline NH3, which results in an increase in adsorption capacity for the ammonium
• One study found on sandy soils, the amount of NH3 retained was CEC x 4.
• Effective CEC of a soil changes with its pH. Addition of NH3 raises soil pH and loss of NH3lowers it. Relationship between NH3, sorption and CEC is not quantitative.
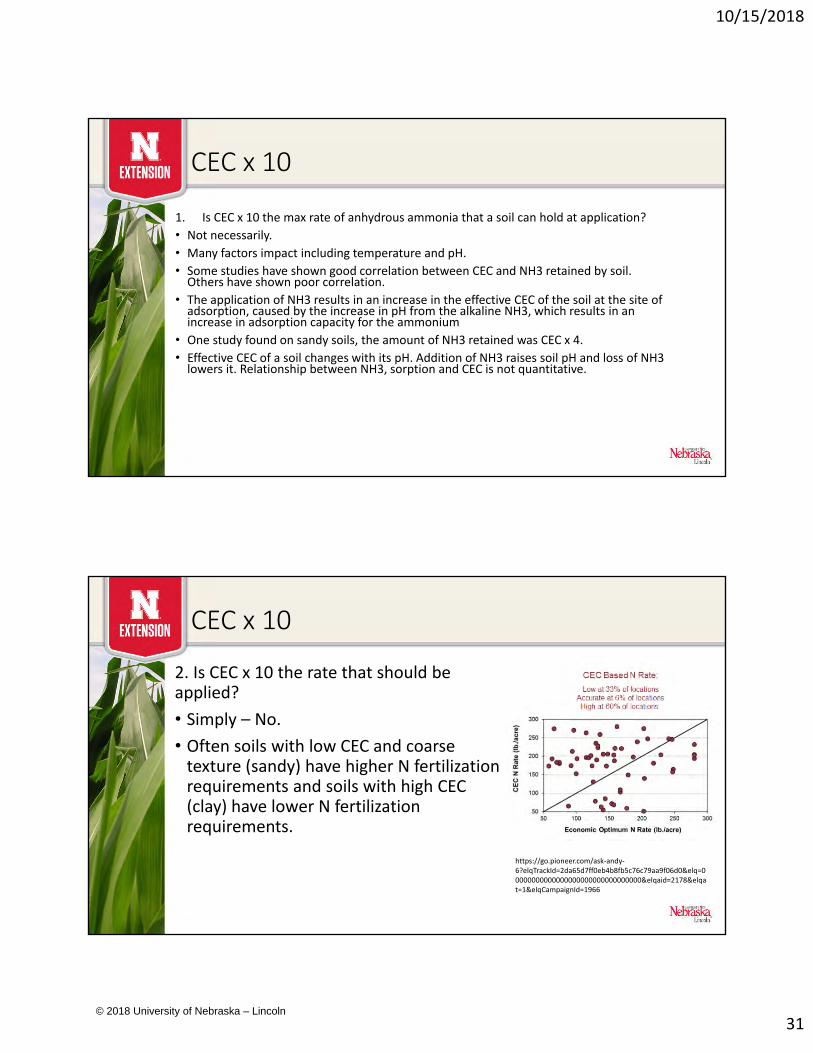
CEC x 10
2. Is CEC x 10 the rate that should beapplied?
• Simply – No.
• Often soils with low CEC and coarsetexture (sandy) have higher N fertilizationrequirements and soils with high CEC(clay) have lower N fertilizationrequirements.
https://go.pioneer.com/ask‐andy‐6?elqTrackId=2da65d7ff0eb4b8fb5c76c79aa9f06d0&elq=00000000000000000000000000000000&elqaid=2178&elqat=1&elqCampaignId=1966
© 2018 University of Nebraska – Lincoln
10/15/2018
32
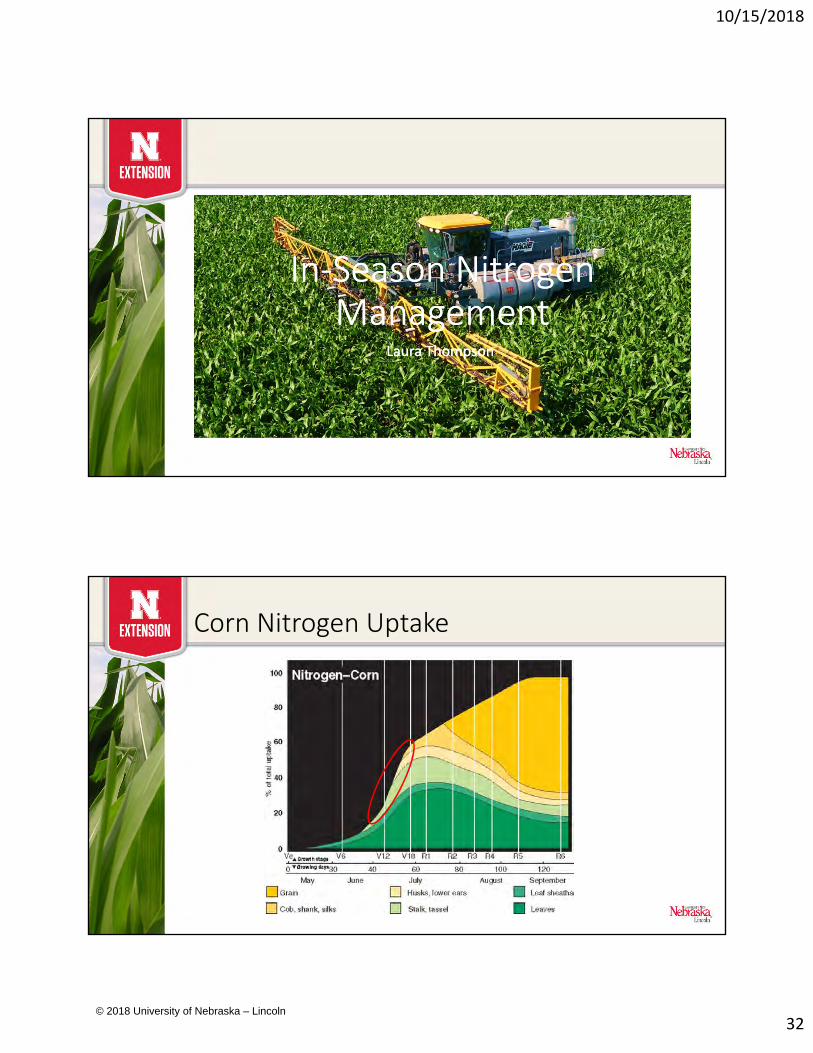
In‐Season Nitrogen Management
In‐Season Nitrogen Management
Laura ThompsonLaura Thompson
Corn Nitrogen Uptake
© 2018 University of Nebraska – Lincoln
10/15/2018
33
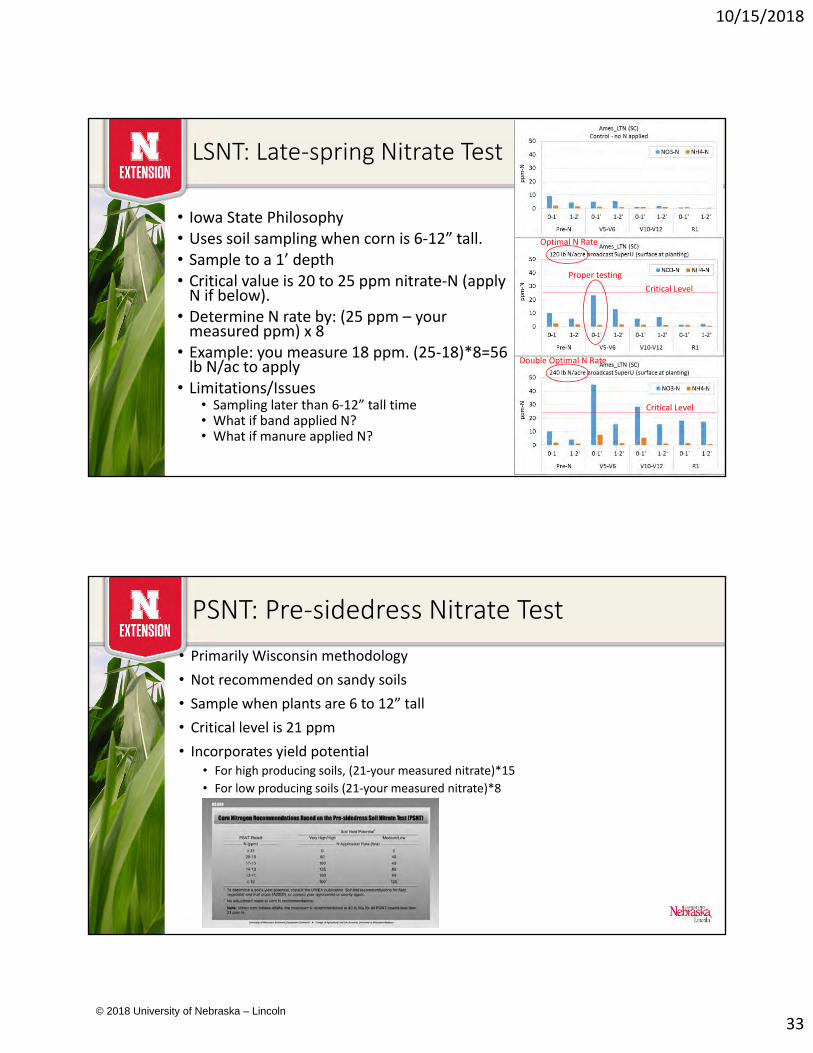
LSNT: Late‐spring Nitrate Test
• Iowa State Philosophy• Uses soil sampling when corn is 6‐12” tall.• Sample to a 1’ depth• Critical value is 20 to 25 ppm nitrate‐N (apply N if below).
• Determine N rate by: (25 ppm – your measured ppm) x 8
• Example: you measure 18 ppm. (25‐18)*8=56 lb N/ac to apply
• Limitations/Issues• Sampling later than 6‐12” tall time• What if band applied N?• What if manure applied N?
Proper testing
Optimal N Rate
Double Optimal N Rate
Critical Level
Critical Level
PSNT: Pre‐sidedress Nitrate Test
• Primarily Wisconsin methodology
• Not recommended on sandy soils
• Sample when plants are 6 to 12” tall
• Critical level is 21 ppm
• Incorporates yield potential• For high producing soils, (21‐your measured nitrate)*15
• For low producing soils (21‐your measured nitrate)*8
© 2018 University of Nebraska – Lincoln
10/15/2018
34
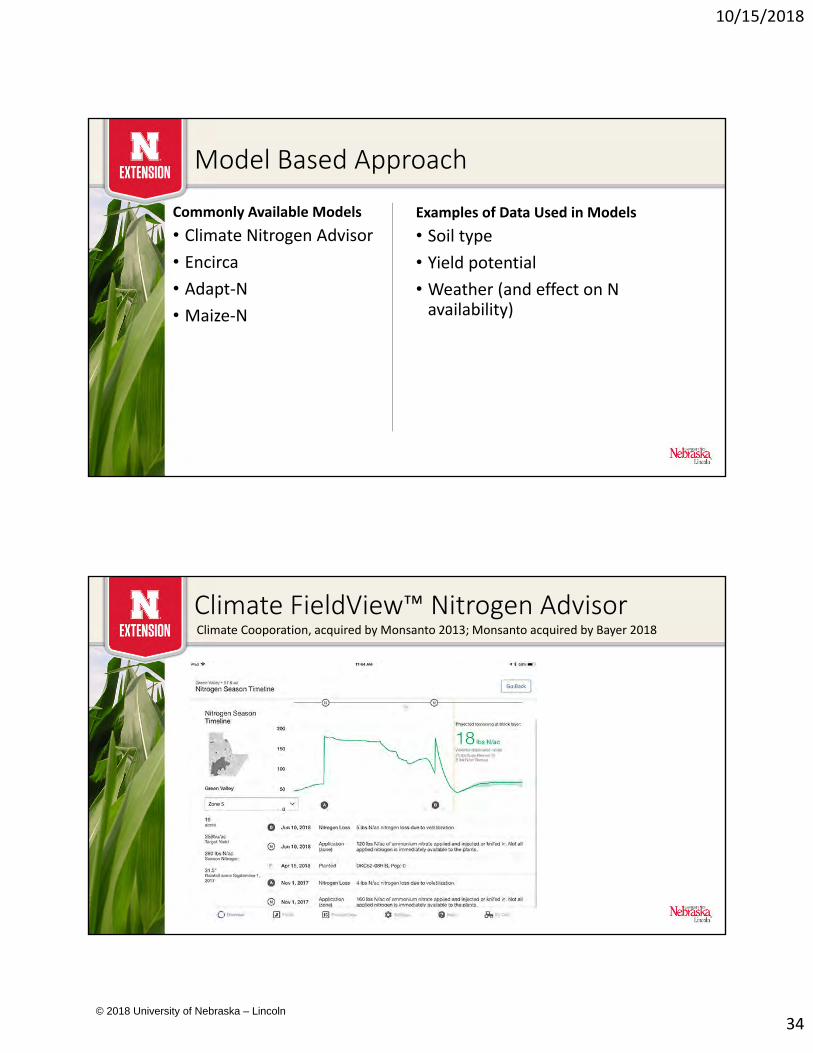
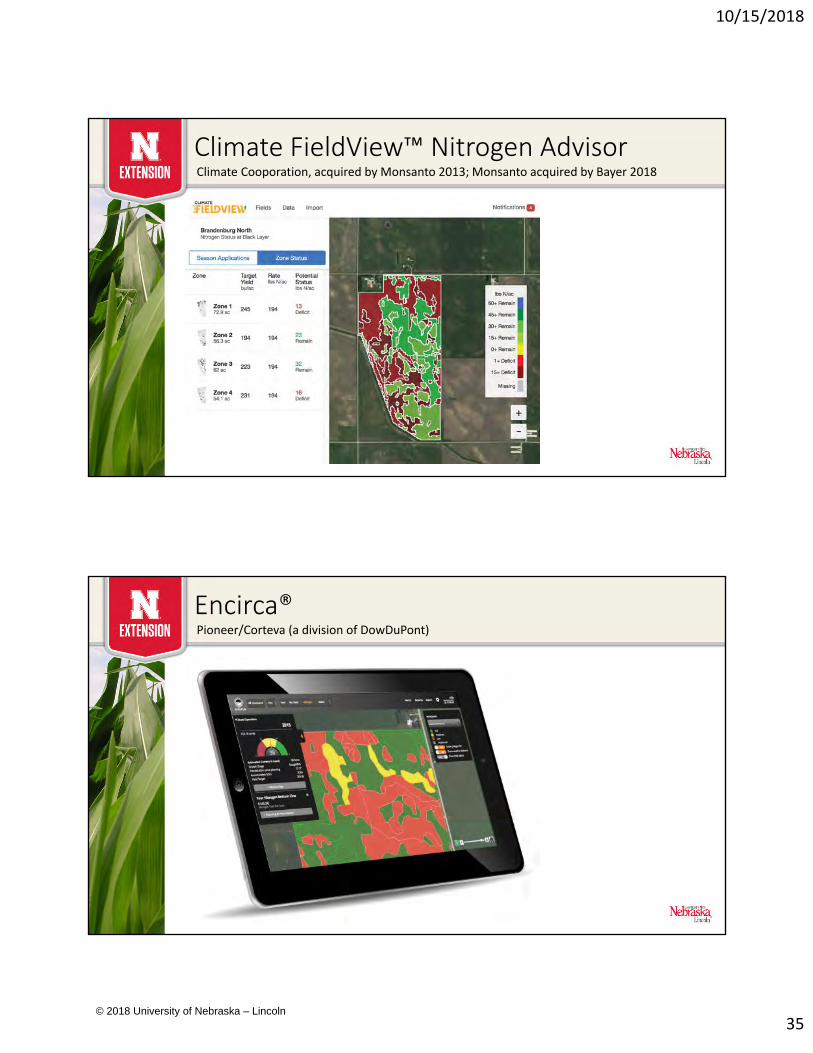
Model Based Approach
Commonly Available Models
• Climate Nitrogen Advisor
• Encirca
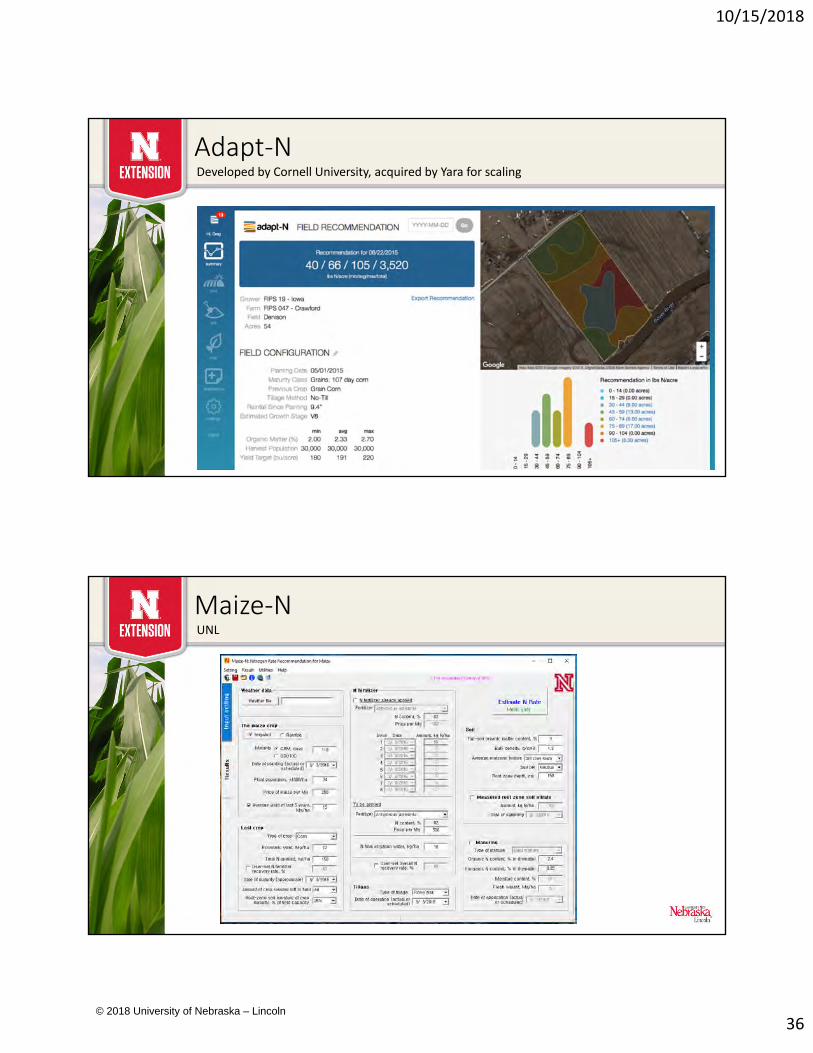
• Adapt‐N
• Maize‐N
Examples of Data Used in Models
• Soil type
• Yield potential
• Weather (and effect on N availability)
Climate FieldView™ Nitrogen AdvisorClimate Cooporation, acquired by Monsanto 2013; Monsanto acquired by Bayer 2018
© 2018 University of Nebraska – Lincoln
10/15/2018
35
Climate FieldView™ Nitrogen AdvisorClimate Cooporation, acquired by Monsanto 2013; Monsanto acquired by Bayer 2018
Encirca® Pioneer/Corteva (a division of DowDuPont)
© 2018 University of Nebraska – Lincoln
10/15/2018
36
Adapt‐NDeveloped by Cornell University, acquired by Yara for scaling
Maize‐NUNL
© 2018 University of Nebraska – Lincoln
10/15/2018
37
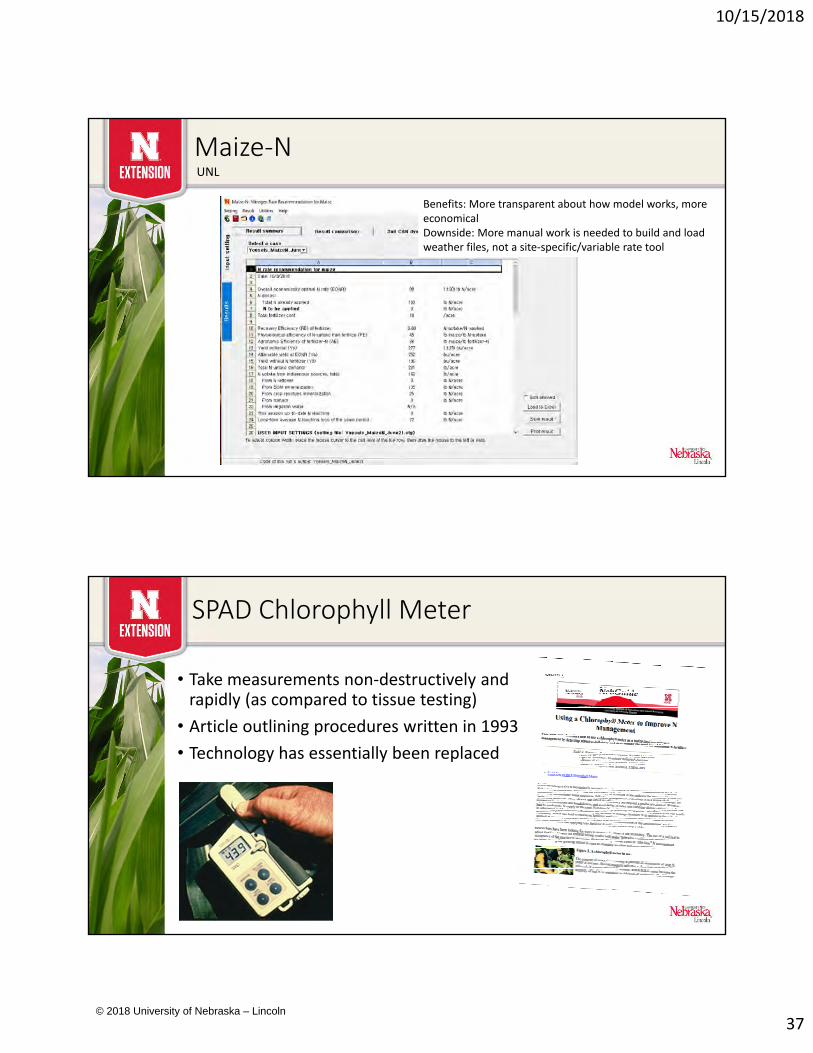
Maize‐NUNL
Benefits: More transparent about how model works, more economicalDownside: More manual work is needed to build and load weather files, not a site‐specific/variable rate tool
SPAD Chlorophyll Meter
• Take measurements non‐destructively and rapidly (as compared to tissue testing)
• Article outlining procedures written in 1993
• Technology has essentially been replaced
© 2018 University of Nebraska – Lincoln
10/15/2018
38
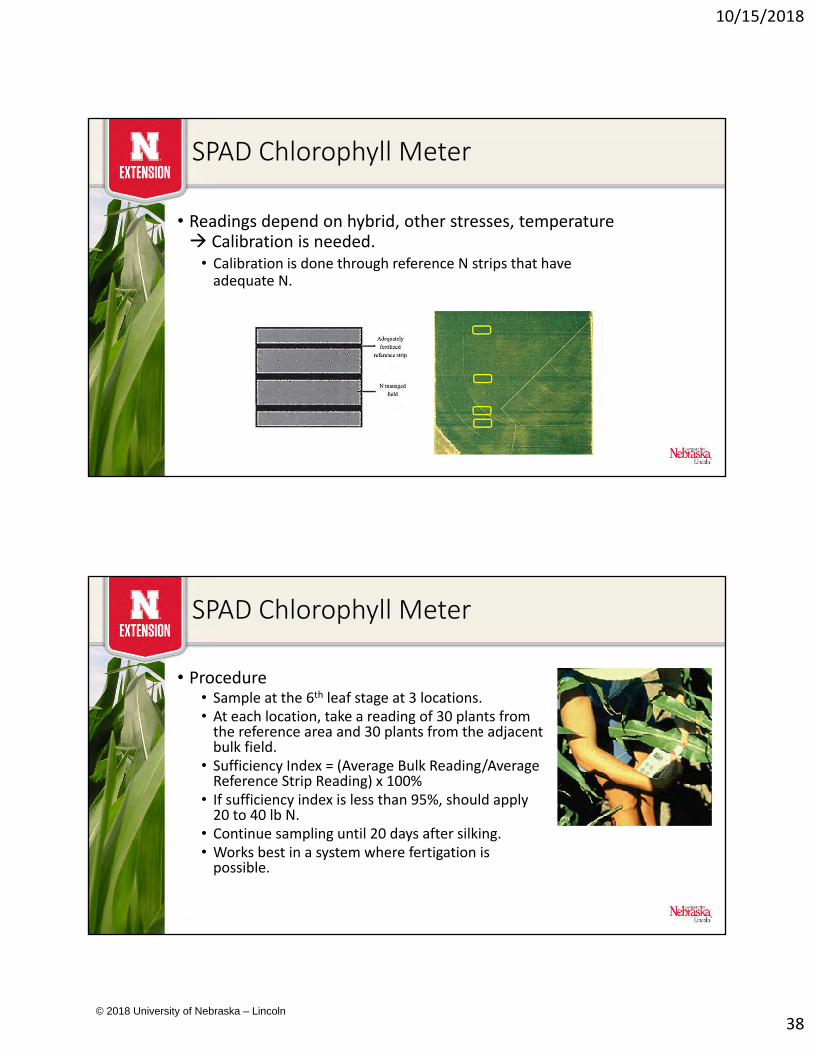
SPAD Chlorophyll Meter
• Readings depend on hybrid, other stresses, temperature Calibration is needed.
• Calibration is done through reference N strips that have adequate N.
SPAD Chlorophyll Meter
• Procedure• Sample at the 6th leaf stage at 3 locations. • At each location, take a reading of 30 plants from the reference area and 30 plants from the adjacent bulk field.
• Sufficiency Index = (Average Bulk Reading/AverageReference Strip Reading) x 100%
• If sufficiency index is less than 95%, should apply 20 to 40 lb N.
• Continue sampling until 20 days after silking.• Works best in a system where fertigation is possible.
© 2018 University of Nebraska – Lincoln
10/15/2018
39
Sensor Based
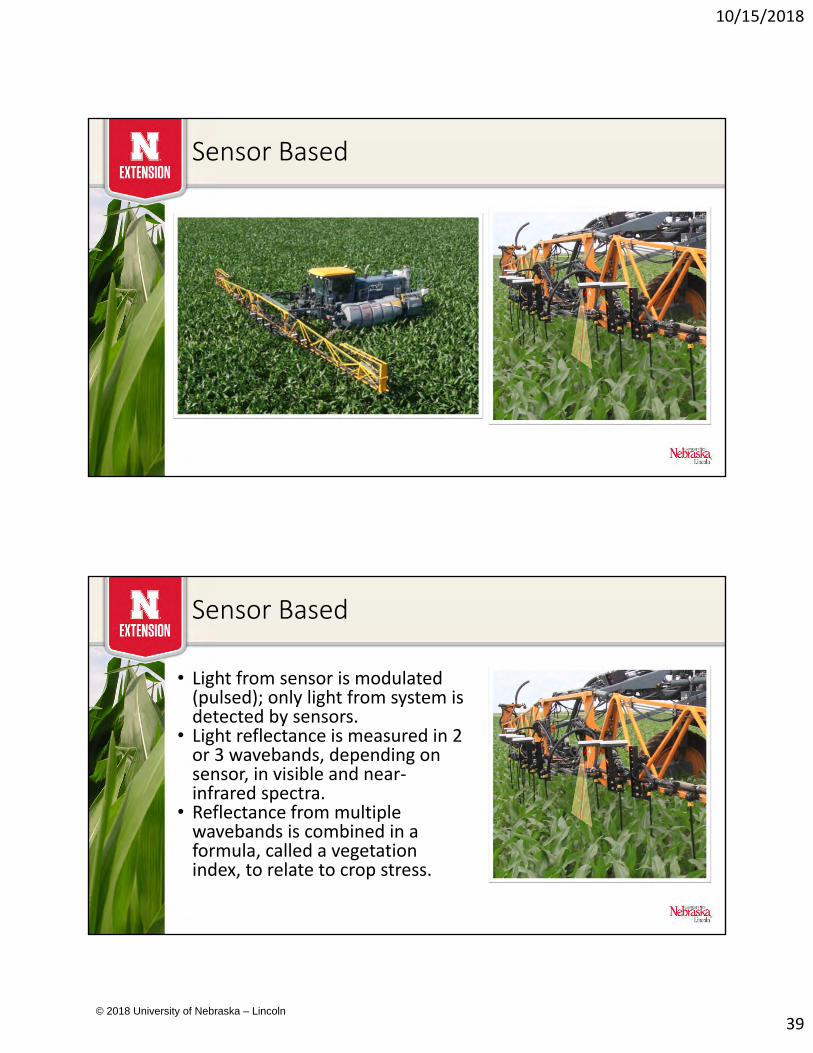
Sensor Based
• Light from sensor is modulated (pulsed); only light from system is detected by sensors.
• Light reflectance is measured in 2 or 3 wavebands, depending on sensor, in visible and near‐infrared spectra.
• Reflectance from multiple wavebands is combined in a formula, called a vegetation index, to relate to crop stress.
© 2018 University of Nebraska – Lincoln
10/15/2018
40
Sensor Based
Sensor Based
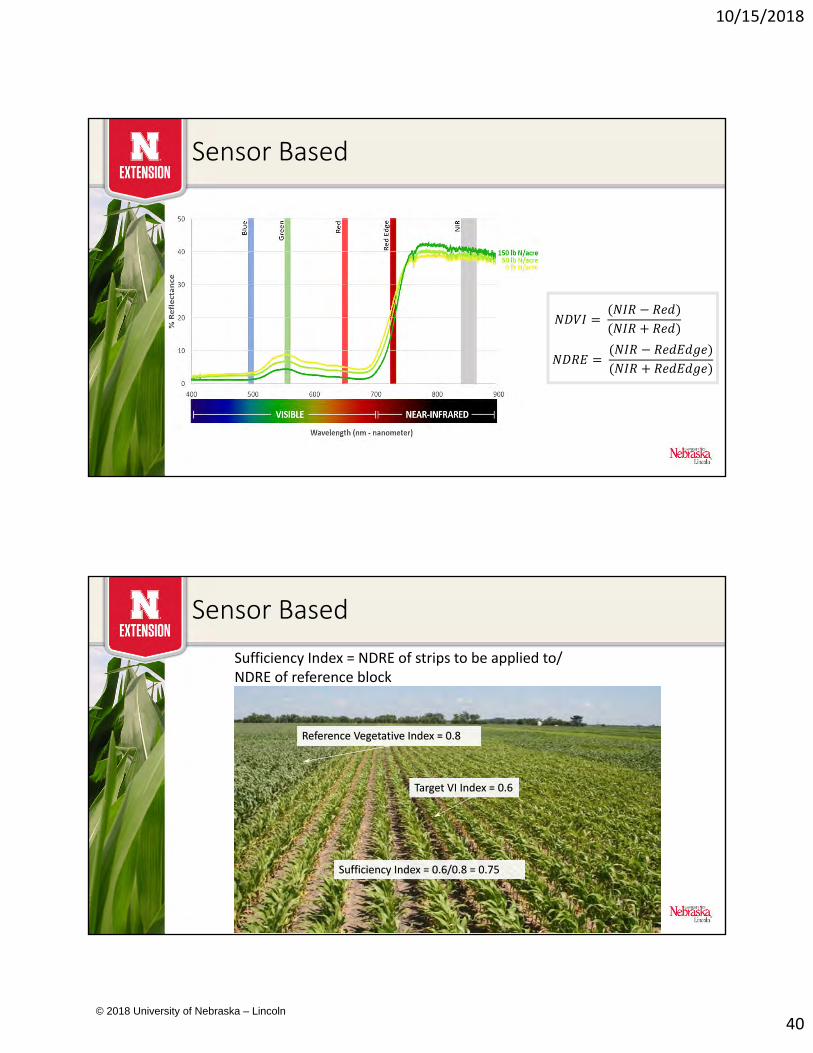
Sufficiency Index = 0.6/0.8 = 0.75Sufficiency Index = 0.6/0.8 = 0.75
Reference Vegetative Index = 0.8Reference Vegetative Index = 0.8
Target VI Index = 0.6Target VI Index = 0.6
Sufficiency Index = NDRE of strips to be applied to/ NDRE of reference block
© 2018 University of Nebraska – Lincoln
10/15/2018
41
Sensor Based
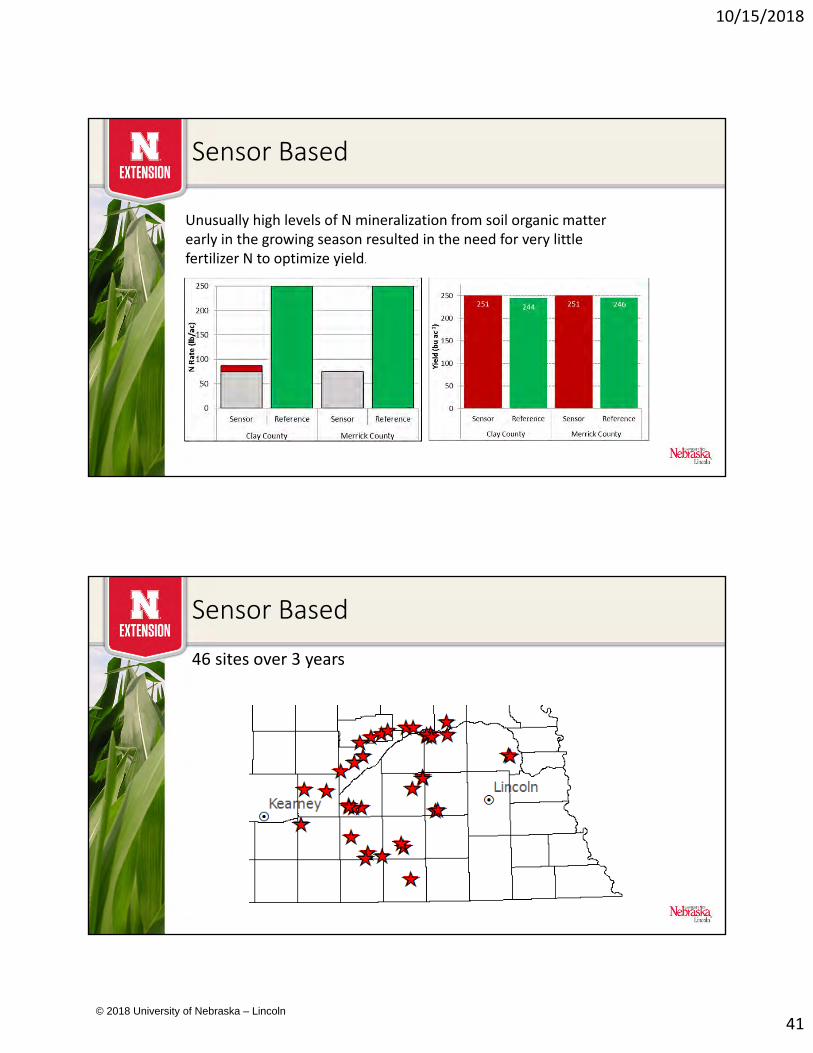
Unusually high levels of N mineralization from soil organic matter early in the growing season resulted in the need for very little fertilizer N to optimize yield.
Sensor Based
46 sites over 3 years
© 2018 University of Nebraska – Lincoln
10/15/2018
42
Watch it in action…
• https://www.youtube.com/watch?v=dcIPNEbYTIM
Sensor Based
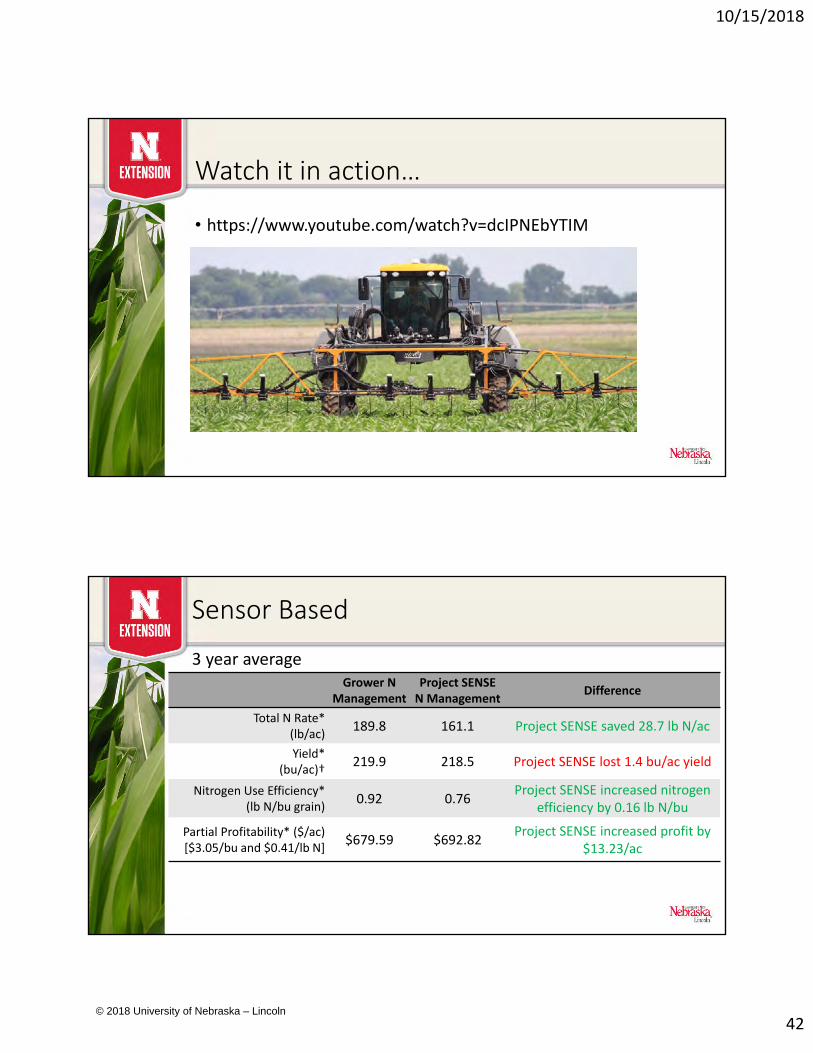
3 year averageGrower N
ManagementProject SENSE N Management
Difference
Total N Rate*(lb/ac)
189.8 161.1 Project SENSE saved 28.7 lb N/ac
Yield*(bu/ac)†
219.9 218.5 Project SENSE lost 1.4 bu/ac yield
Nitrogen Use Efficiency* (lb N/bu grain)
0.92 0.76Project SENSE increased nitrogen
efficiency by 0.16 lb N/bu
Partial Profitability* ($/ac)[$3.05/bu and $0.41/lb N]
$679.59 $692.82Project SENSE increased profit by
$13.23/ac
© 2018 University of Nebraska – Lincoln
10/15/2018
43
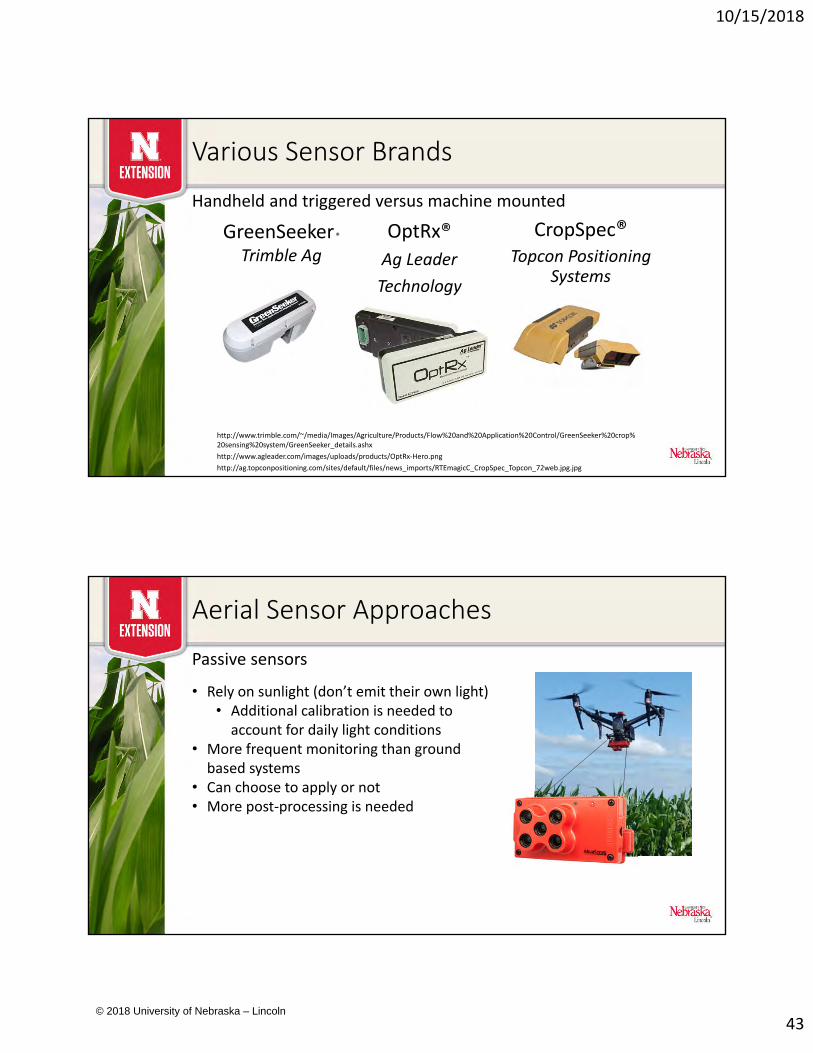
Various Sensor Brands
Handheld and triggered versus machine mounted
GreenSeeker®
Trimble Ag
http://www.trimble.com/~/media/Images/Agriculture/Products/Flow%20and%20Application%20Control/GreenSeeker%20crop%20sensing%20system/GreenSeeker_details.ashx
http://www.agleader.com/images/uploads/products/OptRx‐Hero.png
http://ag.topconpositioning.com/sites/default/files/news_imports/RTEmagicC_CropSpec_Topcon_72web.jpg.jpg
OptRx®
Ag Leader
Technology
CropSpec® Topcon Positioning
Systems
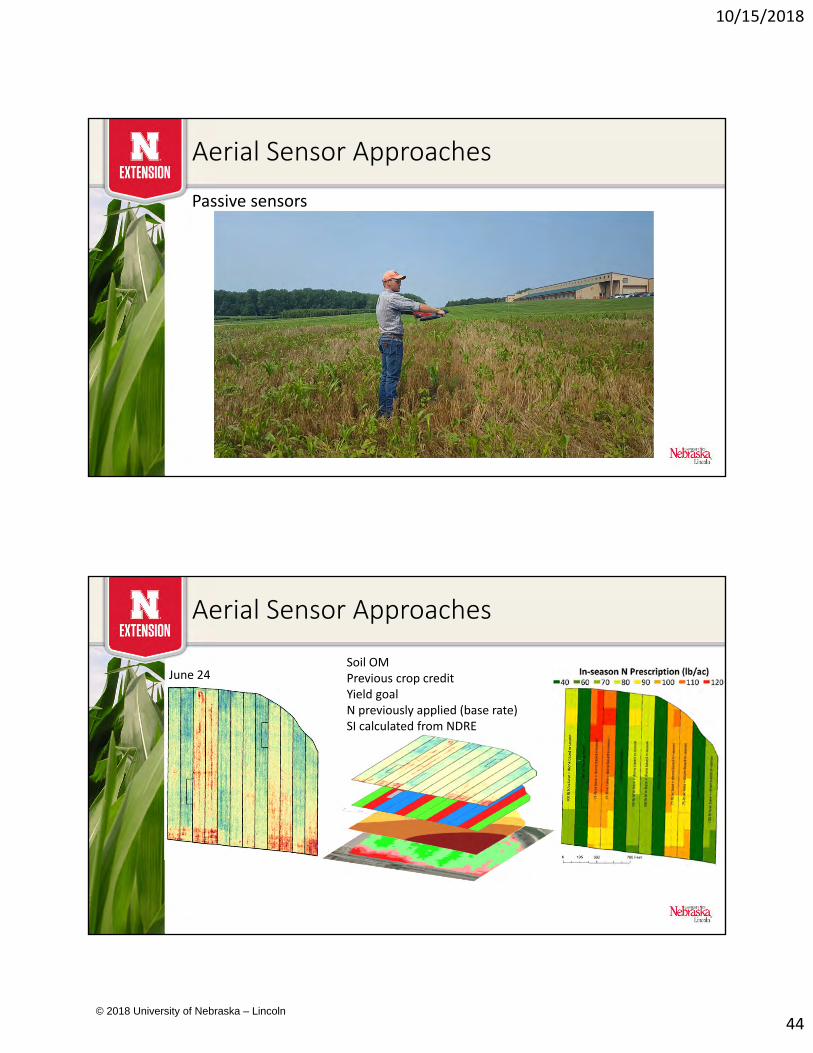
Aerial Sensor Approaches
Passive sensors
• Rely on sunlight (don’t emit their own light)• Additional calibration is needed to account for daily light conditions
• More frequent monitoring than ground based systems
• Can choose to apply or not• More post‐processing is needed
© 2018 University of Nebraska – Lincoln
10/15/2018
44
Aerial Sensor Approaches
Passive sensors
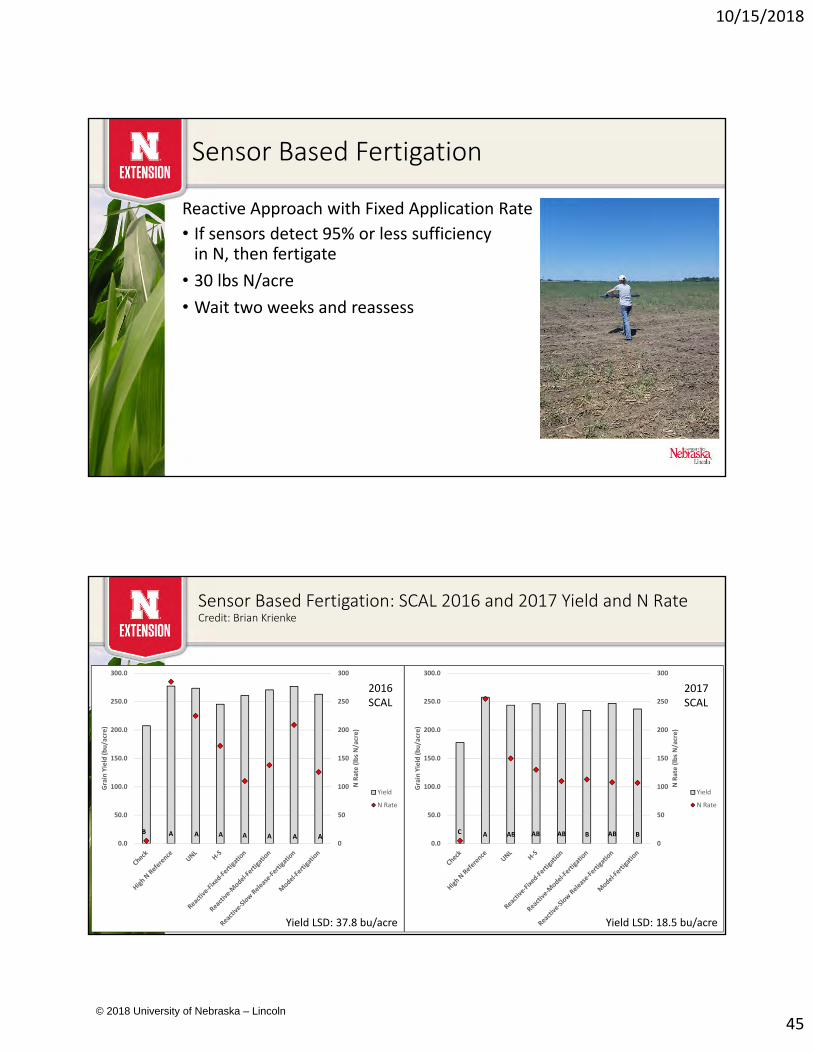
Aerial Sensor Approaches
June 24Soil OMPrevious crop creditYield goalN previously applied (base rate)SI calculated from NDRE
© 2018 University of Nebraska – Lincoln
10/15/2018
45
Sensor Based Fertigation
Reactive Approach with Fixed Application Rate
• If sensors detect 95% or less sufficiency in N, then fertigate
• 30 lbs N/acre
• Wait two weeks and reassess
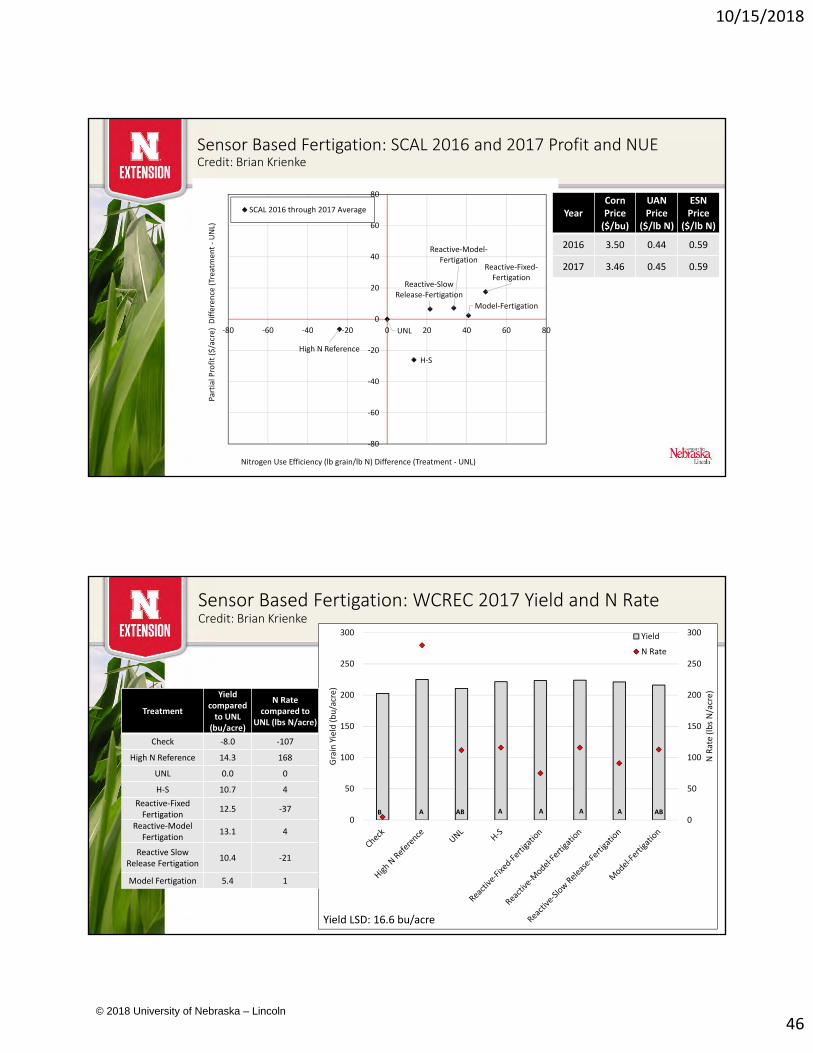
Sensor Based Fertigation: SCAL 2016 and 2017 Yield and N RateCredit: Brian Krienke
0
50
100
150
200
250
300
0.0
50.0
100.0
150.0
200.0
250.0
300.0
N Rate (lbs N/acre)
Grain Yield (bu/acre)
Yield
N Rate
B A A A A A A A
2016 SCAL
0
50
100
150
200
250
300
0.0
50.0
100.0
150.0
200.0
250.0
300.0N Rate (lbs N/acre)
Grain Yield (bu/acre)
Yield
N Rate
C A AB AB AB B AB B
2017 SCAL
Yield LSD: 18.5 bu/acreYield LSD: 37.8 bu/acre
© 2018 University of Nebraska – Lincoln
10/15/2018
46
Sensor Based Fertigation: SCAL 2016 and 2017 Profit and NUECredit: Brian Krienke
High N Reference
UNL
H‐S
Reactive‐Fixed‐Fertigation
Reactive‐Model‐Fertigation
Reactive‐Slow Release‐Fertigation
Model‐Fertigation
‐80
‐60
‐40
‐20
0
20
40
60
80
‐80 ‐60 ‐40 ‐20 0 20 40 60 80
Partial Profit ($/acre) D
ifference (Treatm
ent ‐UNL)
Nitrogen Use Efficiency (lb grain/lb N) Difference (Treatment ‐ UNL)
SCAL 2016 through 2017 Average YearCorn Price ($/bu)
UAN Price
($/lb N)
ESN Price
($/lb N)
2016 3.50 0.44 0.59
2017 3.46 0.45 0.59
0
50
100
150
200
250
300
0
50
100
150
200
250
300
N Rate (lbs N/acre)
Grain Yield (bu/acre)
Yield
N Rate
B A AB A A A A AB
Yield LSD: 16.6 bu/acre
Treatment
Yield compared to UNL
(bu/acre)
N Rate compared to
UNL (lbs N/acre)
Check ‐8.0 ‐107
High N Reference 14.3 168
UNL 0.0 0
H‐S 10.7 4
Reactive‐Fixed Fertigation
12.5 ‐37
Reactive‐Model Fertigation
13.1 4
Reactive Slow Release Fertigation
10.4 ‐21
Model Fertigation 5.4 1
Sensor Based Fertigation: WCREC 2017 Yield and N RateCredit: Brian Krienke
© 2018 University of Nebraska – Lincoln
10/15/2018
47
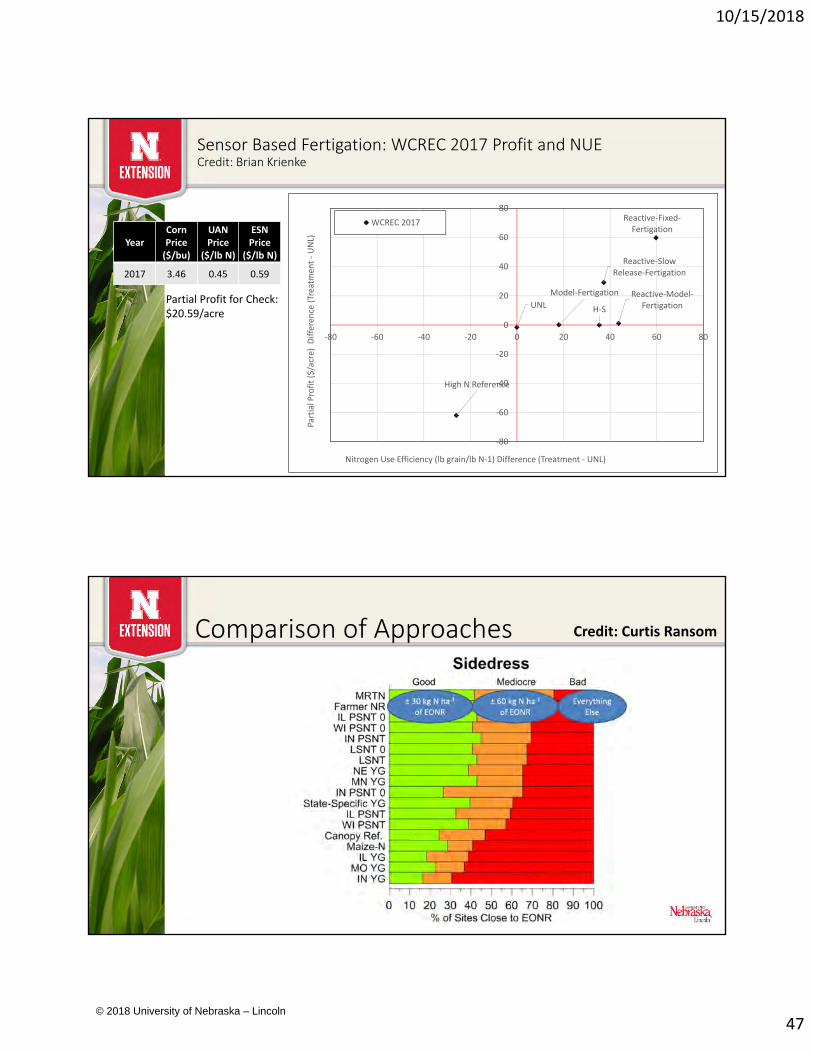
High N Reference
UNL H‐S
Reactive‐Fixed‐Fertigation
Reactive‐Model‐Fertigation
Reactive‐Slow Release‐Fertigation
Model‐Fertigation
‐80
‐60
‐40
‐20
0
20
40
60
80
‐80 ‐60 ‐40 ‐20 0 20 40 60 80
Partial Profit ($/acre) D
ifference (Treatm
ent ‐UNL)
Nitrogen Use Efficiency (lb grain/lb N‐1) Difference (Treatment ‐ UNL)
WCREC 2017
YearCorn Price ($/bu)
UAN Price
($/lb N)
ESN Price
($/lb N)
2017 3.46 0.45 0.59
Partial Profit for Check: $20.59/acre
Sensor Based Fertigation: WCREC 2017 Profit and NUECredit: Brian Krienke
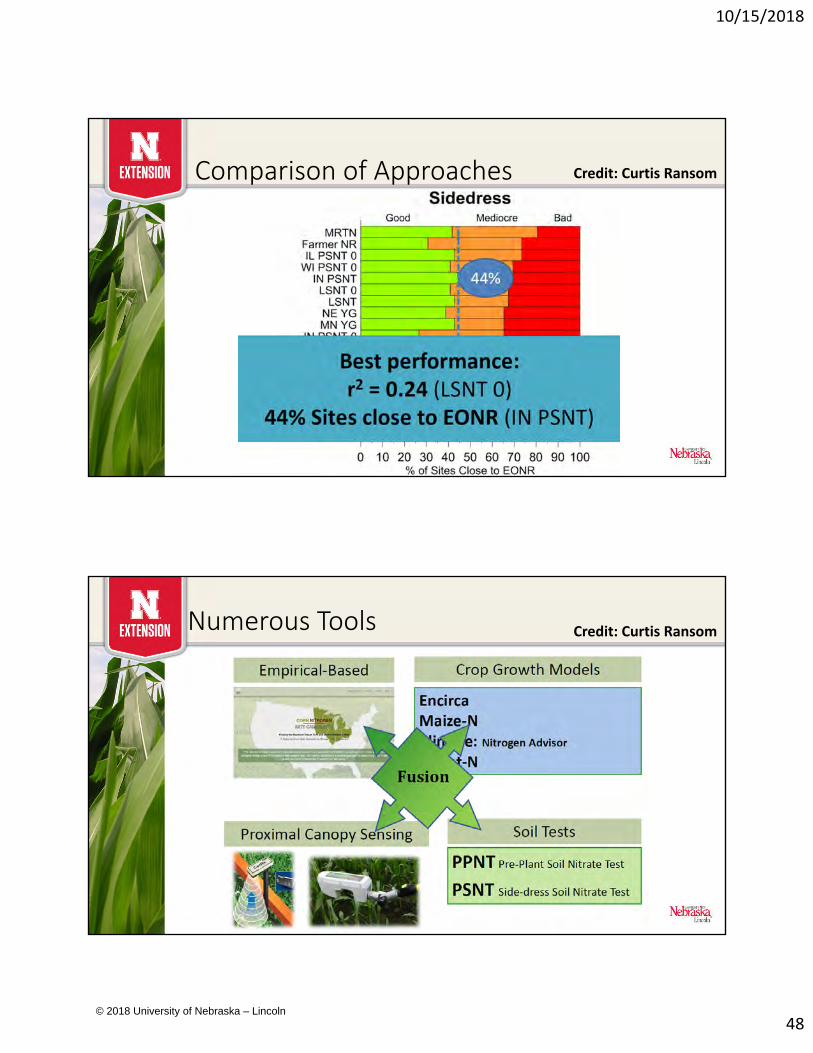
Comparison of Approaches Credit: Curtis Ransom
© 2018 University of Nebraska – Lincoln
10/15/2018
48
Comparison of Approaches Credit: Curtis Ransom
Numerous Tools Credit: Curtis Ransom
© 2018 University of Nebraska – Lincoln
10/15/2018
49
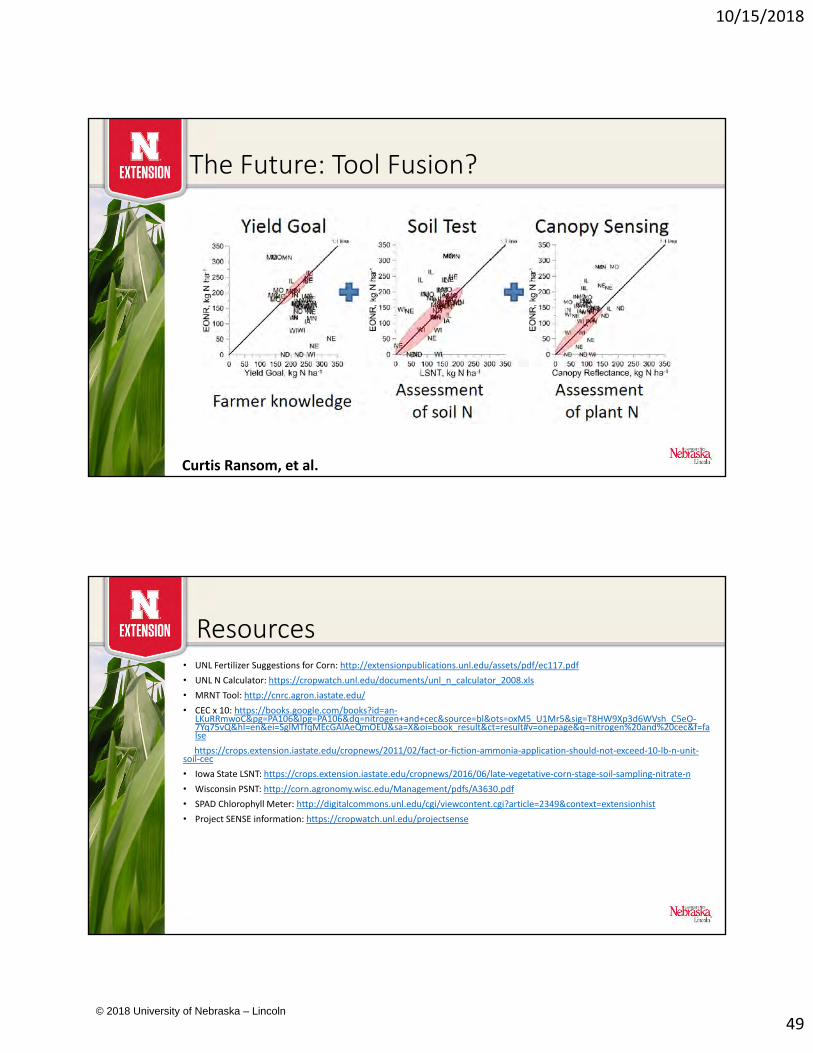
The Future: Tool Fusion?
Curtis Ransom, et al.
Resources• UNL Fertilizer Suggestions for Corn: http://extensionpublications.unl.edu/assets/pdf/ec117.pdf
• UNL N Calculator: https://cropwatch.unl.edu/documents/unl_n_calculator_2008.xls
• MRNT Tool: http://cnrc.agron.iastate.edu/
• CEC x 10: https://books.google.com/books?id=an‐LKuRRmwoC&pg=PA106&lpg=PA106&dq=nitrogen+and+cec&source=bl&ots=oxM5_U1Mr5&sig=T8HW9Xp3d6WVsh_C5eO‐7Yq75vQ&hl=en&ei=SglMTfqMEcGAlAeQmOEU&sa=X&oi=book_result&ct=result#v=onepage&q=nitrogen%20and%20cec&f=false
https://crops.extension.iastate.edu/cropnews/2011/02/fact‐or‐fiction‐ammonia‐application‐should‐not‐exceed‐10‐lb‐n‐unit‐soil‐cec
• Iowa State LSNT: https://crops.extension.iastate.edu/cropnews/2016/06/late‐vegetative‐corn‐stage‐soil‐sampling‐nitrate‐n
• Wisconsin PSNT: http://corn.agronomy.wisc.edu/Management/pdfs/A3630.pdf
• SPAD Chlorophyll Meter: http://digitalcommons.unl.edu/cgi/viewcontent.cgi?article=2349&context=extensionhist
• Project SENSE information: https://cropwatch.unl.edu/projectsense
© 2018 University of Nebraska – Lincoln
10/15/2018
50
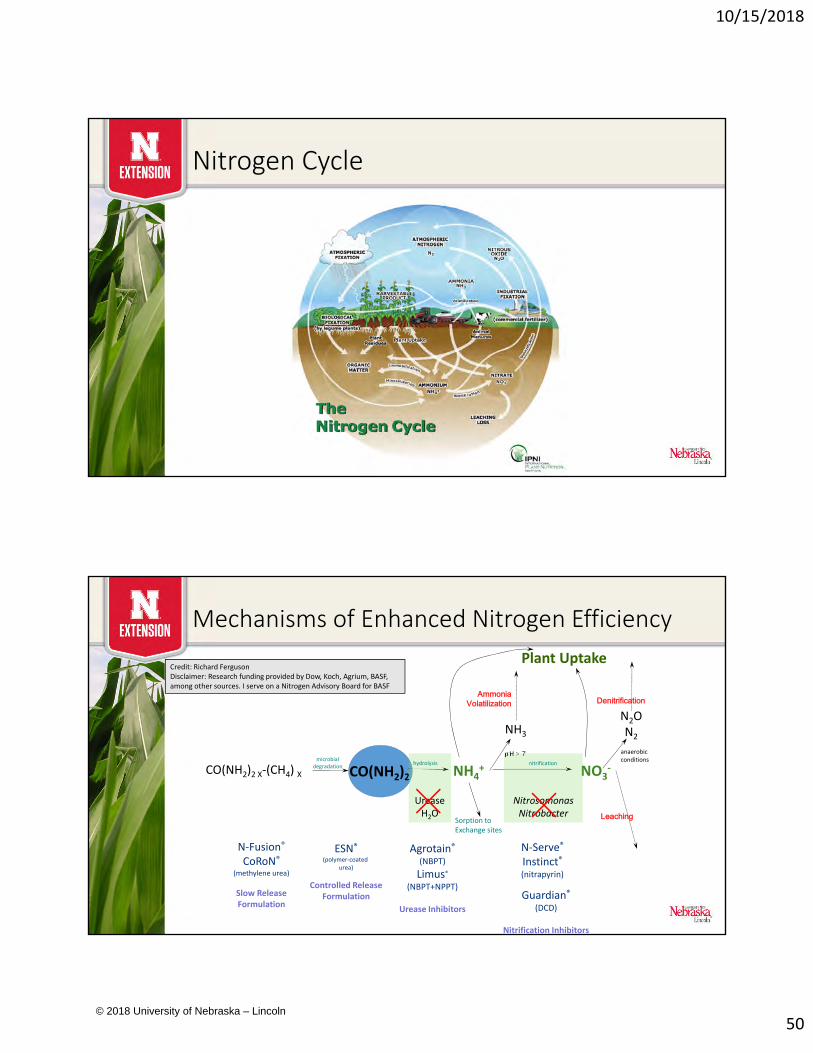
Nitrogen Cycle
ESN®
(polymer‐coated urea)
Controlled ReleaseFormulation
CO(NH2)2 NH4+ NO3
‐
pH > 7
NH3
AmmoniaVolatilization
N2ON2
UreaseH2O
NitrosomonasNitrobacter
hydrolysis nitrification
Denitrification
anaerobicconditions
Leaching
N‐Serve®
Instinct®
(nitrapyrin)
Guardian®
(DCD)
Nitrification Inhibitors
Agrotain®
(NBPT)
Limus®(NBPT+NPPT)
Urease Inhibitors
N‐Fusion®
CoRoN®
(methylene urea)
Slow ReleaseFormulation
CO(NH2)2 X‐(CH4) Xmicrobial
degradation
Plant Uptake
Sorption toExchange sites
Credit: Richard FergusonDisclaimer: Research funding provided by Dow, Koch, Agrium, BASF, among other sources. I serve on a Nitrogen Advisory Board for BASF
Mechanisms of Enhanced Nitrogen Efficiency
© 2018 University of Nebraska – Lincoln
10/15/2018
51
Nutrient Star
• http://nutrientstar.org/
Nutrient Diagnostics ‐Lab Analysis‐
Nathan Mueller
© 2018 University of Nebraska – Lincoln
10/15/2018
52
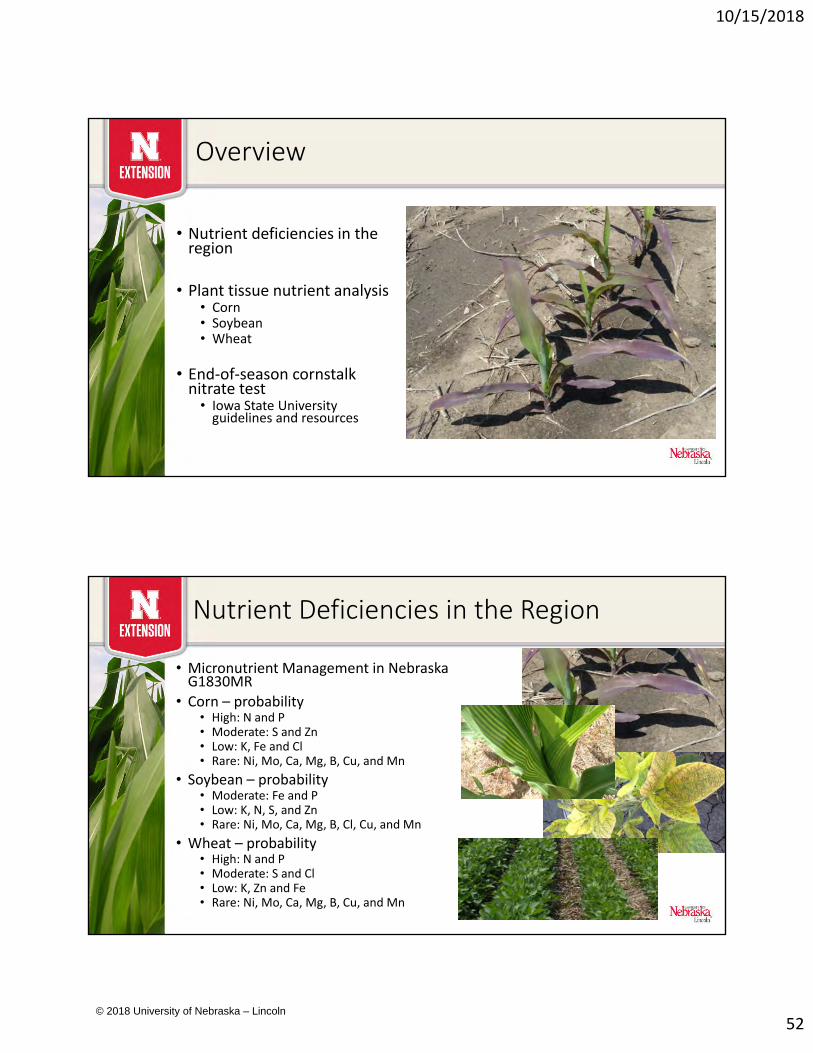
Overview
• Nutrient deficiencies in the region
• Plant tissue nutrient analysis• Corn• Soybean• Wheat
• End‐of‐season cornstalk nitrate test
• Iowa State University guidelines and resources
Nutrient Deficiencies in the Region
• Micronutrient Management in Nebraska G1830MR
• Corn – probability• High: N and P• Moderate: S and Zn• Low: K, Fe and Cl• Rare: Ni, Mo, Ca, Mg, B, Cu, and Mn
• Soybean – probability• Moderate: Fe and P• Low: K, N, S, and Zn• Rare: Ni, Mo, Ca, Mg, B, Cl, Cu, and Mn
• Wheat – probability• High: N and P• Moderate: S and Cl• Low: K, Zn and Fe• Rare: Ni, Mo, Ca, Mg, B, Cu, and Mn
© 2018 University of Nebraska – Lincoln
10/15/2018
53
Plant Tissue Nutrient Analysis
Monitoring
• “Annual health screening”
• Growth stage and plant part critical
• Represent soil sampling zones
• Compare results to sufficiency ranges
• Good weather and plant health
• Avoid contaminations
Diagnostic
• “Your sick, but with what?”
• Take samples in sick, slightly sick, and healthy areas
• Soil and plant samples
• Compare results between samples
• Biomass, concentration, and uptake issue
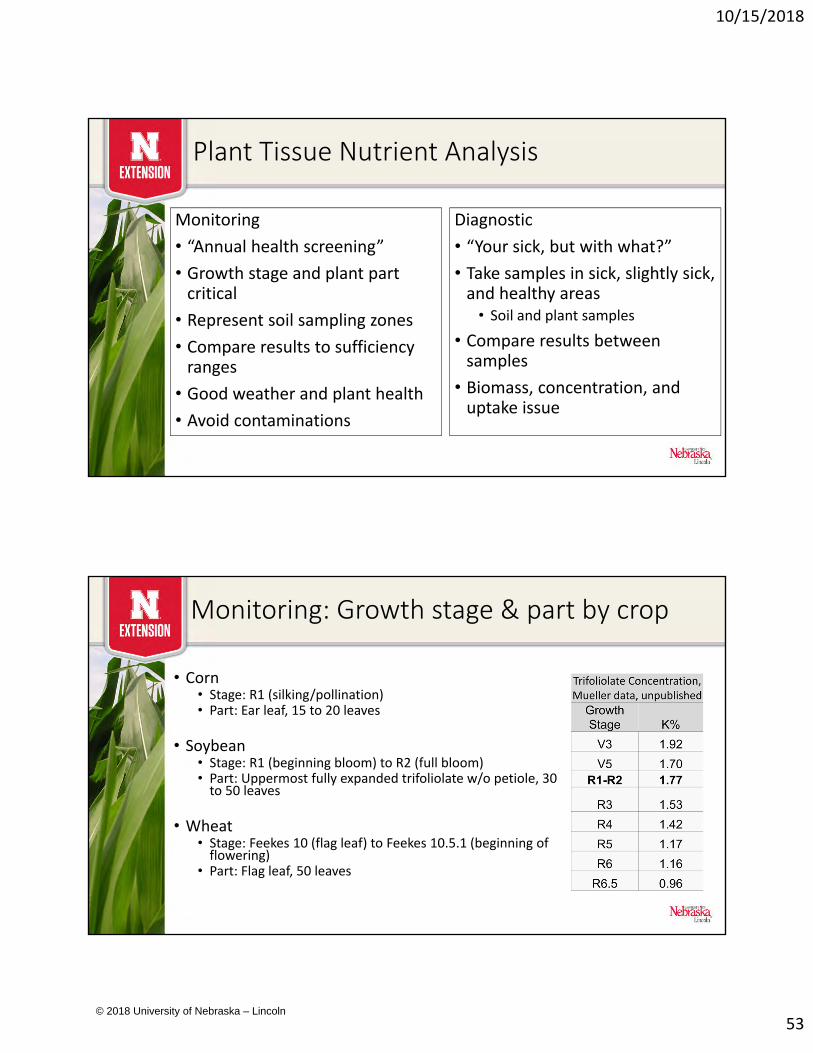
Monitoring: Growth stage & part by crop
• Corn• Stage: R1 (silking/pollination)• Part: Ear leaf, 15 to 20 leaves
• Soybean• Stage: R1 (beginning bloom) to R2 (full bloom)• Part: Uppermost fully expanded trifoliolate w/o petiole, 30 to 50 leaves
• Wheat• Stage: Feekes 10 (flag leaf) to Feekes 10.5.1 (beginning of flowering)
• Part: Flag leaf, 50 leaves
© 2018 University of Nebraska – Lincoln
10/15/2018
54
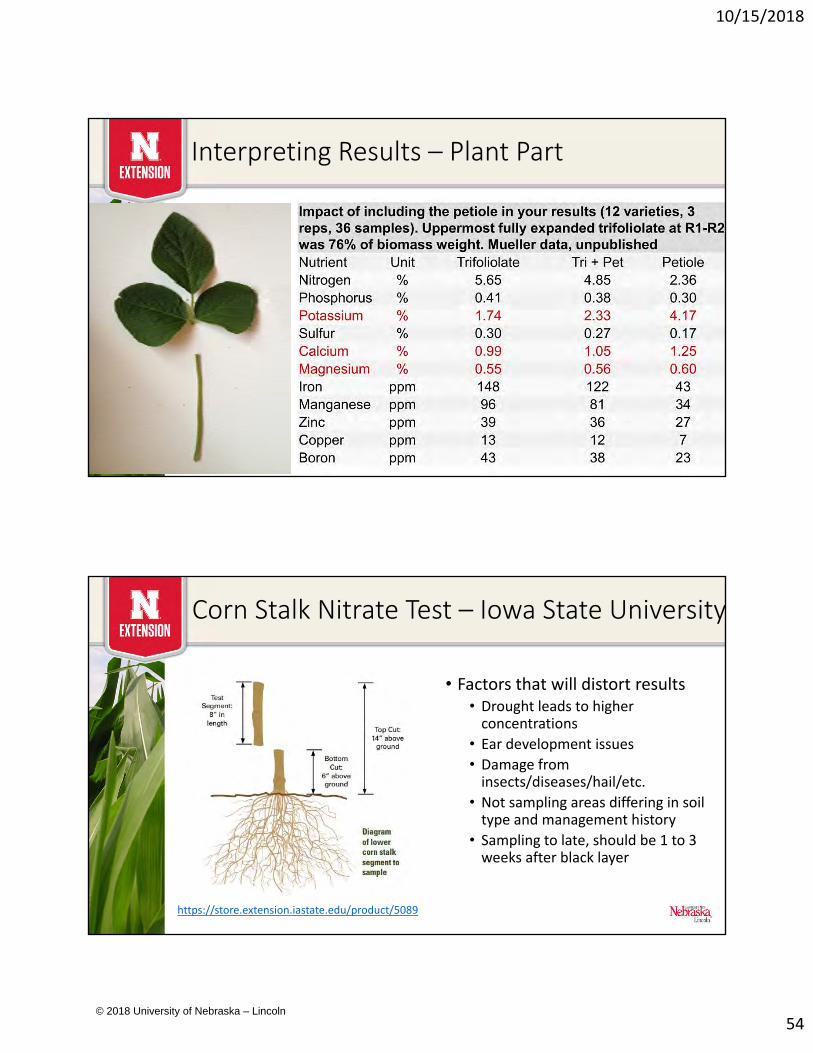
Interpreting Results – Plant Part
Corn Stalk Nitrate Test – Iowa State University
• Factors that will distort results• Drought leads to higher concentrations
• Ear development issues
• Damage from insects/diseases/hail/etc.
• Not sampling areas differing in soil type and management history
• Sampling to late, should be 1 to 3 weeks after black layer
https://store.extension.iastate.edu/product/5089
© 2018 University of Nebraska – Lincoln
10/15/2018
55
Resources
• Micronutrient Management in Nebraska http://extensionpublications.unl.edu/assets/pdf/g1830.pdf
• Plant Nutrient Analysis: Do Your Soybeans have the Right Stuff? http://igrow.org/agronomy/profit‐tips/plant‐nutrient‐analysis‐do‐your‐soybeans‐have‐the‐right‐stuff/
• History of Plant Analysis: Soybean Nutrient Sufficiency Ranges http://ncera‐13.missouri.edu/presentations/mueller.pdf
• Crop Tech Cafe Agronomy Resources ‐ http://croptechcafe.org/agronomy‐resources/• Soybean and wheat plant tissue nutrient sufficiency ranges
• Using plant analysis as a nutrient management tool http://www.sunflower.k‐state.edu/agronomy/soil_fertility/tissue_sampling.html
• Ward Guide pages 131‐149 https://www.wardlab.com/download/WardGuide.pdf
• End‐of‐Season Corn Stalk Nitrate Test https://store.extension.iastate.edu/product/5089
Summary – Nutrient Diagnostics
• Nutrient deficiencies in the region
• Plant tissue nutrient analysis –diagnostic vs. monitoring
• End‐of‐season cornstalk nitrate test
© 2018 University of Nebraska – Lincoln
10/15/2018
56
Cover Crops, Water and Nitrogen Management
Nathan Mueller
Overview – Cover Crops, Water, and N Mngt
• Summary of Nebraska cover crop surveys
• Summary of corn and soybean yields from cover crop research through the Nebraska On‐Farm Research Network
• Recent small‐plot cover crop research in Nebraska and Iowa related to water and nitrogen
• Group discussion of corn nitrogen management following cover crops
© 2018 University of Nebraska – Lincoln
10/15/2018
57
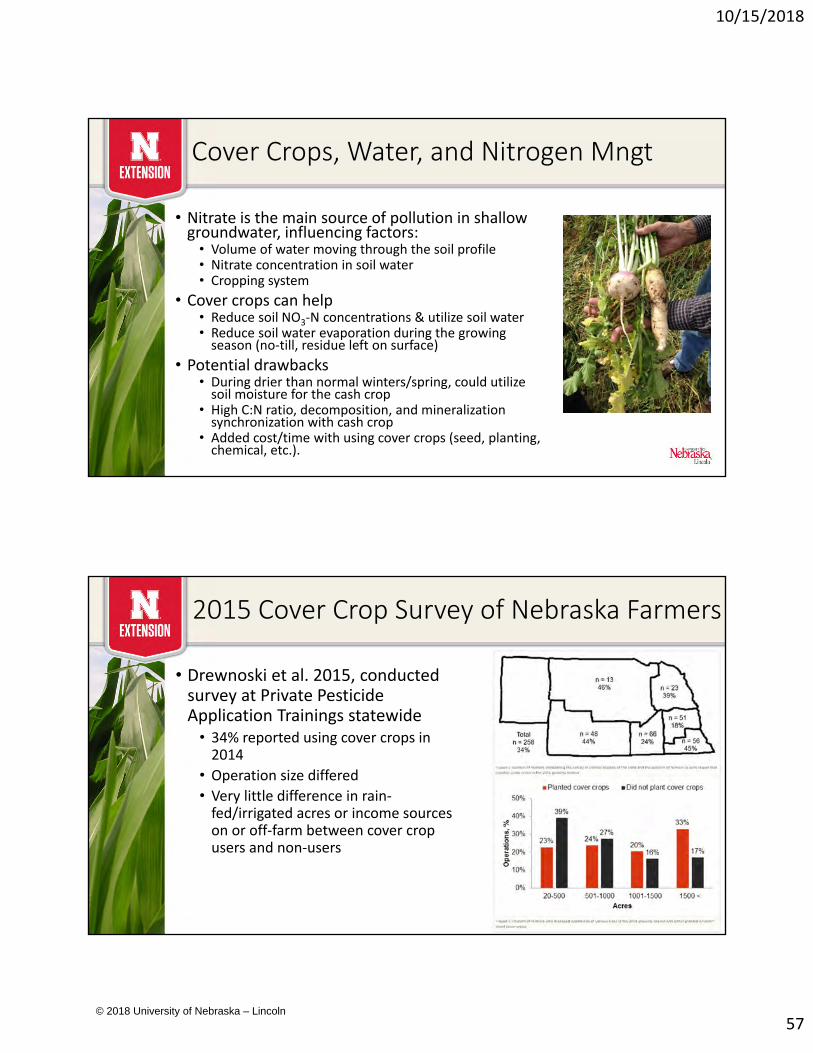
Cover Crops, Water, and Nitrogen Mngt
• Nitrate is the main source of pollution in shallow groundwater, influencing factors:
• Volume of water moving through the soil profile• Nitrate concentration in soil water• Cropping system
• Cover crops can help• Reduce soil NO3‐N concentrations & utilize soil water • Reduce soil water evaporation during the growing season (no‐till, residue left on surface)
• Potential drawbacks• During drier than normal winters/spring, could utilize soil moisture for the cash crop
• High C:N ratio, decomposition, and mineralization synchronization with cash crop
• Added cost/time with using cover crops (seed, planting, chemical, etc.).
2015 Cover Crop Survey of Nebraska Farmers
• Drewnoski et al. 2015, conducted survey at Private Pesticide Application Trainings statewide
• 34% reported using cover crops in 2014
• Operation size differed
• Very little difference in rain‐fed/irrigated acres or income sources on or off‐farm between cover crop users and non‐users
© 2018 University of Nebraska – Lincoln
10/15/2018
58
Barriers or Perceived Barriers w/Cover Crop Use
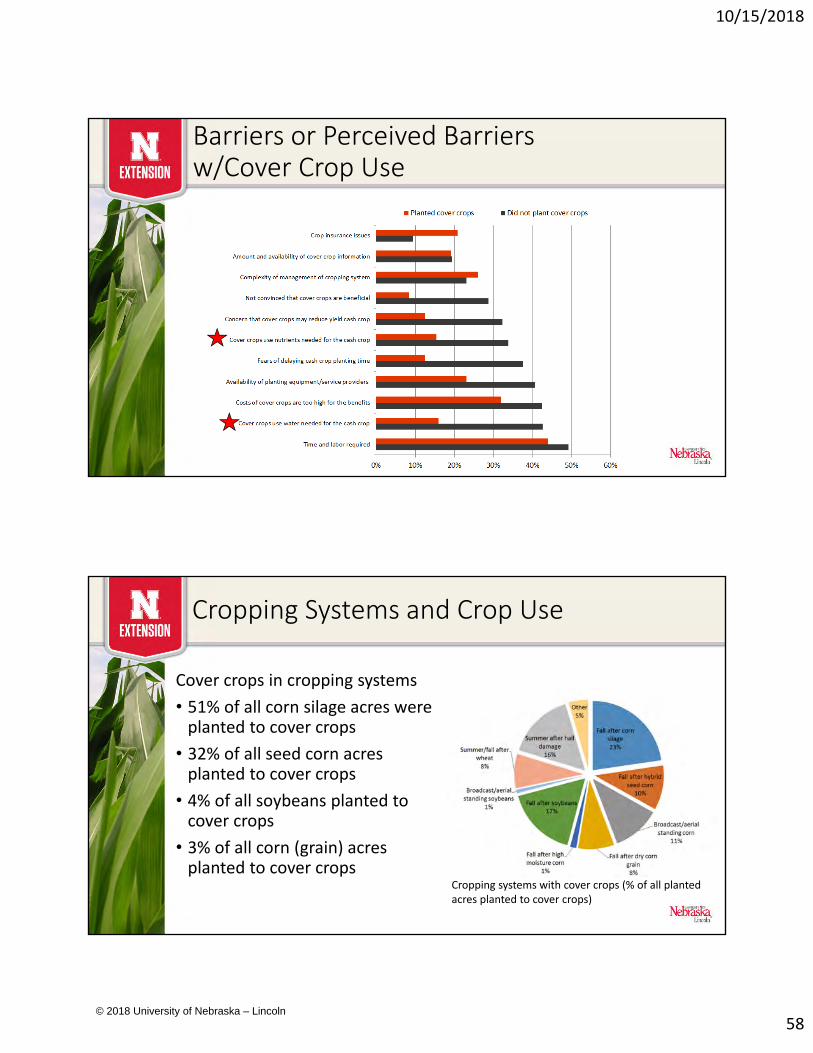
Cropping Systems and Crop Use
Cover crops in cropping systems
• 51% of all corn silage acres were planted to cover crops
• 32% of all seed corn acres planted to cover crops
• 4% of all soybeans planted to cover crops
• 3% of all corn (grain) acres planted to cover crops
Cropping systems with cover crops (% of all planted acres planted to cover crops)
© 2018 University of Nebraska – Lincoln
10/15/2018
59
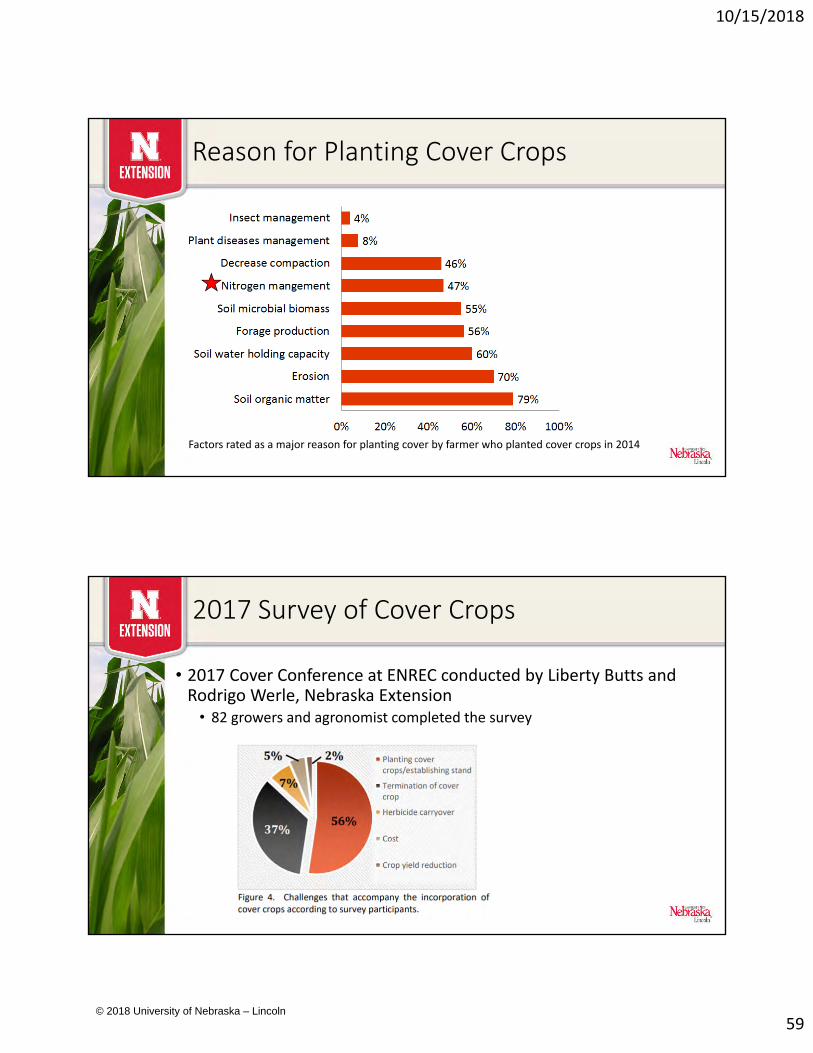
Reason for Planting Cover Crops
Factors rated as a major reason for planting cover by farmer who planted cover crops in 2014
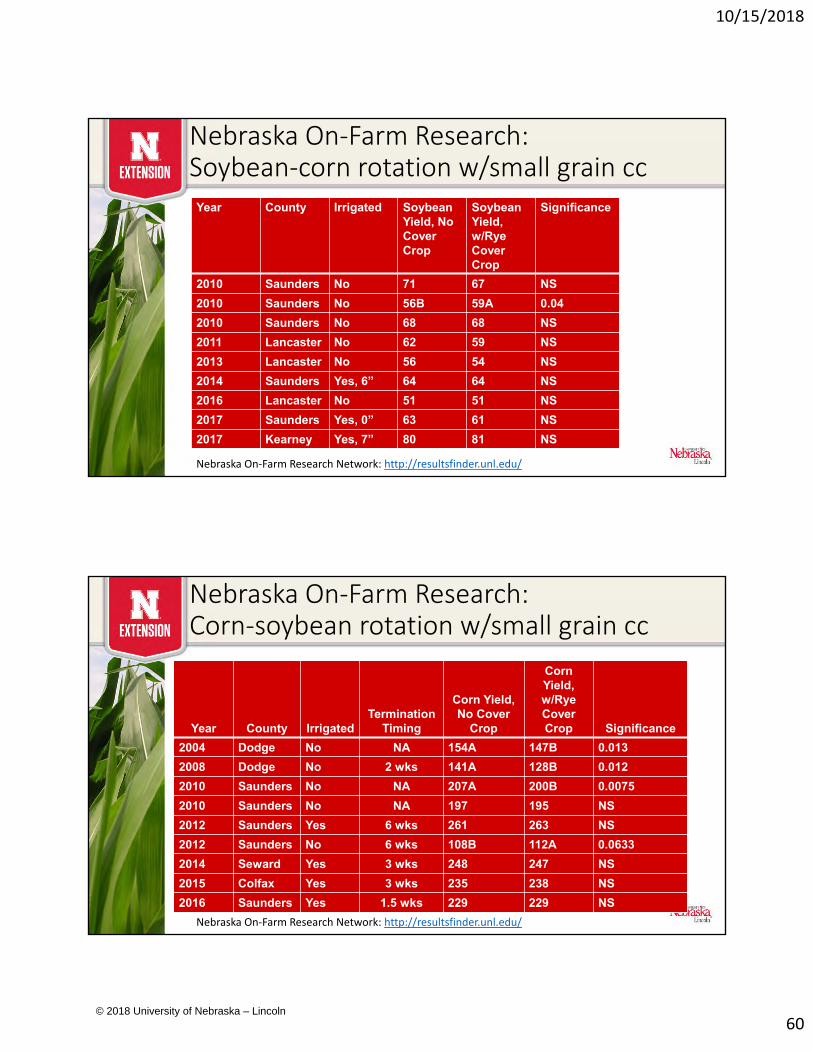
2017 Survey of Cover Crops
• 2017 Cover Conference at ENREC conducted by Liberty Butts and Rodrigo Werle, Nebraska Extension
• 82 growers and agronomist completed the survey
© 2018 University of Nebraska – Lincoln
10/15/2018
60
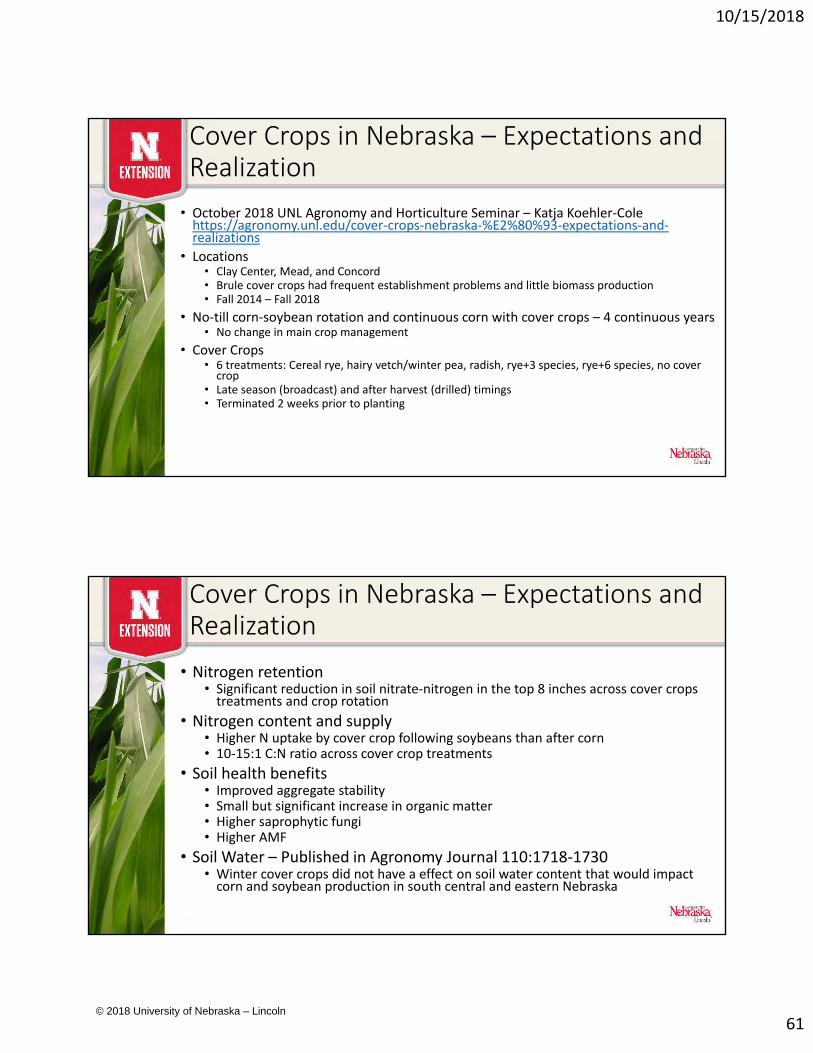
Nebraska On‐Farm Research: Soybean‐corn rotation w/small grain cc
Year County Irrigated Soybean Yield, No Cover Crop
SoybeanYield, w/Rye Cover Crop
Significance
2010 Saunders No 71 67 NS
2010 Saunders No 56B 59A 0.04
2010 Saunders No 68 68 NS
2011 Lancaster No 62 59 NS
2013 Lancaster No 56 54 NS
2014 Saunders Yes, 6” 64 64 NS
2016 Lancaster No 51 51 NS
2017 Saunders Yes, 0” 63 61 NS
2017 Kearney Yes, 7” 80 81 NS
Nebraska On‐Farm Research Network: http://resultsfinder.unl.edu/
Nebraska On‐Farm Research:Corn‐soybean rotation w/small grain cc
Year County IrrigatedTermination
Timing
Corn Yield,No Cover
Crop
Corn Yield, w/Rye Cover Crop Significance
2004 Dodge No NA 154A 147B 0.013
2008 Dodge No 2 wks 141A 128B 0.012
2010 Saunders No NA 207A 200B 0.0075
2010 Saunders No NA 197 195 NS
2012 Saunders Yes 6 wks 261 263 NS
2012 Saunders No 6 wks 108B 112A 0.0633
2014 Seward Yes 3 wks 248 247 NS
2015 Colfax Yes 3 wks 235 238 NS
2016 Saunders Yes 1.5 wks 229 229 NS
Nebraska On‐Farm Research Network: http://resultsfinder.unl.edu/
© 2018 University of Nebraska – Lincoln
10/15/2018
61
Cover Crops in Nebraska – Expectations and Realization
• October 2018 UNL Agronomy and Horticulture Seminar – Katja Koehler‐Cole https://agronomy.unl.edu/cover‐crops‐nebraska‐%E2%80%93‐expectations‐and‐realizations
• Locations• Clay Center, Mead, and Concord• Brule cover crops had frequent establishment problems and little biomass production• Fall 2014 – Fall 2018
• No‐till corn‐soybean rotation and continuous corn with cover crops – 4 continuous years• No change in main crop management
• Cover Crops• 6 treatments: Cereal rye, hairy vetch/winter pea, radish, rye+3 species, rye+6 species, no cover crop
• Late season (broadcast) and after harvest (drilled) timings• Terminated 2 weeks prior to planting
Cover Crops in Nebraska – Expectations and Realization
• Nitrogen retention• Significant reduction in soil nitrate‐nitrogen in the top 8 inches across cover crops treatments and crop rotation
• Nitrogen content and supply• Higher N uptake by cover crop following soybeans than after corn• 10‐15:1 C:N ratio across cover crop treatments
• Soil health benefits• Improved aggregate stability• Small but significant increase in organic matter• Higher saprophytic fungi• Higher AMF
• Soil Water – Published in Agronomy Journal 110:1718‐1730• Winter cover crops did not have a effect on soil water content that would impact corn and soybean production in south central and eastern Nebraska
© 2018 University of Nebraska – Lincoln
10/15/2018
62
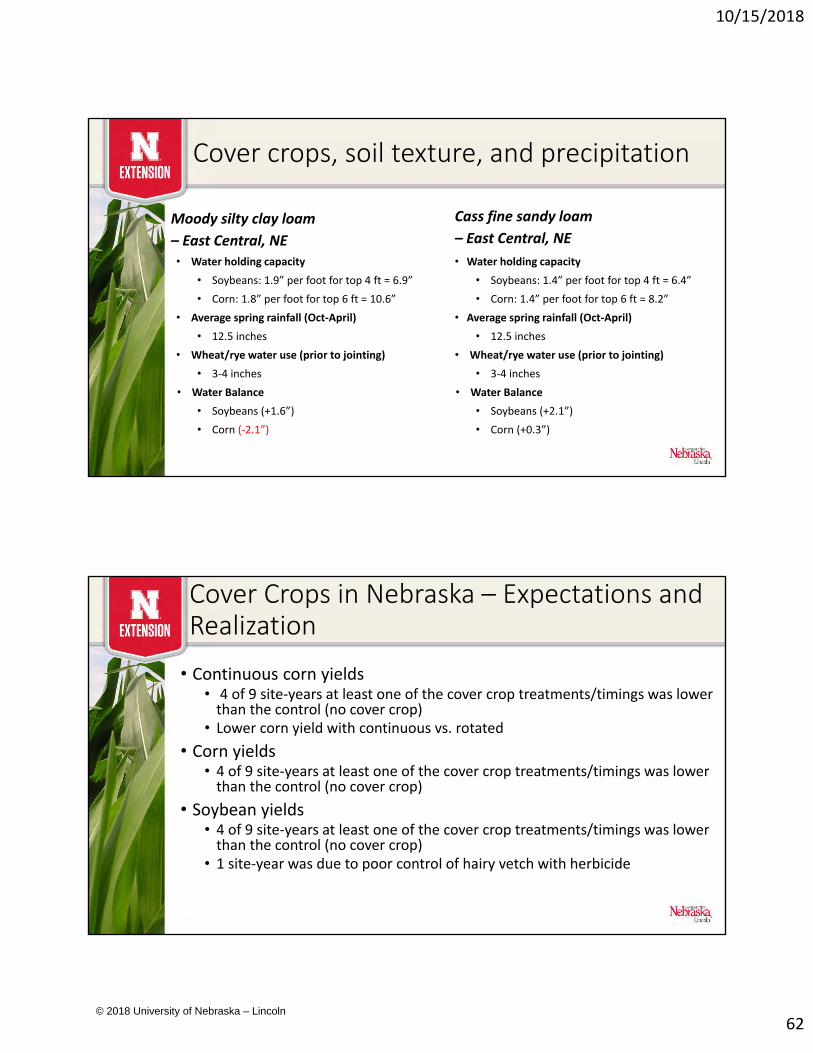
Cover crops, soil texture, and precipitation
Moody silty clay loam
– East Central, NE• Water holding capacity
• Soybeans: 1.9” per foot for top 4 ft = 6.9”
• Corn: 1.8” per foot for top 6 ft = 10.6”
• Average spring rainfall (Oct‐April)
• 12.5 inches
• Wheat/rye water use (prior to jointing)
• 3‐4 inches
• Water Balance
• Soybeans (+1.6”)
• Corn (‐2.1”)
Cass fine sandy loam
– East Central, NE
• Water holding capacity
• Soybeans: 1.4” per foot for top 4 ft = 6.4”
• Corn: 1.4” per foot for top 6 ft = 8.2”
• Average spring rainfall (Oct‐April)
• 12.5 inches
• Wheat/rye water use (prior to jointing)
• 3‐4 inches
• Water Balance
• Soybeans (+2.1”)
• Corn (+0.3”)
Cover Crops in Nebraska – Expectations and Realization
• Continuous corn yields• 4 of 9 site‐years at least one of the cover crop treatments/timings was lower than the control (no cover crop)
• Lower corn yield with continuous vs. rotated
• Corn yields• 4 of 9 site‐years at least one of the cover crop treatments/timings was lower than the control (no cover crop)
• Soybean yields• 4 of 9 site‐years at least one of the cover crop treatments/timings was lower than the control (no cover crop)
• 1 site‐year was due to poor control of hairy vetch with herbicide
© 2018 University of Nebraska – Lincoln
10/15/2018
63
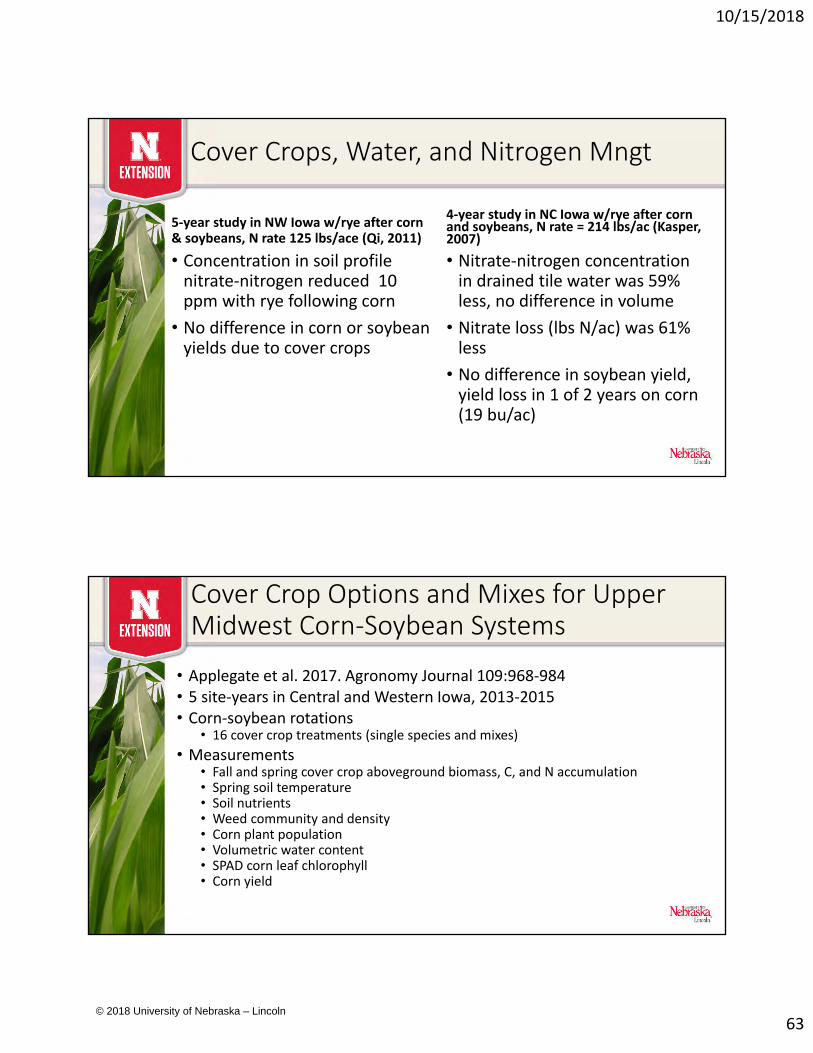
Cover Crops, Water, and Nitrogen Mngt
5‐year study in NW Iowa w/rye after corn & soybeans, N rate 125 lbs/ace (Qi, 2011)
• Concentration in soil profile nitrate‐nitrogen reduced 10 ppm with rye following corn
• No difference in corn or soybean yields due to cover crops
4‐year study in NC Iowa w/rye after corn and soybeans, N rate = 214 lbs/ac (Kasper, 2007)
• Nitrate‐nitrogen concentration in drained tile water was 59% less, no difference in volume
• Nitrate loss (lbs N/ac) was 61% less
• No difference in soybean yield, yield loss in 1 of 2 years on corn (19 bu/ac)
Cover Crop Options and Mixes for Upper Midwest Corn‐Soybean Systems
• Applegate et al. 2017. Agronomy Journal 109:968‐984• 5 site‐years in Central and Western Iowa, 2013‐2015• Corn‐soybean rotations
• 16 cover crop treatments (single species and mixes)
• Measurements • Fall and spring cover crop aboveground biomass, C, and N accumulation• Spring soil temperature• Soil nutrients• Weed community and density• Corn plant population• Volumetric water content• SPAD corn leaf chlorophyll• Corn yield
© 2018 University of Nebraska – Lincoln
10/15/2018
64
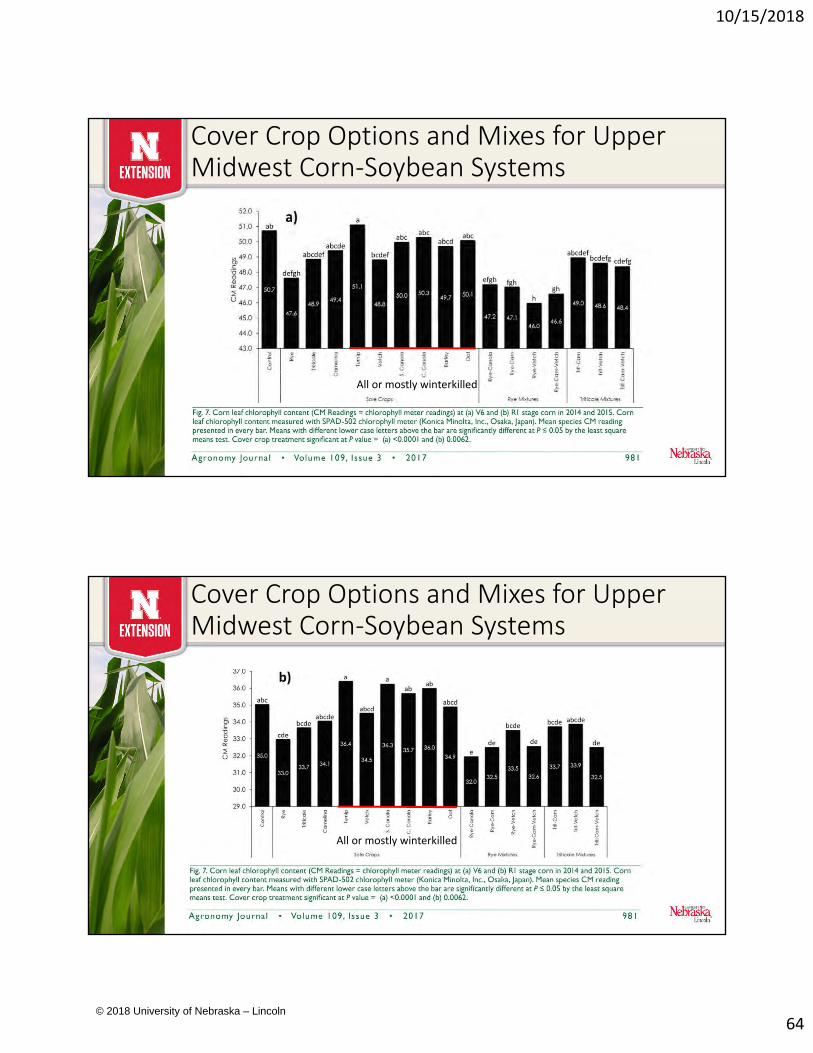
Cover Crop Options and Mixes for Upper Midwest Corn‐Soybean Systems
All or mostly winterkilled
Cover Crop Options and Mixes for Upper Midwest Corn‐Soybean Systems
All or mostly winterkilled
© 2018 University of Nebraska – Lincoln
10/15/2018
65
Cover Crop Options and Mixes for Upper Midwest Corn‐Soybean Systems
• Conclusions• Cover crops influenced:
• Spring soil nitrate concentration• Corn chlorophyll meter reading at V6 and R1
• Cover crop did not influence:• Surface soil temperatures• Soil P and K concentration• Weed density and community• Corn yield• Limited influence on volumetric water content
• “Rye‐associated cover crop had the highest N accumulation and C/N ratios, leading to slower N release, and the lowest soil nitrate concentrations in soil.”
• Nitrogen likely retained in slowly decomposing rye residue on the soil surface. • However, C:N ratio all less than 14:1
Group DiscussionCover crops, water, and nitrogen management
© 2018 University of Nebraska – Lincoln
10/15/2018
66
Resources
• University of Nebraska‐Lincoln CropWatch webpage on cover crops https://cropwatch.unl.edu/cover‐crops
• 2017 Survey of Cover Crop Production in Nebraska Soybeans, Field Corn, and Seed Corn https://cropwatch.unl.edu/2017‐CW‐News/2017‐images/Research/2017‐cover‐crop‐study‐report.pdf
• 2015 Cover Crop Survey of Nebraska Farmer https://cropwatch.unl.edu/report‐cover‐crop‐survey‐nebraska‐farmers
• 2018 Nebraska Cover Crop Conference Recordings https://mediahub.unl.edu/channels/21972
• Seminar: Cover Crops in Nebraska – Expectations and Realization https://agronomy.unl.edu/cover‐crops‐nebraska‐%E2%80%93‐expectations‐and‐realizations
Review – Cover Crops, Water, and N Mngt
• Summary of Nebraska cover crop surveys
• Summary of corn and soybean yields from cover crop research through the Nebraska On‐Farm Research Network
• Recent small‐plot cover crop research in Nebraska and Iowa related to water and nitrogen
• Group discussion of corn nitrogen management following cover crops
© 2018 University of Nebraska – Lincoln
10/15/2018
67
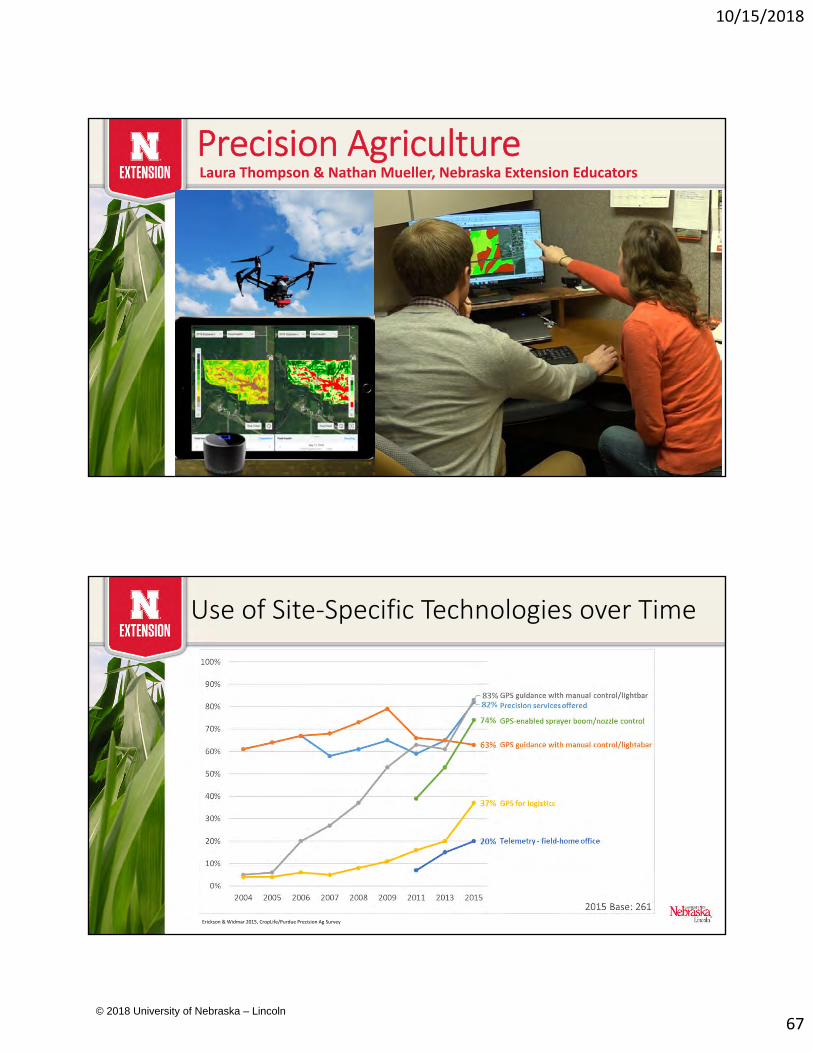
Precision AgricultureLaura Thompson & Nathan Mueller, Nebraska Extension Educators
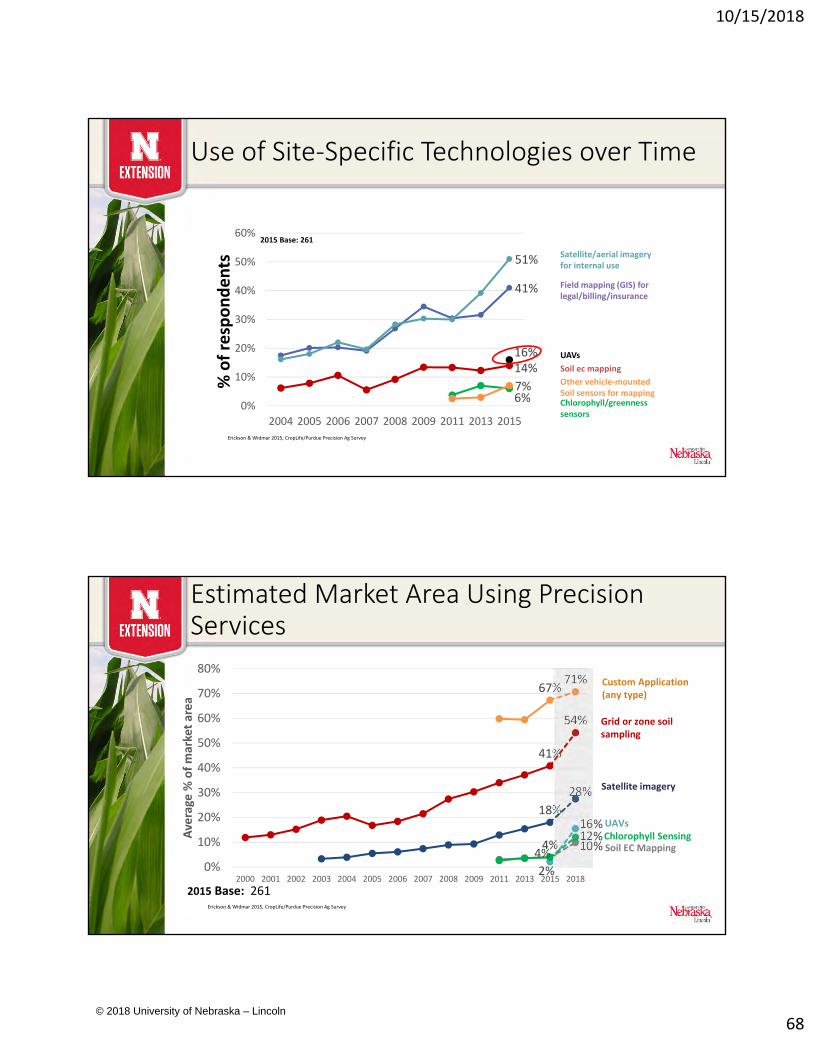
Use of Site‐Specific Technologies over Time
Erickson & Widmar 2015, CropLife/Purdue Precision Ag Survey
© 2018 University of Nebraska – Lincoln
10/15/2018
68
Use of Site‐Specific Technologies over Time
41%
51%
14%16%
6%7%
0%
10%
20%
30%
40%
50%
60%
2004 2005 2006 2007 2008 2009 2011 2013 2015
% of respondents
Satellite/aerial imagery for internal use
Field mapping (GIS) for legal/billing/insurance
Soil ec mapping
Other vehicle‐mountedSoil sensors for mappingChlorophyll/greenness sensors
UAVs
Erickson & Widmar 2015, CropLife/Purdue Precision Ag Survey
2015 Base: 261
Estimated Market Area Using Precision Services
41%
54%
18%
28%
2%
16%
4% 10%4%
12%
67%71%
0%
10%
20%
30%
40%
50%
60%
70%
80%
2000 2001 2002 2003 2004 2005 2006 2007 2008 2009 2011 2013 2015 2018
Average % of market area
2015 Base: 261
Custom Application (any type)
Grid or zone soil sampling
Satellite imagery
UAVsChlorophyll SensingSoil EC Mapping
Erickson & Widmar 2015, CropLife/Purdue Precision Ag Survey
© 2018 University of Nebraska – Lincoln
10/15/2018
69
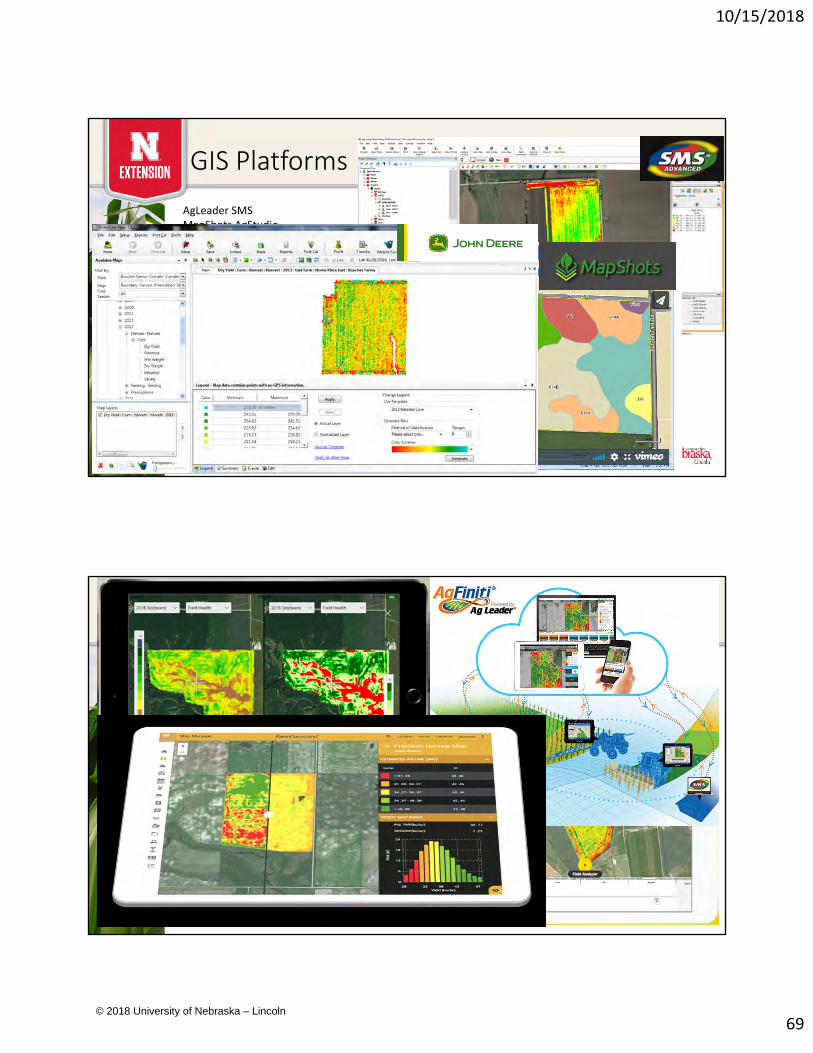
GIS Platforms
AgLeader SMSMapShots AgStudioJohn Deere ApexFarmWorks
GIS Platforms
• Transferring directly from machine to iPad, and then cloud account
• Keeping track of multiple vehicles in field at same time
• Share your data with trusted advisors• CanPlugs/Puck/Drive
© 2018 University of Nebraska – Lincoln
10/15/2018
70
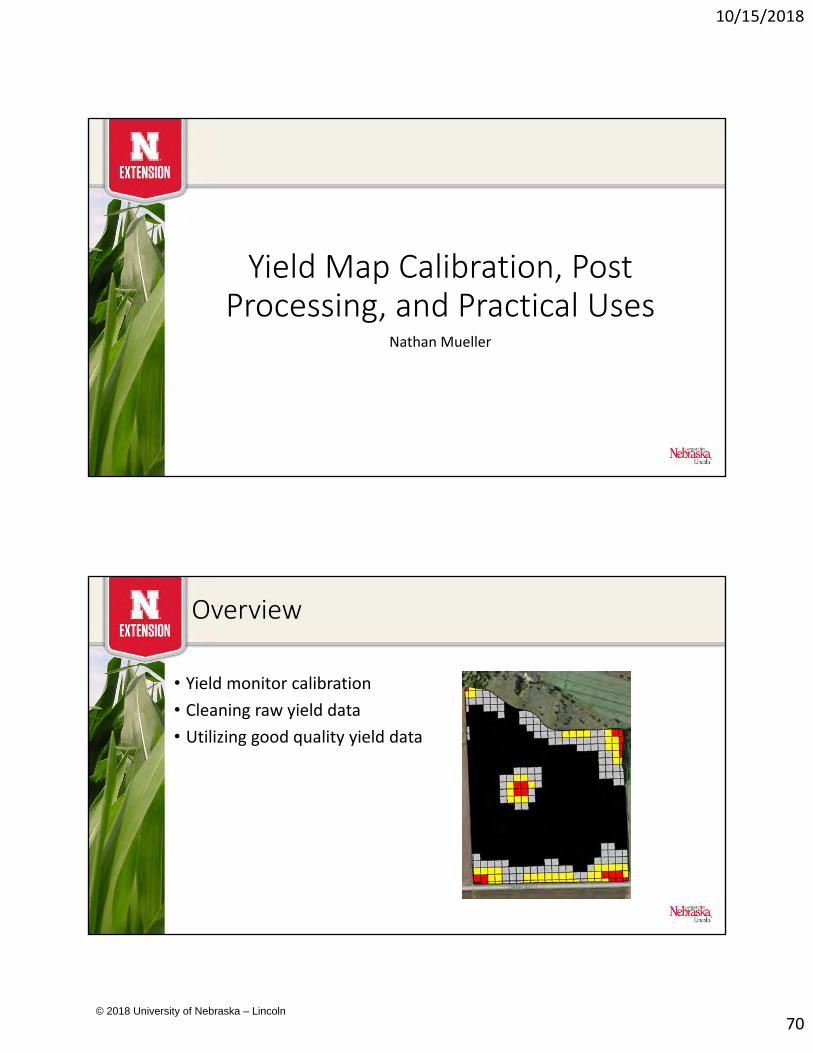
Yield Map Calibration, Post Processing, and Practical Uses
Nathan Mueller
Overview
• Yield monitor calibration
• Cleaning raw yield data
• Utilizing good quality yield data
© 2018 University of Nebraska – Lincoln
10/15/2018
71
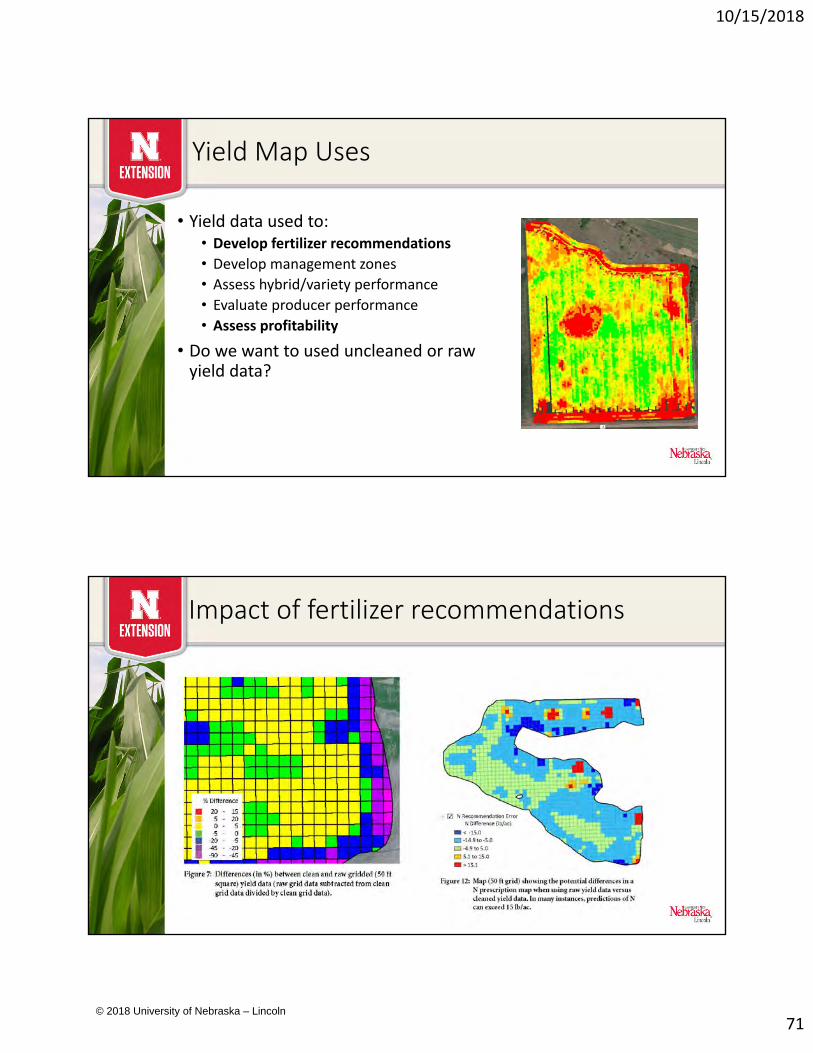
Yield Map Uses
• Yield data used to:• Develop fertilizer recommendations
• Develop management zones
• Assess hybrid/variety performance
• Evaluate producer performance
• Assess profitability
• Do we want to used uncleaned or raw yield data?
Impact of fertilizer recommendations
© 2018 University of Nebraska – Lincoln
10/15/2018
72
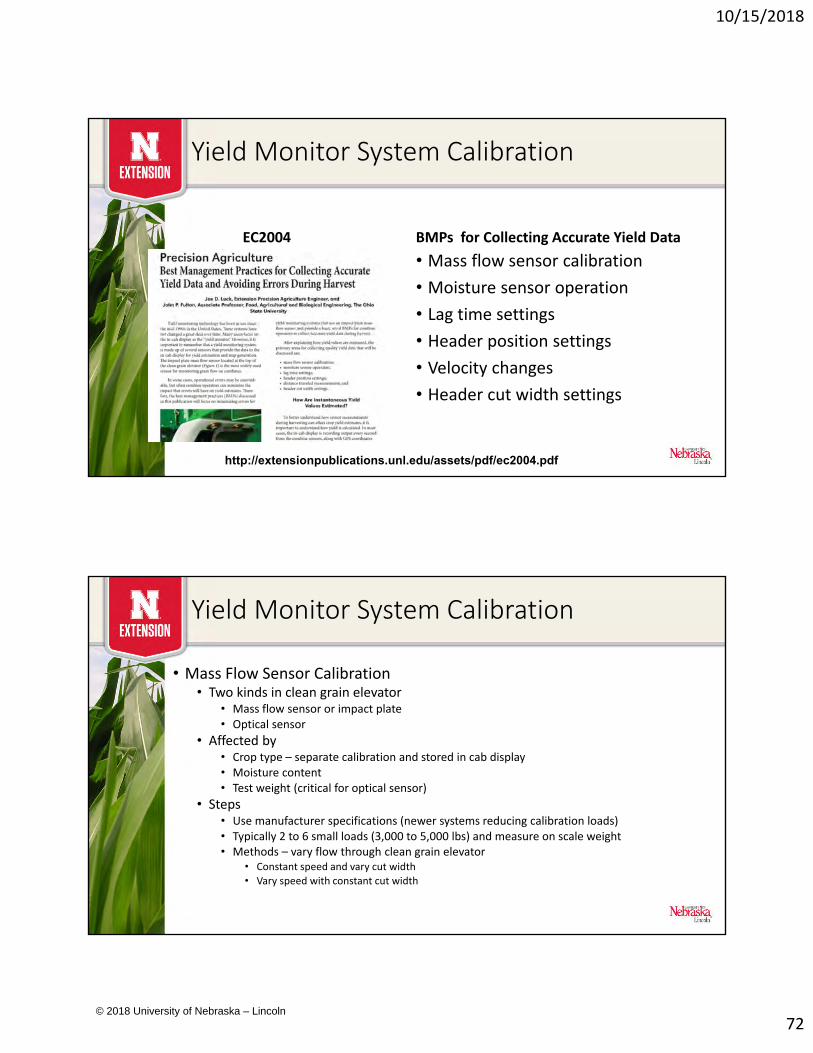
Yield Monitor System Calibration
EC2004 BMPs for Collecting Accurate Yield Data
• Mass flow sensor calibration
• Moisture sensor operation
• Lag time settings
• Header position settings
• Velocity changes
• Header cut width settings
http://extensionpublications.unl.edu/assets/pdf/ec2004.pdf
Yield Monitor System Calibration
• Mass Flow Sensor Calibration• Two kinds in clean grain elevator
• Mass flow sensor or impact plate• Optical sensor
• Affected by• Crop type – separate calibration and stored in cab display• Moisture content• Test weight (critical for optical sensor)
• Steps• Use manufacturer specifications (newer systems reducing calibration loads)• Typically 2 to 6 small loads (3,000 to 5,000 lbs) and measure on scale weight• Methods – vary flow through clean grain elevator
• Constant speed and vary cut width
• Vary speed with constant cut width
© 2018 University of Nebraska – Lincoln
10/15/2018
73
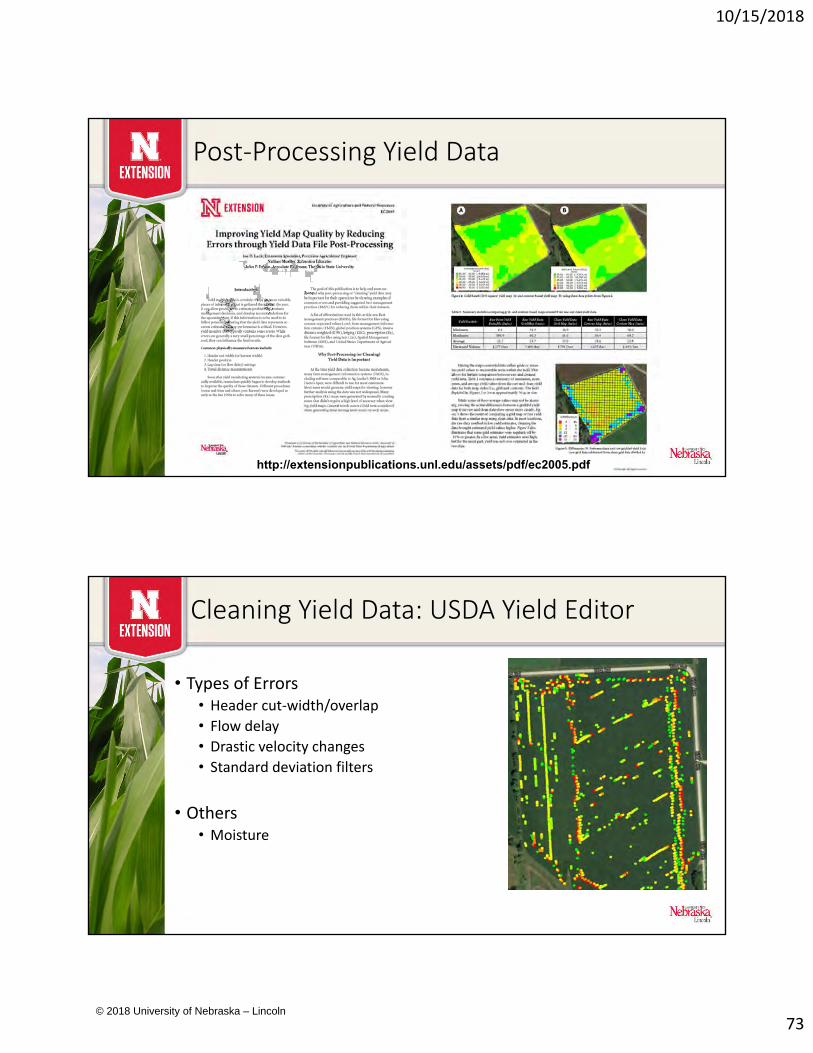
Post‐Processing Yield Data
http://extensionpublications.unl.edu/assets/pdf/ec2005.pdf
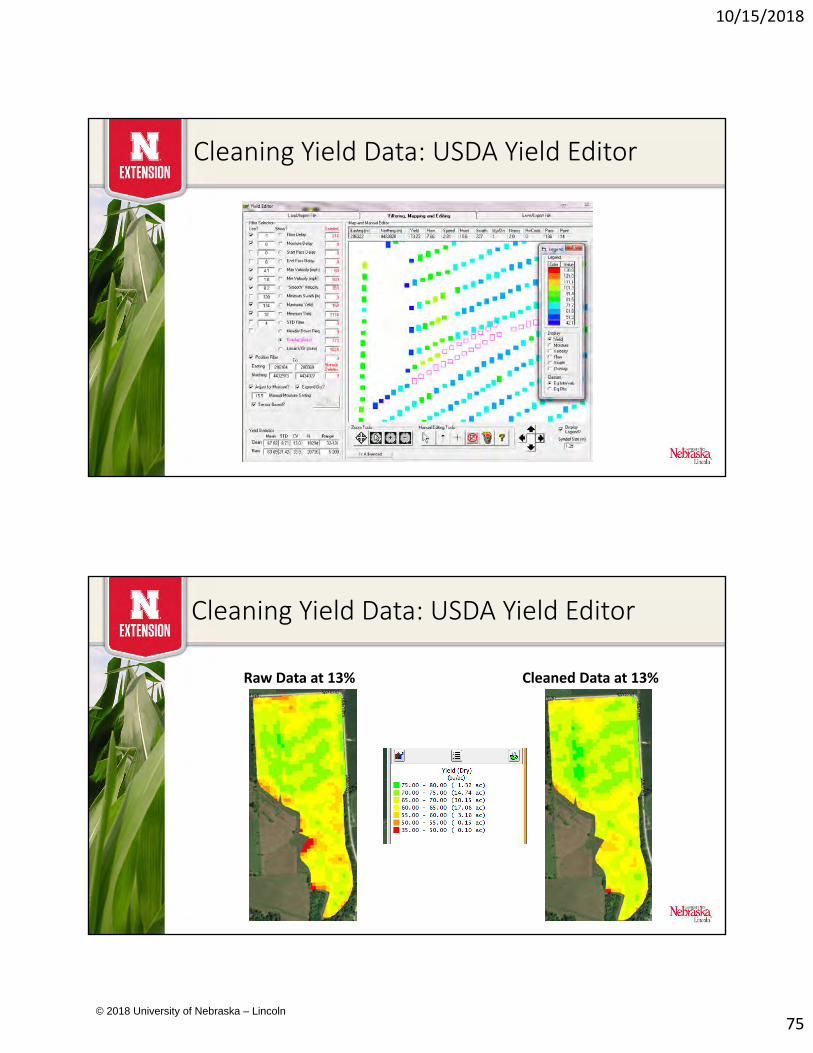
Cleaning Yield Data: USDA Yield Editor
• Types of Errors• Header cut‐width/overlap
• Flow delay
• Drastic velocity changes
• Standard deviation filters
• Others• Moisture
© 2018 University of Nebraska – Lincoln
10/15/2018
74
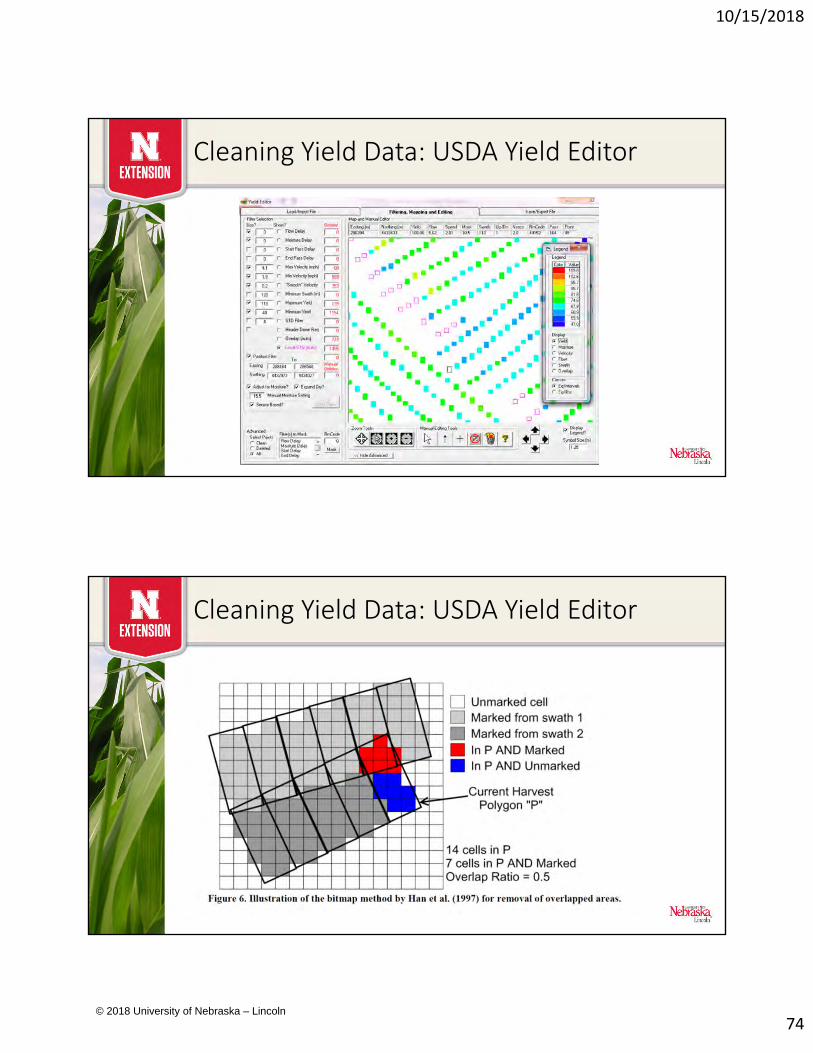
Cleaning Yield Data: USDA Yield Editor
Cleaning Yield Data: USDA Yield Editor
© 2018 University of Nebraska – Lincoln
10/15/2018
75
Cleaning Yield Data: USDA Yield Editor
Cleaning Yield Data: USDA Yield Editor
Raw Data at 13% Cleaned Data at 13%
© 2018 University of Nebraska – Lincoln
10/15/2018
76
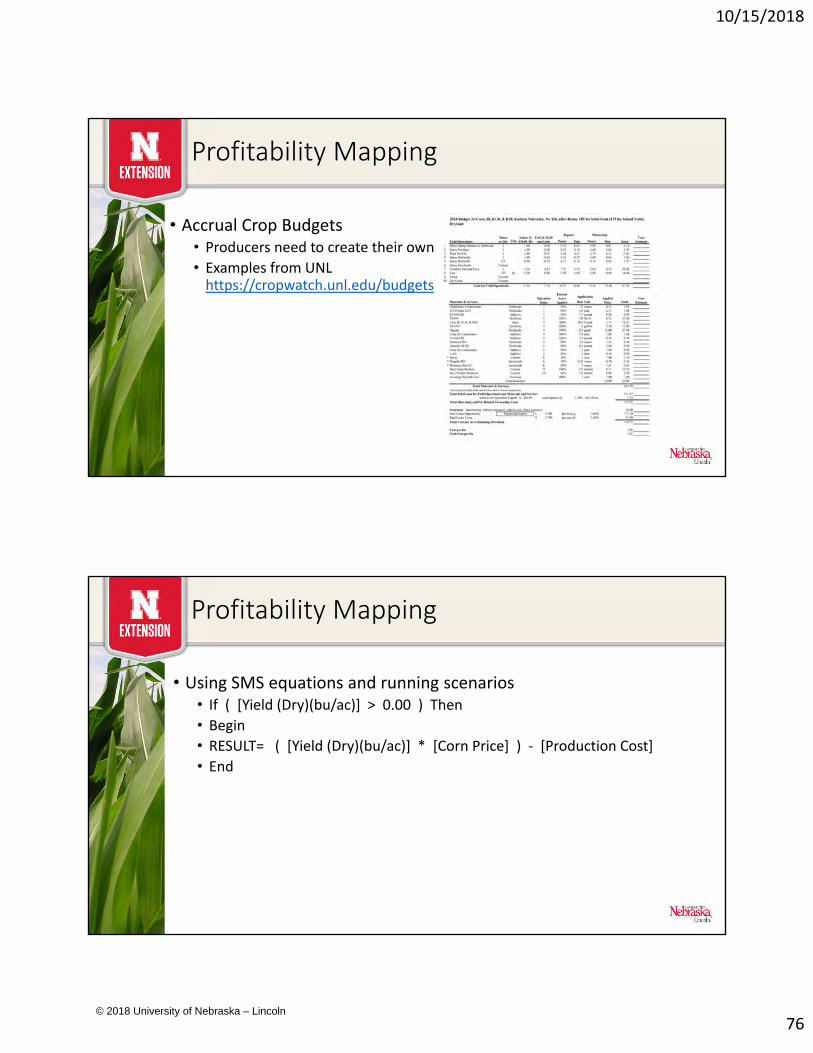
Profitability Mapping
• Accrual Crop Budgets• Producers need to create their own
• Examples from UNL https://cropwatch.unl.edu/budgets
Profitability Mapping
• Using SMS equations and running scenarios• If ( [Yield (Dry)(bu/ac)] > 0.00 ) Then
• Begin
• RESULT= ( [Yield (Dry)(bu/ac)] * [Corn Price] ) ‐ [Production Cost]
• End
© 2018 University of Nebraska – Lincoln
10/15/2018
77
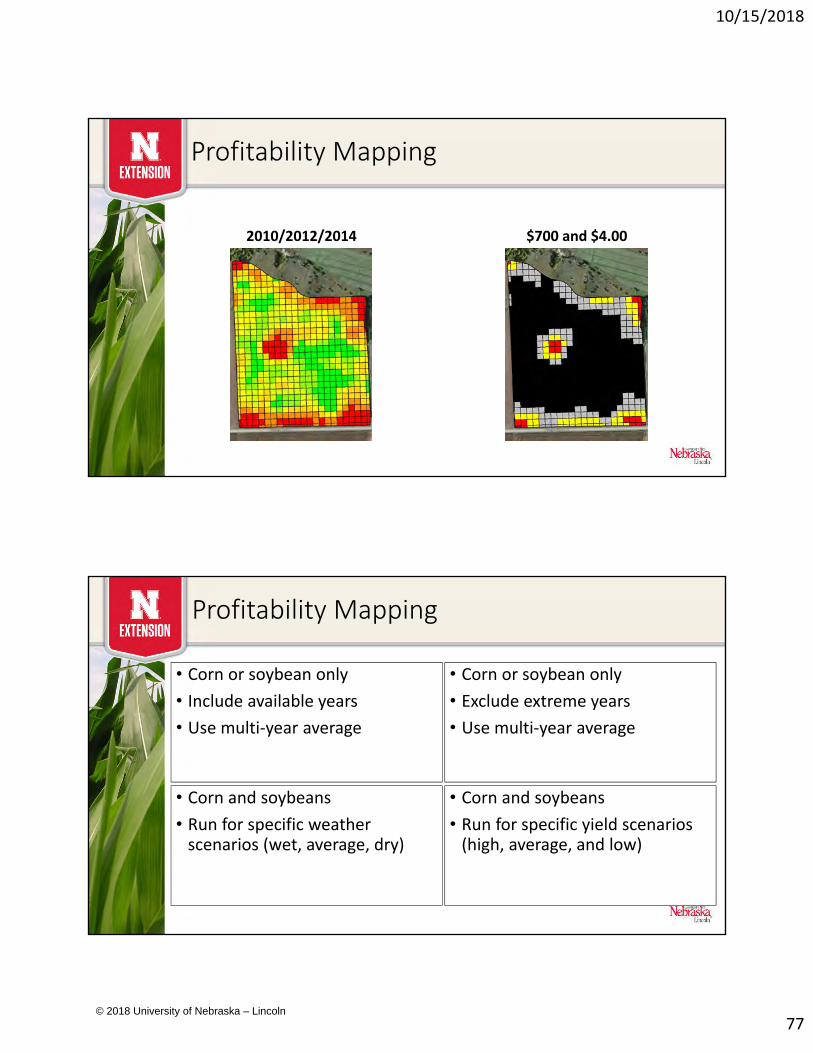
Profitability Mapping
2010/2012/2014 $700 and $4.00
Profitability Mapping
• Corn and soybeans
• Run for specific yield scenarios (high, average, and low)
• Corn or soybean only
• Exclude extreme years
• Use multi‐year average
• Corn and soybeans
• Run for specific weather scenarios (wet, average, dry)
• Corn or soybean only
• Include available years
• Use multi‐year average
© 2018 University of Nebraska – Lincoln
10/15/2018
78
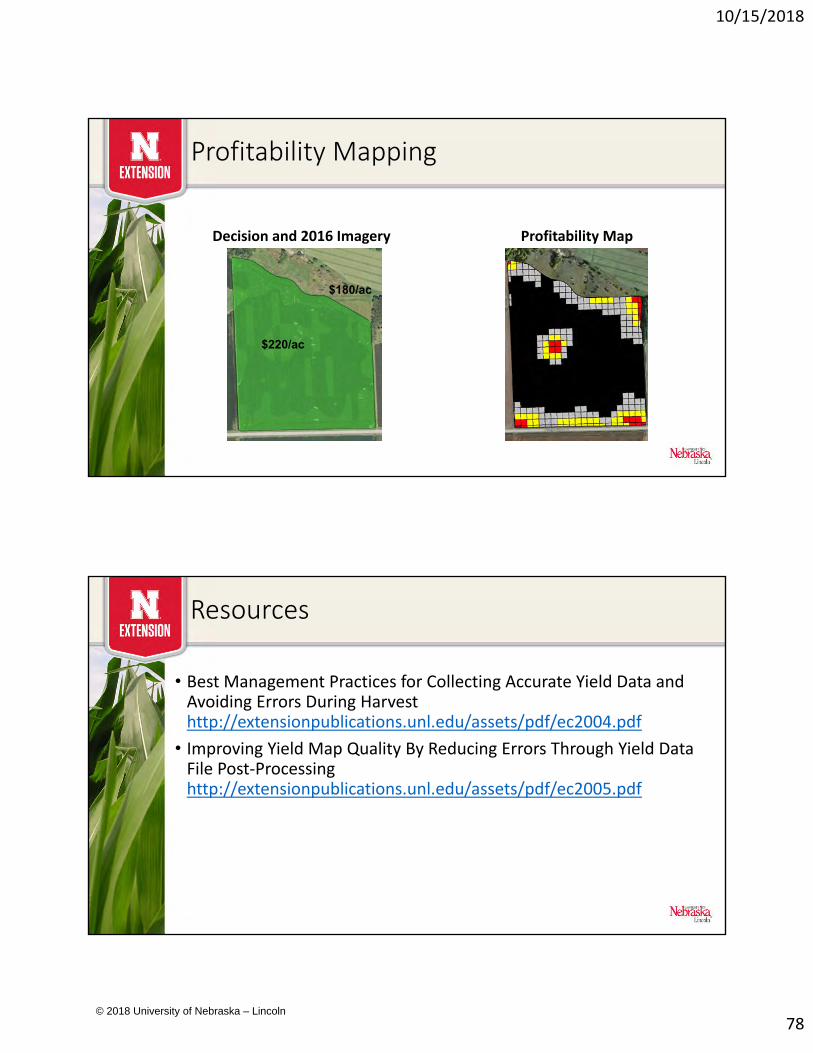
Profitability Mapping
Decision and 2016 Imagery Profitability Map
$180/ac
$220/ac
Resources
• Best Management Practices for Collecting Accurate Yield Data and Avoiding Errors During Harvest http://extensionpublications.unl.edu/assets/pdf/ec2004.pdf
• Improving Yield Map Quality By Reducing Errors Through Yield Data File Post‐Processinghttp://extensionpublications.unl.edu/assets/pdf/ec2005.pdf
© 2018 University of Nebraska – Lincoln
10/15/2018
79
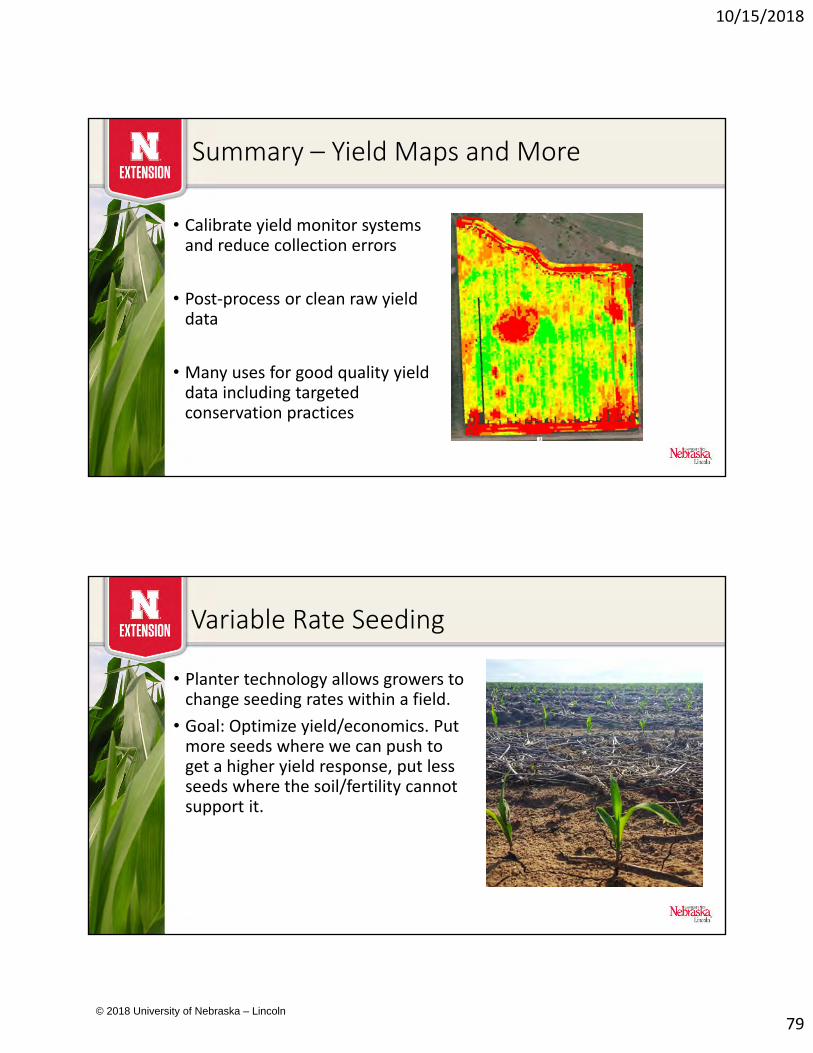
Summary – Yield Maps and More
• Calibrate yield monitor systems and reduce collection errors
• Post‐process or clean raw yield data
• Many uses for good quality yield data including targeted conservation practices
Variable Rate Seeding
• Planter technology allows growers to change seeding rates within a field.
• Goal: Optimize yield/economics. Put more seeds where we can push to get a higher yield response, put less seeds where the soil/fertility cannot support it.
© 2018 University of Nebraska – Lincoln
10/15/2018
80
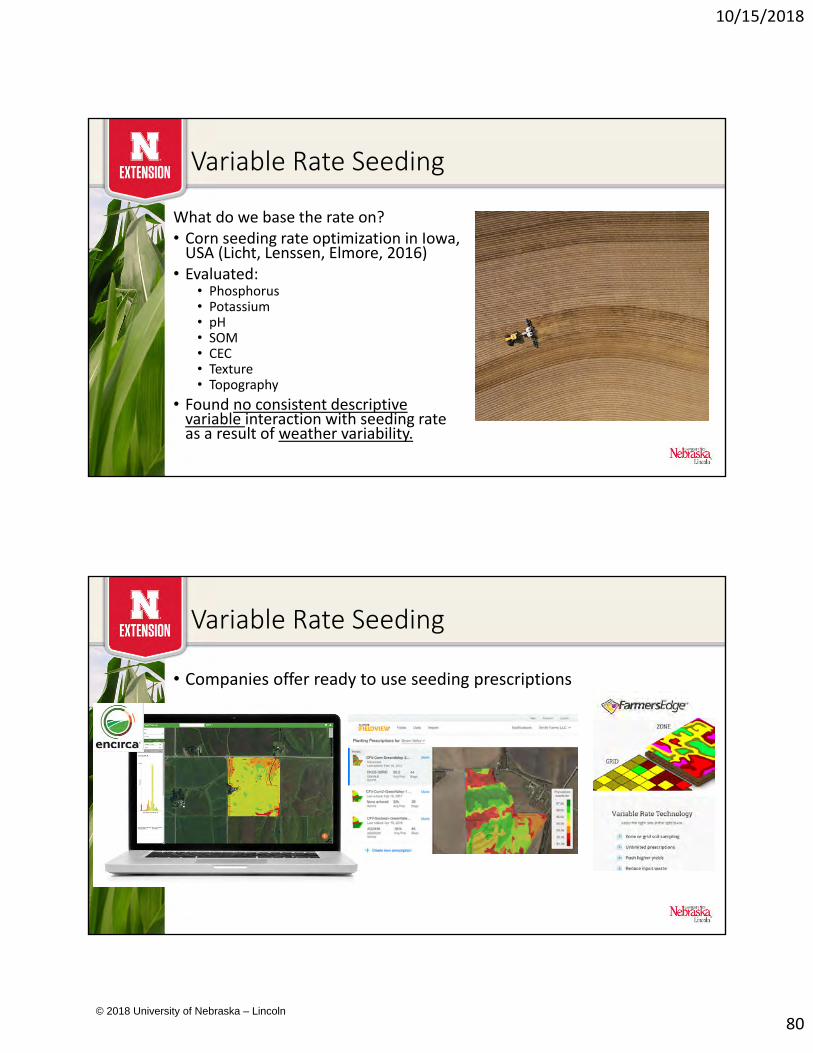
Variable Rate Seeding
What do we base the rate on?• Corn seeding rate optimization in Iowa, USA (Licht, Lenssen, Elmore, 2016)
• Evaluated:• Phosphorus• Potassium• pH• SOM• CEC• Texture• Topography
• Found no consistent descriptive variable interaction with seeding rate as a result of weather variability.
Variable Rate Seeding
• Companies offer ready to use seeding prescriptions
© 2018 University of Nebraska – Lincoln
10/15/2018
81
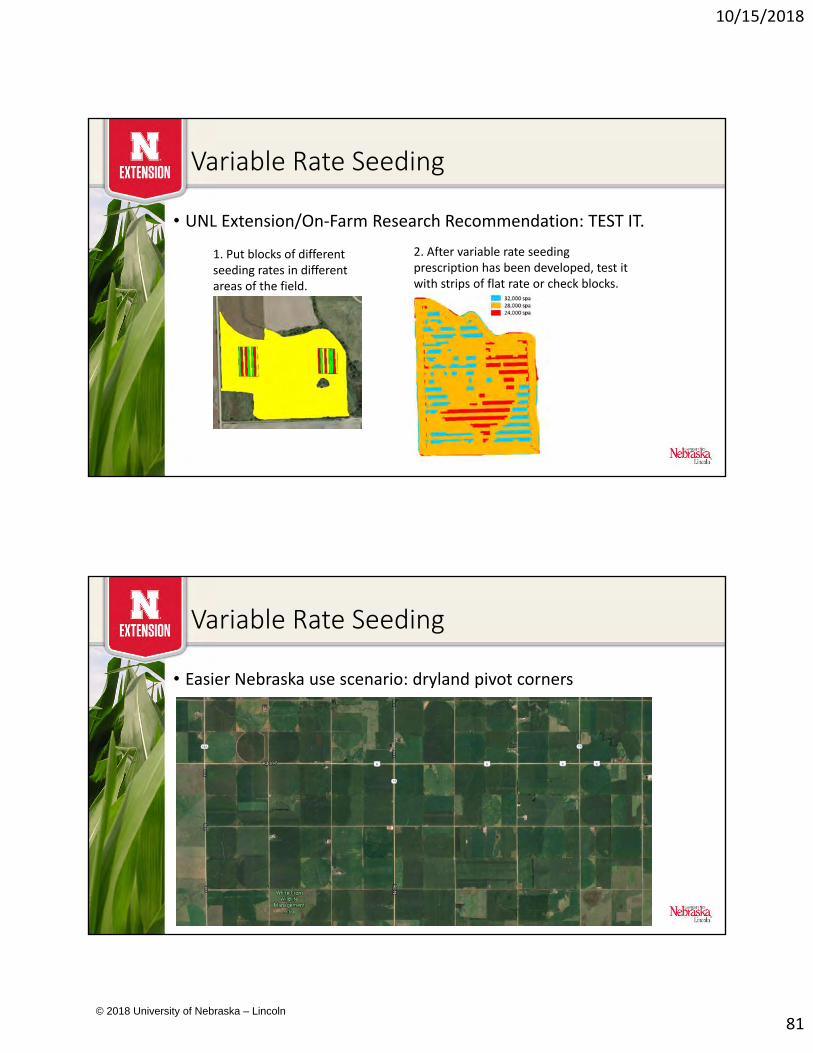
Variable Rate Seeding
• UNL Extension/On‐Farm Research Recommendation: TEST IT.
2. After variable rate seeding prescription has been developed, test it with strips of flat rate or check blocks.
1. Put blocks of different seeding rates in different areas of the field.
Variable Rate Seeding
• Easier Nebraska use scenario: dryland pivot corners
© 2018 University of Nebraska – Lincoln
10/15/2018
82
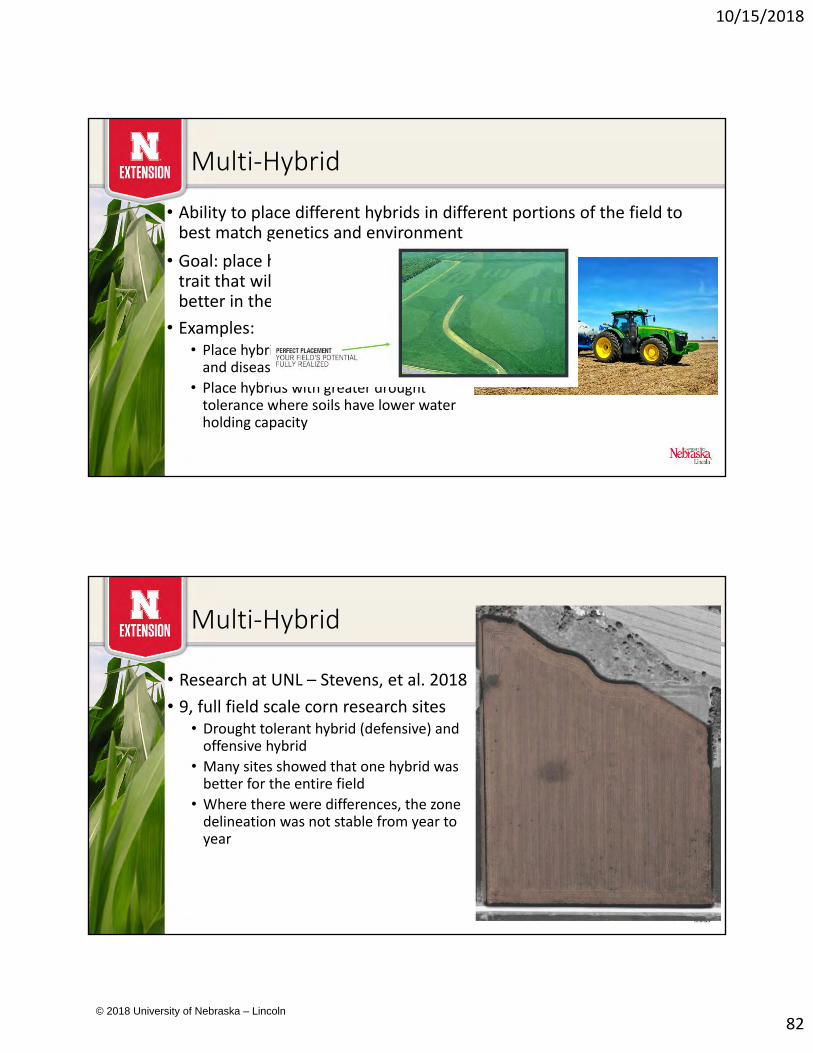
Multi‐Hybrid
• Goal: place hybrids that have some trait that will make them perform better in the area they will do best.
• Examples: • Place hybrids based on disease tolerance and disease prevalence in the field
• Place hybrids with greater drought tolerance where soils have lower water holding capacity
• Ability to place different hybrids in different portions of the field to best match genetics and environment
Multi‐Hybrid
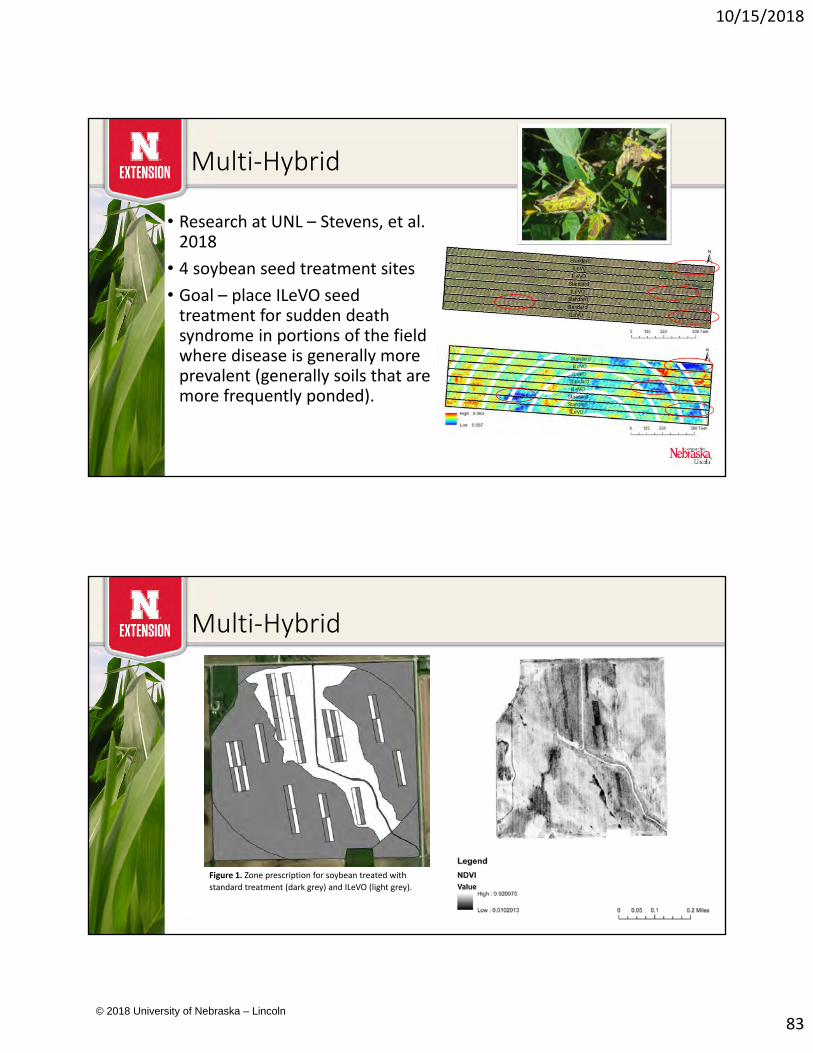
• Research at UNL – Stevens, et al. 2018
• 9, full field scale corn research sites• Drought tolerant hybrid (defensive) and offensive hybrid
• Many sites showed that one hybrid was better for the entire field
• Where there were differences, the zone delineation was not stable from year to year
© 2018 University of Nebraska – Lincoln
10/15/2018
83
Multi‐Hybrid
• Research at UNL – Stevens, et al. 2018
• 4 soybean seed treatment sites
• Goal – place ILeVO seed treatment for sudden death syndrome in portions of the field where disease is generally more prevalent (generally soils that are more frequently ponded).
Multi‐Hybrid
Figure 1. Zone prescription for soybean treated with
standard treatment (dark grey) and ILeVO (light grey).
© 2018 University of Nebraska – Lincoln
10/15/2018
84
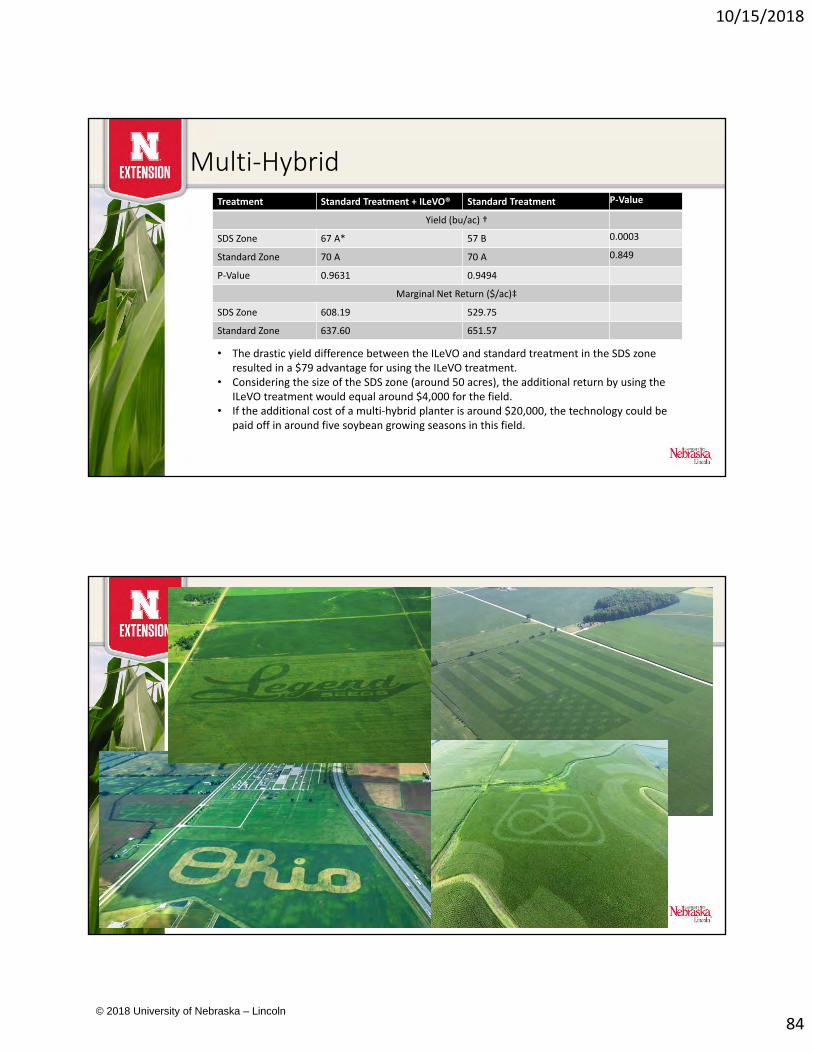
Multi‐HybridTreatment Standard Treatment + ILeVO® Standard Treatment P‐Value
Yield (bu/ac) †
SDS Zone 67 A* 57 B 0.0003
Standard Zone 70 A 70 A 0.849
P‐Value 0.9631 0.9494
Marginal Net Return ($/ac)‡
SDS Zone 608.19 529.75
Standard Zone 637.60 651.57
• The drastic yield difference between the ILeVO and standard treatment in the SDS zone resulted in a $79 advantage for using the ILeVO treatment.
• Considering the size of the SDS zone (around 50 acres), the additional return by using the ILeVO treatment would equal around $4,000 for the field.
• If the additional cost of a multi‐hybrid planter is around $20,000, the technology could be paid off in around five soybean growing seasons in this field.
Variable Hybrid
In reality…
© 2018 University of Nebraska – Lincoln
10/15/2018
85
Resources
Corn seeding rate optimization in Iowa, USA (Licht, Lnssen, and Elmore, 2016): https://link.springer.com/article/10.1007/s11119‐016‐9464‐7
CropWatch Variable Rate Seeding Considerations: https://cropwatch.unl.edu/farmresearch/articlearchives/vr‐seed‐experiments
Remote Sensing PlatformsLaura Thompson
© 2018 University of Nebraska – Lincoln
10/15/2018
86
Proximal
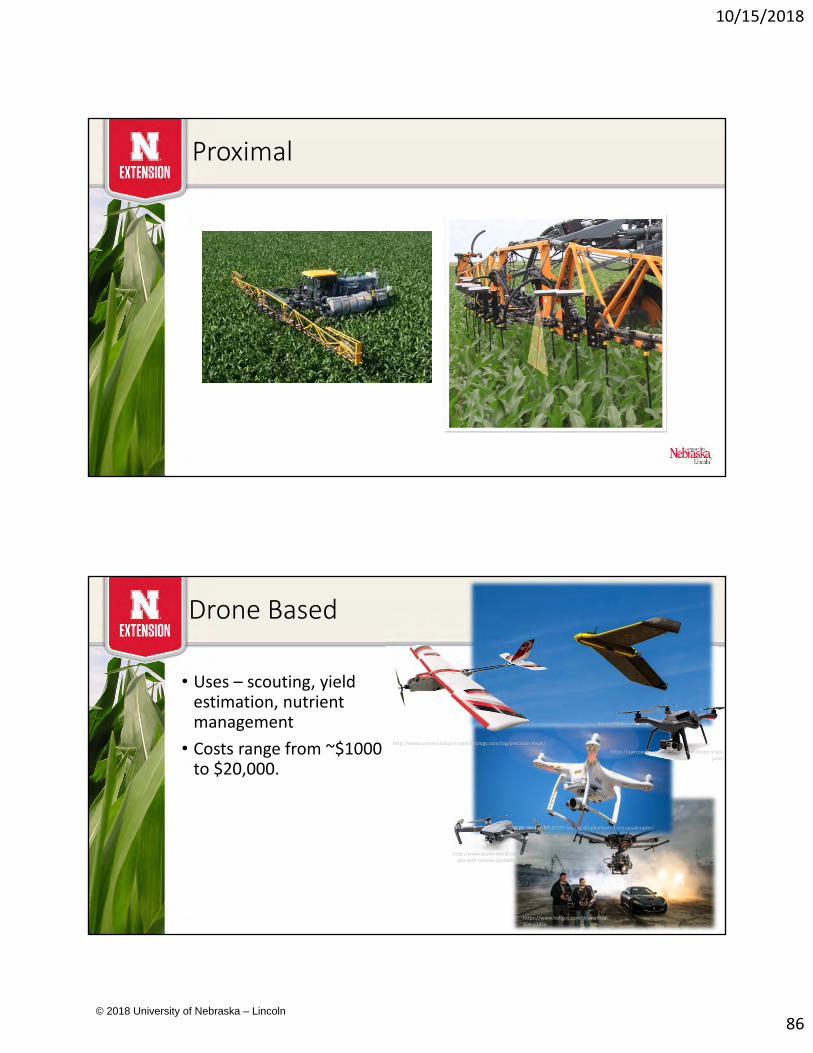
Drone Based
• Uses – scouting, yield estimation, nutrient management
• Costs range from ~$1000 to $20,000.
https://www.heliguy.com/dji‐matrice‐600‐p3856
http://flight‐evolved.com/sensefly‐ebee‐drone/#
http://www.tested.com/tech/537193‐testing‐dji‐phantom‐3‐pro‐quadcopter/
http://www.unmannedsystemstechnology.com/tag/precision‐hawk/
http://www.drone‐world.com/dji‐mavic‐pro‐with‐remote‐portable‐4k‐foldable‐
drone
https://uavcoach.com/3dr‐solo‐smart‐drone‐ships‐june/
© 2018 University of Nebraska – Lincoln
10/15/2018
87
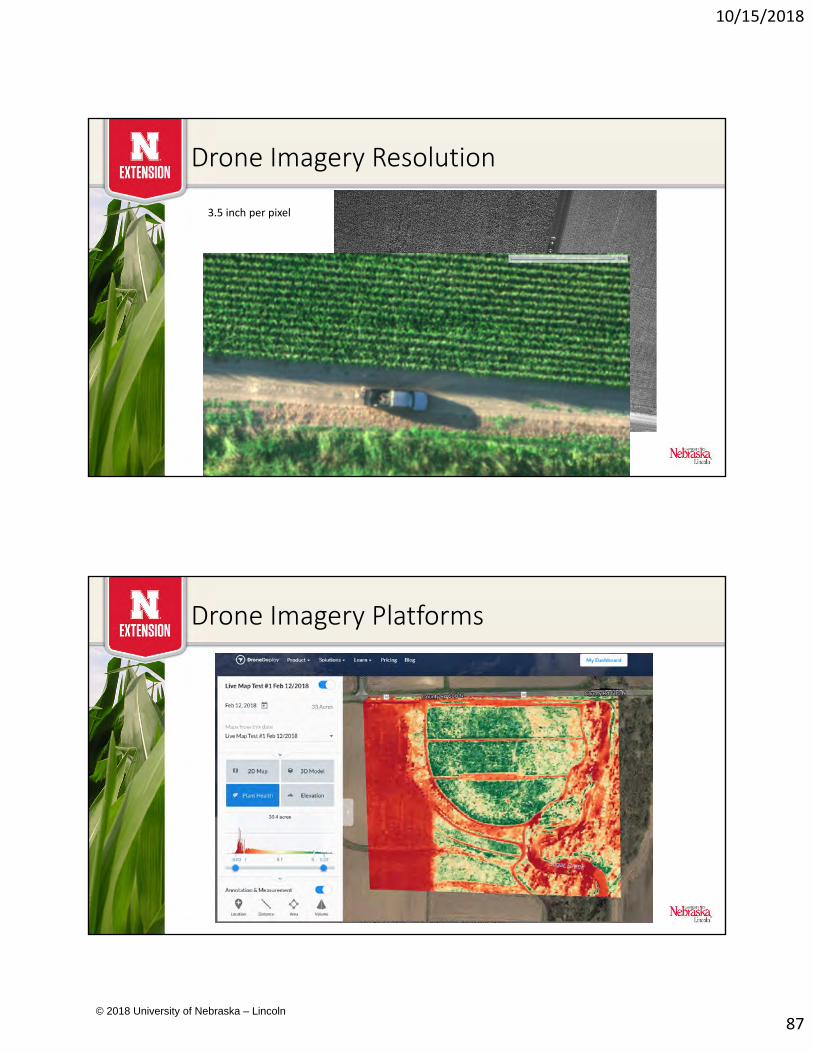
Drone Imagery Resolution
3.5 inch per pixel
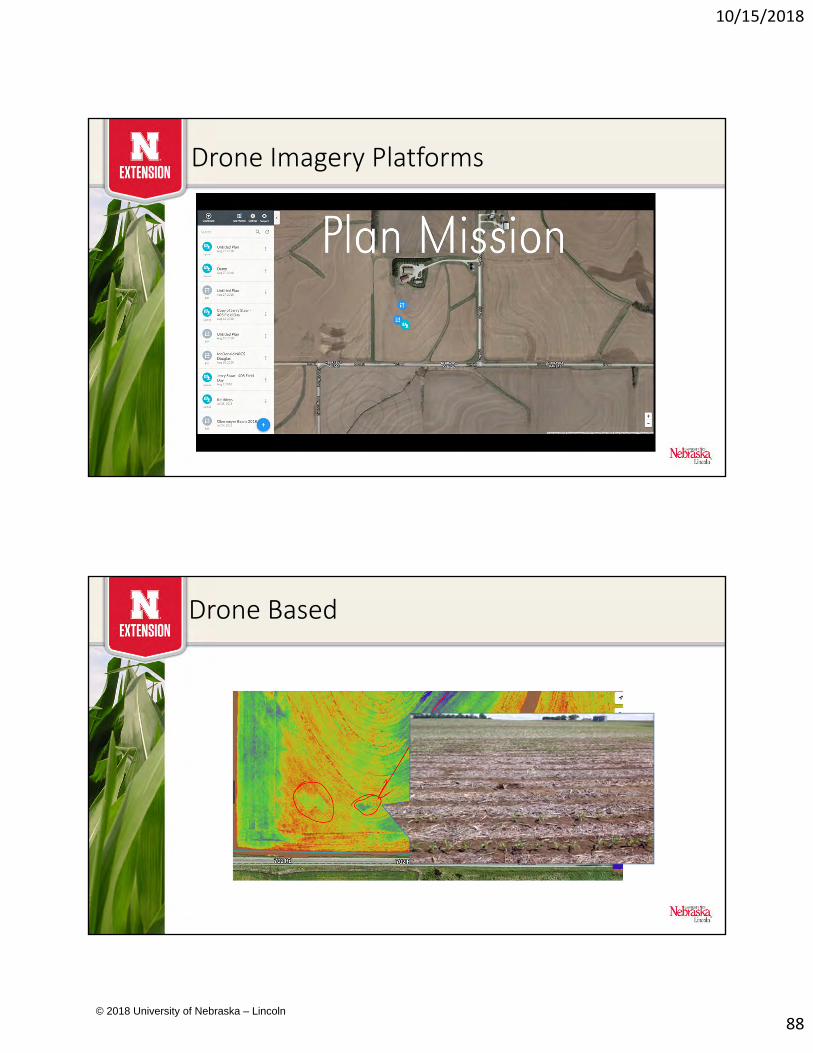
Drone Imagery Platforms
© 2018 University of Nebraska – Lincoln
10/15/2018
88
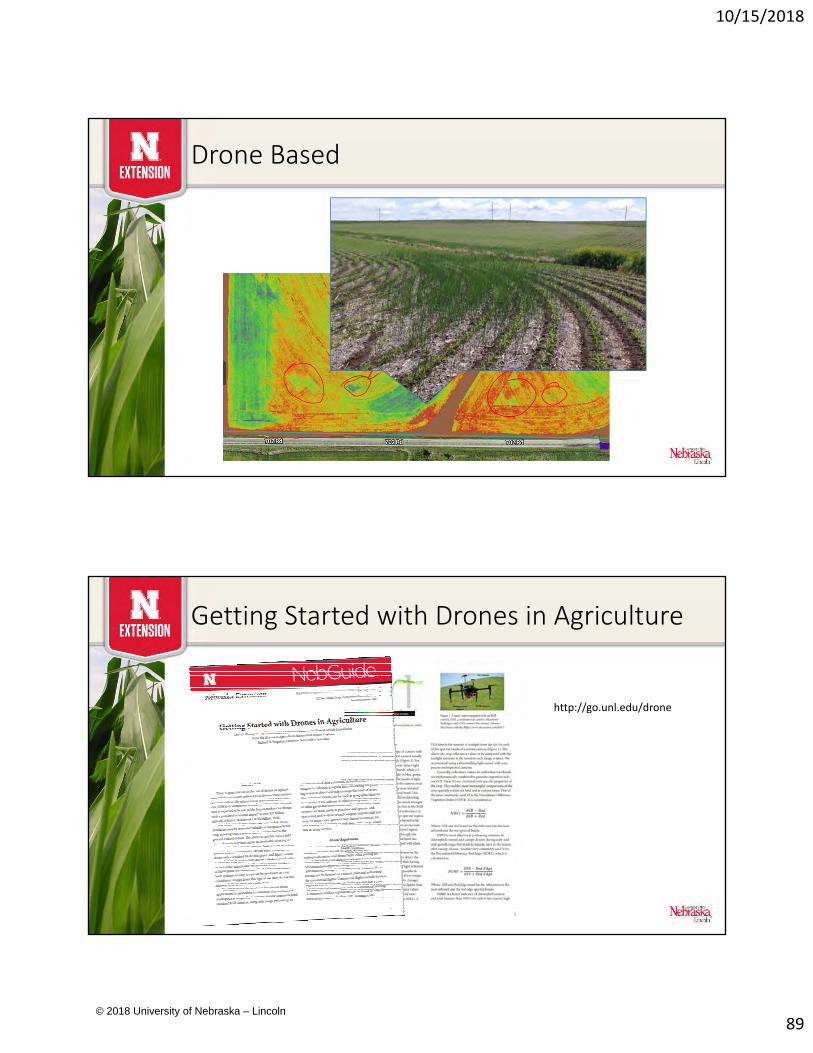
Drone Imagery Platforms
Drone Based
© 2018 University of Nebraska – Lincoln
10/15/2018
89
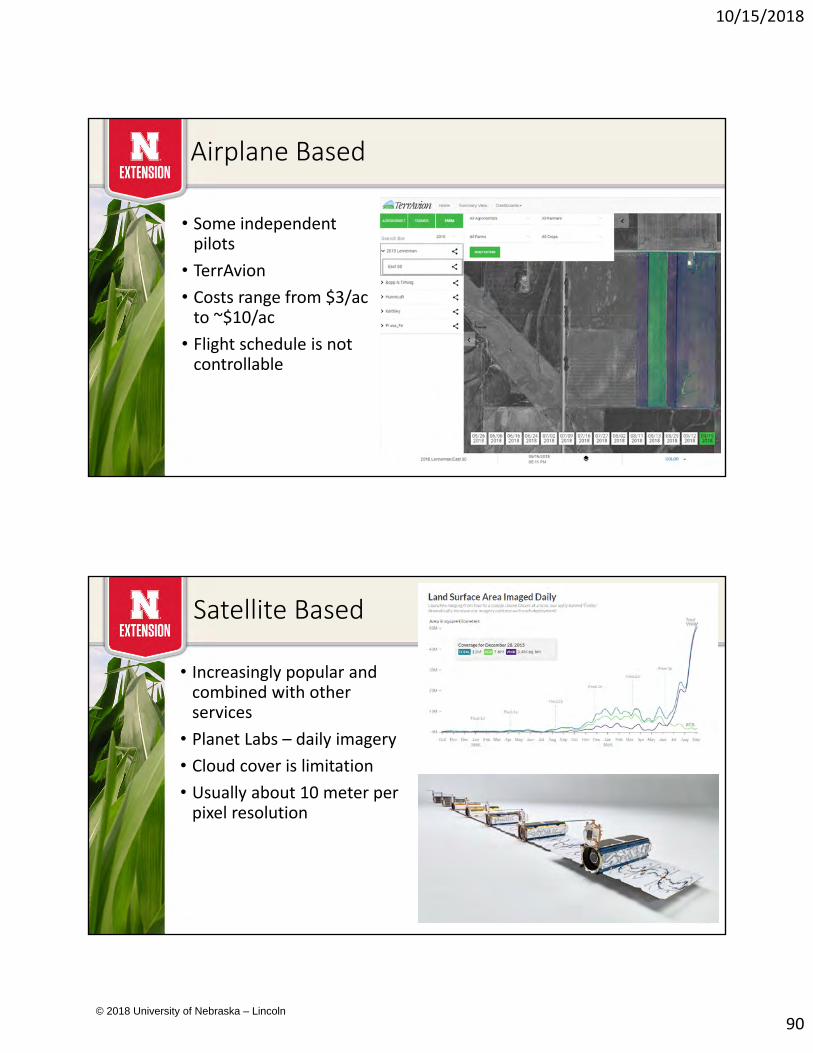
Drone Based
Getting Started with Drones in Agriculture
http://go.unl.edu/drone
© 2018 University of Nebraska – Lincoln
10/15/2018
90
Airplane Based
• Some independent pilots
• TerrAvion
• Costs range from $3/ac to ~$10/ac
• Flight schedule is not controllable
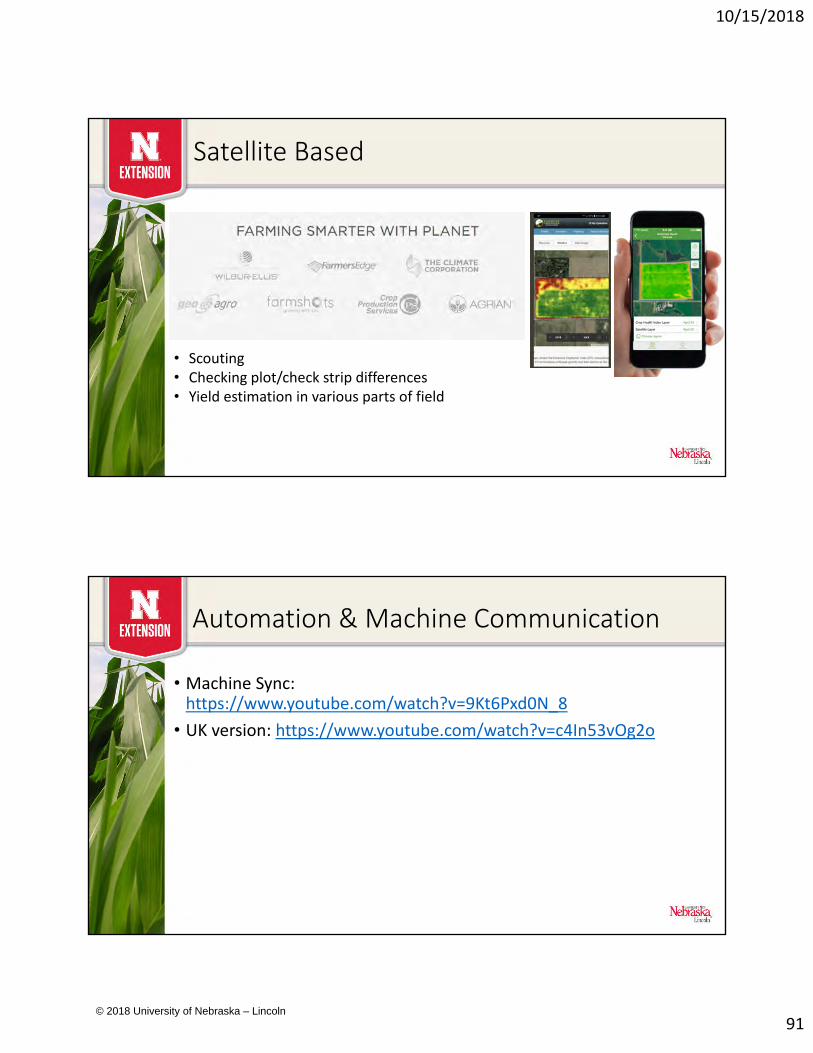
Satellite Based
• Increasingly popular and combined with other services
• Planet Labs – daily imagery
• Cloud cover is limitation
• Usually about 10 meter per pixel resolution
© 2018 University of Nebraska – Lincoln
10/15/2018
91
Satellite Based
• Scouting• Checking plot/check strip differences• Yield estimation in various parts of field
Automation & Machine Communication
• Machine Sync: https://www.youtube.com/watch?v=9Kt6Pxd0N_8
• UK version: https://www.youtube.com/watch?v=c4In53vOg2o
© 2018 University of Nebraska – Lincoln
10/15/2018
92
Contact Info
Nathan Mueller Laura Thompson1206 W 23rd StFremont, NE 68025‐2504Phone: 402‐727‐2775Email: [email protected]:@croptechcafeBlog: http://croptechcafe.org/
1705 Stone StFalls City, NE 68355Phone: 402‐245‐2224Email: [email protected]:@agtechlauraTwitter:@onfarmresearch
© 2018 University of Nebraska – Lincoln