Embed Size (px)
Citation preview

ENVISIONING A SUSTAINABLE CHILE
FIVE FINDINGS ABOUT THE FUTURE OF THE CHILEAN ELECTRICITY AND ENERGY SYSTEM
Authors: Juan Pablo Carvallo1, 2, Patricia Hidalgo-Gonzalez1, 2 and Daniel M. Kammen1, 2, 3 1Renewable and Appropriate Energy Laboratory (RAEL) (http://rael.berkeley.edu) 2Energy and Resources Group 3Goldman School of Public Policy University of California, Berkeley USA Reviewers: Amanda Maxwell4, Doug Sims4, Carlos Finat5 4Natural Resources Defense Council (NRDC) 5Asociación Chilena de Energías Renovables AG. (ACERA)

Executive Summary We employ SWITCH – a long term capacity expansion model developed in the Renewable and Appropriate Energy Laboratory at the University of California, Berkeley – to analyze different scenarios for the Chilean electricity grid’s evolution from 2011-2031. In doing so, we recognized five important and relevant conclusions about the future of the Chilean electric grid:
1. Under a Business-as-usual (BAU) scenario, Chile would become the largest per capita polluter in Latin America and would rank above most European countries, severely affecting its global competitiveness, increasing its risk profile, and failing to meet its international commitment of 20 percent greenhouse gas reductions by 2020. Critically, Chile would generate 47 percent of its energy from imported coal by 2030, an even riskier situation than natural gas imports from Argentina in the late 1990’s with its known consequences.
2. If Chile installed no coal plants from 2014 on, system costs would only go up by 3 percent and carbon dioxide emissions would be halved compared to BAU. Natural gas and non-conventional renewable energy evenly split the gap left by coal plants, compared to BAU, but 70 percent to 100 percent additional incremental liquefied natural gas (LNG) capacity will be required by 2030 compared to existing expansion plans at the two main systems, SING and SIC.
3. Chile can install up to 25 times its 2013 intermittent renewable capacity with existing flexible capacity provided by natural gas plants, which translates to a 7:1 ratio between intermittent resources – wind and solar – and “backup” capacity. Hydropower’s hourly dispatch is adjusted to fit to short term intermittency. A system’s flexibility viewpoint is critical to correctly assess the relationship between intermittent capacity and reliability.
4. Integration costs for high penetration of intermittent renewables triple if transmission expansion is hampered. Restrictions on expanding the transmission system create a wealth transfer towards generators—particularly fossil fuel based ones—that compensates the lack of transmission expansion with larger deployment and more fuel and operational costs.
5. Geothermal energy is the most cost-effective resource and its timing of deployment is sensible to lowering finance rates through schemes that bound exploration risks. Deploying geothermal energy sooner may save between $1 and $11 billion in the 20 year analysis period. Wind power should become the largest source of non-conventional renewable energy in Chile by 2030 with over 7 to 8.5 GW. Utility scale solar power could reach between 1.7 and 3.6 GW by 2030 depending on module cost and finance rate reductions; distributed PV could play a more important role, but we currently lack the data to simulate it properly with SWITCH.
PAGE 1ENVISIONING A SUSTAINABLE CHILE

Introduction The Chilean energy sector faces a number of challenges as the country looks to support and sustain what has been impressive economic growth, to manage energy costs and ensure reliability, to provide universal energy access, and to meet increasingly ambitious and important environmental targets. These challenges can be successfully addressed if Chile turns decisively into a renewable energy based growth path. Consistent with the transition to middle-income status, Chile has seen both the evolution of expectations for a highly functional energy system and witnessed the development of a strong civil society movement that among other things, generally opposes new large conventional power plants – coal, liquefied natural gas (LNG) and large hydro. However, the absence of market signals that integrate the interests of the government, investors, and the public, as well as regulatory uncertainties, have rendered the power grid vulnerable, expensive, and decoupled from load requirements in a growing economy such as Chile. Critics point more generally to a lack of strategic direction from the government. One challenge to developing a strong public dialog energy options in Chile is the lack of a credible model of the power market. Limitations such as the widely cited misconception that transmission capacity needs will not affect future growth of generation, or a lack of detail in the modeling of relevant characteristics of power plants, make it very difficult to obtain a shared and credible view of the different scenarios that Chile could face in the future, their cost, and their environmental externalities. To examine these questions, we employ the SWITCH capacity expansion modeling tool (see, e.g. Nelson, et al, 2012, Mileva, et al, 2013). SWITCH was developed at the University of California-Berkeley’s Renewable and Appropriate Energy Laboratory (RAEL) led by Dan Kammen with Western US, Chile, China, Nicaragua, India, and East Africa models in different development stages. SWITCH is a high temporal and spatial resolution generation and transmission capacity expansion model for the electricity sector. Through a
deterministic linear programming optimization approach, it determines the cost effective generation, transmission, and distribution infrastructure to meet load at a diverse set of sample hours taken in the next 20 years. The optimization is subject to operational, reserve and policy (such as RPSi) constraints that represent a set of real limitations of power systems and electricity markets. More simply, SWITCH provides an algorithm to examine the optimal minimum-cost expansion of Chilean generation and transmission to serve load and comply with operational restrictions in the 2011-2031 period. It does this with an exceptionally high spatial and temporal resolution to represent the grid operation for Chile. The objective function utilized in SWITCH minimizes the net present value of investment, operation, transmission and distribution costs of the entire electric grid. Its strengths come from the way it applies the aforementioned constraints and how it represents temporal intermittency and geographical diversity of renewable resources. The simulation models fuel costs for every year and load area, as well as investment, variable, and fixed costs by technology and year for generation units. It also calculates location-specific connection costs for each new project.. For transmission and distribution, the model uses regional investment and operational costs for each megawatt-kilometer (MW-km) installed. All monetary values in this report are expressed in 2011 dollars. More details about the source of the input data can be found in the supplemental materials and at http://rael.berkeley.edu/switch. Its high temporal and spatial resolution differentiates SWITCH from other simulation exercises for Chile and is a marked improvement to previous studies such as the Escenarios Energéticos 2030 (EE2030) modelii. For more details on the temporal and spatial resolution capacities of SWITCH and differences with EE2030 (EE2030 2013), see Appendix A. We use SWITCH to simulate multiple possible scenarios for the expansion of the Chilean power system from 2011 to 2031. Our objective is to highlight the consequences of higher adoption of renewable resources and constrained hydrocarbon and transmission expansion. The following sections describe five relevant facts about the future of the Chilean electric grid.
PAGE 2ENVISIONING A SUSTAINABLE CHILE
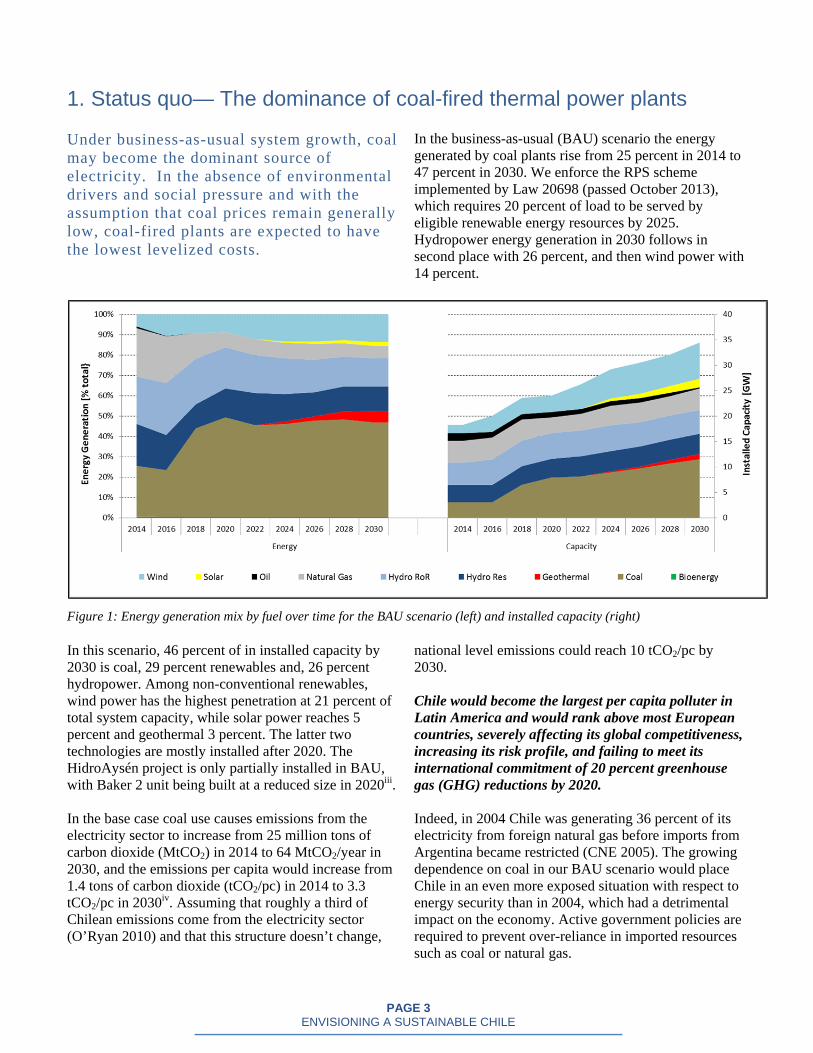
1. Status quo— The dominance of coal-fired thermal power plants Under business-as-usual system growth, coal may become the dominant source of electricity. In the absence of environmental drivers and social pressure and with the assumption that coal prices remain generally low, coal-fired plants are expected to have the lowest levelized costs.
In the business-as-usual (BAU) scenario the energy generated by coal plants rise from 25 percent in 2014 to 47 percent in 2030. We enforce the RPS scheme implemented by Law 20698 (passed October 2013), which requires 20 percent of load to be served by eligible renewable energy resources by 2025. Hydropower energy generation in 2030 follows in second place with 26 percent, and then wind power with 14 percent.
Figure 1: Energy generation mix by fuel over time for the BAU scenario (left) and installed capacity (right) In this scenario, 46 percent of in installed capacity by 2030 is coal, 29 percent renewables and, 26 percent hydropower. Among non-conventional renewables, wind power has the highest penetration at 21 percent of total system capacity, while solar power reaches 5 percent and geothermal 3 percent. The latter two technologies are mostly installed after 2020. The HidroAysén project is only partially installed in BAU, with Baker 2 unit being built at a reduced size in 2020iii. In the base case coal use causes emissions from the electricity sector to increase from 25 million tons of carbon dioxide (MtCO2) in 2014 to 64 MtCO2/year in 2030, and the emissions per capita would increase from 1.4 tons of carbon dioxide (tCO2/pc) in 2014 to 3.3 tCO2/pc in 2030iv. Assuming that roughly a third of Chilean emissions come from the electricity sector (O’Ryan 2010) and that this structure doesn’t change,
national level emissions could reach 10 tCO2/pc by 2030. Chile would become the largest per capita polluter in Latin America and would rank above most European countries, severely affecting its global competitiveness, increasing its risk profile, and failing to meet its international commitment of 20 percent greenhouse gas (GHG) reductions by 2020. Indeed, in 2004 Chile was generating 36 percent of its electricity from foreign natural gas before imports from Argentina became restricted (CNE 2005). The growing dependence on coal in our BAU scenario would place Chile in an even more exposed situation with respect to energy security than in 2004, which had a detrimental impact on the economy. Active government policies are required to prevent over-reliance in imported resources such as coal or natural gas.
PAGE 3ENVISIONING A SUSTAINABLE CHILE

2. No new coal power plants installed? The Chilean system would operate reliably and affordably without any additional coal fired capacity being installed starting in 2014. The general public opposition to coal plants in Chile has proven to be strong and effective: the events related to Barrancones and Punta Alcaldev are signs of it. Then, how would the Chilean electricity grid fare if no additional coal generation was installed starting in 2014? In the no-coal (NC) scenario, new coal plants are prevented from being installed, but we allow both combined cycle and peaker natural gas plants. We show that the absence of this hydrocarbon resource from the Chilean grid does not wreak havoc in the power system.
In the NC scenario coal capacity existing by 2030 is a fifth of its equivalent in the BAU scenario, which leads to CO2 emissions’ reduction close to 50 percent compared to BAU (Figure 2.2). The system’s response to this decreased capacity is to increase installation of gas turbines (+250 percent relative to the BAU scenario), wind (+200 percent solar (+300 percent), and geothermal (+150 percent) by 2030, while keeping hydropower resources roughly the same. Fifty percent of the baseload energy for the 20-year period that was supplied by coal in the BAU scenario is now supplied by non-conventional renewable resources, 70 percent of which are intermittent (Figure 2.1).
Figure 2.1: Energy generation mix by fuel for the BAU scenario (left) and the No Coal scenario (right)
PAGE 4ENVISIONING A SUSTAINABLE CHILE

Figure 2.2: Installed capacity by fuel for the BAU scenario (left) and the No Coal scenario (right)
The NC scenario requires additional gasification capacity to be installed. Currently, the SIC system has 10 million cubic meters per day (MMm3/day) of import and gasification capacity and will expand to 15 MMm3/day by 2015. The SING currently has 5.5 MMm3/day and plans to expand to 8 MMm3/day in the short term. Note that these capacities are not only for electricity production, but for residential, commercial, and industrial gas use as well. From our simulation, we expect average peak day demand for gasified natural gas to increase from 12.5 MMm3/day in 2014 to over 17.5 MMm3/day by 2030 in the SIC, and similarly from 5 MMm3/day to 10.5 MMm3/day in the SING. For the SIC, a no coal scenario would require capacity to provide up to a maximum of 25 MMm3/day of natural gas for electricity alone by 2030. The simulations currently assume that this capacity is available and the incremental costs of new gasification capacity are not factored in. We estimate between a 70 percent and 100 percent incremental LNG capacity expansion on top of
existing expansion projects to meet these requirements by 2030. In this integrative optimization framework, adding those infrastructure costs as decision variables may displace natural gas from the mix and include more renewable resources. A no coal future comes with a modest increase in direct system costs. While $4 billion are saved on fuel in the 2011-2031 period for the no coal scenario, $11 billion more in capital payments are required to build the replacement capacity for coal units. On average, levelized system costsvi for 2014-2030 period increase from $92.50/MWh to $95.18/MWh. This includes an additional $1.5 billion in operational and capital payment costs for new transmission capacity. The whole system's cost (investment and operation for generation, transmission, and distribution) in the 2014-2031 period, will increase by only 2.9 percent compared to the BAU scenario. We estimate that including the costs for new gasification infrastructure would slightly increase costs by 0.1 to 0.2 $/MWh.
PAGE 5ENVISIONING A SUSTAINABLE CHILE

3. High integration of intermittent renewable energy: technically and economically feasible without additional backup capacity
The cost of integrating variable renewable energy sources of non-conventional renewable energy is low in any scenario. Twenty five times the existing intermittent renewable capacity in 2013 can be built with Chile's existing dispatchable capacity and the ratio of renewable energy to backup capacity is seven to one when taking a systems-level metric.
In this section we assess how reserves and backup capacity are deployed and dispatched in scenarios with high penetration of intermittent non-conventional renewable resources, namely solar and wind. We aim to measure the jointvii SIC-SING long term and cost minimizing system’s response to the addition of over 25 GW of intermittent renewable resources in the course of 20 years. We focus particularly on determining the amount of “backup” capacity that the system as whole requires to provide flexibility and operate this large amount of intermittent resources. For this purpose, we create and analyze three scenarios:
1. A high RPS scenario that yields a large, feasible, and consistent penetration of renewable resources. In this case the expansion of the Chilean system is simulated
under a requirement of 50 percent energy generated from non-conventional renewable resources by 2030. 2. A “no intermittency” control scenario in which any technology that employs short-term intermittent resources (wind and solar) is removed from the project pool. We create this experimental scenario as a benchmark to compare how the addition of intermittency alone affects the system compared to a system with no additional intermittency.
3. The “forced intermittency” test scenario, in which we impose new wind and solar capacity expansion based on the high RPS scenario, but let SWITCH determine the cost-effective grid that is built around this restriction.
To analyze capacity expansion, we collate technologies in six groups: Intermittent (Wind and Solar), Baseload (Geothermal, Bioenergy), Flexible baseload (Coal), Dispatchable (Combined Cycle Gas Turbines (CCGT), Simple Cycle Gas Turbines (SCGT) and oil turbines/engines), Hydro run-of-river, and Hydro reservoir. Figure 3 shows the non-intermittent scenario capacity expansion (left) and the forced intermittent scenario expansion (right).
Figure 3: Simulated capacity expansion for non-intermittent (control) and forced-intermittent (test) scenarios. In the forced-intermittent scenario, the green (wind and solar) area is a restriction rather than a result because it reflects forced installation of these resources to test the system’s response to it.
PAGE 6ENVISIONING A SUSTAINABLE CHILE
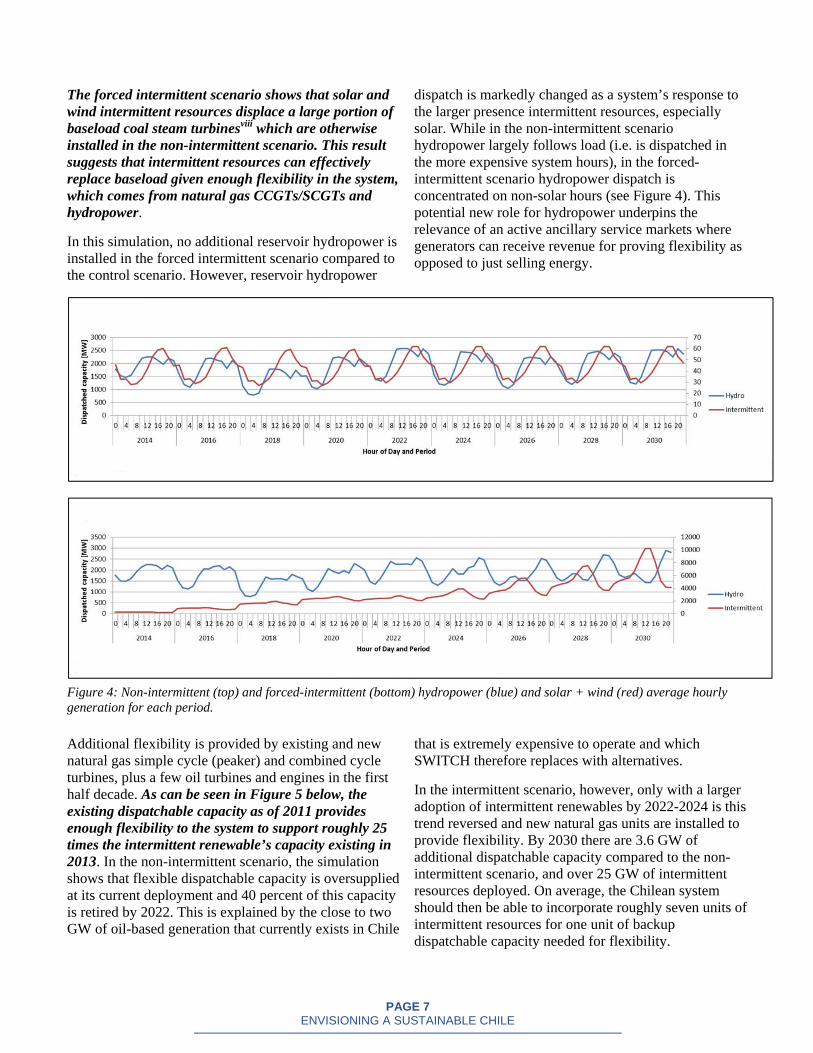
The forced intermittent scenario shows that solar and wind intermittent resources displace a large portion of baseload coal steam turbinesviii which are otherwise installed in the non-intermittent scenario. This result suggests that intermittent resources can effectively replace baseload given enough flexibility in the system, which comes from natural gas CCGTs/SCGTs and hydropower.
In this simulation, no additional reservoir hydropower is installed in the forced intermittent scenario compared to the control scenario. However, reservoir hydropower
dispatch is markedly changed as a system’s response to the larger presence intermittent resources, especially solar. While in the non-intermittent scenario hydropower largely follows load (i.e. is dispatched in the more expensive system hours), in the forced-intermittent scenario hydropower dispatch is concentrated on non-solar hours (see Figure 4). This potential new role for hydropower underpins the relevance of an active ancillary service markets where generators can receive revenue for proving flexibility as opposed to just selling energy.
Figure 4: Non-intermittent (top) and forced-intermittent (bottom) hydropower (blue) and solar + wind (red) average hourly generation for each period.
Additional flexibility is provided by existing and new natural gas simple cycle (peaker) and combined cycle turbines, plus a few oil turbines and engines in the first half decade. As can be seen in Figure 5 below, the existing dispatchable capacity as of 2011 provides enough flexibility to the system to support roughly 25 times the intermittent renewable’s capacity existing in 2013. In the non-intermittent scenario, the simulation shows that flexible dispatchable capacity is oversupplied at its current deployment and 40 percent of this capacity is retired by 2022. This is explained by the close to two GW of oil-based generation that currently exists in Chile
that is extremely expensive to operate and which SWITCH therefore replaces with alternatives.
In the intermittent scenario, however, only with a larger adoption of intermittent renewables by 2022-2024 is this trend reversed and new natural gas units are installed to provide flexibility. By 2030 there are 3.6 GW of additional dispatchable capacity compared to the non-intermittent scenario, and over 25 GW of intermittent resources deployed. On average, the Chilean system should then be able to incorporate roughly seven units of intermittent resources for one unit of backup dispatchable capacity needed for flexibility.
PAGE 7ENVISIONING A SUSTAINABLE CHILE

Figure 5: Evolution of dispatchable capacity in non-intermittent and forced-intermittent scenarios. The dotted grey line shows the intermittent renewable adoption in the forced-intermittent scenario.
4. Cost effective expansion of utility scale renewables depends on the expansion of the transmission system
Integration costs are driven by transmission expansion, which accounts for two-thirds of the system’s level integration costs. The social levelized cost of integrating 25 GW of intermittent renewable resources under this scenario is 2.5 $/MWh over the 2014-2031 period of grid operation. Results show that a system whose transmission expansion is hampered presents integration costs that triple the ones from a grid that expands cost-efficiently.
SWITCH does not have the real world limitations of deploying transmission. In contrast, the current state of the Chilean system is influenced by the delays in transmission construction in the last decade, which SWITCH “corrects” by expanding existing transmission to 50 percent of its current capacity after the first five years (recall we use a present year of 2011), as shown in solid lines in Figure 6 below. In this section, we use the same “no intermittency” and “forced intermittency” scenarios from the previous section to understand the impact that restrictions of the rate of transmission expansion would have on the system’s evolution.
PAGE 8ENVISIONING A SUSTAINABLE CHILE

Figure 6: Transmission capacity expansion for Chile. Solid lines correspond to the original non-intermittent and forced-intermittent scenarios; dashed lines to same scenarios with capped transmission expansion speed.
As seen above, transmission still grows significantly in the original forced-intermittent scenario after 2016, as the system gains flexibility for intermittency by being able to tap its geographically dispersed resources. To deploy 25 GW of intermittent capacity over the 20-year period the system adds roughly 35 more GW in trunk transmission capacity on the forced-intermittent scenario compared to the non-intermittent scenario by 2030.
To check how the system balances transmission and other technologies for flexibility, a “reality-check” restriction was imposed by preventing the optimization model to install more than X percent transmission capacity in period n + 1 compared to existing capacity in period n. The result of this in terms of transmission capacity expansion can be seen in the dashed lines shown in Figure 6 above. For the first half decade a 25 percent growth is allowed; thereafter, a 3 percent inter-period maximum capacity growth rate is permitted based on historical rate of additions to the transmission system in Chile.
The impact of restricted transmission is not to increase the system’s flexibility through dispatchable capacity addition, but to spill portions of the forced renewable generation and add about 40 percent more coal baseload compared to the unrestricted scenario. In a market based context where intermittent generators need to sell their
output to earn their profit this situation is unacceptableix.The initial restriction of imposing a particular growth path for intermittent renewable resources is admittedly inefficient, but it reveals the critical interdependence between transmission deployment, dispatchable resources, and eventually, storage. Results show that the SIC-SING interconnection plays a critical role in increasing system flexibility and cost reduction by exporting from SING blocks of energy during the day and importing from SIC at morning and night.
The restrictions we impose are not connected to any policy prescription nor are the results of any real constraint, but they are an experiment to describe what the Chilean power would have to look like to adopt large quantities of intermittent renewable resources. Having said this, we can estimate the levelized cost difference between the two scenarios, and their transmission-restricted equivalents, to determine approximate integration costs. Two versions of $/MWh costs are calculated: one using total load in the denominator and the other using intermittent output instead. The former captures a socialized levelized cost, while the latter assumes only intermittent generators should pay the additional system costs associated with the deployment of intermittent capacity.x
PAGE 9ENVISIONING A SUSTAINABLE CHILE
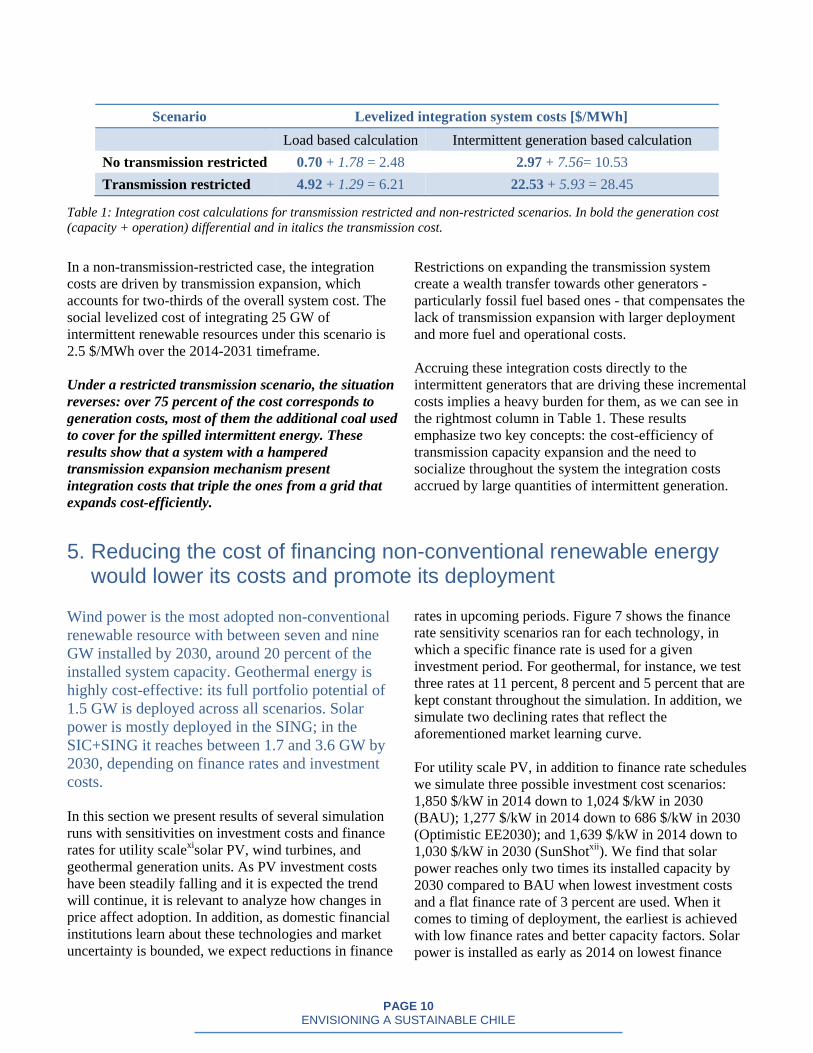
Scenario Levelized integration system costs [$/MWh]
Load based calculation Intermittent generation based calculation
No transmission restricted 0.70 + 1.78 = 2.48 2.97 + 7.56= 10.53
Transmission restricted 4.92 + 1.29 = 6.21 22.53 + 5.93 = 28.45
Table 1: Integration cost calculations for transmission restricted and non-restricted scenarios. In bold the generation cost (capacity + operation) differential and in italics the transmission cost.
In a non-transmission-restricted case, the integration costs are driven by transmission expansion, which accounts for two-thirds of the overall system cost. The social levelized cost of integrating 25 GW of intermittent renewable resources under this scenario is 2.5 $/MWh over the 2014-2031 timeframe. Under a restricted transmission scenario, the situation reverses: over 75 percent of the cost corresponds to generation costs, most of them the additional coal used to cover for the spilled intermittent energy. These results show that a system with a hampered transmission expansion mechanism present integration costs that triple the ones from a grid that expands cost-efficiently.
Restrictions on expanding the transmission system create a wealth transfer towards other generators - particularly fossil fuel based ones - that compensates the lack of transmission expansion with larger deployment and more fuel and operational costs. Accruing these integration costs directly to the intermittent generators that are driving these incremental costs implies a heavy burden for them, as we can see in the rightmost column in Table 1. These results emphasize two key concepts: the cost-efficiency of transmission capacity expansion and the need to socialize throughout the system the integration costs accrued by large quantities of intermittent generation.
5. Reducing the cost of financing non-conventional renewable energy would lower its costs and promote its deployment
Wind power is the most adopted non-conventional renewable resource with between seven and nine GW installed by 2030, around 20 percent of the installed system capacity. Geothermal energy is highly cost-effective: its full portfolio potential of 1.5 GW is deployed across all scenarios. Solar power is mostly deployed in the SING; in the SIC+SING it reaches between 1.7 and 3.6 GW by 2030, depending on finance rates and investment costs.
In this section we present results of several simulation runs with sensitivities on investment costs and finance rates for utility scalexisolar PV, wind turbines, and geothermal generation units. As PV investment costs have been steadily falling and it is expected the trend will continue, it is relevant to analyze how changes in price affect adoption. In addition, as domestic financial institutions learn about these technologies and market uncertainty is bounded, we expect reductions in finance
rates in upcoming periods. Figure 7 shows the finance rate sensitivity scenarios ran for each technology, in which a specific finance rate is used for a given investment period. For geothermal, for instance, we test three rates at 11 percent, 8 percent and 5 percent that are kept constant throughout the simulation. In addition, we simulate two declining rates that reflect the aforementioned market learning curve. For utility scale PV, in addition to finance rate schedules we simulate three possible investment cost scenarios: 1,850 $/kW in 2014 down to 1,024 $/kW in 2030 (BAU); 1,277 $/kW in 2014 down to 686 $/kW in 2030 (Optimistic EE2030); and 1,639 $/kW in 2014 down to 1,030 $/kW in 2030 (SunShotxii). We find that solar power reaches only two times its installed capacity by 2030 compared to BAU when lowest investment costs and a flat finance rate of 3 percent are used. When it comes to timing of deployment, the earliest is achieved with low finance rates and better capacity factors. Solar power is installed as early as 2014 on lowest finance
PAGE 10ENVISIONING A SUSTAINABLE CHILE

rate and investment cost scenarios, 2016 for a high capacity factor and medium investment costs scenario, and 2024 for BAU. Solar power is mostly deployed in the SING, and in the SIC+SING it reaches between 1.7 and 3.6 GW by 2030. Even in scenarios of low capital
costs and low finance rates, utility scale solar power deployment is limited by storage and/or diversity restrictions and may significantly benefit from demand response programs and declining costs of storage.
Figure 7: Finance rate schedules used as sensitivity scenarios for solar PV (left), wind (center), and geothermal (right) technologies.
Wind power is a more mature technology and there is less uncertainty in the evolution of investment costs. However, finance rates could decrease with better project financing in Chile. Deployment starts from 2014 on both BAU and a declining finance rate scenario (Figure 6). However, by 2030 22 percent more capacity – 8.7 GW versus 7.1 GW – is installed in the declining finance rate scenario compared to BAU. Geothermal energy is a cost-effective resource, whose deployment is hampered by insufficient state support for exploration and overall risk hedging. We tested different declining finance rate schedules (Figure 7), as investment costs are relatively mature for this technology. Simulations show that all available 1500 MW of geothermal capacity are installed in all of these
sensitivity scenarios except in the flat rate of 11 percent scenario, where it reaches a maximum of 1060 MW installed. However, timing varies widely with finance rate schedules. The earliest deployment of its complete capacity of 1500 MW occurs in 2018 under the scenario of a 5 percent flat rate, followed by the 8 percent flat rate (full capacity deployed in 2020), then declining slow scenario (2024), and finally declining fast (2026). Considering the sensitivity scenarios where geothermal was deployed at its maximum, an earlier deployment would generate savings of between $1 and $11 billion compared to BAU, which supports the importance of adopting policies and incentives that share exploration and operation risks with private operators.
PAGE 11ENVISIONING A SUSTAINABLE CHILE

References Acuña E., J. C. Pérez, J. Villalón, G. Villalón (2005) “Chile: Proyecciones y Estimaciones de Población.
Total País Período de Información: 1950-2050”. Instituto Nacional de Estadisticas. Comision Nacional de Energia, CNE (2005) “Balance Energetico 2004”, retrieved from
http://www.cne.cl/estadisticas/balances-energeticos. Escenarios Energeticos 2030 (2013), “Escenarios Energeticos Chile 2030: Visiones y temas clave para la
matriz eléctrica” Mileva, A., Nelson, J. H., Johnston, J., and Kammen, D. M. (2013) “SunShot Solar Power Reduces Costs
and Uncertainty in Future Low-Carbon Electricity Systems,” Environmental Science & Technology, 47 (16), 9053 – 9060. dx.doi.org/10.1021/es401898f
Nelson, J. H., Johnston, J., Mileva, A., Fripp, M., Hoffman, I., Petros-Good, A., Blanco, C., and Kammen, D. M. (2012) “High-resolution modeling of the western North American power system demonstrates low-cost and low-carbon futures”, Energy Policy, 43, 436–447.
O’Ryan, R., Diaz M., Clerc J. (2010) “Energy Consumption, Greenhouse Gas Emissions and Mitigation Options for Chile, 2007-2030”, Program for Environmental Economics and Management (PROGEA), Department of Industrial Engineering, University of Chile
Tidwell, V. C., L. Dale, G. Franco, K. Averyt, M. Wei, D. M. Kammen, and J. H. Nelson. 2013. “Energy: Supply, Demand, and Impacts.” In Assessment of Climate Change in the Southwest United States: A Report Prepared for the National Climate Assessment, edited by G. Garfin, A. Jardine, R. Merideth, M. Black, and S. LeRoy, 240–266. A report by the Southwest Climate Alliance. Washington, DC: Island Press.
Wei, M., Nelson, J. H., Greenblatt, J. B., Mileva, A., Johnston, J., Ting, M., Yang, C., Jones, C.,
McMahon, J. E. and Kammen, D. M. (2013) “Deep carbon reductions in California require electrification and integration across economic sectors”, Environmental Research Letters, 8, doi:10.1088/1748-9326/8/1/014038
PAGE 12ENVISIONING A SUSTAINABLE CHILE

Appendix A In this appendix we provide more detail on SWITCH spatial and temporal features as well as further comparison with the EE2030 exercise. SWITCH Temporal resolution In the current version of SWITCH-Chile, the algorithm makes investment decisions for each of ten two-year periods. Within each period, there are a number sampled hours that represent a specific hour of the year for which load and operational constraints must be met. Twelve hours are picked from the median and peak load day for each month of the second year in each investment period. In this report, 10 periods are simulated, with a 12-hour division, resulting in 12 [sampled hours/day] x 2 [days/month] x 12 [months/year] x 2 [years/periods] x 10 [periods] = 2880 simulated sampled hours. Load and intermittent resource data – namely wind, solar and run of river hydropower - are time-synchronized, so this sampling approach reflects the existing synergies between load and resource availability at the hourly level. SWITCH can use several different hydrological conditions for its 20 year simulation. For this report, we default to a medium hydrologyxiii condition. SWITCH Spatial resolution In SWITCH we divide the Chilean power grid into 23 load areas. Load areas (or nodes) are defined by a mixture of electricity and geographic criteria. For Chile, the four load areas in the northern grid (the Sistema Interconectado del Norte Grande, or SING) represent the geographical division used by system operator CDEC-SING. An additional 18 load areas represent marginal cost subsystems used by the central grid’s (the Sistema Interconectado Central, or SIC) system operator CDEC-SIC, while one load area represents the “far south”. This spatial resolution is three times larger than the model used for EE2030. It is assumed that within a load area there are no transmission congestion limitations in the short term, but transmission congestion can exist between load areas. Existing load and generation are allocated to these nodes based on their location in the power grid and future projects are assigned to a particular load area to be built in. Existing transmission is reduced to corridors between adjacent and non-adjacent load areas and future transmission is built based on these existing corridors and potential new ones defined by the user. EE2030 was not based on an overall national optimization as in SWITCH. In the EE2030 case, the optimization was performed from previously custom-made pools of prospective power plants. In contrast, SWITCH is essentially an investment portfolio builder that limits the size of specific projects, but decouples from existing decisions by letting the algorithm decide what capacity of a specific technology to build in a given location. For example, SWITCH is provided with a site to build up to one gigawatt (GW) in photovoltaic (PV) solar, but it depends on the optimization model to decide how much to deploy in each period. This captures dynamics that isolated developers cannot, making SWITCH a true central planner with perfect foresight. While the central planning assumption is strong, its results are very useful to assess the effects of existing institutional arrangements in global system optimization and to derive useful prescriptions regarding quantitative and temporal/spatial design aspects for policy makers.
PAGE 13ENVISIONING A SUSTAINABLE CHILE

Endnotes
i Renewable Portfolio Standard is a regulatory tool that generally requires a minimum capacity and/or energy to be supplied by eligible renewable energy based resources, commonly solar, wind, biomass, and geothermal.
iiThe Escenarios Energéticos 2030 (EE2030) analysis used the PET modeling platform, which has a seven blocks per trimester resolution that doesn’t represent intermittent resources’ hourly capacity factors. It also used 8 nodes to represent the SIC and SING transmission systems, while SWITCH uses 23 including the far south to simulate HidroAysén. PET has an improved representation of hydrology than SWITCH and both models are equally important in analyzing possible pathways for the Chilean electricity sector.
iii SWITCH does not restrict the five HidroAysén units from being deployed concurrently. Under our assumptions, other smaller hydro projects in the pipeline such as Angostura and San Pedro are installed between 2018 and 2022.
ivPopulation growth projections taken from Instituto Nacional de Estadísticas (Acuña 2005).
vThese two coal projects had undergone or were undergoing the regular environmental permitting process and their development was halted by political decisions due to increased public pressure over environmental and social impacts.
viLevelized system costs represent the per-kWh cost (in real dollars) of building and operating a generating plant and transmission infrastructure over an assumed financial life and duty cycle.
viiWe allow SWITCH to decide when and how to interconnect SIC and SING. SWITCH always interconnects as early as possible (2016) with capacities varying from 500 to 3000 MW depending on the scenario. Given that it’s expected the connection will materialize in 2017, we decided not to force a delay in our simulations. These cost-effectiveness results are consistent with the National Energy Commission’s (CNE) findings in previous studies.
viii Recall that since there are no environmental compliance restrictions, reduced coal installation does not come from the need to reduce GHG emissions or other pollutants.
ixNote that spilled energy is not currently penalized in the SWITCH model. Incorporating a cost for “unsold” output may force the simulation to look for cost-effective operational arrangements and alternative capacity expansion routes.
xVery importantly, several benefits of using non-conventional renewables are not being accounted at all, nor are the costs of spilled energy as indicated before.
xiAlthough SWITCH has the capability to simulate distributed solar, we lack the data to include residential and commercial photovoltaic projects. We are working to gain access to this data and integrate distributed solar in future work.
xiiThe SunShot initiative is a U.S. Department of Energy program that aims to reduce module costs to $1000/kW by 2020.
xiii A hydrology condition is defined as the total inflow from rivers into the different watersheds in Chile. A medium hydrology condition is considered a “normal” or median year of rainfall and snowmelt.
OCTOBER 2014
ENVISIONING A SUSTAINABLE CHILE