Embed Size (px)
Citation preview
GOVERNMENT OF GHANA
Prepared By
VICADA Consult
March 2013
NORTHERN RURAL GROWTH PROGRAMME (NRGP)
MONITORING AND EVALUATION SYSTEM
MINISTRY OF FOOD AND AGRICULTURE (MOFA)
IMPLEMENTATION MANUAL
Implementation Manual-M&E System Designed for the NRGP
i
ABBREVIATIONS AND ACRONYMS
ACDEP Association of Churches Development Project
ADB - African Development Bank
ADF - African Development Fund
AEA - Agricultural Extension Agent
AgDB - Agricultural Development Bank
AgSSIP Agricultural Services Sector Investment Programme
APR - Annual Project Review
BA - Beneficiary Assessment
CBP Commodity Business Plans
DA - District Assembly
DADU - District Agricultural Development Unit
DDA District Director of Agriculture
DFR - Department of Feeder Roads
DVCC District Value Chain Committee
EPA - Environmental Protection Agency
FASDEP - Food and Agriculture Sector Development Programme
FBB Farmer Business Book
FBO - Farmer Based Organisations
GDP - Gross Domestic Product
GIDA - Ghana Irrigation Development Authority
GoG - Government of Ghana
GPRSII -Growth and Poverty Reduction Strategy
IFAD - International Fund for Agriculture Development
IFAD RIMS IFAD Results and Impact Monitoring System
MDGs - Millennium Development Goals
MISO Management Information Systems Officer
MOFA - Ministry of Food and Agriculture
M&E = Monitoring and Evaluation
NGO - Non Governmental Organization
NPC - National Programme Coordinator
NRGP Northern Rural Growth Programme
PFIs Participating Financial Institutions
PIU - Project Implementation Unit
PMU - Project Management Unit
PPMED - Policy Planning, Monitoring and Evaluation Directorate
PO Producer Organisations
RADU - Regional Agriculture Development Unit
RDA Regional Director of Agriculture
SME - Small and Medium Scale Enterprises
SNV Netherlands Development Organisation SRID - Statistics Research and Information Directorate
UWR Upper West Region
VC Value Chain
VCD Value Chain Development
Implementation Manual-M&E System Designed for the NRGP
ii
TABLE OF CONTENTS
ABBREVIATIONS AND ACRONYMS.................................................................................................................... I
LIST OF TABLES .................................................................................................................................................... III
LIST OF FIGURES ...................................................................................................................................................IV
LIST OF BOXES .......................................................................................................................................................IV
PREFACE .................................................................................................................................................................... 1
1.0 PROJECT OVERVIEW .................................................................................................................................. 1
1.1 CONTEXT AND BACKGROUND .......................................................................................................................... 1
2.0 THE THEORY OF CHANGE AND INFORMATION COMPONENTS OF THE NORTHERN
RURAL GROWTH PROGRAMME ......................................................................................................................... 1
2.1 PROJECT GOALS ............................................................................................................................................... 2 2.2 PROJECT OUTCOME .......................................................................................................................................... 2
2.2.1 Identified Programme Outcomes ........................................................................................................... 3 2.3 PROJECT OUTPUTS ........................................................................................................................................... 3
2.3.1 Commodity Chain Development Component - Outputs ......................................................................... 3 2.3.2 Rural Infrastructure Component - Outputs............................................................................................ 3 2.3.3 Improving Access to Rural Financial Services ...................................................................................... 4 2.3.4 Project management component ............................................................................................................ 4
2.4. PROJECT ACTIVITIES ........................................................................................................................................ 4 2.4.1 Commodity Chain Development Component – Activities ...................................................................... 4 2.4.2 Rural Infrastructure Development Component – Activities ................................................................... 5 2.4.3 Access to Rural Financial Services Component – Activities ................................................................. 5 2.4.4 Programme Management, Coordination, Monitoring and Evaluation Component – Activities ........... 5
2.5 PROJECT INPUTS............................................................................................................................................... 6
3.0 ESTABLISHMENT OF INDICATORS FOR THE NRGP COMPONENTS. ......................................... 15
3.1. THE PERFORMANCE FRAMEWORK OF THE PROJECT .......................................................................................... 21 3.2. SOURCES OF DATA ......................................................................................................................................... 35
4.0 DATA COLLECTION METHODOLOGIES FOR NRGP ....................................................................... 36
5.0 ORGANISATION AND IMPLEMENTATION OF THE NRGP M&E SYSTEM .................................. 38
5.1. LEVELS OF MONITORING ............................................................................................................................... 38 5.2 SPECIFICATION OF ROLES AND RESPONSIBILITIES OF VARIOUS ACTORS OF THE M&E PROCESS ..................... 38
5.2.1 Roles and Responsibilities of PCU M&E ............................................................................................ 38 5.2.2. Responsibility for M&E at the Implementing Agency level – (DADUs, RADUs, ACDEP, SNV, DFR,
GIDA, PFIs) .................................................................................................................................................. 39 5.3 COMMUNICATING M&E FINDINGS AND PROVIDING FEEDBACK ..................................................................... 40
5.3.1 Presentation of Performance data ....................................................................................................... 40 5.3.2. Quality of Information presented in reports ........................................................................................ 42 5.3.3. M&E Structure & Information Flow .......................................................................................... 43 5.3.4 Strategies for sharing Information ...................................................................................................... 45 5.3.5. Reporting Deadlines ............................................................................................................................ 45
6.0. ORGANISING CRITICAL REFLECTION EVENTS. .............................................................................. 46
7.0. NECESSARY CONDITIONS AND CAPACITIES FOR M&E IMPLEMENTATION. ....................... 48
7.1. TECHNOLOGICAL AND HUMAN CAPACITY NEEDS FOR M&E ......................................................................... 48 7.2. THE M&E WORK PLAN/CALENDAR ................................................................................................................. 49
8.0 EVALUATION FRAMEWORK FOR THE NRGP .................................................................................... 64
9.0 FRAMEWORK FOR BENEFICIARY ASSESSMENT OF NRGP. ......................................................... 77
Implementation Manual-M&E System Designed for the NRGP
iii
9.1 FOCUS OF NRGP BENEFICIARY ASSESSMENT ................................................................................................... 77 9.2 SELECTING INSTITUTIONS AND FIELD RESEARCHERS FOR BENEFICIARY ASSESSMENT ......................................... 77 9.3 PREPARING TERMS OF REFERENCE FOR BENEFICIARY ASSESSMENT IMPLEMENTATION: ....................................... 78 9.4 SAMPLING FRAMES: ......................................................................................................................................... 78 9.5 PREPARING INTERVIEW GUIDES: ...................................................................................................................... 78 9.6 METHODOLOGY: ............................................................................................................................................ 78 9.7 TRAINING OF FIELD RESEARCHERS: ............................................................................................................... 79 9.8 REPORT PREPARATION: .................................................................................................................................. 79
10.0 M&E DATABASE DEVELOPMENT .......................................................................................................... 81
11.0 PROGRESS REPORTING FORMATS ....................................................................................................... 82
APPENDICES ........................................................................................................................................................... 90
APPENDIX 1: FIELD TRIP REPORT ............................................................................................................................ 90 APPENDIX 2: PRODUCER ORGANISATION FORMATION SUMMARY SHEET ......................................... 91 APPENDIX 3: GENERAL INFORMATION ON PRODUCER ORGANISATION MEMBERS ......................... 92 NAME OF SUPERVISOR………………… ................................................................................................................. 93 APPENDIX 4: MONTHLY PERFORMANCE SUMMARY SHEET ON PRODUCER ORGANISATION
FORMATION ........................................................................................................................................................ 93 APNDIX 5: PRODUCER PROFESSIONAL BODIES FORMAT ....................................................................................... 94 APPENDIX 6: COMMODITY INTER-PROFESSIONAL BODIES FORMAT ...................................................................... 95 APPENDIX 7: FORMATION OF VALUE CHAINS FORMAT ......................................................................................... 96 APPENDIX 8: IMPLEMENTATION OF COMMODITY BUSINESS PLAN FORMAT ......................................................... 97 APPENDIX 9: SUPPORT FOR PUBLIC GOODS WINDOW FORMAT ............................................................................ 98 APPENDIX 10: SMALL SCALE IRRIGATION DEVELOPMENT FORMAT .................................................................... 99 APPENDIX 11: MARKETING INFRASTRUCTURE FORMAT .................................................................................... 100 APPENDIX 12: CREDIT -GENERAL CLIENT INFORMATION FORMAT - BORROWERS ........................ 101 APPENDIX 13: CREDIT - GENERAL CLIENT INFORMATION FORMAT - DEPOSITORS .................... 102 APPENDIX 14: CREDIT DISBURSEMENT AND REPAYMENT SUMMARY SHEET ................................. 103 APPENDIX 15: CREDIT REPAYMENT MONITORING FORM ...................................................................... 104 APPENDIX 16 FINANCIAL SERVICES TRAINING FORMAT ....................................................................................... 105 APPENDIX 17: CBP FINANCING FORMAT ........................................................................................................... 106 APPENDIX 18: PROJECT MANAGEMENT FORMAT ............................................................................................... 107 APPENDIX 19: CONTRACT MANAGEMENT FORMAT ............................................................................................ 108 APPENDIX 20: PROJECT DEVELOPMENT INDICATORS FORMAT .......................................................................... 109 APPENDIX 21: SUSTAINABILITY FORMAT ........................................................................................................... 110
LIST OF TABLES TABLE 1: OUTPUT TO OUTCOME REVIEW ............................................................................................................................... 7 TABLE 2: LIST OF INDICATORS AND THEIR DEFINITION .............................................................................................................. 16 TABLE 3: INDICATORS AND TARGETS FOR COMMODITY CHAIN DEVELOPMENT COMPONENT .................................... 22 TABLE 4:INDICATORS AND TARGETS FOR RURAL INFRASTRUCTURE DEVELOPMENT COMPONENT ........................... 26 TABLE 5: INDICATORS AND TARGETS FOR ACCESS TO RURAL FINANCIAL SERVICES COMPONENT .............................. 28 TABLE 6:INDICATORS AND TARGETS FOR PROJECT MANAGEMENT COMPONENT ...................................................... 30 TABLE 7: INDICATORS AND TARGETS FOR OUTCOMES ................................................................................................ 31 TABLE 8: DATA ANALYSIS PROCEDURES TO BE USED ............................................................................................................... 41 TABLE 9: PERFORMANCE INDICATOR REPORT ........................................................................................................................ 41 TABLE 10: REPORTING DEADLINES ....................................................................................................................................... 45 TABLE 11: NORTHERN RURAL GROWTH PROGRAMME -M&E CALENDAR ................................................................... 49 TABLE 12: INFORMATION MATRIX FOR OUTPUT INDICATORS ...................................................................................... 52 TABLE 13: INFORMATION MATRIX FOR OUTCOME INDICATORS .................................................................................. 62 TABLE 14: EVALUATION FRAMEWORK .................................................................................................................................. 67 TABLE 15: INDICATOR REPORT SHEET FOR COMPOPNENT 1 ...................................................................................... 83 TABLE 16: INDICATOR REPORT SHEET FOR COMPONENT 2 ........................................................................................ 85
Implementation Manual-M&E System Designed for the NRGP
iv
TABLE 17: INDICATOR REPORT SHEET FOR COMPONENT 3 ......................................................................................... 87 TABLE 18: INDICATOR REPORT SHEET FOR COMPONENT 4 ........................................................................................ 88 TABLE 19: INDICATOR REPORT SHEET FOR OUTCOMES ............................................................................................... 89
LIST OF FIGURES FIG 1: NRGP DEVELOPMENT PROCESS ................................................................................................................................... 3 FIGURE 2: NRGP LOGIC MODEL ........................................................................................................................................... 1 FIGURE 3: FLOW CHART OF NRGP ...................................................................................................................................... 44
LIST OF BOXES BOX 1: DATA SOURCES FOR NRGP ---------------------------------------------------------------------------------------------------------------- 35 BOX 2: DATA COLLECTION METHODS FOR NRGP ------------------------------------------------------------------------------------------------ 36
Implementation Manual-M&E System Designed for the NRGP
1
PREFACE This M&E implementation Manual was prepared to ensure that staff of the Northern Rural
Growth Programme, participating MDAs, Implementing Agency staff, and stakeholders of the
project M&E process are properly informed about how monitoring and evaluation of NRGP
investments are to be carried out.
The manual relies heavily on results – based management approach for achieving results and
enhancing transparency and accountability through performance measurement and reporting.
Subsequently there is a clear shift from focus on implementation monitoring to results
monitoring.
The Manual is divided into eleven (11) chapters. Chapter 1 deals with the project background
and the key activities of the project components, which form the basis for the development of
project indicators. In this chapter the rationale for setting up the M&E system for the project and
the approach adopted in developing the M&E framework are also articulated.
Chapter 2 presents the theory of change, in which an explicit analysis of the logic underlying the
design of the NRGP is well articulated. The theory of change of the NRGP establishes the causal
relationships between the various levels of results of the project. It demonstrates the way in
which this logic is linked to the identification of information needs for indicators that will be
measured in the course of monitoring and evaluation activities of the project.
Chapter 3 ― Development of project component indicators‖ explains how indicators were
established for each component. In developing indicators for the project, efforts were made to
ensure that they met the test of being objectively verifiable, simple to measure, practical,
independent and cost effective. Furthermore, the selected indicators are expected to measure
what is important in the hierarchy of results, as well as change that is attributable to the project
Details of the results framework of the project, i.e. the completed matrix of the first, second and
third level of results, project indicators and targets are also presented in this chapter. The results
framework will form the basis for planning, resource allocation and project control.
Chapter 4 details data collection methodologies for the project. A mix of data collection methods
has been identified for the various indicators of the project. The methods include: written
document reviews, interviews, key informant interviews, client satisfaction surveys, focus
groups, observations, field visits and surveys. Steps involved in the use of the various data
collection methods have also been clearly outlined.
Chapter 5 ―Organization and Implementation of the M&E system‖ emphasizes the premise upon
which the M&E system is built. The system is anchored on the principle that the level that
records information should be able to use it. This is to ensure that data will be carefully collected
and used for decision-making purposes at that level to ensure action monitoring for effectiveness.
The chapter also details report flows and decision-making process at the project. Roles and
responsibilities of various actors of the M&E process have also been clearly outlined. We
recommend the use of the media, the Ministry of Food and Agriculture‘s website and the
engagement of civil society organizations for the dissemination of information generated during
project implementation. The need to ensure compliance with the requirements of the data quality
triangle – reliability, validity and timeliness – has been highlighted in this chapter.
Implementation Manual-M&E System Designed for the NRGP
2
In Chapter 6, the need for organising critical reflection events is highlighted. Critical reflection
events are programmed for NRGP at three levels: a) at the field implementation level, (b) at the
level of project management and (c) at the level of external reviewers. The need for project
management staff to have an open-mind to problem solving is highlighted as a means to attain
optimum benefits from organising reflection events.
Chapter 7 deals with the necessary conditions and capacities necessary for M&E
implementation. The need to provide requisite logistics and training to M&E operatives is
highlighted. The M&E Workplan, which summarises key M&E activities, is also presented in
this chapter to guide the implementation of the M&E process.
Chapter 8 provides in-depth information on the evaluation framework of the project. It is anticipated that
both formative and summative evaluations of the project would be conducted. For this purpose, the
various evaluation questions have been raised, the type of evaluation design to be used for the respective
evaluation questions have been determined, indicators and the corresponding data collection and analysis
methodologies have been carefully selected for all the evaluation questions raised.
Chapter 9 provides a step-by-step approach to the conduct of a beneficiary assessment of the project. It
discusses the focus of NRGP beneficiary assessment, selection of institutions and field researchers for
beneficiary assessment, guide for terms of reference preparation for BA, selection of sampling frames for
BA, preparation of interview guides, methodology to be adopted for BA, training of field researchers and
report preparation.
Provisions have been made for the establishment of M&E database in order to enhance data
capture, storage, analysis and reporting of information in respect of the NRGP in chapter 10.
In order to harmonise the collection of project information at all levels, data collection formats
have been developed for the various indicators and presented in Chapter 11. Details of the
progress reporting formats that would be used by various stakeholders during project
implementation are also provided.
It is our fervent hope that the M&E system will be implemented and sustained to ensure the
attainment of project objectives. We expect results information to be transparent, trustworthy and
credible; we shall encourage the reportage of both good and bad news that the M&E system
unearths to facilitate timely redress of key implementation problems. Furthermore, sound
technical skills would be provided to staff in data collection and analysis to ensure the system‘s
sustainability.
Implementation Manual-M&E System Designed for the NRGP
1
1.0 PROJECT OVERVIEW
1.1 Context and Background
The Government of the Republic of Ghana (GOG), in line with its commitment to bridge the gap
between the north and south in terms of economic development and well-being, is implementing
the Northern Rural Growth Programme with financial support from the African Development
Bank, the International Fund for Agricultural Development,Beneficiaries and Financial
institutions in Ghana. The cost of the project is USD103.55million. The contribution of the
various financiers of the project is: IFAD – USD22.3m; AfDB – USD 61.2m; GoG –
USD10.3m; Beneficiaries – USD3.7m; Financial Institutions – USD4.6m
.
NRGP addresses the priorities of the Government of Ghana in the pursuit of poverty reduction. It
is consistent with the Ghana Growth and Poverty Reduction Strategy II (GPRS II), the Ghana
Food and Agriculture Development Policy (FASDEP II), which now constitute the framework
for donors‘ support to the development of the agriculture sector, the Bank ‗s Country Strategy
Paper (Pillars I & II) for the period 2005 – 2009, and the Ghana joint Assistance Strategy (G-JAS
- Pillars 1) supported by IFAD, the African Development Bank and other development partners,
as well as the Bank Group Policy for Agriculture and Rural Development. NRGP will contribute
to achieving the objectives of the Millennium Development Goals (MDG) and the NEPAD‘s
Comprehensive African Agricultural Development Programme (CAADP).
The project has four (4) main components namely:
(i) Commodity Chain Development
(ii) Rural Infrastructure Development;
(iii) Access to financial services
(iv) Program Coordination.
A brief description of the components is as follows:
Component A: Commodity Chain Development (US$26.03m): The objective of this component
is to build a long term and sustainable physical and social capital needed to link agricultural
supply in northern Ghana to demand in the centre and south of the country and abroad. It will
empower rural communities to form competent and effective organisations to sustainably
manage community-based development programmes. Essential expected outcomes under this
component include: (i) 250 market oriented producers‘ organisations strengthened and fully
functional; (ii) two functional commodity inter-professional bodies established; (iii) commodity
business plans prepared and implemented; and (iv) a commodity development fund established.
NRGP will support registration for informal producers‘ organisations (PO), 64 training
workshops for PO representatives and 900 meetings of the District Food Security Networks.
Training and extension programme (255 sessions) for POs, which will be elaborated based on the
outcome of the CBP, should include advocacy, governance, accountancy, literacy, business and
network management as well as technical agricultural issues such as good agricultural practices,
quality control, use of chemicals, storage and post harvest handling. 396 radio broadcast
programmes will be funded to improve information dissemination. NRGP will also support the
formalisation of producers‘ commodity professional bodies (CPB).
Implementation Manual-M&E System Designed for the NRGP
2
Component B: Rural Infrastructure Development (US$69.54m) :
The approach to rural infrastructure development takes into consideration the limited technical
capacity in the engineering sub-sector in the three northern regions and relies on strict
enforcement of existing technical design, construction and supervision criteria in irrigation
schemes and rural roads construction, as well as, the promotion of labour based technology
(combination of high labour intensive methods with small and appropriate mechanised
equipment) by construction SMEs for on-farm work and feeder roads. This component will have
the following two sub-components: (i) Small Scale Irrigation Development; and (ii) Marketing
Infrastructure Development.
Component C: Access To Rural Financial Services (US$1.10):
Under this component, the NRGP will provide: (i) institutional strengthening of Participating
Financial Institutions (PFIs), FNGOs and Inter-professional bodies in the programme area; and
(ii) funding arrangements including adapted lending instruments. Institutional strengthening will
involve: (i) capacity building for loan officers in the area of credit appraisal, credit management
and products development; accredited trainers under the Rural Financial Services Project (RFSP)
would be engaged to train credit officers using adapted modules developed under the RFSP; for
clients under the NRGP, the Credit With Education (CWE) module would be used by Freedom
From Hunger Ghana (FFHG) during the scaling up of the model to all RCBs Banks in the
programme area; (ii) training supervisory staff of Apex Bodies such as ARB, Apex Bank and
Credit Unions Association (CUA) in the programme area; and (iii) logistic support would be
provided to Implementing Partners (IPs) involved in the implementation of these activities. The
logistics would include: motor bikes for loan officers to follow-up on clients and bicycles for
Community Agents (CAs) that would be engaged by the PFIs to follow-up on their clients to
ensure effective recoveries and higher loan assets quality. Matching Grants Funds (MGs) and
Micro Leasing (ML) will be adapted from RTIMP to suit clients acquiring productive assets such
as pumps, construction of aquaculture ponds and housing for livestock, donkey carts, and
processing equipments. At least, 80% of CBP projects will receive funding.
Component D: Programme Management, Coordination, Monitoring and Evaluation
(US$4.79m): The objective of this component is the efficient management of the Programme.
Coordination of the implementation of the Northern Rural Growth Program at national level is
anchored in the Projects Coordination Division under PPMED of MOFA. The Programme
Implementation Team (PIT), including a National Programme Coordinator (NPC), a Financial
Controller, a M&E Specialist, a Marketing Specialist, a Rural Engineer, an Environmentalist, a
Sociologist specialized in POs and IPBs, a Gender Specialist, a Rural Rural Financial Specialist,
a Procurement Specialist and support staff have been competitively selected from relevant
implementing agencies. The Project management team is stationed in Tamale. NRGP is expected
to finance activities of the National Programme Steering Committee (NPSC), the Programme
Development and Implementation Partnership (PDIP), cover the costs of a thorough mid-term
review, a project completion review, annual external audits, and contributions towards the cost of
external evaluations, impact assessments and thematic studies.
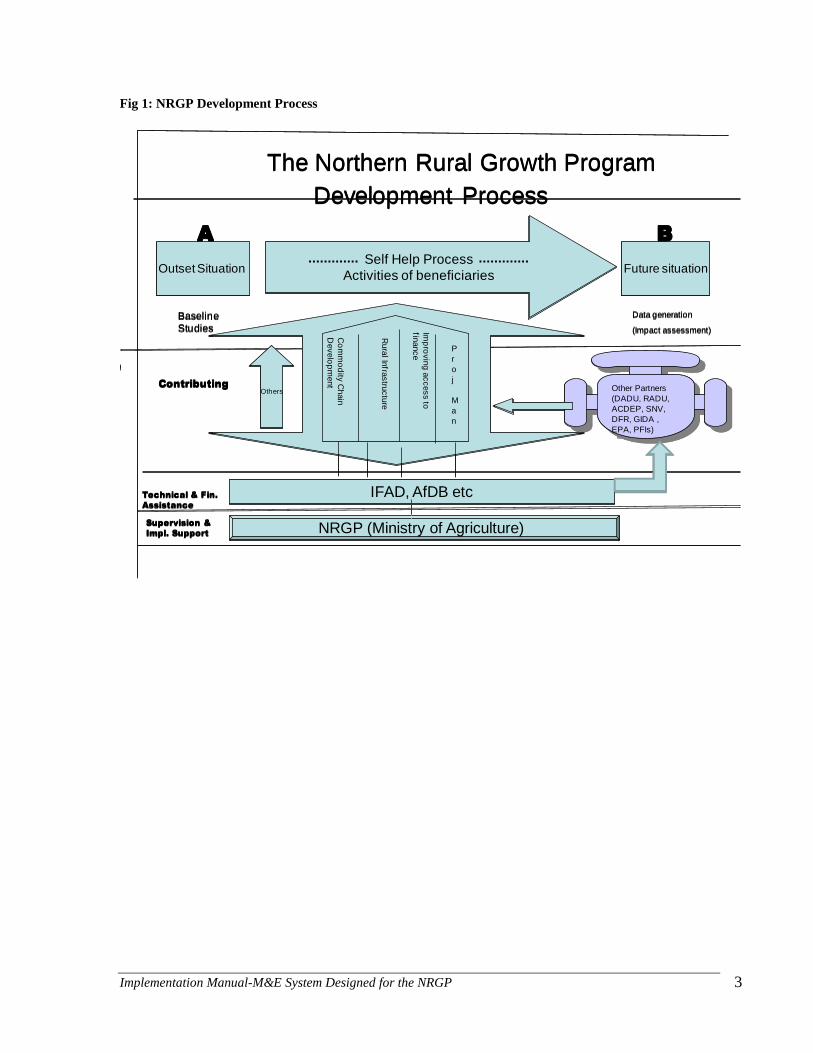
The NRGP Development Process is presented in Fig.1
Implementation Manual-M&E System Designed for the NRGP
3
Fig 1: NRGP Development Process
The Northern Rural Growth Program
Development Process
Self Help Process
Activities of beneficiariesOutset Situation Future situation
A B
Others
IFAD, AfDB etc
Co
mm
od
ity C
hain
Develo
pm
ent
Rura
l Infra
stru
ctu
re
Imp
rovin
g a
ccess to
finance
Data generation
(Impact assessment)
Baseline
Studies
Other Partners
(DADU, RADU,
ACDEP, SNV,
DFR, GIDA ,
EPA, PFIs)
NRGP (Ministry of Agriculture)
Contributing
Technical & Fin.
Assistance
Supervision &
Impl. Support
P
r
o
j
M
a
n
Implementation Manual-M&E System Designed for the NRGP
1
2.0 THE THEORY OF CHANGE AND INFORMATION COMPONENTS
OF THE NORTHERN RURAL GROWTH PROGRAMME
This Chapter presents an explicit statement of the logic underlying the design of the Northern
Rural Growth Programme. It also demonstrates the way in which this logic is linked to the
identification of indicators that will be measured in the course of monitoring and evaluation
activities, outputs and outcomes of the project.
The approach used in the preparation of the M&E system for the Northern Rural Growth
Programme (NRGP) is based on the analysis of the logic behind the design and implementation
of NRGP itself.
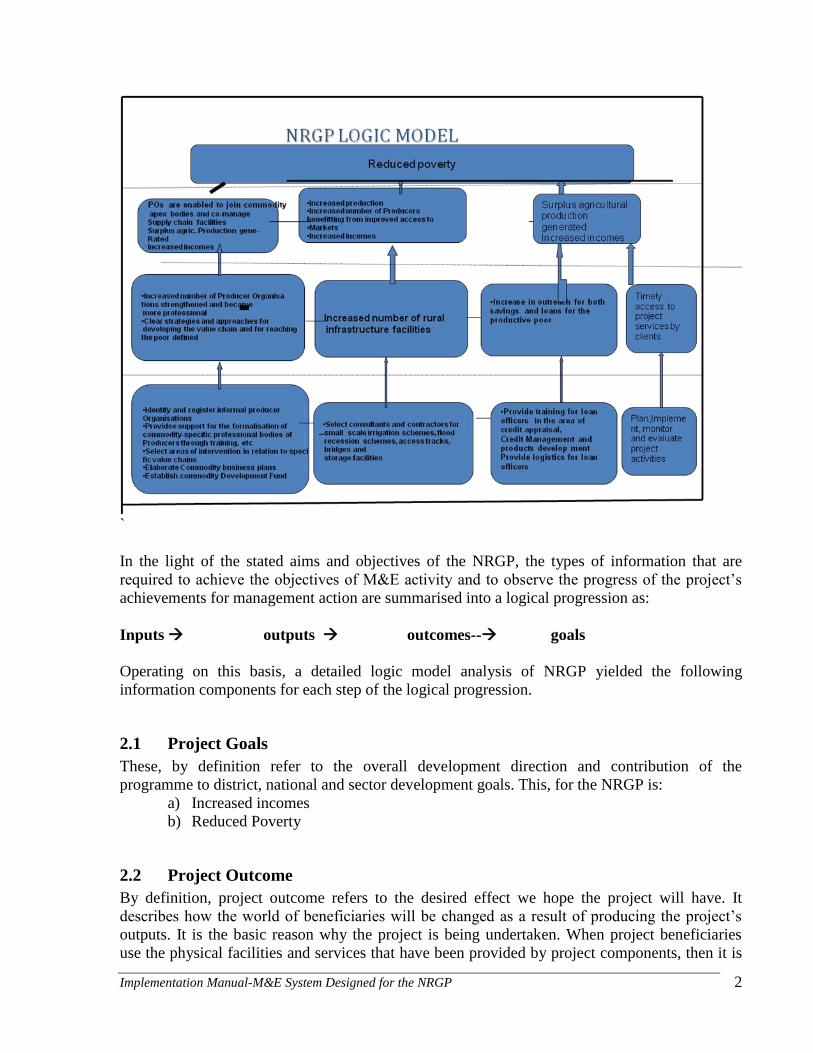
The theory of change of the NRGP centres around four (4) theories. These are as follows:
Theory 1: If informal producer organizations are identified, registered and provided with
requisite training; if commodity- specific professional bodies of producers are formalized
through training etc; if commodity business plans are elaborated and commodity Development
Funds are established, an increased number of producer organizations would be strengthened and
become more professional. Also, clear strategies and approaches for the value chain and reaching
the poor would be defined. This in turn would result in the ability of POs to join commodity apex
bodies and co-manage supply chain facilities with private sector operators, surplus agricultural
production would be generated and increased incomes realised. This would subsequently
contribute to poverty reduction in the project area.
Theory 2: If selection of competent consultants and contractors for rural infrastructure
development is undertaken, there would be increased number of rural infrastructure facilities
constructed. This would result in an increased number of producers benefitting from improved
access to markets and increased incomes. Subsequently there would be poverty reduction in the
project area.
Theory 3: If training is provided for loan officers in the area of credit appraisal, credit
management and products development, there would be increased outreach for both savings and
loans for the productive poor. This would result in surplus agricultural production and increased
incomes. Subsequently there would be poverty reduction in the project area.
Theory 4: If the project Management Unit plans, implements, monitors and evaluates project
activities efficiently, there would be timely access to project services by targeted project
population. This would subsequently result in surplus agricultural production and increased
incomes. Subsequently there would be poverty reduction in the project area.
NRGP logic model is presented in Fig. 2
Figure 2: NRGP Logic Model
Implementation Manual-M&E System Designed for the NRGP
2
`
In the light of the stated aims and objectives of the NRGP, the types of information that are
required to achieve the objectives of M&E activity and to observe the progress of the project‘s
achievements for management action are summarised into a logical progression as:
Inputs outputs outcomes-- goals
Operating on this basis, a detailed logic model analysis of NRGP yielded the following
information components for each step of the logical progression.
2.1 Project Goals
These, by definition refer to the overall development direction and contribution of the
programme to district, national and sector development goals. This, for the NRGP is:
a) Increased incomes
b) Reduced Poverty
2.2 Project Outcome
By definition, project outcome refers to the desired effect we hope the project will have. It
describes how the world of beneficiaries will be changed as a result of producing the project‘s
outputs. It is the basic reason why the project is being undertaken. When project beneficiaries
use the physical facilities and services that have been provided by project components, then it is
Implementation Manual-M&E System Designed for the NRGP
3
expected that these will have an effect and impact on their livelihoods. We can look at the project
outcome as effectiveness or results in terms of access, usage and stakeholder satisfaction from
goods and services generated by the program.
Information components identified at the outcome level for NRGP are as follows:
2.2.1 Identified Programme Outcomes
a) POs are enabled to join commodity Apex bodies and co-manage the supply chain facilities with
the private investor
b) POs are enabled to join Country-level representative Inter-professional bodies established
and functional c) Surplus agricultural production generated for increased incomes
d) Producers benefitting from improved access to markets
2.3 Project Outputs
By definition these are the immediate results of project component activities that become
available for use by project beneficiaries. They may be a physical output or service facilities
developed by the program for use by beneficiaries. For the NRGP the logical framework analysis
yielded the following key outputs for the various program components.
2.3.1 Commodity Chain Development Component - Outputs
a) Increased number of Producer Organisations strengthened and become more professional,
enjoy better and more transparent governance
b) Selected Producer Organisations actively participate in the Commodity Business Plans and
in the governance of commodity chains
c) Information on issues related to selected commodity development is effectively
disseminated
d) A formal and functioning inter Professional Body (IPB) is established in each value
chain
e) Representation between deprived areas and non – deprived areas in IPB is balanced
f) Improved legal framework for professional organizations/inter-professional bodies
developed
g) Linkages between POs and other stakeholders (NGOs) strengthened
h) Commodity inter-professional bodies established i) Clear strategies and approaches for developing the value chain and for reaching the poor
defined
j) Funding support provided to commodity chain development activities identified in
the CBPs
2.3.2 Rural Infrastructure Component - Outputs
a) Small scale irrigation facilities constructed b) Communal/public owned water distribution systems constructed
c) Beneficiaries sensitized on small scale irrigation systems
d) Water User associations strengthened
e) Flood recession schemes constructed
f) Increased number of farmers participate in Farmer field schools on water control structures
g) Farm access tracks constructed
Implementation Manual-M&E System Designed for the NRGP
4
h) Feeder roads rehabilitated
i) Access to transport facilities increased
j) Storage facilities constructed
2.3.3 Improving Access to Rural Financial Services
a) Increase in outreach for both savings and loans for the productive poor
2.3.4 Project management component
a) Efficient management of project activities
2.4. Project Activities
Are the things that must be done to achieve the results under NRGP. The logical framework
analysis isolated the following activities for implementation under the various components of
NRGP
2.4.1 Commodity Chain Development Component – Activities
a) Provide legal advice to FBOs to facilitate recognition as legal entities
b) Identify and register informal Producer Organisations/Farmer Based Organisations
c) Conduct Training and Capacity needs assessment of Producer Organisations
d) Organise workshops to identify representatives of producer organizations that participate in
e) the elaboration of the CBP
f) Conduct District Value chain working committee meetings
g) Train POs/FBOs on planning and advocacy
h) Organise radio broadcast programmes to improve information dissemination
i) Provide support for the formalization of commodity-specific professional bodies (PB)
j) of producers through a) training on organization, rules communication and financial
k) sustainability (b) institutional strengthening and (c) office installation
l) Conduct study to analyse sub-regional and best suited regulation frameworks for IPBs
m) Organise meetings at national level between POs and other stakeholders
n) Provide training to IPBs on: participatory decision making, joint management of strategic issues,
o) elaboration of commodity development plans, M&E tools, post harvest measures, meeting quality
p) and export requirements, management of the distribution networks, commodity chain facilities
q) and marketing techniques
r) Organise visits to and from countries with successful experiences on inter-professional bodies creation
s) Provide establishment cost of a secretariat of the IPBs
t) Identify private operators (processors, exporters, wholesalers) interested in collaborating
u) with NRGP in establishing commercial ventures with small farmers
v) Select commodities within the four identified windows
Implementation Manual-M&E System Designed for the NRGP
5
w) Select areas for intervention related to specific commodity chains
x) Select producer groups to engage in the CBP programme
y) Select facilitating institutions
z) Elaborate Commodity Business Plans
aa) Conduct market assessment, value chain analysis, geographic analysis of production basis
bb) Establish a Commodity Development Fund for private goods and public goods windows
cc) Establish financial management procedure for the fund
dd) Facilitate alternative source of funding for commodity chain improvements.
2.4.2 Rural Infrastructure Development Component – Activities
a) Select Consultants and contractors for design and construction of small scale irrigation schemes
b) Select Consultants and contractors for design and construction of communal/public owned
c) water distribution systems.
d) Organise forums to sensitize beneficiaries of the small scale irrigation systems
e) Train Water Users‘ Associations
f) Select Consultants and contractors for design and construction of flood recession schemes/simple
g) water control structures (eg dykes, bunds, open earth drains for crops and/or fisheries production)
h) Organise demonstrations and training of farmers in appropriate land preparation techniques
i) and utilization of mulch and livestock manure
j) Select Consultants and contractors for design and construction of farm access tracks
k) Select Consultants and contractors for design and improvement of feeder roads
l) Select Consultants and contractors for design and improvement of trunk roads
m) Select Consultants and contractors for design and construction of bridges
n) Procure appropriate group transport facilities for farmers
o) Select consultants and contractors to design and construct simple storage facilities at existing
p) market centres for use by
2.4.3 Access to Rural Financial Services Component – Activities
a) Provide training for loan officers in the area of credit appraisal, credit management and products
Development
b) /Provide logistics (motorbikes) for loan officers and bicycles for Community Agents that are
engaged by PFIs
2.4.4 Programme Management, Coordination, Monitoring and Evaluation Component –
Activities
a) Prepare Annual Work Plan, Budget, Procurement Plan
b) Prepare Annual M&E Plan
c) Engage stakeholders through fora, reviews etc
Implementation Manual-M&E System Designed for the NRGP
6
d) Prepare project reports
e) Conduct annual review workshops, district planning workshops and meetings,
f) National Project Steering Committee meetings etc
g) Organise Mid term review
h) Organise project completion review
It would be necessary to further develop Sub-Activities on annual basis during the Annual Work
Planning Cycle to give more clarity to detailed actions that would be taken at the Implementing
Agency level.
2.5 Project Inputs
By definition, project inputs are the resources, working tools or facilities required and delivered
to program components, departments and implementing agencies to equip and provide them with
the means to undertake the functions and activities required of them in the Project Design
Document. A summary of the project inputs is provided below:
Transport - Vehicles
Equipment - Office equipment
- Machinery
Buildings - Offices
Funds - AfDB/IFAD
- Government of Ghana
- Cost of human resources
Incremental staff of NRGP, INCLUDING Implementing Agency staff.
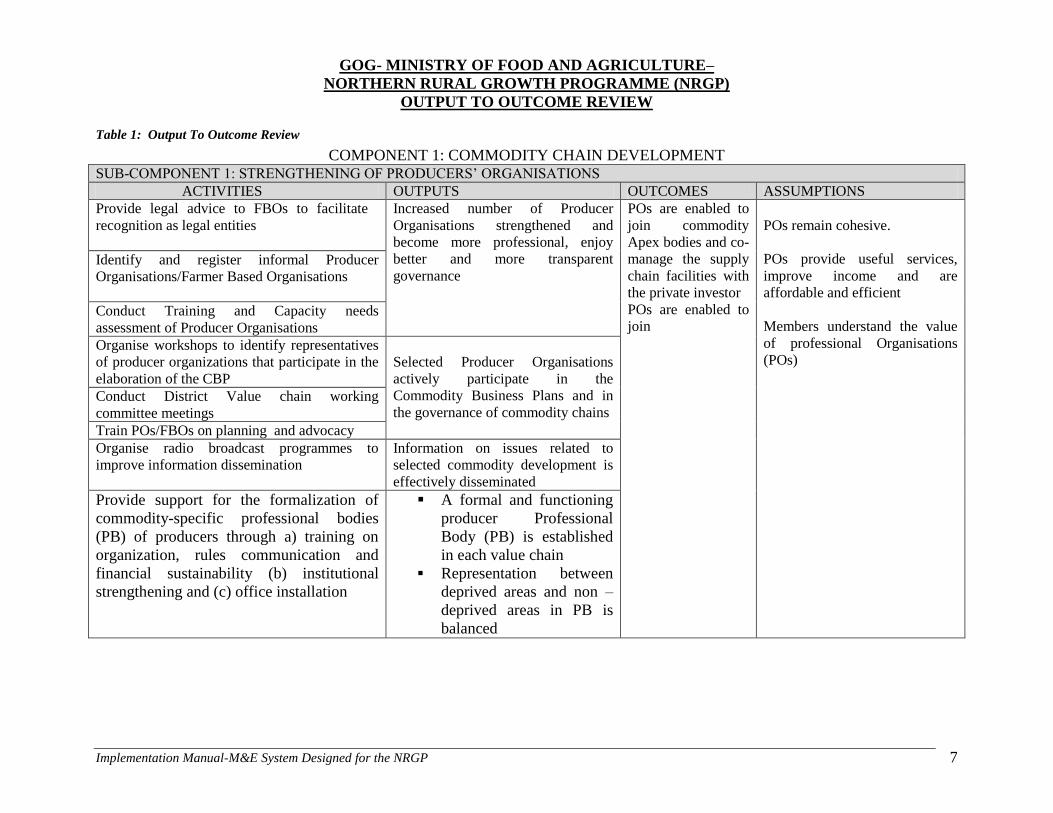
Based on our review of the Project Document, the output to outcome review of the NRGP
revealed the details presented in Table 1
Implementation Manual-M&E System Designed for the NRGP 7
GOG- MINISTRY OF FOOD AND AGRICULTURE–
NORTHERN RURAL GROWTH PROGRAMME (NRGP)
OUTPUT TO OUTCOME REVIEW
Table 1: Output To Outcome Review
COMPONENT 1: COMMODITY CHAIN DEVELOPMENT
SUB-COMPONENT 1: STRENGTHENING OF PRODUCERS‘ ORGANISATIONS
ACTIVITIES OUTPUTS OUTCOMES ASSUMPTIONS
Provide legal advice to FBOs to facilitate
recognition as legal entities
Increased number of Producer
Organisations strengthened and
become more professional, enjoy
better and more transparent
governance
POs are enabled to
join commodity
Apex bodies and co-
manage the supply
chain facilities with
the private investor
POs are enabled to
join
POs remain cohesive.
POs provide useful services,
improve income and are
affordable and efficient
Members understand the value
of professional Organisations
(POs)
Identify and register informal Producer
Organisations/Farmer Based Organisations
Conduct Training and Capacity needs
assessment of Producer Organisations
Organise workshops to identify representatives
of producer organizations that participate in the
elaboration of the CBP
Selected Producer Organisations
actively participate in the
Commodity Business Plans and in
the governance of commodity chains Conduct District Value chain working
committee meetings
Train POs/FBOs on planning and advocacy
Organise radio broadcast programmes to
improve information dissemination
Information on issues related to
selected commodity development is
effectively disseminated
Provide support for the formalization of
commodity-specific professional bodies
(PB) of producers through a) training on
organization, rules communication and
financial sustainability (b) institutional
strengthening and (c) office installation
A formal and functioning
producer Professional
Body (PB) is established
in each value chain
Representation between
deprived areas and non –
deprived areas in PB is
balanced
Implementation Manual-M&E System Designed for the NRGP 8
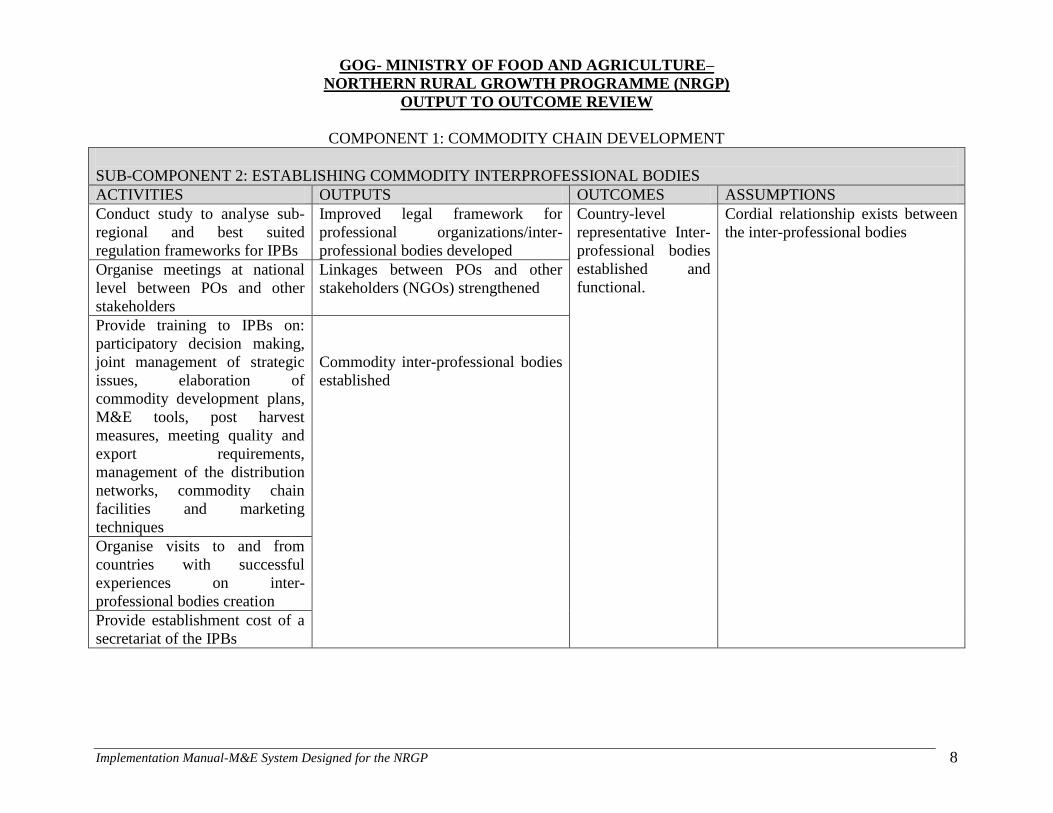
GOG- MINISTRY OF FOOD AND AGRICULTURE–
NORTHERN RURAL GROWTH PROGRAMME (NRGP)
OUTPUT TO OUTCOME REVIEW
COMPONENT 1: COMMODITY CHAIN DEVELOPMENT
SUB-COMPONENT 2: ESTABLISHING COMMODITY INTERPROFESSIONAL BODIES
ACTIVITIES OUTPUTS OUTCOMES ASSUMPTIONS
Conduct study to analyse sub-
regional and best suited
regulation frameworks for IPBs
Improved legal framework for
professional organizations/inter-
professional bodies developed
Country-level
representative Inter-
professional bodies
established and
functional.
Cordial relationship exists between
the inter-professional bodies
Organise meetings at national
level between POs and other
stakeholders
Linkages between POs and other
stakeholders (NGOs) strengthened
Provide training to IPBs on:
participatory decision making,
joint management of strategic
issues, elaboration of
commodity development plans,
M&E tools, post harvest
measures, meeting quality and
export requirements,
management of the distribution
networks, commodity chain
facilities and marketing
techniques
Commodity inter-professional bodies
established
Organise visits to and from
countries with successful
experiences on inter-
professional bodies creation
Provide establishment cost of a
secretariat of the IPBs
Implementation Manual-M&E System Designed for the NRGP 9
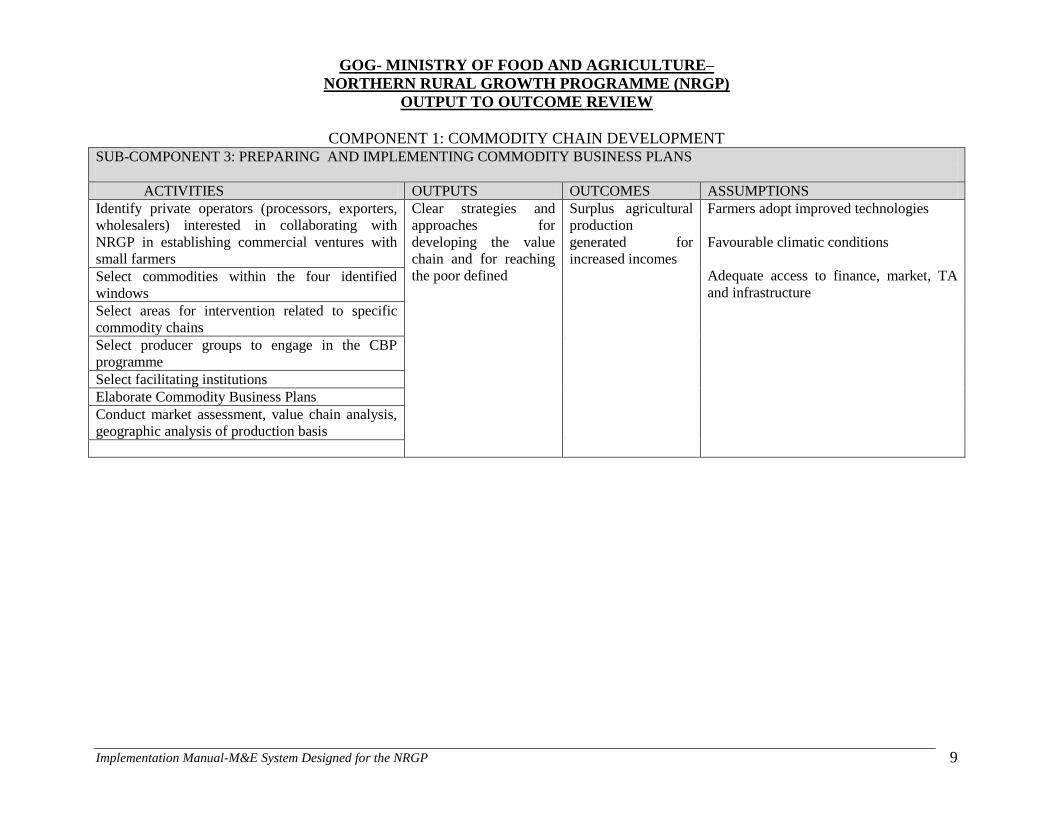
GOG- MINISTRY OF FOOD AND AGRICULTURE–
NORTHERN RURAL GROWTH PROGRAMME (NRGP)
OUTPUT TO OUTCOME REVIEW
COMPONENT 1: COMMODITY CHAIN DEVELOPMENT SUB-COMPONENT 3: PREPARING AND IMPLEMENTING COMMODITY BUSINESS PLANS
ACTIVITIES OUTPUTS OUTCOMES ASSUMPTIONS
Identify private operators (processors, exporters,
wholesalers) interested in collaborating with
NRGP in establishing commercial ventures with
small farmers
Clear strategies and
approaches for
developing the value
chain and for reaching
the poor defined
Surplus agricultural
production
generated for
increased incomes
Farmers adopt improved technologies
Favourable climatic conditions
Adequate access to finance, market, TA
and infrastructure Select commodities within the four identified
windows
Select areas for intervention related to specific
commodity chains
Select producer groups to engage in the CBP
programme
Select facilitating institutions
Elaborate Commodity Business Plans
Conduct market assessment, value chain analysis,
geographic analysis of production basis
Implementation Manual-M&E System Designed for the NRGP 10
GOG- MINISTRY OF FOOD AND AGRICULTURE–
NORTHERN RURAL GROWTH PROGRAMME (NRGP)
OUTPUT TO OUTCOME REVIEW
COMPONENT 1: COMMODITY CHAIN DEVELOPMENT
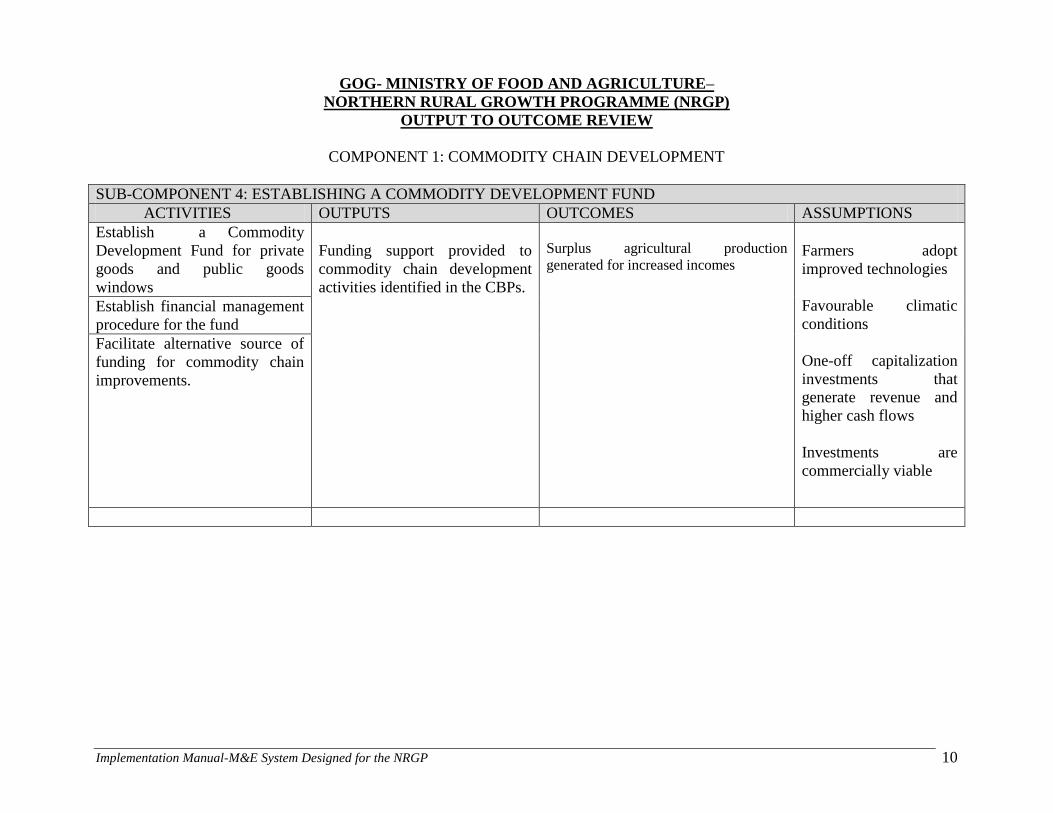
SUB-COMPONENT 4: ESTABLISHING A COMMODITY DEVELOPMENT FUND
ACTIVITIES OUTPUTS OUTCOMES ASSUMPTIONS
Establish a Commodity
Development Fund for private
goods and public goods
windows
Funding support provided to
commodity chain development
activities identified in the CBPs.
Surplus agricultural production
generated for increased incomes
Farmers adopt
improved technologies
Favourable climatic
conditions
One-off capitalization
investments that
generate revenue and
higher cash flows
Investments are
commercially viable
Establish financial management
procedure for the fund
Facilitate alternative source of
funding for commodity chain
improvements.
Implementation Manual-M&E System Designed for the NRGP 11
GOG- MINISTRY OF FOOD AND AGRICULTURE–
NORTHERN RURAL GROWTH PROGRAMME (NRGP)
OUTPUT TO OUTCOME REVIEW
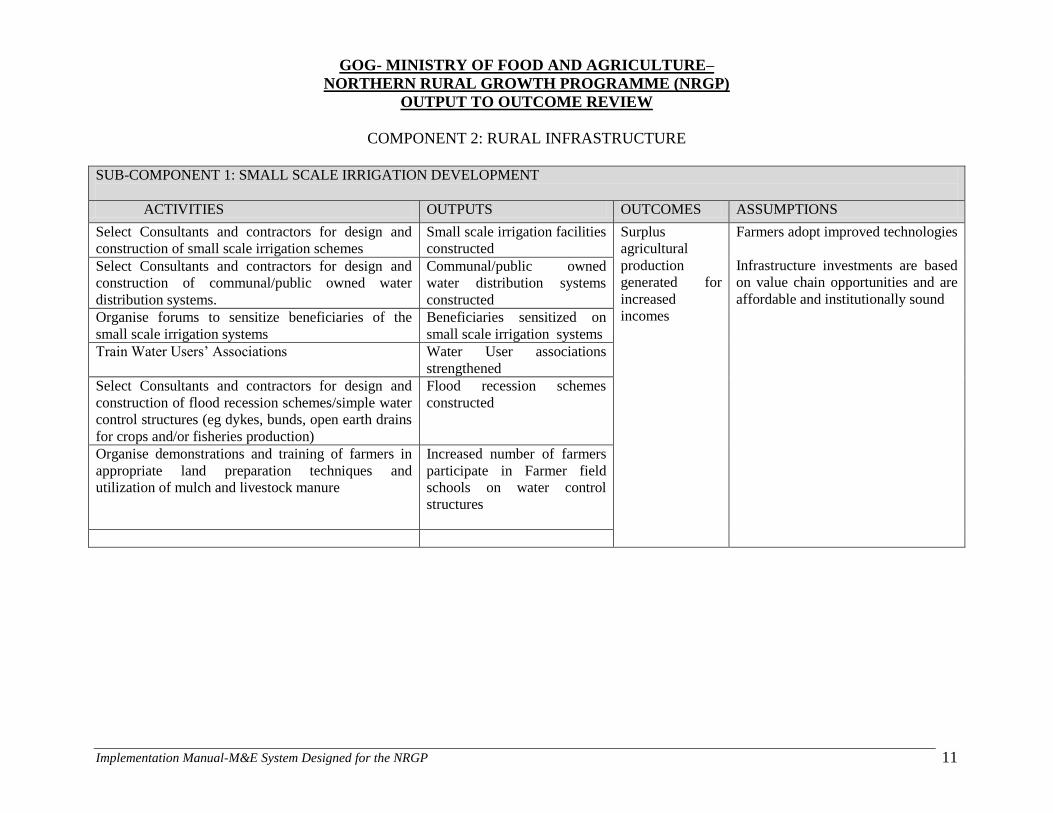
COMPONENT 2: RURAL INFRASTRUCTURE
SUB-COMPONENT 1: SMALL SCALE IRRIGATION DEVELOPMENT
ACTIVITIES OUTPUTS OUTCOMES ASSUMPTIONS
Select Consultants and contractors for design and
construction of small scale irrigation schemes
Small scale irrigation facilities
constructed
Surplus
agricultural
production
generated for
increased
incomes
Farmers adopt improved technologies
Infrastructure investments are based
on value chain opportunities and are
affordable and institutionally sound
Select Consultants and contractors for design and
construction of communal/public owned water
distribution systems.
Communal/public owned
water distribution systems
constructed
Organise forums to sensitize beneficiaries of the
small scale irrigation systems
Beneficiaries sensitized on
small scale irrigation systems
Train Water Users‘ Associations Water User associations
strengthened
Select Consultants and contractors for design and
construction of flood recession schemes/simple water
control structures (eg dykes, bunds, open earth drains
for crops and/or fisheries production)
Flood recession schemes
constructed
Organise demonstrations and training of farmers in
appropriate land preparation techniques and
utilization of mulch and livestock manure
Increased number of farmers
participate in Farmer field
schools on water control
structures
Implementation Manual-M&E System Designed for the NRGP 12
GOG- MINISTRY OF FOOD AND AGRICULTURE–
NORTHERN RURAL GROWTH PROGRAMME (NRGP)
OUTPUT TO OUTCOME REVIEW
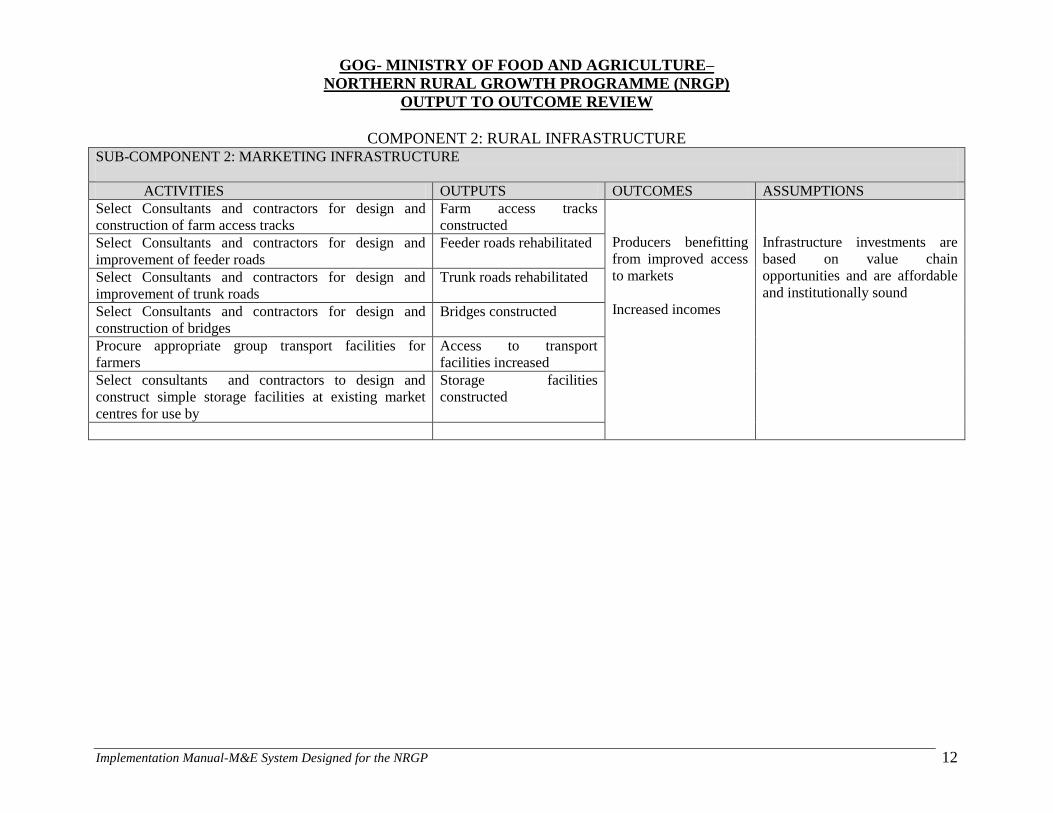
COMPONENT 2: RURAL INFRASTRUCTURE SUB-COMPONENT 2: MARKETING INFRASTRUCTURE
ACTIVITIES OUTPUTS OUTCOMES ASSUMPTIONS
Select Consultants and contractors for design and
construction of farm access tracks
Farm access tracks
constructed
Producers benefitting
from improved access
to markets
Increased incomes
Infrastructure investments are
based on value chain
opportunities and are affordable
and institutionally sound
Select Consultants and contractors for design and
improvement of feeder roads
Feeder roads rehabilitated
Select Consultants and contractors for design and
improvement of trunk roads
Trunk roads rehabilitated
Select Consultants and contractors for design and
construction of bridges
Bridges constructed
Procure appropriate group transport facilities for
farmers
Access to transport
facilities increased
Select consultants and contractors to design and
construct simple storage facilities at existing market
centres for use by
Storage facilities
constructed
Implementation Manual-M&E System Designed for the NRGP 13
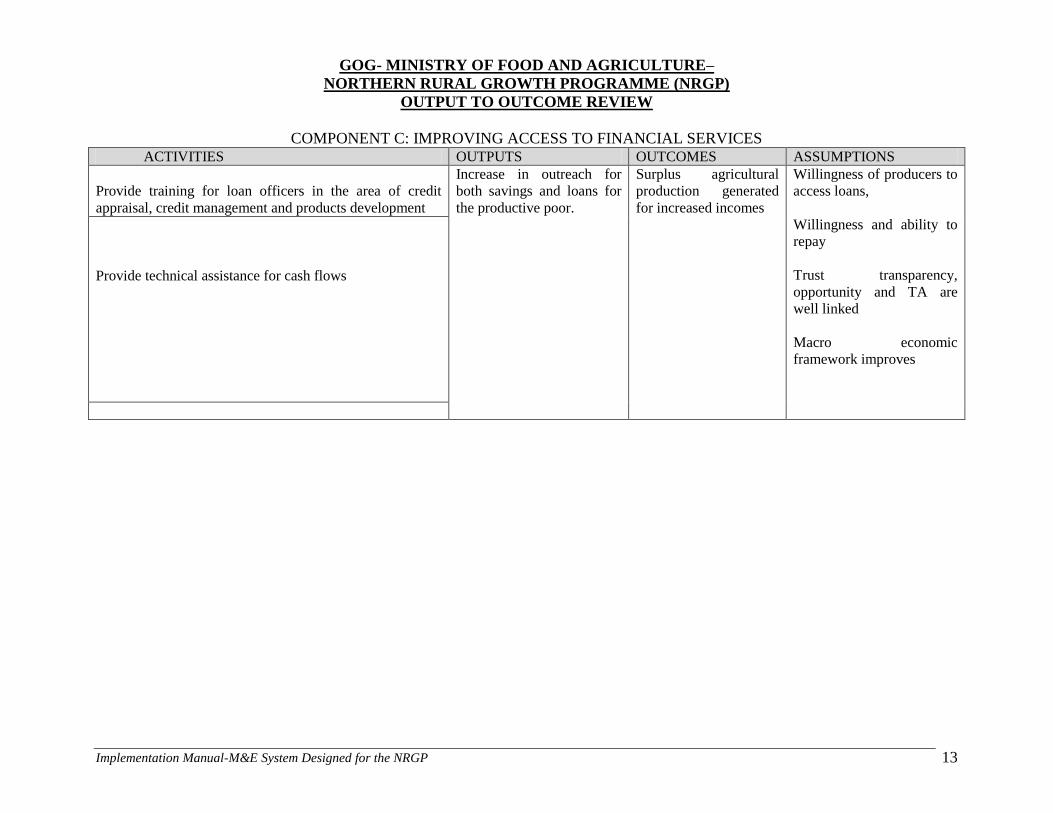
GOG- MINISTRY OF FOOD AND AGRICULTURE–
NORTHERN RURAL GROWTH PROGRAMME (NRGP)
OUTPUT TO OUTCOME REVIEW
COMPONENT C: IMPROVING ACCESS TO FINANCIAL SERVICES ACTIVITIES OUTPUTS OUTCOMES ASSUMPTIONS
Provide training for loan officers in the area of credit
appraisal, credit management and products development
Increase in outreach for
both savings and loans for
the productive poor.
Surplus agricultural
production generated
for increased incomes
Willingness of producers to
access loans,
Willingness and ability to
repay
Trust transparency,
opportunity and TA are
well linked
Macro economic
framework improves
Provide technical assistance for cash flows
Implementation Manual-M&E System Designed for the NRGP 14
GOG- MINISTRY OF FOOD AND AGRICULTURE–
NORTHERN RURAL GROWTH PROGRAMME (NRGP)
OUTPUT TO OUTCOME REVIEW
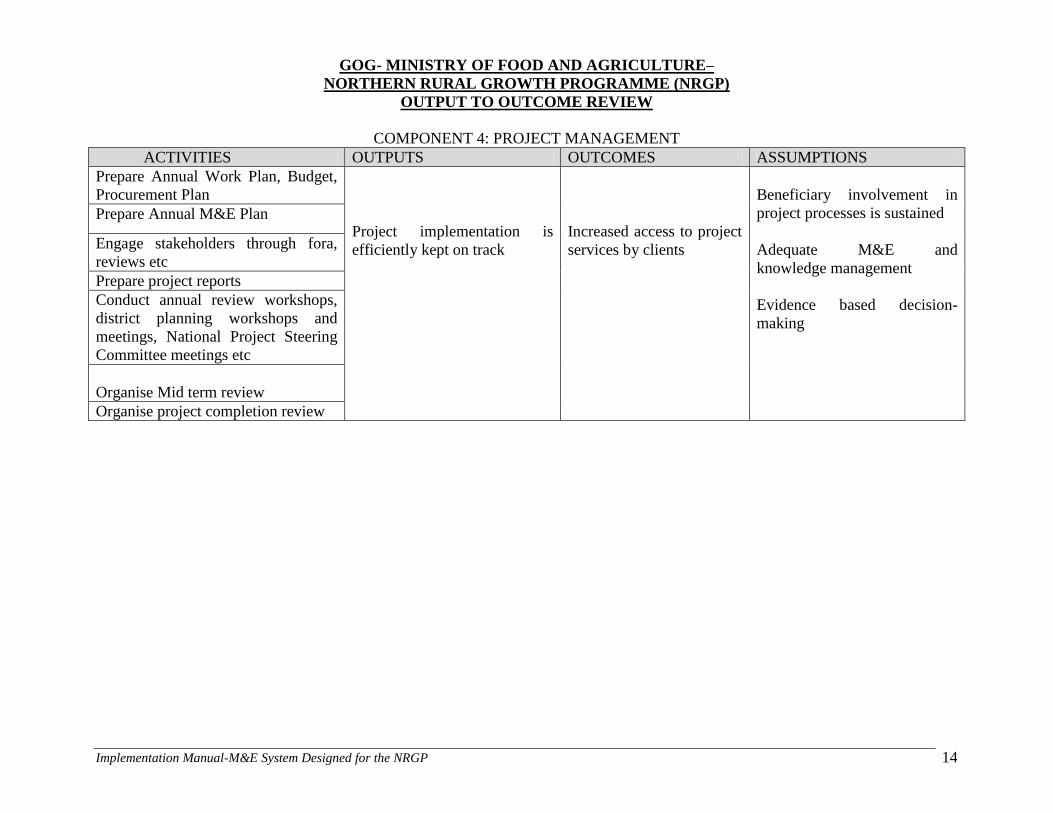
COMPONENT 4: PROJECT MANAGEMENT
ACTIVITIES OUTPUTS OUTCOMES ASSUMPTIONS
Prepare Annual Work Plan, Budget,
Procurement Plan
Project implementation is
efficiently kept on track
Increased access to project
services by clients
Beneficiary involvement in
project processes is sustained
Adequate M&E and
knowledge management
Evidence based decision-
making
Prepare Annual M&E Plan
Engage stakeholders through fora,
reviews etc
Prepare project reports
Conduct annual review workshops,
district planning workshops and
meetings, National Project Steering
Committee meetings etc
Organise Mid term review
Organise project completion review
Implementation Manual-M&E System Designed for the NRGP 15
3.0 ESTABLISHMENT OF INDICATORS FOR THE NRGP
COMPONENTS.
Indicators are the means for establishing what conditions will signal successful achievement of
the objectives of the program. They define quality standards that a program must meet; they
clarify the Goal, the outcome, the outputs and activities of the program. They provide an
objective basis for monitoring and evaluation of programmes.
The results chain developed for the project in Chapter 2, which outlined the key activities,
outputs, outcomes and impacts formed the basis for indicator selection.
Key issues which were considered in selecting indicators for the NRGP included the following:
The selected indicators should measure what is important in the hierarchy of results
rather than what is easy to measure
Indicators must measure change that is attributable to the program
Indicators and the corresponding data collection methods they imply must be cost-
effective.
Indicators are well targeted (refer to chapter 4 for indicator targets)
The targets for the indicators should be realistic and time bound (refer to chapter 4)
Indicators measure performance at the appropriate level of the results hierarchy
Implementation Manual-M&E System Designed for the NRGP 16
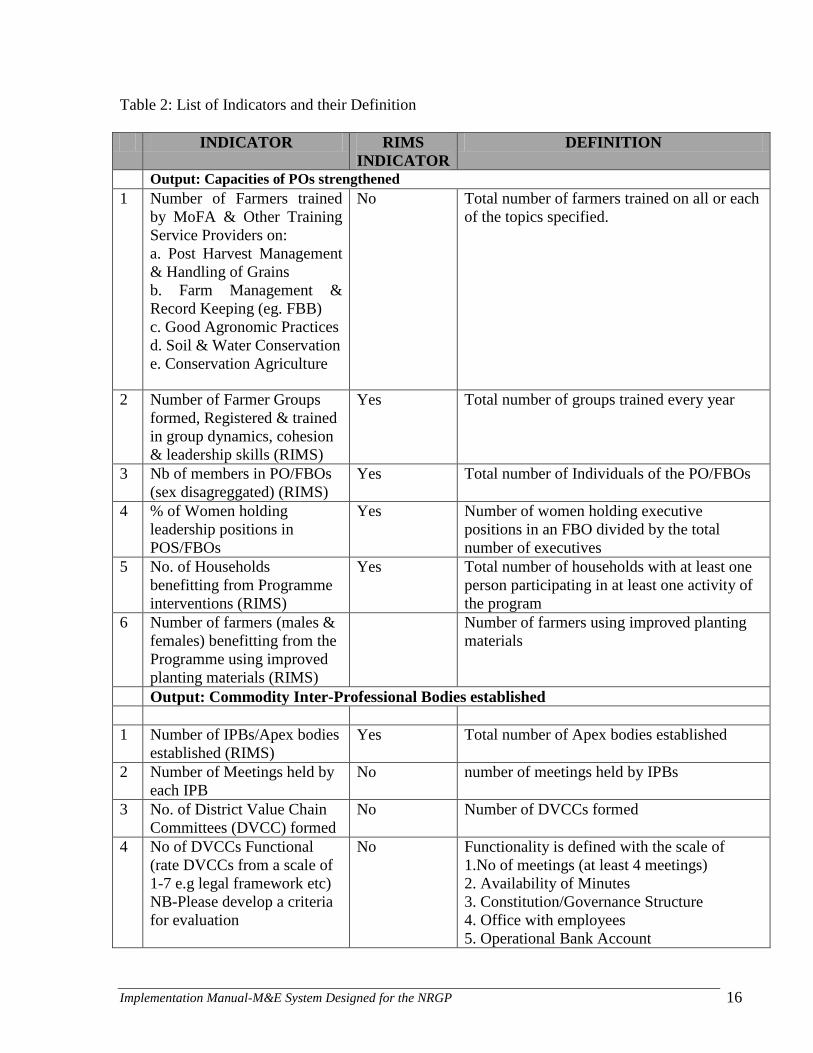
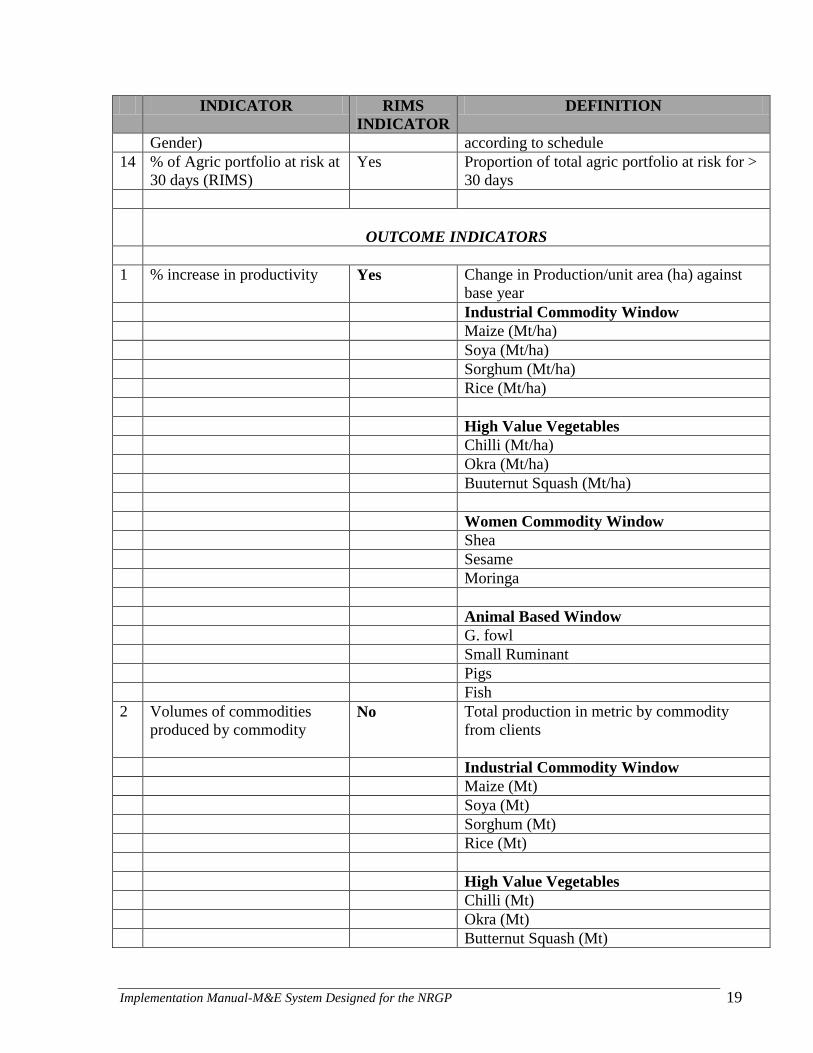
Table 2: List of Indicators and their Definition
INDICATOR RIMS
INDICATOR
DEFINITION
Output: Capacities of POs strengthened
1 Number of Farmers trained
by MoFA & Other Training
Service Providers on:
a. Post Harvest Management
& Handling of Grains
b. Farm Management &
Record Keeping (eg. FBB)
c. Good Agronomic Practices
d. Soil & Water Conservation
e. Conservation Agriculture
No Total number of farmers trained on all or each
of the topics specified.
2 Number of Farmer Groups
formed, Registered & trained
in group dynamics, cohesion
& leadership skills (RIMS)
Yes Total number of groups trained every year
3 Nb of members in PO/FBOs
(sex disagreggated) (RIMS)
Yes Total number of Individuals of the PO/FBOs
4 % of Women holding
leadership positions in
POS/FBOs
Yes Number of women holding executive
positions in an FBO divided by the total
number of executives
5 No. of Households
benefitting from Programme
interventions (RIMS)
Yes Total number of households with at least one
person participating in at least one activity of
the program
6 Number of farmers (males &
females) benefitting from the
Programme using improved
planting materials (RIMS)
Number of farmers using improved planting
materials
Output: Commodity Inter-Professional Bodies established
1 Number of IPBs/Apex bodies
established (RIMS)
Yes Total number of Apex bodies established
2 Number of Meetings held by
each IPB
No number of meetings held by IPBs
3 No. of District Value Chain
Committees (DVCC) formed
No Number of DVCCs formed
4 No of DVCCs Functional
(rate DVCCs from a scale of
1-7 e.g legal framework etc)
NB-Please develop a criteria
for evaluation
No Functionality is defined with the scale of
1.No of meetings (at least 4 meetings)
2. Availability of Minutes
3. Constitution/Governance Structure
4. Office with employees
5. Operational Bank Account
Implementation Manual-M&E System Designed for the NRGP 17
INDICATOR RIMS
INDICATOR
DEFINITION
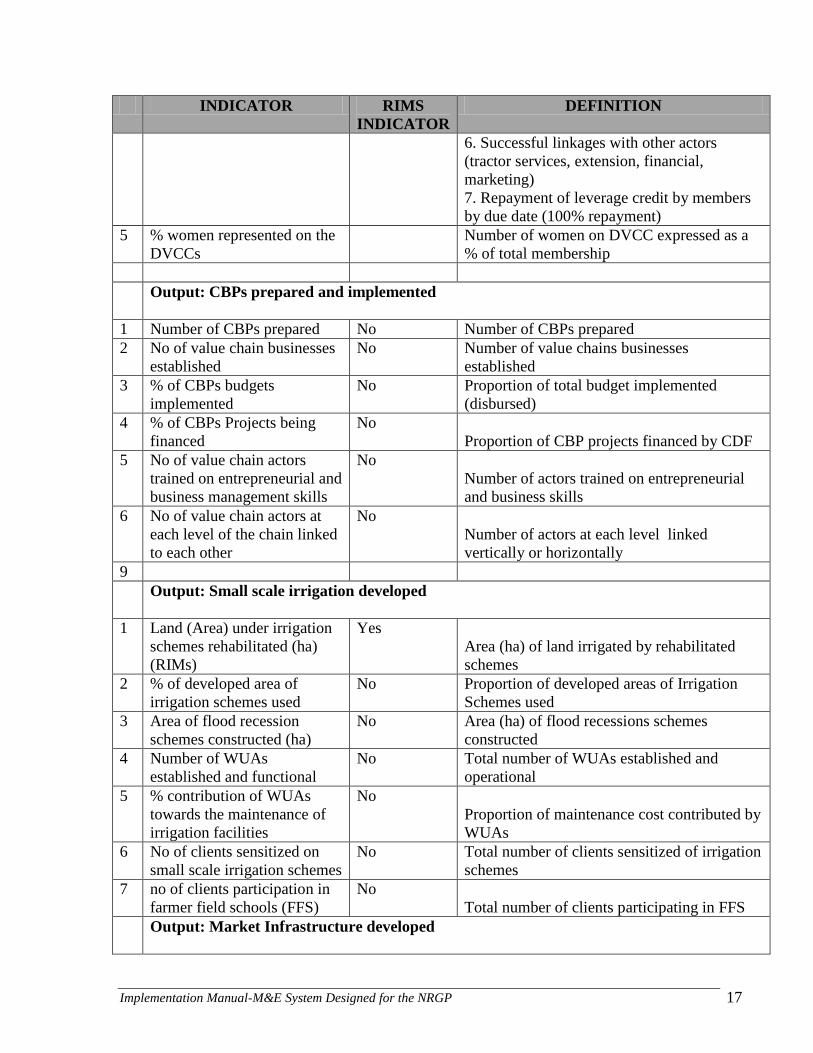
6. Successful linkages with other actors
(tractor services, extension, financial,
marketing)
7. Repayment of leverage credit by members
by due date (100% repayment)
5 % women represented on the
DVCCs
Number of women on DVCC expressed as a
% of total membership
Output: CBPs prepared and implemented
1 Number of CBPs prepared No Number of CBPs prepared
2 No of value chain businesses
established
No Number of value chains businesses
established
3 % of CBPs budgets
implemented
No Proportion of total budget implemented
(disbursed)
4 % of CBPs Projects being
financed
No
Proportion of CBP projects financed by CDF
5 No of value chain actors
trained on entrepreneurial and
business management skills
No
Number of actors trained on entrepreneurial
and business skills
6 No of value chain actors at
each level of the chain linked
to each other
No
Number of actors at each level linked
vertically or horizontally
9
Output: Small scale irrigation developed
1 Land (Area) under irrigation
schemes rehabilitated (ha)
(RIMs)
Yes
Area (ha) of land irrigated by rehabilitated
schemes
2 % of developed area of
irrigation schemes used
No Proportion of developed areas of Irrigation
Schemes used
3 Area of flood recession
schemes constructed (ha)
No Area (ha) of flood recessions schemes
constructed
4 Number of WUAs
established and functional
No Total number of WUAs established and
operational
5 % contribution of WUAs
towards the maintenance of
irrigation facilities
No
Proportion of maintenance cost contributed by
WUAs
6 No of clients sensitized on
small scale irrigation schemes
No Total number of clients sensitized of irrigation
schemes
7 no of clients participation in
farmer field schools (FFS)
No
Total number of clients participating in FFS
Output: Market Infrastructure developed
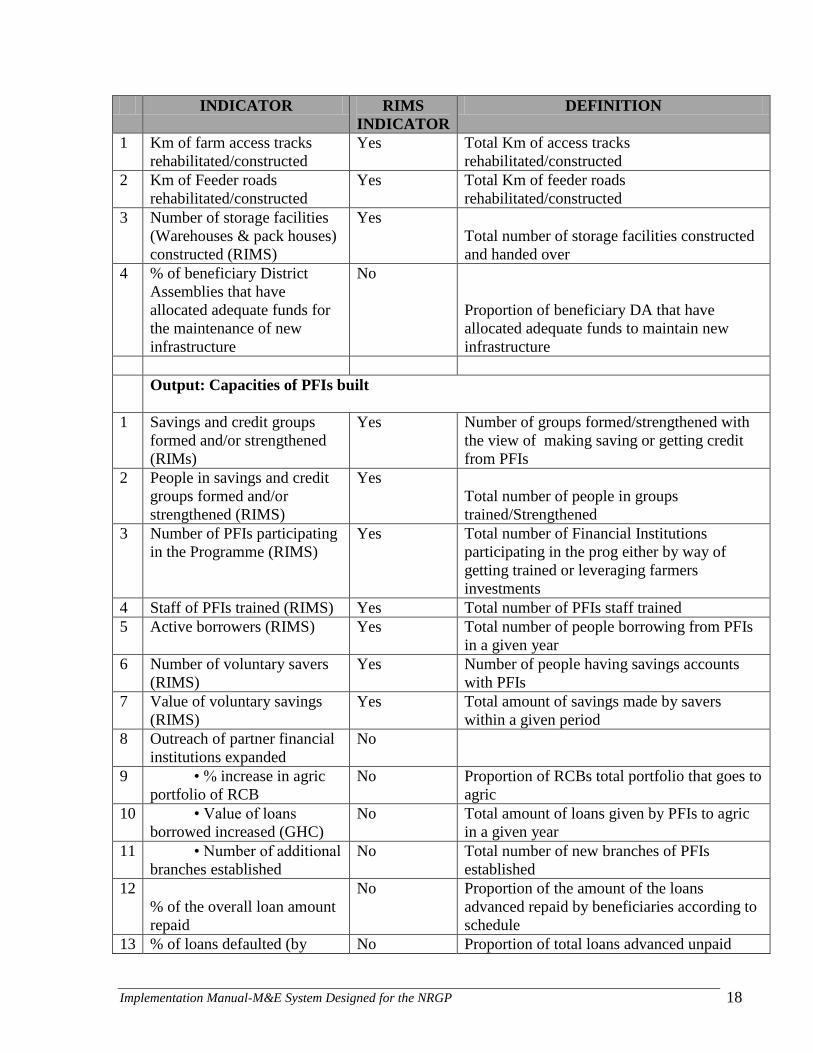
Implementation Manual-M&E System Designed for the NRGP 18
INDICATOR RIMS
INDICATOR
DEFINITION
1 Km of farm access tracks
rehabilitated/constructed
Yes Total Km of access tracks
rehabilitated/constructed
2 Km of Feeder roads
rehabilitated/constructed
Yes Total Km of feeder roads
rehabilitated/constructed
3 Number of storage facilities
(Warehouses & pack houses)
constructed (RIMS)
Yes
Total number of storage facilities constructed
and handed over
4 % of beneficiary District
Assemblies that have
allocated adequate funds for
the maintenance of new
infrastructure
No
Proportion of beneficiary DA that have
allocated adequate funds to maintain new
infrastructure
Output: Capacities of PFIs built
1 Savings and credit groups
formed and/or strengthened
(RIMs)
Yes Number of groups formed/strengthened with
the view of making saving or getting credit
from PFIs
2 People in savings and credit
groups formed and/or
strengthened (RIMS)
Yes
Total number of people in groups
trained/Strengthened
3 Number of PFIs participating
in the Programme (RIMS)
Yes Total number of Financial Institutions
participating in the prog either by way of
getting trained or leveraging farmers
investments
4 Staff of PFIs trained (RIMS) Yes Total number of PFIs staff trained
5 Active borrowers (RIMS) Yes Total number of people borrowing from PFIs
in a given year
6 Number of voluntary savers
(RIMS)
Yes Number of people having savings accounts
with PFIs
7 Value of voluntary savings
(RIMS)
Yes Total amount of savings made by savers
within a given period
8 Outreach of partner financial
institutions expanded
No
9 • % increase in agric
portfolio of RCB
No Proportion of RCBs total portfolio that goes to
agric
10 • Value of loans
borrowed increased (GHC)
No Total amount of loans given by PFIs to agric
in a given year
11 • Number of additional
branches established
No Total number of new branches of PFIs
established
12
% of the overall loan amount
repaid
No Proportion of the amount of the loans
advanced repaid by beneficiaries according to
schedule
13 % of loans defaulted (by No Proportion of total loans advanced unpaid
Implementation Manual-M&E System Designed for the NRGP 19
INDICATOR RIMS
INDICATOR
DEFINITION
Gender) according to schedule
14 % of Agric portfolio at risk at
30 days (RIMS)
Yes Proportion of total agric portfolio at risk for >
30 days
OUTCOME INDICATORS
1 % increase in productivity
Yes Change in Production/unit area (ha) against
base year
Industrial Commodity Window
Maize (Mt/ha)
Soya (Mt/ha)
Sorghum (Mt/ha)
Rice (Mt/ha)
High Value Vegetables
Chilli (Mt/ha)
Okra (Mt/ha)
Buuternut Squash (Mt/ha)
Women Commodity Window
Shea
Sesame
Moringa
Animal Based Window
G. fowl
Small Ruminant
Pigs
Fish
2 Volumes of commodities
produced by commodity
No Total production in metric by commodity
from clients
Industrial Commodity Window
Maize (Mt)
Soya (Mt)
Sorghum (Mt)
Rice (Mt)
High Value Vegetables
Chilli (Mt)
Okra (Mt)
Butternut Squash (Mt)
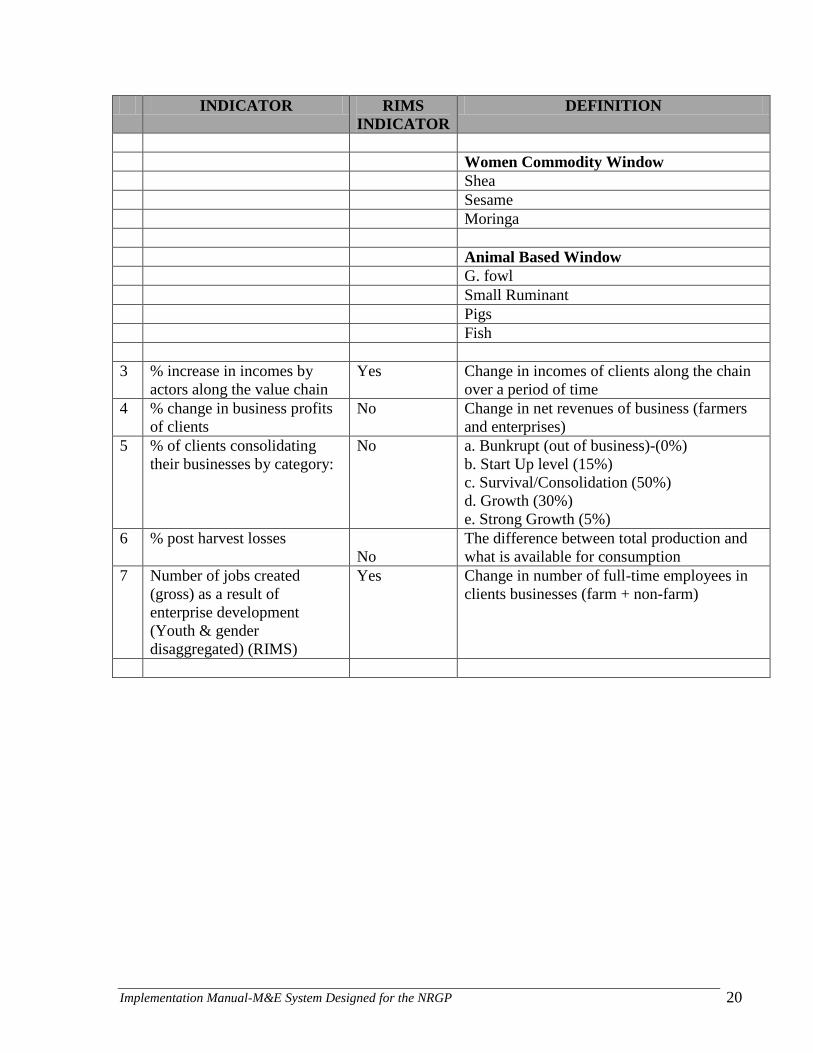
Implementation Manual-M&E System Designed for the NRGP 20
INDICATOR RIMS
INDICATOR
DEFINITION
Women Commodity Window
Shea
Sesame
Moringa
Animal Based Window
G. fowl
Small Ruminant
Pigs
Fish
3 % increase in incomes by
actors along the value chain
Yes Change in incomes of clients along the chain
over a period of time
4 % change in business profits
of clients
No Change in net revenues of business (farmers
and enterprises)
5 % of clients consolidating
their businesses by category:
No a. Bunkrupt (out of business)-(0%)
b. Start Up level (15%)
c. Survival/Consolidation (50%)
d. Growth (30%)
e. Strong Growth (5%)
6 % post harvest losses
No
The difference between total production and
what is available for consumption
7 Number of jobs created
(gross) as a result of
enterprise development
(Youth & gender
disaggregated) (RIMS)
Yes Change in number of full-time employees in
clients businesses (farm + non-farm)
Implementation Manual-M&E System Designed for the NRGP 21
3.1. The Performance Framework of the Project
The Performance/results framework has been developed in order to give life to the project. The
completed matrix of the first, second and third level of results, indicators, baselines and targets
becomes the performance/results framework. It defines the results, and plans for the design of a
results-based M&E system that will in turn begin to provide information on whether interim
targets are being achieved on the way to the longer-term outcome.
The performance framework becomes the basis for planning and resource allocation. It should be
frequently consulted and considered during the process of managing towards the desired
outcomes.
Target setting took into consideration the baseline situation, the expected funding and resource
levels – existing capacity within MOFA and implementing agencies, budgets, personnel, funding
sources and the like during the target period.
It is recommended that the targets within the results framework should be reviewed periodically
to reflect current realities with regards to resource and capacity changes.
Details of the Indicators and targets set for the NRGP are shown in table 3.
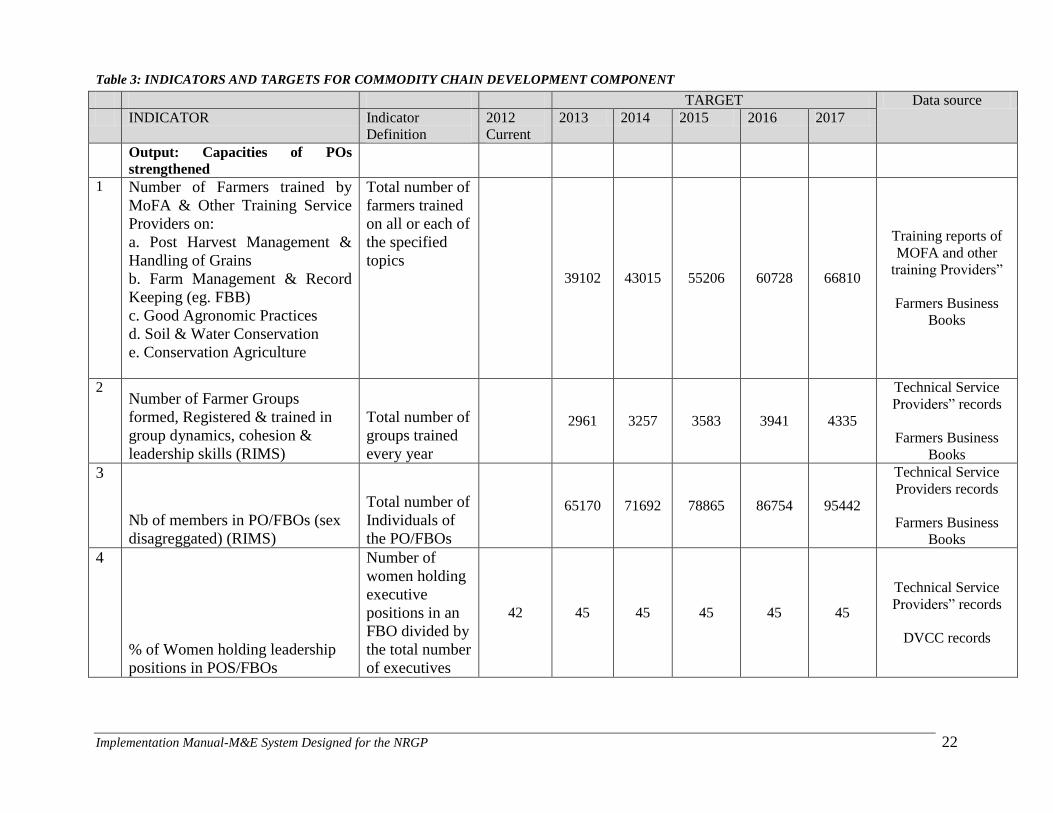
Implementation Manual-M&E System Designed for the NRGP
22
Table 3: INDICATORS AND TARGETS FOR COMMODITY CHAIN DEVELOPMENT COMPONENT
TARGET Data source
INDICATOR Indicator
Definition
2012
Current
2013 2014 2015 2016 2017
Output: Capacities of POs
strengthened
1 Number of Farmers trained by
MoFA & Other Training Service
Providers on:
a. Post Harvest Management &
Handling of Grains
b. Farm Management & Record
Keeping (eg. FBB)
c. Good Agronomic Practices
d. Soil & Water Conservation
e. Conservation Agriculture
Total number of
farmers trained
on all or each of
the specified
topics 39102 43015 55206 60728 66810
Training reports of
MOFA and other
training Providers‖
Farmers Business
Books
2 Number of Farmer Groups
formed, Registered & trained in
group dynamics, cohesion &
leadership skills (RIMS)
Total number of
groups trained
every year
2961 3257 3583 3941 4335
Technical Service
Providers‖ records
Farmers Business
Books
3
Nb of members in PO/FBOs (sex
disagreggated) (RIMS)
Total number of
Individuals of
the PO/FBOs
65170 71692 78865 86754 95442
Technical Service
Providers records
Farmers Business
Books
4
% of Women holding leadership
positions in POS/FBOs
Number of
women holding
executive
positions in an
FBO divided by
the total number
of executives
42 45 45 45 45 45
Technical Service
Providers‖ records
DVCC records
Implementation Manual-M&E System Designed for the NRGP
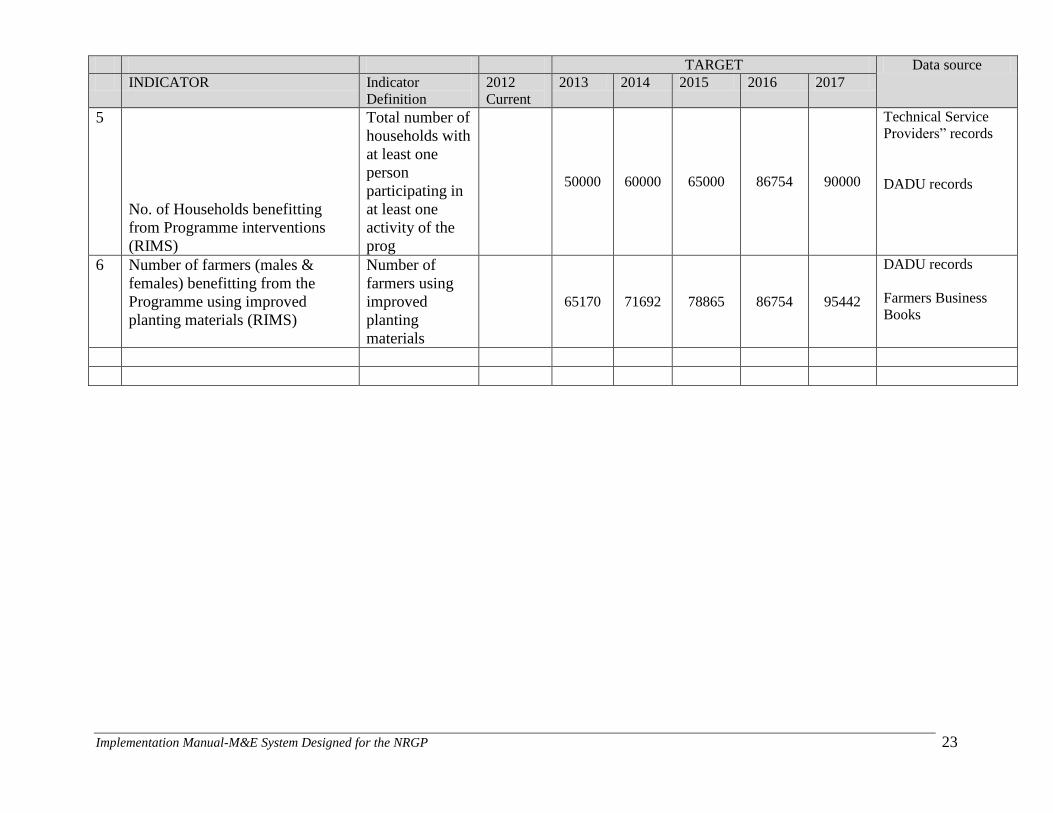
23
TARGET Data source
INDICATOR Indicator
Definition
2012
Current
2013 2014 2015 2016 2017
5
No. of Households benefitting
from Programme interventions
(RIMS)
Total number of
households with
at least one
person
participating in
at least one
activity of the
prog
50000 60000 65000 86754 90000
Technical Service
Providers‖ records
DADU records
6 Number of farmers (males &
females) benefitting from the
Programme using improved
planting materials (RIMS)
Number of
farmers using
improved
planting
materials
65170 71692 78865 86754 95442
DADU records
Farmers Business
Books
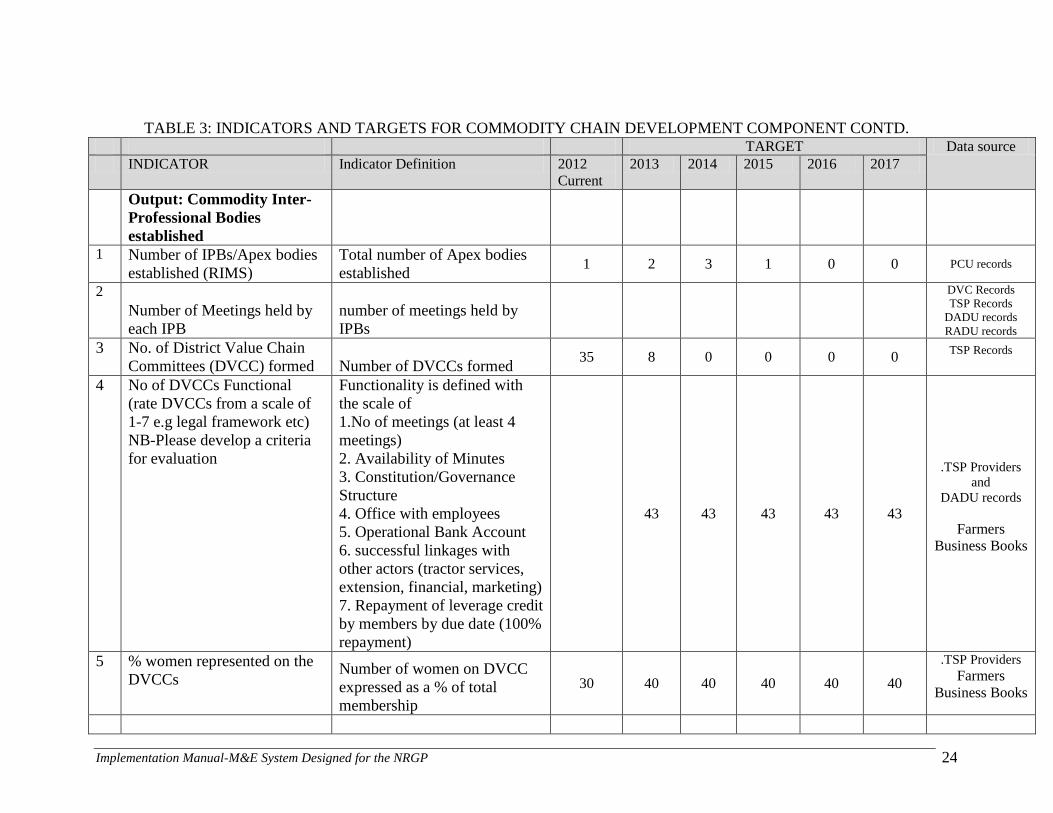
Implementation Manual-M&E System Designed for the NRGP 24
TABLE 3: INDICATORS AND TARGETS FOR COMMODITY CHAIN DEVELOPMENT COMPONENT CONTD. TARGET Data source
INDICATOR Indicator Definition 2012
Current
2013 2014 2015 2016 2017
Output: Commodity Inter-
Professional Bodies
established
1 Number of IPBs/Apex bodies
established (RIMS)
Total number of Apex bodies
established 1 2 3 1 0 0 PCU records
2
Number of Meetings held by
each IPB
number of meetings held by
IPBs
DVC Records
TSP Records
DADU records
RADU records
3 No. of District Value Chain
Committees (DVCC) formed Number of DVCCs formed 35 8 0 0 0 0
TSP Records
4 No of DVCCs Functional
(rate DVCCs from a scale of
1-7 e.g legal framework etc)
NB-Please develop a criteria
for evaluation
Functionality is defined with
the scale of
1.No of meetings (at least 4
meetings)
2. Availability of Minutes
3. Constitution/Governance
Structure
4. Office with employees
5. Operational Bank Account
6. successful linkages with
other actors (tractor services,
extension, financial, marketing)
7. Repayment of leverage credit
by members by due date (100%
repayment)
43 43 43 43 43
.TSP Providers
and
DADU records
Farmers
Business Books
5 % women represented on the
DVCCs Number of women on DVCC
expressed as a % of total
membership
30 40 40 40 40 40
.TSP Providers
Farmers
Business Books
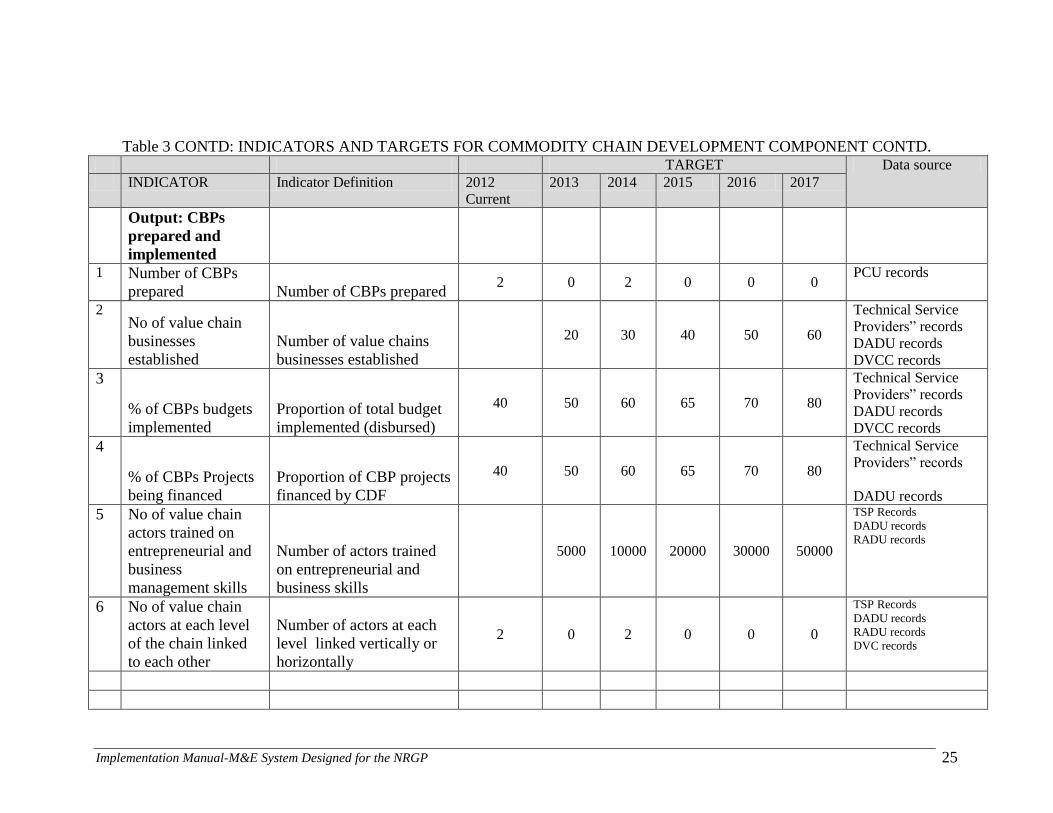
Implementation Manual-M&E System Designed for the NRGP 25
Table 3 CONTD: INDICATORS AND TARGETS FOR COMMODITY CHAIN DEVELOPMENT COMPONENT CONTD. TARGET Data source
INDICATOR Indicator Definition 2012
Current
2013 2014 2015 2016 2017
Output: CBPs
prepared and
implemented
1 Number of CBPs
prepared Number of CBPs prepared 2 0 2 0 0 0
PCU records
2 No of value chain
businesses
established
Number of value chains
businesses established
20 30 40 50 60
Technical Service
Providers‖ records
DADU records
DVCC records
3
% of CBPs budgets
implemented
Proportion of total budget
implemented (disbursed)
40 50 60 65 70 80
Technical Service
Providers‖ records
DADU records
DVCC records
4
% of CBPs Projects
being financed
Proportion of CBP projects
financed by CDF
40 50 60 65 70 80
Technical Service
Providers‖ records
DADU records
5 No of value chain
actors trained on
entrepreneurial and
business
management skills
Number of actors trained
on entrepreneurial and
business skills
5000 10000 20000 30000 50000
TSP Records
DADU records
RADU records
6 No of value chain
actors at each level
of the chain linked
to each other
Number of actors at each
level linked vertically or
horizontally
2 0 2 0 0 0
TSP Records
DADU records
RADU records
DVC records
Implementation Manual-M&E System Designed for the NRGP 26
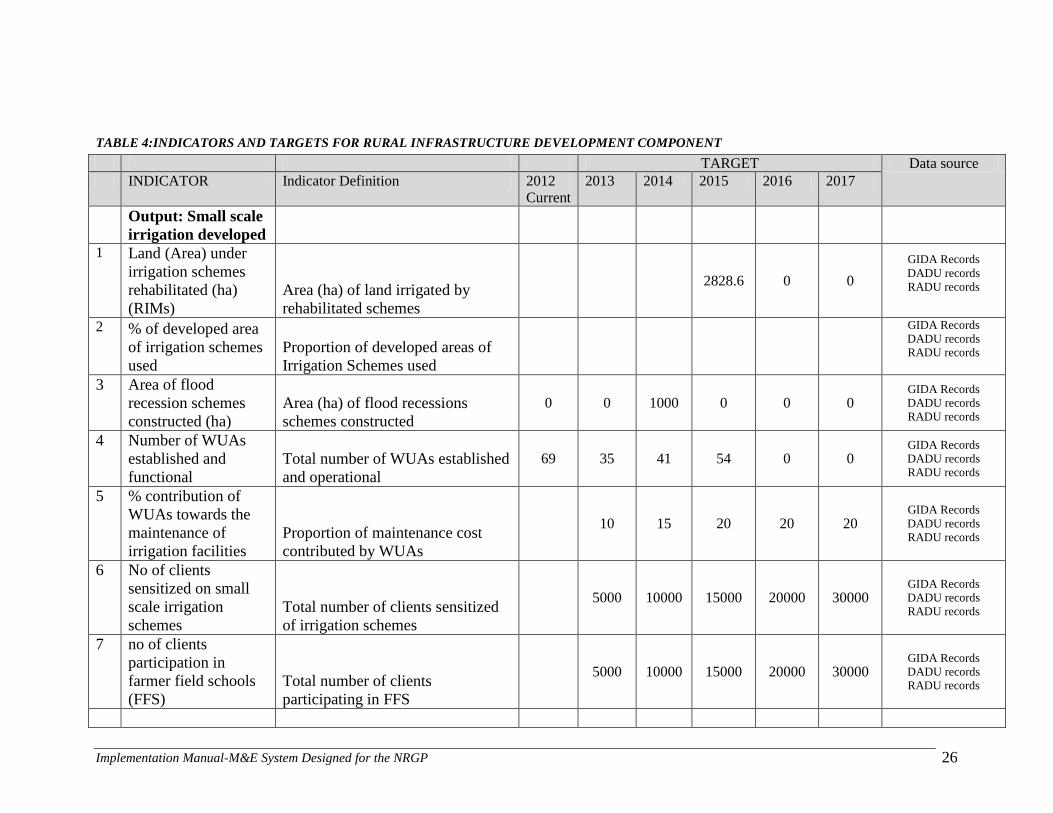
TABLE 4:INDICATORS AND TARGETS FOR RURAL INFRASTRUCTURE DEVELOPMENT COMPONENT
TARGET Data source
INDICATOR Indicator Definition 2012
Current
2013 2014 2015 2016 2017
Output: Small scale
irrigation developed
1 Land (Area) under
irrigation schemes
rehabilitated (ha)
(RIMs)
Area (ha) of land irrigated by
rehabilitated schemes
2828.6 0 0
GIDA Records
DADU records
RADU records
2 % of developed area
of irrigation schemes
used
Proportion of developed areas of
Irrigation Schemes used
GIDA Records
DADU records
RADU records
3 Area of flood
recession schemes
constructed (ha)
Area (ha) of flood recessions
schemes constructed
0 0 1000 0 0 0 GIDA Records
DADU records
RADU records
4 Number of WUAs
established and
functional
Total number of WUAs established
and operational
69 35 41 54 0 0 GIDA Records
DADU records
RADU records
5 % contribution of
WUAs towards the
maintenance of
irrigation facilities
Proportion of maintenance cost
contributed by WUAs
10 15 20 20 20 GIDA Records
DADU records
RADU records
6 No of clients
sensitized on small
scale irrigation
schemes
Total number of clients sensitized
of irrigation schemes
5000 10000 15000 20000 30000 GIDA Records
DADU records
RADU records
7 no of clients
participation in
farmer field schools
(FFS)
Total number of clients
participating in FFS
5000 10000 15000 20000 30000 GIDA Records
DADU records
RADU records
Implementation Manual-M&E System Designed for the NRGP 27
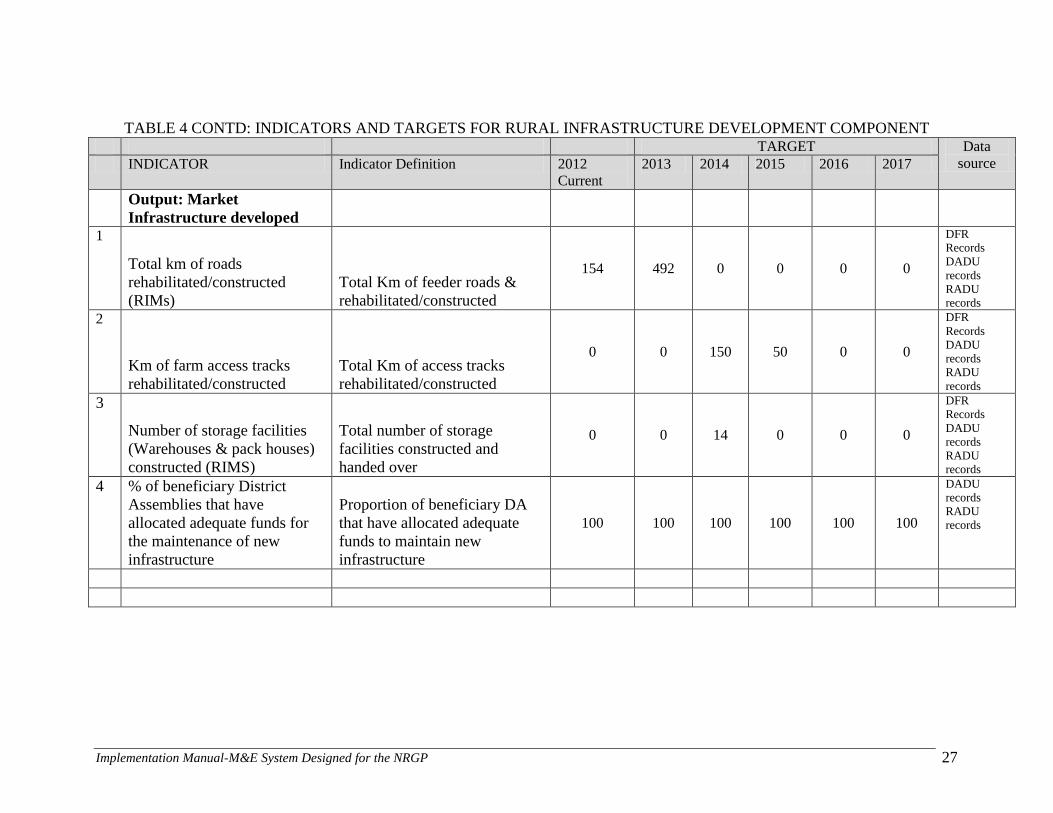
TABLE 4 CONTD: INDICATORS AND TARGETS FOR RURAL INFRASTRUCTURE DEVELOPMENT COMPONENT TARGET Data
source INDICATOR Indicator Definition 2012
Current
2013 2014 2015 2016 2017
Output: Market
Infrastructure developed
1
Total km of roads
rehabilitated/constructed
(RIMs)
Total Km of feeder roads &
rehabilitated/constructed
154 492 0 0 0 0
DFR
Records
DADU
records
RADU
records
2
Km of farm access tracks
rehabilitated/constructed
Total Km of access tracks
rehabilitated/constructed
0 0 150 50 0 0
DFR
Records
DADU
records
RADU
records
3
Number of storage facilities
(Warehouses & pack houses)
constructed (RIMS)
Total number of storage
facilities constructed and
handed over
0 0 14 0 0 0
DFR
Records
DADU
records
RADU
records
4 % of beneficiary District
Assemblies that have
allocated adequate funds for
the maintenance of new
infrastructure
Proportion of beneficiary DA
that have allocated adequate
funds to maintain new
infrastructure
100 100 100 100 100 100
DADU
records
RADU
records
Implementation Manual-M&E System Designed for the NRGP 28
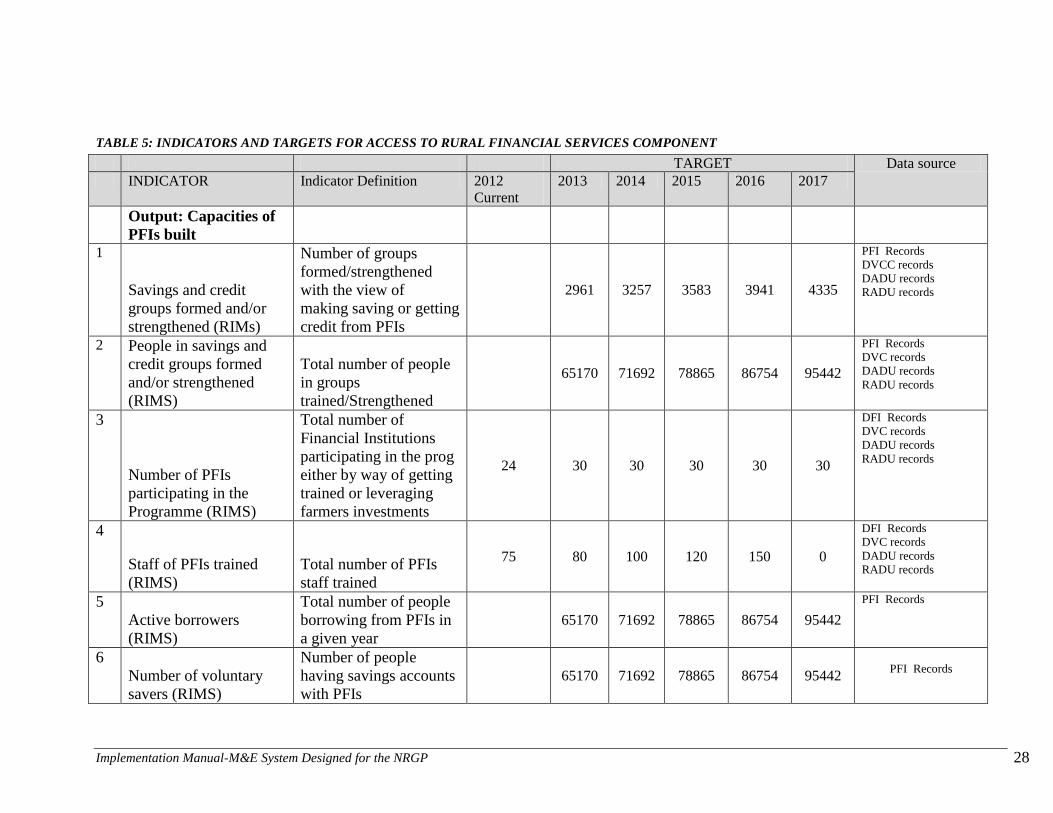
TABLE 5: INDICATORS AND TARGETS FOR ACCESS TO RURAL FINANCIAL SERVICES COMPONENT
TARGET Data source
INDICATOR Indicator Definition 2012
Current
2013 2014 2015 2016 2017
Output: Capacities of
PFIs built
1
Savings and credit
groups formed and/or
strengthened (RIMs)
Number of groups
formed/strengthened
with the view of
making saving or getting
credit from PFIs
2961 3257 3583 3941 4335
PFI Records
DVCC records
DADU records
RADU records
2 People in savings and
credit groups formed
and/or strengthened
(RIMS)
Total number of people
in groups
trained/Strengthened
65170 71692 78865 86754 95442
PFI Records
DVC records
DADU records
RADU records
3
Number of PFIs
participating in the
Programme (RIMS)
Total number of
Financial Institutions
participating in the prog
either by way of getting
trained or leveraging
farmers investments
24 30 30 30 30 30
DFI Records
DVC records
DADU records
RADU records
4
Staff of PFIs trained
(RIMS)
Total number of PFIs
staff trained
75 80 100 120 150 0
DFI Records
DVC records
DADU records
RADU records
5
Active borrowers
(RIMS)
Total number of people
borrowing from PFIs in
a given year
65170 71692 78865 86754 95442
PFI Records
6
Number of voluntary
savers (RIMS)
Number of people
having savings accounts
with PFIs
65170 71692 78865 86754 95442 PFI Records
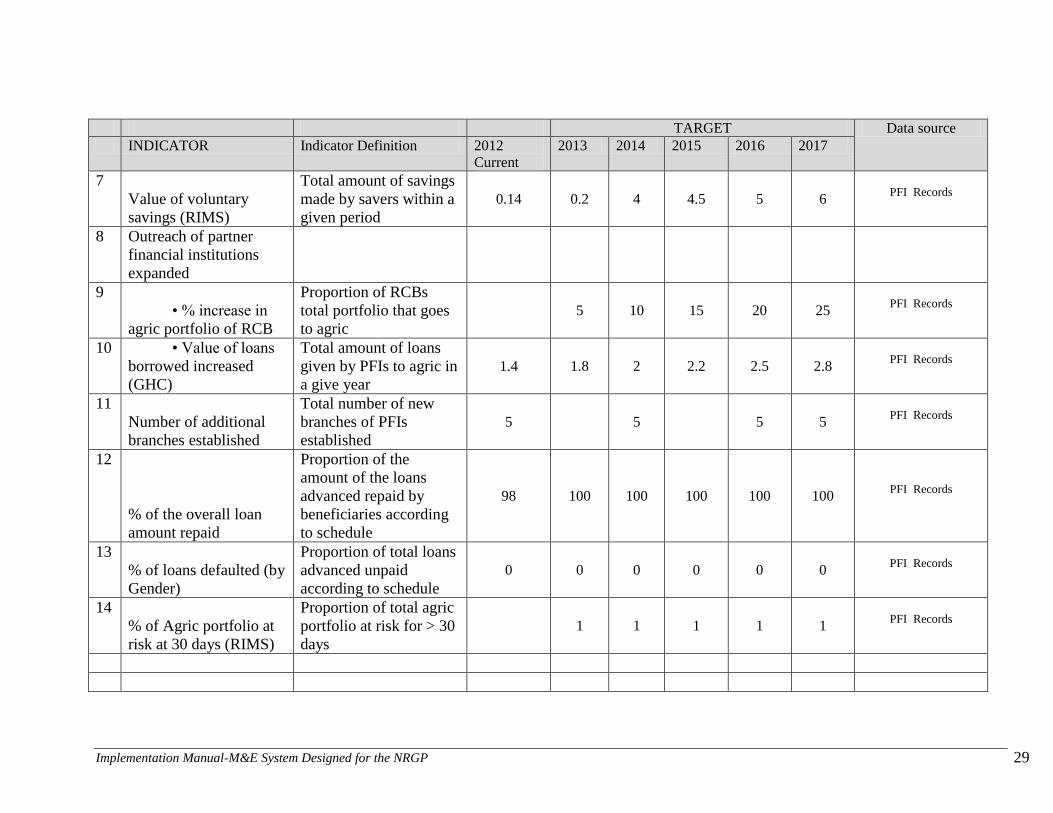
Implementation Manual-M&E System Designed for the NRGP 29
TARGET Data source
INDICATOR Indicator Definition 2012
Current
2013 2014 2015 2016 2017
7
Value of voluntary
savings (RIMS)
Total amount of savings
made by savers within a
given period
0.14 0.2 4 4.5 5 6 PFI Records
8 Outreach of partner
financial institutions
expanded
9
• % increase in
agric portfolio of RCB
Proportion of RCBs
total portfolio that goes
to agric
5 10 15 20 25 PFI Records
10 • Value of loans
borrowed increased
(GHC)
Total amount of loans
given by PFIs to agric in
a give year
1.4 1.8 2 2.2 2.5 2.8 PFI Records
11
Number of additional
branches established
Total number of new
branches of PFIs
established
5 5 5 5 PFI Records
12
% of the overall loan
amount repaid
Proportion of the
amount of the loans
advanced repaid by
beneficiaries according
to schedule
98 100 100 100 100 100 PFI Records
13
% of loans defaulted (by
Gender)
Proportion of total loans
advanced unpaid
according to schedule
0 0 0 0 0 0 PFI Records
14
% of Agric portfolio at
risk at 30 days (RIMS)
Proportion of total agric
portfolio at risk for > 30
days
1 1 1 1 1 PFI Records
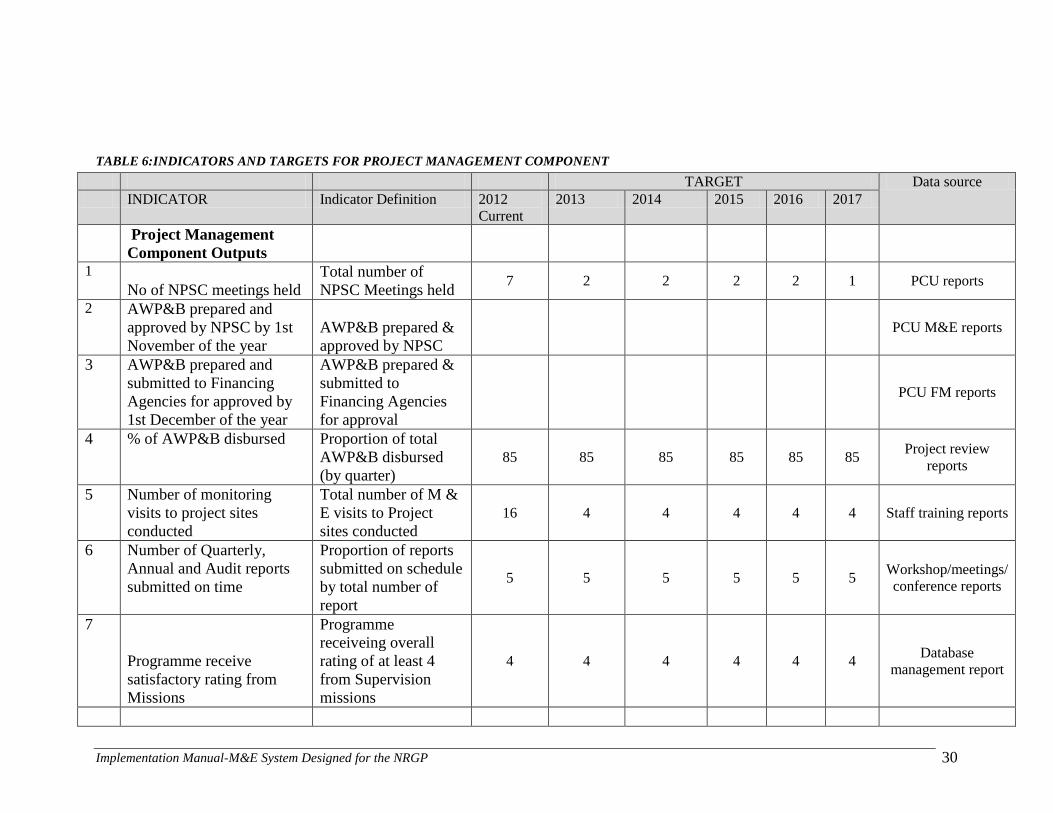
Implementation Manual-M&E System Designed for the NRGP 30
TABLE 6:INDICATORS AND TARGETS FOR PROJECT MANAGEMENT COMPONENT
TARGET Data source
INDICATOR Indicator Definition 2012
Current
2013 2014 2015 2016 2017
Project Management
Component Outputs
1
No of NPSC meetings held
Total number of
NPSC Meetings held 7 2 2 2 2 1 PCU reports
2 AWP&B prepared and
approved by NPSC by 1st
November of the year
AWP&B prepared &
approved by NPSC
PCU M&E reports
3 AWP&B prepared and
submitted to Financing
Agencies for approved by
1st December of the year
AWP&B prepared &
submitted to
Financing Agencies
for approval
PCU FM reports
4 % of AWP&B disbursed Proportion of total
AWP&B disbursed
(by quarter)
85 85 85 85 85 85 Project review
reports
5 Number of monitoring
visits to project sites
conducted
Total number of M &
E visits to Project
sites conducted
16 4 4 4 4 4 Staff training reports
6 Number of Quarterly,
Annual and Audit reports
submitted on time
Proportion of reports
submitted on schedule
by total number of
report
5 5 5 5 5 5 Workshop/meetings/
conference reports
7
Programme receive
satisfactory rating from
Missions
Programme
receiveing overall
rating of at least 4
from Supervision
missions
4 4 4 4 4 4 Database
management report
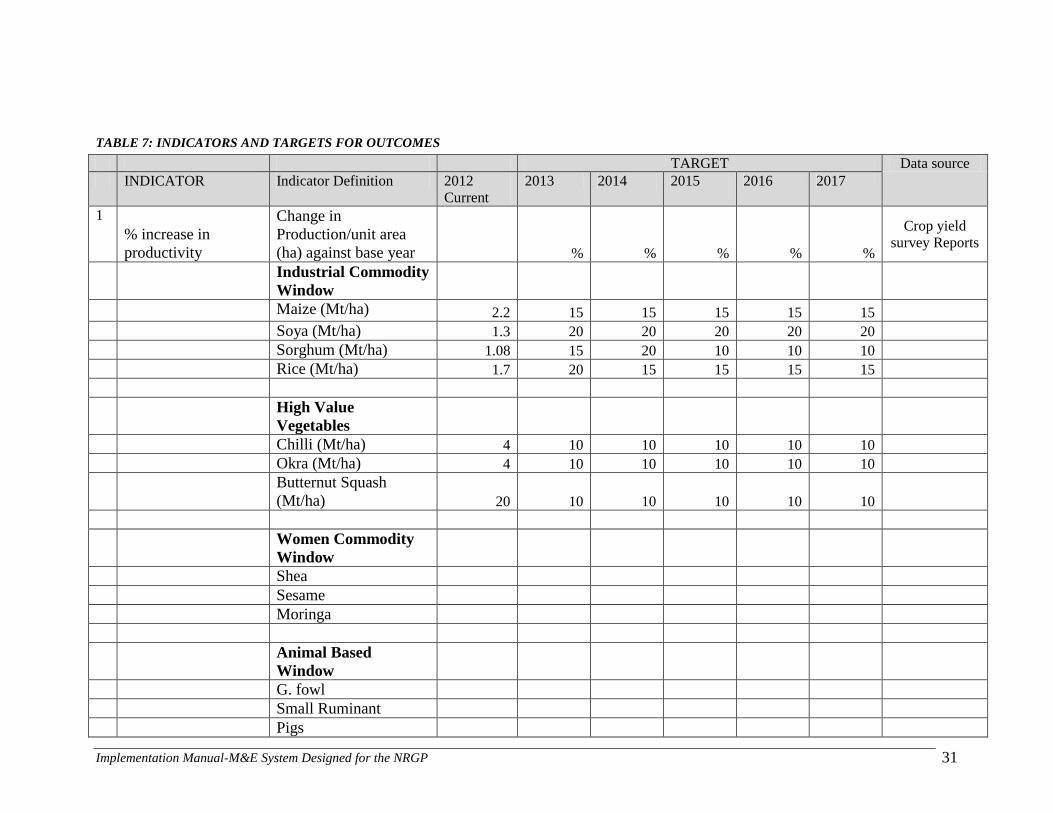
Implementation Manual-M&E System Designed for the NRGP 31
TABLE 7: INDICATORS AND TARGETS FOR OUTCOMES
TARGET Data source
INDICATOR Indicator Definition 2012
Current
2013 2014 2015 2016 2017
1
% increase in
productivity
Change in
Production/unit area
(ha) against base year % % % % %
Crop yield
survey Reports
Industrial Commodity
Window
Maize (Mt/ha) 2.2 15 15 15 15 15
Soya (Mt/ha) 1.3 20 20 20 20 20
Sorghum (Mt/ha) 1.08 15 20 10 10 10
Rice (Mt/ha) 1.7 20 15 15 15 15
High Value
Vegetables
Chilli (Mt/ha) 4 10 10 10 10 10
Okra (Mt/ha) 4 10 10 10 10 10
Butternut Squash
(Mt/ha) 20 10 10 10 10 10
Women Commodity
Window
Shea
Sesame
Moringa
Animal Based
Window
G. fowl
Small Ruminant
Pigs
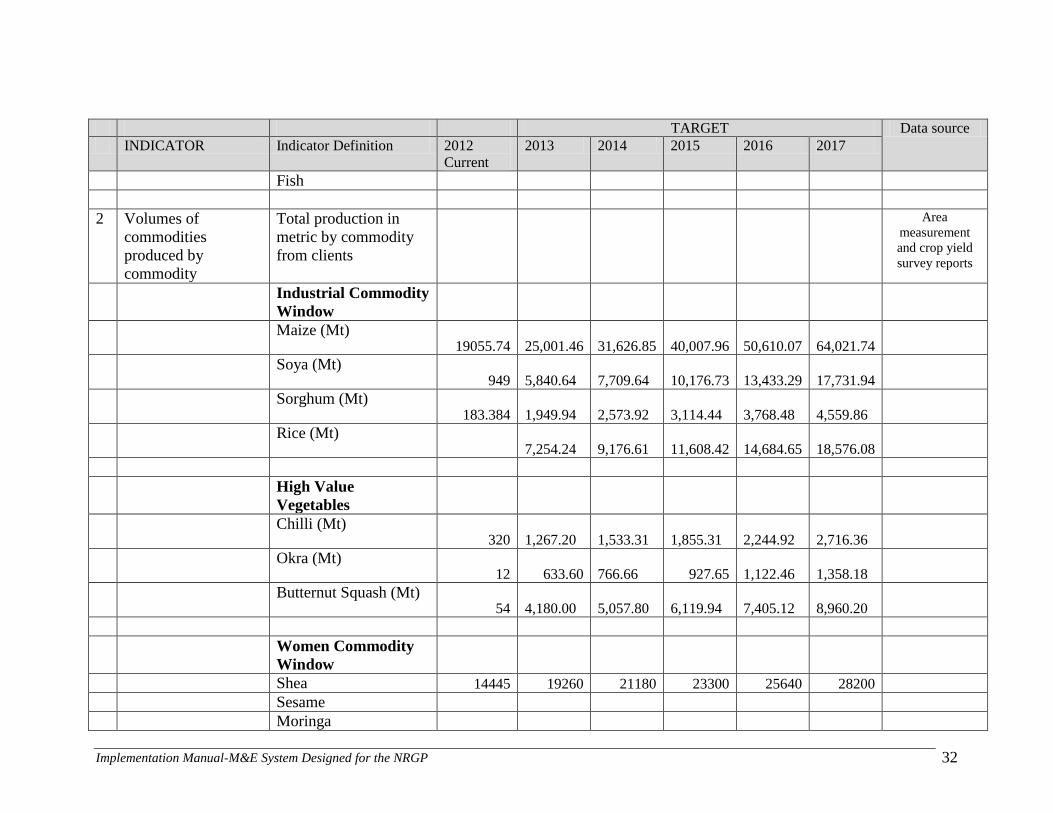
Implementation Manual-M&E System Designed for the NRGP 32
TARGET Data source
INDICATOR Indicator Definition 2012
Current
2013 2014 2015 2016 2017
Fish
2 Volumes of
commodities
produced by
commodity
Total production in
metric by commodity
from clients
Area
measurement
and crop yield
survey reports
Industrial Commodity
Window
Maize (Mt) 19055.74
25,001.46
31,626.85
40,007.96
50,610.07
64,021.74
Soya (Mt) 949
5,840.64
7,709.64
10,176.73
13,433.29
17,731.94
Sorghum (Mt) 183.384
1,949.94
2,573.92
3,114.44
3,768.48
4,559.86
Rice (Mt)
7,254.24
9,176.61
11,608.42
14,684.65
18,576.08
High Value
Vegetables
Chilli (Mt) 320
1,267.20
1,533.31
1,855.31
2,244.92
2,716.36
Okra (Mt) 12 633.60
766.66 927.65
1,122.46
1,358.18
Butternut Squash (Mt) 54
4,180.00
5,057.80
6,119.94
7,405.12
8,960.20
Women Commodity
Window
Shea 14445 19260 21180 23300 25640 28200
Sesame
Moringa
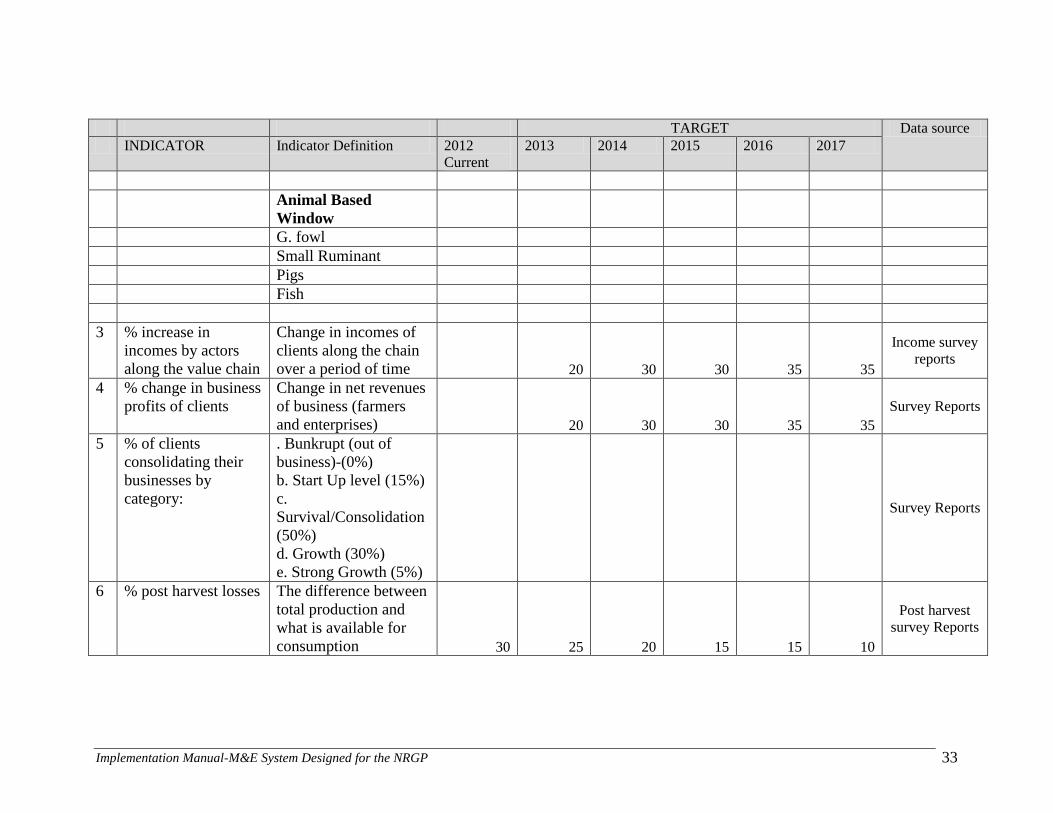
Implementation Manual-M&E System Designed for the NRGP 33
TARGET Data source
INDICATOR Indicator Definition 2012
Current
2013 2014 2015 2016 2017
Animal Based
Window
G. fowl
Small Ruminant
Pigs
Fish
3 % increase in
incomes by actors
along the value chain
Change in incomes of
clients along the chain
over a period of time 20 30 30 35 35
Income survey
reports
4 % change in business
profits of clients
Change in net revenues
of business (farmers
and enterprises) 20 30 30 35 35
Survey Reports
5 % of clients
consolidating their
businesses by
category:
. Bunkrupt (out of
business)-(0%)
b. Start Up level (15%)
c.
Survival/Consolidation
(50%)
d. Growth (30%)
e. Strong Growth (5%)
Survey Reports
6 % post harvest losses The difference between
total production and
what is available for
consumption 30 25 20 15 15 10
Post harvest
survey Reports
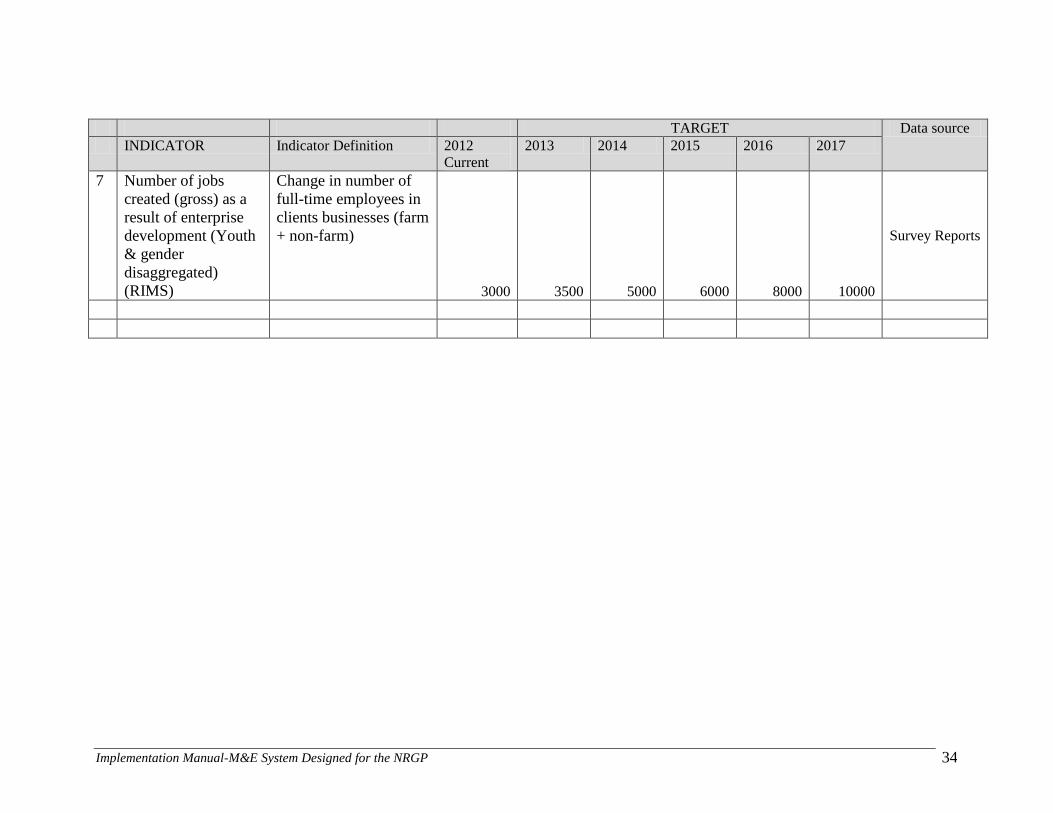
Implementation Manual-M&E System Designed for the NRGP 34
TARGET Data source
INDICATOR Indicator Definition 2012
Current
2013 2014 2015 2016 2017
7 Number of jobs
created (gross) as a
result of enterprise
development (Youth
& gender
disaggregated)
(RIMS)
Change in number of
full-time employees in
clients businesses (farm
+ non-farm)
3000 3500 5000 6000 8000 10000
Survey Reports
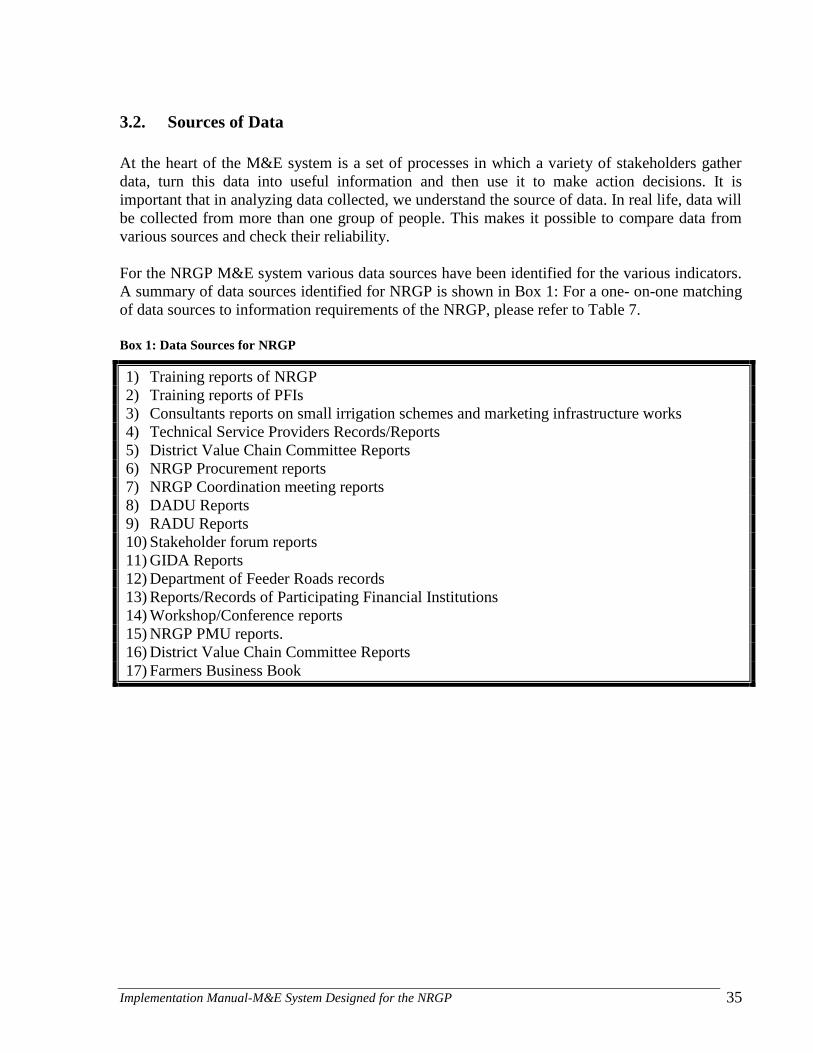
Implementation Manual-M&E System Designed for the NRGP 35
3.2. Sources of Data
At the heart of the M&E system is a set of processes in which a variety of stakeholders gather
data, turn this data into useful information and then use it to make action decisions. It is
important that in analyzing data collected, we understand the source of data. In real life, data will
be collected from more than one group of people. This makes it possible to compare data from
various sources and check their reliability.
For the NRGP M&E system various data sources have been identified for the various indicators.
A summary of data sources identified for NRGP is shown in Box 1: For a one- on-one matching
of data sources to information requirements of the NRGP, please refer to Table 7.
Box 1: Data Sources for NRGP
1) Training reports of NRGP
2) Training reports of PFIs
3) Consultants reports on small irrigation schemes and marketing infrastructure works
4) Technical Service Providers Records/Reports
5) District Value Chain Committee Reports
6) NRGP Procurement reports
7) NRGP Coordination meeting reports
8) DADU Reports
9) RADU Reports
10) Stakeholder forum reports
11) GIDA Reports
12) Department of Feeder Roads records
13) Reports/Records of Participating Financial Institutions
14) Workshop/Conference reports
15) NRGP PMU reports.
16) District Value Chain Committee Reports
17) Farmers Business Book
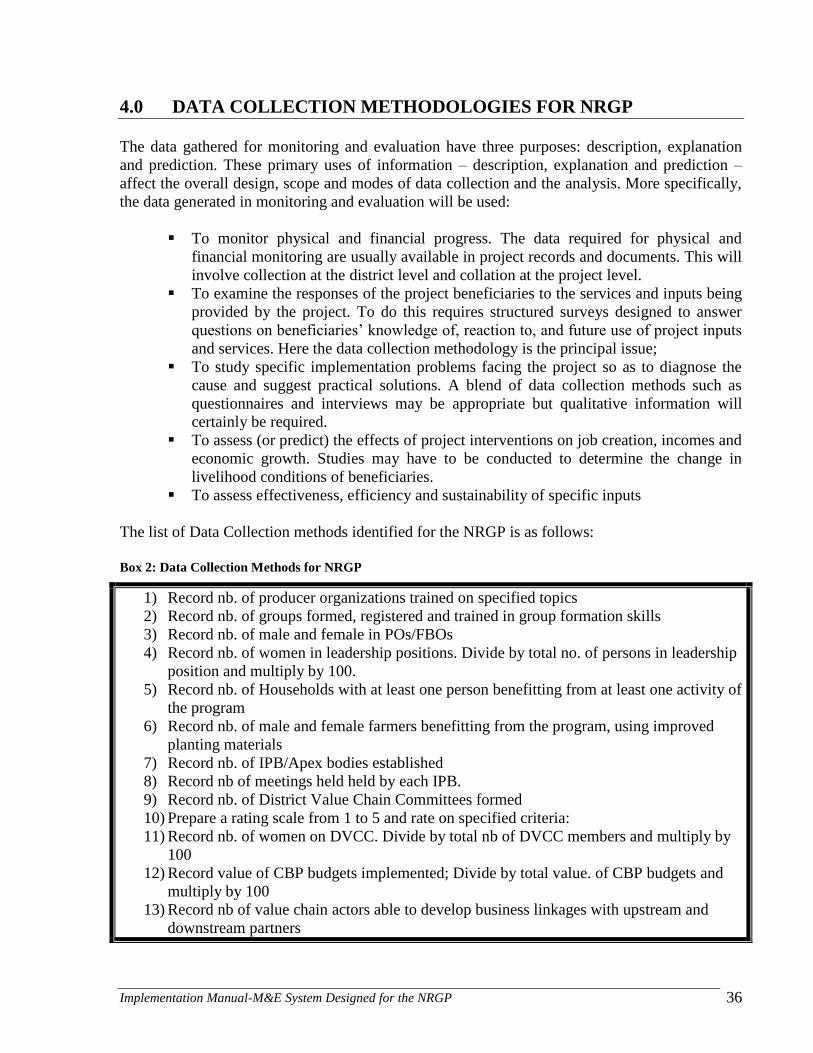
Implementation Manual-M&E System Designed for the NRGP 36
4.0 DATA COLLECTION METHODOLOGIES FOR NRGP
The data gathered for monitoring and evaluation have three purposes: description, explanation
and prediction. These primary uses of information – description, explanation and prediction –
affect the overall design, scope and modes of data collection and the analysis. More specifically,
the data generated in monitoring and evaluation will be used:
To monitor physical and financial progress. The data required for physical and
financial monitoring are usually available in project records and documents. This will
involve collection at the district level and collation at the project level.
To examine the responses of the project beneficiaries to the services and inputs being
provided by the project. To do this requires structured surveys designed to answer
questions on beneficiaries‘ knowledge of, reaction to, and future use of project inputs
and services. Here the data collection methodology is the principal issue;
To study specific implementation problems facing the project so as to diagnose the
cause and suggest practical solutions. A blend of data collection methods such as
questionnaires and interviews may be appropriate but qualitative information will
certainly be required.
To assess (or predict) the effects of project interventions on job creation, incomes and
economic growth. Studies may have to be conducted to determine the change in
livelihood conditions of beneficiaries.
To assess effectiveness, efficiency and sustainability of specific inputs
The list of Data Collection methods identified for the NRGP is as follows:
Box 2: Data Collection Methods for NRGP
1) Record nb. of producer organizations trained on specified topics
2) Record nb. of groups formed, registered and trained in group formation skills
3) Record nb. of male and female in POs/FBOs
4) Record nb. of women in leadership positions. Divide by total no. of persons in leadership
position and multiply by 100.
5) Record nb. of Households with at least one person benefitting from at least one activity of
the program
6) Record nb. of male and female farmers benefitting from the program, using improved
planting materials
7) Record nb. of IPB/Apex bodies established
8) Record nb of meetings held held by each IPB.
9) Record nb. of District Value Chain Committees formed
10) Prepare a rating scale from 1 to 5 and rate on specified criteria:
11) Record nb. of women on DVCC. Divide by total nb of DVCC members and multiply by
100
12) Record value of CBP budgets implemented; Divide by total value. of CBP budgets and
multiply by 100
13) Record nb of value chain actors able to develop business linkages with upstream and
downstream partners
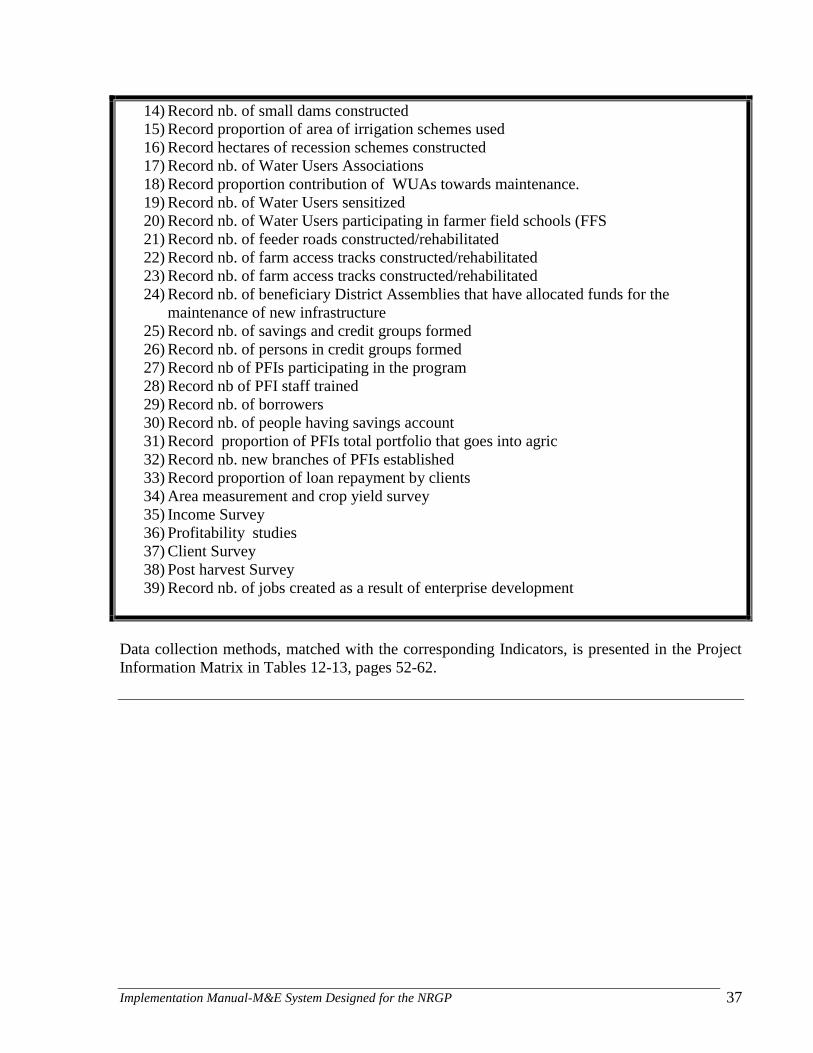
Implementation Manual-M&E System Designed for the NRGP 37
14) Record nb. of small dams constructed
15) Record proportion of area of irrigation schemes used
16) Record hectares of recession schemes constructed
17) Record nb. of Water Users Associations
18) Record proportion contribution of WUAs towards maintenance.
19) Record nb. of Water Users sensitized
20) Record nb. of Water Users participating in farmer field schools (FFS
21) Record nb. of feeder roads constructed/rehabilitated
22) Record nb. of farm access tracks constructed/rehabilitated
23) Record nb. of farm access tracks constructed/rehabilitated
24) Record nb. of beneficiary District Assemblies that have allocated funds for the
maintenance of new infrastructure
25) Record nb. of savings and credit groups formed
26) Record nb. of persons in credit groups formed
27) Record nb of PFIs participating in the program
28) Record nb of PFI staff trained
29) Record nb. of borrowers
30) Record nb. of people having savings account
31) Record proportion of PFIs total portfolio that goes into agric
32) Record nb. new branches of PFIs established
33) Record proportion of loan repayment by clients
34) Area measurement and crop yield survey
35) Income Survey
36) Profitability studies
37) Client Survey
38) Post harvest Survey
39) Record nb. of jobs created as a result of enterprise development
Data collection methods, matched with the corresponding Indicators, is presented in the Project
Information Matrix in Tables 12-13, pages 52-62.
Implementation Manual-M&E System Designed for the NRGP 38
5.0 ORGANISATION AND IMPLEMENTATION OF THE NRGP M&E
SYSTEM
5.1. Levels of Monitoring
The M&E system of the NRGP is organized on the premise that management decisions taken as
close as possible to the activity motivates personnel, makes them react faster to changing needs
and situations and encourages economic use of resources. For this reason, it is crucial to ensure
that the level that records information should be able to use it. This will improve the chances that
the data will be collected carefully and put to use.
Monitoring of NRGP project activities would be conducted from the implementing agency level
to the PCU level. As a management tool, monitoring would be organized at each level of
management. The implementing agencies (stakeholders) of the project that will be conducting
monitoring activities are:
Ministry of Food and Agriculture
55 District Agricultural Development Units of MOFA
4 Regional Agricultural Development Units of MOFA
Association of Churches in Development Project (ACDEP)
Netherlands Development Organisation (SNV)
Department of Feeder Roads (DFR)
Ghana Irrigation Development Authority (GIDA)
District Value Chain Committees (DVCs)
Participating Financial Institutions
5.2 Specification of Roles and responsibilities of various actors of the M&E
process
5.2.1 Roles and Responsibilities of PCU M&E
The PCU M&E will be responsible for the following:
1) Establishment of an M&E System: The PCU M&E will oversee development of an
integrated M&E system. This will include procedures and processes that will be
documented in either an M&E Manual or other format, to be used by all PCU staff and
program implementers.
2) Provide M&E Orientation and Capacity Building for Stakeholders: The M&E Unit will be
responsible for communicating the M&E System to all Key Stakeholders involved in the
NRGP to ensure there is a common understanding of the overall process. This will take the
following forms:
a. Reviewing and validating indicators, data collection methods and sources, and
timing/frequency of data collection and reporting;
Implementation Manual-M&E System Designed for the NRGP 39
b. Target setting and review
c. Data quality controls and verification procedures;
M&E Orientation and Capacity Building for Stakeholders will be an ongoing activity and
will be rolled out as the situation demands.
3) Operate an Effective Documentation System: Based on the M&E framework and
application software developed by the M&E consulting firm, the M&E Unit will ensure
that an effective documentation system is operational at the project level by populating the
indicator tables at regular intervals for effective decision making purposes.
4) Disseminate Information and Findings: The M&E Unit will develop and implement a
systematic dissemination approach to ensure participation of all the stakeholders, and to
facilitate feedback of lessons learned into the program implementation process. Different
approaches to information packaging and dissemination will be employed depending on the
Stakeholders being targeted.
5) Conduct Data Quality Reviews: Data quality reviews will be conducted on a periodic basis
to assess the quality of data reported by various implementing institutions.
6) Participate in Program Monitoring: The M&E Unit will participate in Project Monitoring
through field visits, review of Project reports and analysis of Performance Monitoring and
other data. Project Monitoring will be an on-going exercise beginning from the start of
actual implementation of activities. In order to keep track of program activities effectively
and initiate corrective action promptly, all staff of the PCU will be required to provide
feedback to the Project Manager, reporting on observations made during field visits. For
this purpose, staff will use the ‗Field trip Report format‘ in Section 11 of this manual. The
format will be completed and submitted to the Project Manager on return from field visits
for prompt remedial action when necessary
7) Formulate an M&E Work Plan: Update the M&E work plan annually.
8) Coordinate and Supervise activities of M&E Consulting firms.
9) Initiate and manage the conduct of various studies that will be conducted under the project.
10) Provide leadership/guidance in analyses, studies and research
5.2.2. Responsibility for M&E at the Implementing Agency level – (DADUs, RADUs, ACDEP,
SNV, DFR, GIDA, PFIs)
1) Plan implementation of project M&E activities at the Agency level
2) Planning fine-tuning, packaging and scaling up
Implementation Manual-M&E System Designed for the NRGP 40
3) Collect and analyse data relevant to technical area of expertise, using prescribed
formats
4) Compilation and submission of project reports to NRGP
5) Participate in project review meetings
6) Regular field meeting to project sites
7) Submission of field monitoring reports to NRGP using prescribed formats
8) Work Planning and creating results framework
5.3 Communicating M&E findings and Providing feedback
Monitoring findings would be used to make managerial decisions at each level of
implementation of the NRGP. In addition to direct use by the level collecting the data, feedback
would be given to personnel at each level regarding the results of the data collected and the
analysis made at higher levels.
Where findings are not used at the level of collection, data reporting can become irregular and of
poor quality. Every effort would therefore be made to equip data collectors with the capacity to
utilize data at their level of operation.
Monitoring results, including field trip reports, would be summarized and discussed during
project review meetings and also incorporated in the Quarterly Reports. Suggested revisions
would be incorporated in the Plan of Action for the succeeding period. In addition, the review
would identify new evaluations and studies to be conducted and revise/ update the evaluation
plan.
5.3.1 Presentation of Performance data
Performance data of the NRGP would be presented in comparison to earlier data and to the
baseline. Data would be presented in a simple, clear and easily understandable format. Only the
most important data should be presented. Acronyms and jargons should be avoided. A minimum
of background information should be provided to establish the context. Major points should be
stated upfront. Findings and recommendations should be organized around key outcomes and
their indicators. A separate appendix or report can be used to convey detailed data. In table 8, we
present points of analysis and questions that should be answered in the presentation of
performance data.
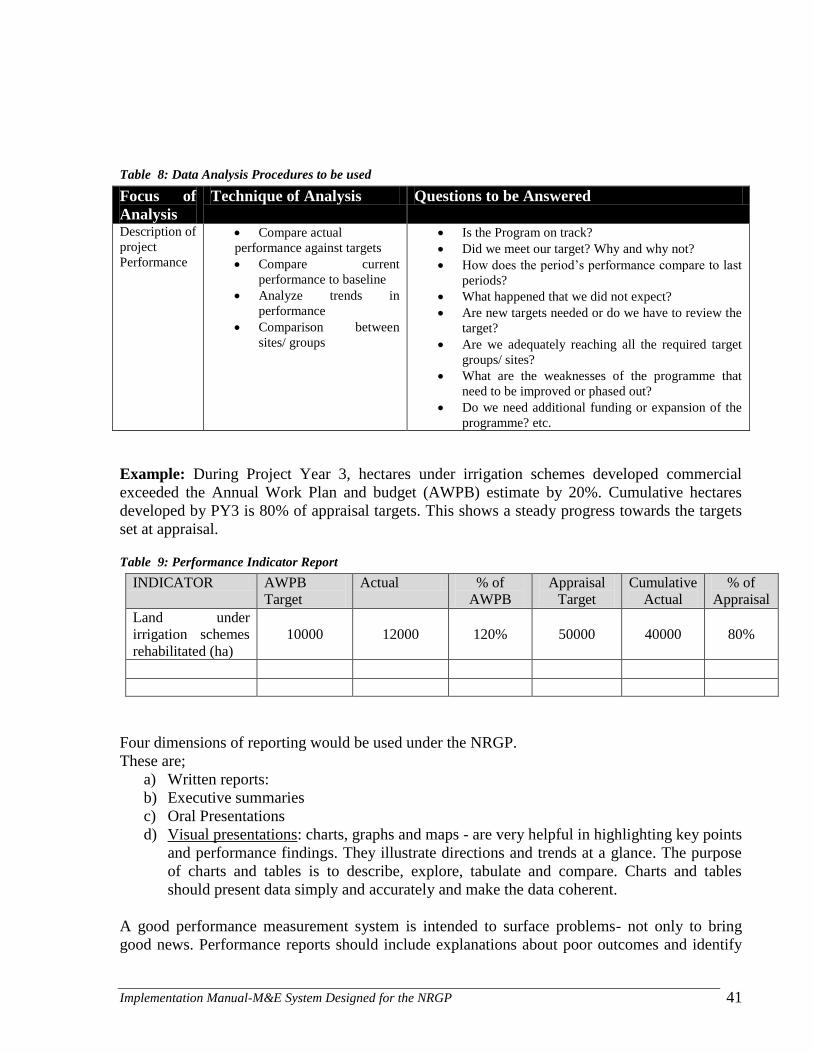
Implementation Manual-M&E System Designed for the NRGP 41
Table 8: Data Analysis Procedures to be used
Focus of
Analysis
Technique of Analysis Questions to be Answered
Description of
project
Performance
Compare actual
performance against targets
Compare current
performance to baseline
Analyze trends in
performance
Comparison between
sites/ groups
Is the Program on track?
Did we meet our target? Why and why not?
How does the period‘s performance compare to last
periods?
What happened that we did not expect?
Are new targets needed or do we have to review the
target?
Are we adequately reaching all the required target
groups/ sites?
What are the weaknesses of the programme that
need to be improved or phased out?
Do we need additional funding or expansion of the
programme? etc.
Example: During Project Year 3, hectares under irrigation schemes developed commercial
exceeded the Annual Work Plan and budget (AWPB) estimate by 20%. Cumulative hectares
developed by PY3 is 80% of appraisal targets. This shows a steady progress towards the targets
set at appraisal.
Table 9: Performance Indicator Report
INDICATOR AWPB
Target
Actual % of
AWPB
Appraisal
Target
Cumulative
Actual
% of
Appraisal
Land under
irrigation schemes
rehabilitated (ha)
10000 12000 120% 50000 40000 80%
Four dimensions of reporting would be used under the NRGP.
These are;
a) Written reports:
b) Executive summaries
c) Oral Presentations
d) Visual presentations: charts, graphs and maps - are very helpful in highlighting key points
and performance findings. They illustrate directions and trends at a glance. The purpose
of charts and tables is to describe, explore, tabulate and compare. Charts and tables
should present data simply and accurately and make the data coherent.
A good performance measurement system is intended to surface problems- not only to bring
good news. Performance reports should include explanations about poor outcomes and identify
Implementation Manual-M&E System Designed for the NRGP 42
steps taken or planned to correct problems. Instilling fear of bringing forth bad news will not
encourage reporting and use of findings.
5.3.2. Quality of Information presented in reports
Data collection system for all indicators (implementation and results) of the NRGP M&E system
will possess three key criteria: reliability, validity and timeliness. For this purpose data quality
assessments will be undertaken regularly.
NRGP Data Quality Reviews will assess data collection, analysis, and dissemination systems to
determine the utility, objectivity, and integrity of the information. The recommendations
resulting from the reviews will help to constantly improve collection, processing, and
dissemination of data. Additional elements will include capacity building efforts for project
implementers and others responsible for collecting and reporting data. The capacity building
initiatives will be upstream interventions aimed at strengthening implementers‘ data collection
systems and controls to reduce the possibility of data quality problems occurring when data are
actually collected and reported. A third element is encouraging constant use of data that are
gathered and reported to the NRGP. Widespread use will quickly highlight data discrepancies
thereby identifying areas where improvements are required.
Criteria for Data Quality Reviews
In conducting a Data Quality Review, performance indicators will be assessed based on the
following criteria:
1. Validity
Are the data gathered consistent with the documented definition of the indicators?
Is there a verifiable source for the data gathered?
2. Reliability
Is there:
Consistency: Is the same data gathering process (including instrument and sampling
process) being employed over time and across locations?
Quality Control: What are the procedures in data collection to guard against bias? Are
procedures reviewed periodically? Are there random checks at each stage?
Transparency: Are there procedures in writing and are problems reported?
3. Timeliness
Are data collected and reported regularly and are they relevant?
Is reported data the most recent?
Is the date of data collection clearly identified?
4. Precision
If sampling is used, is the margin of error reported?
Is the margin of error less than expected change in the indicator?
Is the margin of error acceptable for decision-making, given cost/benefit?
5. Adequacy
Implementation Manual-M&E System Designed for the NRGP 43
To what extent do the indicators for a particular expected result fully measure it?
Are they sufficient to characterize and/or measure the result?
5.3.3. M&E Structure & Information Flow
Staff capacity at the district levels for data generation is inadequate. The M&E Structure in place
at the various implementing agencies needs to be strengthened to ensure effective
implementation of the M&E process.
Producers, Input dealers, Marketers, Processors, Transporters as well as staff benefiting from
various capacity building interventions are the primary stakeholders of the programme and
therefore the point of primary data collection by other relevant actors of the M&E process.
District Agricultural Development Unit (MOFA) staff will collect relevant programme - related
information from identified stakeholder groups, process this information and share with the
Regional Agricultural Development Unit and the Northern Rural Growth Programme (NRGP).
The NRGP will in turn analyse the information and share with the Minister (MOFA). A feedback
is expected between the various information-sharing points.
Regional MOFA Offices will collect relevant project information from identified stakeholder
groups and share with NRGP, and the Minister (MOFA). A feedback is expected between the
various information-sharing points.
Project Technical Service Providers (ACDEP, SNV) will collect relevant programme – related
data from beneficiaries, analyse the information and share same with NRGP. A feedback is
expected between the various information-sharing points
.
Implementing agencies (notably, GIDA, DFR, EPA) will provide information to NRGP in
respect of their respective implementation domains relevant to the project. NRGP will analyse
the information and in turn share information with Ministry of Food and Agriculture, and their
respective Headquarters.
NRGP PCU will collect relevant non-routine data from all categories of project beneficiaries.
This may be done with the assistance of Consultants. This will be analysed and shared with
MOFA, MOFEP and the implementing agencies.
The Information flow chart of the NRGP is presented in Fig 3.
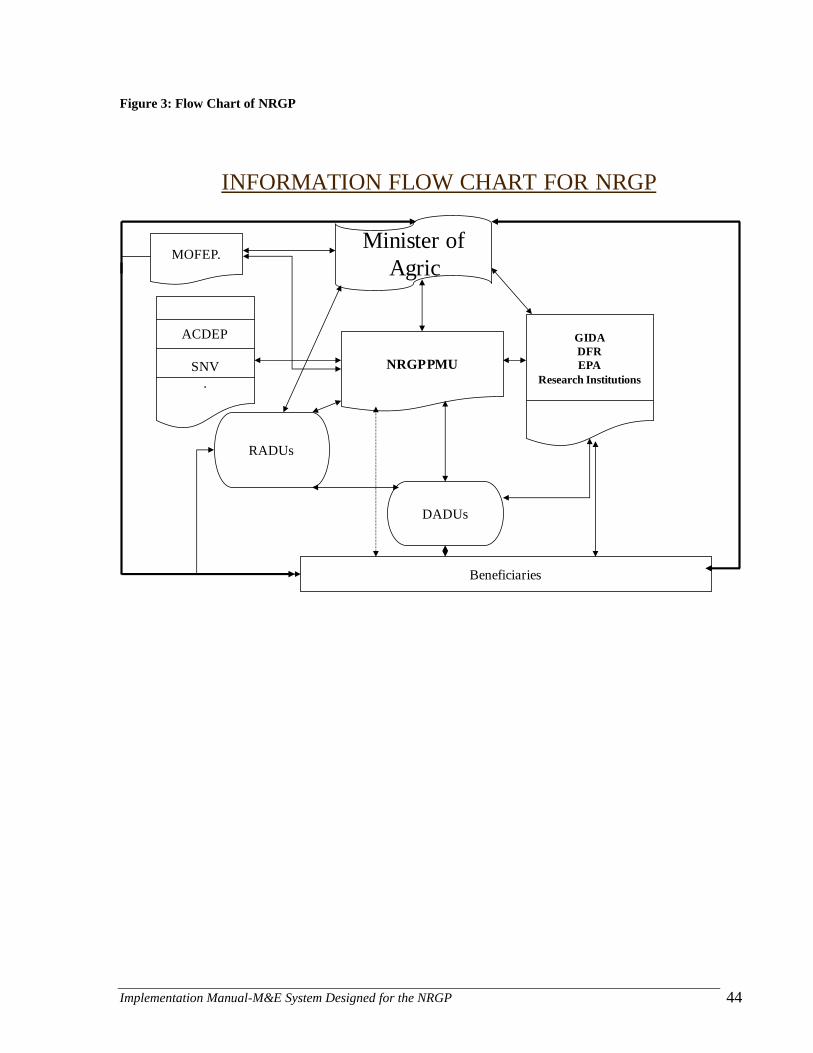
Implementation Manual-M&E System Designed for the NRGP 44
Figure 3: Flow Chart of NRGP
INFORMATION FLOW CHART FOR NRGP
Minister of
Agric
ACDEP
SNV
.
NRGP PMU
GIDA
DFR
EPA
Research Institutions
Beneficiaries
DADUs
RADUs
MOFEP.
Implementation Manual-M&E System Designed for the NRGP 45
5.3.4 Strategies for sharing Information
A good communication strategy is essential for disseminating information and sharing it with
key stakeholders. Results-based information would therefore be shared with all internal and
external stakeholders and interested parties.
Apart from dissemination through reports, other specific strategies that would be adopted under
the NRGP for sharing information include the following:
The Media: There are currently 193 FM stations, 9 free on air TV and 6 Pay TV stations
operational in Ghana. As part of the information sharing strategies of the NRGP, discussion
sessions would be held on some of these networks to inform citizens on progress that has been
made towards the attainment of program objectives. Furthermore feature articles on project
implementation would be placed in the print media to inform the public on NRGP activities and
results.
Use of MOFA website: The Ministry of Food and Agriculture currently operates a website
(www.mofa.gov.gh). Performance information of the NRGP will be placed on the website to
serve as an effective way of disseminating information.
Engagement of civil society and citizen groups: Fora will be created for the engagement of civil
society and citizen groups as part of the information sharing strategy. The PMU will lead this
effort.
5.3.5. Reporting Deadlines
The following reporting deadlines will be observed.
Table 10: Reporting deadlines
Who Reports To whom Frequency When
DADUs RADU Quarterly Last week of reporting
quarter
RADU PMU Quarterly
Beneficiary Implementing
Agencies
PMU Quarterly Last week of reporting
quarter
Beneficiary TSPs PMU Quarterly Last week of reporting
quarter
PMU MOFA/AfDB/MOFEP Quarterly Third week of succeeding
quarter
Implementation Manual-M&E System Designed for the NRGP 46
6.0. Organising Critical Reflection Events. It is important to plan for and organize critical reflection events in order to manage for impact.
Making analysis critical means moving beyond collecting, processing and reviewing data. ―After
asking what is happening‖, it is pertinent to also discuss
―Why is it happening‖
―So what are the implications for the project‖
―Now what do we do next‖.
Making the project reflective will require planning more consciously when and how to deal
critically with information.
The critical reflection events under the NRGP will be classified into three categories.
1) Reflection events at Field Level
a) Frequent visits by the project team to communities/project sites to help understand
community reactions to project activities: In order to keep track of program activities
effectively and initiate corrective action promptly, all staff of the PCU will be required to
provide feedback to the Project Manager, reporting on observations made during field
visits. For this purpose, staff will use the ‗Field trip Report format‘ in Appendix 1 of this
manual. The format will be completed and submitted to the Project Manager on return
from field visits for prompt remedial action when necessary
b) Quick follow up by PMU to problems and other issues that emerged in implementing
agencies to allow for more feedback to ensure quicker learning of what worked and what
didn‘t.
c) Bi-annual action plan reviews with field level implementing teams
d) Annual regional meetings with stakeholder groups that provide community reactions to
share progress and problems.
2) Reflection events at the Program management level
a) Project Steering Committee meetings for adaptive management: PCU will organize
project steering committee meetings quarterly. It is recommended that steering committee
meetings should be used to assess dilemmas and problems and find solutions – rather
than to report progress, as progress can be shared in documents beforehand. It is also
useful to invite steering group members to visit the field at several moments during the
project life and interact with field staff and primary stakeholders.
b) Project team meetings: Will be organized by the PMU. Meetings should be long enough
apart so that there is new material for reflection, and yet frequent enough to allow for
timely decisions to be made. Fortnightly meetings are proposed at the PCU level.
c) Participatory reviews with communities, district teams, external teams and the project
team
d) Periodic, targeted reviews e.g. Annual Project Review (APR): the purpose is to reach
conclusions about achievements and failures in order to improve ongoing program
quality. It can help to ensure that the overall project goals, results and implementation
strategy remain appropriate, review the operational and management effectiveness and
Implementation Manual-M&E System Designed for the NRGP 47
efficiency of implementation and identify lessons and actions to improve the succeeding
year‘s implementation and performance.
In order to make effective use of reflection events at the project team level, the following
attitudes must prevail:
Team is open to feedback from each other
Program team must have good attitude towards listening
Not being afraid to try new ideas
Problems are valued – not seen as mistakes but as learning opportunities
3) REFLECTIVE EVENTS BASED ON EXTERNAL OPPORTUNITIES
Besides internal self-evaluation and learning events, external reflective events are very valuable
moments for project stakeholders to focus on key issues and strategic changes. Outside
perspectives and experience can help raise questions what is taken for granted and bring out
issues that might be sensitive yet critical. Some of the external reflective events identified for
the NRGP are as follows:
a) Supervision missions: Will be organized by the African Development Bank and IFAD at
least once a year. These will regularly examine the relevance of project activities and
suggest modifications, review implementation status of approved AWPB, review primary
stakeholder participation in M&E activities, monitor and secure government compliance
with project covenants among others. The Project Management team will prepare
relevant documentation and sites for the supervision team.
b) Mid Term Review /evaluation: This will be done by Consultants with participation of the
project team and the African Development Bank and IFAD at project mid-term.
c) Interim evaluation – prior to completion to draw out key lessons and prepare a possible
second phase: It is recommended that the project team engages the services of a
Consultant to prepare the interim evaluation six months before project closure.
d) Consultants‘ recommendations: Workshops should be organized by the PMU to share
Consultants‘ recommendations to enrich project implementation status.
Once the external mission arrives, senior management of the project will need to coordinate the
visits so that it involves stakeholders fairly and appropriately. For this purpose it is necessary to:
Plan several field visits to give the opportunity to the team to see what is happening on
the ground.
Make all logistics arrangement
Promote dialogue between project stakeholders and the external reviewers as much as
possible.
Ask that the reviewers present draft findings to project staff, staff of implementing
partners and primary stakeholder representatives.
When external reviews work well, they contribute to providing independent and constructive
criticism that helps to:
reflect on and identify lessons learned that can improve action
Implementation Manual-M&E System Designed for the NRGP 48
identify priorities for the remaining time of the project to support the rational use
of resources
unite diverse stakeholder perspectives
7.0. Necessary Conditions and Capacities for M&E Implementation.
7.1. Technological and Human Capacity Needs for M&E
Technological Capacity Needs: The PMU of the project is fairly well resourced. There is one
desktop computer, a printer and internet connectivity for staff of the M&E Unit. Apart from that,
there is a scanner and a photocopier in the project office, which the M&E staff have access to.
There will however the need to upgrade the technological capacity of the M&E Unit by
providing other technological requirements for implementing the M&E system in the form of
statistical data analysis packages such as Statistical Package for Social Sciences (SPSS) and
Microsoft Project Software.
Human Resource Capacity needs for M&E: Skills of Implementing Agency staff (DADUs,
RADUs) in data management (data capture, processing, analysis and reporting) would require
significant improvement through an intensive training program. It should be possible for
Implementing Agency staff to carry out data entry into simple data capture templates, such as the
Indicator Tracking Table to ensure prompt decision making on project implementation. These
trainings should be organized in local institutions that conduct training on Monitoring and
Evaluation, Data Management and Analysis.
Staff of the PMU are highly trained professionals in their areas of specialization with academic
degrees ranging from BSc/BA to MSc/MA. Knowledge of staff in M&E is quite high, but so far
the monitoring function of the Unit has been largely restricted to activity and output level
monitoring. In order to further develop the capacities of staff to initiate, design and implement
studies on effectiveness of development interventions that have taken place in the agricultural
and rural development space, we recommend that the M&E Specialist of the project and the
Project Manager be sponsored with project funds to participate in a four-week training program
of the International Program for Development Evaluation Training (IPDET), which is organized
yearly by the World Bank and Carleton University in Ottawa, Canada in June – July each year.
Details of training content can be found on www.ipdet.org.
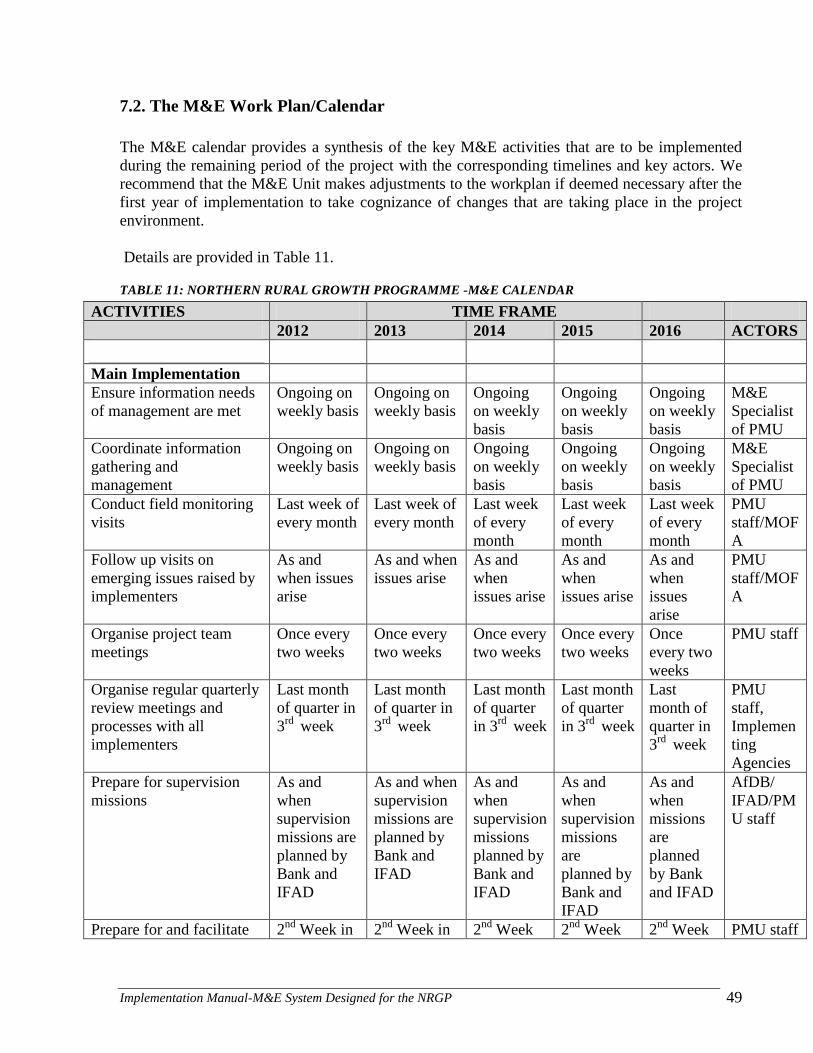
Implementation Manual-M&E System Designed for the NRGP 49
7.2. The M&E Work Plan/Calendar
The M&E calendar provides a synthesis of the key M&E activities that are to be implemented
during the remaining period of the project with the corresponding timelines and key actors. We
recommend that the M&E Unit makes adjustments to the workplan if deemed necessary after the
first year of implementation to take cognizance of changes that are taking place in the project
environment.
Details are provided in Table 11.
TABLE 11: NORTHERN RURAL GROWTH PROGRAMME -M&E CALENDAR
ACTIVITIES TIME FRAME
2012 2013 2014 2015 2016 ACTORS
Main Implementation
Ensure information needs
of management are met
Ongoing on
weekly basis
Ongoing on
weekly basis
Ongoing
on weekly
basis
Ongoing
on weekly
basis
Ongoing
on weekly
basis
M&E
Specialist
of PMU
Coordinate information
gathering and
management
Ongoing on
weekly basis
Ongoing on
weekly basis
Ongoing
on weekly
basis
Ongoing
on weekly
basis
Ongoing
on weekly
basis
M&E
Specialist
of PMU
Conduct field monitoring
visits
Last week of
every month
Last week of
every month
Last week
of every
month
Last week
of every
month
Last week
of every
month
PMU
staff/MOF
A
Follow up visits on
emerging issues raised by
implementers
As and
when issues
arise
As and when
issues arise
As and
when
issues arise
As and
when
issues arise
As and
when
issues
arise
PMU
staff/MOF
A
Organise project team
meetings
Once every
two weeks
Once every
two weeks
Once every
two weeks
Once every
two weeks
Once
every two
weeks
PMU staff
Organise regular quarterly
review meetings and
processes with all
implementers
Last month
of quarter in
3rd
week
Last month
of quarter in
3rd
week
Last month
of quarter
in 3rd
week
Last month
of quarter
in 3rd
week
Last
month of
quarter in
3rd
week
PMU
staff,
Implemen
ting
Agencies
Prepare for supervision
missions
As and
when
supervision
missions are
planned by
Bank and
IFAD
As and when
supervision
missions are
planned by
Bank and
IFAD
As and
when
supervision
missions
planned by
Bank and
IFAD
As and
when
supervision
missions
are
planned by
Bank and
IFAD
As and
when
missions
are
planned
by Bank
and IFAD
AfDB/
IFAD/PM
U staff
Prepare for and facilitate 2nd
Week in 2nd
Week in 2nd
Week 2nd
Week 2nd
Week PMU staff
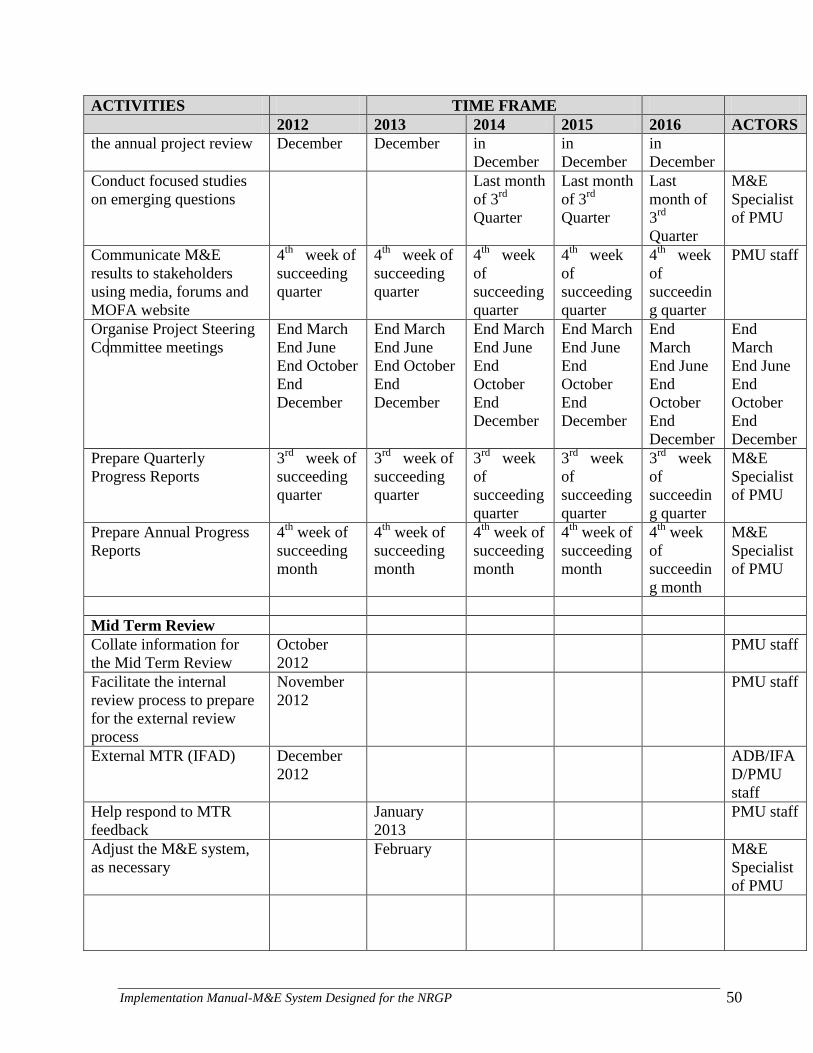
Implementation Manual-M&E System Designed for the NRGP 50
ACTIVITIES TIME FRAME
2012 2013 2014 2015 2016 ACTORS
the annual project review December December in
December
in
December
in
December
Conduct focused studies
on emerging questions
Last month
of 3rd
Quarter
Last month
of 3rd
Quarter
Last
month of
3rd
Quarter
M&E
Specialist
of PMU
Communicate M&E
results to stakeholders
using media, forums and
MOFA website
4th
week of
succeeding
quarter
4th
week of
succeeding
quarter
4th
week
of
succeeding
quarter
4th
week
of
succeeding
quarter
4th
week
of
succeedin
g quarter
PMU staff
Organise Project Steering
Committee meetings
End March
End June
End October
End
December
End March
End June
End October
End
December
End March
End June
End
October
End
December
End March
End June
End
October
End
December
End
March
End June
End
October
End
December
End
March
End June
End
October
End
December
Prepare Quarterly
Progress Reports
3rd
week of
succeeding
quarter
3rd
week of
succeeding
quarter
3rd
week
of
succeeding
quarter
3rd
week
of
succeeding
quarter
3rd
week
of
succeedin
g quarter
M&E
Specialist
of PMU
Prepare Annual Progress
Reports
4th
week of
succeeding
month
4th
week of
succeeding
month
4th
week of
succeeding
month
4th
week of
succeeding
month
4th
week
of
succeedin
g month
M&E
Specialist
of PMU
Mid Term Review
Collate information for
the Mid Term Review
October
2012
PMU staff
Facilitate the internal
review process to prepare
for the external review
process
November
2012
PMU staff
External MTR (IFAD) December
2012
ADB/IFA
D/PMU
staff
Help respond to MTR
feedback
January
2013
PMU staff
Adjust the M&E system,
as necessary
February M&E
Specialist
of PMU
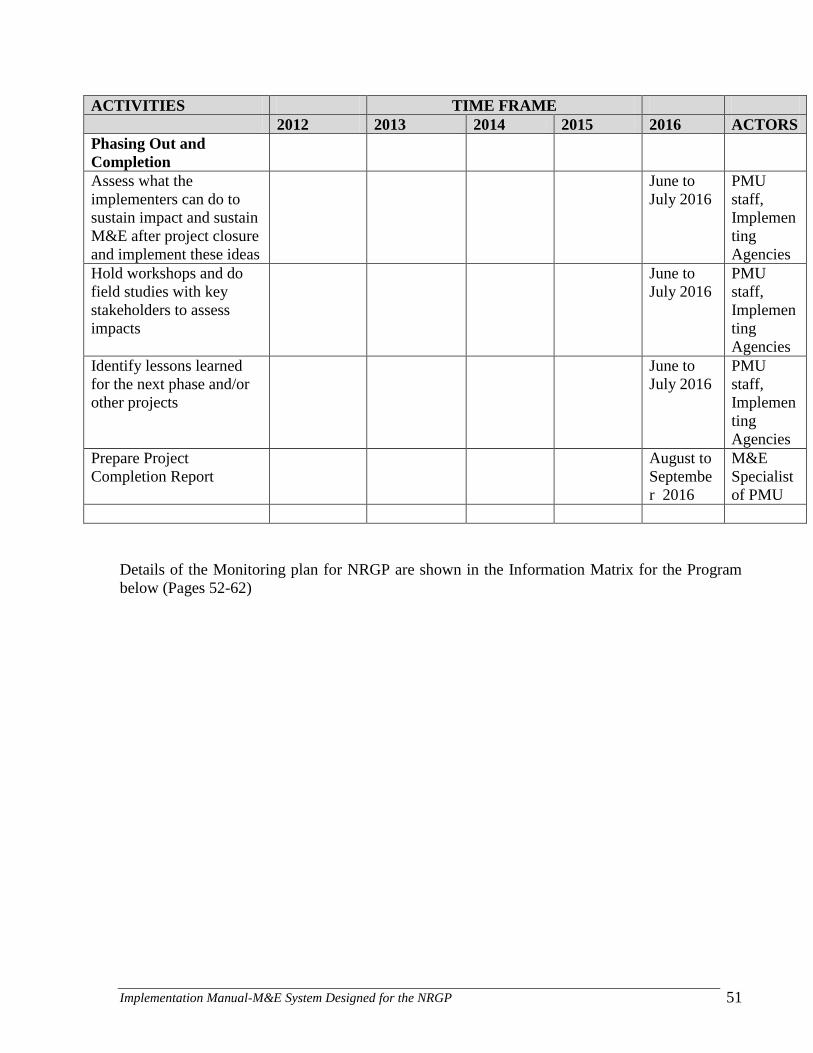
Implementation Manual-M&E System Designed for the NRGP 51
ACTIVITIES TIME FRAME
2012 2013 2014 2015 2016 ACTORS
Phasing Out and
Completion
Assess what the
implementers can do to
sustain impact and sustain
M&E after project closure
and implement these ideas
June to
July 2016
PMU
staff,
Implemen
ting
Agencies
Hold workshops and do
field studies with key
stakeholders to assess
impacts
June to
July 2016
PMU
staff,
Implemen
ting
Agencies
Identify lessons learned
for the next phase and/or
other projects
June to
July 2016
PMU
staff,
Implemen
ting
Agencies
Prepare Project
Completion Report
August to
Septembe
r 2016
M&E
Specialist
of PMU
Details of the Monitoring plan for NRGP are shown in the Information Matrix for the Program
below (Pages 52-62)
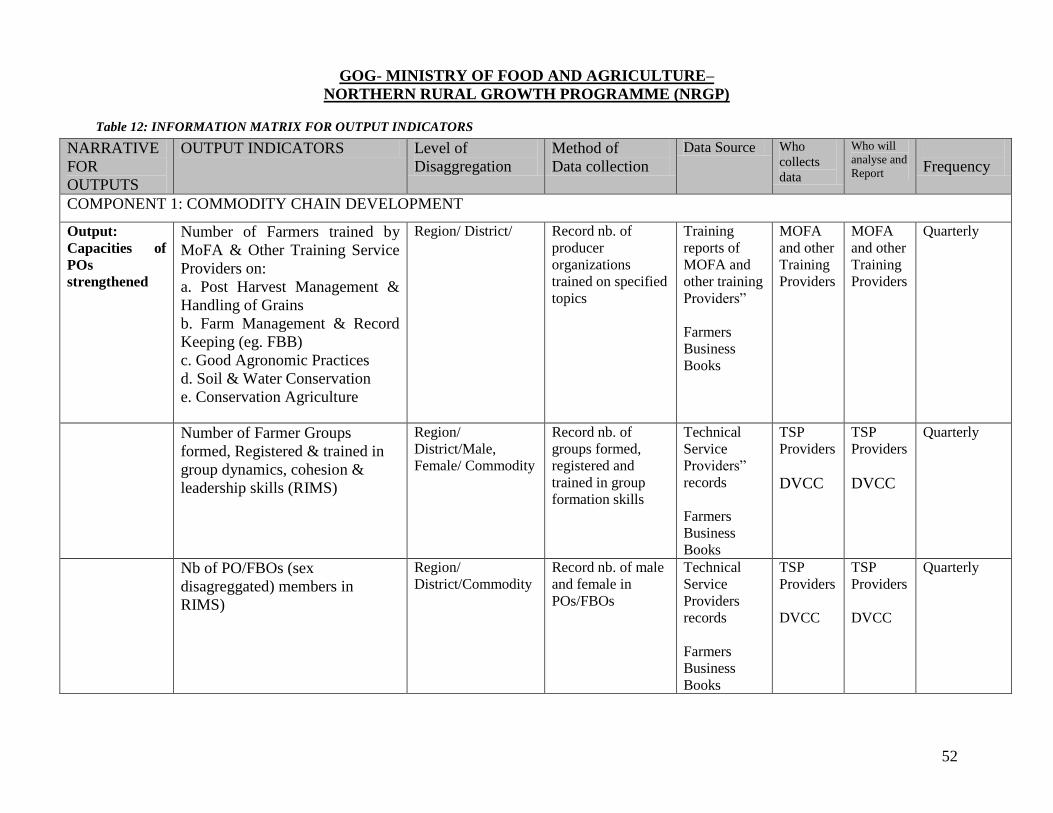
52
GOG- MINISTRY OF FOOD AND AGRICULTURE–
NORTHERN RURAL GROWTH PROGRAMME (NRGP)
Table 12: INFORMATION MATRIX FOR OUTPUT INDICATORS
NARRATIVE
FOR
OUTPUTS
OUTPUT INDICATORS Level of
Disaggregation
Method of
Data collection
Data Source Who
collects
data
Who will
analyse and
Report
Frequency
COMPONENT 1: COMMODITY CHAIN DEVELOPMENT
Output:
Capacities of
POs
strengthened
Number of Farmers trained by
MoFA & Other Training Service
Providers on:
a. Post Harvest Management &
Handling of Grains
b. Farm Management & Record
Keeping (eg. FBB)
c. Good Agronomic Practices
d. Soil & Water Conservation
e. Conservation Agriculture
Region/ District/
Record nb. of
producer
organizations
trained on specified
topics
Training
reports of
MOFA and
other training
Providers‖
Farmers
Business
Books
MOFA
and other
Training
Providers
MOFA
and other
Training
Providers
Quarterly
Number of Farmer Groups
formed, Registered & trained in
group dynamics, cohesion &
leadership skills (RIMS)
Region/
District/Male,
Female/ Commodity
Record nb. of
groups formed,
registered and
trained in group
formation skills
Technical
Service
Providers‖
records
Farmers
Business
Books
TSP
Providers
DVCC
TSP
Providers
DVCC
Quarterly
Nb of PO/FBOs (sex
disagreggated) members in
RIMS)
Region/
District/Commodity
Record nb. of male
and female in
POs/FBOs
Technical
Service
Providers
records
Farmers
Business
Books
TSP
Providers
DVCC
TSP
Providers
DVCC
Quarterly
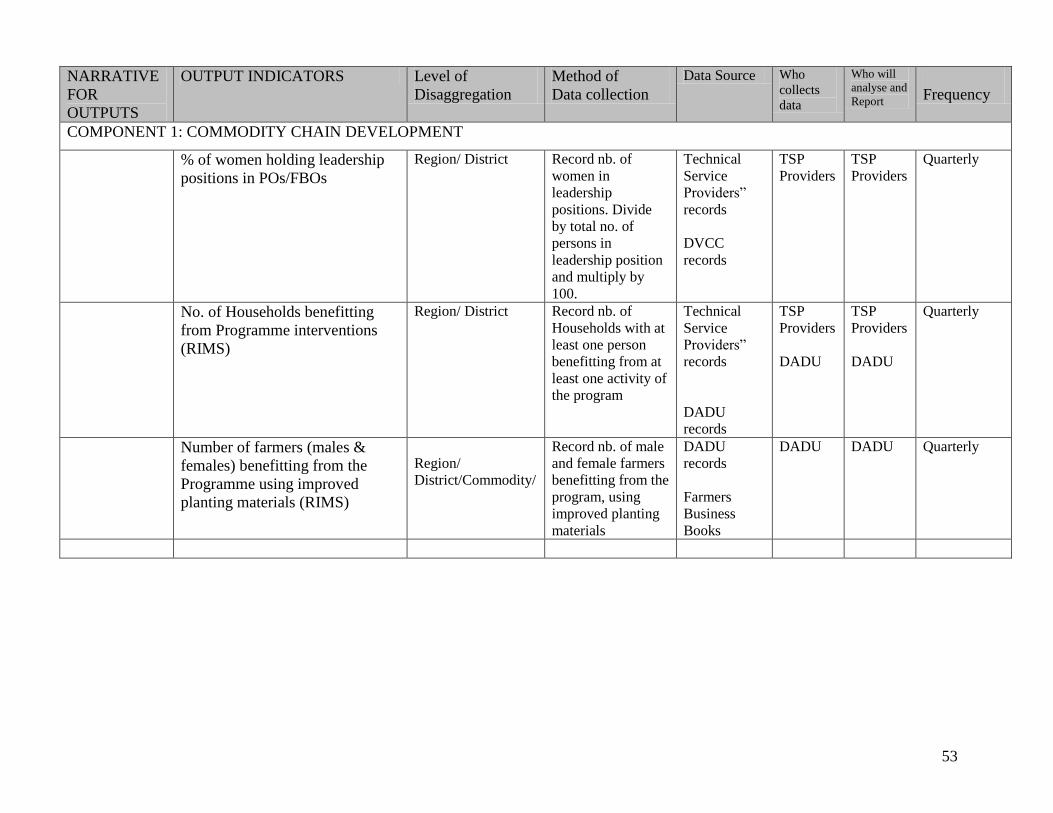
53
NARRATIVE
FOR
OUTPUTS
OUTPUT INDICATORS Level of
Disaggregation
Method of
Data collection
Data Source Who
collects
data
Who will
analyse and
Report
Frequency
COMPONENT 1: COMMODITY CHAIN DEVELOPMENT
% of women holding leadership
positions in POs/FBOs
Region/ District
Record nb. of
women in
leadership
positions. Divide
by total no. of
persons in
leadership position
and multiply by
100.
Technical
Service
Providers‖
records
DVCC
records
TSP
Providers TSP
Providers Quarterly
No. of Households benefitting
from Programme interventions
(RIMS)
Region/ District
Record nb. of
Households with at
least one person
benefitting from at
least one activity of
the program
Technical
Service
Providers‖
records
DADU
records
TSP
Providers
DADU
TSP
Providers
DADU
Quarterly
Number of farmers (males &
females) benefitting from the
Programme using improved
planting materials (RIMS)
Region/
District/Commodity/
Record nb. of male
and female farmers
benefitting from the
program, using
improved planting
materials
DADU
records
Farmers
Business
Books
DADU
DADU Quarterly
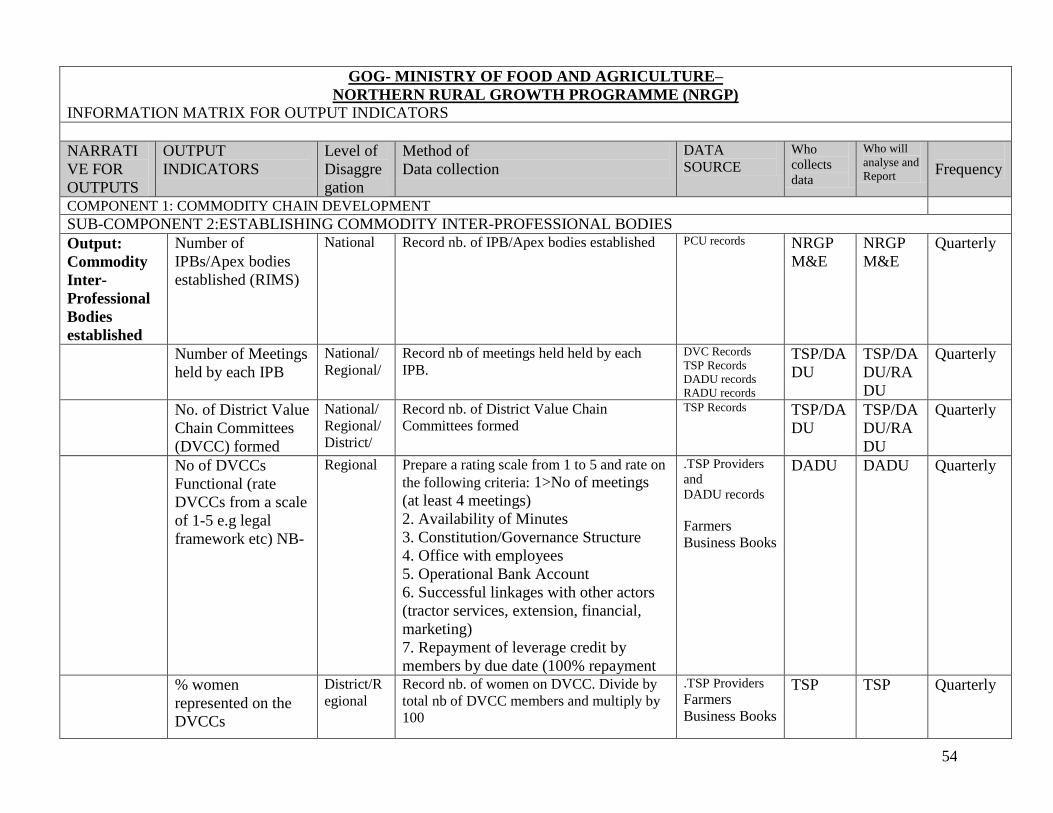
54
GOG- MINISTRY OF FOOD AND AGRICULTURE–
NORTHERN RURAL GROWTH PROGRAMME (NRGP)
INFORMATION MATRIX FOR OUTPUT INDICATORS
NARRATI
VE FOR
OUTPUTS
OUTPUT
INDICATORS
Level of
Disaggre
gation
Method of
Data collection
DATA
SOURCE
Who
collects
data
Who will
analyse and
Report
Frequency
COMPONENT 1: COMMODITY CHAIN DEVELOPMENT
SUB-COMPONENT 2:ESTABLISHING COMMODITY INTER-PROFESSIONAL BODIES
Output:
Commodity
Inter-
Professional
Bodies
established
Number of
IPBs/Apex bodies
established (RIMS)
National Record nb. of IPB/Apex bodies established PCU records NRGP
M&E
NRGP
M&E
Quarterly
Number of Meetings
held by each IPB
National/
Regional/
Record nb of meetings held held by each
IPB.
DVC Records
TSP Records
DADU records
RADU records
TSP/DA
DU
TSP/DA
DU/RA
DU
Quarterly
No. of District Value
Chain Committees
(DVCC) formed
National/
Regional/
District/
Record nb. of District Value Chain
Committees formed
TSP Records
TSP/DA
DU
TSP/DA
DU/RA
DU
Quarterly
No of DVCCs
Functional (rate
DVCCs from a scale
of 1-5 e.g legal
framework etc) NB-
Regional Prepare a rating scale from 1 to 5 and rate on
the following criteria: 1>No of meetings
(at least 4 meetings)
2. Availability of Minutes
3. Constitution/Governance Structure
4. Office with employees
5. Operational Bank Account
6. Successful linkages with other actors
(tractor services, extension, financial,
marketing)
7. Repayment of leverage credit by
members by due date (100% repayment
.TSP Providers
and
DADU records
Farmers
Business Books
DADU DADU Quarterly
% women
represented on the
DVCCs
District/R
egional
Record nb. of women on DVCC. Divide by
total nb of DVCC members and multiply by
100
.TSP Providers
Farmers
Business Books
TSP TSP Quarterly
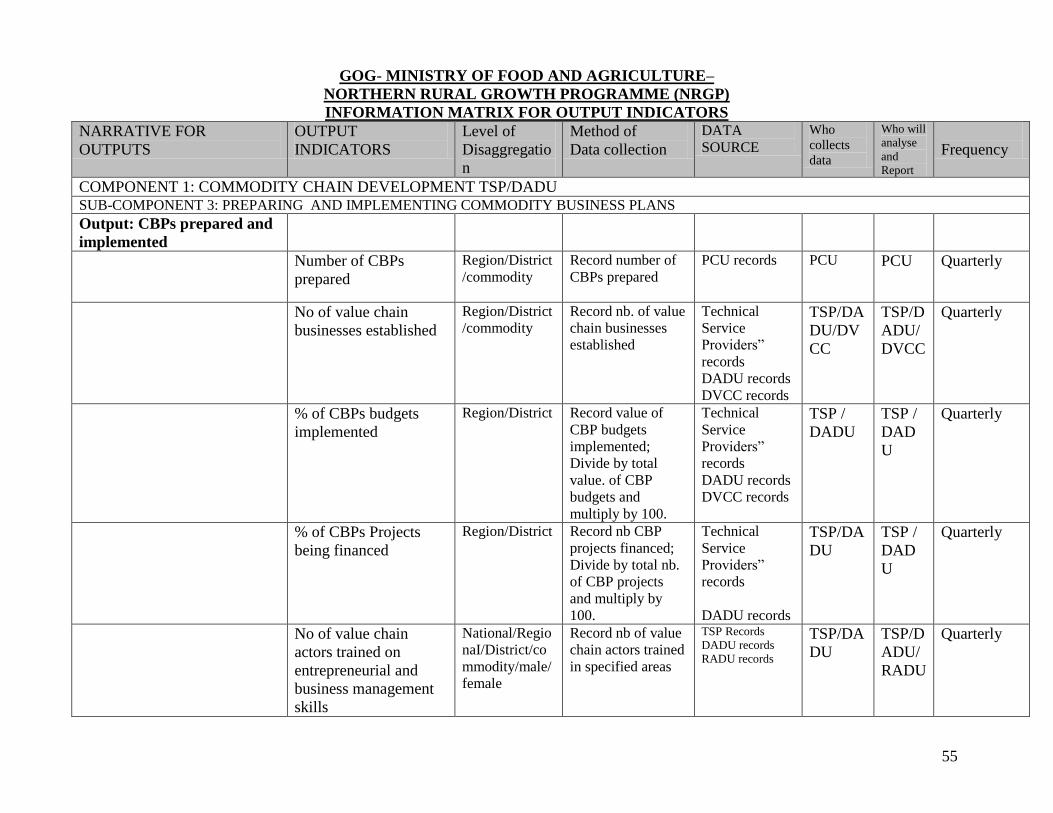
55
GOG- MINISTRY OF FOOD AND AGRICULTURE–
NORTHERN RURAL GROWTH PROGRAMME (NRGP)
INFORMATION MATRIX FOR OUTPUT INDICATORS
NARRATIVE FOR
OUTPUTS
OUTPUT
INDICATORS
Level of
Disaggregatio
n
Method of
Data collection
DATA
SOURCE
Who
collects
data
Who will
analyse
and
Report
Frequency
COMPONENT 1: COMMODITY CHAIN DEVELOPMENT TSP/DADU
SUB-COMPONENT 3: PREPARING AND IMPLEMENTING COMMODITY BUSINESS PLANS
Output: CBPs prepared and
implemented
Number of CBPs
prepared
Region/District
/commodity
Record number of
CBPs prepared
PCU records PCU PCU Quarterly
No of value chain
businesses established
Region/District
/commodity
Record nb. of value
chain businesses
established
Technical
Service
Providers‖
records
DADU records
DVCC records
TSP/DA
DU/DV
CC
TSP/D
ADU/
DVCC
Quarterly
% of CBPs budgets
implemented
Region/District Record value of
CBP budgets
implemented;
Divide by total
value. of CBP
budgets and
multiply by 100.
Technical
Service
Providers‖
records
DADU records
DVCC records
TSP /
DADU
TSP /
DAD
U
Quarterly
% of CBPs Projects
being financed
Region/District Record nb CBP
projects financed;
Divide by total nb.
of CBP projects
and multiply by
100.
Technical
Service
Providers‖
records
DADU records
TSP/DA
DU
TSP /
DAD
U
Quarterly
No of value chain
actors trained on
entrepreneurial and
business management
skills
National/Regio
naI/District/co
mmodity/male/
female
Record nb of value
chain actors trained
in specified areas
TSP Records
DADU records
RADU records
TSP/DA
DU
TSP/D
ADU/
RADU
Quarterly
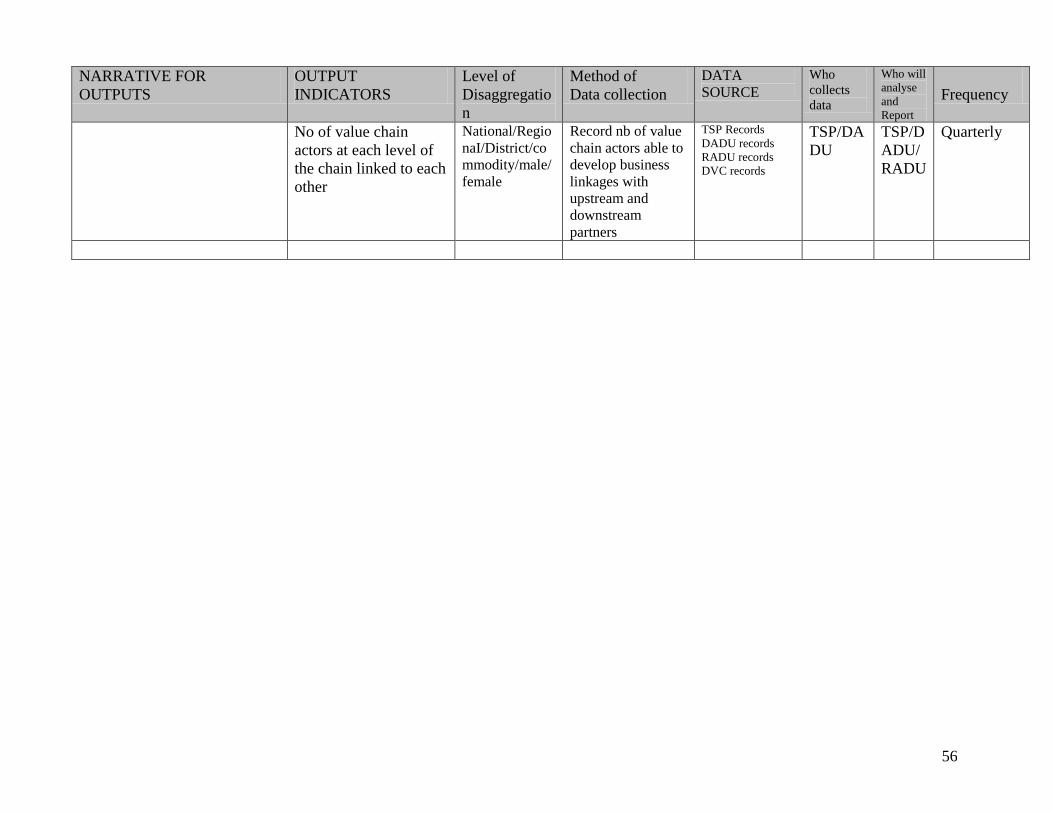
56
NARRATIVE FOR
OUTPUTS
OUTPUT
INDICATORS
Level of
Disaggregatio
n
Method of
Data collection
DATA
SOURCE
Who
collects
data
Who will
analyse
and
Report
Frequency
No of value chain
actors at each level of
the chain linked to each
other
National/Regio
naI/District/co
mmodity/male/
female
Record nb of value
chain actors able to
develop business
linkages with
upstream and
downstream
partners
TSP Records
DADU records
RADU records
DVC records
TSP/DA
DU
TSP/D
ADU/
RADU
Quarterly
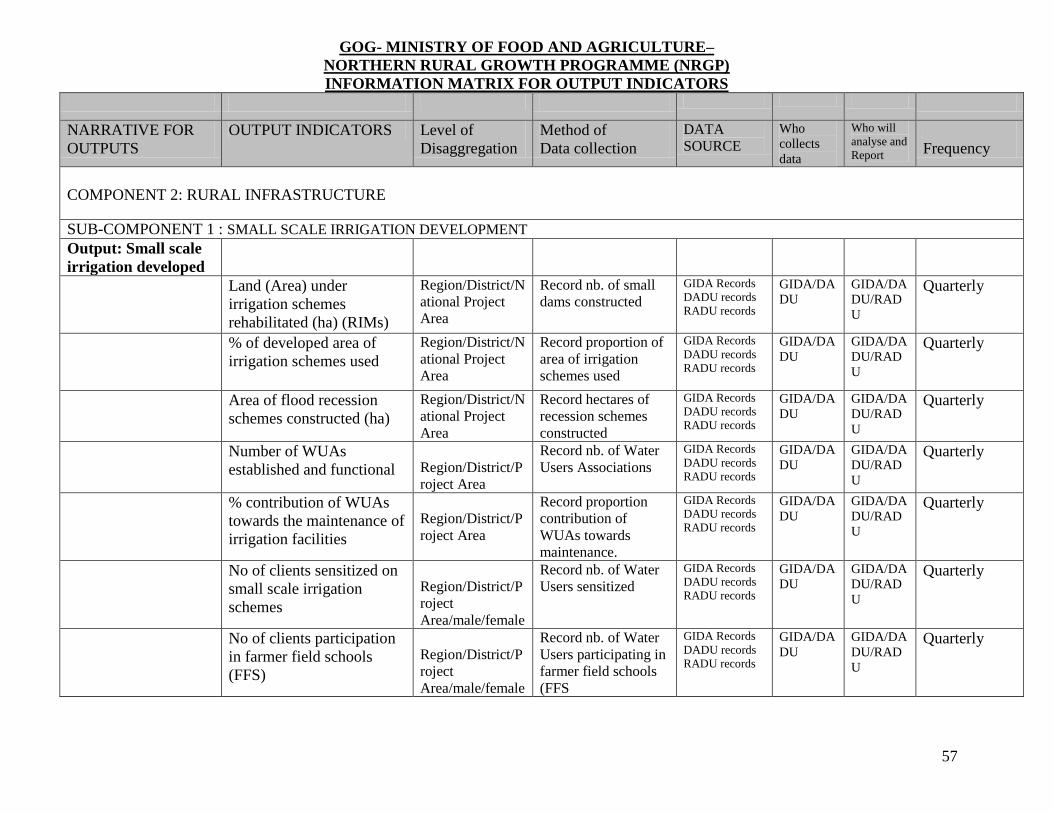
57
GOG- MINISTRY OF FOOD AND AGRICULTURE–
NORTHERN RURAL GROWTH PROGRAMME (NRGP)
INFORMATION MATRIX FOR OUTPUT INDICATORS
NARRATIVE FOR
OUTPUTS
OUTPUT INDICATORS Level of
Disaggregation
Method of
Data collection
DATA
SOURCE Who
collects
data
Who will
analyse and
Report
Frequency
COMPONENT 2: RURAL INFRASTRUCTURE
SUB-COMPONENT 1 : SMALL SCALE IRRIGATION DEVELOPMENT
Output: Small scale
irrigation developed
Land (Area) under
irrigation schemes
rehabilitated (ha) (RIMs)
Region/District/N
ational Project
Area
Record nb. of small
dams constructed
GIDA Records
DADU records
RADU records
GIDA/DA
DU
GIDA/DA
DU/RAD
U
Quarterly
% of developed area of
irrigation schemes used
Region/District/N
ational Project
Area
Record proportion of
area of irrigation
schemes used
GIDA Records
DADU records
RADU records
GIDA/DA
DU
GIDA/DA
DU/RAD
U
Quarterly
Area of flood recession
schemes constructed (ha)
Region/District/N
ational Project
Area
Record hectares of
recession schemes
constructed
GIDA Records
DADU records
RADU records
GIDA/DA
DU
GIDA/DA
DU/RAD
U
Quarterly
Number of WUAs
established and functional
Region/District/P
roject Area
Record nb. of Water
Users Associations
GIDA Records
DADU records
RADU records
GIDA/DA
DU
GIDA/DA
DU/RAD
U
Quarterly
% contribution of WUAs
towards the maintenance of
irrigation facilities
Region/District/P
roject Area
Record proportion
contribution of
WUAs towards
maintenance.
GIDA Records
DADU records
RADU records
GIDA/DA
DU
GIDA/DA
DU/RAD
U
Quarterly
No of clients sensitized on
small scale irrigation
schemes
Region/District/P
roject
Area/male/female
Record nb. of Water
Users sensitized
GIDA Records
DADU records
RADU records
GIDA/DA
DU
GIDA/DA
DU/RAD
U
Quarterly
No of clients participation
in farmer field schools
(FFS)
Region/District/P
roject
Area/male/female
Record nb. of Water
Users participating in
farmer field schools
(FFS
GIDA Records
DADU records
RADU records
GIDA/DA
DU
GIDA/DA
DU/RAD
U
Quarterly
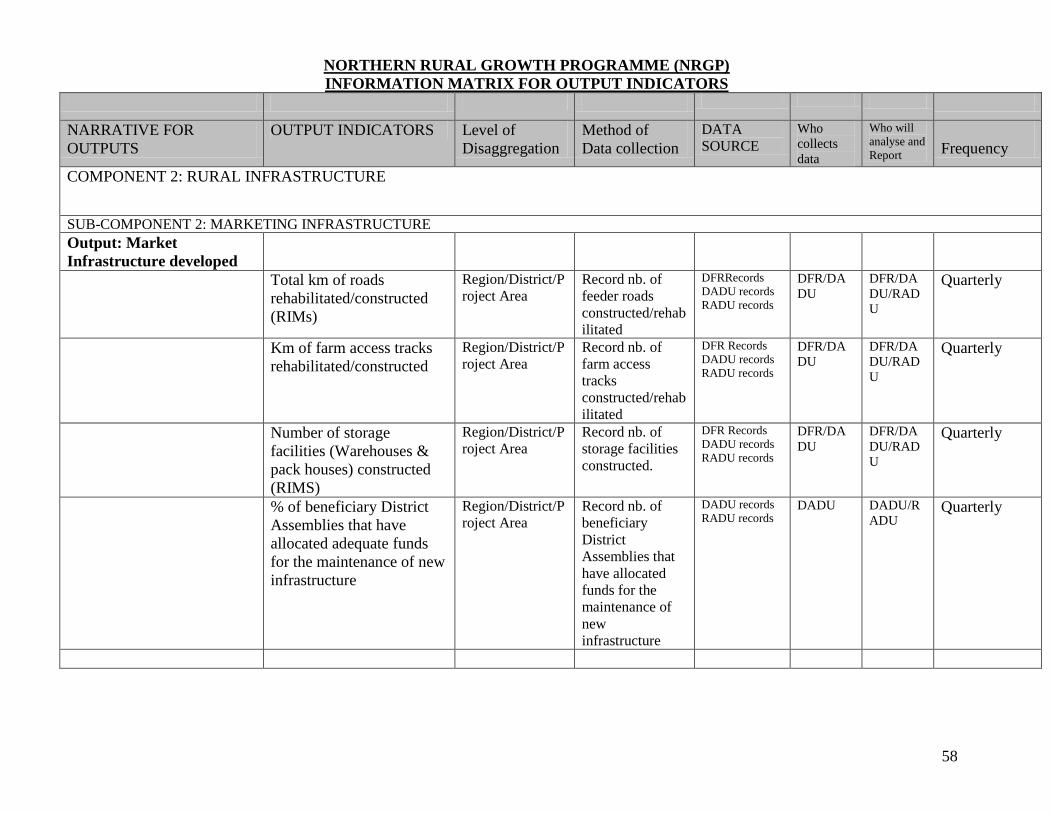
58
NORTHERN RURAL GROWTH PROGRAMME (NRGP)
INFORMATION MATRIX FOR OUTPUT INDICATORS
NARRATIVE FOR
OUTPUTS
OUTPUT INDICATORS Level of
Disaggregation
Method of
Data collection
DATA
SOURCE Who
collects
data
Who will
analyse and
Report
Frequency
COMPONENT 2: RURAL INFRASTRUCTURE
SUB-COMPONENT 2: MARKETING INFRASTRUCTURE
Output: Market
Infrastructure developed
Total km of roads
rehabilitated/constructed
(RIMs)
Region/District/P
roject Area
Record nb. of
feeder roads
constructed/rehab
ilitated
DFRRecords
DADU records
RADU records
DFR/DA
DU DFR/DA
DU/RAD
U
Quarterly
Km of farm access tracks
rehabilitated/constructed
Region/District/P
roject Area
Record nb. of
farm access
tracks
constructed/rehab
ilitated
DFR Records
DADU records
RADU records
DFR/DA
DU DFR/DA
DU/RAD
U
Quarterly
Number of storage
facilities (Warehouses &
pack houses) constructed
(RIMS)
Region/District/P
roject Area
Record nb. of
storage facilities
constructed.
DFR Records
DADU records
RADU records
DFR/DA
DU DFR/DA
DU/RAD
U
Quarterly
% of beneficiary District
Assemblies that have
allocated adequate funds
for the maintenance of new
infrastructure
Region/District/P
roject Area
Record nb. of
beneficiary
District
Assemblies that
have allocated
funds for the
maintenance of
new
infrastructure
DADU records
RADU records DADU DADU/R
ADU Quarterly
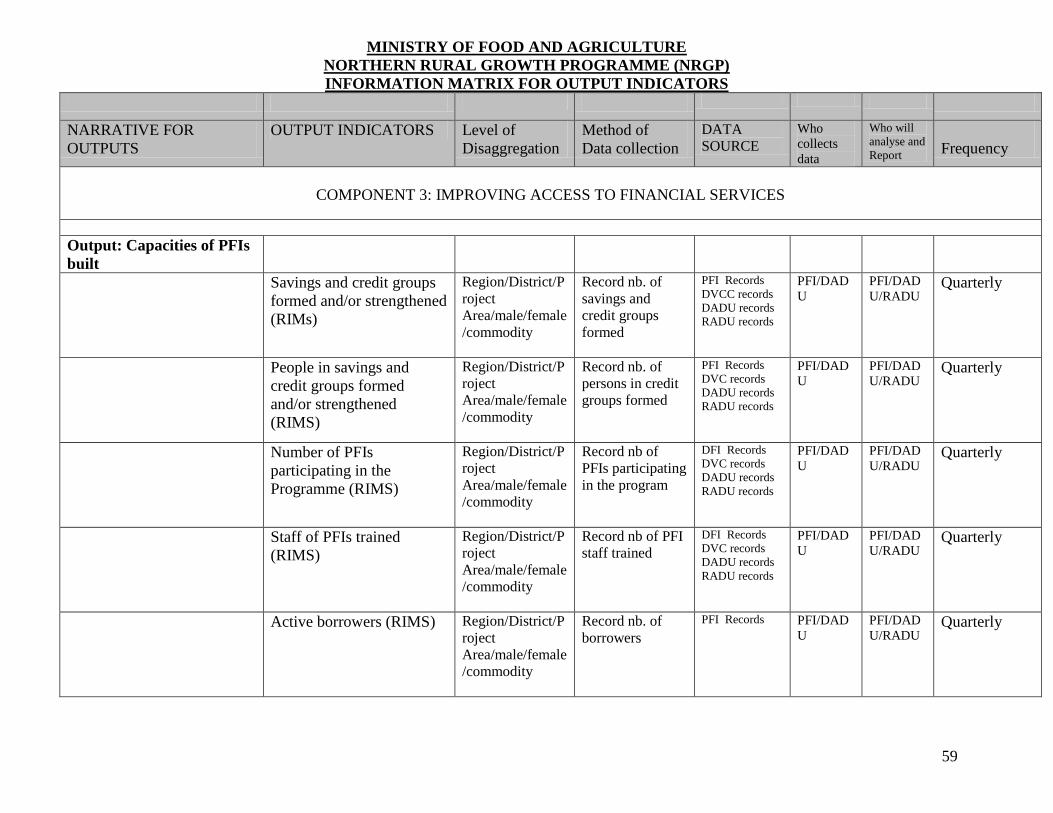
59
MINISTRY OF FOOD AND AGRICULTURE
NORTHERN RURAL GROWTH PROGRAMME (NRGP)
INFORMATION MATRIX FOR OUTPUT INDICATORS
NARRATIVE FOR
OUTPUTS
OUTPUT INDICATORS Level of
Disaggregation
Method of
Data collection
DATA
SOURCE Who
collects
data
Who will
analyse and
Report
Frequency
COMPONENT 3: IMPROVING ACCESS TO FINANCIAL SERVICES
Output: Capacities of PFIs
built
Savings and credit groups
formed and/or strengthened
(RIMs)
Region/District/P
roject
Area/male/female
/commodity
Record nb. of
savings and
credit groups
formed
PFI Records
DVCC records
DADU records
RADU records
PFI/DAD
U PFI/DAD
U/RADU Quarterly
People in savings and
credit groups formed
and/or strengthened
(RIMS)
Region/District/P
roject
Area/male/female
/commodity
Record nb. of
persons in credit
groups formed
PFI Records
DVC records
DADU records
RADU records
PFI/DAD
U PFI/DAD
U/RADU Quarterly
Number of PFIs
participating in the
Programme (RIMS)
Region/District/P
roject
Area/male/female
/commodity
Record nb of
PFIs participating
in the program
DFI Records
DVC records
DADU records
RADU records
PFI/DAD
U PFI/DAD
U/RADU Quarterly
Staff of PFIs trained
(RIMS)
Region/District/P
roject
Area/male/female
/commodity
Record nb of PFI
staff trained
DFI Records
DVC records
DADU records
RADU records
PFI/DAD
U PFI/DAD
U/RADU Quarterly
Active borrowers (RIMS) Region/District/P
roject
Area/male/female
/commodity
Record nb. of
borrowers
PFI Records
PFI/DAD
U PFI/DAD
U/RADU Quarterly
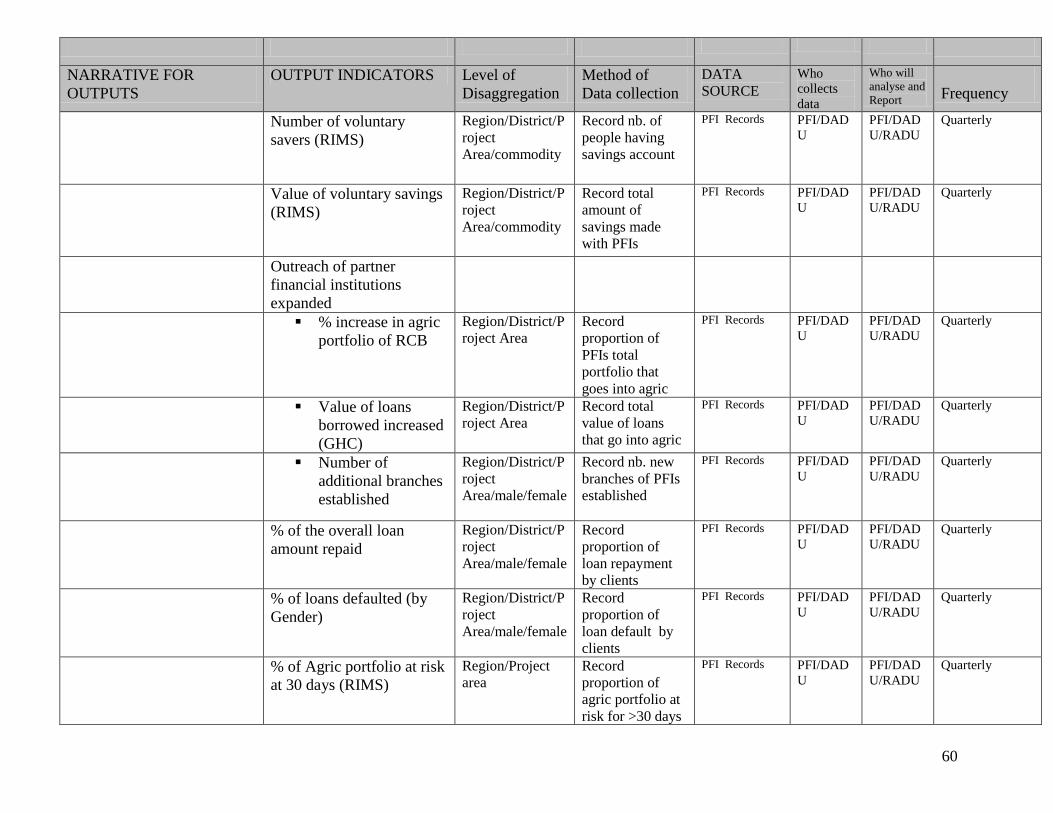
60
NARRATIVE FOR
OUTPUTS
OUTPUT INDICATORS Level of
Disaggregation
Method of
Data collection
DATA
SOURCE Who
collects
data
Who will
analyse and
Report
Frequency
Number of voluntary
savers (RIMS)
Region/District/P
roject
Area/commodity
Record nb. of
people having
savings account
PFI Records
PFI/DAD
U PFI/DAD
U/RADU
Quarterly
Value of voluntary savings
(RIMS)
Region/District/P
roject
Area/commodity
Record total
amount of
savings made
with PFIs
PFI Records
PFI/DAD
U PFI/DAD
U/RADU Quarterly
Outreach of partner
financial institutions
expanded
% increase in agric
portfolio of RCB
Region/District/P
roject Area
Record
proportion of
PFIs total
portfolio that
goes into agric
PFI Records
PFI/DAD
U PFI/DAD
U/RADU Quarterly
Value of loans
borrowed increased
(GHC)
Region/District/P
roject Area
Record total
value of loans
that go into agric
PFI Records
PFI/DAD
U PFI/DAD
U/RADU Quarterly
Number of
additional branches
established
Region/District/P
roject
Area/male/female
Record nb. new
branches of PFIs
established
PFI Records
PFI/DAD
U PFI/DAD
U/RADU Quarterly
% of the overall loan
amount repaid
Region/District/P
roject
Area/male/female
Record
proportion of
loan repayment
by clients
PFI Records
PFI/DAD
U PFI/DAD
U/RADU Quarterly
% of loans defaulted (by
Gender)
Region/District/P
roject
Area/male/female
Record
proportion of
loan default by
clients
PFI Records
PFI/DAD
U PFI/DAD
U/RADU Quarterly
% of Agric portfolio at risk
at 30 days (RIMS)
Region/Project
area
Record
proportion of
agric portfolio at
risk for >30 days
PFI Records
PFI/DAD
U PFI/DAD
U/RADU Quarterly
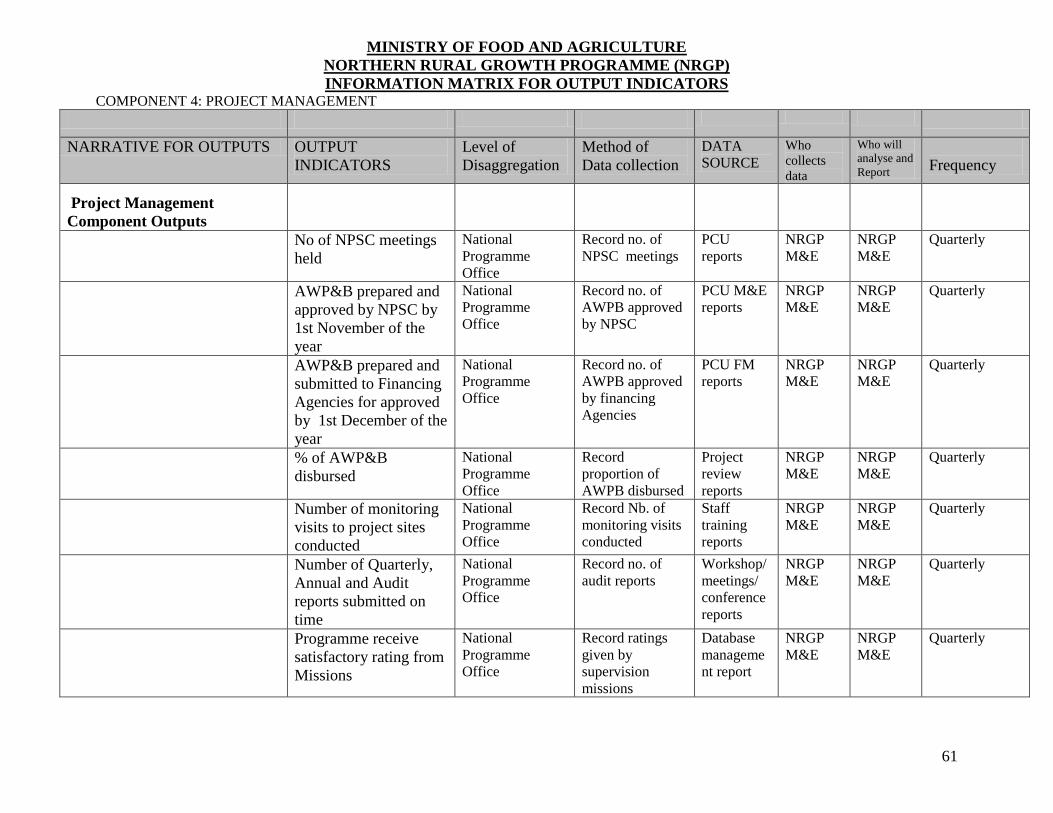
61
MINISTRY OF FOOD AND AGRICULTURE
NORTHERN RURAL GROWTH PROGRAMME (NRGP)
INFORMATION MATRIX FOR OUTPUT INDICATORS COMPONENT 4: PROJECT MANAGEMENT
NARRATIVE FOR OUTPUTS OUTPUT
INDICATORS
Level of
Disaggregation
Method of
Data collection
DATA
SOURCE Who
collects
data
Who will
analyse and
Report
Frequency
Project Management
Component Outputs
No of NPSC meetings
held
National
Programme
Office
Record no. of
NPSC meetings
PCU
reports
NRGP
M&E
NRGP
M&E
Quarterly
AWP&B prepared and
approved by NPSC by
1st November of the
year
National
Programme
Office
Record no. of
AWPB approved
by NPSC
PCU M&E
reports
NRGP
M&E
NRGP
M&E
Quarterly
AWP&B prepared and
submitted to Financing
Agencies for approved
by 1st December of the
year
National
Programme
Office
Record no. of
AWPB approved
by financing
Agencies
PCU FM
reports
NRGP
M&E
NRGP
M&E
Quarterly
% of AWP&B
disbursed
National
Programme
Office
Record
proportion of
AWPB disbursed
Project
review
reports
NRGP
M&E
NRGP
M&E
Quarterly
Number of monitoring
visits to project sites
conducted
National
Programme
Office
Record Nb. of
monitoring visits
conducted
Staff
training
reports
NRGP
M&E
NRGP
M&E
Quarterly
Number of Quarterly,
Annual and Audit
reports submitted on
time
National
Programme
Office
Record no. of
audit reports
Workshop/
meetings/
conference
reports
NRGP
M&E
NRGP
M&E
Quarterly
Programme receive
satisfactory rating from
Missions
National
Programme
Office
Record ratings
given by
supervision
missions
Database
manageme
nt report
NRGP
M&E
NRGP
M&E
Quarterly
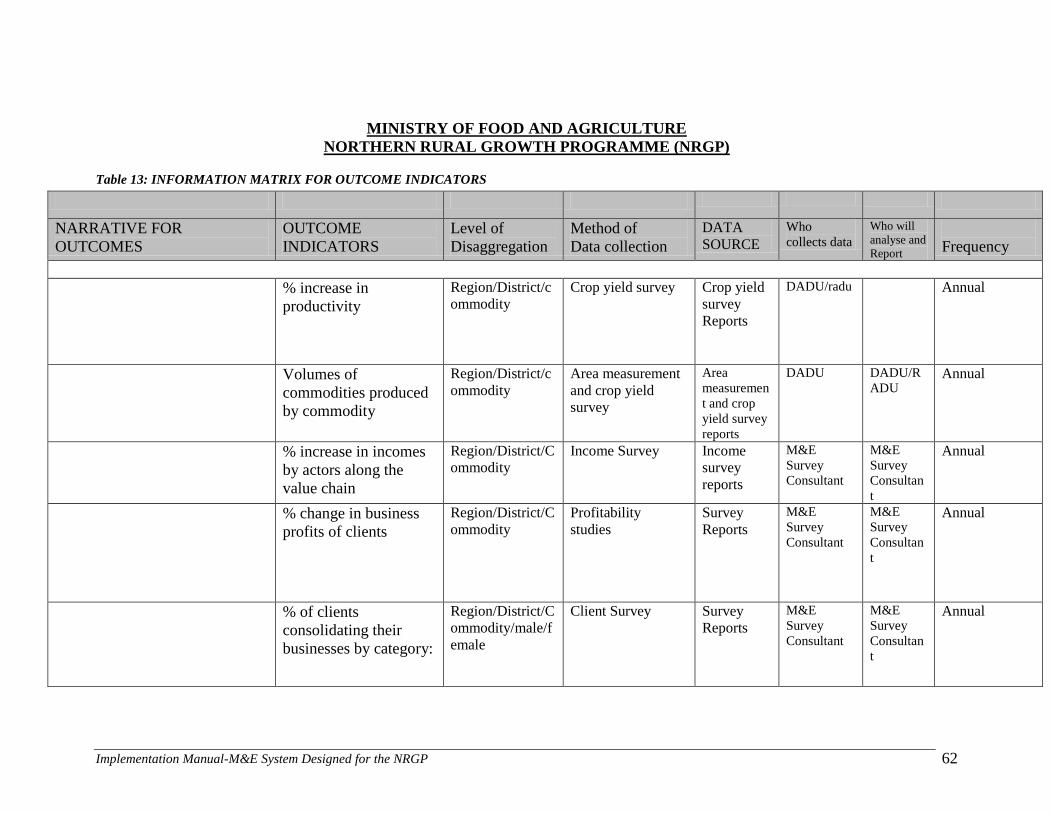
Implementation Manual-M&E System Designed for the NRGP 62
MINISTRY OF FOOD AND AGRICULTURE
NORTHERN RURAL GROWTH PROGRAMME (NRGP)
Table 13: INFORMATION MATRIX FOR OUTCOME INDICATORS
NARRATIVE FOR
OUTCOMES
OUTCOME
INDICATORS
Level of
Disaggregation
Method of
Data collection
DATA
SOURCE
Who
collects data Who will
analyse and
Report
Frequency
% increase in
productivity
Region/District/c
ommodity
Crop yield survey Crop yield
survey
Reports
DADU/radu Annual
Volumes of
commodities produced
by commodity
Region/District/c
ommodity
Area measurement
and crop yield
survey
Area
measuremen
t and crop
yield survey
reports
DADU DADU/R
ADU Annual
% increase in incomes
by actors along the
value chain
Region/District/C
ommodity
Income Survey Income
survey
reports
M&E
Survey
Consultant
M&E
Survey
Consultan
t
Annual
% change in business
profits of clients
Region/District/C
ommodity
Profitability
studies
Survey
Reports
M&E
Survey
Consultant
M&E
Survey
Consultan
t
Annual
% of clients
consolidating their
businesses by category:
Region/District/C
ommodity/male/f
emale
Client Survey Survey
Reports
M&E
Survey
Consultant
M&E
Survey
Consultan
t
Annual
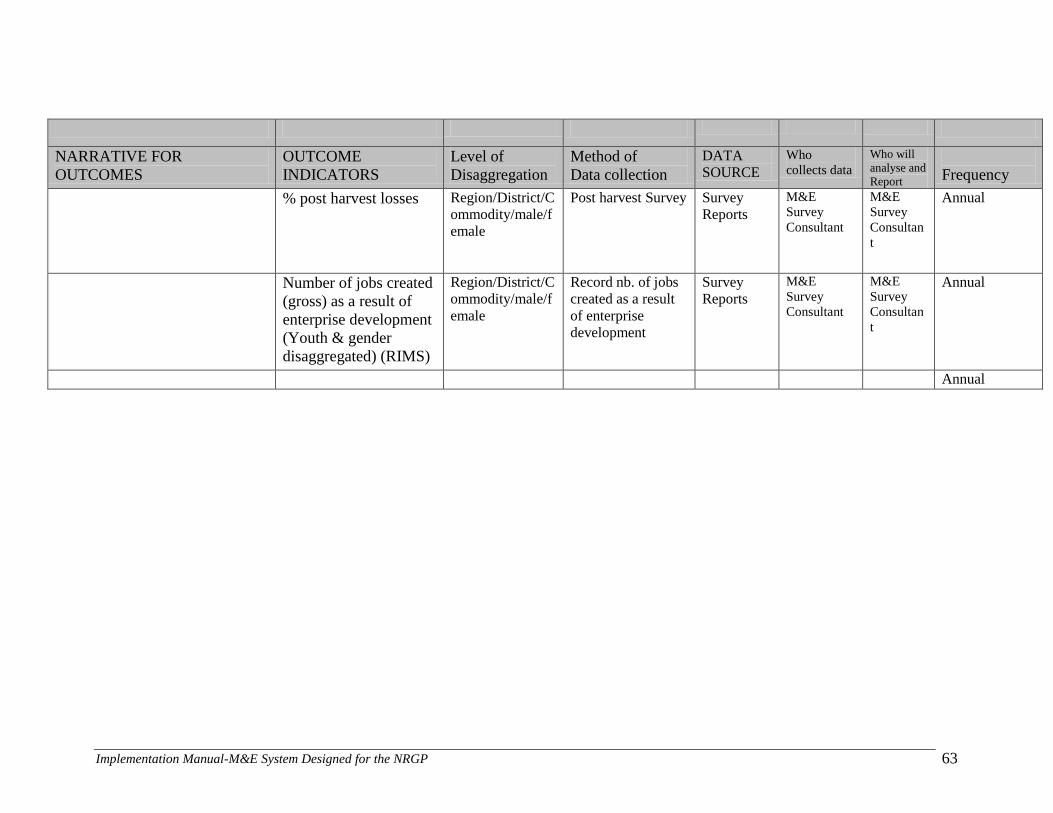
Implementation Manual-M&E System Designed for the NRGP 63
NARRATIVE FOR
OUTCOMES
OUTCOME
INDICATORS
Level of
Disaggregation
Method of
Data collection
DATA
SOURCE Who
collects data Who will
analyse and
Report
Frequency
% post harvest losses Region/District/C
ommodity/male/f
emale
Post harvest Survey Survey
Reports
M&E
Survey
Consultant
M&E
Survey
Consultan
t
Annual
Number of jobs created
(gross) as a result of
enterprise development
(Youth & gender
disaggregated) (RIMS)
Region/District/C
ommodity/male/f
emale
Record nb. of jobs
created as a result
of enterprise
development
Survey
Reports
M&E
Survey
Consultant
M&E
Survey
Consultan
t
Annual
Annual
Implementation Manual-M&E System Designed for the NRGP 64
8.0 EVALUATION FRAMEWORK FOR THE NRGP
Evaluation can be defined as ―The systematic and objective assessment of an on-going or
completed project, programme or policy, its design, implementation and results”. In essence,
evaluations offer a learning opportunity to find out about what is working, what isn‘t – and what
needs to be improved. Evaluations demonstrate integrity and objectivity in identifying valid,
balanced and accurate results that are supported by the evidence assessed.
The Evaluation Questions which would be focused on at Mid-term and Project completion are
categorized under (i) development results and (ii) success factors as follows:
I. DEVELOPMENT RESULTS
1.A Achievement of results at Output level
A. What progress was made towards the achievement of results at the output level?
a) To what extent were results achieved under the commodity chain development
component in comparison with planned, targeted results?
b) To what extent were results achieved under the improvement of rural infrastructure
development component in comparison with planned, targeted results?
c) To what extent were results achieved under the improvement of access to rural financial
services component in comparison with planned, targeted results?
d) What unintended results, if any were attributable to NRGP investments (both positive and
negative)
1.B Achievement of results at Outcome and Impact levels
B. What progress was made towards the achievement of results of the outcome and impact
levels? (To what extent did these results contribute to increased income of beneficiaries?)
a) To what extent did the development of commodity chains result increased agricultural
production and subsequently, increased incomes?
b) To what extent did the improvement in rural infrastructure (small scale irrigation and
marketing infrastructure) result in increased production and improved market access?
c) To what extent did the improvement in rural financial services result in increased
production and incomes?
d) Were beneficiaries clearly identified and targeted for benefits throughout
implementation?
2. Cost-Effectiveness of Results
Is the relationship between costs and results reasonable?
a) Comparison of costs with relevant benchmarks, where feasible, taking into consideration
results achieved.
b) Did actual expenditures correspond to planned expenditures or significant variances fully
justified
3. Relevance of results
Has the NRGP been responsive to development challenges, priorities and objectives of the
Government of Ghana?
Implementation Manual-M&E System Designed for the NRGP 65
a) Did NRGP investments make sense in terms of meeting the challenges taken on?
b) Was there consistency with the needs and priorities of the Government of Ghana?
c) Were efforts co-ordinated with other developmental initiatives?
4. Sustainability of results
To what extent will the results and benefits continue after NRGP involvement ends?
a) How did NRGP programming contribute to the sustainability of results?
b) How will the development of commodity chains continue when NRGP ends?
c) How will the infrastructure provided under NRGP be maintained after NRGP
involvement?
d) How will the provision of rural financial services to actors of the value chain continue
when NRGP ends?
Implementation Manual-M&E System Designed for the NRGP 66
II. SUCCESS FACTORS
5. Partnership
To what extent have partnerships and/or linkages between institutions and organizations been
encouraged and supported?
a) What partnerships and/or linkages were facilitated?
b) Is `there shared responsibility and accountability for results?
c) What methods were successful?
6. Appropriateness of resource utilisation
Were human, financial and physical resources used appropriately and financial information
accurately and adequately maintained?
a) What was the management effectiveness of the project team with regard to planning,
execution and control?
b) Were management structures effective in responding to on-going challenges and in
promoting creativity and innovation?
c) What were the strengths and weaknesses of management structures?
d) Were resource levels adequate?
e) Were the accounting and financial systems adequate (complete, accurate and reliable) for
effective program management? (Sound financial management policies and procedures
including budgeting, accounting and reporting systems and practices)
f) Were Contracting and contract management in accordance with sound contracting
policies and practices
g) Are prudence and probity adequately exercised?
7. Information Management and timely Action.
Did the project anticipate and respond to change based on adequate information?
a) Were there appropriate and adequate information systems in place to identify emerging
risk, developing issues and project performance levels?
b) Was there effective sharing of information?
III. FUTURE DIRECTIONS
8. What needs to be done to achieve accelerated increased production and incomes in adopting
the value chain approach?
a) What foci should be brought to AfDB, IFAD and GoG funding?
b) How should development co-operation be carried out to best advantage?
c) What are the core constraints to realizing such development co-operation opportunities?
d) How should these constraints be overcome?
Details of the Evaluation Framework of NRGP are presented in the Evaluation Design Matrix
below.
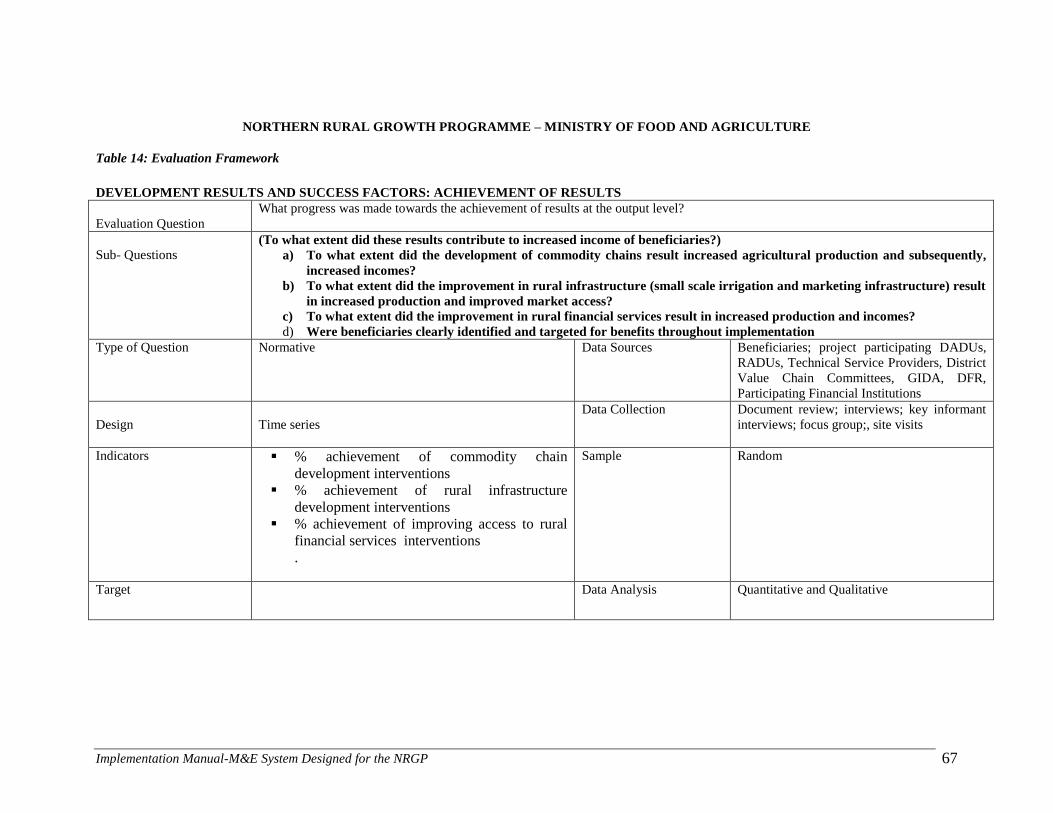
Implementation Manual-M&E System Designed for the NRGP 67
NORTHERN RURAL GROWTH PROGRAMME – MINISTRY OF FOOD AND AGRICULTURE
Table 14: Evaluation Framework
DEVELOPMENT RESULTS AND SUCCESS FACTORS: ACHIEVEMENT OF RESULTS
Evaluation Question
What progress was made towards the achievement of results at the output level?
Sub- Questions (To what extent did these results contribute to increased income of beneficiaries?)
a) To what extent did the development of commodity chains result increased agricultural production and subsequently,
increased incomes?
b) To what extent did the improvement in rural infrastructure (small scale irrigation and marketing infrastructure) result
in increased production and improved market access?
c) To what extent did the improvement in rural financial services result in increased production and incomes?
d) Were beneficiaries clearly identified and targeted for benefits throughout implementation
Type of Question Normative Data Sources Beneficiaries; project participating DADUs,
RADUs, Technical Service Providers, District
Value Chain Committees, GIDA, DFR,
Participating Financial Institutions
Design
Time series
Data Collection Document review; interviews; key informant
interviews; focus group;, site visits
Indicators
% achievement of commodity chain
development interventions
% achievement of rural infrastructure
development interventions
% achievement of improving access to rural
financial services interventions
.
Sample Random
Target
Data Analysis Quantitative and Qualitative
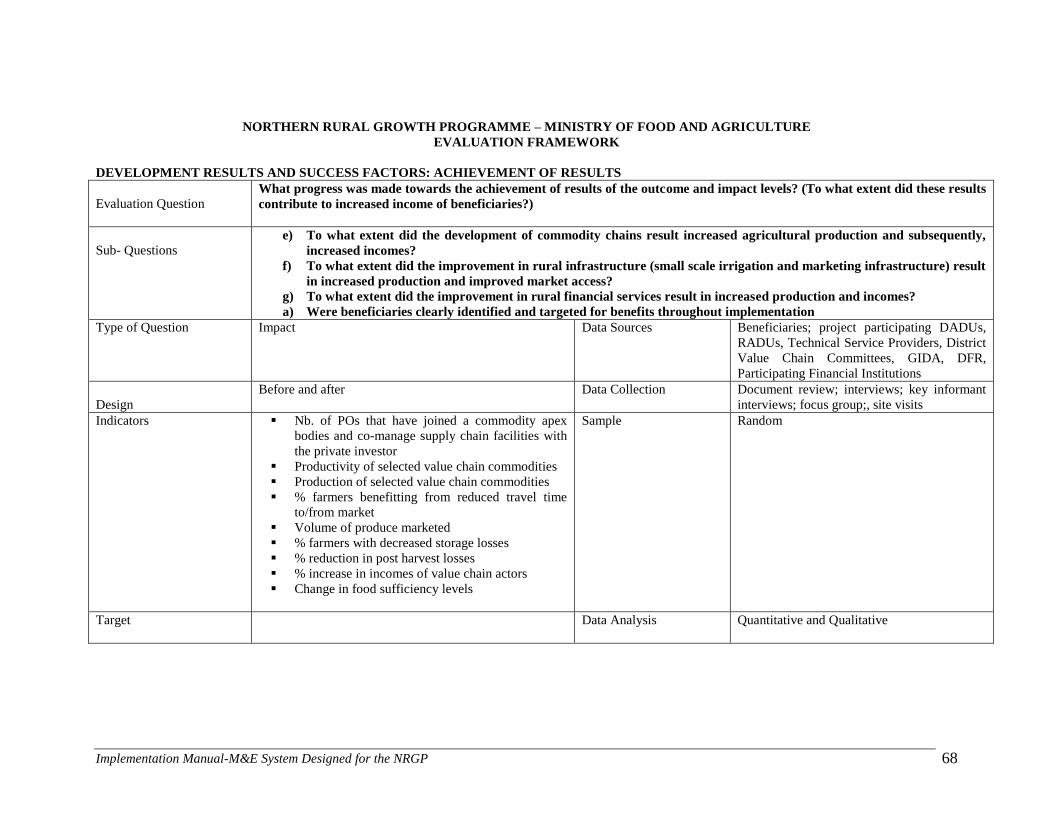
Implementation Manual-M&E System Designed for the NRGP 68
NORTHERN RURAL GROWTH PROGRAMME – MINISTRY OF FOOD AND AGRICULTURE
EVALUATION FRAMEWORK
DEVELOPMENT RESULTS AND SUCCESS FACTORS: ACHIEVEMENT OF RESULTS
Evaluation Question What progress was made towards the achievement of results of the outcome and impact levels? (To what extent did these results
contribute to increased income of beneficiaries?)
Sub- Questions e) To what extent did the development of commodity chains result increased agricultural production and subsequently,
increased incomes?
f) To what extent did the improvement in rural infrastructure (small scale irrigation and marketing infrastructure) result
in increased production and improved market access?
g) To what extent did the improvement in rural financial services result in increased production and incomes?
a) Were beneficiaries clearly identified and targeted for benefits throughout implementation
Type of Question Impact Data Sources Beneficiaries; project participating DADUs,
RADUs, Technical Service Providers, District
Value Chain Committees, GIDA, DFR,
Participating Financial Institutions
Design
Before and after
Data Collection Document review; interviews; key informant
interviews; focus group;, site visits
Indicators
Nb. of POs that have joined a commodity apex
bodies and co-manage supply chain facilities with
the private investor
Productivity of selected value chain commodities
Production of selected value chain commodities
% farmers benefitting from reduced travel time
to/from market
Volume of produce marketed
% farmers with decreased storage losses
% reduction in post harvest losses
% increase in incomes of value chain actors
Change in food sufficiency levels
Sample Random
Target
Data Analysis Quantitative and Qualitative
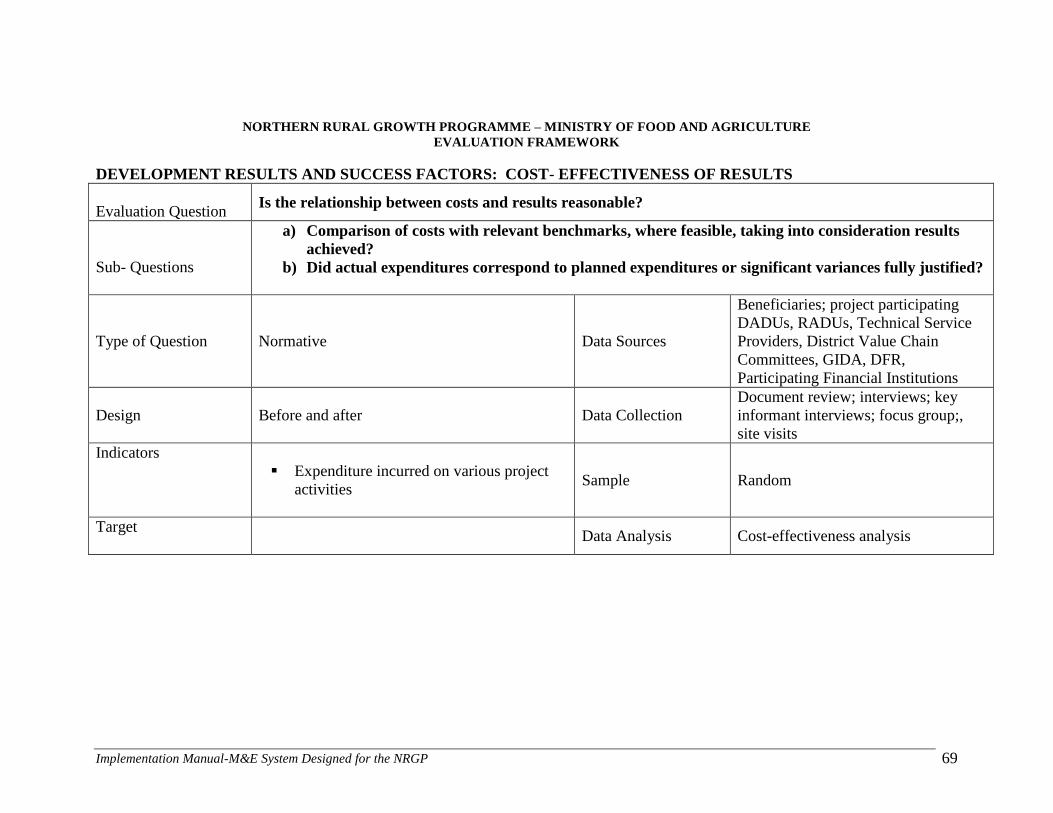
Implementation Manual-M&E System Designed for the NRGP 69
NORTHERN RURAL GROWTH PROGRAMME – MINISTRY OF FOOD AND AGRICULTURE
EVALUATION FRAMEWORK
DEVELOPMENT RESULTS AND SUCCESS FACTORS: COST- EFFECTIVENESS OF RESULTS
Evaluation Question Is the relationship between costs and results reasonable?
Sub- Questions
a) Comparison of costs with relevant benchmarks, where feasible, taking into consideration results
achieved?
b) Did actual expenditures correspond to planned expenditures or significant variances fully justified?
Type of Question Normative Data Sources
Beneficiaries; project participating
DADUs, RADUs, Technical Service
Providers, District Value Chain
Committees, GIDA, DFR,
Participating Financial Institutions
Design
Before and after
Data Collection
Document review; interviews; key
informant interviews; focus group;,
site visits
Indicators
Expenditure incurred on various project
activities Sample Random
Target
Data Analysis Cost-effectiveness analysis
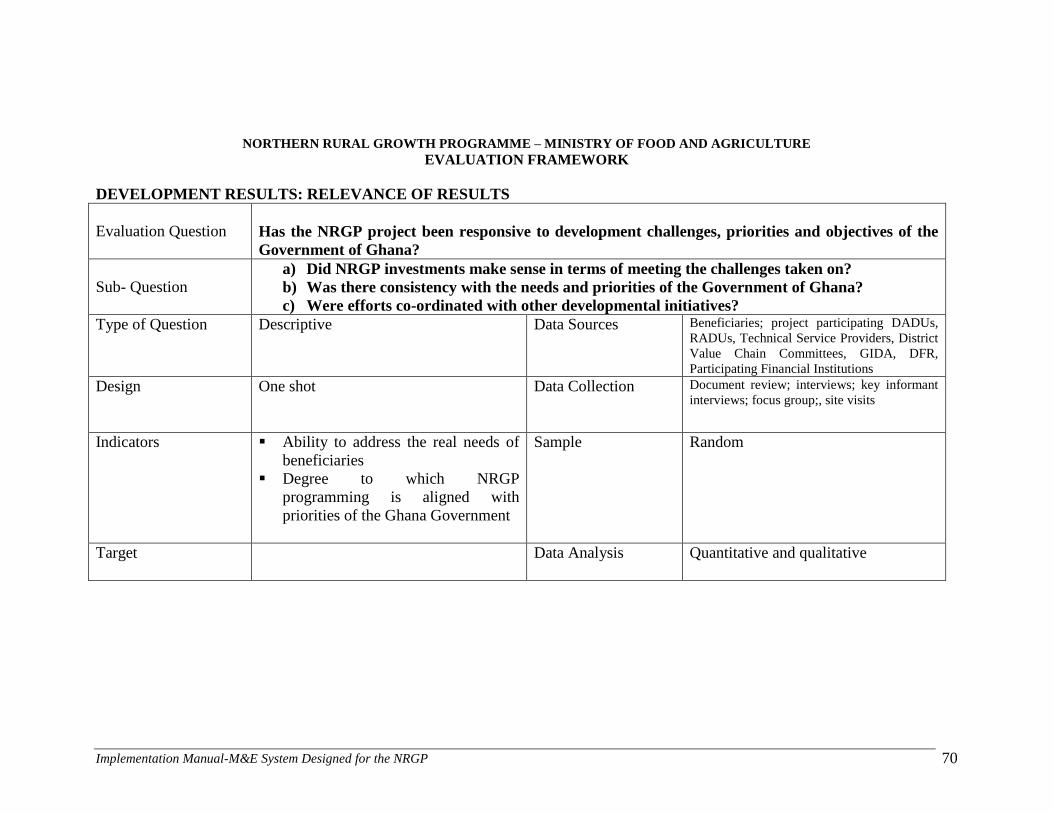
Implementation Manual-M&E System Designed for the NRGP 70
NORTHERN RURAL GROWTH PROGRAMME – MINISTRY OF FOOD AND AGRICULTURE
EVALUATION FRAMEWORK
DEVELOPMENT RESULTS: RELEVANCE OF RESULTS
Evaluation Question
Has the NRGP project been responsive to development challenges, priorities and objectives of the
Government of Ghana?
Sub- Question a) Did NRGP investments make sense in terms of meeting the challenges taken on?
b) Was there consistency with the needs and priorities of the Government of Ghana?
c) Were efforts co-ordinated with other developmental initiatives?
Type of Question Descriptive Data Sources Beneficiaries; project participating DADUs,
RADUs, Technical Service Providers, District
Value Chain Committees, GIDA, DFR,
Participating Financial Institutions
Design One shot
Data Collection Document review; interviews; key informant
interviews; focus group;, site visits
Indicators
Ability to address the real needs of
beneficiaries
Degree to which NRGP
programming is aligned with
priorities of the Ghana Government
Sample Random
Target
Data Analysis Quantitative and qualitative
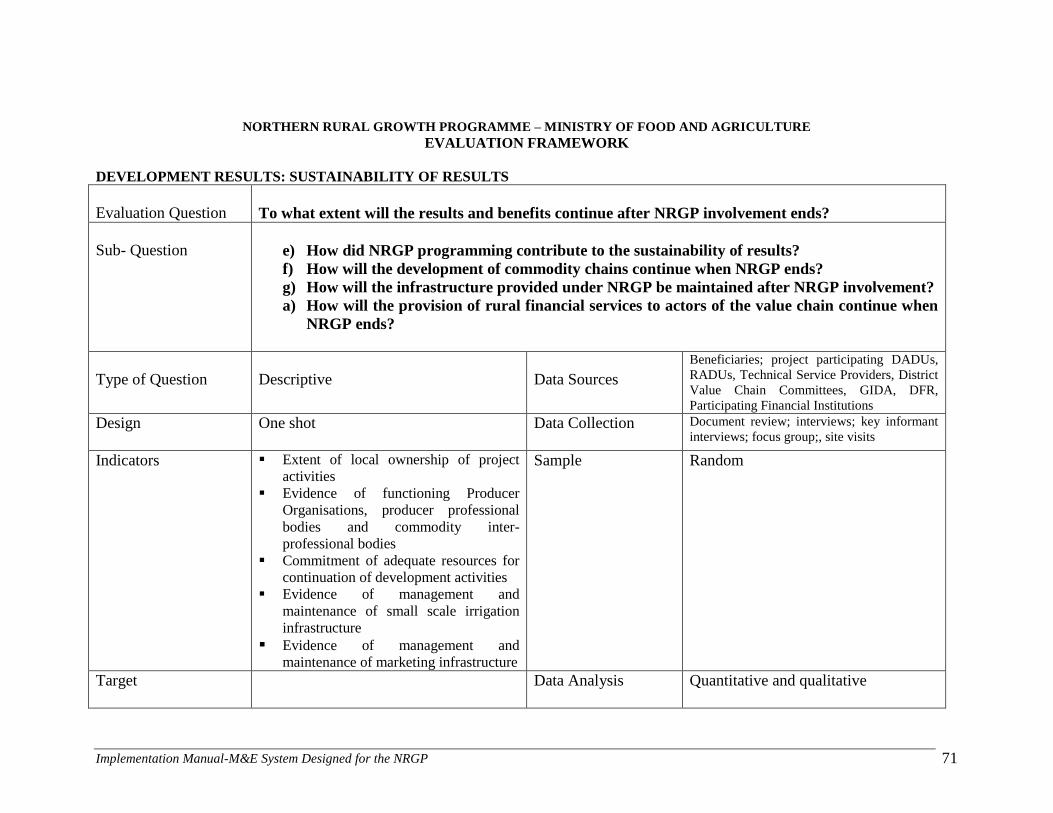
Implementation Manual-M&E System Designed for the NRGP 71
NORTHERN RURAL GROWTH PROGRAMME – MINISTRY OF FOOD AND AGRICULTURE
EVALUATION FRAMEWORK
DEVELOPMENT RESULTS: SUSTAINABILITY OF RESULTS
Evaluation Question
To what extent will the results and benefits continue after NRGP involvement ends?
Sub- Question
e) How did NRGP programming contribute to the sustainability of results?
f) How will the development of commodity chains continue when NRGP ends?
g) How will the infrastructure provided under NRGP be maintained after NRGP involvement?
a) How will the provision of rural financial services to actors of the value chain continue when
NRGP ends?
Type of Question
Descriptive
Data Sources
Beneficiaries; project participating DADUs,
RADUs, Technical Service Providers, District
Value Chain Committees, GIDA, DFR,
Participating Financial Institutions
Design One shot
Data Collection Document review; interviews; key informant
interviews; focus group;, site visits
Indicators
Extent of local ownership of project
activities
Evidence of functioning Producer
Organisations, producer professional
bodies and commodity inter-
professional bodies
Commitment of adequate resources for
continuation of development activities
Evidence of management and
maintenance of small scale irrigation
infrastructure
Evidence of management and
maintenance of marketing infrastructure
Sample Random
Target
Data Analysis Quantitative and qualitative
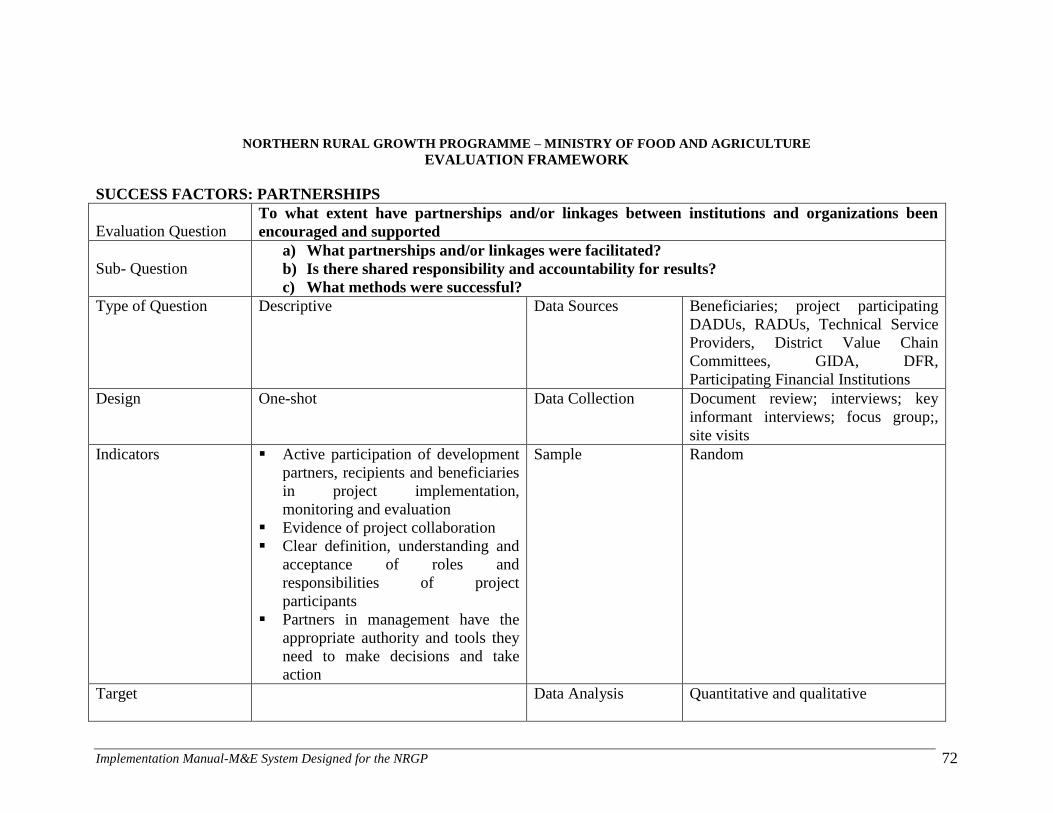
Implementation Manual-M&E System Designed for the NRGP 72
NORTHERN RURAL GROWTH PROGRAMME – MINISTRY OF FOOD AND AGRICULTURE
EVALUATION FRAMEWORK
SUCCESS FACTORS: PARTNERSHIPS
Evaluation Question To what extent have partnerships and/or linkages between institutions and organizations been
encouraged and supported
Sub- Question a) What partnerships and/or linkages were facilitated?
b) Is there shared responsibility and accountability for results?
c) What methods were successful?
Type of Question Descriptive Data Sources Beneficiaries; project participating
DADUs, RADUs, Technical Service
Providers, District Value Chain
Committees, GIDA, DFR,
Participating Financial Institutions
Design One-shot
Data Collection Document review; interviews; key
informant interviews; focus group;,
site visits
Indicators
Active participation of development
partners, recipients and beneficiaries
in project implementation,
monitoring and evaluation
Evidence of project collaboration
Clear definition, understanding and
acceptance of roles and
responsibilities of project
participants
Partners in management have the
appropriate authority and tools they
need to make decisions and take
action
Sample Random
Target
Data Analysis Quantitative and qualitative
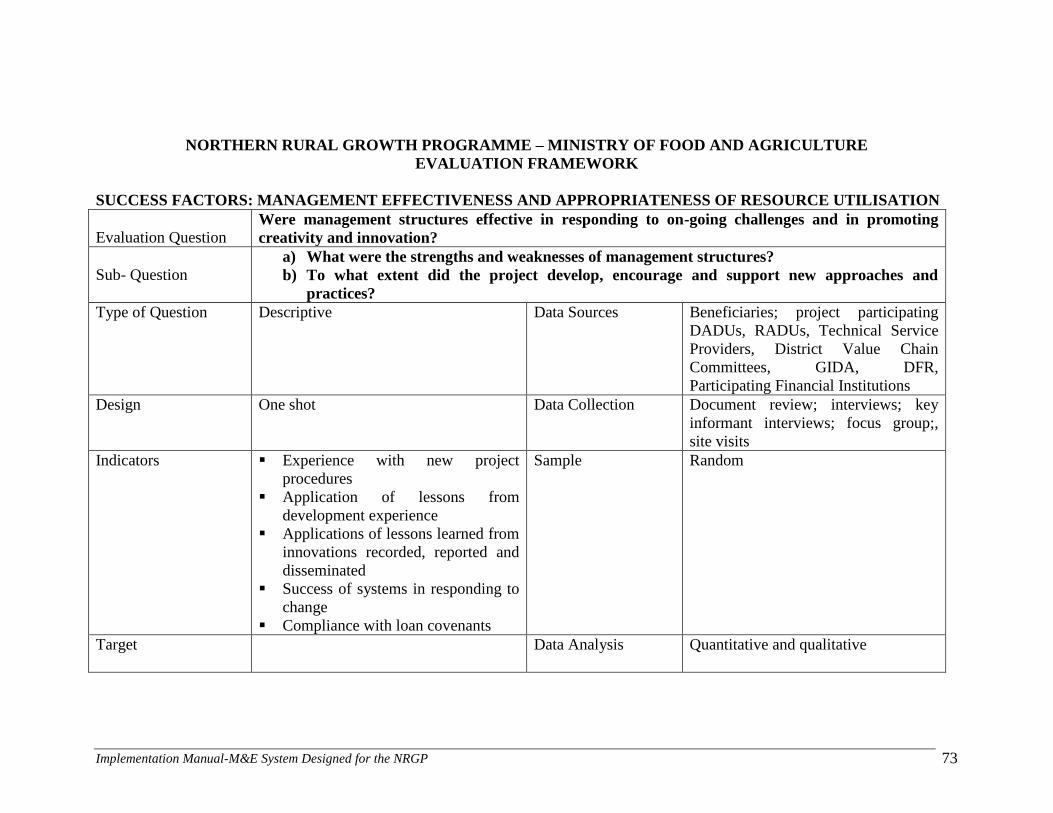
Implementation Manual-M&E System Designed for the NRGP 73
NORTHERN RURAL GROWTH PROGRAMME – MINISTRY OF FOOD AND AGRICULTURE
EVALUATION FRAMEWORK
SUCCESS FACTORS: MANAGEMENT EFFECTIVENESS AND APPROPRIATENESS OF RESOURCE UTILISATION
Evaluation Question Were management structures effective in responding to on-going challenges and in promoting
creativity and innovation?
Sub- Question a) What were the strengths and weaknesses of management structures?
b) To what extent did the project develop, encourage and support new approaches and
practices?
Type of Question Descriptive Data Sources Beneficiaries; project participating
DADUs, RADUs, Technical Service
Providers, District Value Chain
Committees, GIDA, DFR,
Participating Financial Institutions
Design One shot
Data Collection Document review; interviews; key
informant interviews; focus group;,
site visits
Indicators
Experience with new project
procedures
Application of lessons from
development experience
Applications of lessons learned from
innovations recorded, reported and
disseminated
Success of systems in responding to
change
Compliance with loan covenants
Sample Random
Target
Data Analysis Quantitative and qualitative
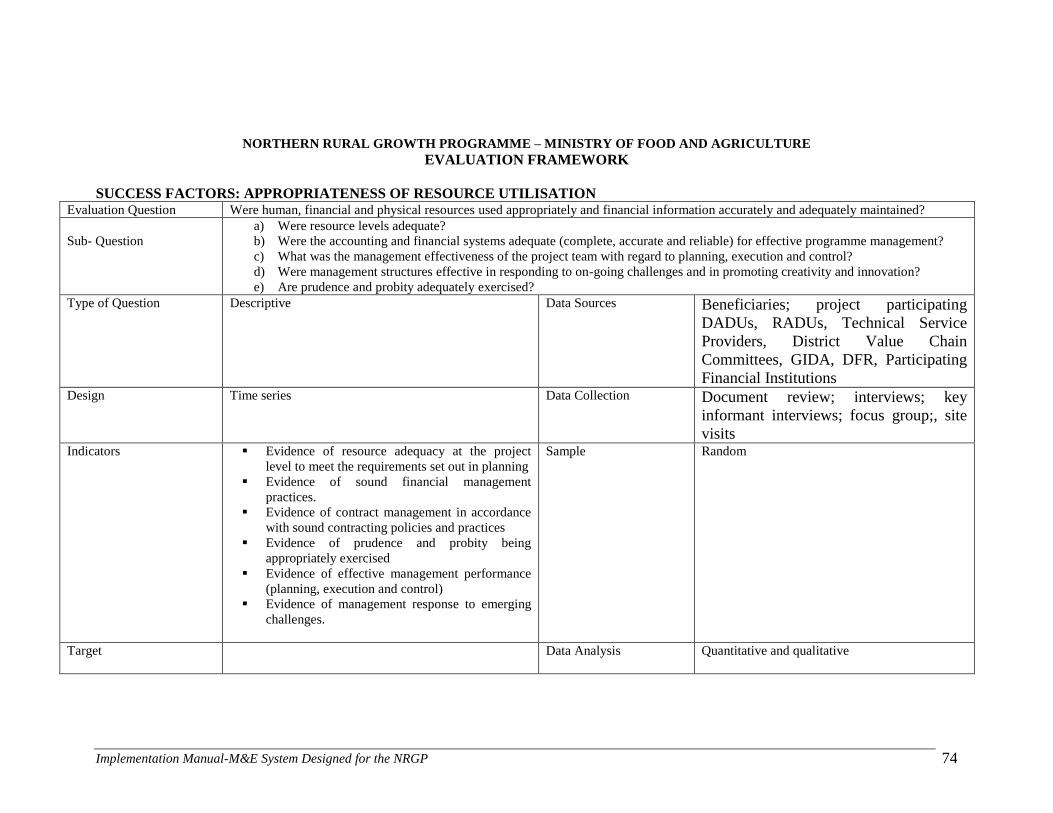
Implementation Manual-M&E System Designed for the NRGP 74
NORTHERN RURAL GROWTH PROGRAMME – MINISTRY OF FOOD AND AGRICULTURE
EVALUATION FRAMEWORK
SUCCESS FACTORS: APPROPRIATENESS OF RESOURCE UTILISATION Evaluation Question Were human, financial and physical resources used appropriately and financial information accurately and adequately maintained?
Sub- Question
a) Were resource levels adequate?
b) Were the accounting and financial systems adequate (complete, accurate and reliable) for effective programme management?
c) What was the management effectiveness of the project team with regard to planning, execution and control?
d) Were management structures effective in responding to on-going challenges and in promoting creativity and innovation?
e) Are prudence and probity adequately exercised?
Type of Question Descriptive Data Sources Beneficiaries; project participating
DADUs, RADUs, Technical Service
Providers, District Value Chain
Committees, GIDA, DFR, Participating
Financial Institutions Design Time series
Data Collection Document review; interviews; key
informant interviews; focus group;, site
visits Indicators
Evidence of resource adequacy at the project
level to meet the requirements set out in planning
Evidence of sound financial management
practices.
Evidence of contract management in accordance
with sound contracting policies and practices
Evidence of prudence and probity being
appropriately exercised
Evidence of effective management performance
(planning, execution and control)
Evidence of management response to emerging
challenges.
Sample Random
Target
Data Analysis Quantitative and qualitative
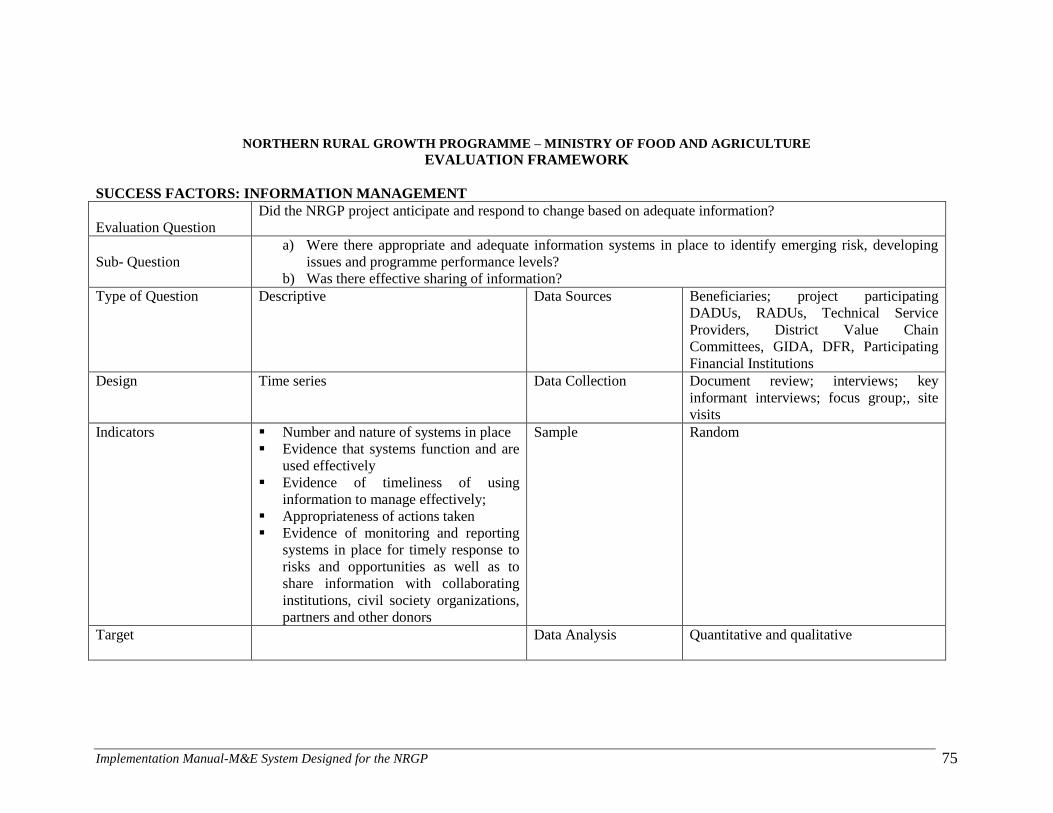
Implementation Manual-M&E System Designed for the NRGP 75
NORTHERN RURAL GROWTH PROGRAMME – MINISTRY OF FOOD AND AGRICULTURE
EVALUATION FRAMEWORK
SUCCESS FACTORS: INFORMATION MANAGEMENT
Evaluation Question
Did the NRGP project anticipate and respond to change based on adequate information?
Sub- Question
a) Were there appropriate and adequate information systems in place to identify emerging risk, developing
issues and programme performance levels?
b) Was there effective sharing of information?
Type of Question Descriptive Data Sources Beneficiaries; project participating
DADUs, RADUs, Technical Service
Providers, District Value Chain
Committees, GIDA, DFR, Participating
Financial Institutions
Design Time series
Data Collection Document review; interviews; key
informant interviews; focus group;, site
visits
Indicators
Number and nature of systems in place
Evidence that systems function and are
used effectively
Evidence of timeliness of using
information to manage effectively;
Appropriateness of actions taken
Evidence of monitoring and reporting
systems in place for timely response to
risks and opportunities as well as to
share information with collaborating
institutions, civil society organizations,
partners and other donors
Sample Random
Target
Data Analysis Quantitative and qualitative
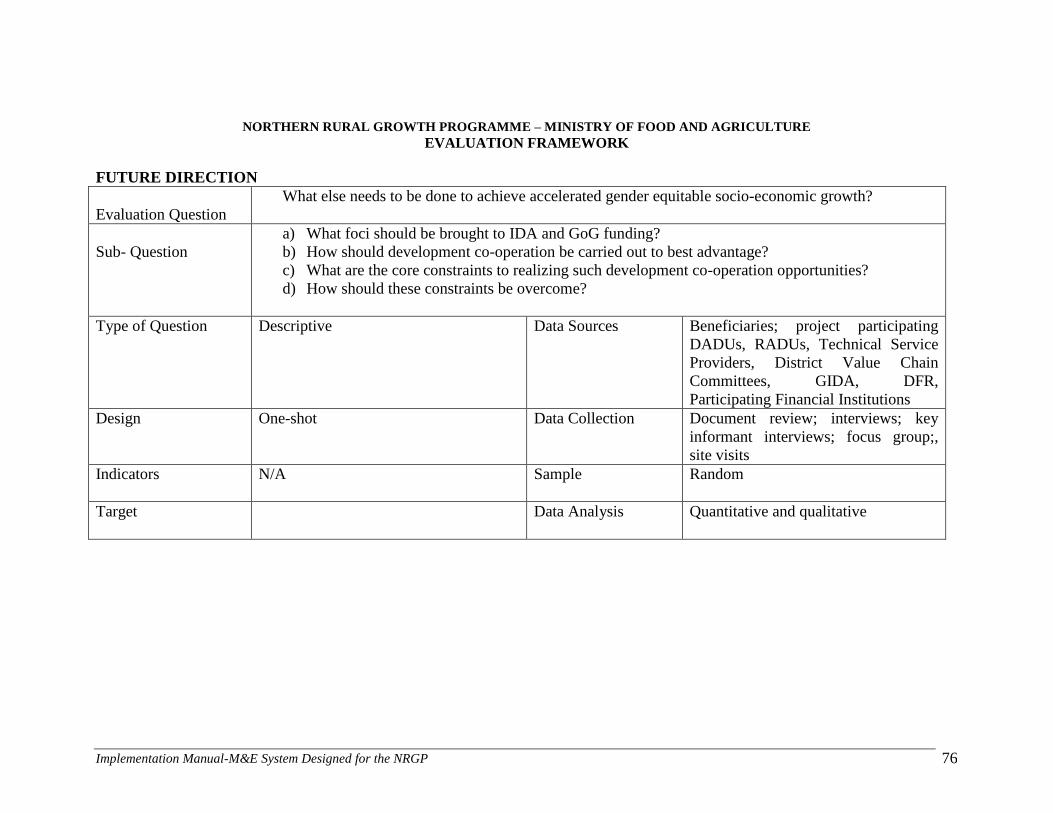
Implementation Manual-M&E System Designed for the NRGP 76
NORTHERN RURAL GROWTH PROGRAMME – MINISTRY OF FOOD AND AGRICULTURE
EVALUATION FRAMEWORK
FUTURE DIRECTION
Evaluation Question
What else needs to be done to achieve accelerated gender equitable socio-economic growth?
Sub- Question
a) What foci should be brought to IDA and GoG funding?
b) How should development co-operation be carried out to best advantage?
c) What are the core constraints to realizing such development co-operation opportunities?
d) How should these constraints be overcome?
Type of Question Descriptive Data Sources Beneficiaries; project participating
DADUs, RADUs, Technical Service
Providers, District Value Chain
Committees, GIDA, DFR,
Participating Financial Institutions
Design One-shot
Data Collection Document review; interviews; key
informant interviews; focus group;,
site visits
Indicators
N/A Sample Random
Target
Data Analysis Quantitative and qualitative
Implementation Manual-M&E System Designed for the NRGP 77
9.0 Framework for Beneficiary Assessment of NRGP.
Beneficiary assessment (BA) is a qualitative research tool used to improve the impact of
development operations by gaining the views of intended beneficiaries regarding a planned or
ongoing intervention.
The objective of BA under NRGP is to assess the value of project activities as perceived by
project beneficiaries and integrate these findings into project activities. It is intended to provide
reliable qualitative, in-depth information on the socio-cultural conditions of beneficiary
populations – information that would be of immediate use to managers and policymakers
responsible for improving peoples‘ lives.
The beneficiary assessment of NRGP would provide beneficiaries with the opportunity to have
their voices heard in the development process. The increased participation of beneficiaries in turn
would lead to ownership, whereby beneficiaries become the key actors in producing the needed
and desired changes in their own development. The beneficiary assessment would thus be used
as a management tool.
9.1 Focus of NRGP Beneficiary Assessment
Issues which would form the focus of NRGP beneficiary assessment include the following.
The nature and degree of beneficiary satisfaction with project interventions
The degree, and increasing rate of participation
The degree to which project support reached the targeted population (e.g. poor,
unemployed, women and other vulnerable groups)
Willingness of beneficiaries to contribute to the operation and maintenance of sub-
projects in order to increase the likelihood of sustainability.
Beneficiary appreciation for local institutions, public and private
Determining the level of awareness of the existence and nature of the project and
ways to relate to it.
Discovering and examining factors underlying motivation (or lack thereof) to
maintain works supported by the project.
9.2 Selecting institutions and field researchers for Beneficiary Assessment
It is recommended to select an M&E Consultant to be responsible for conducting beneficiary
assessments of NRGP. The use of an external agency – the M&E firm - for the conduct of the
beneficiary assessment has the advantage of making the findings credible since the assignment
would be implemented by an external as opposed to an internal entity. It is however
recommended that District Schedule Officers of DADU and the NRGP management team should
participate in the assessment process to enhance the level of internalization that is associated
with in-house involvement.
The conduct of beneficiary assessment would be done once in a year.
Implementation Manual-M&E System Designed for the NRGP 78
9.3 Preparing terms of reference for beneficiary assessment implementation:
The terms of reference for BA implementation should elaborate on the following areas:
Brief note on background and justification (rationale);
Specific purpose and objectives;
Methodology—techniques to be used;
Research issues and themes to be addressed (including the preparation of an interview
guide);
Sample size;
Reporting (form, frequency, to whom);
Time frame for implementation (four weeks is recommended);
Budget
9.4 Sampling frames:
In determining the sample size, the primary concern is that the beneficiary population
interviewed should be large enough to serve as the basis for management decision-making.
Salmen (1995) stated: ―While statistical sampling procedures may serve as a general guide, these
will suggest sample sizes greater than those needed for beneficiary assessment. Because of the
in-depth, qualitative methodology employed in this approach, long conversational interviews,
often complemented by participant observation, can provide a great deal of understanding from a
relatively small number of beneficiaries.‖
Purposive sampling techniques, based on the coverage of the programme, the variability of target
beneficiaries, and the complexity of the program, would be used. Depending on variability of the
client group for the programme, the sample should be stratified according to sub-projects. Within
the stratified sample groups, sampling will be random.
9.5 Preparing interview guides:
The interview guide plays an important role in the implementation of the BA. Given that this is
the main instrument used to obtain information from the assessment, the development of its
content should be a collaborative effort largely between the M&E firm and the M&E Co-
ordinator of the e- Ghana project. The BA interview guide should use themes based on areas of
interest and operational relevance to project management. Open-ended questions should be used.
This technique allows for a smoother flow of information, and often brings to light new
information that was not previously considered by programme management.
9.6 Methodology:
Conversational interview will be the basic tool of inquiry for the BA. The objective is to gain in-
depth information on beneficiary views in relation to a planned or ongoing activity, by
encouraging beneficiaries to speak freely and bring to light issues of concern to project
management. Interviews may be conducted on a one-to-one basis or in focus groups. The
advantages of individual interviews are that people are likely to speak more freely, without
Implementation Manual-M&E System Designed for the NRGP 79
worrying what peers or other community members may think. Lower-status or introverted
members of communities may not feel comfortable speaking out in groups. In undertaking
conversational interviews, the interviewer should establish trust and good rapport with the
respondent to enhance the likelihood of gaining unsolicited information. The timing of the
interview, its duration, and the time of day, should all depend on what is most convenient for the
intended beneficiary. Interviews should be completed in less than one hour (both to
accommodate interviewees and to facilitate recall). Note-taking should be kept to a minimum,
and should be completed as soon after the interview as possible. Asking direct questions on
sensitive topics can put people on the defensive; responses given may be ones that the
respondent feels the interviewer wants to hear. The use of indirect questioning is meant to elicit a
more valid expression of opinion, or of fact.
Focus groups: Use of focus group interviews would permit a wider coverage of people, and may
provoke insightful commentary stimulated by peer interaction. Focus groups are, however, more
difficult to quantify, and attribution of responses to specific individuals more difficult.
9.7 Training of field Researchers:
The training of local researchers should take from two to five days depending on the experience
of team members. The training takes the form of orientation, because BA is a simple-to-use
technique, and should be relatively easy to implement.
9.8 Report preparation:
The final beneficiary assessment report is a critical part of the BA process, because it
summarizes the findings of the field research and also because the recommendations it provides
serve as a guide to project management. Given the goal of serving a wide range of users, two
kinds of final reports for the BA may be considered: the comprehensive for discussion with
donors, and the abbreviated for local use. The comprehensive final report should attempt to
quantify findings to the greatest extent possible. Responses to a few key questions should be
categorized according to thematic areas of the interview guide and presented as percentages. The
findings of focus group discussions should be summarized by groups and by the districts or
zones where they took place. The report should focus as much as possible on issues of relevance
and importance to programme management.
The comprehensive final BA report should contain the following:
An executive summary;
An introduction that gives background information on the objectives of the BA, and a
description of the methodology used;
Findings of the BA as they relate to the interview guide (this section should include
tabular data);
Any other relevant information; and
Conclusions and recommendations.
The abbreviated report should contain only the essentials of sample size, interview guide,
conclusions (as related to key findings), and recommendations.
Implementation Manual-M&E System Designed for the NRGP 80
The length of final reports will vary according to the subject matter, need, and context (5-10
pages for abbreviated, and 25-40 pages for comprehensive).
Implementation Manual-M&E System Designed for the NRGP 81
10.0 M&E DATABASE DEVELOPMENT
In order to enhance the data capture, storage, analysis and reporting of information in respect of
the Northern Rural Growth Programme, an M&E system is to be set up as part of this
Consultancy. This system will be used at the Project Headquarters and Regional levels.
Details of services being rendered by the Consultant involve the following:
a) Development of a user-friendly computerized database model and structure for the
capture, storage, processing, analysis and reporting of data on all indicators of the
Northern Rural Growth Programme
b) Conceptualise a robust and secure front–end for the database
c) Design relevant protocols for data collection, management and integration at various
levels of project management.
d) Define protocols for periodic updates and regular dissemination of data.
e) Develop a user–manual for the use, management and maintenance of the database.
f) Train staff on the use of the database system that has been developed
g) Propose training and institutional capacity building programme on the use, maintenance
and the content management of the database.
h) Propose necessary equipment to run the database.
.
Implementation Manual-M&E System Designed for the NRGP 82
11.0 PROGRESS REPORTING FORMATS
In order to standardize information gathering for the NRGP, progress-reporting formats have
been prepared for use at various levels of management.
The outline of quarterly and annual reports which will be submitted by Implementing Agencies
include the following:
i. A list of specific objectives and activities that were to be accomplished during the
quarter
ii. The degree to which each was completed with figures
a) Compare actual performance against targets on component basis
b) Compare current performance to baseline
c) Analyze trends in performance
d) Carry out comparison between sites/ groups
In analyzing performance the following Questions must be asked and duly answered.
a) Is the Program on track?
b) Did we meet our target? Why and why not?
c) How does the period‘s performance compare to last periods?
d) What happened that we did not expect?
e) Are new targets needed or do we have to review the target?
f) Are we adequately reaching all the required target groups/ sites?
g) What are the weaknesses of the programme that need to be improved or
phased out?
iii. Identification of obstacles or constraints that explain why certain objectives were
not completed as planned (if applicable)
iv. Identification of additional resources, training etc needed to help overcome these
constraints
v. Recommendations for program improvement
vi. Lessons Learnt
vii. Updated list of objectives /activities planned for the next period
viii. Financial accounting: what was budgeted and spent during the reporting period and any
proposed changes for the next period
ix. Items to be followed up during the next reporting period.
The reporting formats will be reviewed periodically and fine – tuned when necessary to
continuously reflect the views of M&E stakeholders.
The Project Indicator report sheet is shown in Table 16 below.
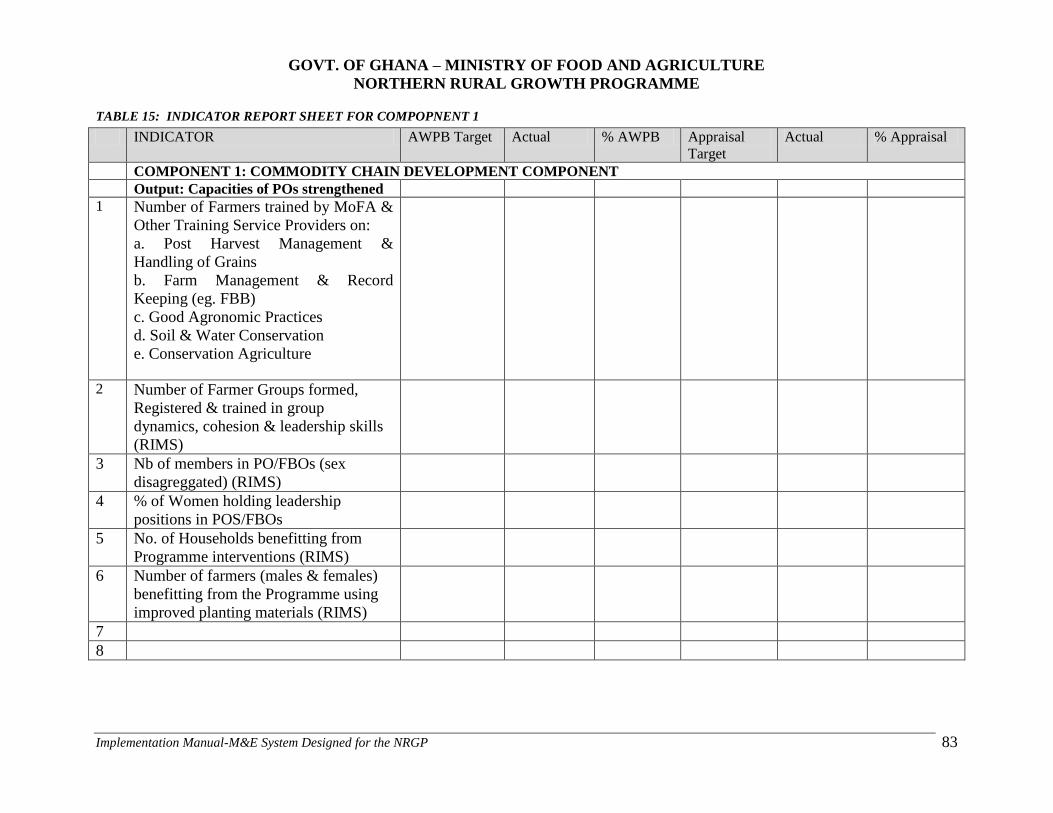
Implementation Manual-M&E System Designed for the NRGP
83
GOVT. OF GHANA – MINISTRY OF FOOD AND AGRICULTURE
NORTHERN RURAL GROWTH PROGRAMME
TABLE 15: INDICATOR REPORT SHEET FOR COMPOPNENT 1
INDICATOR AWPB Target Actual % AWPB Appraisal
Target
Actual % Appraisal
COMPONENT 1: COMMODITY CHAIN DEVELOPMENT COMPONENT
Output: Capacities of POs strengthened
1 Number of Farmers trained by MoFA &
Other Training Service Providers on:
a. Post Harvest Management &
Handling of Grains
b. Farm Management & Record
Keeping (eg. FBB)
c. Good Agronomic Practices
d. Soil & Water Conservation
e. Conservation Agriculture
2 Number of Farmer Groups formed,
Registered & trained in group
dynamics, cohesion & leadership skills
(RIMS)
3 Nb of members in PO/FBOs (sex
disagreggated) (RIMS)
4 % of Women holding leadership
positions in POS/FBOs
5 No. of Households benefitting from
Programme interventions (RIMS)
6 Number of farmers (males & females)
benefitting from the Programme using
improved planting materials (RIMS)
7
8
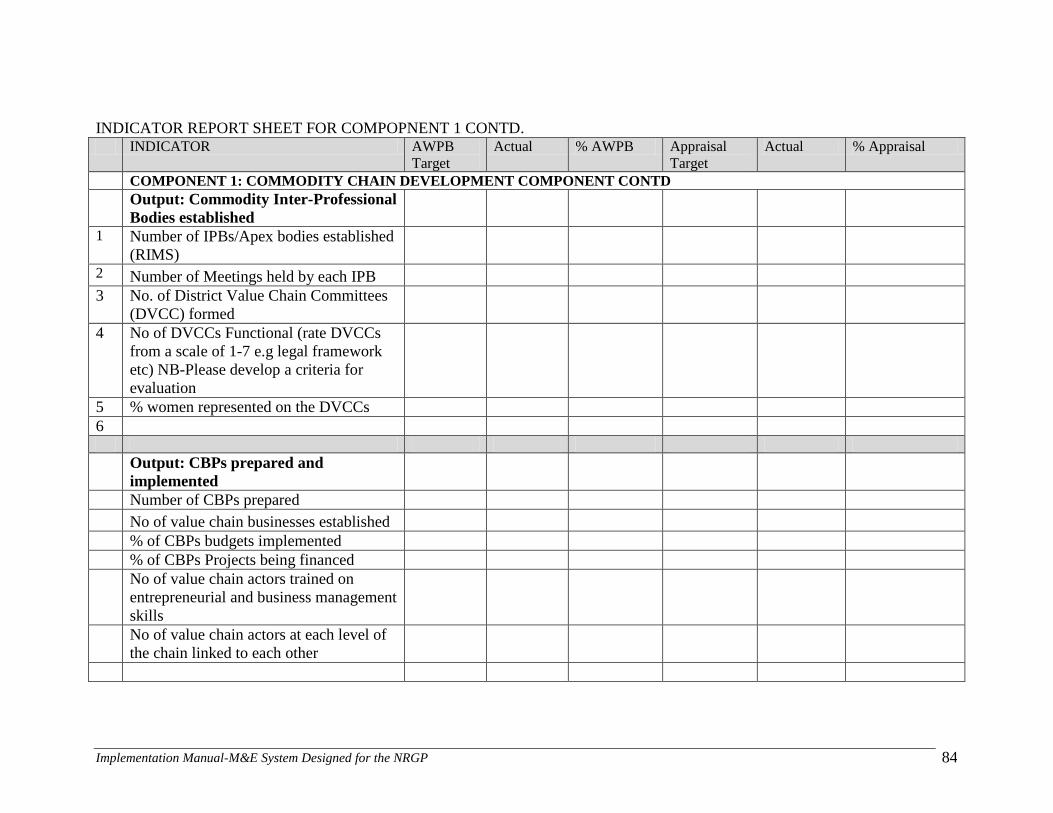
Implementation Manual-M&E System Designed for the NRGP 84
INDICATOR REPORT SHEET FOR COMPOPNENT 1 CONTD. INDICATOR AWPB
Target
Actual % AWPB Appraisal
Target
Actual % Appraisal
COMPONENT 1: COMMODITY CHAIN DEVELOPMENT COMPONENT CONTD
Output: Commodity Inter-Professional
Bodies established
1 Number of IPBs/Apex bodies established
(RIMS)
2 Number of Meetings held by each IPB
3 No. of District Value Chain Committees
(DVCC) formed
4 No of DVCCs Functional (rate DVCCs
from a scale of 1-7 e.g legal framework
etc) NB-Please develop a criteria for
evaluation
5 % women represented on the DVCCs
6
Output: CBPs prepared and
implemented
Number of CBPs prepared
No of value chain businesses established
% of CBPs budgets implemented
% of CBPs Projects being financed
No of value chain actors trained on
entrepreneurial and business management
skills
No of value chain actors at each level of
the chain linked to each other
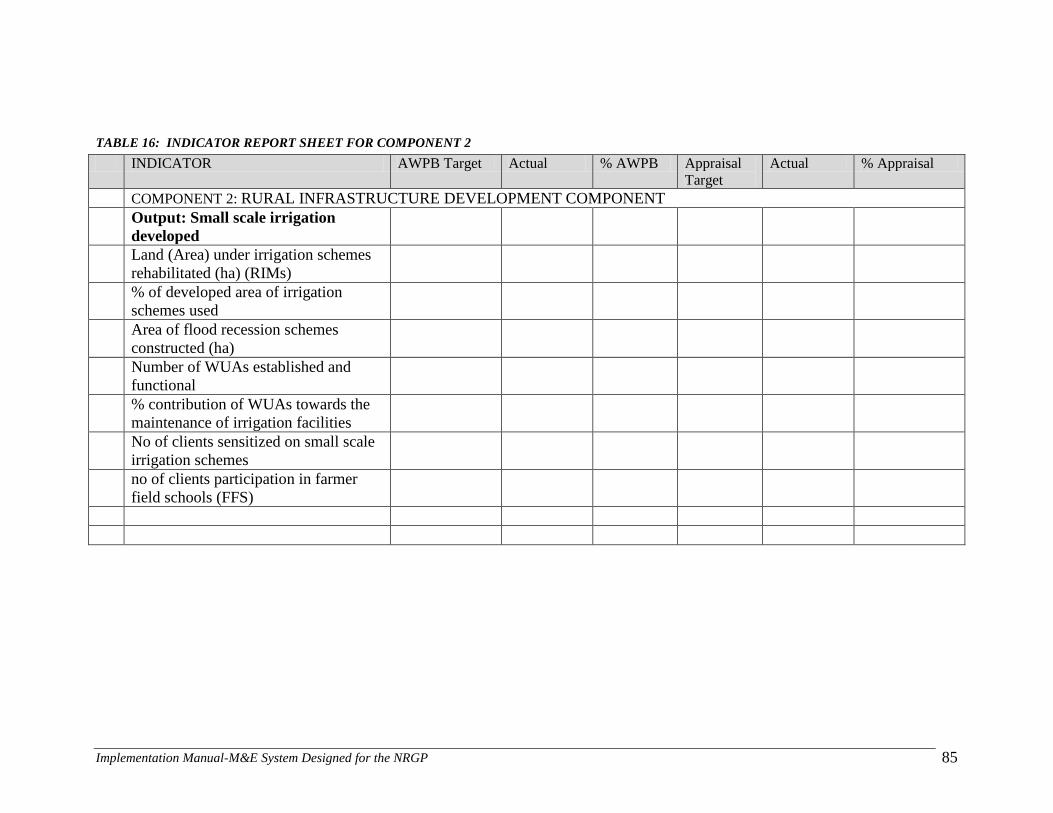
Implementation Manual-M&E System Designed for the NRGP 85
TABLE 16: INDICATOR REPORT SHEET FOR COMPONENT 2
INDICATOR AWPB Target Actual % AWPB Appraisal
Target
Actual % Appraisal
COMPONENT 2: RURAL INFRASTRUCTURE DEVELOPMENT COMPONENT
Output: Small scale irrigation
developed
Land (Area) under irrigation schemes
rehabilitated (ha) (RIMs)
% of developed area of irrigation
schemes used
Area of flood recession schemes
constructed (ha)
Number of WUAs established and
functional
% contribution of WUAs towards the
maintenance of irrigation facilities
No of clients sensitized on small scale
irrigation schemes
no of clients participation in farmer
field schools (FFS)
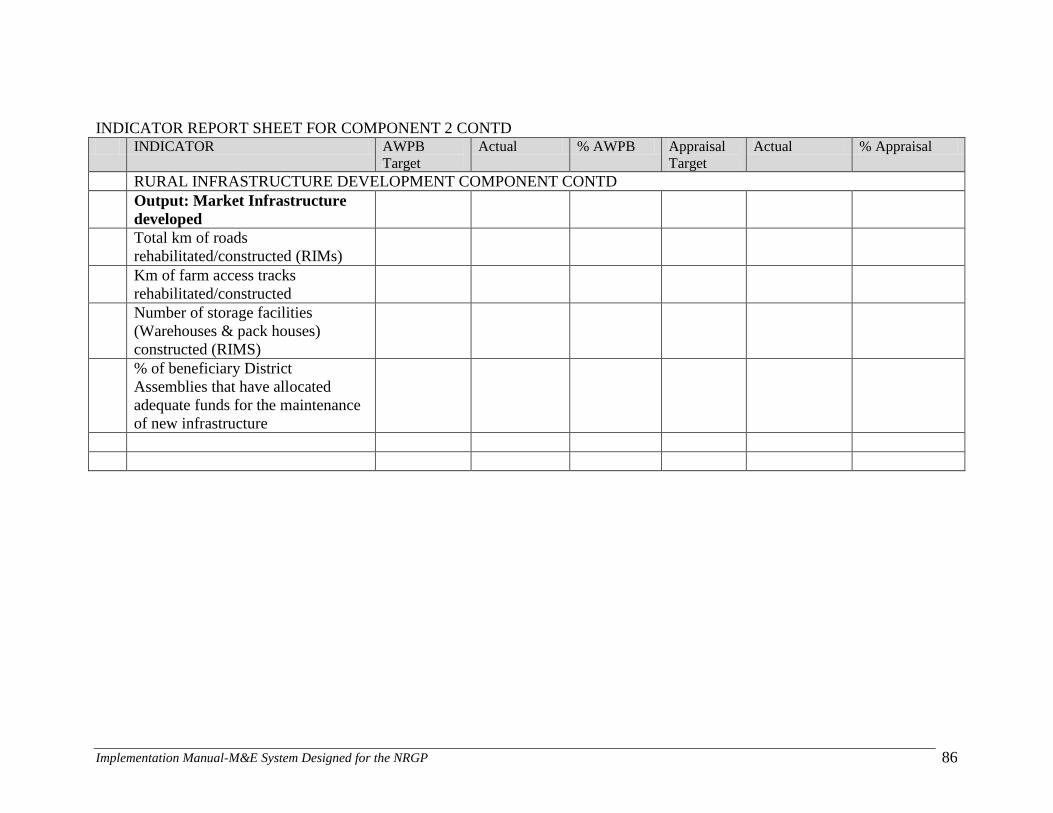
Implementation Manual-M&E System Designed for the NRGP 86
INDICATOR REPORT SHEET FOR COMPONENT 2 CONTD INDICATOR AWPB
Target
Actual % AWPB Appraisal
Target
Actual % Appraisal
RURAL INFRASTRUCTURE DEVELOPMENT COMPONENT CONTD
Output: Market Infrastructure
developed
Total km of roads
rehabilitated/constructed (RIMs)
Km of farm access tracks
rehabilitated/constructed
Number of storage facilities
(Warehouses & pack houses)
constructed (RIMS)
% of beneficiary District
Assemblies that have allocated
adequate funds for the maintenance
of new infrastructure
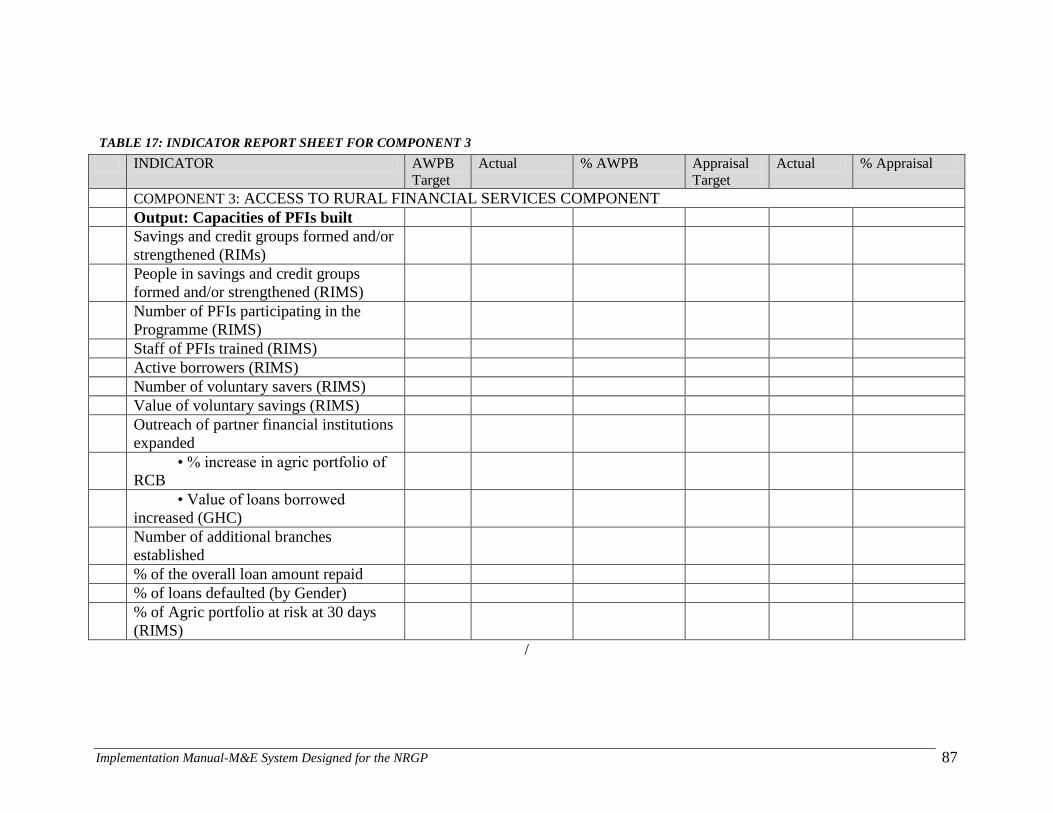
Implementation Manual-M&E System Designed for the NRGP 87
TABLE 17: INDICATOR REPORT SHEET FOR COMPONENT 3
INDICATOR AWPB
Target
Actual % AWPB Appraisal
Target
Actual % Appraisal
COMPONENT 3: ACCESS TO RURAL FINANCIAL SERVICES COMPONENT
Output: Capacities of PFIs built
Savings and credit groups formed and/or
strengthened (RIMs)
People in savings and credit groups
formed and/or strengthened (RIMS)
Number of PFIs participating in the
Programme (RIMS)
Staff of PFIs trained (RIMS)
Active borrowers (RIMS)
Number of voluntary savers (RIMS)
Value of voluntary savings (RIMS)
Outreach of partner financial institutions
expanded
• % increase in agric portfolio of
RCB
• Value of loans borrowed
increased (GHC)
Number of additional branches
established
% of the overall loan amount repaid
% of loans defaulted (by Gender)
% of Agric portfolio at risk at 30 days
(RIMS)
/
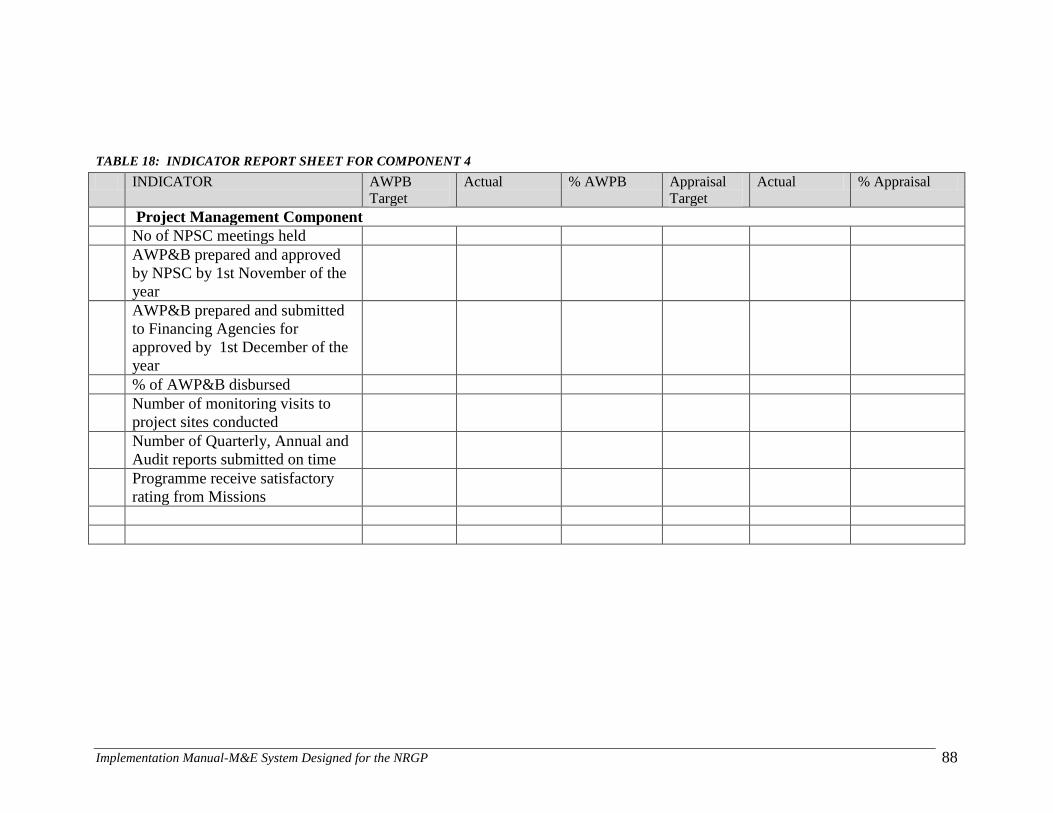
Implementation Manual-M&E System Designed for the NRGP 88
TABLE 18: INDICATOR REPORT SHEET FOR COMPONENT 4
INDICATOR AWPB
Target
Actual % AWPB Appraisal
Target
Actual % Appraisal
Project Management Component No of NPSC meetings held
AWP&B prepared and approved
by NPSC by 1st November of the
year
AWP&B prepared and submitted
to Financing Agencies for
approved by 1st December of the
year
% of AWP&B disbursed
Number of monitoring visits to
project sites conducted
Number of Quarterly, Annual and
Audit reports submitted on time
Programme receive satisfactory
rating from Missions
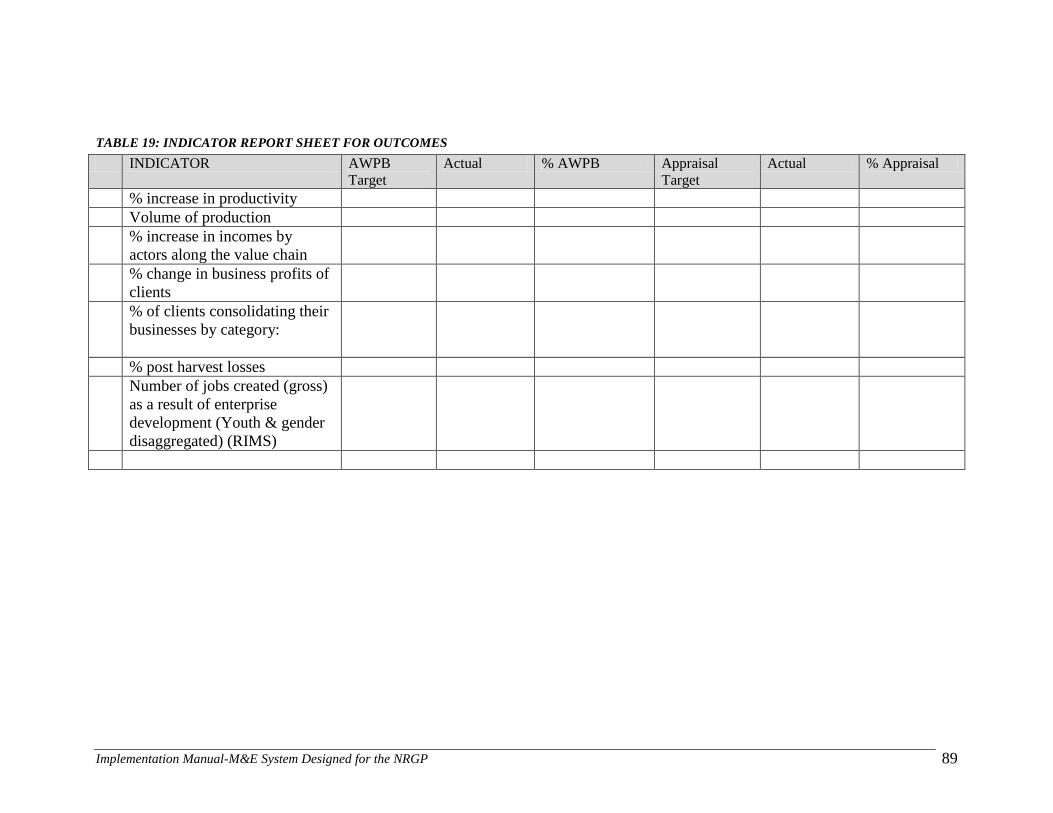
Implementation Manual-M&E System Designed for the NRGP 89
TABLE 19: INDICATOR REPORT SHEET FOR OUTCOMES
INDICATOR AWPB
Target
Actual % AWPB Appraisal
Target
Actual % Appraisal
% increase in productivity
Volume of production
% increase in incomes by
actors along the value chain
% change in business profits of
clients
% of clients consolidating their
businesses by category:
% post harvest losses
Number of jobs created (gross)
as a result of enterprise
development (Youth & gender
disaggregated) (RIMS)
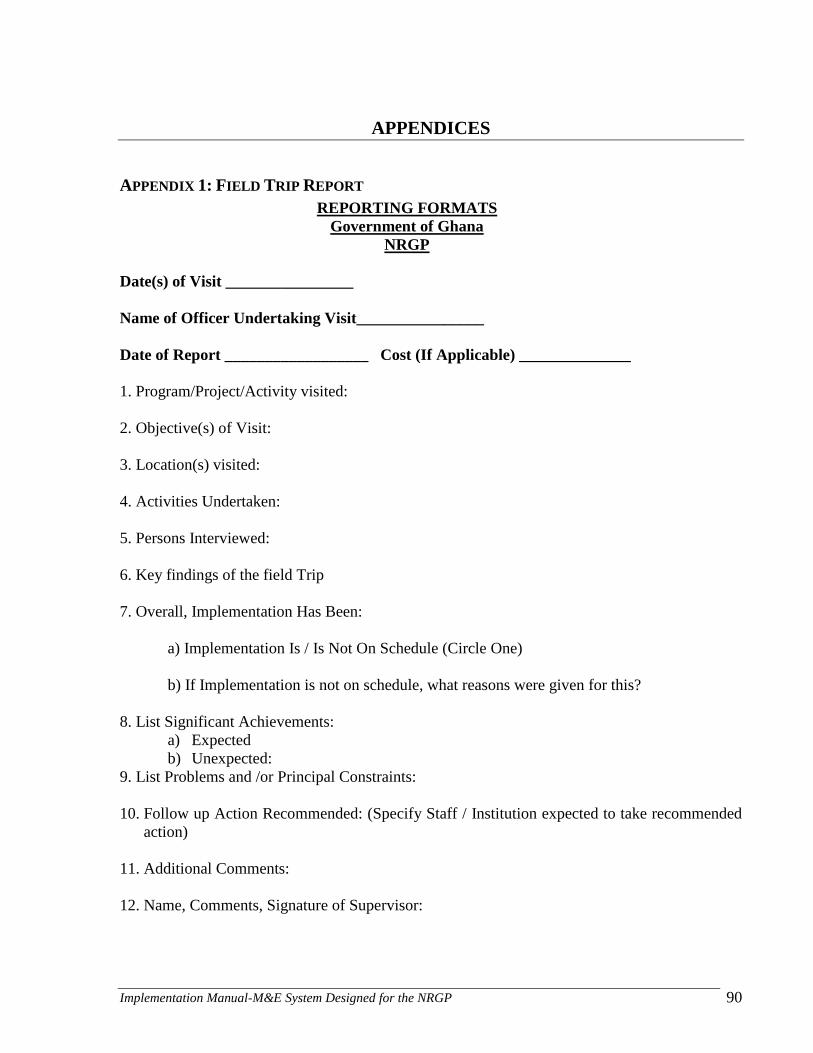
Implementation Manual-M&E System Designed for the NRGP 90
APPENDICES
APPENDIX 1: FIELD TRIP REPORT
REPORTING FORMATS
Government of Ghana
NRGP
Date(s) of Visit ________________
Name of Officer Undertaking Visit________________
Date of Report __________________ Cost (If Applicable) ______________
1. Program/Project/Activity visited:
2. Objective(s) of Visit:
3. Location(s) visited:
4. Activities Undertaken:
5. Persons Interviewed:
6. Key findings of the field Trip
7. Overall, Implementation Has Been:
a) Implementation Is / Is Not On Schedule (Circle One)
b) If Implementation is not on schedule, what reasons were given for this?
8. List Significant Achievements:
a) Expected
b) Unexpected:
9. List Problems and /or Principal Constraints:
10. Follow up Action Recommended: (Specify Staff / Institution expected to take recommended
action)
11. Additional Comments:
12. Name, Comments, Signature of Supervisor:
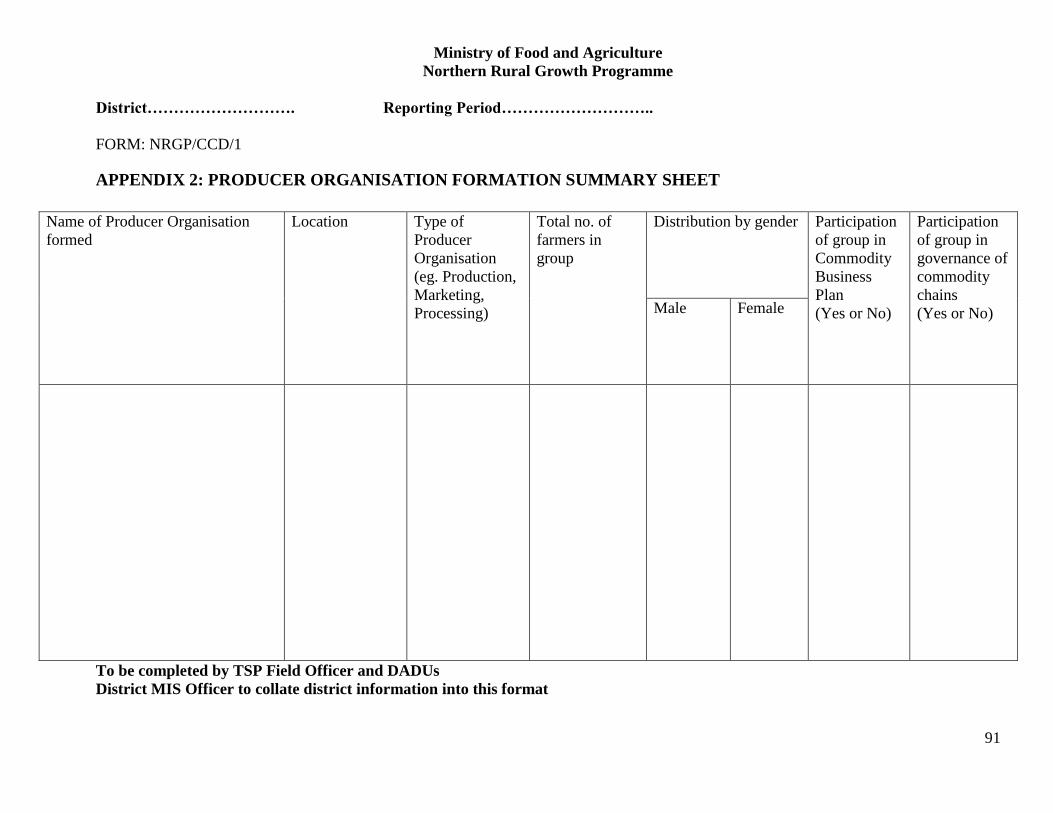
91
Ministry of Food and Agriculture
Northern Rural Growth Programme
District………………………. Reporting Period………………………..
FORM: NRGP/CCD/1
APPENDIX 2: PRODUCER ORGANISATION FORMATION SUMMARY SHEET
Name of Producer Organisation
formed
Location Type of
Producer
Organisation
(eg. Production,
Marketing,
Processing)
Total no. of
farmers in
group
Distribution by gender Participation
of group in
Commodity
Business
Plan
(Yes or No)
Participation
of group in
governance of
commodity
chains
(Yes or No) Male Female
To be completed by TSP Field Officer and DADUs
District MIS Officer to collate district information into this format
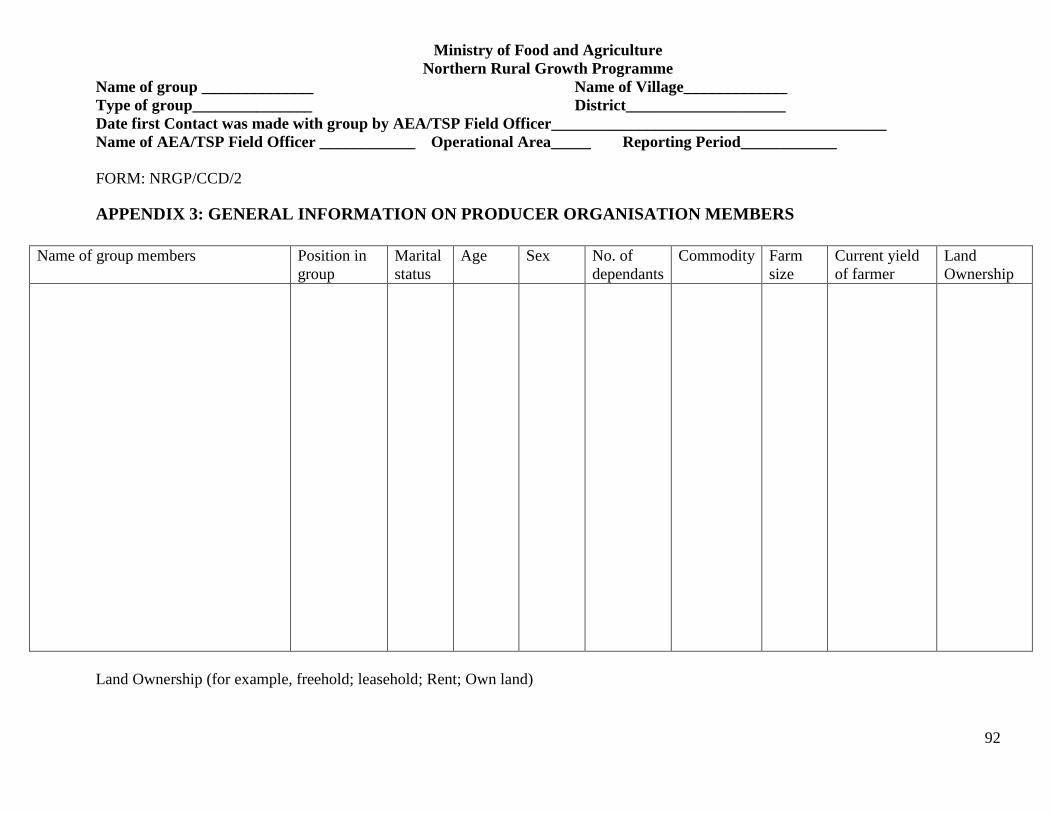
92
Ministry of Food and Agriculture
Northern Rural Growth Programme
Name of group ______________ Name of Village_____________
Type of group_______________ District____________________
Date first Contact was made with group by AEA/TSP Field Officer__________________________________________
Name of AEA/TSP Field Officer ____________ Operational Area_____ Reporting Period____________
FORM: NRGP/CCD/2
APPENDIX 3: GENERAL INFORMATION ON PRODUCER ORGANISATION MEMBERS
Name of group members Position in
group
Marital
status
Age Sex No. of
dependants
Commodity Farm
size
Current yield
of farmer
Land
Ownership
Land Ownership (for example, freehold; leasehold; Rent; Own land)
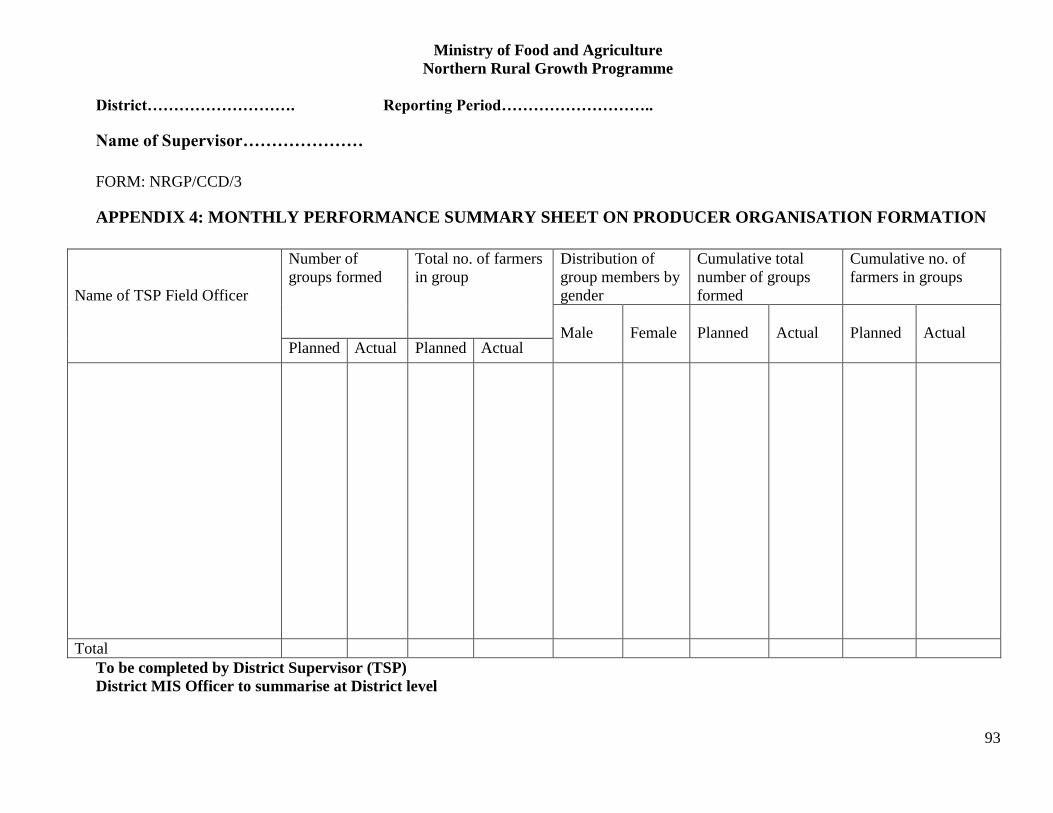
93
Ministry of Food and Agriculture
Northern Rural Growth Programme
District………………………. Reporting Period………………………..
Name of Supervisor…………………
FORM: NRGP/CCD/3
APPENDIX 4: MONTHLY PERFORMANCE SUMMARY SHEET ON PRODUCER ORGANISATION FORMATION
Name of TSP Field Officer
Number of
groups formed
Total no. of farmers
in group
Distribution of
group members by
gender
Cumulative total
number of groups
formed
Cumulative no. of
farmers in groups
Male
Female
Planned
Actual
Planned
Actual Planned Actual Planned Actual
Total
To be completed by District Supervisor (TSP)
District MIS Officer to summarise at District level
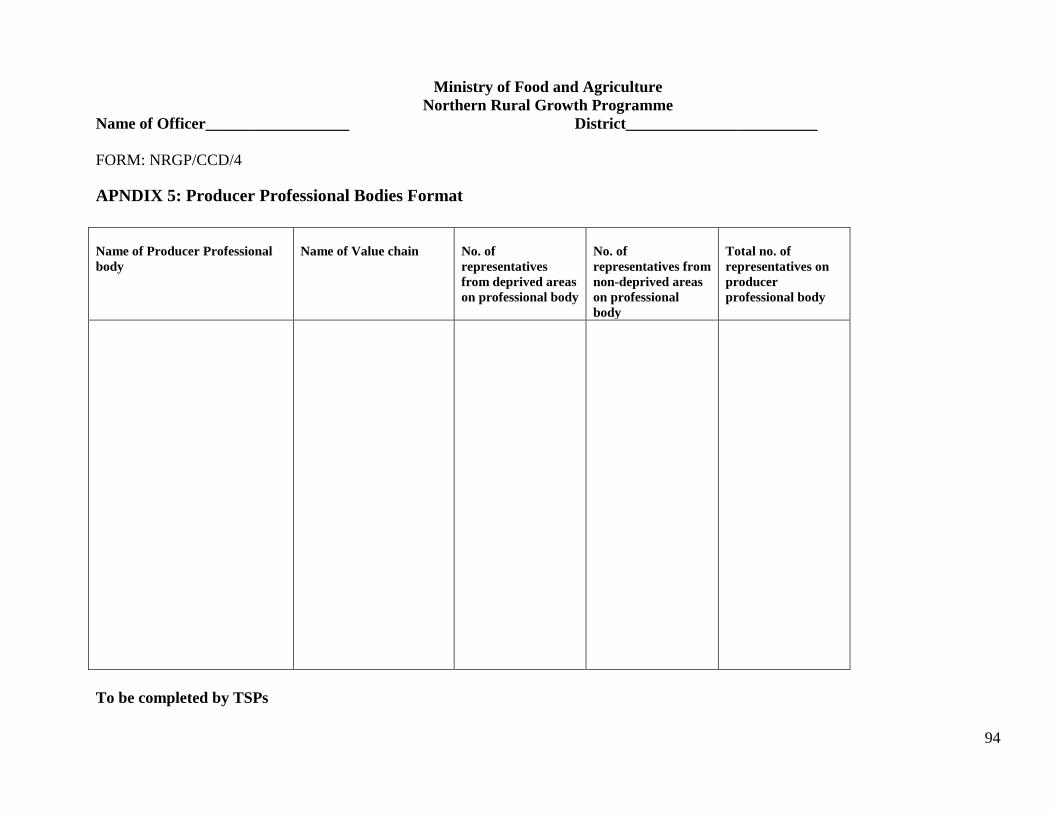
94
Ministry of Food and Agriculture
Northern Rural Growth Programme
Name of Officer__________________ District________________________
FORM: NRGP/CCD/4
APNDIX 5: Producer Professional Bodies Format
Name of Producer Professional
body
Name of Value chain
No. of
representatives
from deprived areas
on professional body
No. of
representatives from
non-deprived areas
on professional
body
Total no. of
representatives on
producer
professional body
To be completed by TSPs
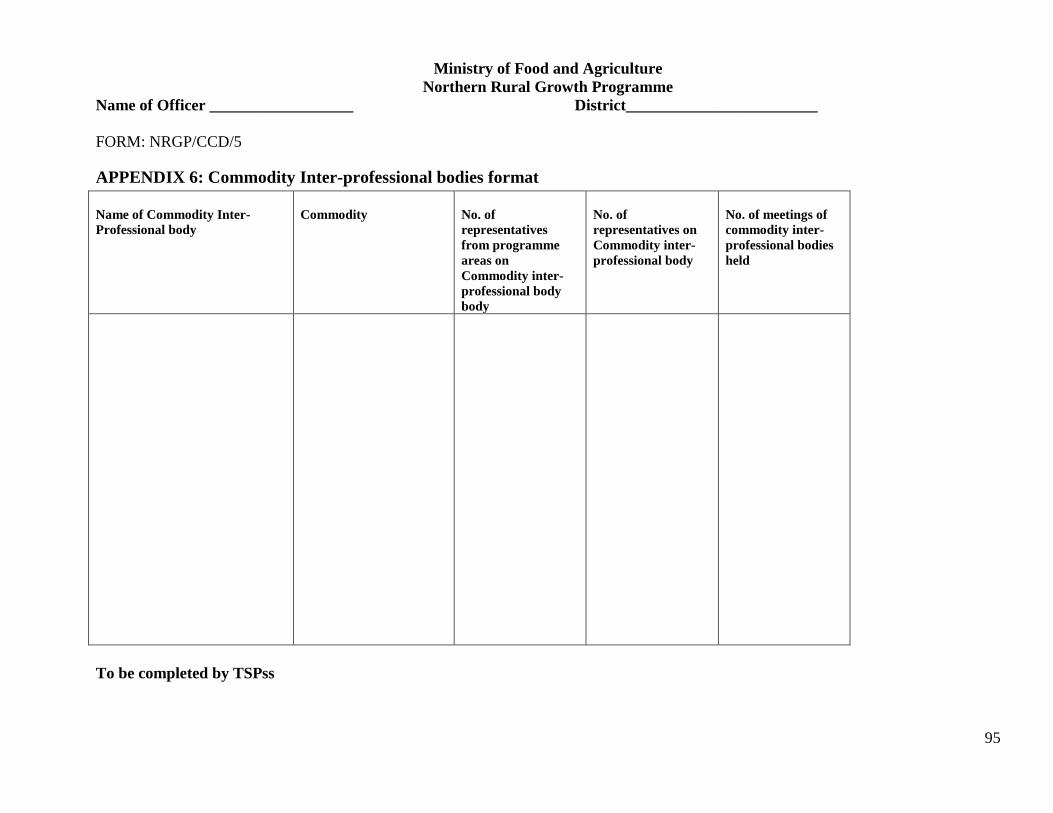
95
Ministry of Food and Agriculture
Northern Rural Growth Programme
Name of Officer __________________ District________________________
FORM: NRGP/CCD/5
APPENDIX 6: Commodity Inter-professional bodies format
Name of Commodity Inter-
Professional body
Commodity
No. of
representatives
from programme
areas on
Commodity inter-
professional body
body
No. of
representatives on
Commodity inter-
professional body
No. of meetings of
commodity inter-
professional bodies
held
To be completed by TSPss
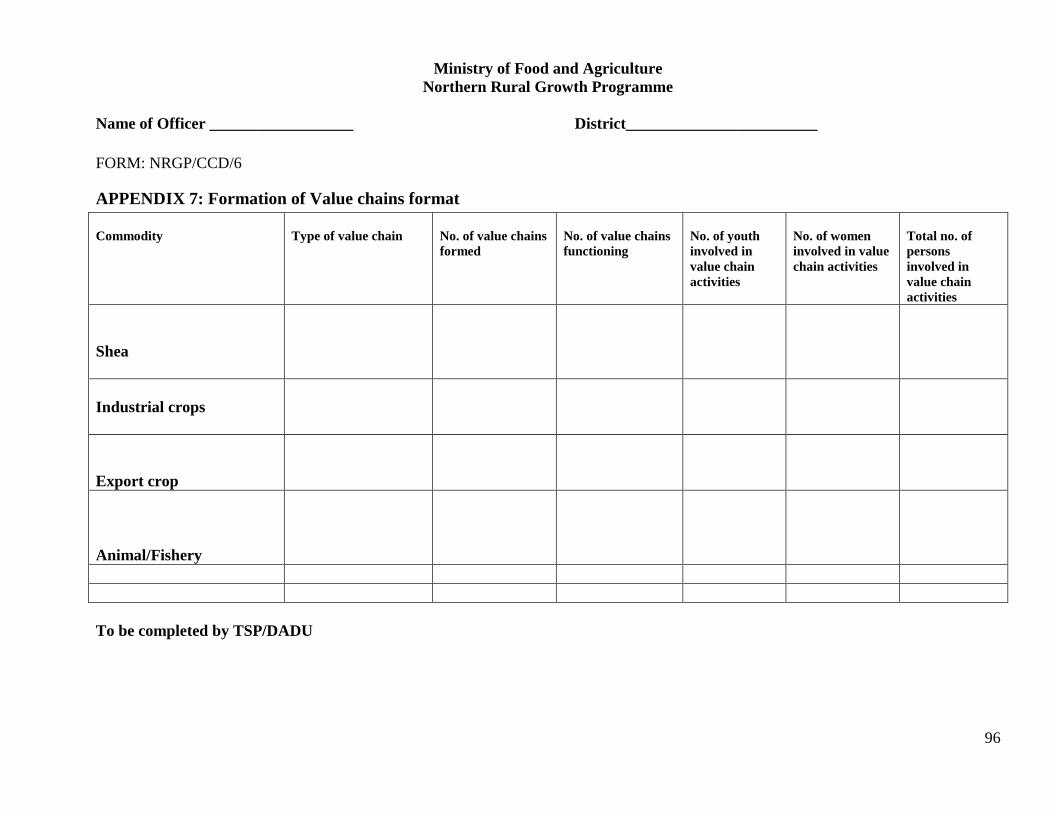
96
Ministry of Food and Agriculture
Northern Rural Growth Programme
Name of Officer __________________ District________________________
FORM: NRGP/CCD/6
APPENDIX 7: Formation of Value chains format
Commodity
Type of value chain
No. of value chains
formed
No. of value chains
functioning
No. of youth
involved in
value chain
activities
No. of women
involved in value
chain activities
Total no. of
persons
involved in
value chain
activities
Shea
Industrial crops
Export crop
Animal/Fishery
To be completed by TSP/DADU
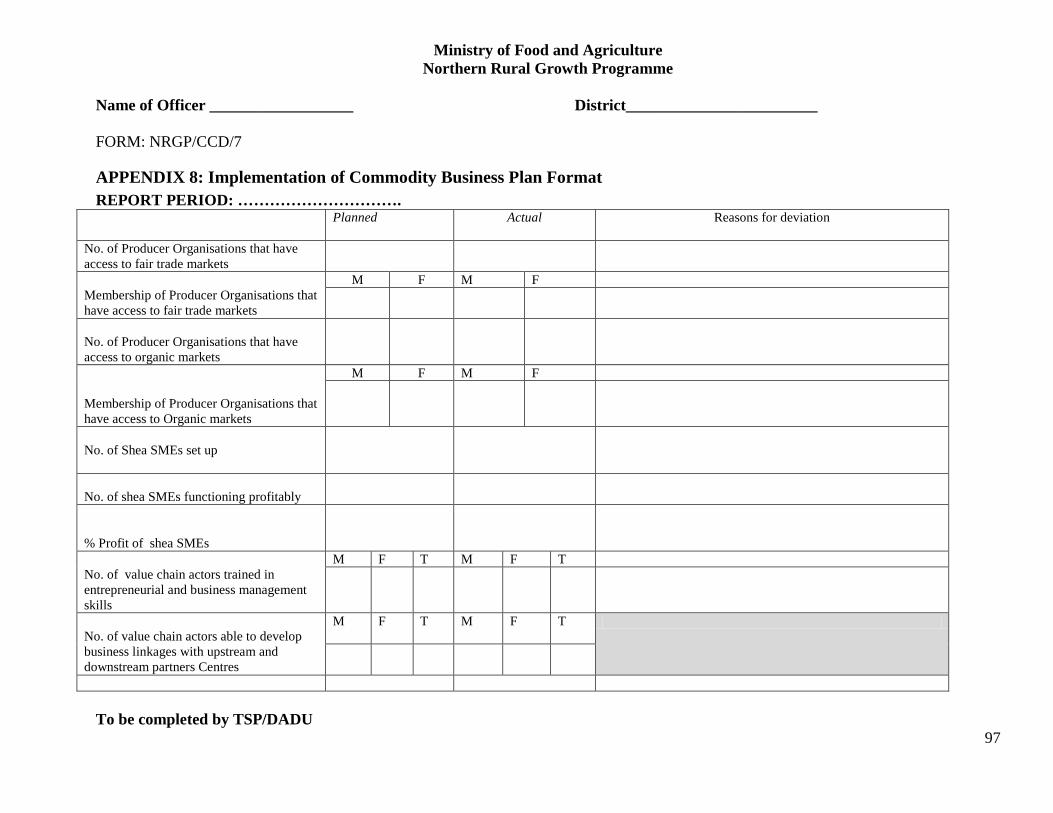
97
Ministry of Food and Agriculture
Northern Rural Growth Programme
Name of Officer __________________ District________________________
FORM: NRGP/CCD/7
APPENDIX 8: Implementation of Commodity Business Plan Format
REPORT PERIOD: ………………………….
Planned Actual Reasons for deviation
No. of Producer Organisations that have
access to fair trade markets
Membership of Producer Organisations that
have access to fair trade markets
M F M F
No. of Producer Organisations that have
access to organic markets
Membership of Producer Organisations that
have access to Organic markets
M F M F
No. of Shea SMEs set up
No. of shea SMEs functioning profitably
% Profit of shea SMEs
No. of value chain actors trained in
entrepreneurial and business management
skills
M F T M F T
No. of value chain actors able to develop
business linkages with upstream and
downstream partners Centres
M F T M F T
To be completed by TSP/DADU
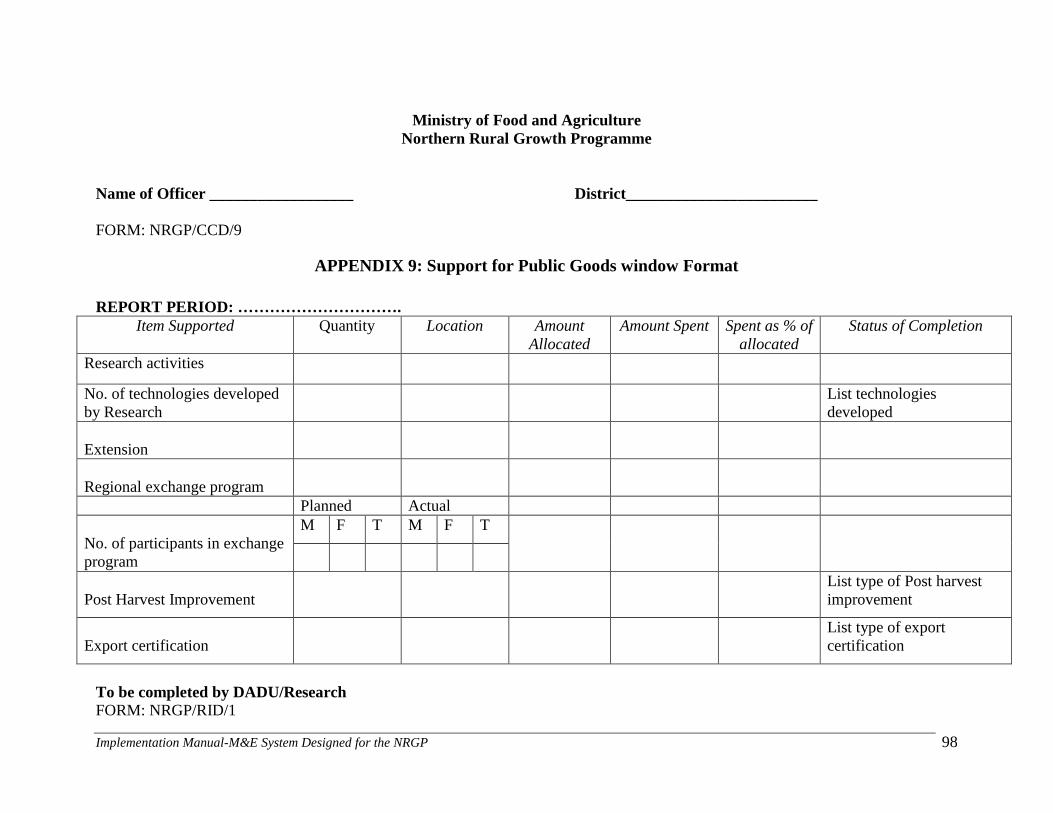
Implementation Manual-M&E System Designed for the NRGP
98
Ministry of Food and Agriculture
Northern Rural Growth Programme
Name of Officer __________________ District________________________
FORM: NRGP/CCD/9
APPENDIX 9: Support for Public Goods window Format
REPORT PERIOD: ………………………….
Item Supported Quantity Location Amount
Allocated
Amount Spent Spent as % of
allocated
Status of Completion
Research activities
No. of technologies developed
by Research
List technologies
developed
Extension
Regional exchange program
Planned Actual
No. of participants in exchange
program
M F T M F T
Post Harvest Improvement
List type of Post harvest
improvement
Export certification
List type of export
certification
To be completed by DADU/Research FORM: NRGP/RID/1
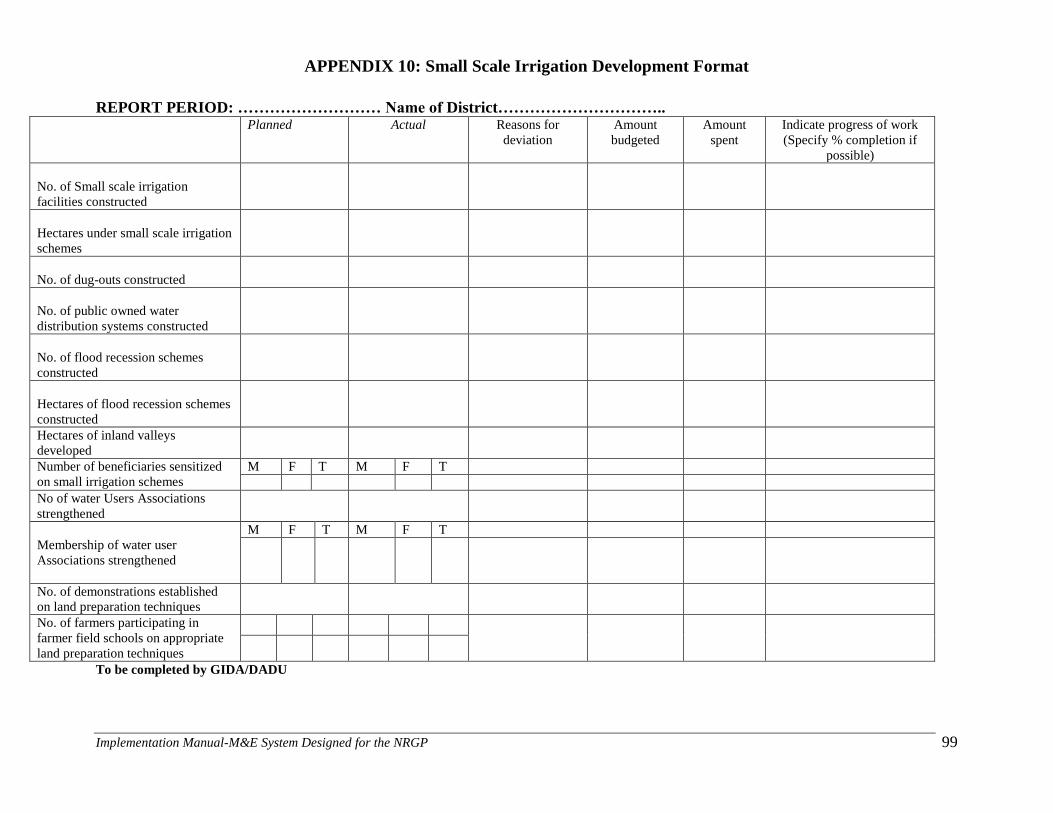
Implementation Manual-M&E System Designed for the NRGP
99
APPENDIX 10: Small Scale Irrigation Development Format
REPORT PERIOD: ……………………… Name of District…………………………..
Planned Actual Reasons for
deviation
Amount
budgeted
Amount
spent
Indicate progress of work
(Specify % completion if
possible)
No. of Small scale irrigation
facilities constructed
Hectares under small scale irrigation
schemes
No. of dug-outs constructed
No. of public owned water
distribution systems constructed
No. of flood recession schemes
constructed
Hectares of flood recession schemes
constructed
Hectares of inland valleys
developed
Number of beneficiaries sensitized
on small irrigation schemes
M F T M F T
No of water Users Associations
strengthened
Membership of water user
Associations strengthened
M F T M F T
No. of demonstrations established
on land preparation techniques
No. of farmers participating in
farmer field schools on appropriate
land preparation techniques
To be completed by GIDA/DADU
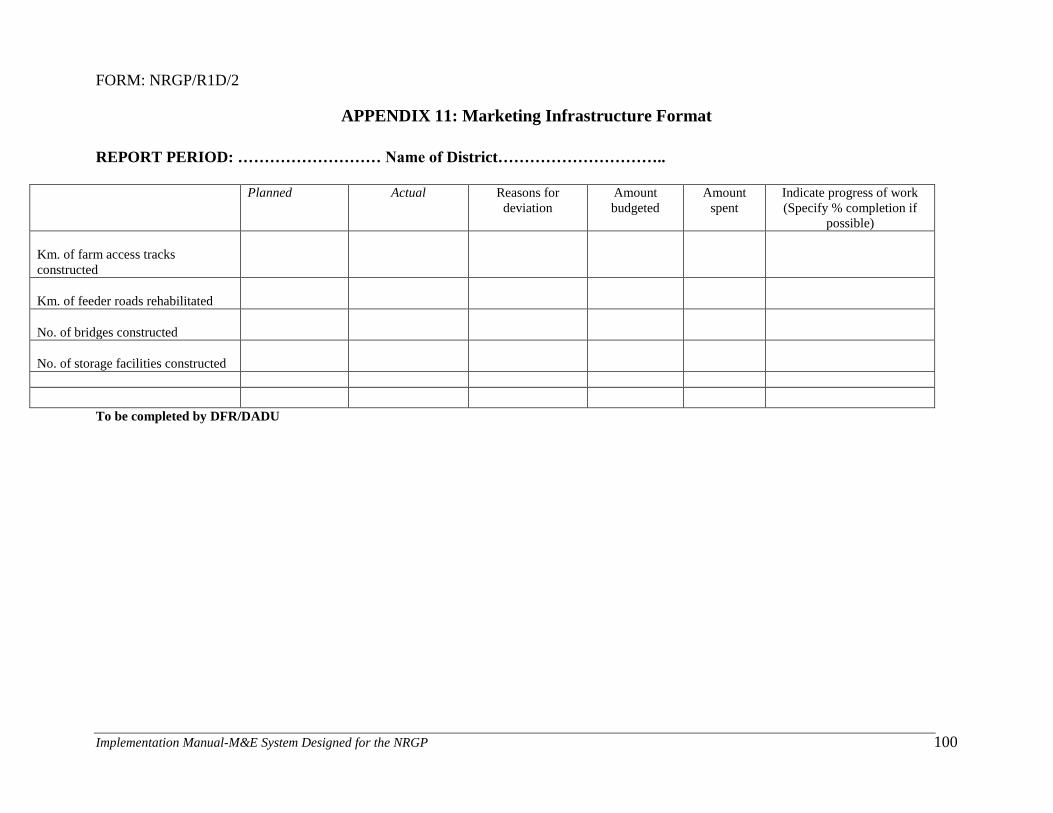
Implementation Manual-M&E System Designed for the NRGP
100
FORM: NRGP/R1D/2
APPENDIX 11: Marketing Infrastructure Format
REPORT PERIOD: ……………………… Name of District…………………………..
Planned Actual Reasons for
deviation
Amount
budgeted
Amount
spent
Indicate progress of work
(Specify % completion if
possible)
Km. of farm access tracks
constructed
Km. of feeder roads rehabilitated
No. of bridges constructed
No. of storage facilities constructed
To be completed by DFR/DADU
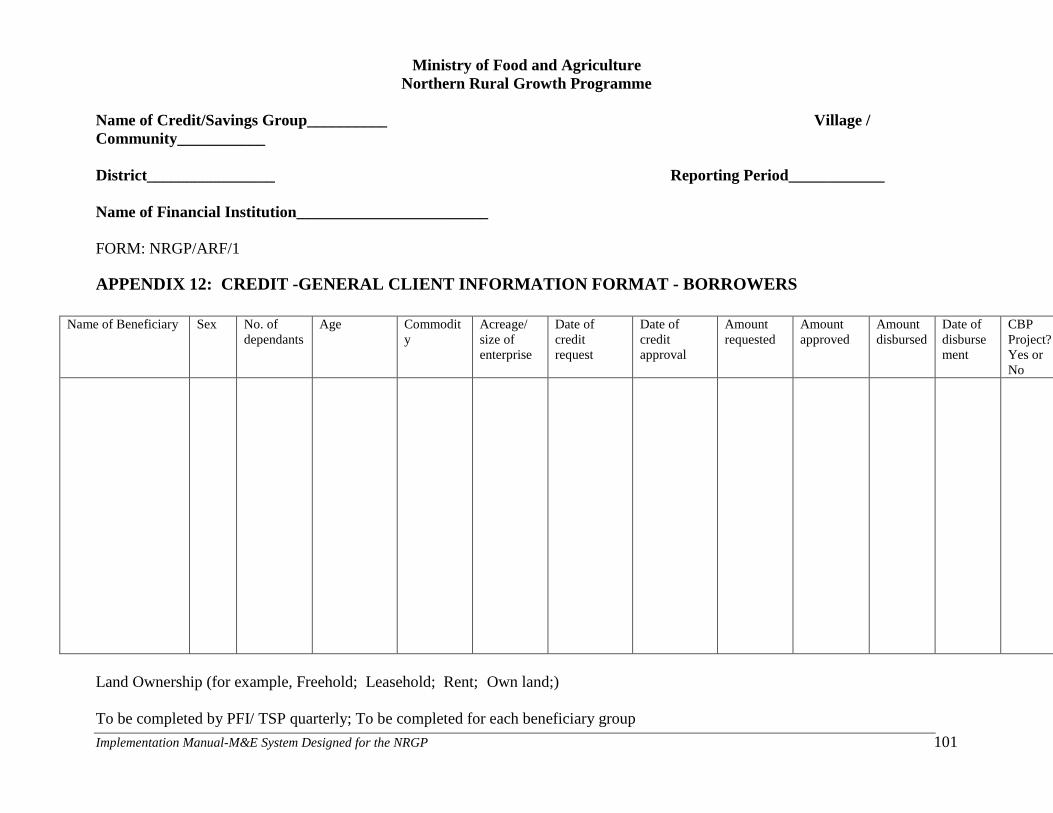
Implementation Manual-M&E System Designed for the NRGP
101
Ministry of Food and Agriculture
Northern Rural Growth Programme
Name of Credit/Savings Group__________ Village /
Community___________
District________________ Reporting Period____________
Name of Financial Institution________________________
FORM: NRGP/ARF/1
APPENDIX 12: CREDIT -GENERAL CLIENT INFORMATION FORMAT - BORROWERS
Name of Beneficiary Sex No. of
dependants
Age Commodit
y
Acreage/
size of
enterprise
Date of
credit
request
Date of
credit
approval
Amount
requested
Amount
approved
Amount
disbursed
Date of
disburse
ment
CBP
Project?
Yes or
No
Land Ownership (for example, Freehold; Leasehold; Rent; Own land;)
To be completed by PFI/ TSP quarterly; To be completed for each beneficiary group
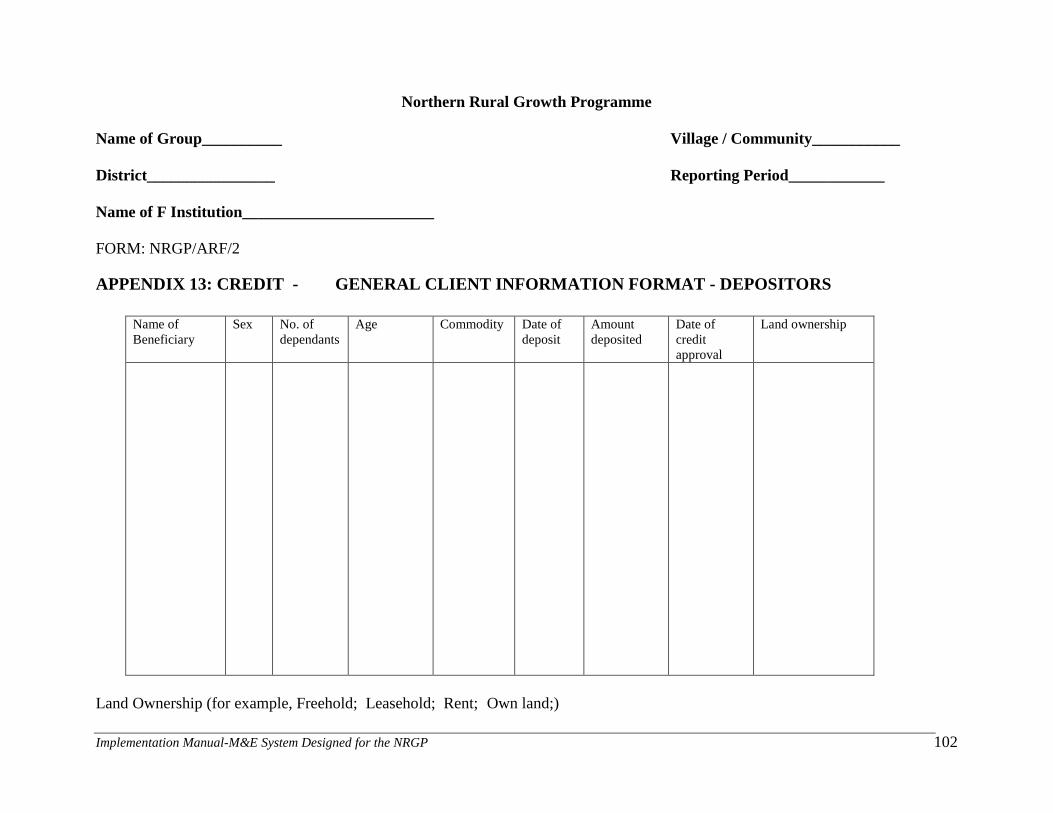
Implementation Manual-M&E System Designed for the NRGP
102
Northern Rural Growth Programme
Name of Group__________ Village / Community___________
District________________ Reporting Period____________
Name of F Institution________________________
FORM: NRGP/ARF/2
APPENDIX 13: CREDIT - GENERAL CLIENT INFORMATION FORMAT - DEPOSITORS
Name of
Beneficiary
Sex No. of
dependants
Age Commodity Date of
deposit
Amount
deposited
Date of
credit
approval
Land ownership
Land Ownership (for example, Freehold; Leasehold; Rent; Own land;)
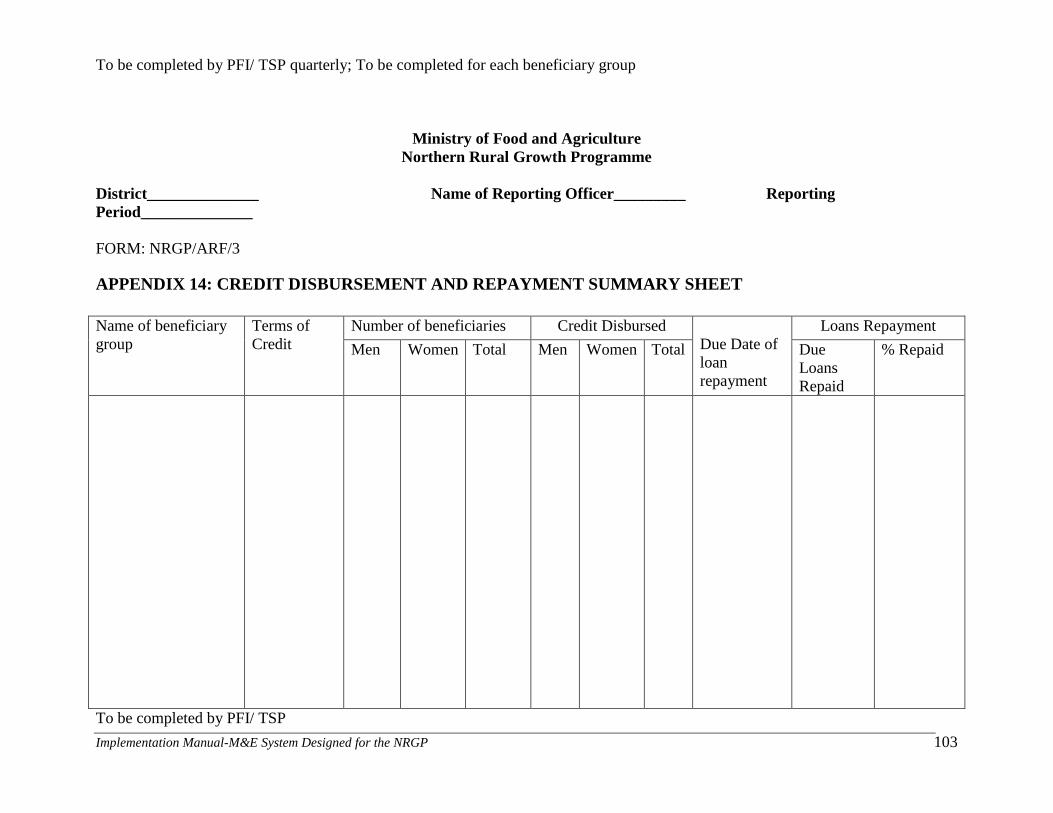
Implementation Manual-M&E System Designed for the NRGP
103
To be completed by PFI/ TSP quarterly; To be completed for each beneficiary group
Ministry of Food and Agriculture
Northern Rural Growth Programme
District______________ Name of Reporting Officer_________ Reporting
Period______________
FORM: NRGP/ARF/3
APPENDIX 14: CREDIT DISBURSEMENT AND REPAYMENT SUMMARY SHEET
Name of beneficiary
group
Terms of
Credit
Number of beneficiaries Credit Disbursed
Due Date of
loan
repayment
Loans Repayment
Men Women Total Men Women Total Due
Loans
Repaid
% Repaid
To be completed by PFI/ TSP
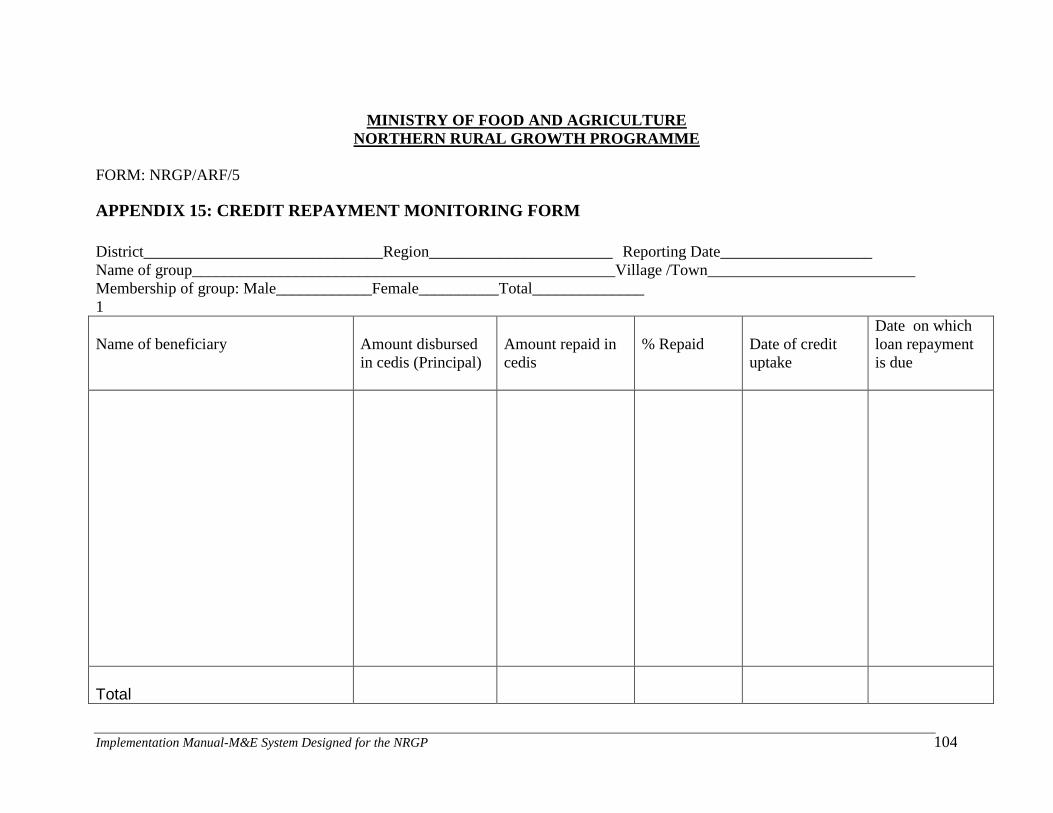
Implementation Manual-M&E System Designed for the NRGP
104
MINISTRY OF FOOD AND AGRICULTURE
NORTHERN RURAL GROWTH PROGRAMME
FORM: NRGP/ARF/5
APPENDIX 15: CREDIT REPAYMENT MONITORING FORM
District______________________________Region_______________________ Reporting Date___________________
Name of group_____________________________________________________Village /Town__________________________
Membership of group: Male____________Female__________Total______________
1
Name of beneficiary
Amount disbursed
in cedis (Principal)
Amount repaid in
cedis
% Repaid
Date of credit
uptake
Date on which
loan repayment
is due
Total
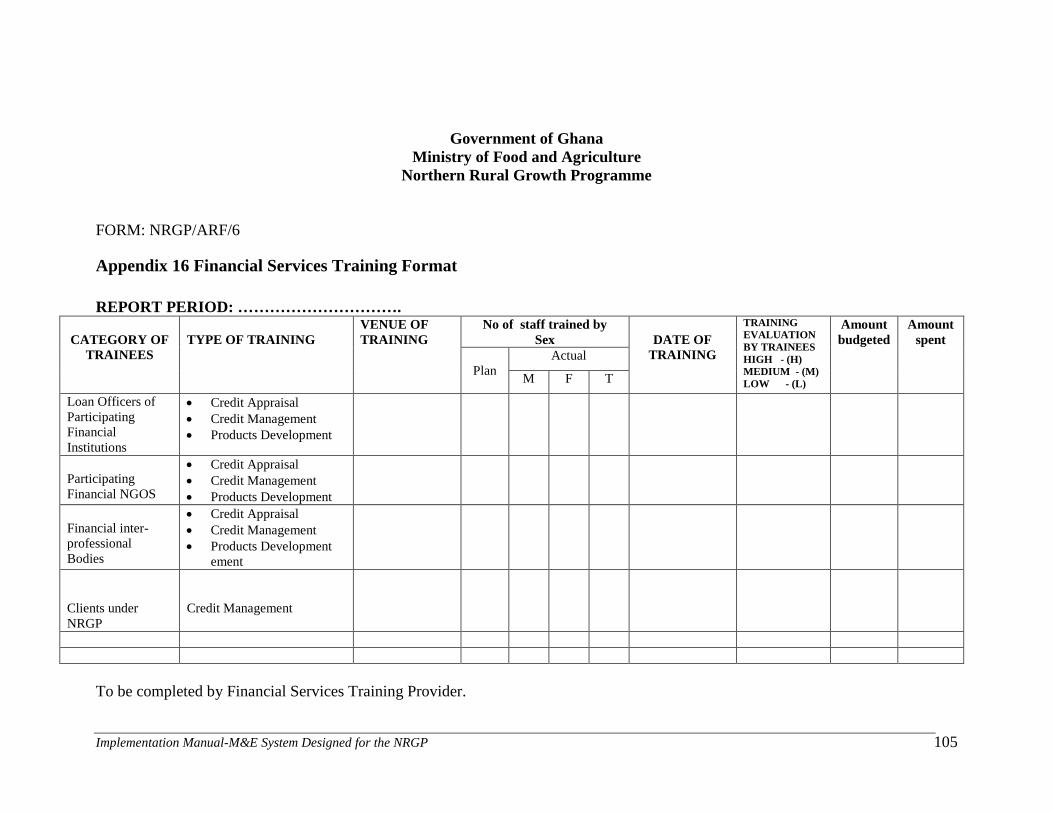
Implementation Manual-M&E System Designed for the NRGP
105
Government of Ghana
Ministry of Food and Agriculture
Northern Rural Growth Programme
FORM: NRGP/ARF/6
Appendix 16 Financial Services Training Format
REPORT PERIOD: ………………………….
CATEGORY OF
TRAINEES
TYPE OF TRAINING
VENUE OF
TRAINING
No of staff trained by
Sex
DATE OF
TRAINING
TRAINING
EVALUATION
BY TRAINEES
HIGH - (H)
MEDIUM - (M)
LOW - (L)
Amount
budgeted
Amount
spent
Plan
Actual
M F T
Loan Officers of
Participating
Financial
Institutions
Credit Appraisal
Credit Management
Products Development
Participating
Financial NGOS
Credit Appraisal
Credit Management
Products Development
Financial inter-
professional
Bodies
Credit Appraisal
Credit Management
Products Development
ement
Clients under
NRGP
Credit Management
To be completed by Financial Services Training Provider.
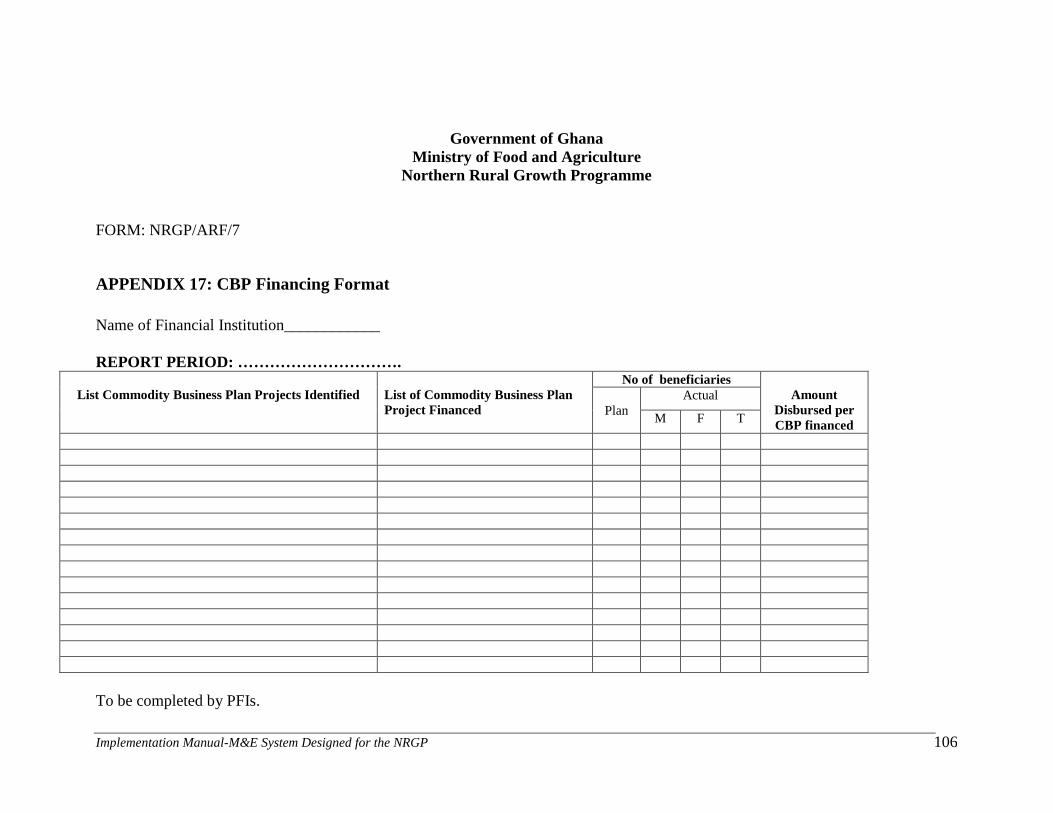
Implementation Manual-M&E System Designed for the NRGP
106
Government of Ghana
Ministry of Food and Agriculture
Northern Rural Growth Programme
FORM: NRGP/ARF/7
APPENDIX 17: CBP Financing Format
Name of Financial Institution____________
REPORT PERIOD: ………………………….
List Commodity Business Plan Projects Identified
List of Commodity Business Plan
Project Financed
No of beneficiaries
Amount
Disbursed per
CBP financed
Plan
Actual
M F T
To be completed by PFIs.
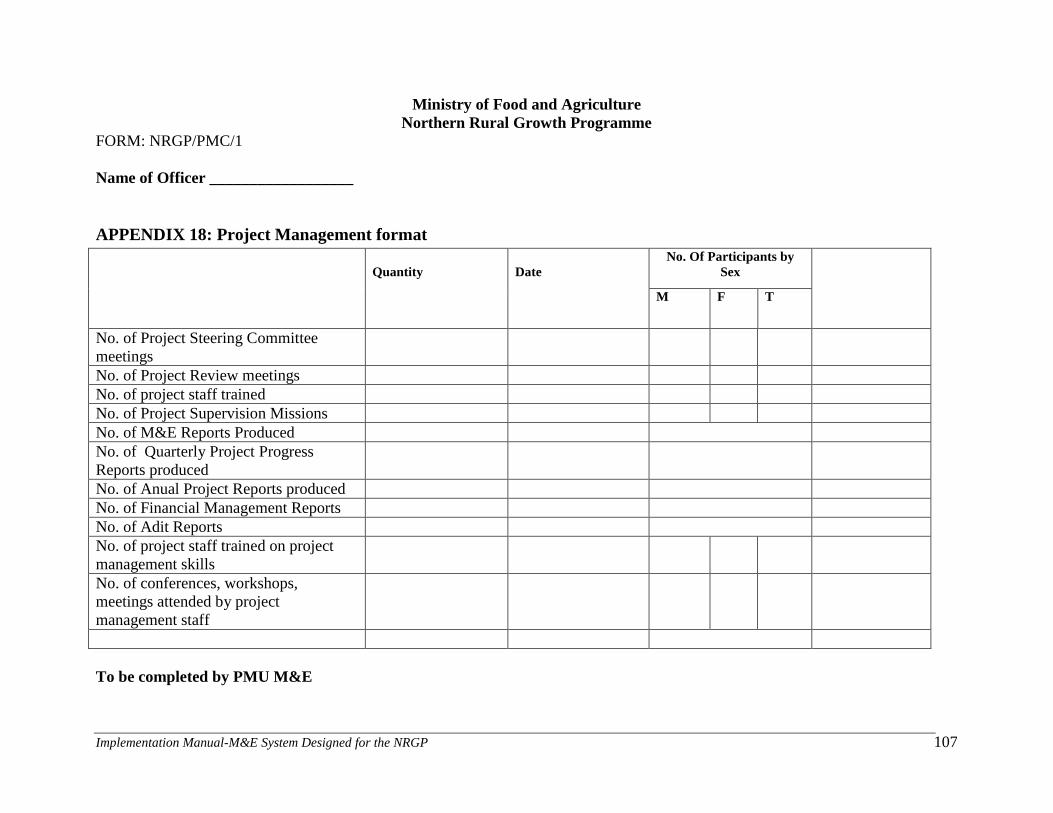
Implementation Manual-M&E System Designed for the NRGP
107
Ministry of Food and Agriculture
Northern Rural Growth Programme
FORM: NRGP/PMC/1
Name of Officer __________________
APPENDIX 18: Project Management format
Quantity
Date
No. Of Participants by
Sex
M F T
No. of Project Steering Committee
meetings
No. of Project Review meetings
No. of project staff trained
No. of Project Supervision Missions
No. of M&E Reports Produced
No. of Quarterly Project Progress
Reports produced
No. of Anual Project Reports produced
No. of Financial Management Reports
No. of Adit Reports
No. of project staff trained on project
management skills
No. of conferences, workshops,
meetings attended by project
management staff
To be completed by PMU M&E
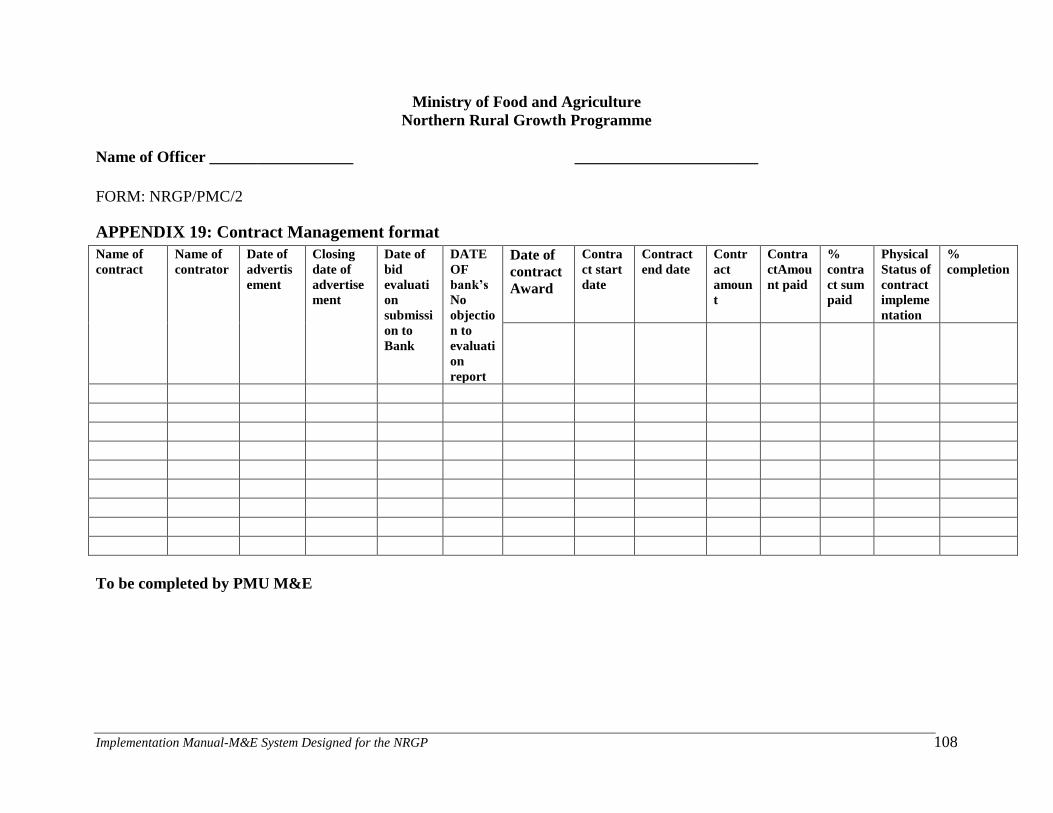
Implementation Manual-M&E System Designed for the NRGP
108
Ministry of Food and Agriculture
Northern Rural Growth Programme
Name of Officer __________________ _______________________
FORM: NRGP/PMC/2
APPENDIX 19: Contract Management format
Name of
contract
Name of
contrator
Date of
advertis
ement
Closing
date of
advertise
ment
Date of
bid
evaluati
on
submissi
on to
Bank
DATE
OF
bank’s
No
objectio
n to
evaluati
on
report
Date of
contract
Award
Contra
ct start
date
Contract
end date
Contr
act
amoun
t
Contra
ctAmou
nt paid
%
contra
ct sum
paid
Physical
Status of
contract
impleme
ntation
%
completion
To be completed by PMU M&E
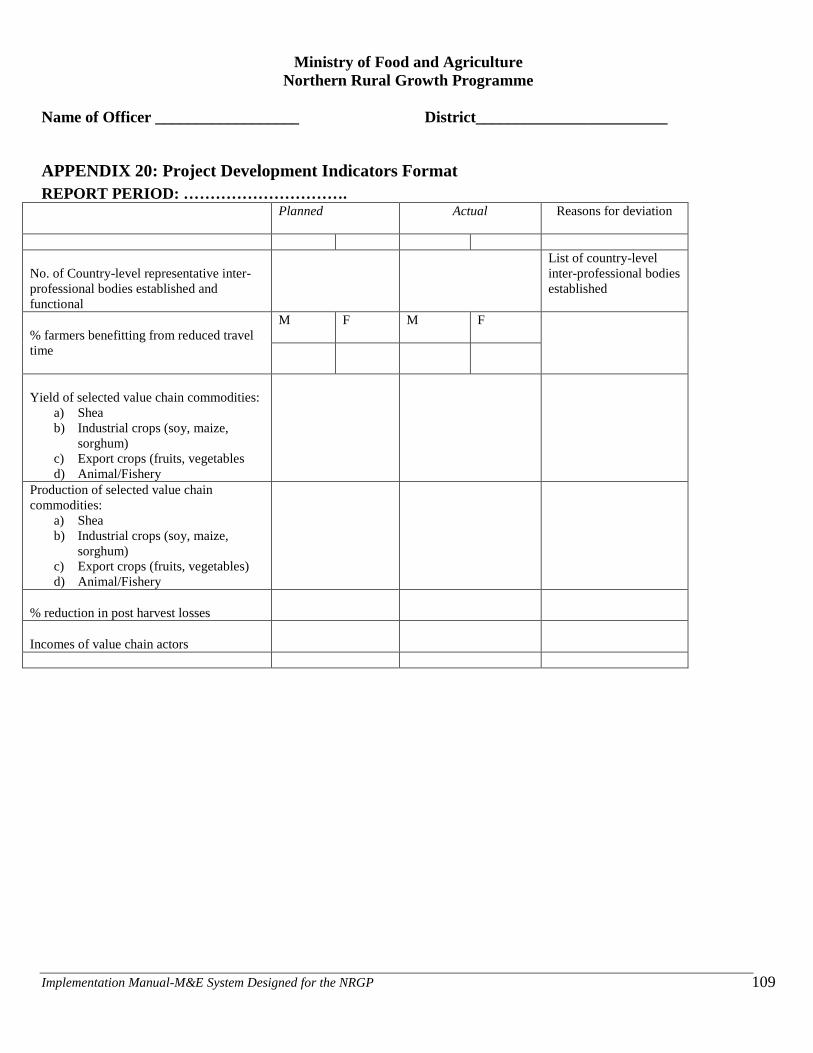
Implementation Manual-M&E System Designed for the NRGP
109
Ministry of Food and Agriculture
Northern Rural Growth Programme
Name of Officer __________________ District________________________
APPENDIX 20: Project Development Indicators Format
REPORT PERIOD: ………………………….
Planned Actual Reasons for deviation
No. of Country-level representative inter-
professional bodies established and
functional
List of country-level
inter-professional bodies
established
% farmers benefitting from reduced travel
time
M F M F
Yield of selected value chain commodities:
a) Shea
b) Industrial crops (soy, maize,
sorghum)
c) Export crops (fruits, vegetables
d) Animal/Fishery
Production of selected value chain
commodities:
a) Shea
b) Industrial crops (soy, maize,
sorghum)
c) Export crops (fruits, vegetables)
d) Animal/Fishery
% reduction in post harvest losses
Incomes of value chain actors
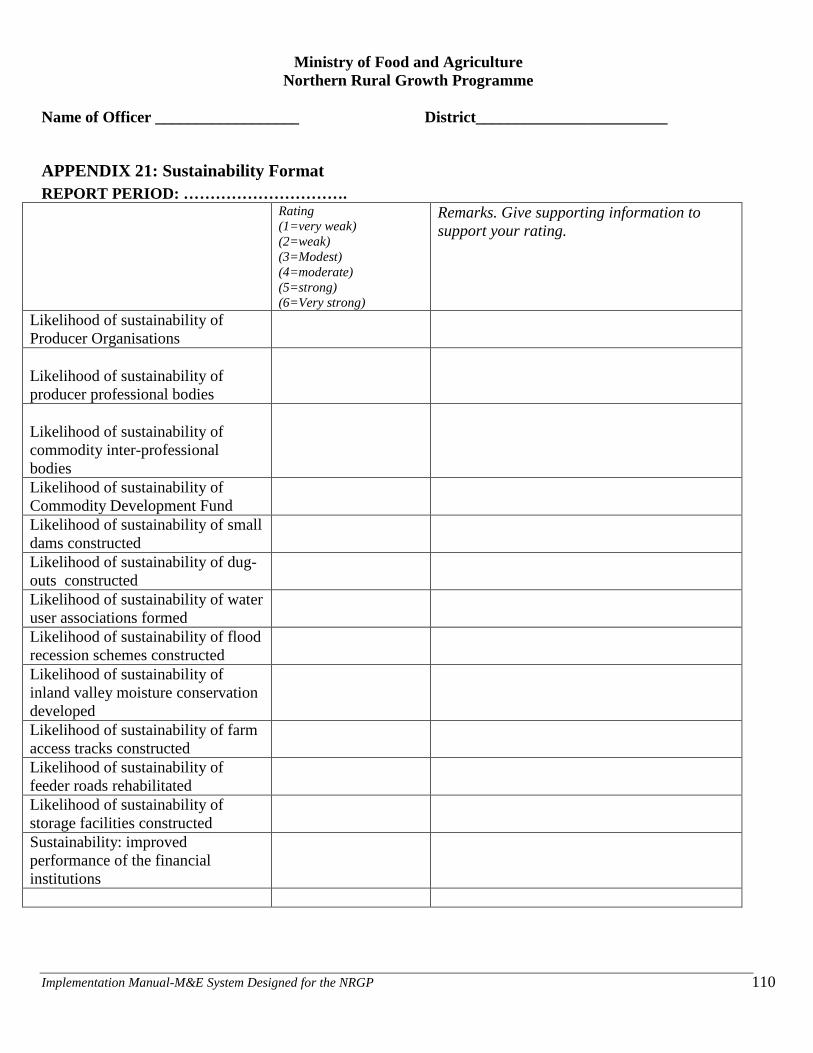
Implementation Manual-M&E System Designed for the NRGP
110
Ministry of Food and Agriculture
Northern Rural Growth Programme
Name of Officer __________________ District________________________
APPENDIX 21: Sustainability Format
REPORT PERIOD: ………………………….
Rating
(1=very weak)
(2=weak)
(3=Modest)
(4=moderate)
(5=strong)
(6=Very strong)
Remarks. Give supporting information to
support your rating.
Likelihood of sustainability of
Producer Organisations
Likelihood of sustainability of
producer professional bodies
Likelihood of sustainability of
commodity inter-professional
bodies
Likelihood of sustainability of
Commodity Development Fund
Likelihood of sustainability of small
dams constructed
Likelihood of sustainability of dug-
outs constructed
Likelihood of sustainability of water
user associations formed
Likelihood of sustainability of flood
recession schemes constructed
Likelihood of sustainability of
inland valley moisture conservation
developed
Likelihood of sustainability of farm
access tracks constructed
Likelihood of sustainability of
feeder roads rehabilitated
Likelihood of sustainability of
storage facilities constructed
Sustainability: improved
performance of the financial
institutions
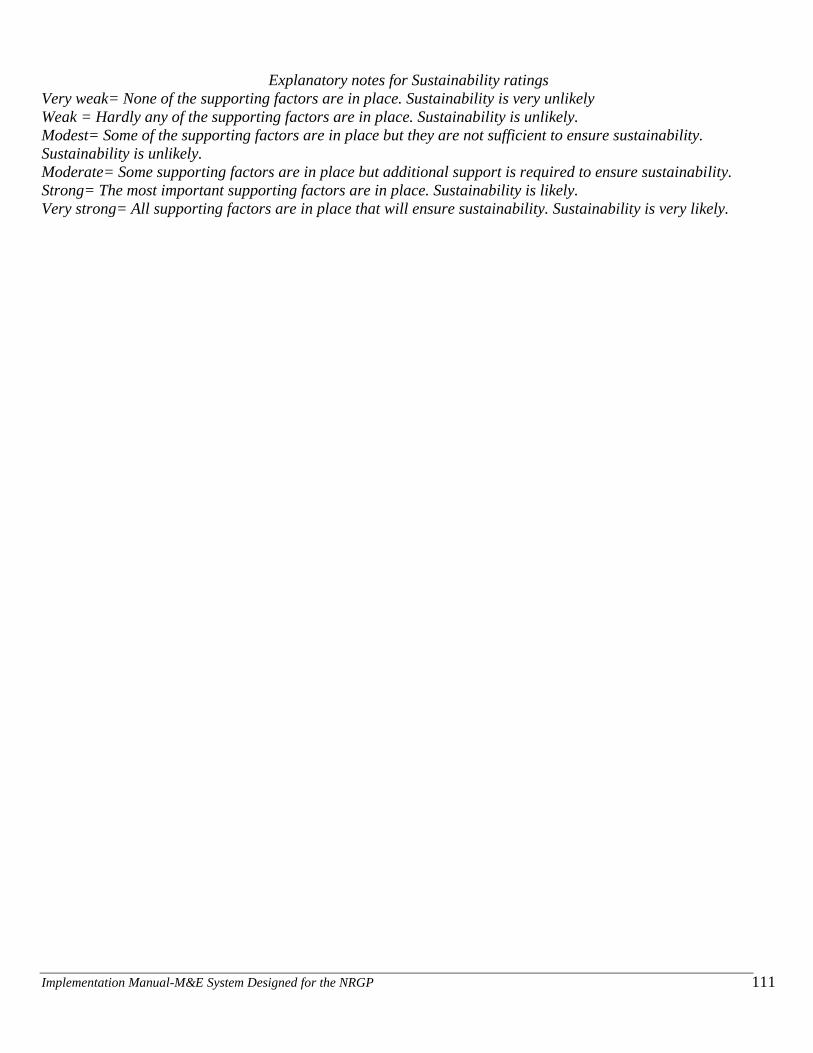
Implementation Manual-M&E System Designed for the NRGP
111
Explanatory notes for Sustainability ratings
Very weak= None of the supporting factors are in place. Sustainability is very unlikely
Weak = Hardly any of the supporting factors are in place. Sustainability is unlikely.
Modest= Some of the supporting factors are in place but they are not sufficient to ensure sustainability.
Sustainability is unlikely.
Moderate= Some supporting factors are in place but additional support is required to ensure sustainability.
Strong= The most important supporting factors are in place. Sustainability is likely.
Very strong= All supporting factors are in place that will ensure sustainability. Sustainability is very likely.
Implementation Manual-M&E System Designed for the NRGP 112