Embed Size (px)
Citation preview
Standards
N.RN.1 Explain how the definition of the meaning of rational exponents follows from extending the properties of integer exponents to those values, allowing for a notation for radicals in terms of rational exponents. For example, we define 51/3 to be the cube root of 5 because we want (51/3)3 = 5(1/3)3 to hold, so (51/3)3 must equal 5. Knowledge Learning Target(s) DART Statements
1. Define radical notation as a convention used to represent rational exponents.
1. I can define radical notation as a convention used to represent rational exponents.
Reasoning Learning Target(s) DART Statements
1. Explain the properties of operations of rational exponents as an extension of the properties of integer exponents.
2. Explain how radical notation, rational
exponents, and properties of integer exponents relate to one another.
Note from Appendix A: In implementing the standards in curriculum, these standards should occur before discussing exponential functions with continuous domains.
1. I will explain the properties of operations of rational exponents as an extension of the properties of integer exponents.
2. I will explain how radical notation, rational exponents, and properties of integer exponents relate to one another.
Performance Skill Learning Target(s) DART Statements
Product Learning Target(s) DART Statements
Standards
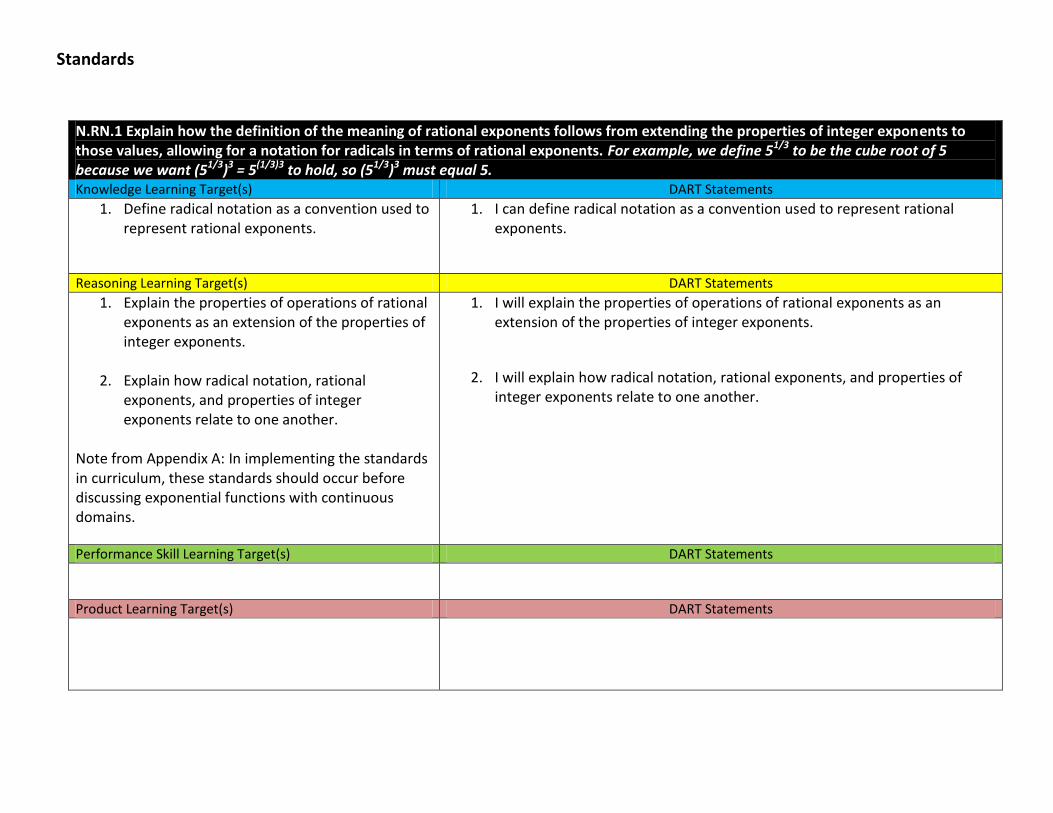
N.RN.2 Rewrite expressions involving radicals and rational exponents using the properties of exponents. Knowledge Learning Target(s) DART Statements
1. Using the properties of exponents, rewrite a radical expression as an expression with a rational exponent.
2. Using the properties of exponents, rewrite an
expression with a rational exponent as a radical expression.
Notes from Appendix A: In implementing the standards in curriculum, these standards should occur before discussing exponential functions with continuous domains.
1. Using the properties of exponents, I can rewrite a radical expression as an expression with a rational exponent.
2. Using the properties of exponents, I can rewrite an expression with a rational exponent as a radical expression.
Reasoning Learning Target(s) DART Statements
Performance Skill Learning Target(s) DART Statements
Product Learning Target(s) DART Statements
Standards
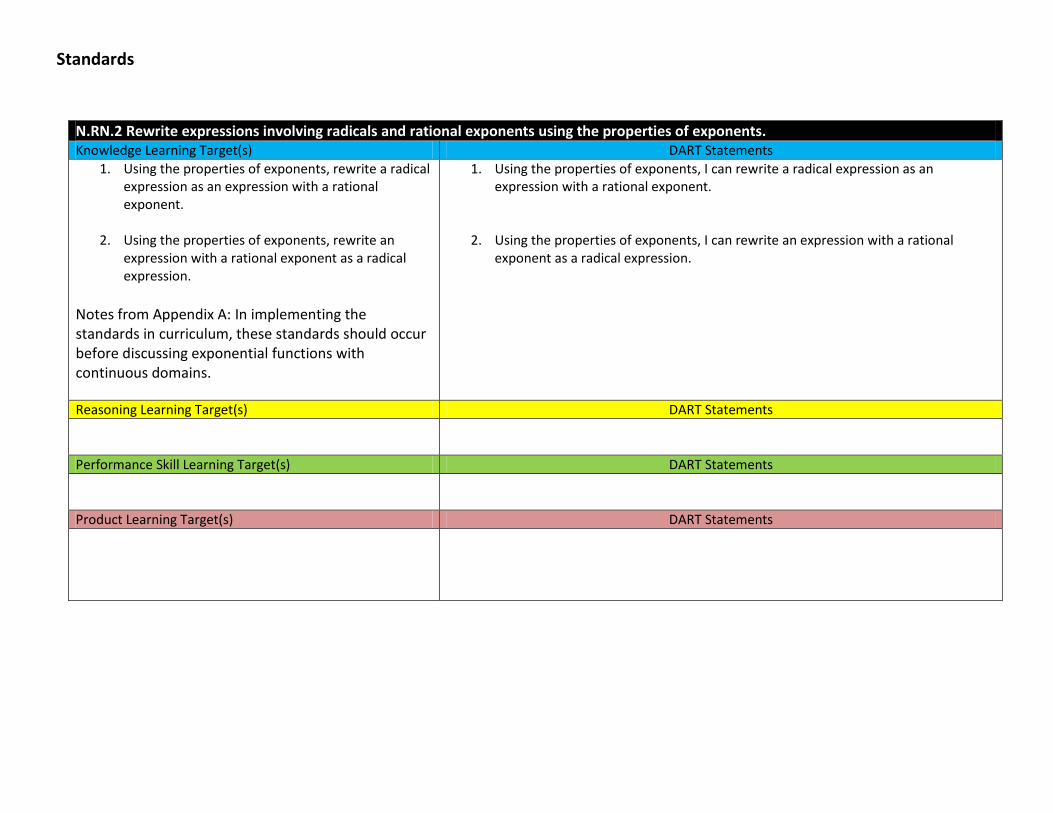
N.RN.3 Explain why the sum or product of two rational numbers is rational; that the sum of a rational number and an irrational number is irrational; and that the product of a nonzero rational number and an irrational number is irrational. Knowledge Learning Target(s) DART Statements
1. Find the sums and products of rational and irrational numbers.
2. Recognize that the sum of a rational number
and an irrational number is irrational.
3. Recognize that the product of a nonzero rational number and an irrational number is irrational.
Note from Appendix A: Connect N.RN.3 to physical situations, e.g., finding the perimeter of a square of area 2.
1. I can find the sums and products of rational and irrational numbers.
2. I can recognize that the sum of a rational number and an irrational number is
irrational.
3. I can recognize that the product of a nonzero rational number and an irrational number is irrational.
Reasoning Learning Target(s) DART Statements
1. Explain why rational numbers are closed under addition or multiplication.
Note from Appendix A: Connect N.RN.3 to physical situations, e.g., finding the perimeter of a square of area 2.
1. I can explain why rational numbers are closed under addition or multiplication.
Performance Skill Learning Target(s) DART Statements
Product Learning Target(s) DART Statements

Standards
N.Q.1 Use units as a way to understand problems and to guide the solution of multi-step problems; choose and interpret units consistently in formulas; choose and interpret the scale and the origin in graphs and data displays. Knowledge Learning Target(s) DART Statements
1. Calculate unit conversions.
2. Recognize units given or needed to solve problem.
1. I can calculate unit conversions.
2. I can recognize units needed to solve a problem.
Reasoning Learning Target(s) DART Statements
1. Use given units and the context of a problem as a way to determine if the solution to a multi-step problem is reasonable (e.g. length problems dictate different units than problems dealing with a measure such as slope)
2. Choose appropriate units to represent a problem
when using formulas or graphing.
3. Interpret units or scales used in formulas or represented in graphs.
4. Use units as a way to understand problems and to guide the solution of multi-step problems.
1. I can recognize units needed to solve a problem.
2. A. I can determine if the solution to a multistep problem is reasonable using correct units in the context of the problem. This means that I can decide if my answer actually matches the problem.
B. I can choose correct units to represent a problem involving a formula.
3. A. I can interpret units or scales in a formula.
B. I can interpret units or scales on a graph.
4. I can use units to understand a real-world problem.
Performance Skill Learning Target(s) DART Statements
Product Learning Target(s) DART Statements
Standards
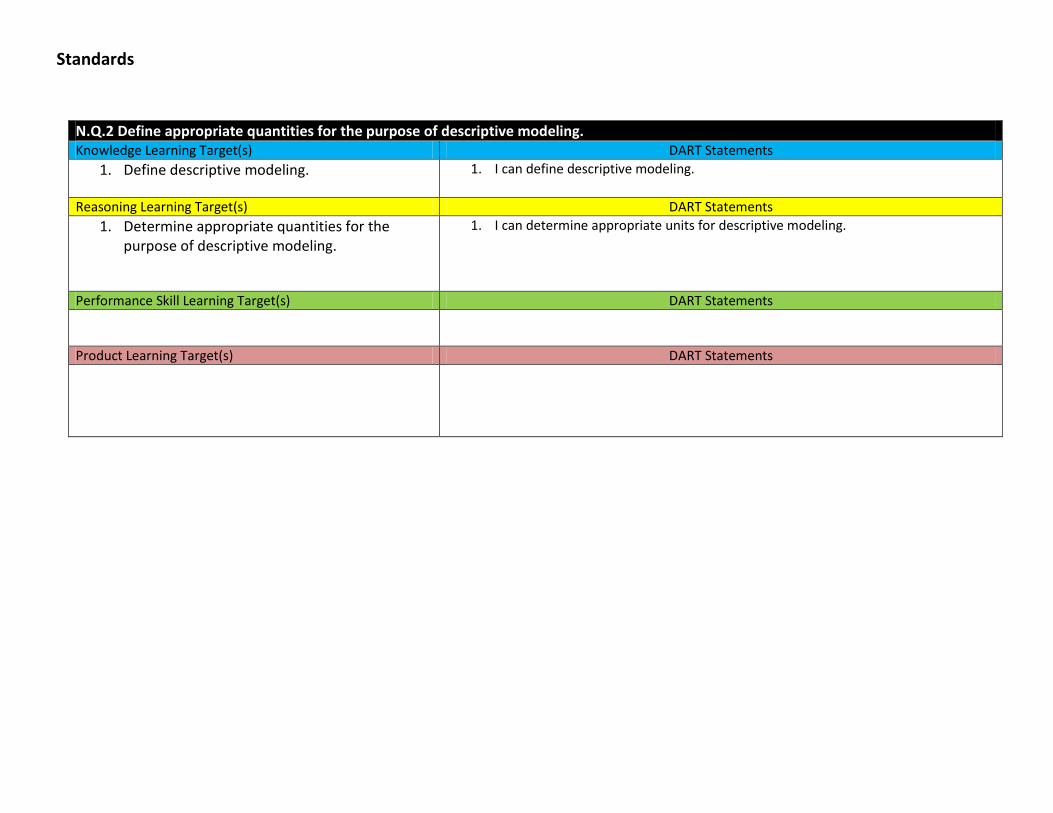
N.Q.2 Define appropriate quantities for the purpose of descriptive modeling. Knowledge Learning Target(s) DART Statements
1. Define descriptive modeling.
1. I can define descriptive modeling.
Reasoning Learning Target(s) DART Statements
1. Determine appropriate quantities for the purpose of descriptive modeling.
1. I can determine appropriate units for descriptive modeling.
Performance Skill Learning Target(s) DART Statements
Product Learning Target(s) DART Statements
Standards
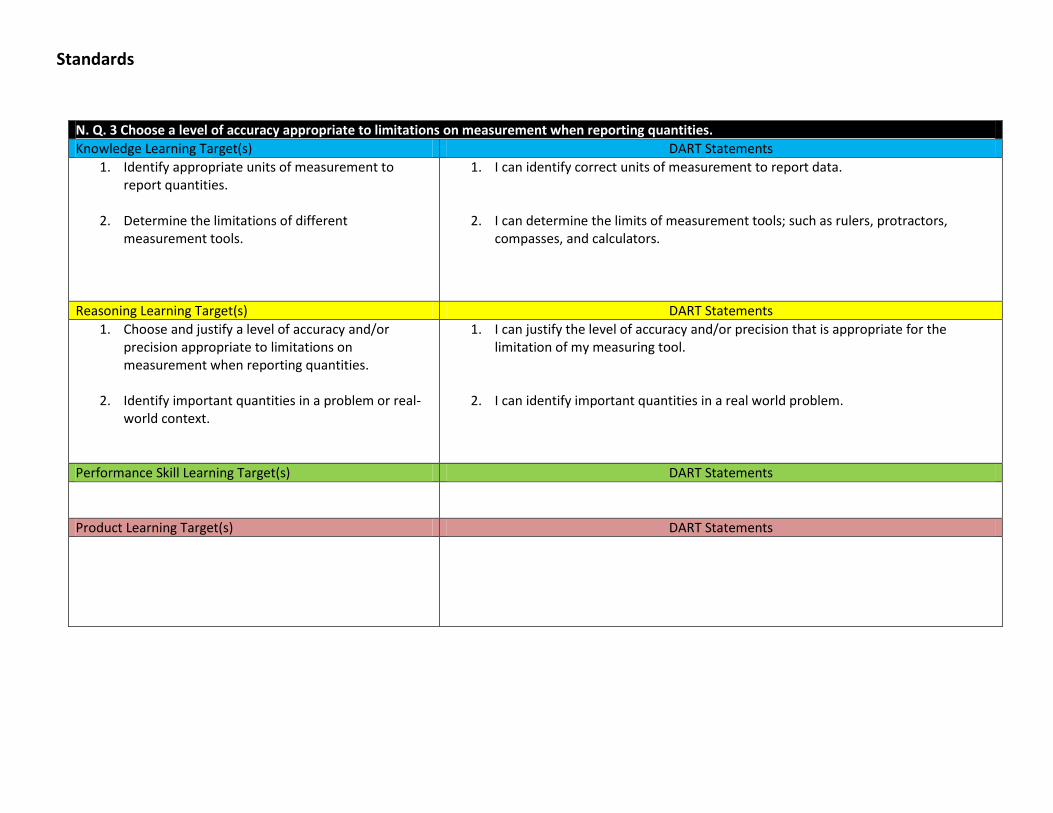
N. Q. 3 Choose a level of accuracy appropriate to limitations on measurement when reporting quantities. Knowledge Learning Target(s) DART Statements
1. Identify appropriate units of measurement to report quantities.
2. Determine the limitations of different
measurement tools.
1. I can identify correct units of measurement to report data.
2. I can determine the limits of measurement tools; such as rulers, protractors, compasses, and calculators.
Reasoning Learning Target(s) DART Statements
1. Choose and justify a level of accuracy and/or precision appropriate to limitations on measurement when reporting quantities.
2. Identify important quantities in a problem or real-
world context.
1. I can justify the level of accuracy and/or precision that is appropriate for the limitation of my measuring tool.
2. I can identify important quantities in a real world problem.
Performance Skill Learning Target(s) DART Statements
Product Learning Target(s) DART Statements
Standards
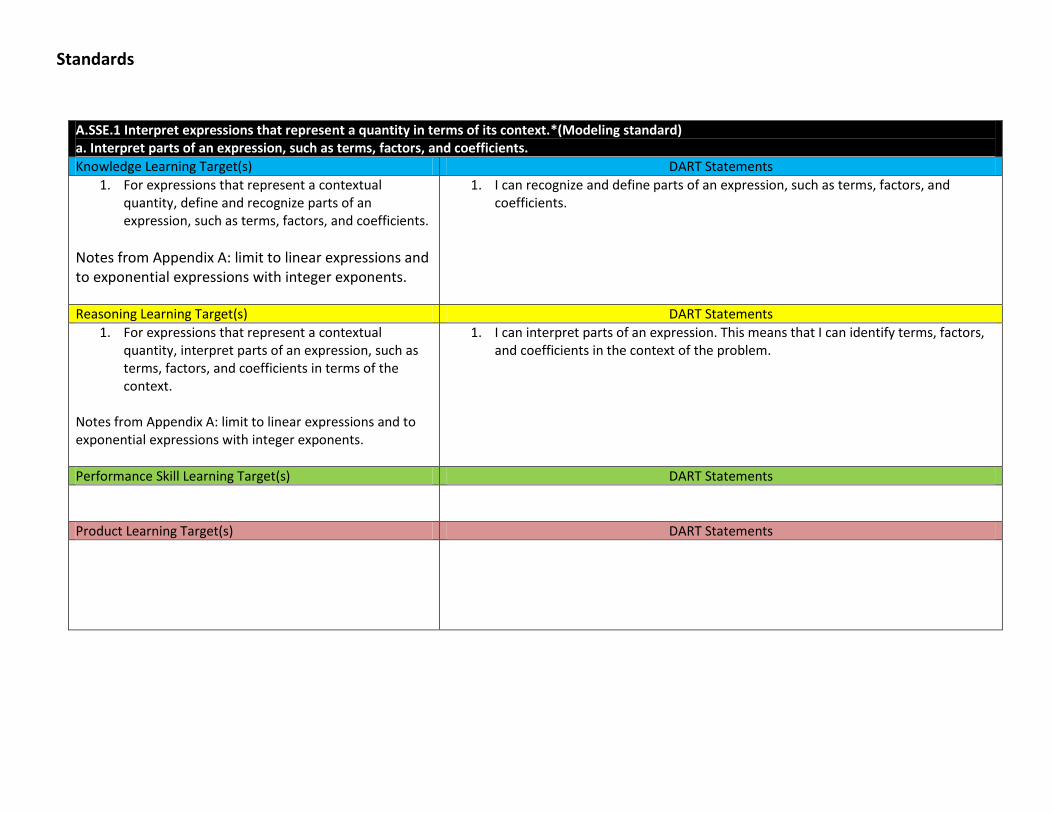
A.SSE.1 Interpret expressions that represent a quantity in terms of its context.*(Modeling standard) a. Interpret parts of an expression, such as terms, factors, and coefficients. Knowledge Learning Target(s) DART Statements
1. For expressions that represent a contextual quantity, define and recognize parts of an expression, such as terms, factors, and coefficients.
Notes from Appendix A: limit to linear expressions and to exponential expressions with integer exponents.
1. I can recognize and define parts of an expression, such as terms, factors, and coefficients.
Reasoning Learning Target(s) DART Statements
1. For expressions that represent a contextual quantity, interpret parts of an expression, such as terms, factors, and coefficients in terms of the context.
Notes from Appendix A: limit to linear expressions and to exponential expressions with integer exponents.
1. I can interpret parts of an expression. This means that I can identify terms, factors, and coefficients in the context of the problem.
Performance Skill Learning Target(s) DART Statements
Product Learning Target(s) DART Statements
Standards
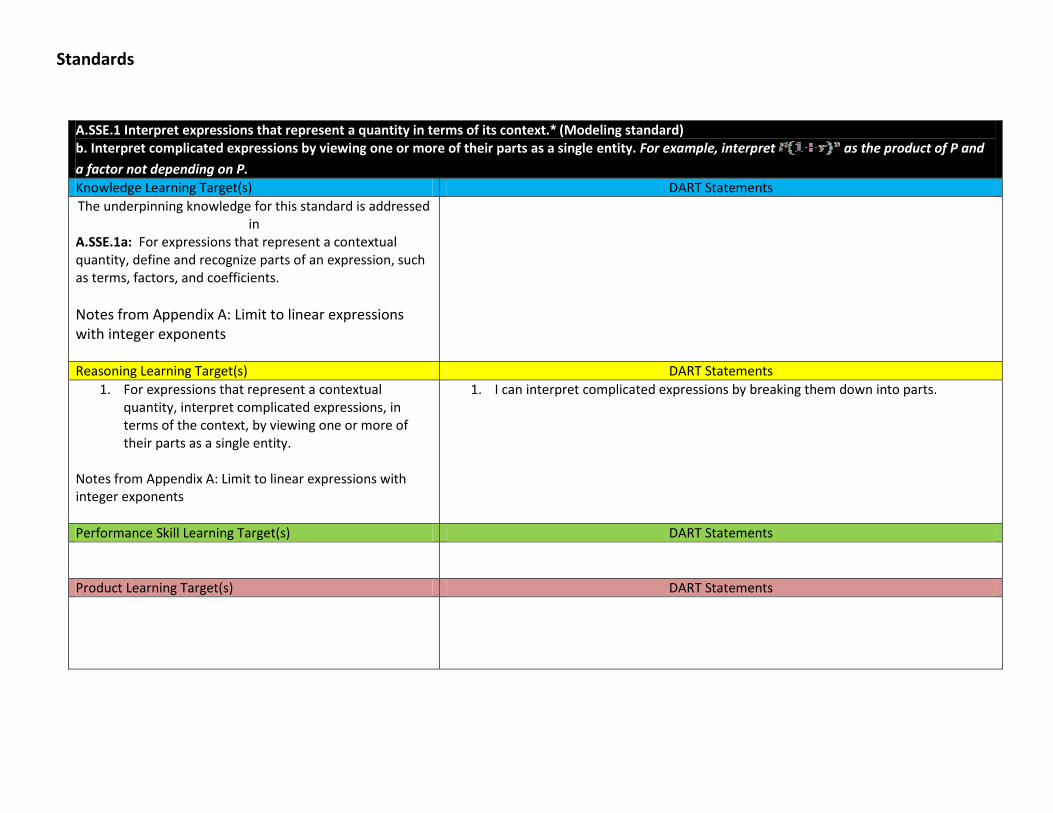
A.SSE.1 Interpret expressions that represent a quantity in terms of its context.* (Modeling standard) b. Interpret complicated expressions by viewing one or more of their parts as a single entity. For example, interpret as the product of P and
a factor not depending on P. Knowledge Learning Target(s) DART Statements
The underpinning knowledge for this standard is addressed in
A.SSE.1a: For expressions that represent a contextual quantity, define and recognize parts of an expression, such as terms, factors, and coefficients.
Notes from Appendix A: Limit to linear expressions with integer exponents
Reasoning Learning Target(s) DART Statements
1. For expressions that represent a contextual quantity, interpret complicated expressions, in terms of the context, by viewing one or more of their parts as a single entity.
Notes from Appendix A: Limit to linear expressions with integer exponents
1. I can interpret complicated expressions by breaking them down into parts.
Performance Skill Learning Target(s) DART Statements
Product Learning Target(s) DART Statements
Standards
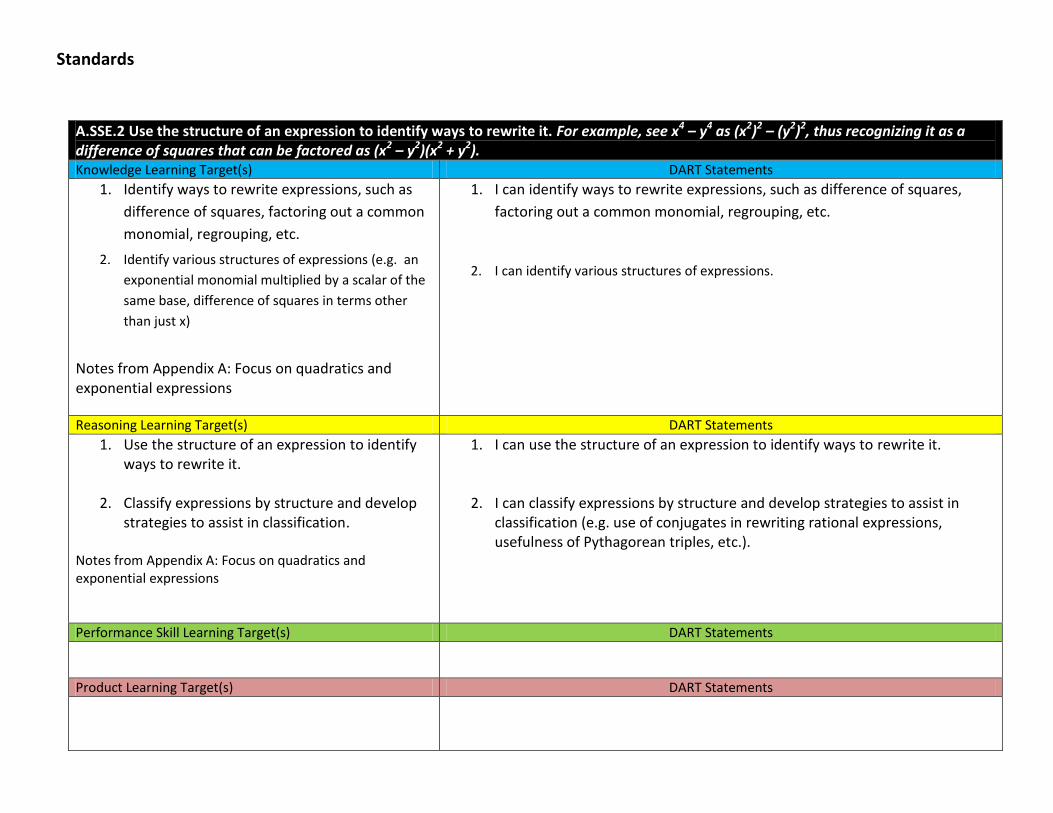
A.SSE.2 Use the structure of an expression to identify ways to rewrite it. For example, see x4 – y4 as (x2)2 – (y2)2, thus recognizing it as a difference of squares that can be factored as (x2 – y2)(x2 + y2). Knowledge Learning Target(s) DART Statements
1. Identify ways to rewrite expressions, such as
difference of squares, factoring out a common
monomial, regrouping, etc.
2. Identify various structures of expressions (e.g. an
exponential monomial multiplied by a scalar of the
same base, difference of squares in terms other
than just x)
Notes from Appendix A: Focus on quadratics and exponential expressions
1. I can identify ways to rewrite expressions, such as difference of squares,
factoring out a common monomial, regrouping, etc.
2. I can identify various structures of expressions.
Reasoning Learning Target(s) DART Statements
1. Use the structure of an expression to identify ways to rewrite it.
2. Classify expressions by structure and develop
strategies to assist in classification. Notes from Appendix A: Focus on quadratics and exponential expressions
1. I can use the structure of an expression to identify ways to rewrite it.
2. I can classify expressions by structure and develop strategies to assist in classification (e.g. use of conjugates in rewriting rational expressions, usefulness of Pythagorean triples, etc.).
Performance Skill Learning Target(s) DART Statements
Product Learning Target(s) DART Statements
Standards
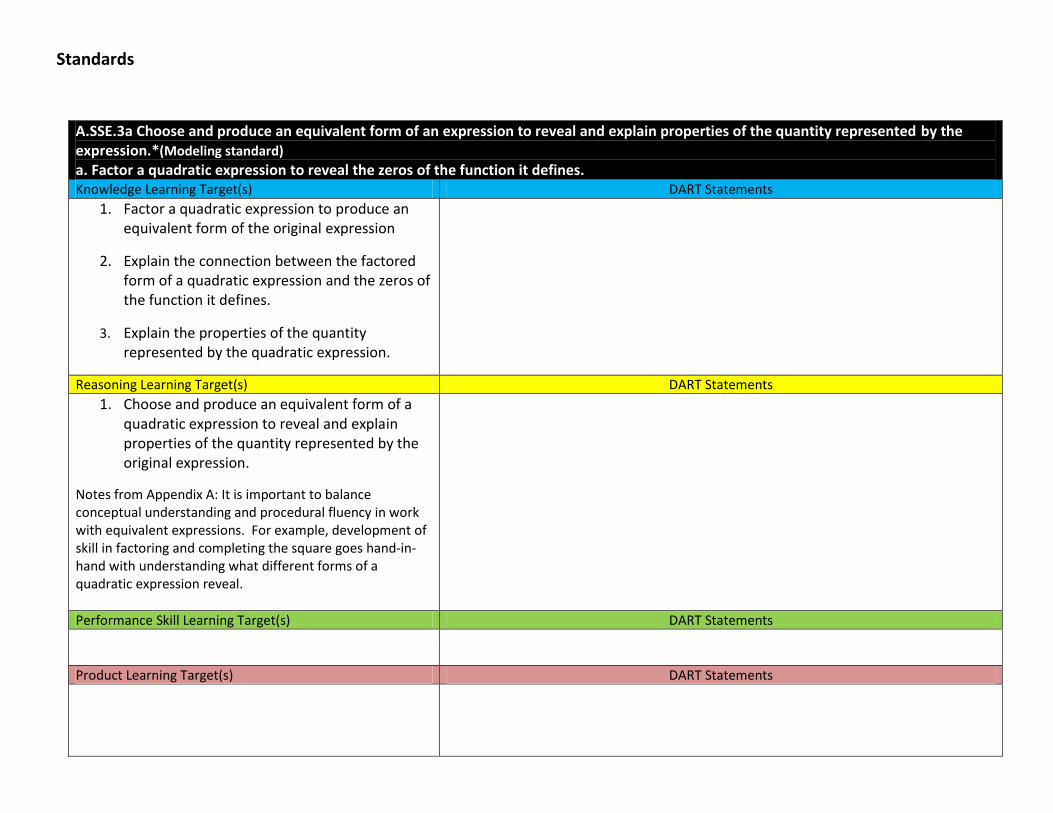
A.SSE.3a Choose and produce an equivalent form of an expression to reveal and explain properties of the quantity represented by the expression.*(Modeling standard) a. Factor a quadratic expression to reveal the zeros of the function it defines. Knowledge Learning Target(s) DART Statements
1. Factor a quadratic expression to produce an equivalent form of the original expression
2. Explain the connection between the factored form of a quadratic expression and the zeros of the function it defines.
3. Explain the properties of the quantity represented by the quadratic expression.
Reasoning Learning Target(s) DART Statements
1. Choose and produce an equivalent form of a quadratic expression to reveal and explain properties of the quantity represented by the original expression.
Notes from Appendix A: It is important to balance conceptual understanding and procedural fluency in work with equivalent expressions. For example, development of skill in factoring and completing the square goes hand-in-hand with understanding what different forms of a quadratic expression reveal.
Performance Skill Learning Target(s) DART Statements
Product Learning Target(s) DART Statements
Standards
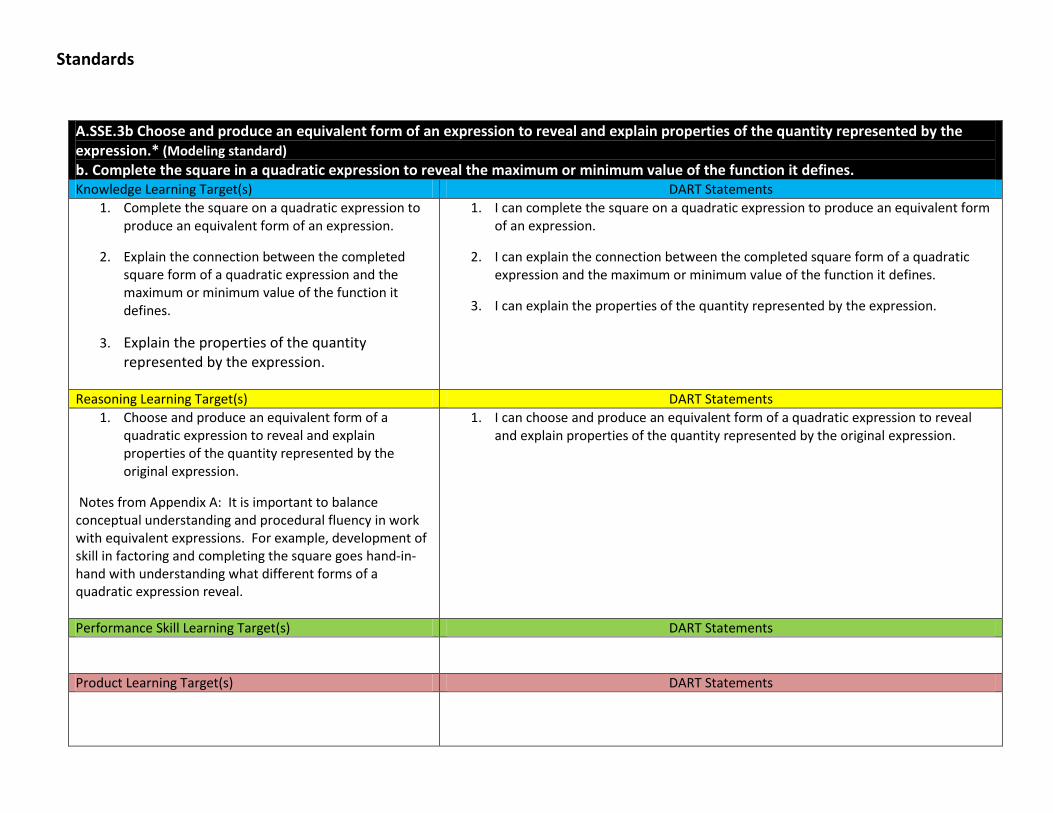
A.SSE.3b Choose and produce an equivalent form of an expression to reveal and explain properties of the quantity represented by the expression.* (Modeling standard) b. Complete the square in a quadratic expression to reveal the maximum or minimum value of the function it defines. Knowledge Learning Target(s) DART Statements
1. Complete the square on a quadratic expression to produce an equivalent form of an expression.
2. Explain the connection between the completed square form of a quadratic expression and the maximum or minimum value of the function it defines.
3. Explain the properties of the quantity represented by the expression.
1. I can complete the square on a quadratic expression to produce an equivalent form of an expression.
2. I can explain the connection between the completed square form of a quadratic expression and the maximum or minimum value of the function it defines.
3. I can explain the properties of the quantity represented by the expression.
Reasoning Learning Target(s) DART Statements
1. Choose and produce an equivalent form of a quadratic expression to reveal and explain properties of the quantity represented by the original expression.
Notes from Appendix A: It is important to balance conceptual understanding and procedural fluency in work with equivalent expressions. For example, development of skill in factoring and completing the square goes hand-in-hand with understanding what different forms of a quadratic expression reveal.
1. I can choose and produce an equivalent form of a quadratic expression to reveal and explain properties of the quantity represented by the original expression.
Performance Skill Learning Target(s) DART Statements
Product Learning Target(s) DART Statements
Standards
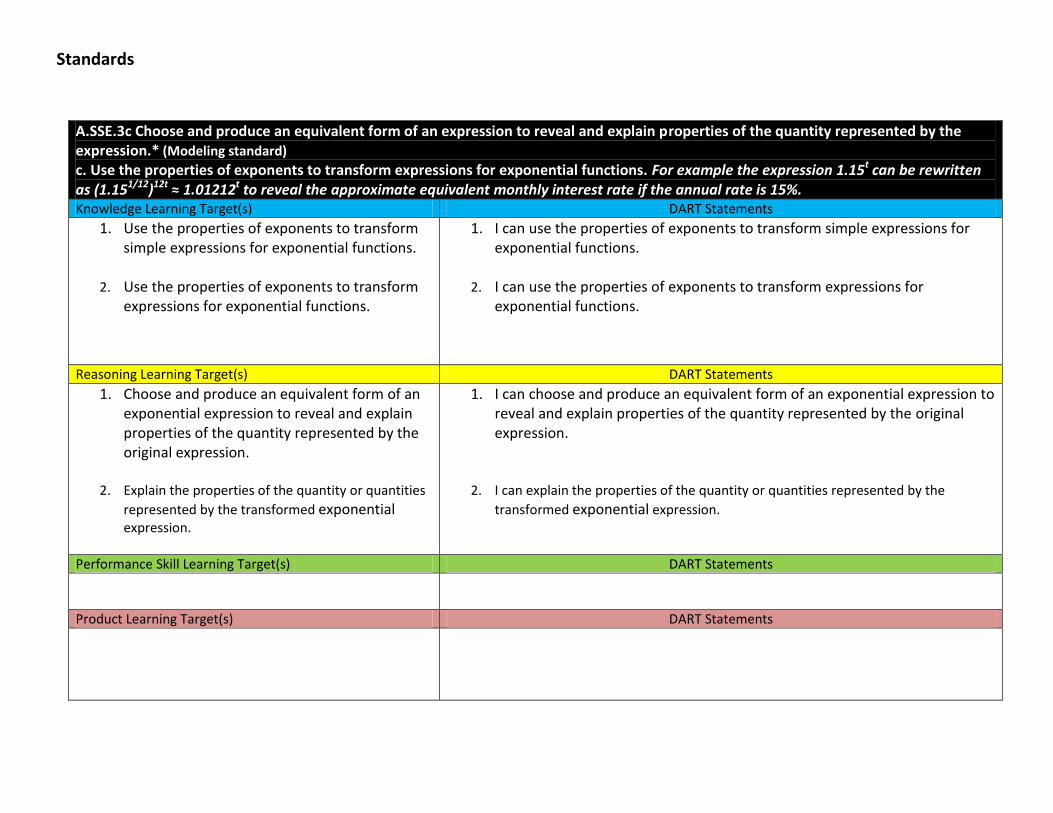
A.SSE.3c Choose and produce an equivalent form of an expression to reveal and explain properties of the quantity represented by the expression.* (Modeling standard) c. Use the properties of exponents to transform expressions for exponential functions. For example the expression 1.15t can be rewritten as (1.151/12)12t ≈ 1.01212t to reveal the approximate equivalent monthly interest rate if the annual rate is 15%. Knowledge Learning Target(s) DART Statements
1. Use the properties of exponents to transform simple expressions for exponential functions.
2. Use the properties of exponents to transform
expressions for exponential functions.
1. I can use the properties of exponents to transform simple expressions for exponential functions.
2. I can use the properties of exponents to transform expressions for
exponential functions.
Reasoning Learning Target(s) DART Statements
1. Choose and produce an equivalent form of an exponential expression to reveal and explain properties of the quantity represented by the original expression.
2. Explain the properties of the quantity or quantities
represented by the transformed exponential expression.
1. I can choose and produce an equivalent form of an exponential expression to reveal and explain properties of the quantity represented by the original expression.
2. I can explain the properties of the quantity or quantities represented by the
transformed exponential expression.
Performance Skill Learning Target(s) DART Statements
Product Learning Target(s) DART Statements
Standards
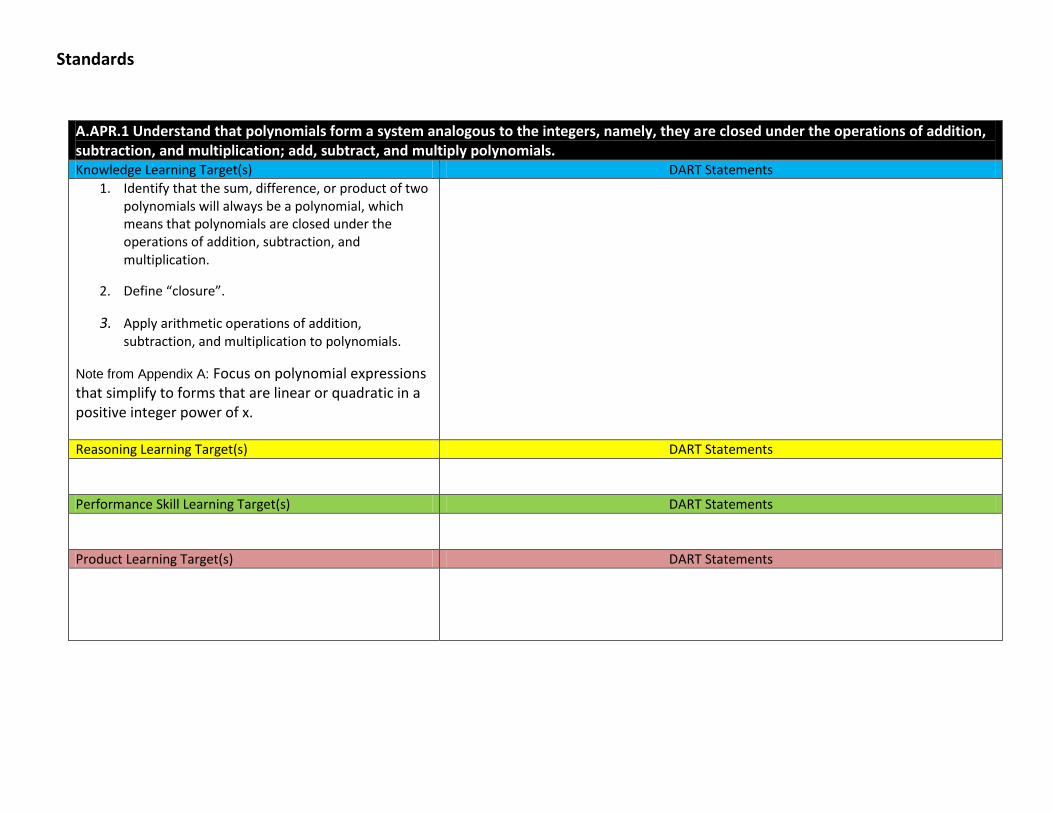
A.APR.1 Understand that polynomials form a system analogous to the integers, namely, they are closed under the operations of addition, subtraction, and multiplication; add, subtract, and multiply polynomials. Knowledge Learning Target(s) DART Statements
1. Identify that the sum, difference, or product of two polynomials will always be a polynomial, which means that polynomials are closed under the operations of addition, subtraction, and multiplication.
2. Define “closure”.
3. Apply arithmetic operations of addition, subtraction, and multiplication to polynomials.
Note from Appendix A: Focus on polynomial expressions that simplify to forms that are linear or quadratic in a positive integer power of x.
Reasoning Learning Target(s) DART Statements
Performance Skill Learning Target(s) DART Statements
Product Learning Target(s) DART Statements
Standards
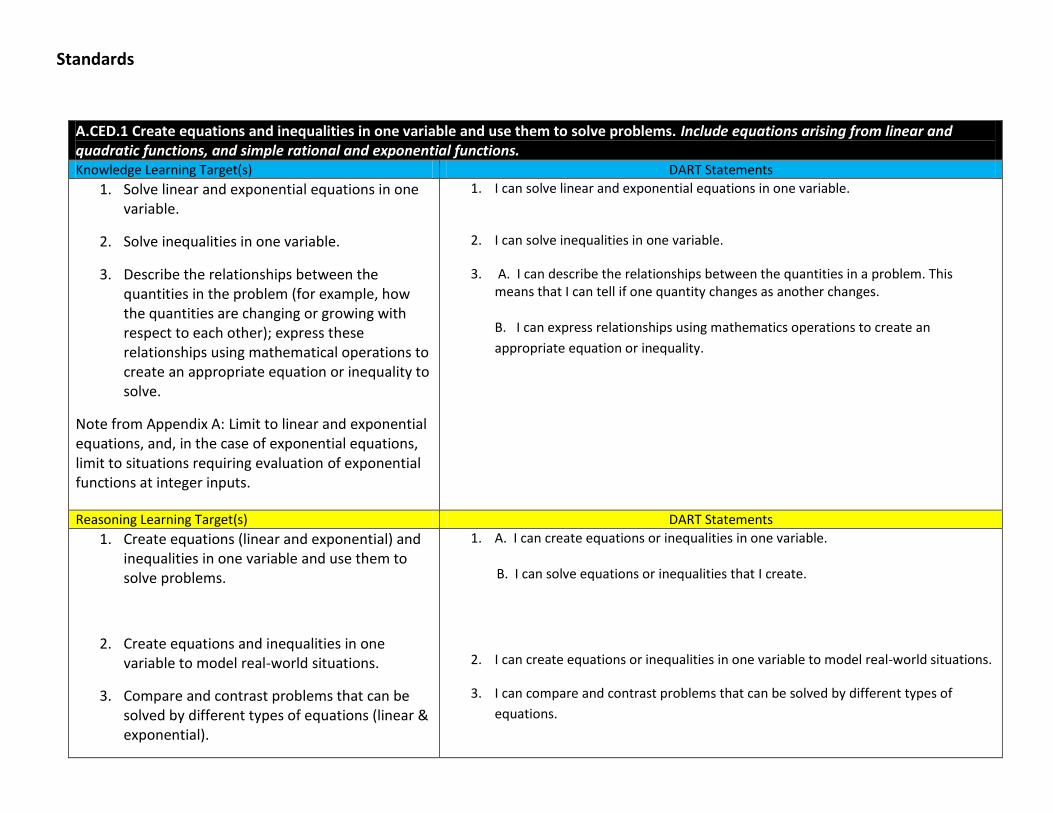
A.CED.1 Create equations and inequalities in one variable and use them to solve problems. Include equations arising from linear and quadratic functions, and simple rational and exponential functions. Knowledge Learning Target(s) DART Statements
1. Solve linear and exponential equations in one variable.
2. Solve inequalities in one variable.
3. Describe the relationships between the quantities in the problem (for example, how the quantities are changing or growing with respect to each other); express these relationships using mathematical operations to create an appropriate equation or inequality to solve.
Note from Appendix A: Limit to linear and exponential equations, and, in the case of exponential equations, limit to situations requiring evaluation of exponential functions at integer inputs.
1. I can solve linear and exponential equations in one variable.
2. I can solve inequalities in one variable.
3. A. I can describe the relationships between the quantities in a problem. This means that I can tell if one quantity changes as another changes.
B. I can express relationships using mathematics operations to create an
appropriate equation or inequality.
Reasoning Learning Target(s) DART Statements
1. Create equations (linear and exponential) and inequalities in one variable and use them to solve problems.
2. Create equations and inequalities in one variable to model real-world situations.
3. Compare and contrast problems that can be solved by different types of equations (linear & exponential).
1. A. I can create equations or inequalities in one variable. B. I can solve equations or inequalities that I create.
2. I can create equations or inequalities in one variable to model real-world situations.
3. I can compare and contrast problems that can be solved by different types of
equations.
Standards
Note from Appendix A: In the case of exponential equations, limit to situations requiring evaluation of exponential functions at integer inputs.
Performance Skill Learning Target(s) DART Statements
Product Learning Target(s) DART Statements
Standards
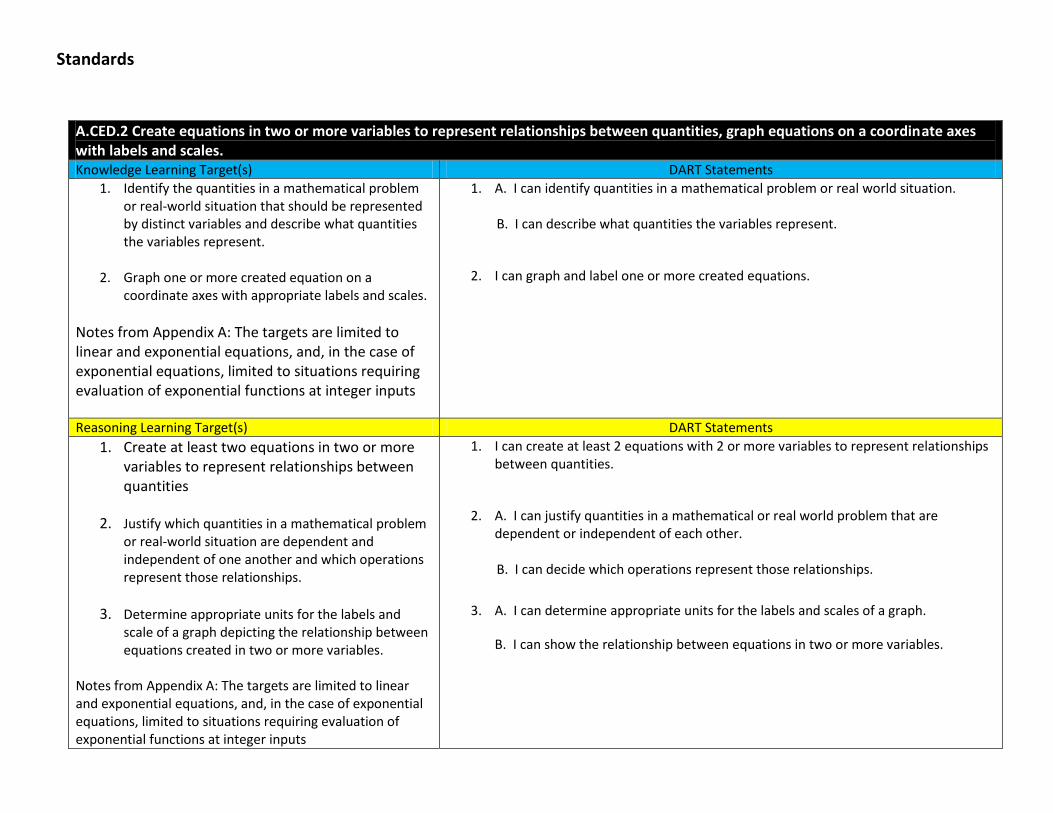
A.CED.2 Create equations in two or more variables to represent relationships between quantities, graph equations on a coordinate axes with labels and scales. Knowledge Learning Target(s) DART Statements
1. Identify the quantities in a mathematical problem or real-world situation that should be represented by distinct variables and describe what quantities the variables represent.
2. Graph one or more created equation on a
coordinate axes with appropriate labels and scales.
Notes from Appendix A: The targets are limited to linear and exponential equations, and, in the case of exponential equations, limited to situations requiring evaluation of exponential functions at integer inputs
1. A. I can identify quantities in a mathematical problem or real world situation. B. I can describe what quantities the variables represent.
2. I can graph and label one or more created equations.
Reasoning Learning Target(s) DART Statements
1. Create at least two equations in two or more variables to represent relationships between quantities
2. Justify which quantities in a mathematical problem or real-world situation are dependent and independent of one another and which operations represent those relationships.
3. Determine appropriate units for the labels and scale of a graph depicting the relationship between equations created in two or more variables.
Notes from Appendix A: The targets are limited to linear and exponential equations, and, in the case of exponential equations, limited to situations requiring evaluation of exponential functions at integer inputs
1. I can create at least 2 equations with 2 or more variables to represent relationships between quantities.
2. A. I can justify quantities in a mathematical or real world problem that are dependent or independent of each other.
B. I can decide which operations represent those relationships.
3. A. I can determine appropriate units for the labels and scales of a graph.
B. I can show the relationship between equations in two or more variables.

Standards
Performance Skill Learning Target(s) DART Statements
Product Learning Target(s) DART Statements
Standards
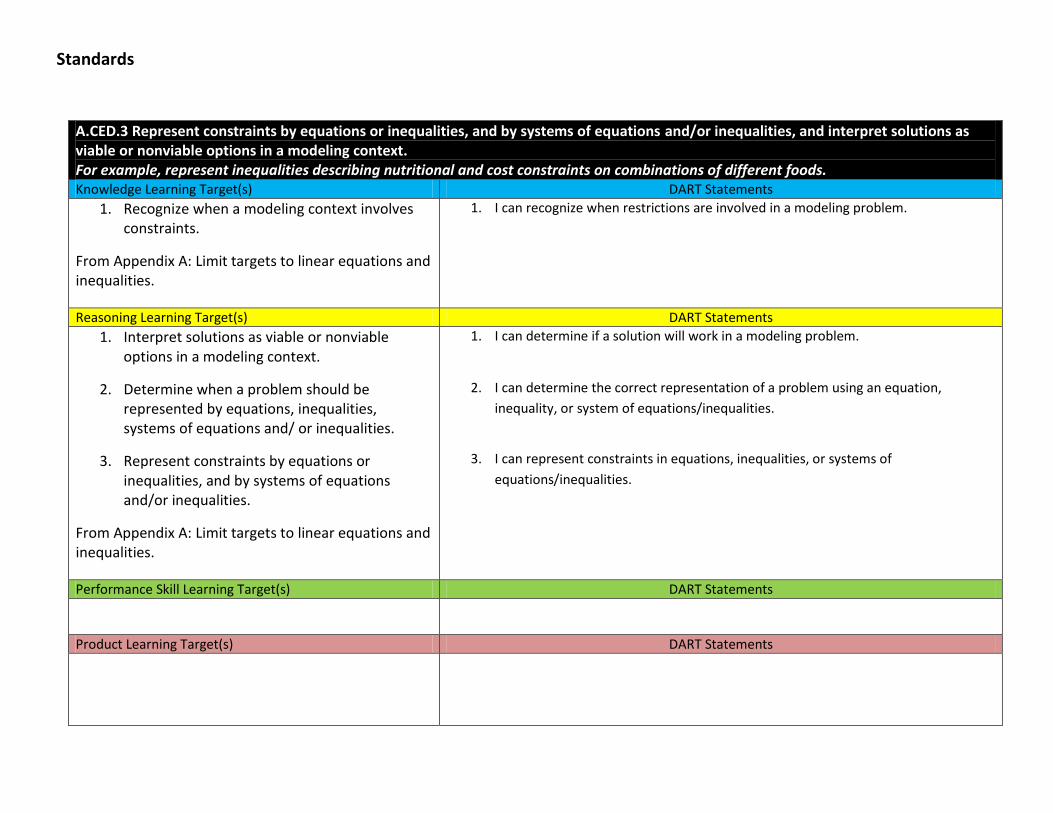
A.CED.3 Represent constraints by equations or inequalities, and by systems of equations and/or inequalities, and interpret solutions as viable or nonviable options in a modeling context. For example, represent inequalities describing nutritional and cost constraints on combinations of different foods. Knowledge Learning Target(s) DART Statements
1. Recognize when a modeling context involves constraints.
From Appendix A: Limit targets to linear equations and inequalities.
1. I can recognize when restrictions are involved in a modeling problem.
Reasoning Learning Target(s) DART Statements
1. Interpret solutions as viable or nonviable options in a modeling context.
2. Determine when a problem should be represented by equations, inequalities, systems of equations and/ or inequalities.
3. Represent constraints by equations or inequalities, and by systems of equations and/or inequalities.
From Appendix A: Limit targets to linear equations and inequalities.
1. I can determine if a solution will work in a modeling problem.
2. I can determine the correct representation of a problem using an equation,
inequality, or system of equations/inequalities.
3. I can represent constraints in equations, inequalities, or systems of
equations/inequalities.
Performance Skill Learning Target(s) DART Statements
Product Learning Target(s) DART Statements
Standards
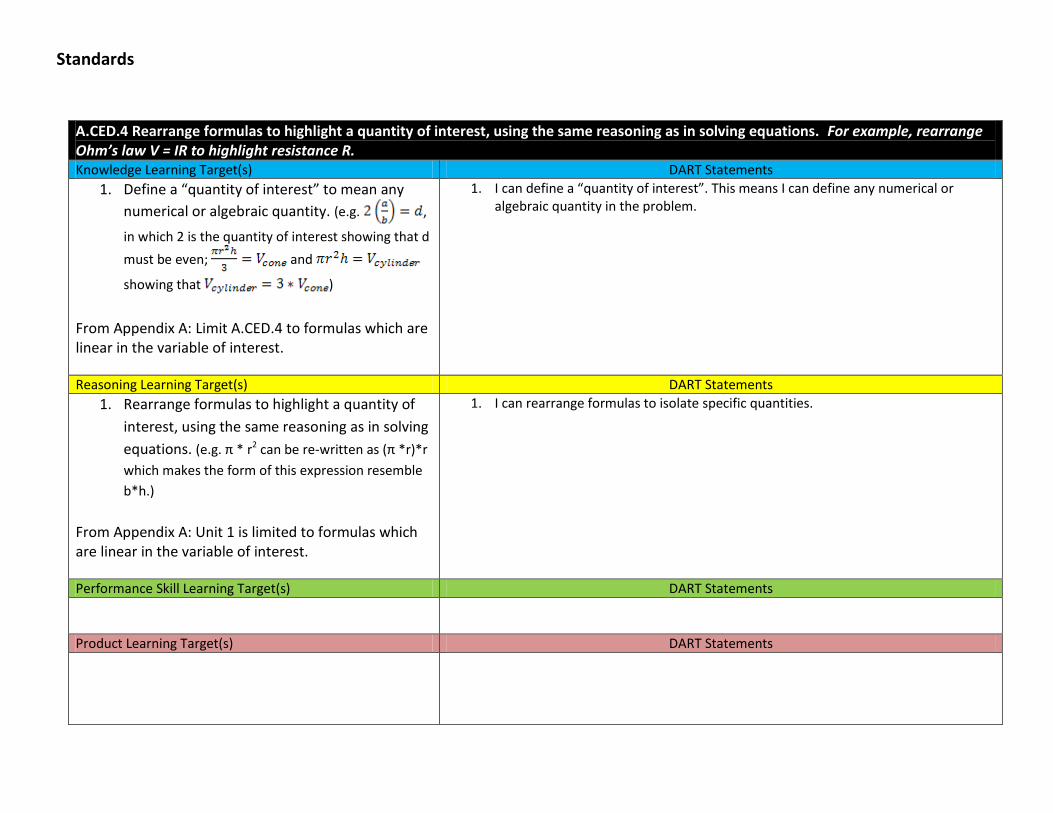
A.CED.4 Rearrange formulas to highlight a quantity of interest, using the same reasoning as in solving equations. For example, rearrange Ohm’s law V = IR to highlight resistance R. Knowledge Learning Target(s) DART Statements
1. Define a “quantity of interest” to mean any
numerical or algebraic quantity. (e.g. ,
in which 2 is the quantity of interest showing that d
must be even; and
showing that )
From Appendix A: Limit A.CED.4 to formulas which are linear in the variable of interest.
1. I can define a “quantity of interest”. This means I can define any numerical or algebraic quantity in the problem.
Reasoning Learning Target(s) DART Statements
1. Rearrange formulas to highlight a quantity of
interest, using the same reasoning as in solving
equations. (e.g. π * r2 can be re-written as (π *r)*r
which makes the form of this expression resemble
b*h.)
From Appendix A: Unit 1 is limited to formulas which are linear in the variable of interest.
1. I can rearrange formulas to isolate specific quantities.
Performance Skill Learning Target(s) DART Statements
Product Learning Target(s) DART Statements
Standards
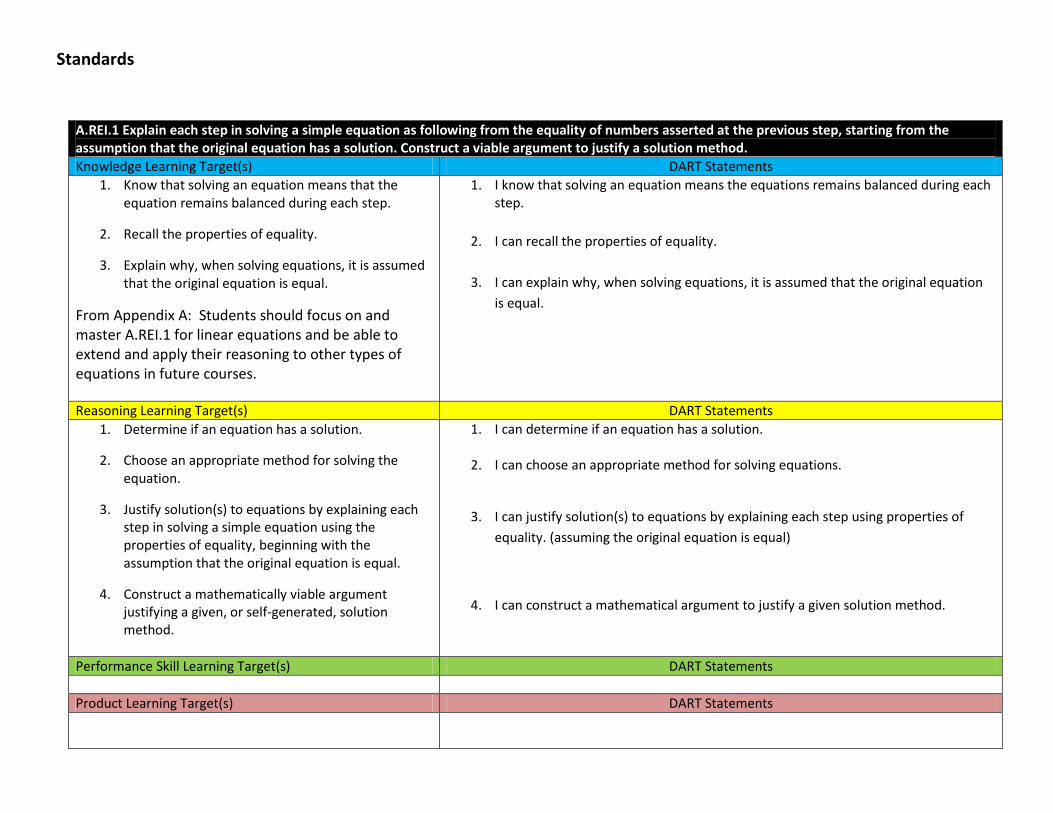
A.REI.1 Explain each step in solving a simple equation as following from the equality of numbers asserted at the previous step, starting from the assumption that the original equation has a solution. Construct a viable argument to justify a solution method. Knowledge Learning Target(s) DART Statements
1. Know that solving an equation means that the equation remains balanced during each step.
2. Recall the properties of equality.
3. Explain why, when solving equations, it is assumed that the original equation is equal.
From Appendix A: Students should focus on and master A.REI.1 for linear equations and be able to extend and apply their reasoning to other types of equations in future courses.
1. I know that solving an equation means the equations remains balanced during each step.
2. I can recall the properties of equality.
3. I can explain why, when solving equations, it is assumed that the original equation
is equal.
Reasoning Learning Target(s) DART Statements
1. Determine if an equation has a solution.
2. Choose an appropriate method for solving the equation.
3. Justify solution(s) to equations by explaining each step in solving a simple equation using the properties of equality, beginning with the assumption that the original equation is equal.
4. Construct a mathematically viable argument justifying a given, or self-generated, solution method.
1. I can determine if an equation has a solution.
2. I can choose an appropriate method for solving equations.
3. I can justify solution(s) to equations by explaining each step using properties of
equality. (assuming the original equation is equal)
4. I can construct a mathematical argument to justify a given solution method.
Performance Skill Learning Target(s) DART Statements
Product Learning Target(s) DART Statements
Standards
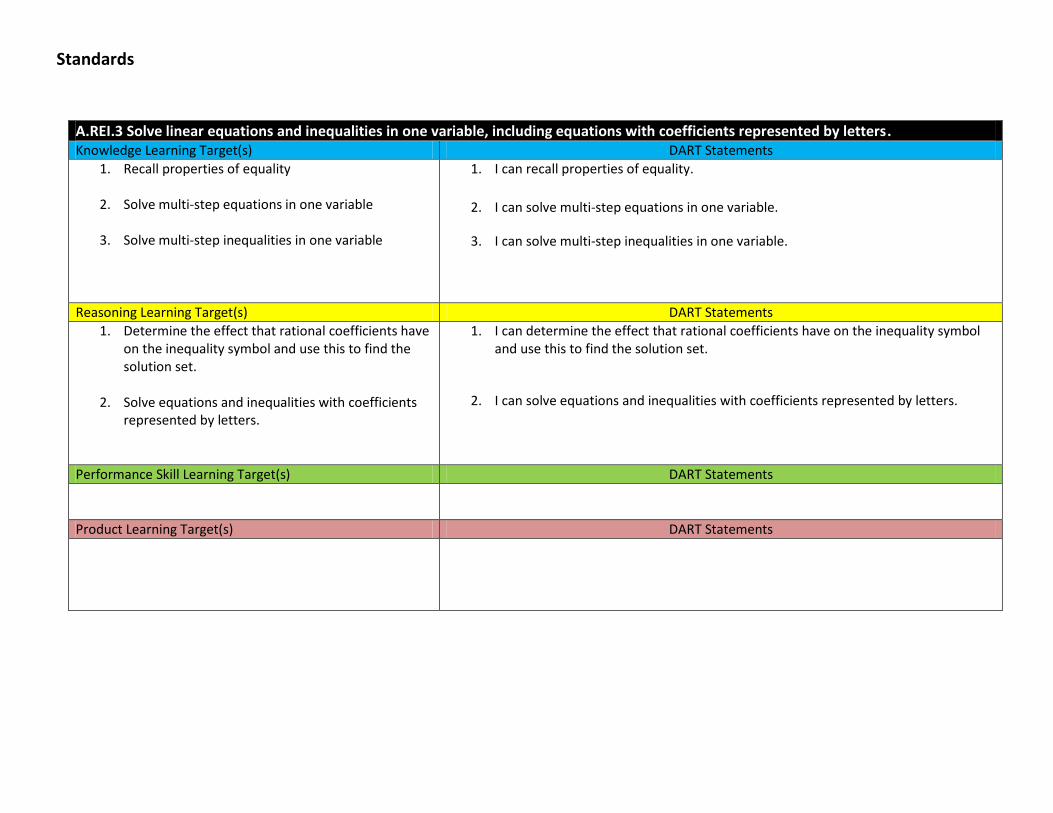
A.REI.3 Solve linear equations and inequalities in one variable, including equations with coefficients represented by letters. Knowledge Learning Target(s) DART Statements
1. Recall properties of equality
2. Solve multi-step equations in one variable
3. Solve multi-step inequalities in one variable
1. I can recall properties of equality.
2. I can solve multi-step equations in one variable.
3. I can solve multi-step inequalities in one variable.
Reasoning Learning Target(s) DART Statements
1. Determine the effect that rational coefficients have on the inequality symbol and use this to find the solution set.
2. Solve equations and inequalities with coefficients
represented by letters.
1. I can determine the effect that rational coefficients have on the inequality symbol and use this to find the solution set.
2. I can solve equations and inequalities with coefficients represented by letters.
Performance Skill Learning Target(s) DART Statements
Product Learning Target(s) DART Statements
Standards
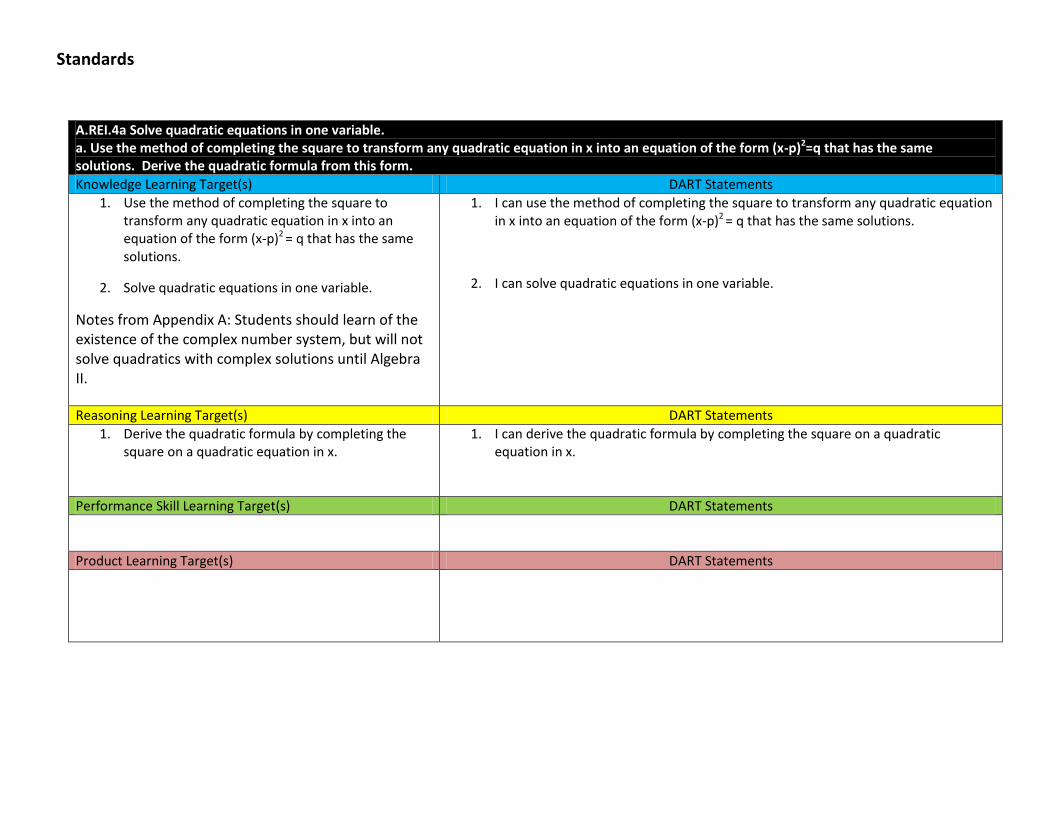
A.REI.4a Solve quadratic equations in one variable. a. Use the method of completing the square to transform any quadratic equation in x into an equation of the form (x-p)2=q that has the same solutions. Derive the quadratic formula from this form. Knowledge Learning Target(s) DART Statements
1. Use the method of completing the square to transform any quadratic equation in x into an equation of the form (x-p)2 = q that has the same solutions.
2. Solve quadratic equations in one variable.
Notes from Appendix A: Students should learn of the existence of the complex number system, but will not solve quadratics with complex solutions until Algebra II.
1. I can use the method of completing the square to transform any quadratic equation in x into an equation of the form (x-p)2 = q that has the same solutions.
2. I can solve quadratic equations in one variable.
Reasoning Learning Target(s) DART Statements
1. Derive the quadratic formula by completing the square on a quadratic equation in x.
1. I can derive the quadratic formula by completing the square on a quadratic equation in x.
Performance Skill Learning Target(s) DART Statements
Product Learning Target(s) DART Statements
Standards
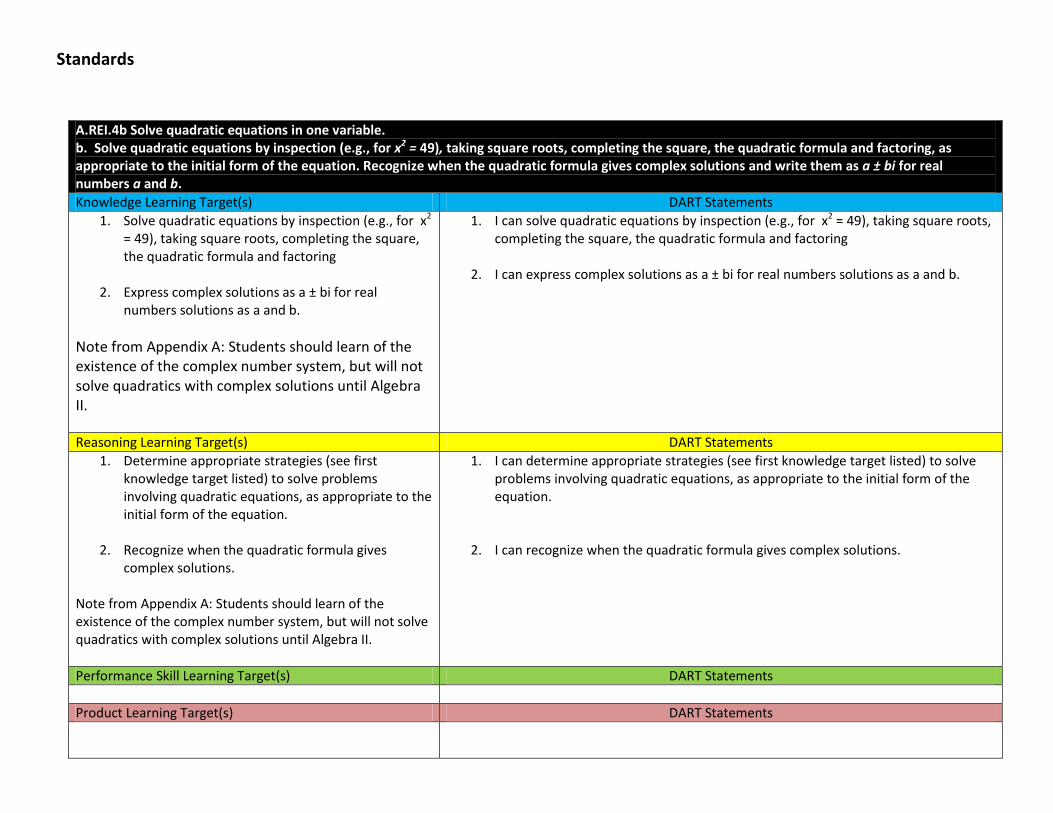
A.REI.4b Solve quadratic equations in one variable. b. Solve quadratic equations by inspection (e.g., for x2 = 49), taking square roots, completing the square, the quadratic formula and factoring, as appropriate to the initial form of the equation. Recognize when the quadratic formula gives complex solutions and write them as a ± bi for real numbers a and b. Knowledge Learning Target(s) DART Statements
1. Solve quadratic equations by inspection (e.g., for x2 = 49), taking square roots, completing the square, the quadratic formula and factoring
2. Express complex solutions as a ± bi for real
numbers solutions as a and b.
Note from Appendix A: Students should learn of the existence of the complex number system, but will not solve quadratics with complex solutions until Algebra II.
1. I can solve quadratic equations by inspection (e.g., for x2 = 49), taking square roots, completing the square, the quadratic formula and factoring
2. I can express complex solutions as a ± bi for real numbers solutions as a and b.
Reasoning Learning Target(s) DART Statements
1. Determine appropriate strategies (see first knowledge target listed) to solve problems involving quadratic equations, as appropriate to the initial form of the equation.
2. Recognize when the quadratic formula gives
complex solutions. Note from Appendix A: Students should learn of the existence of the complex number system, but will not solve quadratics with complex solutions until Algebra II.
1. I can determine appropriate strategies (see first knowledge target listed) to solve problems involving quadratic equations, as appropriate to the initial form of the equation.
2. I can recognize when the quadratic formula gives complex solutions.
Performance Skill Learning Target(s) DART Statements
Product Learning Target(s) DART Statements
Standards
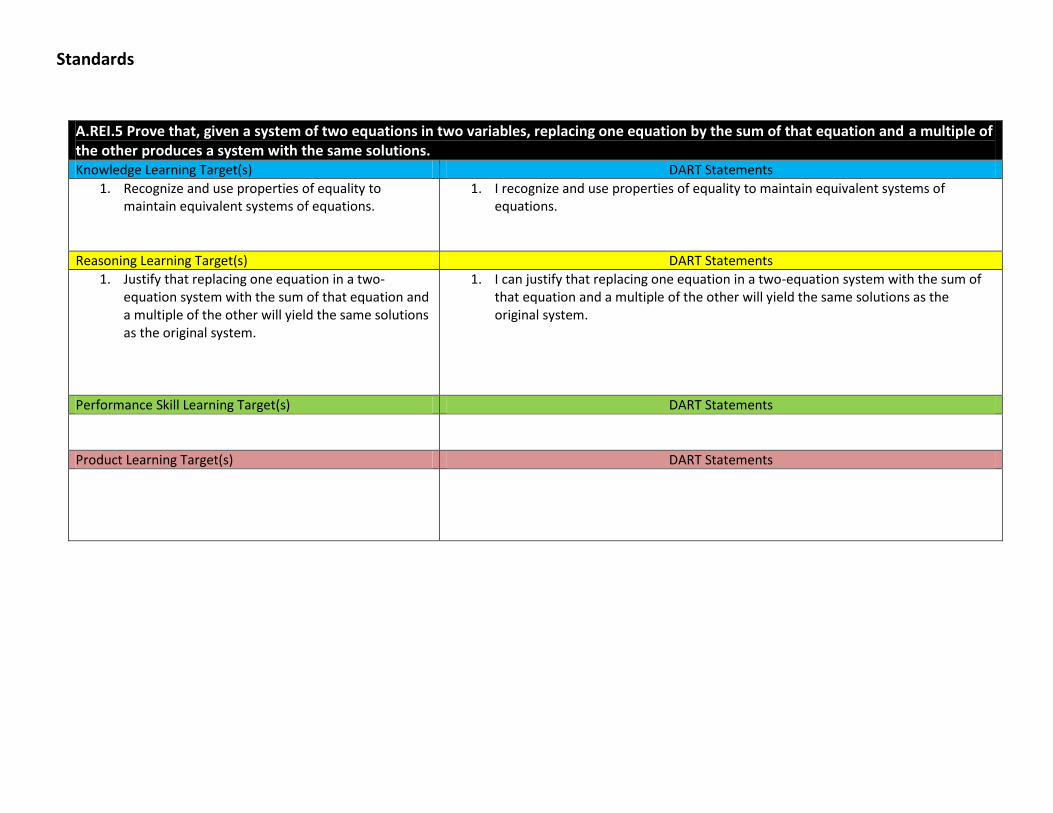
A.REI.5 Prove that, given a system of two equations in two variables, replacing one equation by the sum of that equation and a multiple of the other produces a system with the same solutions. Knowledge Learning Target(s) DART Statements
1. Recognize and use properties of equality to maintain equivalent systems of equations.
1. I recognize and use properties of equality to maintain equivalent systems of equations.
Reasoning Learning Target(s) DART Statements
1. Justify that replacing one equation in a two-equation system with the sum of that equation and a multiple of the other will yield the same solutions as the original system.
1. I can justify that replacing one equation in a two-equation system with the sum of that equation and a multiple of the other will yield the same solutions as the original system.
Performance Skill Learning Target(s) DART Statements
Product Learning Target(s) DART Statements
Standards
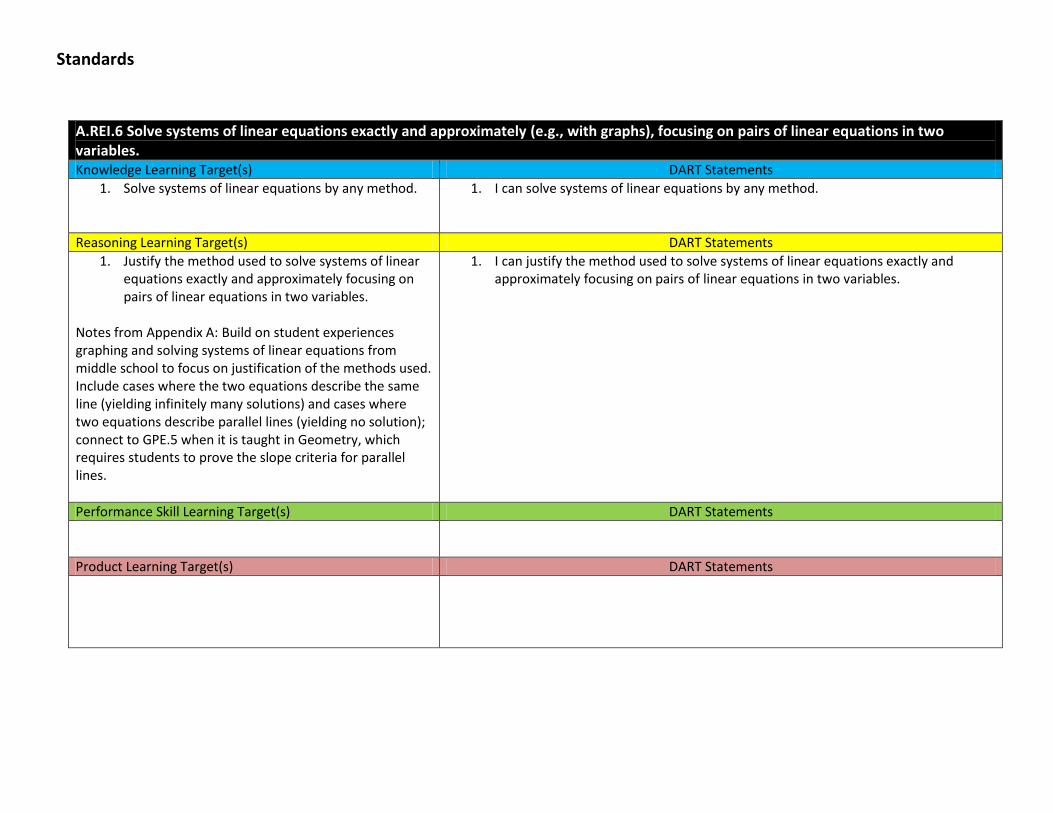
A.REI.6 Solve systems of linear equations exactly and approximately (e.g., with graphs), focusing on pairs of linear equations in two variables. Knowledge Learning Target(s) DART Statements
1. Solve systems of linear equations by any method.
1. I can solve systems of linear equations by any method.
Reasoning Learning Target(s) DART Statements
1. Justify the method used to solve systems of linear equations exactly and approximately focusing on pairs of linear equations in two variables.
Notes from Appendix A: Build on student experiences graphing and solving systems of linear equations from middle school to focus on justification of the methods used. Include cases where the two equations describe the same line (yielding infinitely many solutions) and cases where two equations describe parallel lines (yielding no solution); connect to GPE.5 when it is taught in Geometry, which requires students to prove the slope criteria for parallel lines.
1. I can justify the method used to solve systems of linear equations exactly and approximately focusing on pairs of linear equations in two variables.
Performance Skill Learning Target(s) DART Statements
Product Learning Target(s) DART Statements
Standards
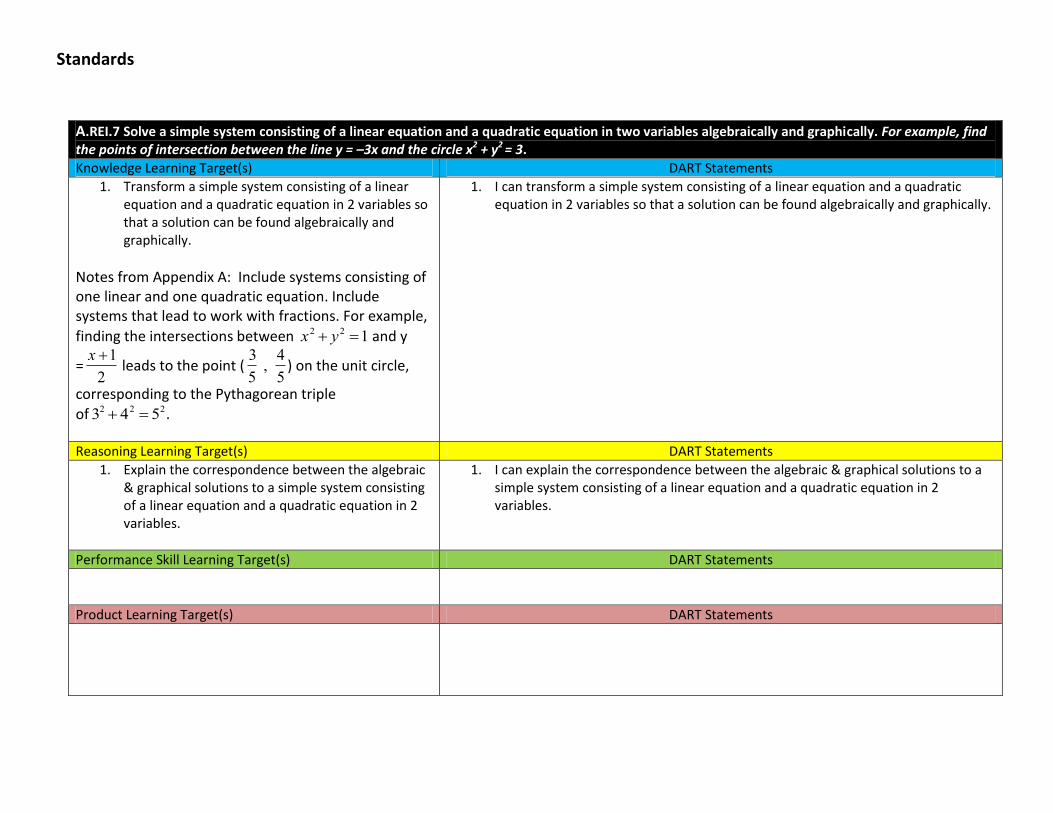
A.REI.7 Solve a simple system consisting of a linear equation and a quadratic equation in two variables algebraically and graphically. For example, find the points of intersection between the line y = –3x and the circle x2 + y2 = 3. Knowledge Learning Target(s) DART Statements
1. Transform a simple system consisting of a linear equation and a quadratic equation in 2 variables so that a solution can be found algebraically and graphically.
Notes from Appendix A: Include systems consisting of one linear and one quadratic equation. Include systems that lead to work with fractions. For example,
finding the intersections between
x2 y2 1 and y
=
x 1
2 leads to the point (
3
5 ,
4
5) on the unit circle,
corresponding to the Pythagorean triple
of
32 42 52.
1. I can transform a simple system consisting of a linear equation and a quadratic equation in 2 variables so that a solution can be found algebraically and graphically.
Reasoning Learning Target(s) DART Statements
1. Explain the correspondence between the algebraic & graphical solutions to a simple system consisting of a linear equation and a quadratic equation in 2 variables.
1. I can explain the correspondence between the algebraic & graphical solutions to a simple system consisting of a linear equation and a quadratic equation in 2 variables.
Performance Skill Learning Target(s) DART Statements
Product Learning Target(s) DART Statements
Standards
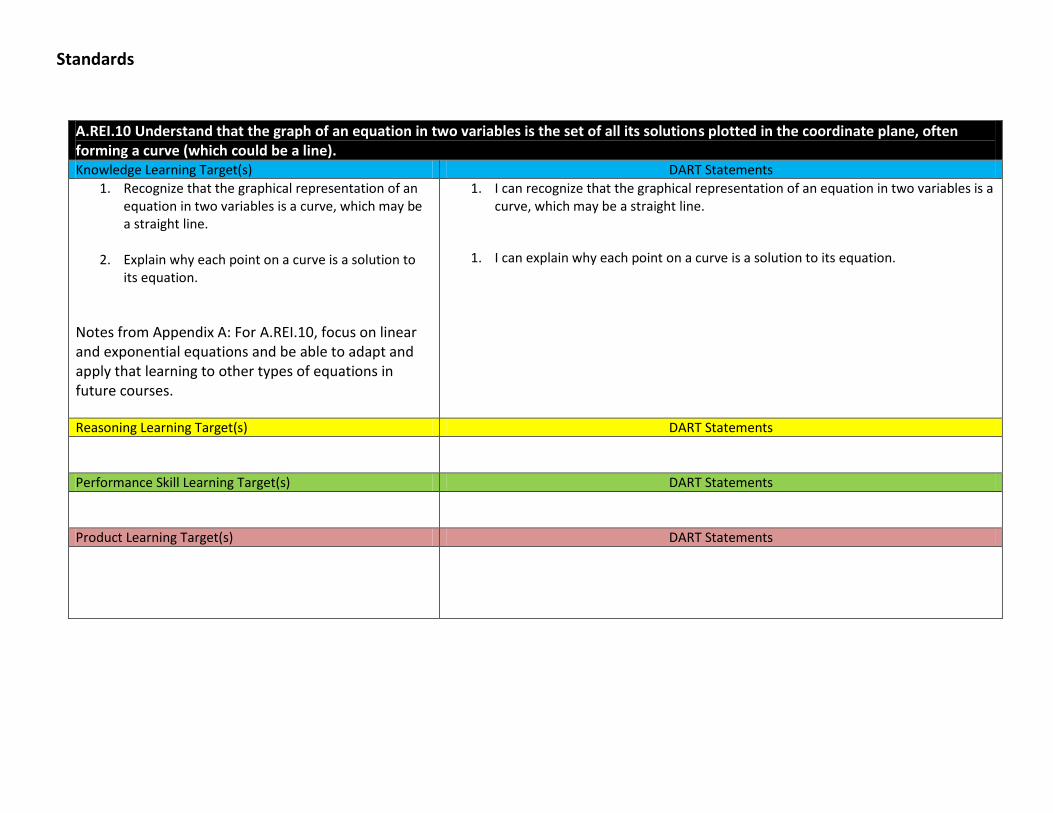
A.REI.10 Understand that the graph of an equation in two variables is the set of all its solutions plotted in the coordinate plane, often forming a curve (which could be a line). Knowledge Learning Target(s) DART Statements
1. Recognize that the graphical representation of an equation in two variables is a curve, which may be a straight line.
2. Explain why each point on a curve is a solution to
its equation.
Notes from Appendix A: For A.REI.10, focus on linear and exponential equations and be able to adapt and apply that learning to other types of equations in future courses.
1. I can recognize that the graphical representation of an equation in two variables is a curve, which may be a straight line.
1. I can explain why each point on a curve is a solution to its equation.
Reasoning Learning Target(s) DART Statements
Performance Skill Learning Target(s) DART Statements
Product Learning Target(s) DART Statements
Standards
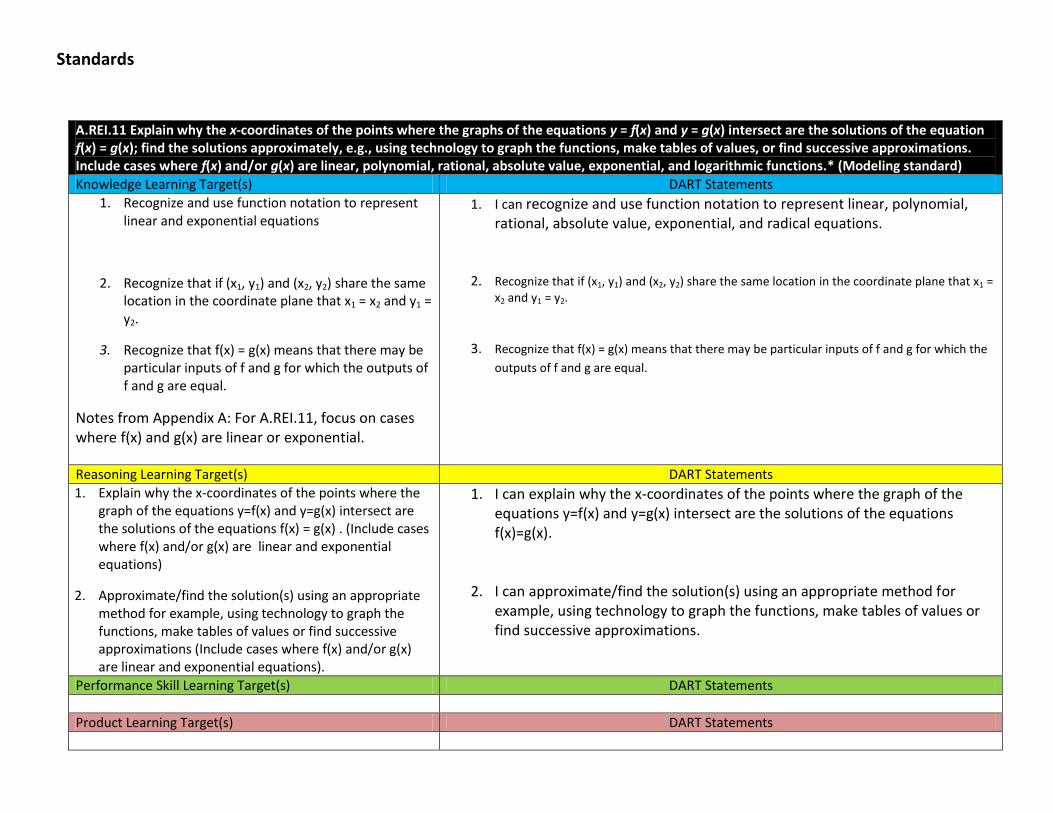
A.REI.11 Explain why the x-coordinates of the points where the graphs of the equations y = f(x) and y = g(x) intersect are the solutions of the equation f(x) = g(x); find the solutions approximately, e.g., using technology to graph the functions, make tables of values, or find successive approximations. Include cases where f(x) and/or g(x) are linear, polynomial, rational, absolute value, exponential, and logarithmic functions.* (Modeling standard) Knowledge Learning Target(s) DART Statements
1. Recognize and use function notation to represent linear and exponential equations
2. Recognize that if (x1, y1) and (x2, y2) share the same location in the coordinate plane that x1 = x2 and y1 = y2.
3. Recognize that f(x) = g(x) means that there may be particular inputs of f and g for which the outputs of f and g are equal.
Notes from Appendix A: For A.REI.11, focus on cases where f(x) and g(x) are linear or exponential.
1. I can recognize and use function notation to represent linear, polynomial, rational, absolute value, exponential, and radical equations.
2. Recognize that if (x1, y1) and (x2, y2) share the same location in the coordinate plane that x1 = x2 and y1 = y2.
3. Recognize that f(x) = g(x) means that there may be particular inputs of f and g for which the
outputs of f and g are equal.
Reasoning Learning Target(s) DART Statements
1. Explain why the x-coordinates of the points where the graph of the equations y=f(x) and y=g(x) intersect are the solutions of the equations f(x) = g(x) . (Include cases where f(x) and/or g(x) are linear and exponential equations)
2. Approximate/find the solution(s) using an appropriate method for example, using technology to graph the functions, make tables of values or find successive approximations (Include cases where f(x) and/or g(x) are linear and exponential equations).
1. I can explain why the x-coordinates of the points where the graph of the equations y=f(x) and y=g(x) intersect are the solutions of the equations f(x)=g(x).
2. I can approximate/find the solution(s) using an appropriate method for example, using technology to graph the functions, make tables of values or find successive approximations.
Performance Skill Learning Target(s) DART Statements
Product Learning Target(s) DART Statements
Standards
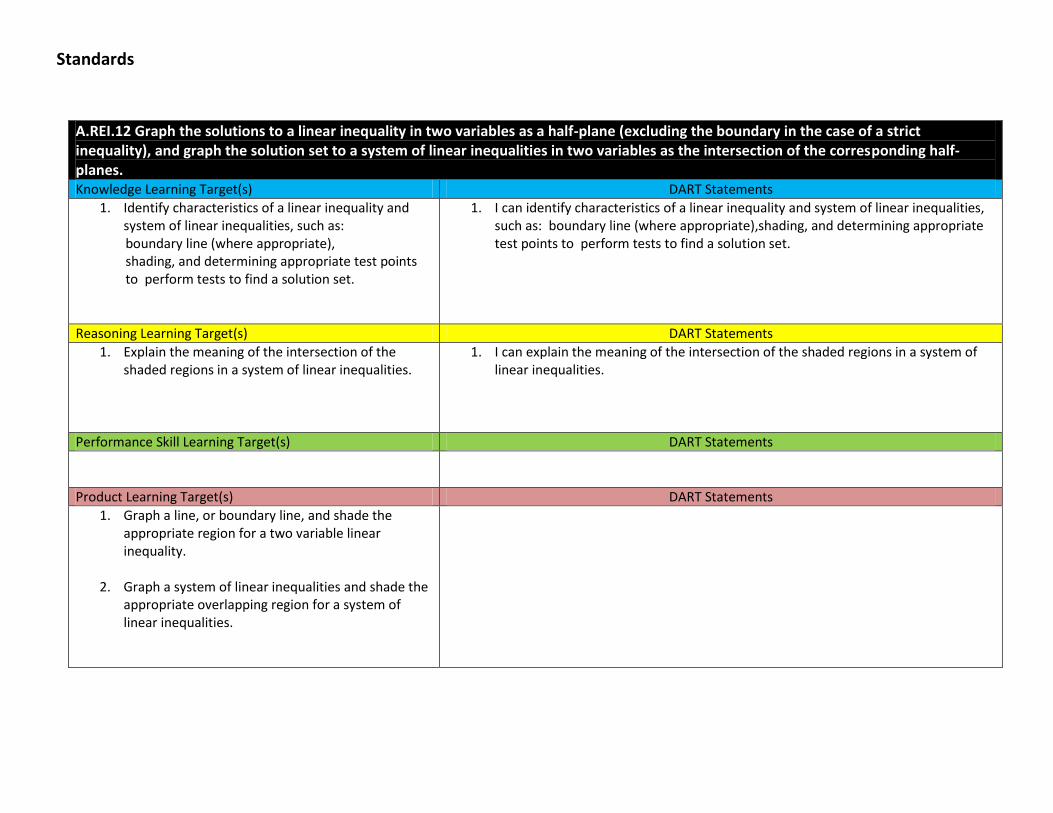
A.REI.12 Graph the solutions to a linear inequality in two variables as a half-plane (excluding the boundary in the case of a strict inequality), and graph the solution set to a system of linear inequalities in two variables as the intersection of the corresponding half-planes. Knowledge Learning Target(s) DART Statements
1. Identify characteristics of a linear inequality and system of linear inequalities, such as:
boundary line (where appropriate), shading, and determining appropriate test points to perform tests to find a solution set.
1. I can identify characteristics of a linear inequality and system of linear inequalities, such as: boundary line (where appropriate),shading, and determining appropriate test points to perform tests to find a solution set.
Reasoning Learning Target(s) DART Statements
1. Explain the meaning of the intersection of the shaded regions in a system of linear inequalities.
1. I can explain the meaning of the intersection of the shaded regions in a system of linear inequalities.
Performance Skill Learning Target(s) DART Statements
Product Learning Target(s) DART Statements
1. Graph a line, or boundary line, and shade the appropriate region for a two variable linear inequality.
2. Graph a system of linear inequalities and shade the
appropriate overlapping region for a system of linear inequalities.
Standards
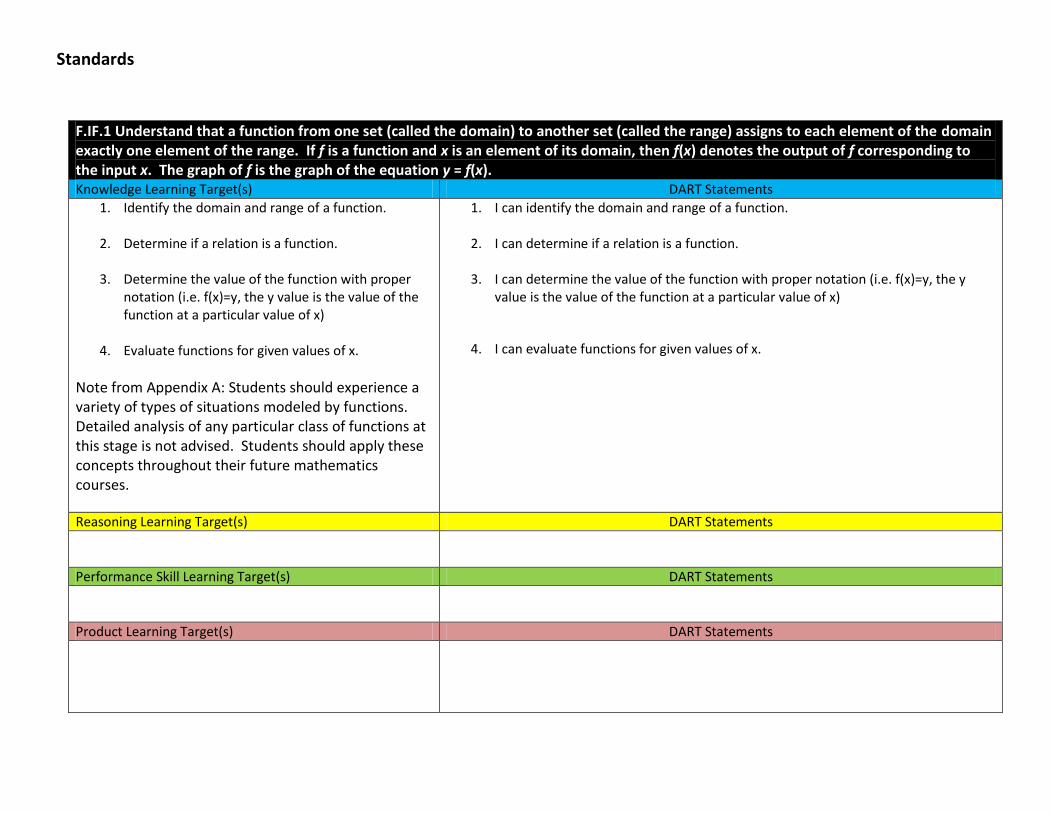
F.IF.1 Understand that a function from one set (called the domain) to another set (called the range) assigns to each element of the domain exactly one element of the range. If f is a function and x is an element of its domain, then f(x) denotes the output of f corresponding to the input x. The graph of f is the graph of the equation y = f(x). Knowledge Learning Target(s) DART Statements
1. Identify the domain and range of a function.
2. Determine if a relation is a function.
3. Determine the value of the function with proper notation (i.e. f(x)=y, the y value is the value of the function at a particular value of x)
4. Evaluate functions for given values of x.
Note from Appendix A: Students should experience a variety of types of situations modeled by functions. Detailed analysis of any particular class of functions at this stage is not advised. Students should apply these concepts throughout their future mathematics courses.
1. I can identify the domain and range of a function.
2. I can determine if a relation is a function.
3. I can determine the value of the function with proper notation (i.e. f(x)=y, the y value is the value of the function at a particular value of x)
4. I can evaluate functions for given values of x.
Reasoning Learning Target(s) DART Statements
Performance Skill Learning Target(s) DART Statements
Product Learning Target(s) DART Statements
Standards
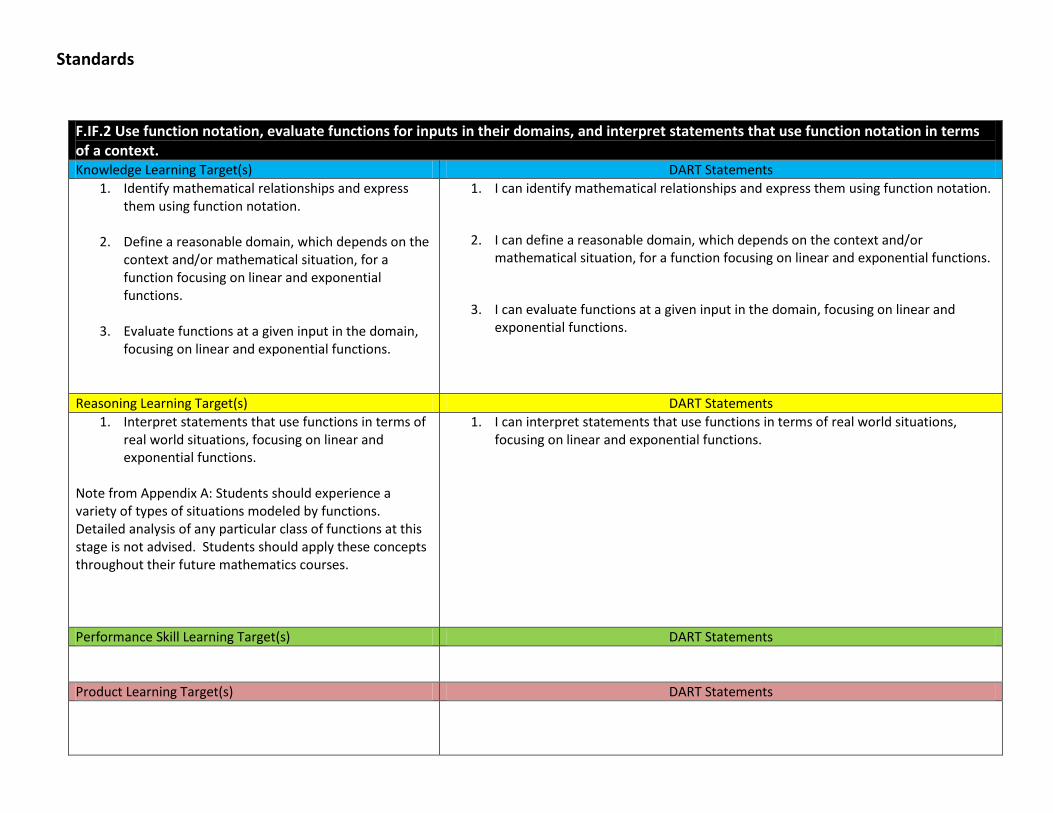
F.IF.2 Use function notation, evaluate functions for inputs in their domains, and interpret statements that use function notation in terms of a context. Knowledge Learning Target(s) DART Statements
1. Identify mathematical relationships and express them using function notation.
2. Define a reasonable domain, which depends on the
context and/or mathematical situation, for a function focusing on linear and exponential functions.
3. Evaluate functions at a given input in the domain,
focusing on linear and exponential functions.
1. I can identify mathematical relationships and express them using function notation.
2. I can define a reasonable domain, which depends on the context and/or mathematical situation, for a function focusing on linear and exponential functions.
3. I can evaluate functions at a given input in the domain, focusing on linear and exponential functions.
Reasoning Learning Target(s) DART Statements
1. Interpret statements that use functions in terms of real world situations, focusing on linear and exponential functions.
Note from Appendix A: Students should experience a variety of types of situations modeled by functions. Detailed analysis of any particular class of functions at this stage is not advised. Students should apply these concepts throughout their future mathematics courses.
1. I can interpret statements that use functions in terms of real world situations, focusing on linear and exponential functions.
Performance Skill Learning Target(s) DART Statements
Product Learning Target(s) DART Statements
Standards
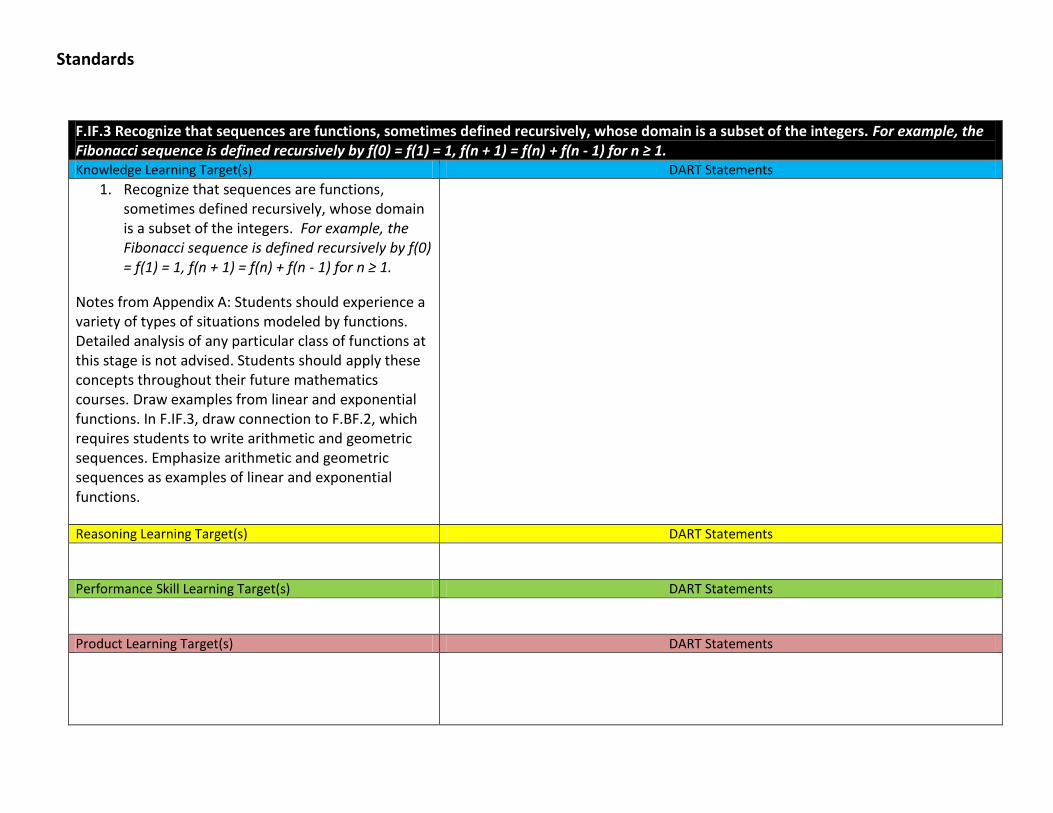
F.IF.3 Recognize that sequences are functions, sometimes defined recursively, whose domain is a subset of the integers. For example, the Fibonacci sequence is defined recursively by f(0) = f(1) = 1, f(n + 1) = f(n) + f(n - 1) for n ≥ 1. Knowledge Learning Target(s) DART Statements
1. Recognize that sequences are functions, sometimes defined recursively, whose domain is a subset of the integers. For example, the Fibonacci sequence is defined recursively by f(0) = f(1) = 1, f(n + 1) = f(n) + f(n - 1) for n ≥ 1.
Notes from Appendix A: Students should experience a variety of types of situations modeled by functions. Detailed analysis of any particular class of functions at this stage is not advised. Students should apply these concepts throughout their future mathematics courses. Draw examples from linear and exponential functions. In F.IF.3, draw connection to F.BF.2, which requires students to write arithmetic and geometric sequences. Emphasize arithmetic and geometric sequences as examples of linear and exponential functions.
Reasoning Learning Target(s) DART Statements
Performance Skill Learning Target(s) DART Statements
Product Learning Target(s) DART Statements
Standards
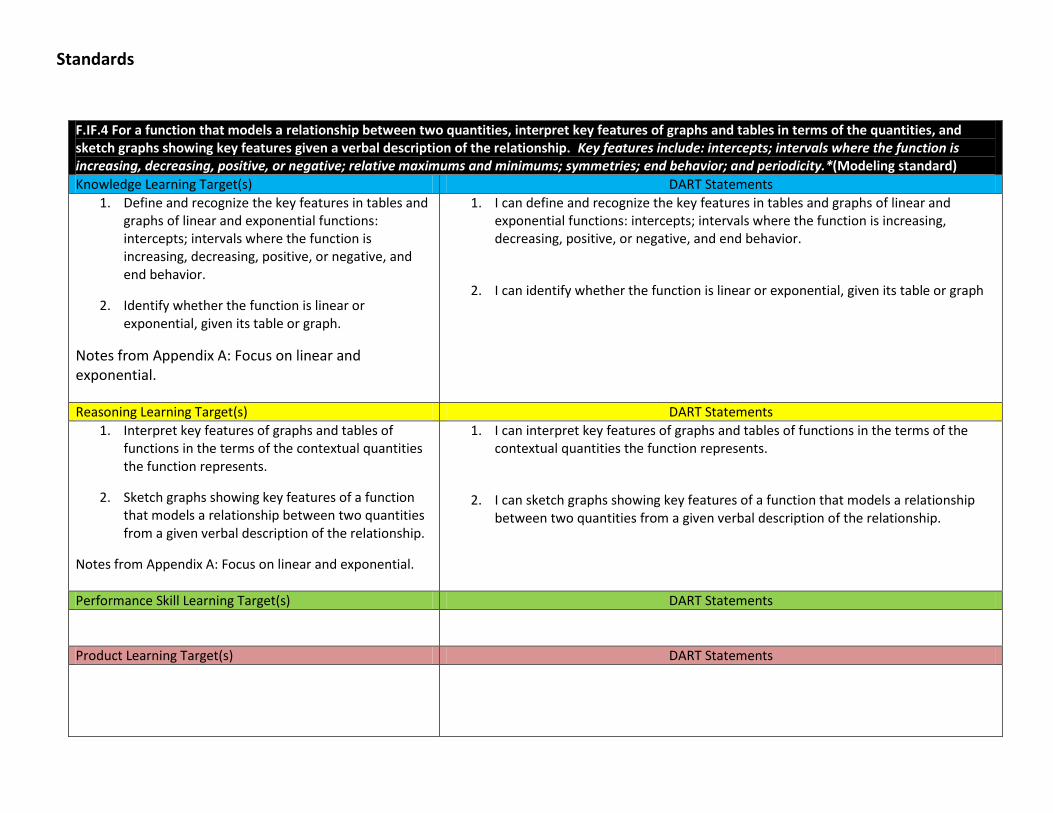
F.IF.4 For a function that models a relationship between two quantities, interpret key features of graphs and tables in terms of the quantities, and sketch graphs showing key features given a verbal description of the relationship. Key features include: intercepts; intervals where the function is increasing, decreasing, positive, or negative; relative maximums and minimums; symmetries; end behavior; and periodicity.*(Modeling standard) Knowledge Learning Target(s) DART Statements
1. Define and recognize the key features in tables and graphs of linear and exponential functions: intercepts; intervals where the function is increasing, decreasing, positive, or negative, and end behavior.
2. Identify whether the function is linear or exponential, given its table or graph.
Notes from Appendix A: Focus on linear and exponential.
1. I can define and recognize the key features in tables and graphs of linear and exponential functions: intercepts; intervals where the function is increasing, decreasing, positive, or negative, and end behavior.
2. I can identify whether the function is linear or exponential, given its table or graph
Reasoning Learning Target(s) DART Statements
1. Interpret key features of graphs and tables of functions in the terms of the contextual quantities the function represents.
2. Sketch graphs showing key features of a function that models a relationship between two quantities from a given verbal description of the relationship.
Notes from Appendix A: Focus on linear and exponential.
1. I can interpret key features of graphs and tables of functions in the terms of the contextual quantities the function represents.
2. I can sketch graphs showing key features of a function that models a relationship between two quantities from a given verbal description of the relationship.
Performance Skill Learning Target(s) DART Statements
Product Learning Target(s) DART Statements
Standards
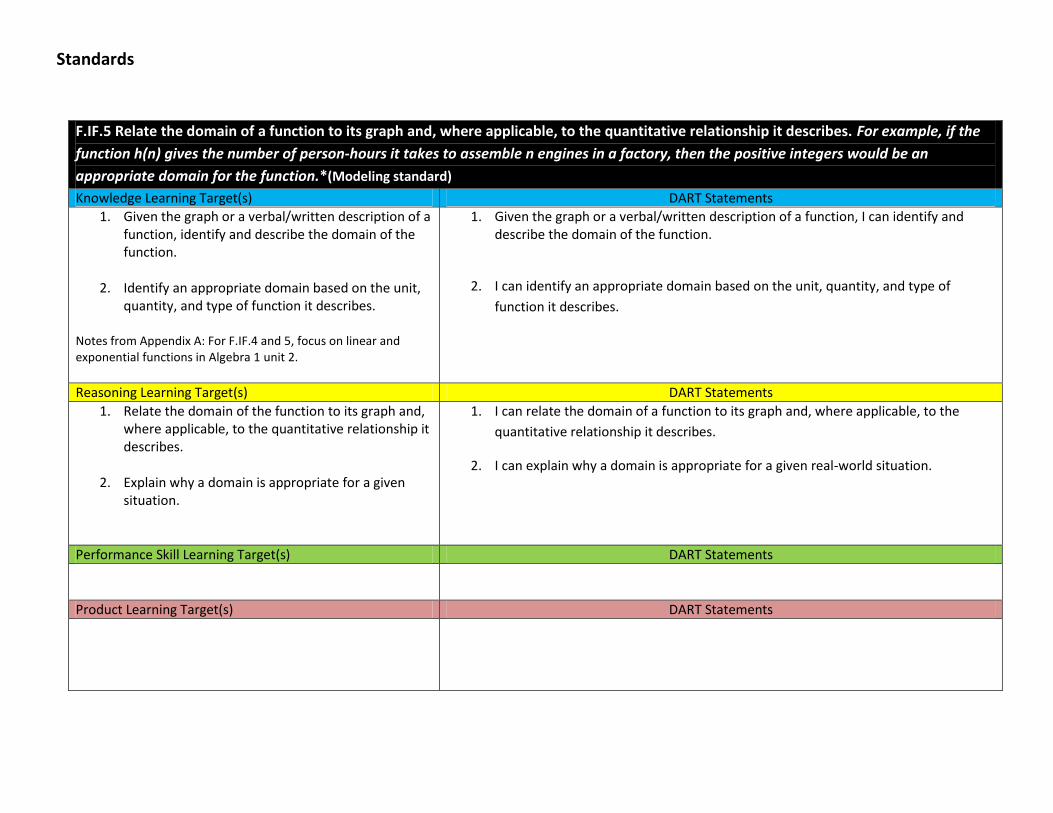
F.IF.5 Relate the domain of a function to its graph and, where applicable, to the quantitative relationship it describes. For example, if the
function h(n) gives the number of person-hours it takes to assemble n engines in a factory, then the positive integers would be an
appropriate domain for the function.*(Modeling standard) Knowledge Learning Target(s) DART Statements
1. Given the graph or a verbal/written description of a function, identify and describe the domain of the function.
2. Identify an appropriate domain based on the unit,
quantity, and type of function it describes. Notes from Appendix A: For F.IF.4 and 5, focus on linear and exponential functions in Algebra 1 unit 2.
1. Given the graph or a verbal/written description of a function, I can identify and describe the domain of the function.
2. I can identify an appropriate domain based on the unit, quantity, and type of
function it describes.
Reasoning Learning Target(s) DART Statements
1. Relate the domain of the function to its graph and, where applicable, to the quantitative relationship it describes.
2. Explain why a domain is appropriate for a given
situation.
1. I can relate the domain of a function to its graph and, where applicable, to the
quantitative relationship it describes.
2. I can explain why a domain is appropriate for a given real-world situation.
Performance Skill Learning Target(s) DART Statements
Product Learning Target(s) DART Statements
Standards
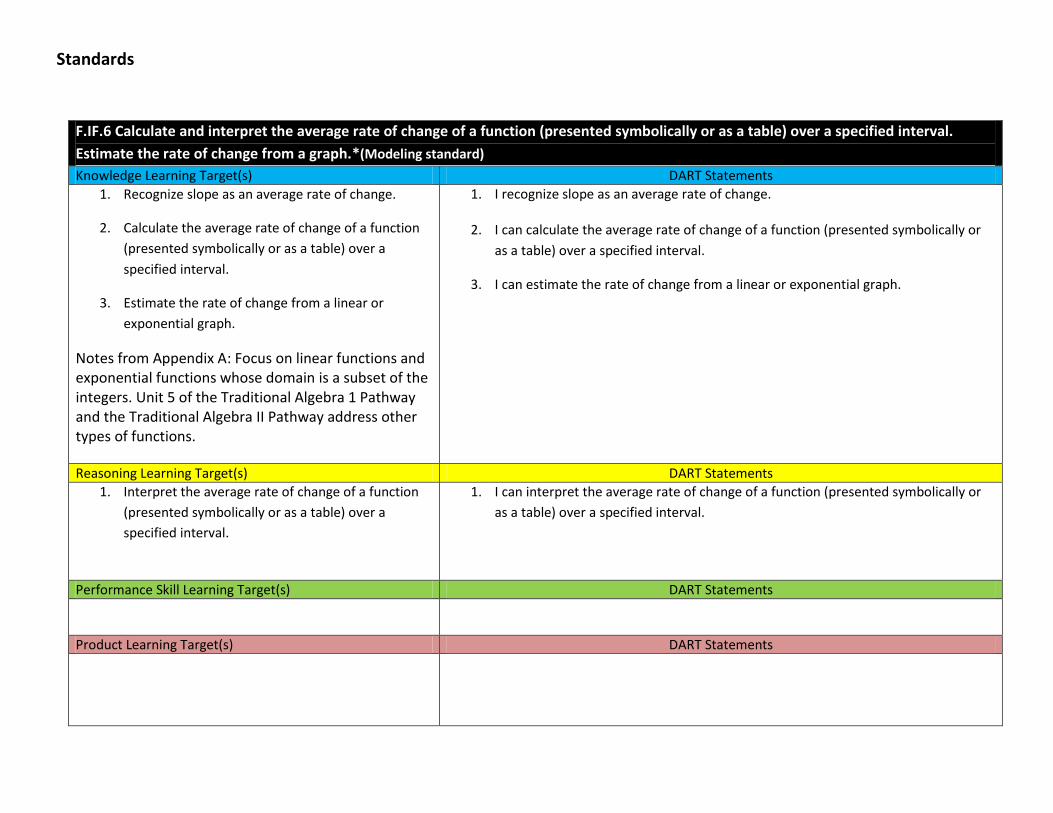
F.IF.6 Calculate and interpret the average rate of change of a function (presented symbolically or as a table) over a specified interval.
Estimate the rate of change from a graph.*(Modeling standard) Knowledge Learning Target(s) DART Statements
1. Recognize slope as an average rate of change.
2. Calculate the average rate of change of a function
(presented symbolically or as a table) over a
specified interval.
3. Estimate the rate of change from a linear or
exponential graph.
Notes from Appendix A: Focus on linear functions and exponential functions whose domain is a subset of the integers. Unit 5 of the Traditional Algebra 1 Pathway and the Traditional Algebra II Pathway address other types of functions.
1. I recognize slope as an average rate of change.
2. I can calculate the average rate of change of a function (presented symbolically or
as a table) over a specified interval.
3. I can estimate the rate of change from a linear or exponential graph.
Reasoning Learning Target(s) DART Statements
1. Interpret the average rate of change of a function
(presented symbolically or as a table) over a
specified interval.
1. I can interpret the average rate of change of a function (presented symbolically or
as a table) over a specified interval.
Performance Skill Learning Target(s) DART Statements
Product Learning Target(s) DART Statements
Standards
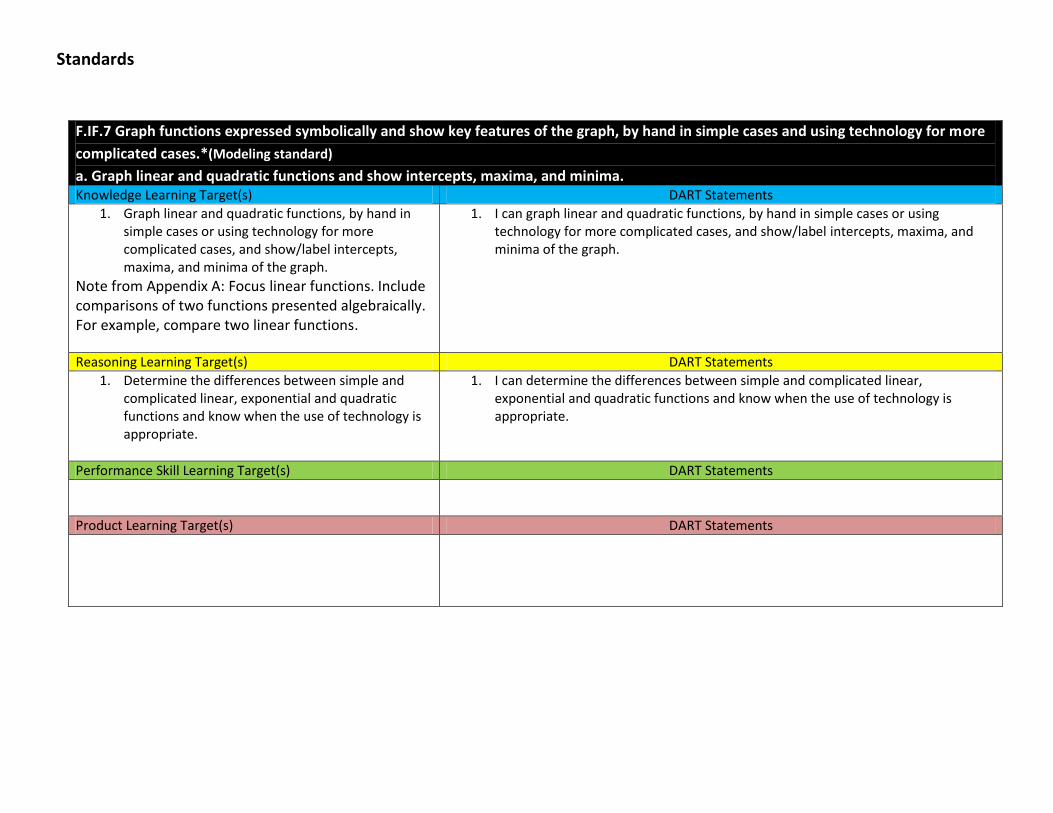
F.IF.7 Graph functions expressed symbolically and show key features of the graph, by hand in simple cases and using technology for more
complicated cases.*(Modeling standard)
a. Graph linear and quadratic functions and show intercepts, maxima, and minima. Knowledge Learning Target(s) DART Statements
1. Graph linear and quadratic functions, by hand in simple cases or using technology for more complicated cases, and show/label intercepts, maxima, and minima of the graph.
Note from Appendix A: Focus linear functions. Include comparisons of two functions presented algebraically. For example, compare two linear functions.
1. I can graph linear and quadratic functions, by hand in simple cases or using technology for more complicated cases, and show/label intercepts, maxima, and minima of the graph.
Reasoning Learning Target(s) DART Statements
1. Determine the differences between simple and complicated linear, exponential and quadratic functions and know when the use of technology is appropriate.
1. I can determine the differences between simple and complicated linear, exponential and quadratic functions and know when the use of technology is appropriate.
Performance Skill Learning Target(s) DART Statements
Product Learning Target(s) DART Statements
Standards
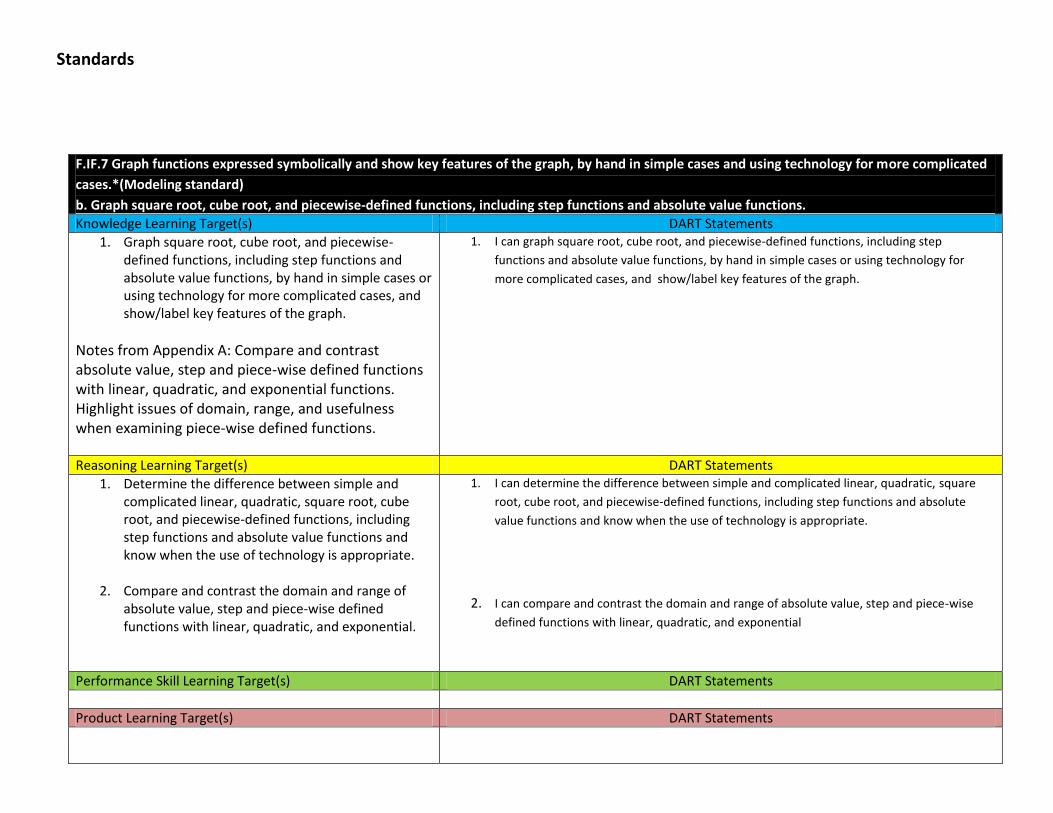
F.IF.7 Graph functions expressed symbolically and show key features of the graph, by hand in simple cases and using technology for more complicated
cases.*(Modeling standard)
b. Graph square root, cube root, and piecewise-defined functions, including step functions and absolute value functions. Knowledge Learning Target(s) DART Statements
1. Graph square root, cube root, and piecewise-defined functions, including step functions and absolute value functions, by hand in simple cases or using technology for more complicated cases, and show/label key features of the graph.
Notes from Appendix A: Compare and contrast absolute value, step and piece-wise defined functions with linear, quadratic, and exponential functions. Highlight issues of domain, range, and usefulness when examining piece-wise defined functions.
1. I can graph square root, cube root, and piecewise-defined functions, including step
functions and absolute value functions, by hand in simple cases or using technology for
more complicated cases, and show/label key features of the graph.
Reasoning Learning Target(s) DART Statements
1. Determine the difference between simple and complicated linear, quadratic, square root, cube root, and piecewise-defined functions, including step functions and absolute value functions and know when the use of technology is appropriate.
2. Compare and contrast the domain and range of
absolute value, step and piece-wise defined functions with linear, quadratic, and exponential.
1. I can determine the difference between simple and complicated linear, quadratic, square
root, cube root, and piecewise-defined functions, including step functions and absolute
value functions and know when the use of technology is appropriate.
2. I can compare and contrast the domain and range of absolute value, step and piece-wise
defined functions with linear, quadratic, and exponential
Performance Skill Learning Target(s) DART Statements
Product Learning Target(s) DART Statements
Standards
F.IF.7 Graph functions expressed symbolically and show key features of the graph, by hand in simple cases and using technology for more complicated
cases.*(Modeling standard)
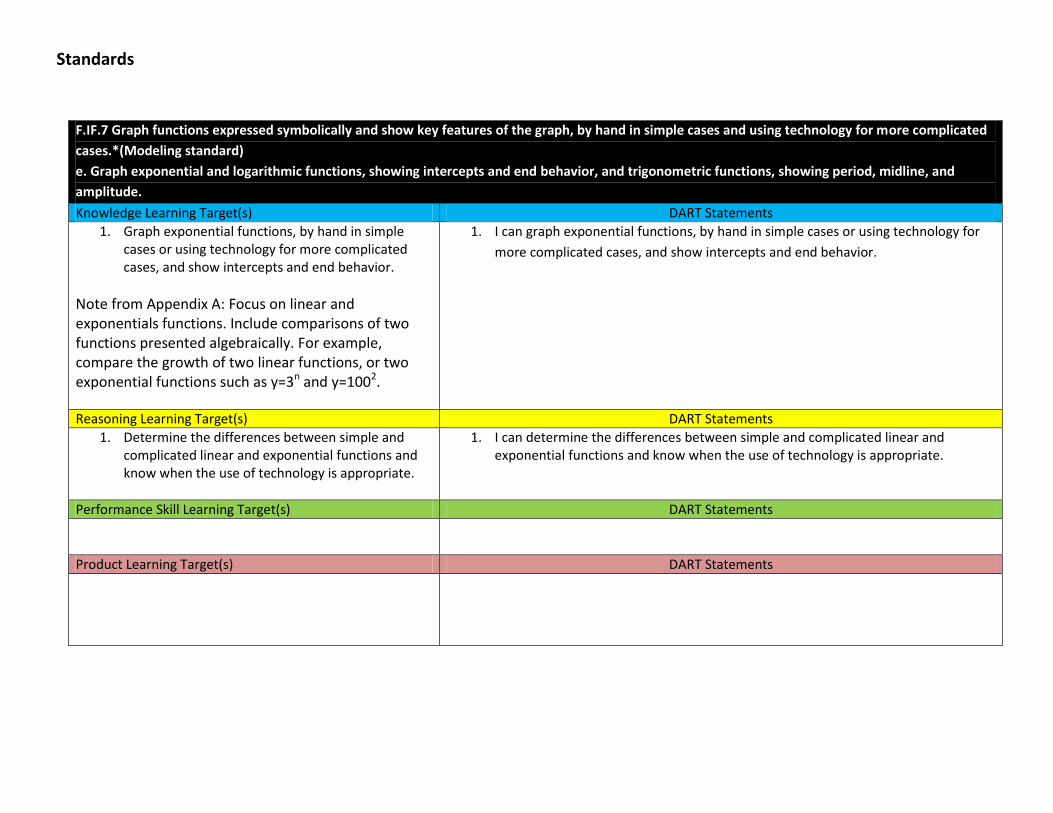
e. Graph exponential and logarithmic functions, showing intercepts and end behavior, and trigonometric functions, showing period, midline, and
amplitude. Knowledge Learning Target(s) DART Statements
1. Graph exponential functions, by hand in simple cases or using technology for more complicated cases, and show intercepts and end behavior.
Note from Appendix A: Focus on linear and exponentials functions. Include comparisons of two functions presented algebraically. For example, compare the growth of two linear functions, or two exponential functions such as y=3n and y=1002.
1. I can graph exponential functions, by hand in simple cases or using technology for
more complicated cases, and show intercepts and end behavior.
Reasoning Learning Target(s) DART Statements
1. Determine the differences between simple and complicated linear and exponential functions and know when the use of technology is appropriate.
1. I can determine the differences between simple and complicated linear and exponential functions and know when the use of technology is appropriate.
Performance Skill Learning Target(s) DART Statements
Product Learning Target(s) DART Statements
Standards
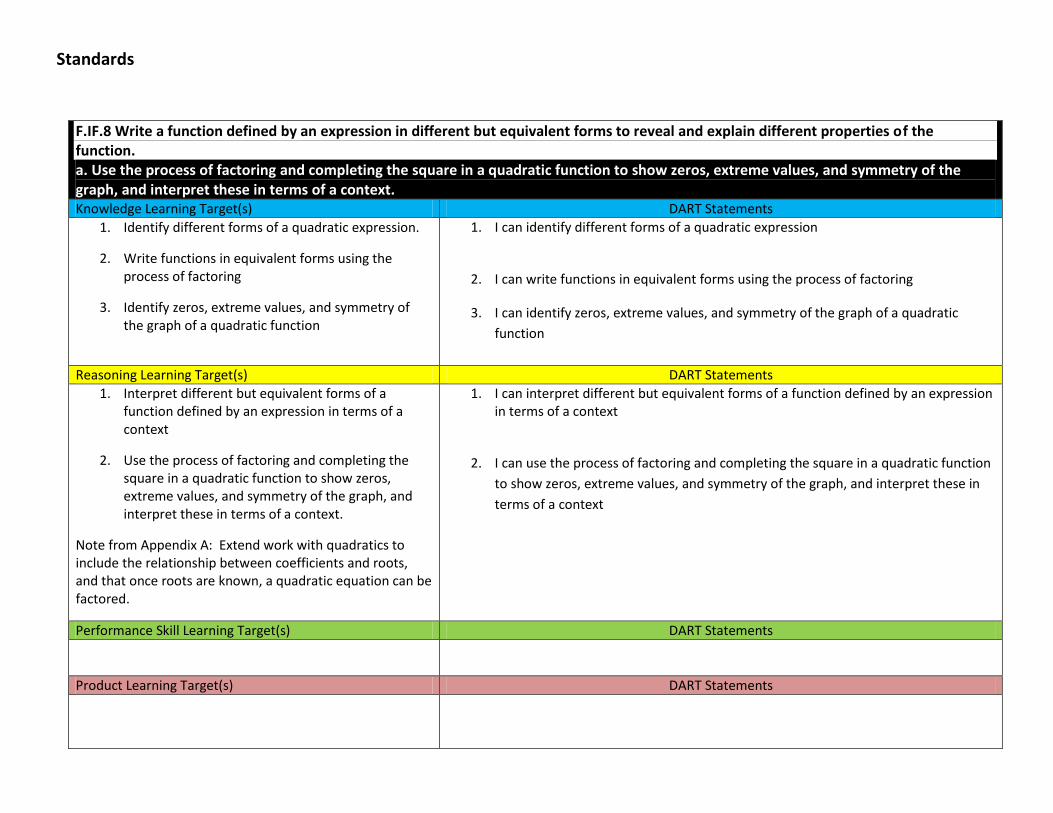
F.IF.8 Write a function defined by an expression in different but equivalent forms to reveal and explain different properties of the function. a. Use the process of factoring and completing the square in a quadratic function to show zeros, extreme values, and symmetry of the graph, and interpret these in terms of a context. Knowledge Learning Target(s) DART Statements
1. Identify different forms of a quadratic expression.
2. Write functions in equivalent forms using the process of factoring
3. Identify zeros, extreme values, and symmetry of the graph of a quadratic function
1. I can identify different forms of a quadratic expression
2. I can write functions in equivalent forms using the process of factoring
3. I can identify zeros, extreme values, and symmetry of the graph of a quadratic
function
Reasoning Learning Target(s) DART Statements
1. Interpret different but equivalent forms of a function defined by an expression in terms of a context
2. Use the process of factoring and completing the square in a quadratic function to show zeros, extreme values, and symmetry of the graph, and interpret these in terms of a context.
Note from Appendix A: Extend work with quadratics to include the relationship between coefficients and roots, and that once roots are known, a quadratic equation can be factored.
1. I can interpret different but equivalent forms of a function defined by an expression in terms of a context
2. I can use the process of factoring and completing the square in a quadratic function
to show zeros, extreme values, and symmetry of the graph, and interpret these in
terms of a context
Performance Skill Learning Target(s) DART Statements
Product Learning Target(s) DART Statements
Standards
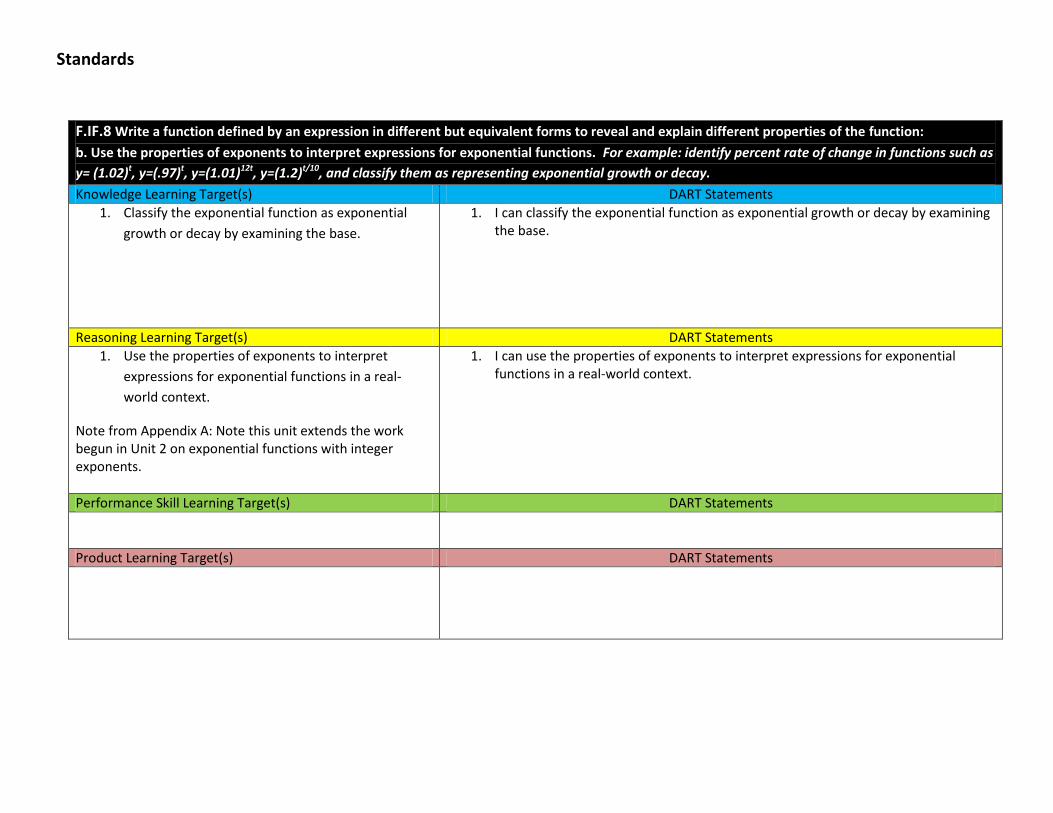
F.IF.8 Write a function defined by an expression in different but equivalent forms to reveal and explain different properties of the function:
b. Use the properties of exponents to interpret expressions for exponential functions. For example: identify percent rate of change in functions such as
y= (1.02)t, y=(.97)t, y=(1.01)12t, y=(1.2)t/10, and classify them as representing exponential growth or decay. Knowledge Learning Target(s) DART Statements
1. Classify the exponential function as exponential
growth or decay by examining the base.
1. I can classify the exponential function as exponential growth or decay by examining the base.
Reasoning Learning Target(s) DART Statements
1. Use the properties of exponents to interpret
expressions for exponential functions in a real-
world context.
Note from Appendix A: Note this unit extends the work begun in Unit 2 on exponential functions with integer exponents.
1. I can use the properties of exponents to interpret expressions for exponential functions in a real-world context.
Performance Skill Learning Target(s) DART Statements
Product Learning Target(s) DART Statements
Standards
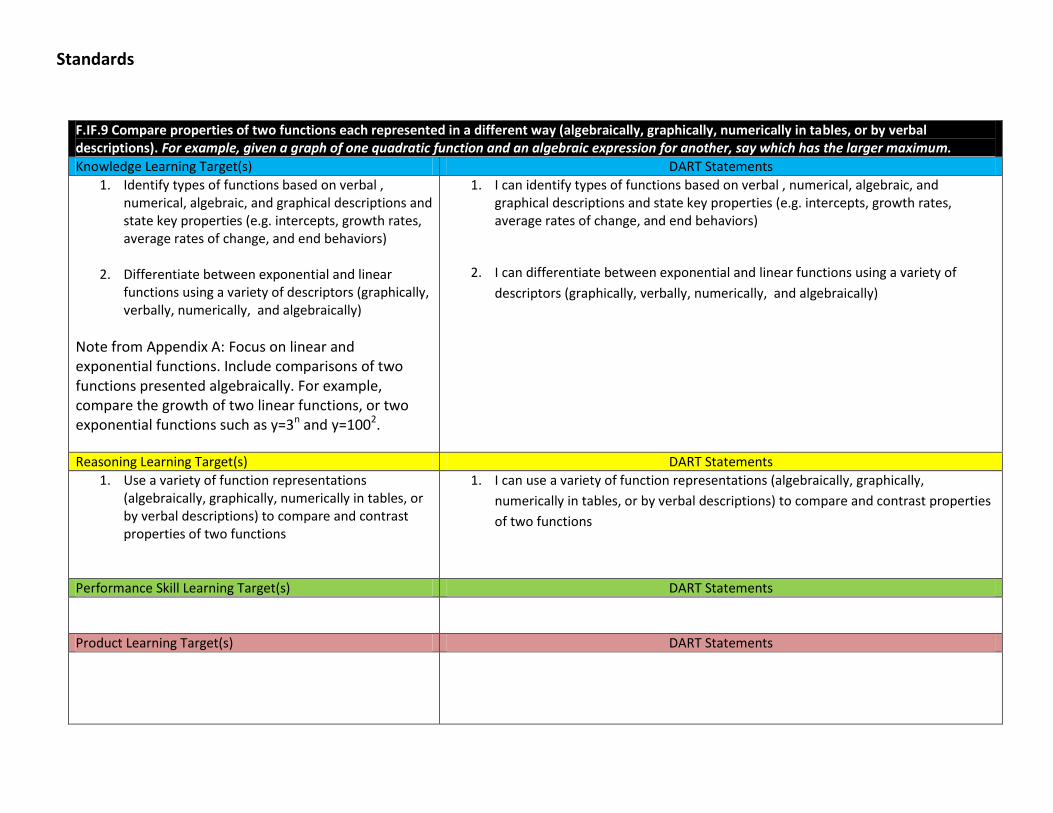
F.IF.9 Compare properties of two functions each represented in a different way (algebraically, graphically, numerically in tables, or by verbal descriptions). For example, given a graph of one quadratic function and an algebraic expression for another, say which has the larger maximum. Knowledge Learning Target(s) DART Statements
1. Identify types of functions based on verbal , numerical, algebraic, and graphical descriptions and state key properties (e.g. intercepts, growth rates, average rates of change, and end behaviors)
2. Differentiate between exponential and linear
functions using a variety of descriptors (graphically, verbally, numerically, and algebraically)
Note from Appendix A: Focus on linear and exponential functions. Include comparisons of two functions presented algebraically. For example, compare the growth of two linear functions, or two exponential functions such as y=3n and y=1002.
1. I can identify types of functions based on verbal , numerical, algebraic, and graphical descriptions and state key properties (e.g. intercepts, growth rates, average rates of change, and end behaviors)
2. I can differentiate between exponential and linear functions using a variety of
descriptors (graphically, verbally, numerically, and algebraically)
Reasoning Learning Target(s) DART Statements
1. Use a variety of function representations (algebraically, graphically, numerically in tables, or by verbal descriptions) to compare and contrast properties of two functions
1. I can use a variety of function representations (algebraically, graphically,
numerically in tables, or by verbal descriptions) to compare and contrast properties
of two functions
Performance Skill Learning Target(s) DART Statements
Product Learning Target(s) DART Statements

Standards
F.BF.1 Write a function that describes a relationship between two quantities.*(Modeling standard) a. Determine an explicit expression, a recursive process, or steps for calculation from a context. Knowledge Learning Target(s) DART Statements
1. Define “explicit function” and “recursive process”.
Note from Appendix A: Limit to F.BF.1a to linear and exponential functions
1. I can define “explicit function” and “recursive process”.
Reasoning Learning Target(s) DART Statements
1. Write a function that describes a relationship between two quantities by determining an explicit expression, a recursive process, or steps for calculation from a context.
Note from Appendix A: Limit to F.BF.1a to linear and exponential functions
1. I can write a function that describes a relationship between two quantities by determining an explicit expression, a recursive process, or steps for calculation from a context.
Performance Skill Learning Target(s) DART Statements
Product Learning Target(s) DART Statements
Standards
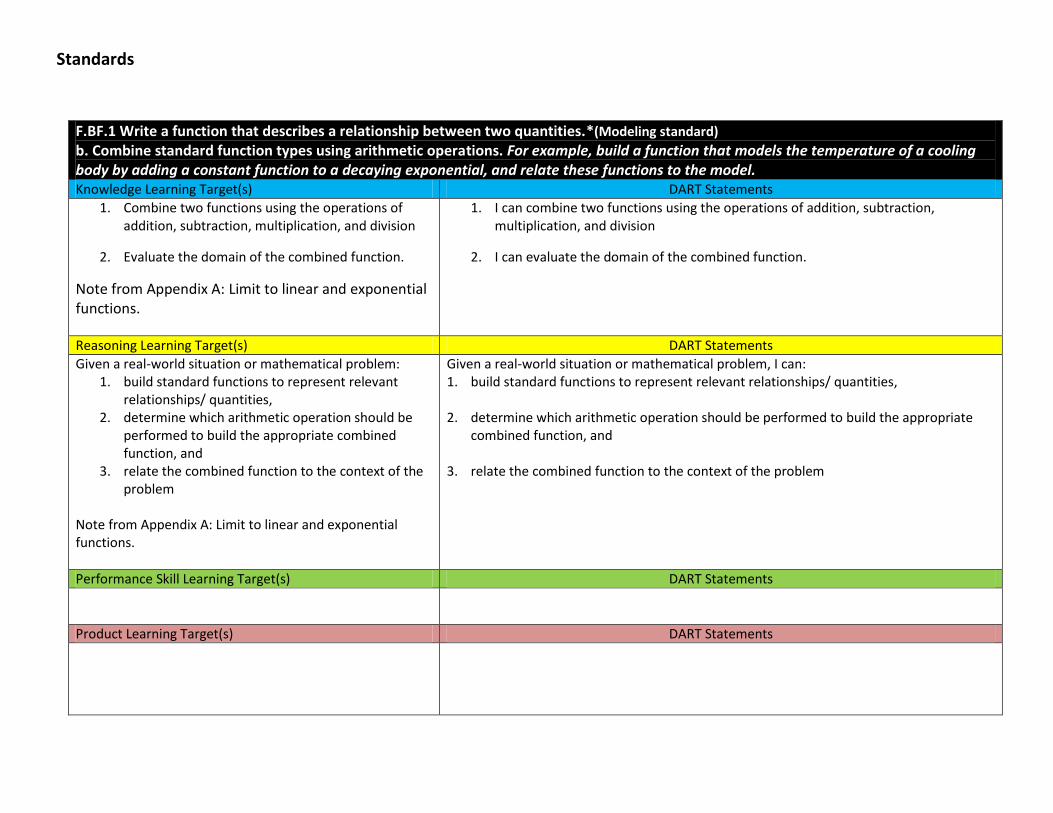
F.BF.1 Write a function that describes a relationship between two quantities.*(Modeling standard) b. Combine standard function types using arithmetic operations. For example, build a function that models the temperature of a cooling body by adding a constant function to a decaying exponential, and relate these functions to the model. Knowledge Learning Target(s) DART Statements
1. Combine two functions using the operations of addition, subtraction, multiplication, and division
2. Evaluate the domain of the combined function.
Note from Appendix A: Limit to linear and exponential functions.
1. I can combine two functions using the operations of addition, subtraction, multiplication, and division
2. I can evaluate the domain of the combined function.
Reasoning Learning Target(s) DART Statements
Given a real-world situation or mathematical problem: 1. build standard functions to represent relevant
relationships/ quantities, 2. determine which arithmetic operation should be
performed to build the appropriate combined function, and
3. relate the combined function to the context of the problem
Note from Appendix A: Limit to linear and exponential functions.
Given a real-world situation or mathematical problem, I can: 1. build standard functions to represent relevant relationships/ quantities,
2. determine which arithmetic operation should be performed to build the appropriate
combined function, and 3. relate the combined function to the context of the problem
Performance Skill Learning Target(s) DART Statements
Product Learning Target(s) DART Statements
Standards
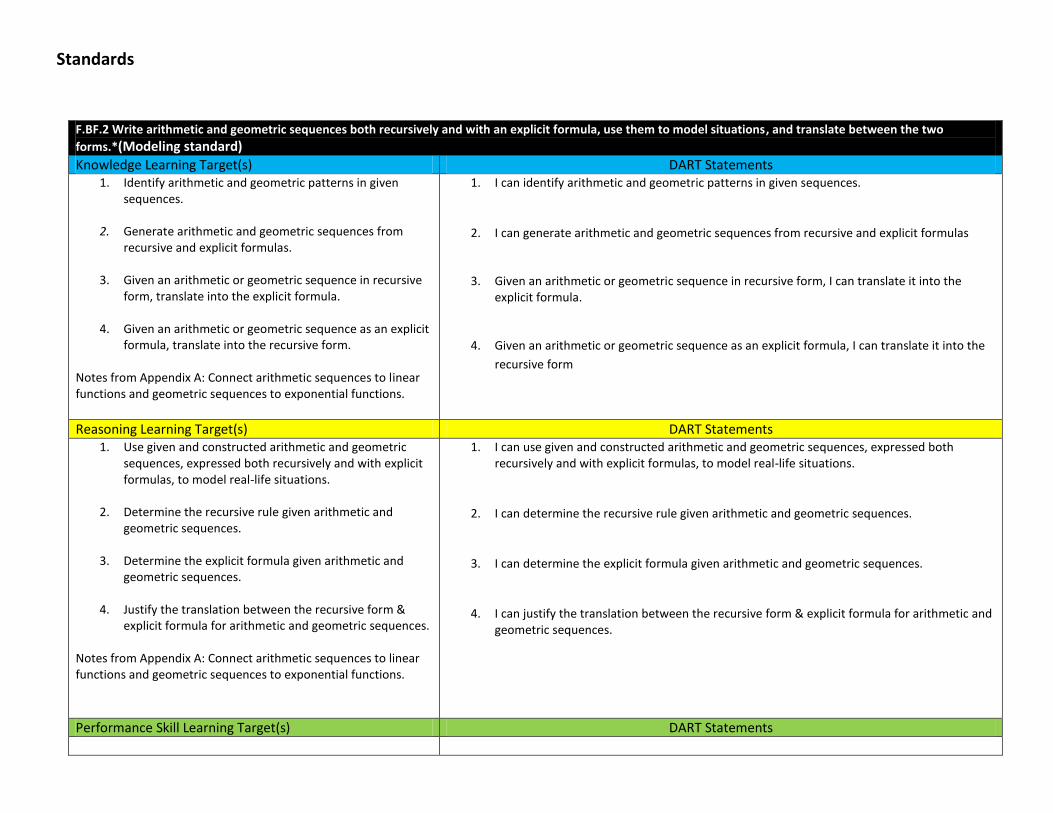
F.BF.2 Write arithmetic and geometric sequences both recursively and with an explicit formula, use them to model situations, and translate between the two
forms.*(Modeling standard) Knowledge Learning Target(s) DART Statements
1. Identify arithmetic and geometric patterns in given sequences.
2. Generate arithmetic and geometric sequences from
recursive and explicit formulas.
3. Given an arithmetic or geometric sequence in recursive form, translate into the explicit formula.
4. Given an arithmetic or geometric sequence as an explicit
formula, translate into the recursive form. Notes from Appendix A: Connect arithmetic sequences to linear functions and geometric sequences to exponential functions.
1. I can identify arithmetic and geometric patterns in given sequences.
2. I can generate arithmetic and geometric sequences from recursive and explicit formulas
3. Given an arithmetic or geometric sequence in recursive form, I can translate it into the
explicit formula.
4. Given an arithmetic or geometric sequence as an explicit formula, I can translate it into the
recursive form
Reasoning Learning Target(s) DART Statements 1. Use given and constructed arithmetic and geometric
sequences, expressed both recursively and with explicit formulas, to model real-life situations.
2. Determine the recursive rule given arithmetic and
geometric sequences.
3. Determine the explicit formula given arithmetic and geometric sequences.
4. Justify the translation between the recursive form &
explicit formula for arithmetic and geometric sequences. Notes from Appendix A: Connect arithmetic sequences to linear functions and geometric sequences to exponential functions.
1. I can use given and constructed arithmetic and geometric sequences, expressed both recursively and with explicit formulas, to model real-life situations.
2. I can determine the recursive rule given arithmetic and geometric sequences.
3. I can determine the explicit formula given arithmetic and geometric sequences.
4. I can justify the translation between the recursive form & explicit formula for arithmetic and geometric sequences.
Performance Skill Learning Target(s) DART Statements
Standards
Product Learning Target(s) DART Statements
Standards
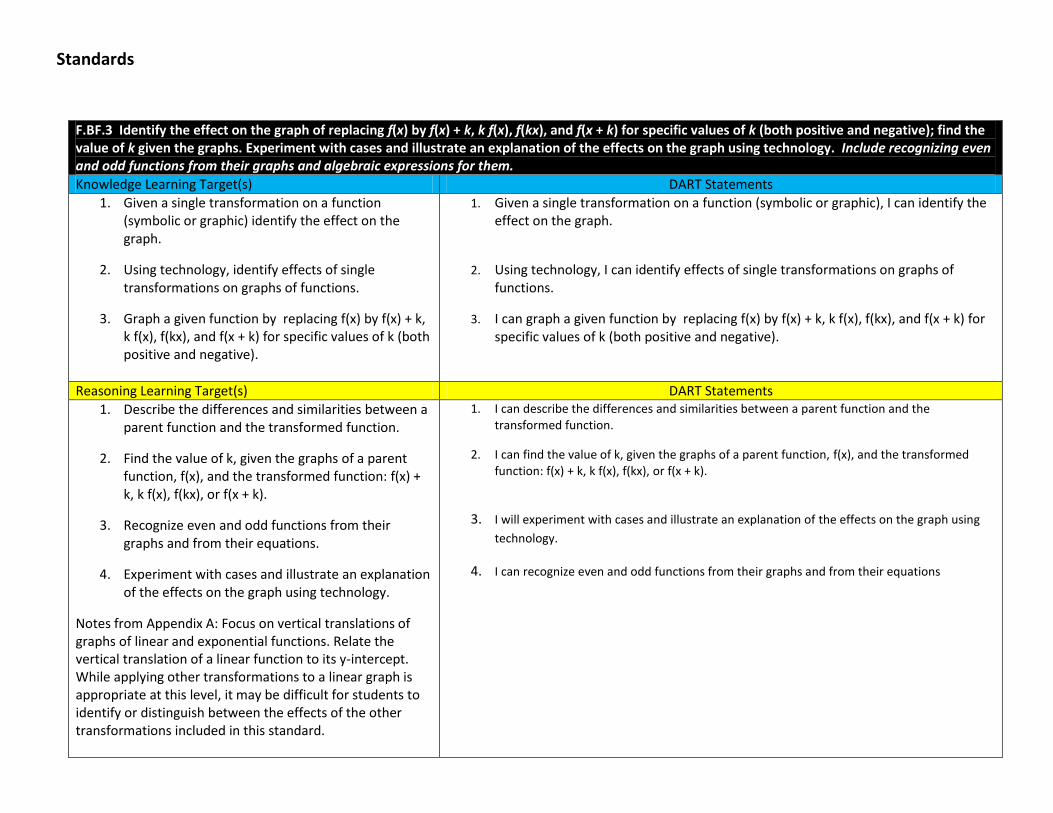
F.BF.3 Identify the effect on the graph of replacing f(x) by f(x) + k, k f(x), f(kx), and f(x + k) for specific values of k (both positive and negative); find the value of k given the graphs. Experiment with cases and illustrate an explanation of the effects on the graph using technology. Include recognizing even and odd functions from their graphs and algebraic expressions for them. Knowledge Learning Target(s) DART Statements
1. Given a single transformation on a function (symbolic or graphic) identify the effect on the graph.
2. Using technology, identify effects of single transformations on graphs of functions.
3. Graph a given function by replacing f(x) by f(x) + k, k f(x), f(kx), and f(x + k) for specific values of k (both positive and negative).
1. Given a single transformation on a function (symbolic or graphic), I can identify the effect on the graph.
2. Using technology, I can identify effects of single transformations on graphs of functions.
3. I can graph a given function by replacing f(x) by f(x) + k, k f(x), f(kx), and f(x + k) for specific values of k (both positive and negative).
Reasoning Learning Target(s) DART Statements
1. Describe the differences and similarities between a parent function and the transformed function.
2. Find the value of k, given the graphs of a parent function, f(x), and the transformed function: f(x) + k, k f(x), f(kx), or f(x + k).
3. Recognize even and odd functions from their graphs and from their equations.
4. Experiment with cases and illustrate an explanation of the effects on the graph using technology.
Notes from Appendix A: Focus on vertical translations of graphs of linear and exponential functions. Relate the vertical translation of a linear function to its y-intercept. While applying other transformations to a linear graph is appropriate at this level, it may be difficult for students to identify or distinguish between the effects of the other transformations included in this standard.
1. I can describe the differences and similarities between a parent function and the transformed function.
2. I can find the value of k, given the graphs of a parent function, f(x), and the transformed function: f(x) + k, k f(x), f(kx), or f(x + k).
3. I will experiment with cases and illustrate an explanation of the effects on the graph using
technology.
4. I can recognize even and odd functions from their graphs and from their equations
Standards
Performance Skill Learning Target(s) DART Statements
Product Learning Target(s) DART Statements
Standards
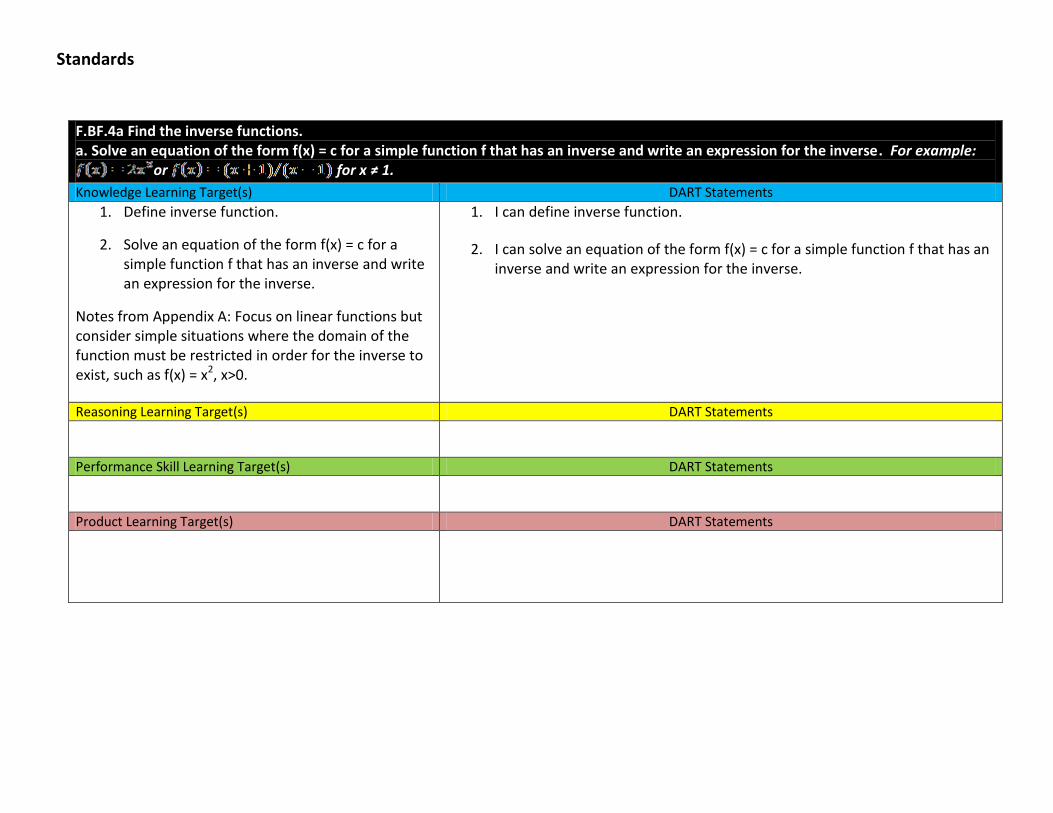
F.BF.4a Find the inverse functions. a. Solve an equation of the form f(x) = c for a simple function f that has an inverse and write an expression for the inverse. For example:
or for x ≠ 1. Knowledge Learning Target(s) DART Statements
1. Define inverse function.
2. Solve an equation of the form f(x) = c for a simple function f that has an inverse and write an expression for the inverse.
Notes from Appendix A: Focus on linear functions but consider simple situations where the domain of the function must be restricted in order for the inverse to exist, such as f(x) = x2, x>0.
1. I can define inverse function.
2. I can solve an equation of the form f(x) = c for a simple function f that has an inverse and write an expression for the inverse.
Reasoning Learning Target(s) DART Statements
Performance Skill Learning Target(s) DART Statements
Product Learning Target(s) DART Statements
Standards
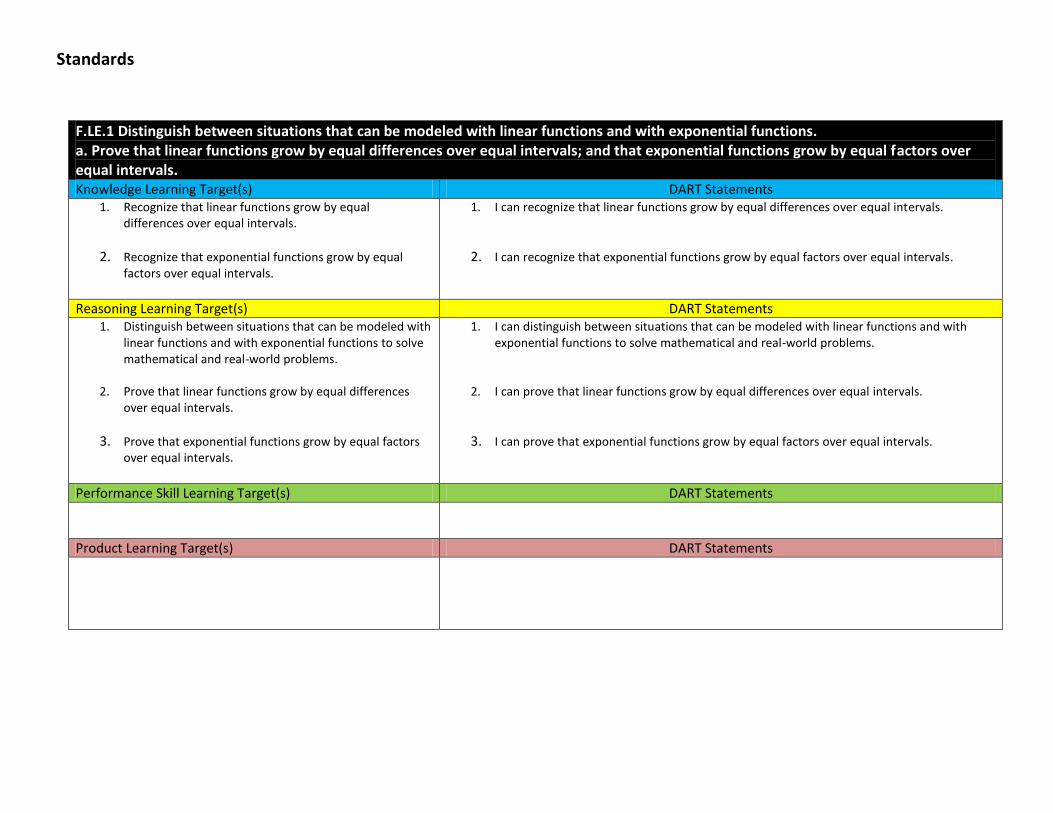
F.LE.1 Distinguish between situations that can be modeled with linear functions and with exponential functions. a. Prove that linear functions grow by equal differences over equal intervals; and that exponential functions grow by equal factors over equal intervals. Knowledge Learning Target(s) DART Statements
1. Recognize that linear functions grow by equal differences over equal intervals.
2. Recognize that exponential functions grow by equal factors over equal intervals.
1. I can recognize that linear functions grow by equal differences over equal intervals.
2. I can recognize that exponential functions grow by equal factors over equal intervals.
Reasoning Learning Target(s) DART Statements 1. Distinguish between situations that can be modeled with
linear functions and with exponential functions to solve mathematical and real-world problems.
2. Prove that linear functions grow by equal differences
over equal intervals.
3. Prove that exponential functions grow by equal factors over equal intervals.
1. I can distinguish between situations that can be modeled with linear functions and with exponential functions to solve mathematical and real-world problems.
2. I can prove that linear functions grow by equal differences over equal intervals.
3. I can prove that exponential functions grow by equal factors over equal intervals.
Performance Skill Learning Target(s) DART Statements
Product Learning Target(s) DART Statements
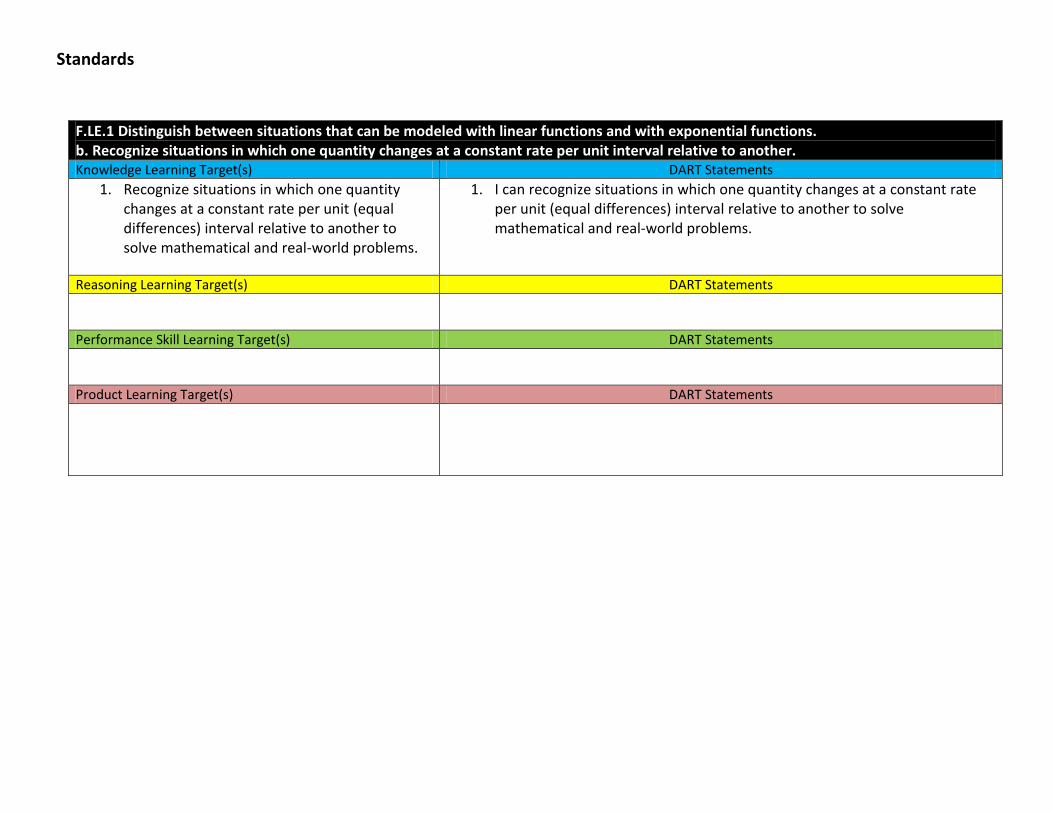
Standards
F.LE.1 Distinguish between situations that can be modeled with linear functions and with exponential functions. b. Recognize situations in which one quantity changes at a constant rate per unit interval relative to another. Knowledge Learning Target(s) DART Statements
1. Recognize situations in which one quantity changes at a constant rate per unit (equal differences) interval relative to another to solve mathematical and real-world problems.
1. I can recognize situations in which one quantity changes at a constant rate per unit (equal differences) interval relative to another to solve mathematical and real-world problems.
Reasoning Learning Target(s) DART Statements
Performance Skill Learning Target(s) DART Statements
Product Learning Target(s) DART Statements
Standards
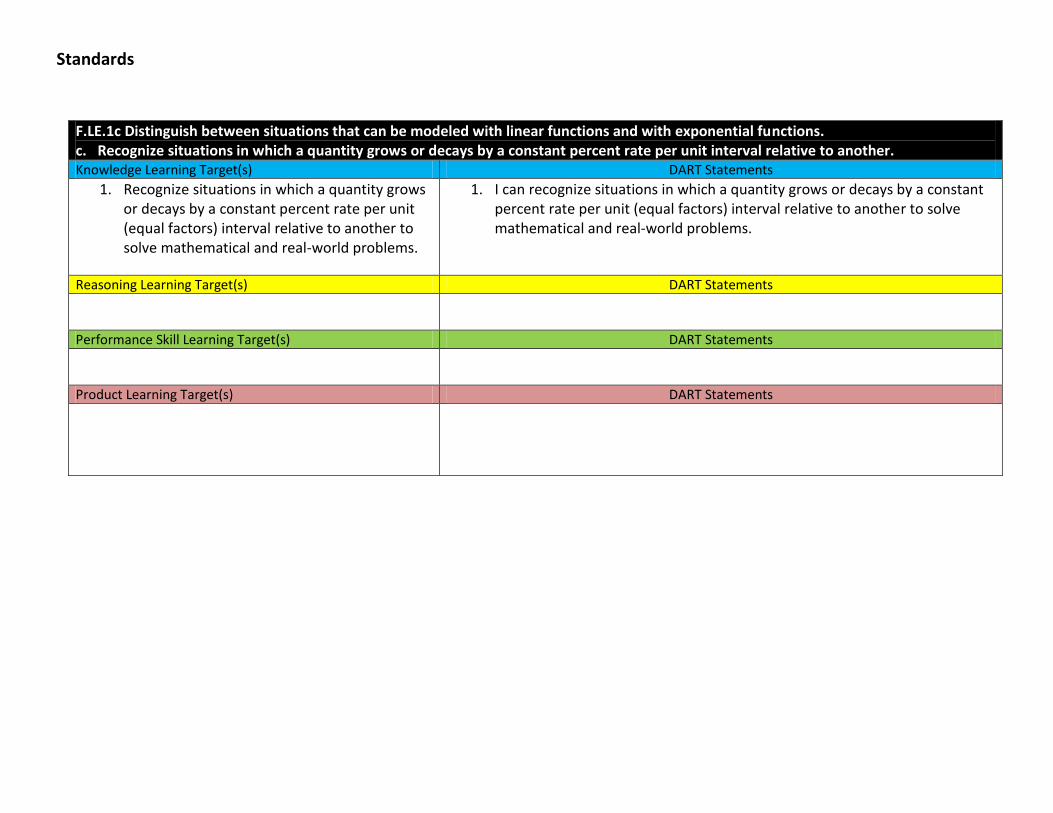
F.LE.1c Distinguish between situations that can be modeled with linear functions and with exponential functions. c. Recognize situations in which a quantity grows or decays by a constant percent rate per unit interval relative to another. Knowledge Learning Target(s) DART Statements
1. Recognize situations in which a quantity grows or decays by a constant percent rate per unit (equal factors) interval relative to another to solve mathematical and real-world problems.
1. I can recognize situations in which a quantity grows or decays by a constant percent rate per unit (equal factors) interval relative to another to solve mathematical and real-world problems.
Reasoning Learning Target(s) DART Statements
Performance Skill Learning Target(s) DART Statements
Product Learning Target(s) DART Statements
Standards
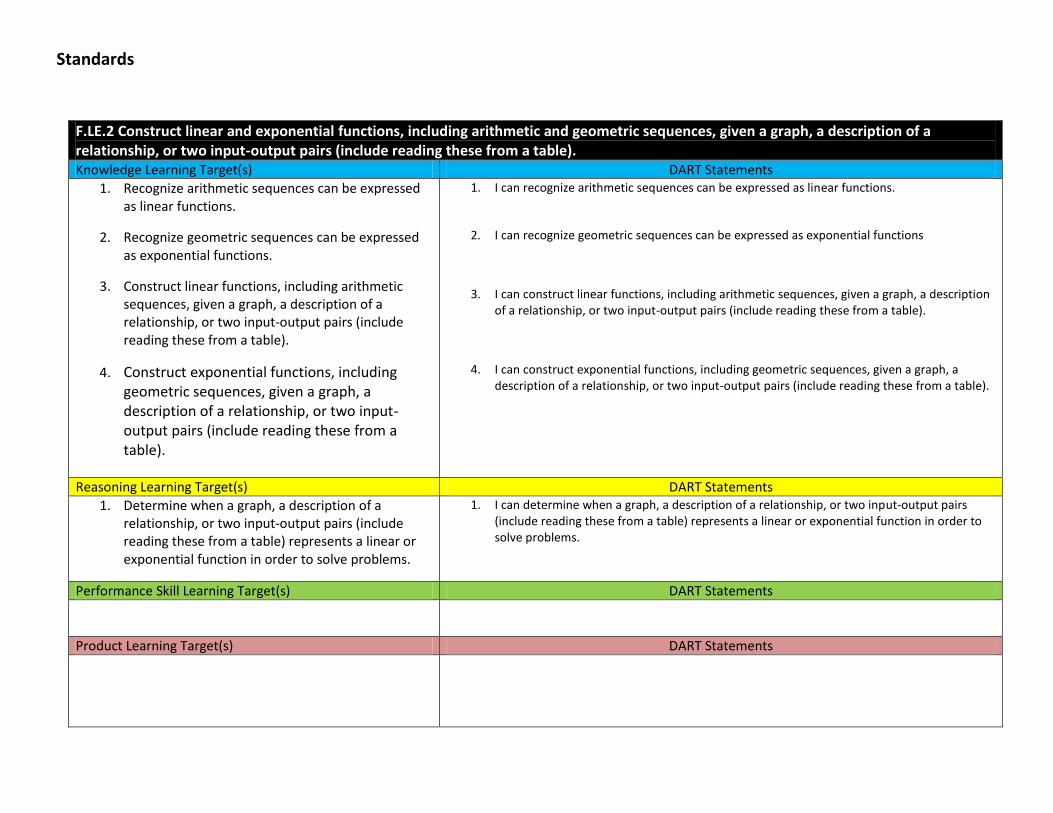
F.LE.2 Construct linear and exponential functions, including arithmetic and geometric sequences, given a graph, a description of a relationship, or two input-output pairs (include reading these from a table). Knowledge Learning Target(s) DART Statements
1. Recognize arithmetic sequences can be expressed as linear functions.
2. Recognize geometric sequences can be expressed as exponential functions.
3. Construct linear functions, including arithmetic sequences, given a graph, a description of a relationship, or two input-output pairs (include reading these from a table).
4. Construct exponential functions, including geometric sequences, given a graph, a description of a relationship, or two input-output pairs (include reading these from a table).
1. I can recognize arithmetic sequences can be expressed as linear functions.
2. I can recognize geometric sequences can be expressed as exponential functions
3. I can construct linear functions, including arithmetic sequences, given a graph, a description of a relationship, or two input-output pairs (include reading these from a table).
4. I can construct exponential functions, including geometric sequences, given a graph, a description of a relationship, or two input-output pairs (include reading these from a table).
Reasoning Learning Target(s) DART Statements
1. Determine when a graph, a description of a relationship, or two input-output pairs (include reading these from a table) represents a linear or exponential function in order to solve problems.
1. I can determine when a graph, a description of a relationship, or two input-output pairs (include reading these from a table) represents a linear or exponential function in order to solve problems.
Performance Skill Learning Target(s) DART Statements
Product Learning Target(s) DART Statements
Standards
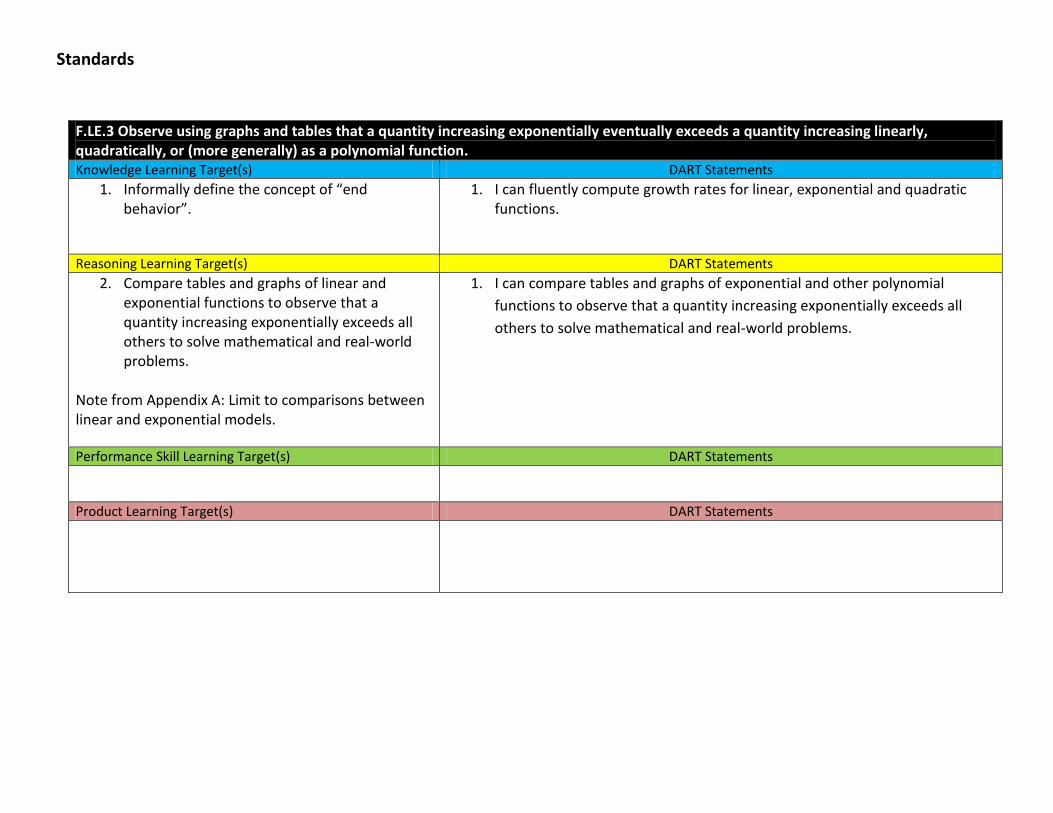
F.LE.3 Observe using graphs and tables that a quantity increasing exponentially eventually exceeds a quantity increasing linearly, quadratically, or (more generally) as a polynomial function. Knowledge Learning Target(s) DART Statements
1. Informally define the concept of “end behavior”.
1. I can fluently compute growth rates for linear, exponential and quadratic functions.
Reasoning Learning Target(s) DART Statements
2. Compare tables and graphs of linear and exponential functions to observe that a quantity increasing exponentially exceeds all others to solve mathematical and real-world problems.
Note from Appendix A: Limit to comparisons between linear and exponential models.
1. I can compare tables and graphs of exponential and other polynomial
functions to observe that a quantity increasing exponentially exceeds all
others to solve mathematical and real-world problems.
Performance Skill Learning Target(s) DART Statements
Product Learning Target(s) DART Statements
Standards
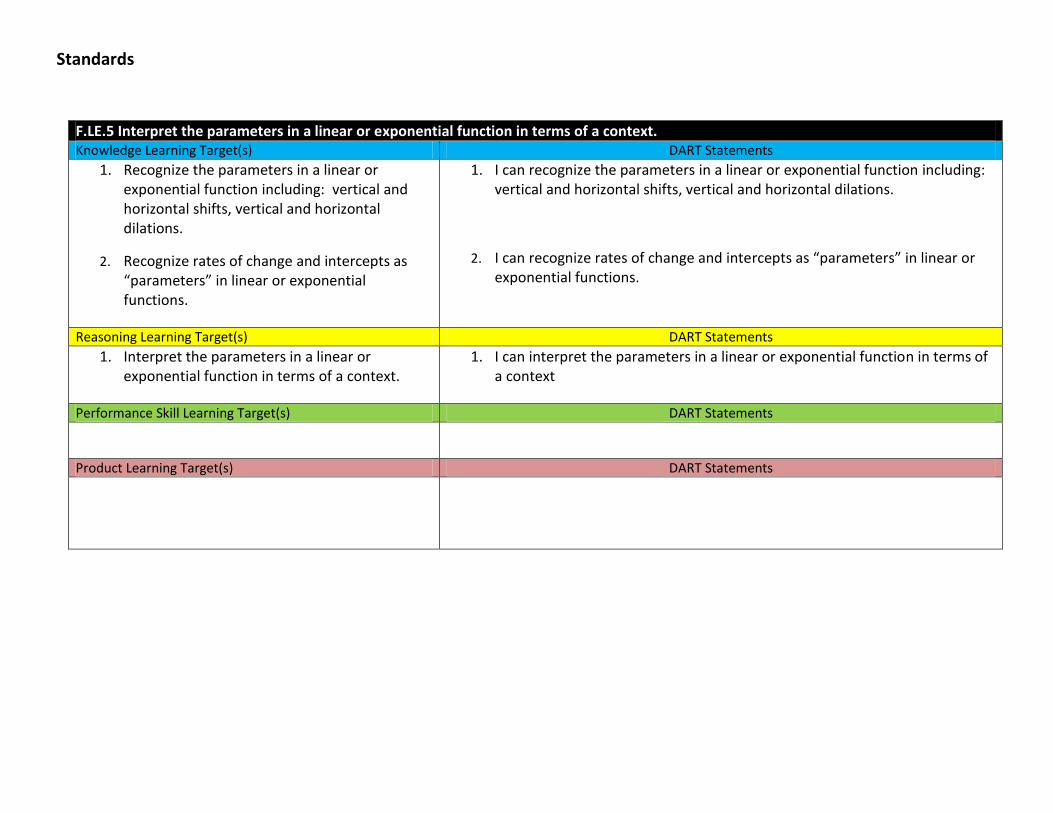
F.LE.5 Interpret the parameters in a linear or exponential function in terms of a context. Knowledge Learning Target(s) DART Statements
1. Recognize the parameters in a linear or exponential function including: vertical and horizontal shifts, vertical and horizontal dilations.
2. Recognize rates of change and intercepts as “parameters” in linear or exponential functions.
1. I can recognize the parameters in a linear or exponential function including: vertical and horizontal shifts, vertical and horizontal dilations.
2. I can recognize rates of change and intercepts as “parameters” in linear or exponential functions.
Reasoning Learning Target(s) DART Statements
1. Interpret the parameters in a linear or exponential function in terms of a context.
1. I can interpret the parameters in a linear or exponential function in terms of a context
Performance Skill Learning Target(s) DART Statements
Product Learning Target(s) DART Statements
Standards
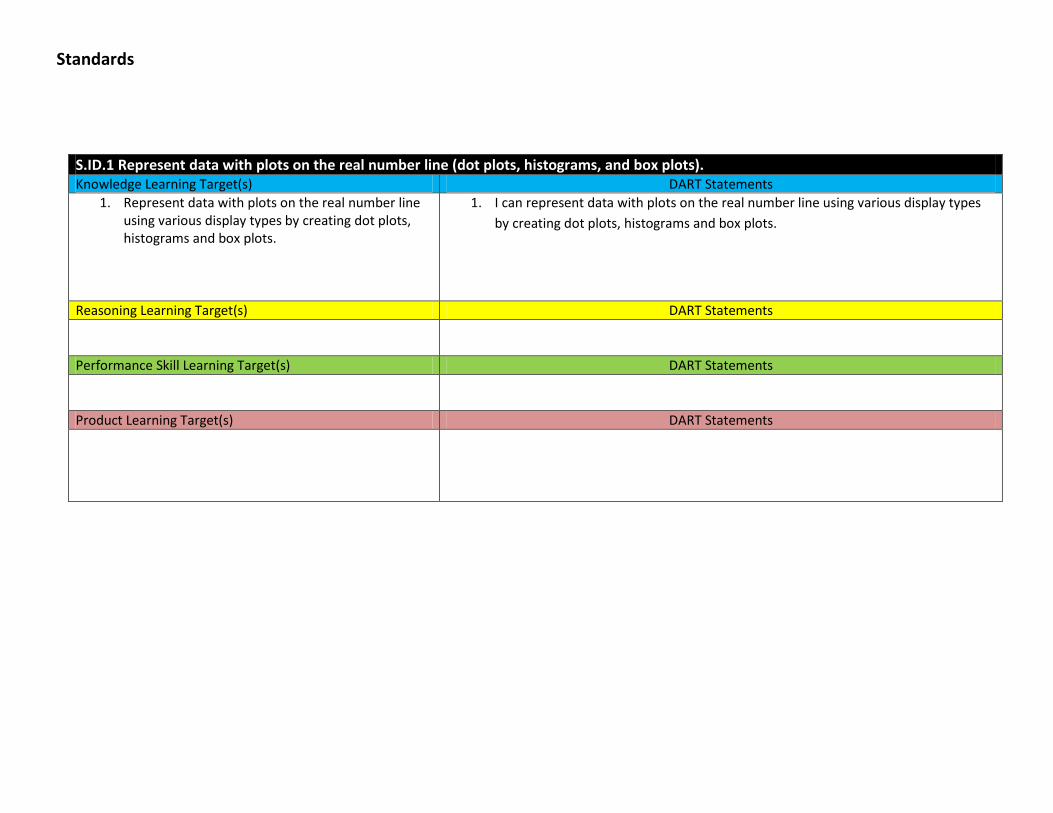
S.ID.1 Represent data with plots on the real number line (dot plots, histograms, and box plots). Knowledge Learning Target(s) DART Statements
1. Represent data with plots on the real number line using various display types by creating dot plots, histograms and box plots.
1. I can represent data with plots on the real number line using various display types
by creating dot plots, histograms and box plots.
Reasoning Learning Target(s) DART Statements
Performance Skill Learning Target(s) DART Statements
Product Learning Target(s) DART Statements
Standards
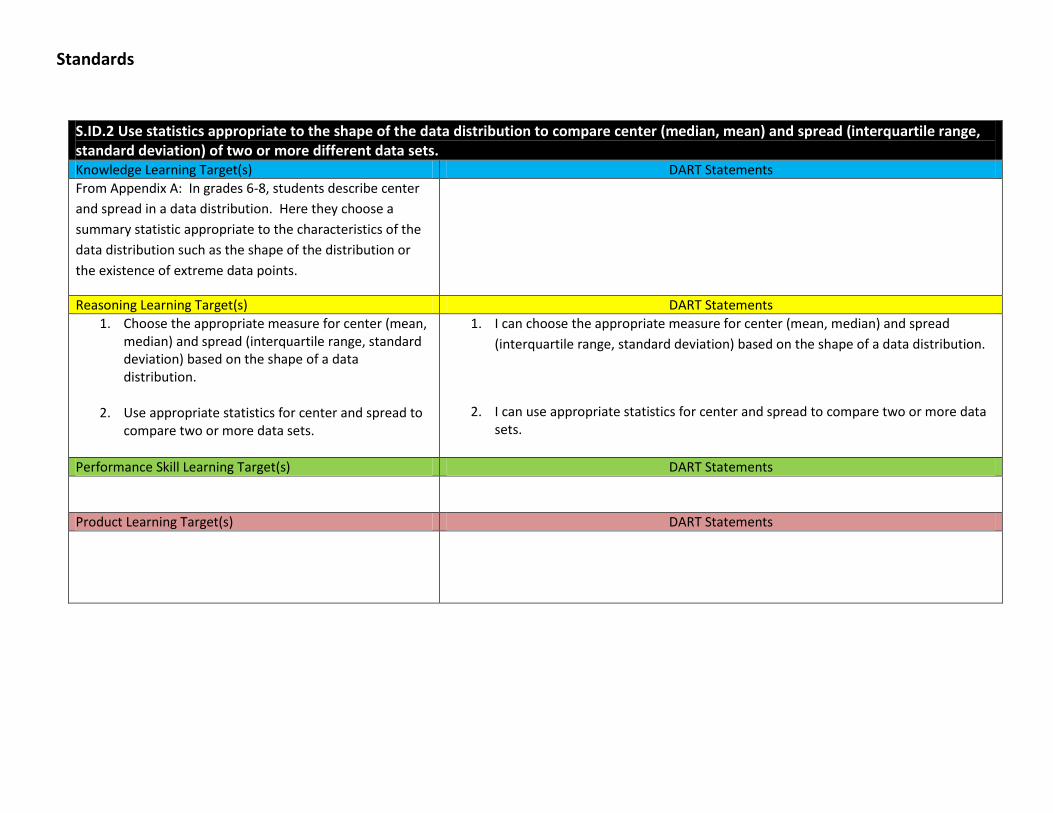
S.ID.2 Use statistics appropriate to the shape of the data distribution to compare center (median, mean) and spread (interquartile range, standard deviation) of two or more different data sets. Knowledge Learning Target(s) DART Statements
From Appendix A: In grades 6-8, students describe center
and spread in a data distribution. Here they choose a
summary statistic appropriate to the characteristics of the
data distribution such as the shape of the distribution or
the existence of extreme data points.
Reasoning Learning Target(s) DART Statements
1. Choose the appropriate measure for center (mean, median) and spread (interquartile range, standard deviation) based on the shape of a data distribution.
2. Use appropriate statistics for center and spread to
compare two or more data sets.
1. I can choose the appropriate measure for center (mean, median) and spread
(interquartile range, standard deviation) based on the shape of a data distribution.
2. I can use appropriate statistics for center and spread to compare two or more data sets.
Performance Skill Learning Target(s) DART Statements
Product Learning Target(s) DART Statements
Standards
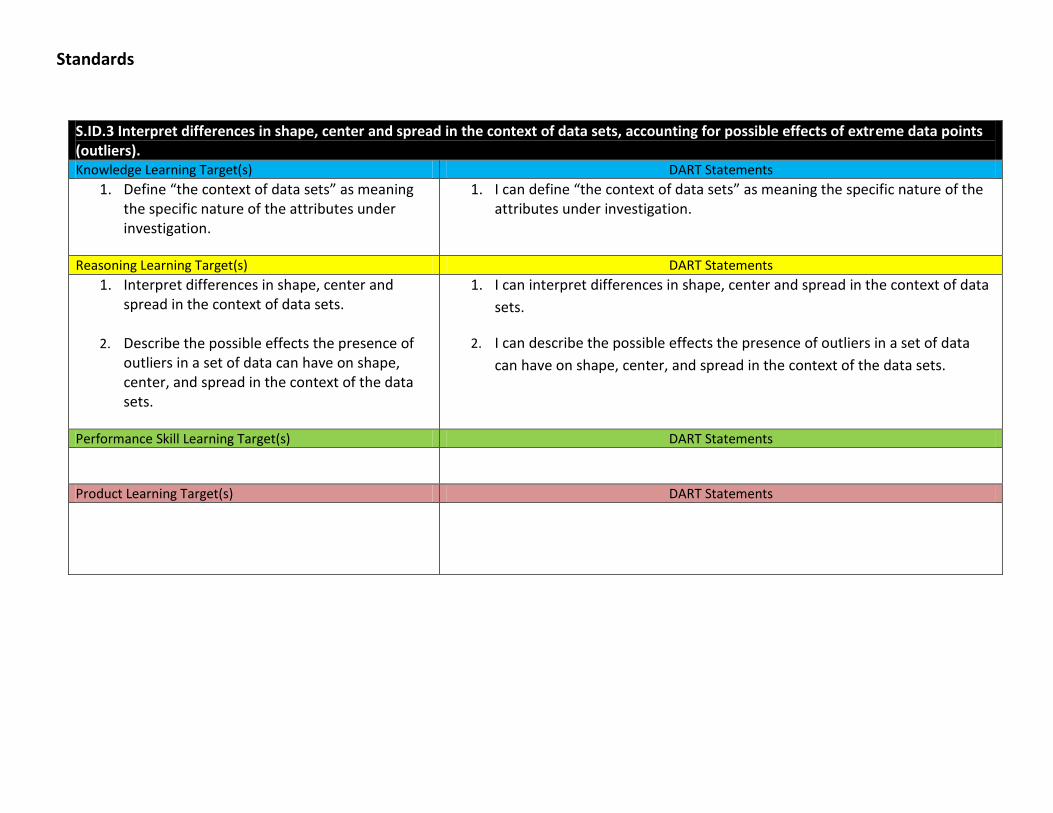
S.ID.3 Interpret differences in shape, center and spread in the context of data sets, accounting for possible effects of extreme data points (outliers). Knowledge Learning Target(s) DART Statements
1. Define “the context of data sets” as meaning the specific nature of the attributes under investigation.
1. I can define “the context of data sets” as meaning the specific nature of the attributes under investigation.
Reasoning Learning Target(s) DART Statements
1. Interpret differences in shape, center and spread in the context of data sets.
2. Describe the possible effects the presence of
outliers in a set of data can have on shape, center, and spread in the context of the data sets.
1. I can interpret differences in shape, center and spread in the context of data
sets.
2. I can describe the possible effects the presence of outliers in a set of data
can have on shape, center, and spread in the context of the data sets.
Performance Skill Learning Target(s) DART Statements
Product Learning Target(s) DART Statements
Standards
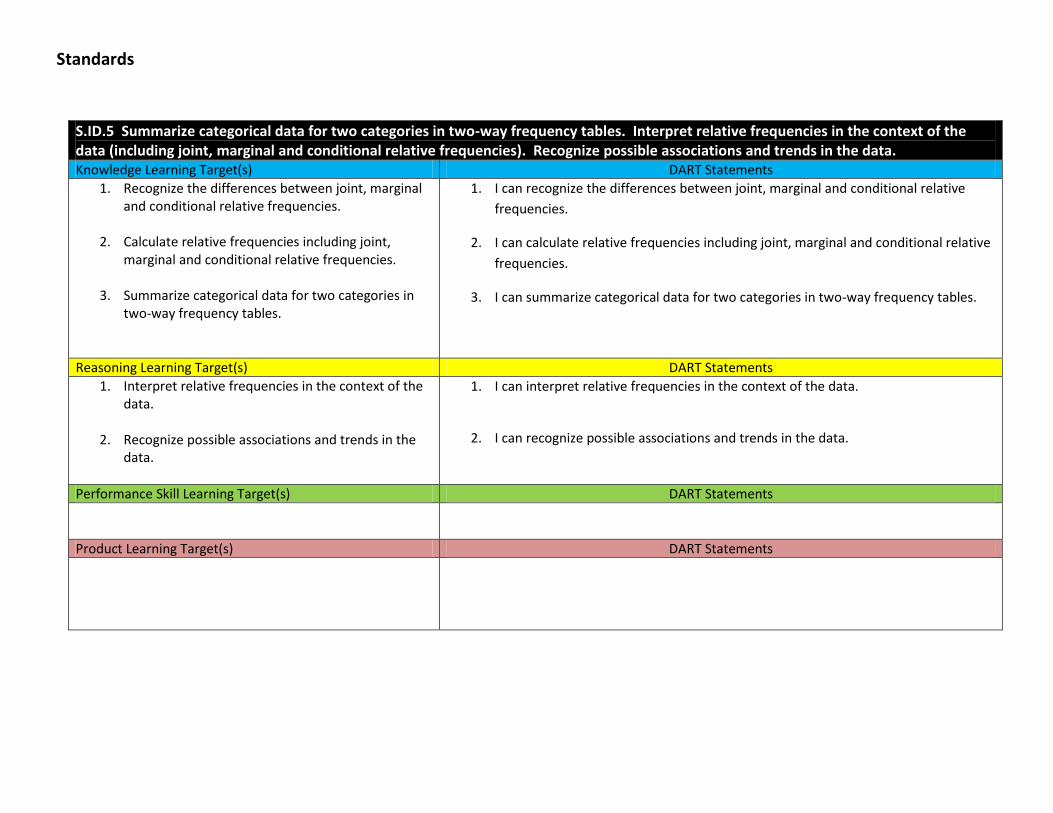
S.ID.5 Summarize categorical data for two categories in two-way frequency tables. Interpret relative frequencies in the context of the data (including joint, marginal and conditional relative frequencies). Recognize possible associations and trends in the data. Knowledge Learning Target(s) DART Statements
1. Recognize the differences between joint, marginal and conditional relative frequencies.
2. Calculate relative frequencies including joint,
marginal and conditional relative frequencies.
3. Summarize categorical data for two categories in two-way frequency tables.
1. I can recognize the differences between joint, marginal and conditional relative
frequencies.
2. I can calculate relative frequencies including joint, marginal and conditional relative
frequencies.
3. I can summarize categorical data for two categories in two-way frequency tables.
Reasoning Learning Target(s) DART Statements
1. Interpret relative frequencies in the context of the data.
2. Recognize possible associations and trends in the
data.
1. I can interpret relative frequencies in the context of the data.
2. I can recognize possible associations and trends in the data.
Performance Skill Learning Target(s) DART Statements
Product Learning Target(s) DART Statements
Standards
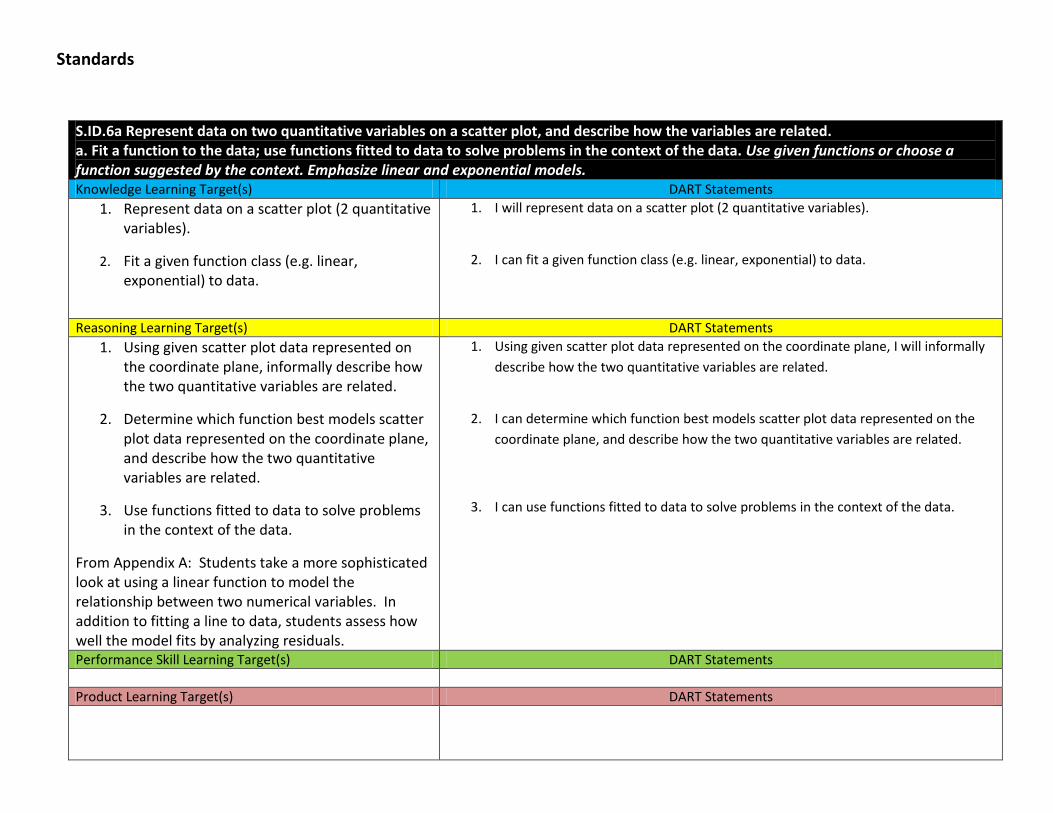
S.ID.6a Represent data on two quantitative variables on a scatter plot, and describe how the variables are related. a. Fit a function to the data; use functions fitted to data to solve problems in the context of the data. Use given functions or choose a function suggested by the context. Emphasize linear and exponential models. Knowledge Learning Target(s) DART Statements
1. Represent data on a scatter plot (2 quantitative variables).
2. Fit a given function class (e.g. linear, exponential) to data.
1. I will represent data on a scatter plot (2 quantitative variables).
2. I can fit a given function class (e.g. linear, exponential) to data.
Reasoning Learning Target(s) DART Statements
1. Using given scatter plot data represented on the coordinate plane, informally describe how the two quantitative variables are related.
2. Determine which function best models scatter plot data represented on the coordinate plane, and describe how the two quantitative variables are related.
3. Use functions fitted to data to solve problems in the context of the data.
From Appendix A: Students take a more sophisticated look at using a linear function to model the relationship between two numerical variables. In addition to fitting a line to data, students assess how well the model fits by analyzing residuals.
1. Using given scatter plot data represented on the coordinate plane, I will informally
describe how the two quantitative variables are related.
2. I can determine which function best models scatter plot data represented on the
coordinate plane, and describe how the two quantitative variables are related.
3. I can use functions fitted to data to solve problems in the context of the data.
Performance Skill Learning Target(s) DART Statements
Product Learning Target(s) DART Statements
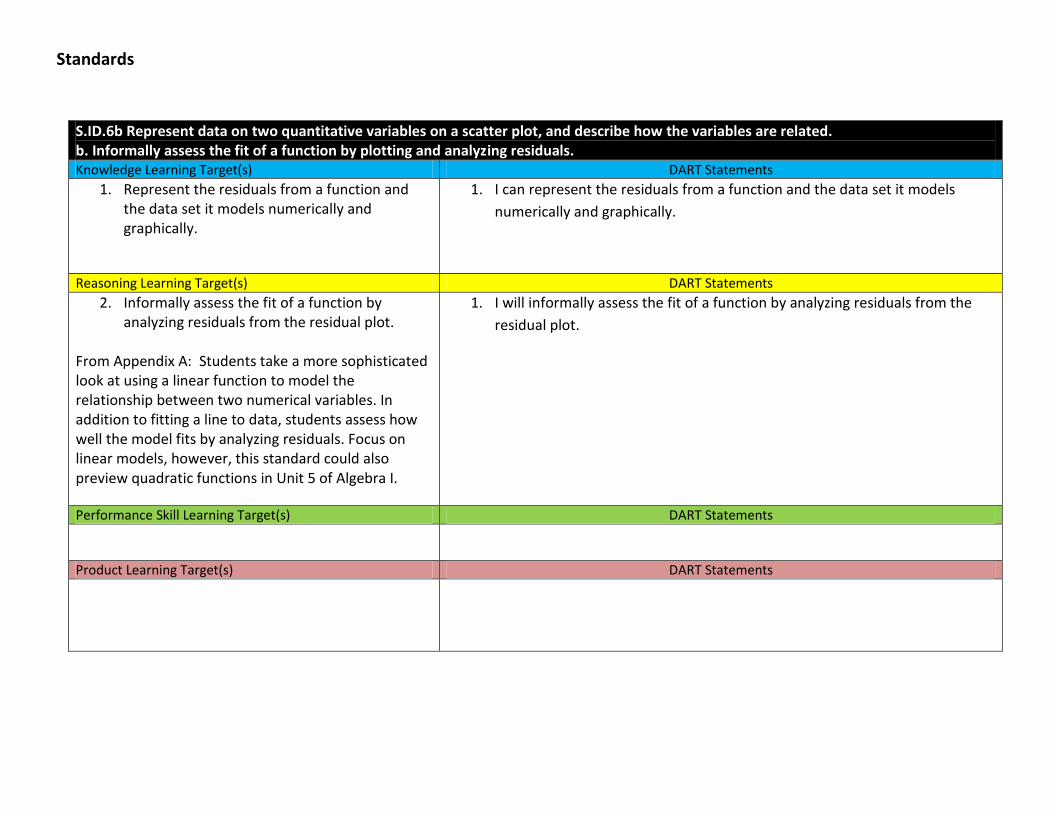
Standards
S.ID.6b Represent data on two quantitative variables on a scatter plot, and describe how the variables are related. b. Informally assess the fit of a function by plotting and analyzing residuals. Knowledge Learning Target(s) DART Statements
1. Represent the residuals from a function and the data set it models numerically and graphically.
1. I can represent the residuals from a function and the data set it models
numerically and graphically.
Reasoning Learning Target(s) DART Statements
2. Informally assess the fit of a function by analyzing residuals from the residual plot.
From Appendix A: Students take a more sophisticated look at using a linear function to model the relationship between two numerical variables. In addition to fitting a line to data, students assess how well the model fits by analyzing residuals. Focus on linear models, however, this standard could also preview quadratic functions in Unit 5 of Algebra I.
1. I will informally assess the fit of a function by analyzing residuals from the
residual plot.
Performance Skill Learning Target(s) DART Statements
Product Learning Target(s) DART Statements
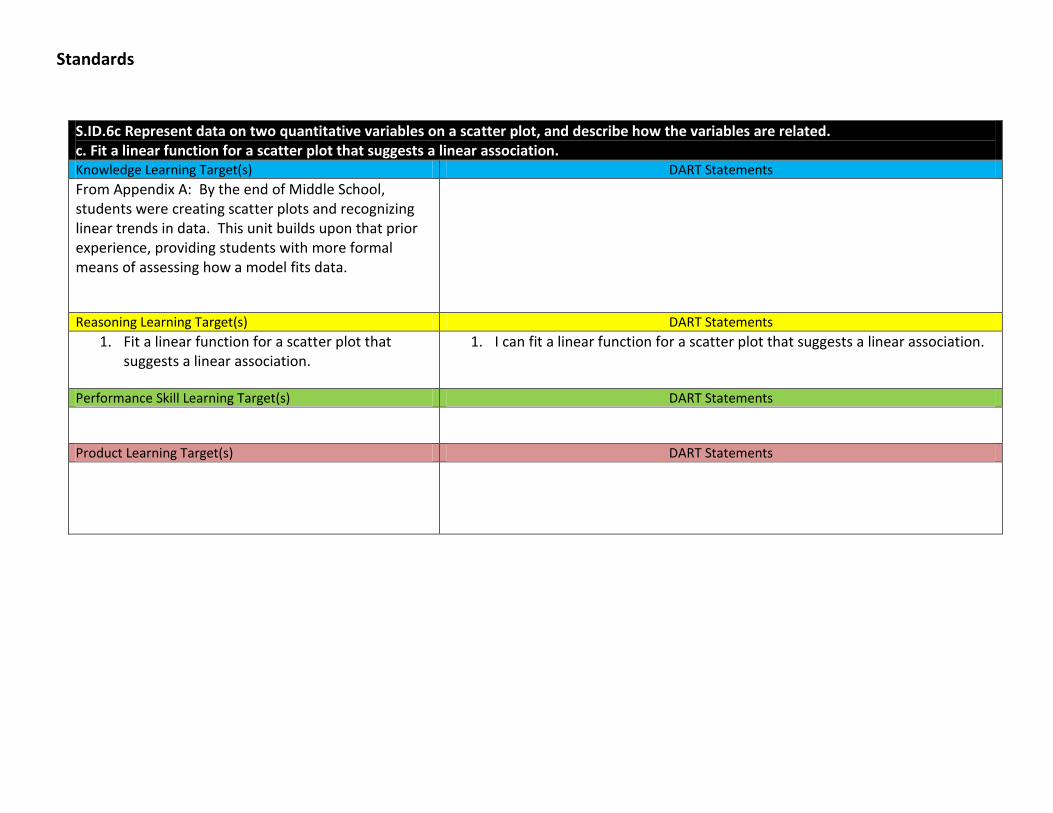
Standards
S.ID.6c Represent data on two quantitative variables on a scatter plot, and describe how the variables are related. c. Fit a linear function for a scatter plot that suggests a linear association. Knowledge Learning Target(s) DART Statements
From Appendix A: By the end of Middle School, students were creating scatter plots and recognizing linear trends in data. This unit builds upon that prior experience, providing students with more formal means of assessing how a model fits data.
Reasoning Learning Target(s) DART Statements
1. Fit a linear function for a scatter plot that suggests a linear association.
1. I can fit a linear function for a scatter plot that suggests a linear association.
Performance Skill Learning Target(s) DART Statements
Product Learning Target(s) DART Statements
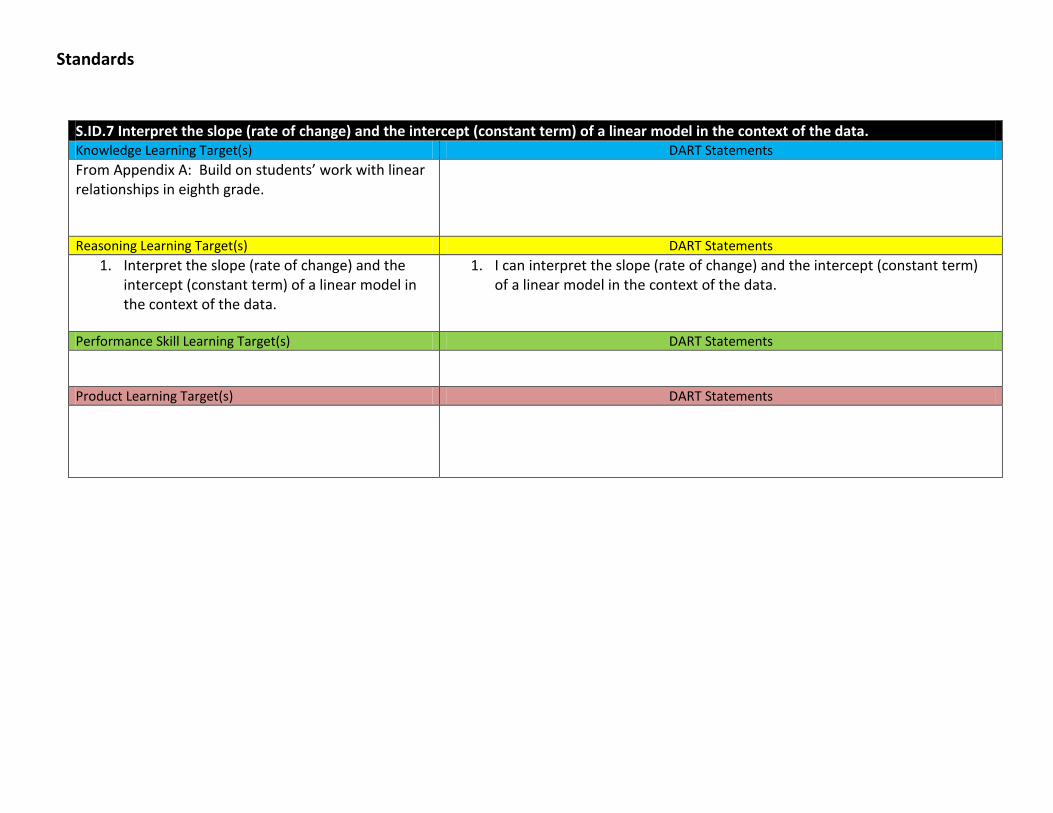
Standards
S.ID.7 Interpret the slope (rate of change) and the intercept (constant term) of a linear model in the context of the data. Knowledge Learning Target(s) DART Statements
From Appendix A: Build on students’ work with linear relationships in eighth grade.
Reasoning Learning Target(s) DART Statements
1. Interpret the slope (rate of change) and the intercept (constant term) of a linear model in the context of the data.
1. I can interpret the slope (rate of change) and the intercept (constant term) of a linear model in the context of the data.
Performance Skill Learning Target(s) DART Statements
Product Learning Target(s) DART Statements
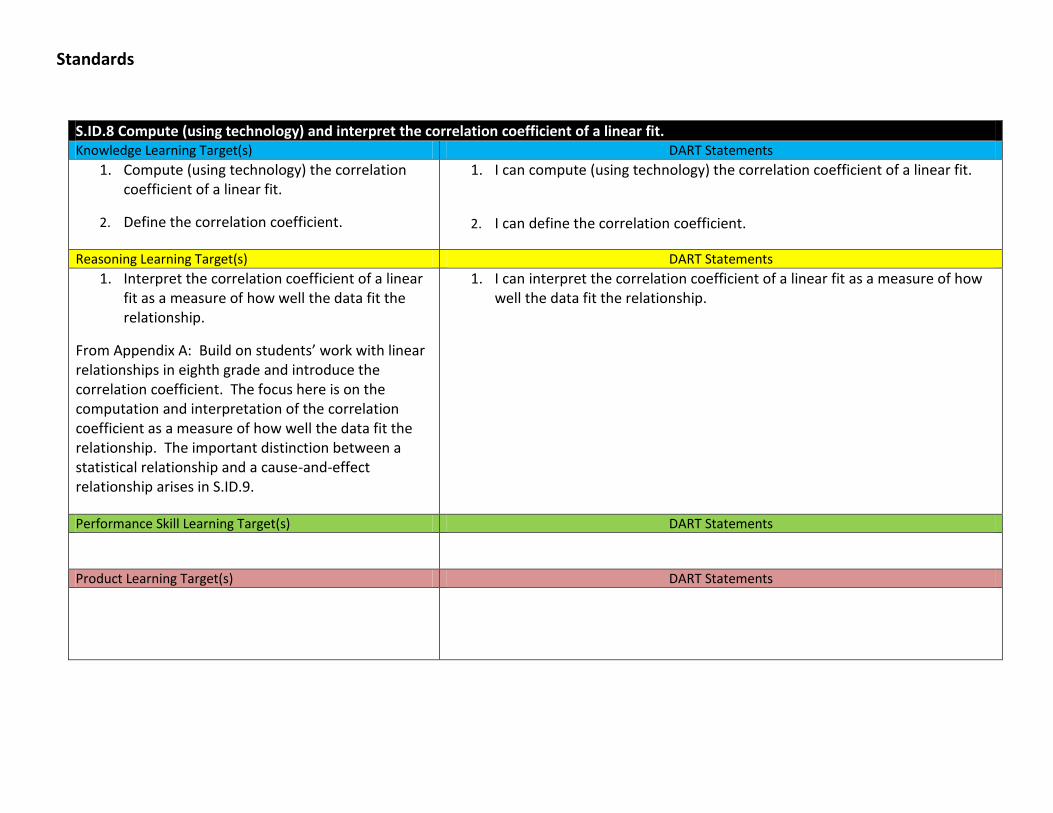
Standards
S.ID.8 Compute (using technology) and interpret the correlation coefficient of a linear fit. Knowledge Learning Target(s) DART Statements
1. Compute (using technology) the correlation coefficient of a linear fit.
2. Define the correlation coefficient.
1. I can compute (using technology) the correlation coefficient of a linear fit.
2. I can define the correlation coefficient.
Reasoning Learning Target(s) DART Statements
1. Interpret the correlation coefficient of a linear fit as a measure of how well the data fit the relationship.
From Appendix A: Build on students’ work with linear relationships in eighth grade and introduce the correlation coefficient. The focus here is on the computation and interpretation of the correlation coefficient as a measure of how well the data fit the relationship. The important distinction between a statistical relationship and a cause-and-effect relationship arises in S.ID.9.
1. I can interpret the correlation coefficient of a linear fit as a measure of how well the data fit the relationship.
Performance Skill Learning Target(s) DART Statements
Product Learning Target(s) DART Statements
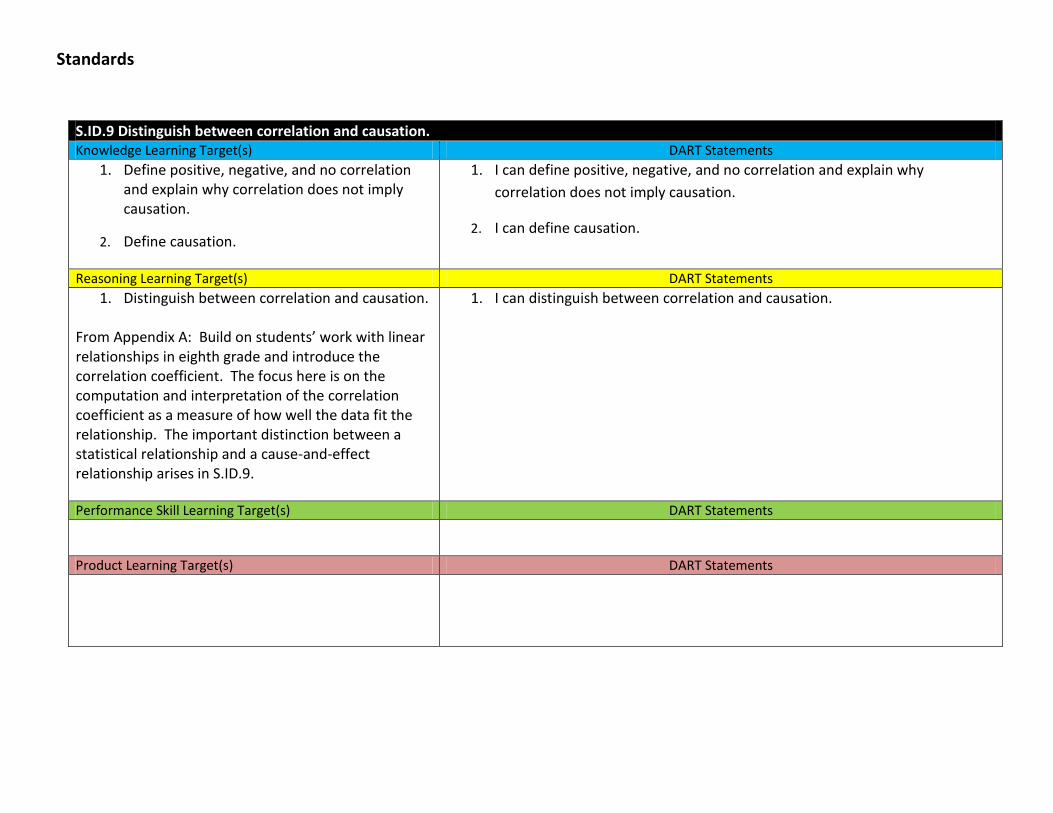
Standards
S.ID.9 Distinguish between correlation and causation. Knowledge Learning Target(s) DART Statements
1. Define positive, negative, and no correlation and explain why correlation does not imply causation.
2. Define causation.
1. I can define positive, negative, and no correlation and explain why
correlation does not imply causation.
2. I can define causation.
Reasoning Learning Target(s) DART Statements
1. Distinguish between correlation and causation. From Appendix A: Build on students’ work with linear relationships in eighth grade and introduce the correlation coefficient. The focus here is on the computation and interpretation of the correlation coefficient as a measure of how well the data fit the relationship. The important distinction between a statistical relationship and a cause-and-effect relationship arises in S.ID.9.
1. I can distinguish between correlation and causation.
Performance Skill Learning Target(s) DART Statements
Product Learning Target(s) DART Statements
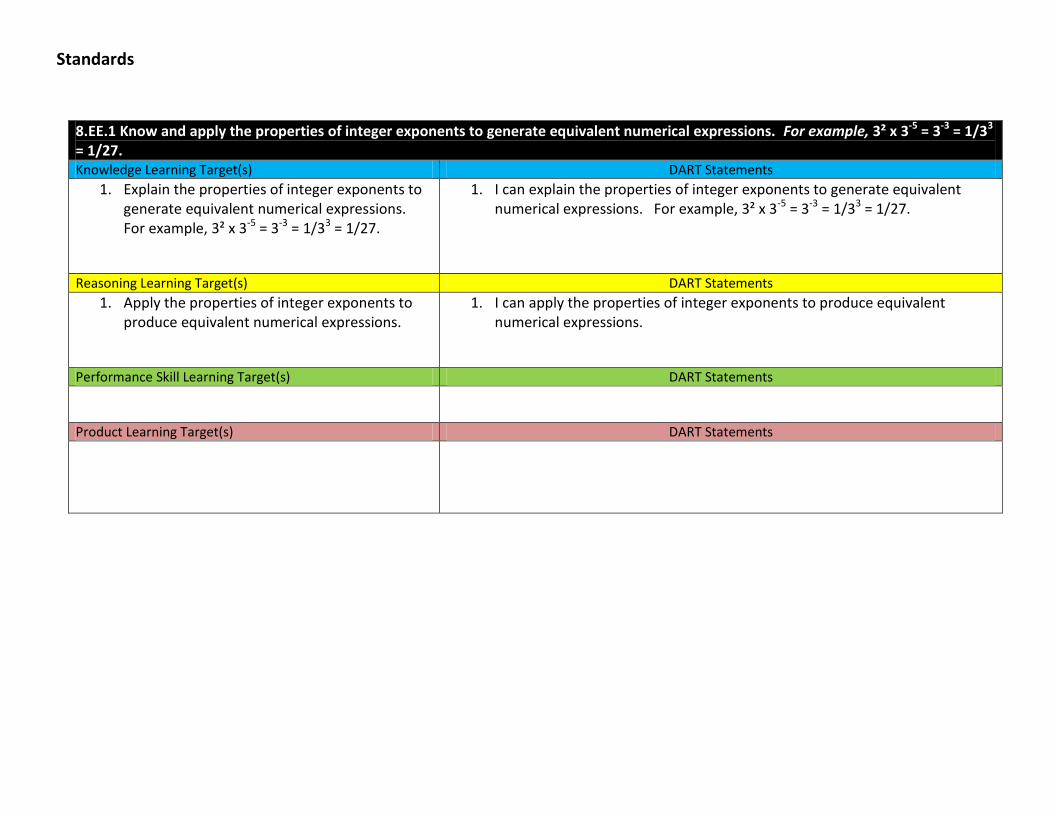
Standards
8.EE.1 Know and apply the properties of integer exponents to generate equivalent numerical expressions. For example, 3² x 3-5 = 3-3 = 1/33 = 1/27. Knowledge Learning Target(s) DART Statements
1. Explain the properties of integer exponents to generate equivalent numerical expressions. For example, 3² x 3-5 = 3-3 = 1/33 = 1/27.
1. I can explain the properties of integer exponents to generate equivalent numerical expressions. For example, 3² x 3-5 = 3-3 = 1/33 = 1/27.
Reasoning Learning Target(s) DART Statements
1. Apply the properties of integer exponents to produce equivalent numerical expressions.
1. I can apply the properties of integer exponents to produce equivalent numerical expressions.
Performance Skill Learning Target(s) DART Statements
Product Learning Target(s) DART Statements

Standards
8.EE.2 Use square root and cube root symbols to represent solutions to equations of the form x2 = p and x3 = p, where p is a positive rational number. Evaluate square roots of small perfect squares and cube roots of small perfect cubes. Know that the square root of 2 is irrational. Knowledge Learning Target(s) DART Statements
1. Use square root and cube root symbols to represent solutions to equations of the form x2 = p and x3 = p, where p is a positive rational number.
2. Evaluate square roots of small perfect squares
3. Evaluate cube roots of small perfect cubes
4. Know that the square root of 2 is irrational.
1. I can use square root and cube root symbols to represent solutions to equations of the form x2 = p and x3 = p, where p is a positive rational number.
2. I can evaluate square roots of small perfect squares.
3. I can evaluate cube roots of small perfect cubes.
4. I know that the square root of 2 is irrational.
Reasoning Learning Target(s) DART Statements
Performance Skill Learning Target(s) DART Statements
Product Learning Target(s) DART Statements
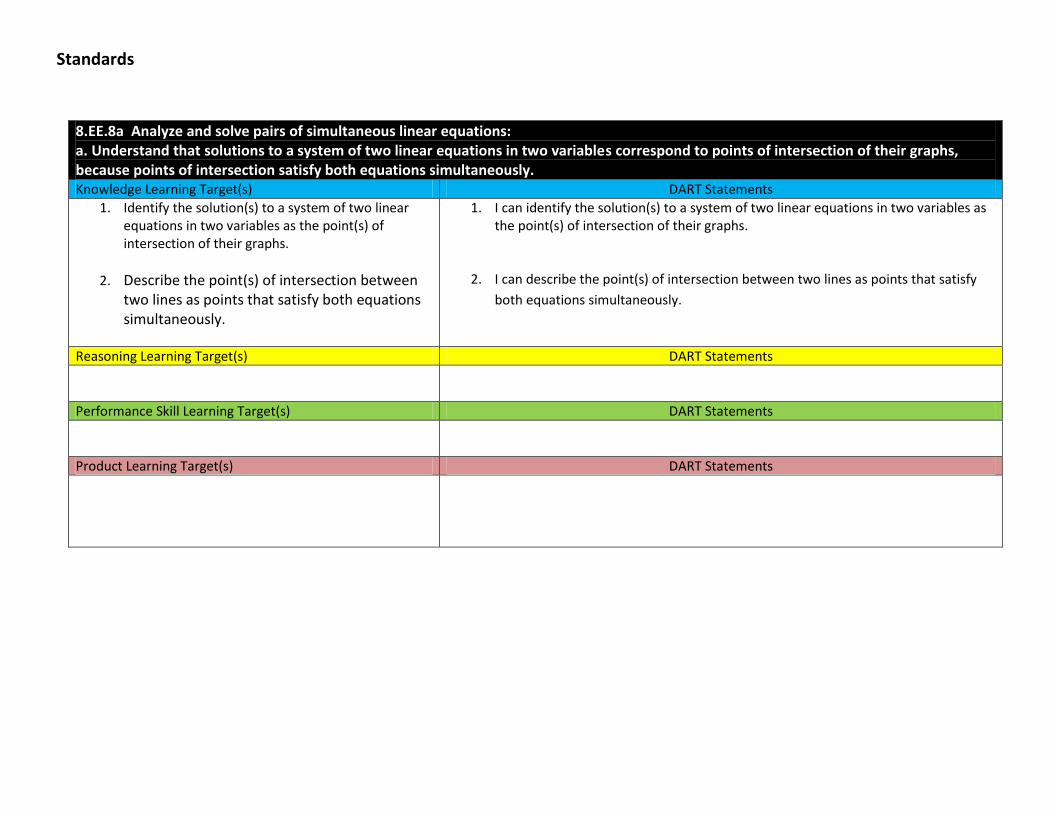
Standards
8.EE.8a Analyze and solve pairs of simultaneous linear equations: a. Understand that solutions to a system of two linear equations in two variables correspond to points of intersection of their graphs, because points of intersection satisfy both equations simultaneously. Knowledge Learning Target(s) DART Statements
1. Identify the solution(s) to a system of two linear equations in two variables as the point(s) of intersection of their graphs.
2. Describe the point(s) of intersection between two lines as points that satisfy both equations simultaneously.
1. I can identify the solution(s) to a system of two linear equations in two variables as the point(s) of intersection of their graphs.
2. I can describe the point(s) of intersection between two lines as points that satisfy
both equations simultaneously.
Reasoning Learning Target(s) DART Statements
Performance Skill Learning Target(s) DART Statements
Product Learning Target(s) DART Statements