Embed Size (px)
Citation preview


NÁRODNÁ BANKA SLOVENSKA
ANNUALREPORT
1995
Published by:
Národná banka SlovenskaŠtúrova 2818 54 BratislavaSlovakia
Public Relations Departmenttel.: +42 /7 /364 349, 210 34 05, 210 34 14fax: +42/7 /210 34 12
Contents
Foreword 1
A. Economic Development in 1995 51. The World Economy 7
1.1 Global Macroeconomic Development 71.2 The European Union 71.3 Foreign Exchange Markets 81.4 World Trade 9
2. Economic Development in Central European Transition Economies 102.1 Gross Domestic Product 102.2 Price Developments 112.3 State Budget 112.4 Labour Market 112.5 Foreign Trade 112.6 Foreign Exchange Reserves 122.7 Complex Comparison 12
3. Economic Development in Slovakia 143.1 General Situation 143.2 GDP and Development in Key Sectors of the Economy 153.3 Price Development and Inflation 163.4 Wages and Labour Productivity 173.5 Labour Market 183.6 Private Sector 193.7 Foreign Capital 193.8 Foreign Trade 20
B. Report on Monetary Development in the SR for 1995 231. Monetary developments 25
1.1 Development of Inflation 251.2 Development of Foreign Exchange Reserves 271.3 Money Supply 281.4 Bank Lending 311.5 Interest Rate Development 321.6 Budget Performance and the Internal Debt of the Government 341.7 Balance of Payments 361.8 Debt Servicing by the NBS and the Slovak Government 391.9 Issue of Foreign Exchange Licences and Permits 41
2. Monetary policy 442.1 Objectives and Implementation of Monetary Policy 442.2 Valuation of Monetary Development 442.3 Utilisation of Monetary-Policy Instruments 462.4 Instruments of Monetary Policy 482.5 Monetary Calendar 50
3. International Relations and Foreign Loans 533.1 Foreign Credit and Capital Relations 533.2 Foreign Relations of the NBS with Respect to Slovakia's Integration
into the European Union 584. Financial Market Developments 62
4.1 Money Market 624.2 Capital Market 654.3 Foreign Exchange Market 68

C. Banking Sector 711. Development of the Banking Sector 732. Prudential Banking Regulations 75
2.1 Structure of Resources and Capital Adequacy 752.1.1 Structure of Resources 752.1.2 Capital Adequacy 76
2.2 Large Credit Exposure 762.2.1 Net Credit Exposure to Non-bank Customers 762.2.2 Net Credit Exposure to Bank Customers 762.2.3 Aggregate Net Credit Risk Exposure 77
2.3 Liquidity 772.3.1 Liquid Assets 772.3.2 Investment in Property 77
2.4 Monetary Positions 78
D. Note Issuing Activity of the NBS and Money Circulation 791. New Slovak Currency Denominations 81
1.1 Cash in Circulation 811.2 Banknotes and Coin in Circulation in Proportion to the Total
Volume of Cash 832. Occurrence of Counterfeit Money in the Slovak Republic 85
2.1 Counterfeit Slovak Banknotes 852.2 Counterfeit Foreign Banknotes 852.3 Examination of Damaged Banknotes 862.4 International Cooperation 87
E. Auditors' Report 89
F. Appendices 105

Foreword
The year 1995 has been an eventful year for the National Bank of Slovakia. Theeconomic growth surpassed all expectations, whilst at the same time the primaryobjectives of monetary policy (i.e. reduction of inflation and stabilisation of thecurrency) were also achieved. Budgetary performance resulted in a deficit lower thanhad originally been forecast in the State budget draft, and even produced a surplus -for the first time since the beginning of the economic reform in 1990. The surplus inthe balance of trade and the current account of the balance of payments, theincreasing inflow of foreign capital, the achieved level of foreign exchange reserves,and the more efficient application of a stabilisation-oriented economic and monetarypolicy, made it possible for Slovakia to abandon internal convertibility and, with thesupport of the new Foreign Exchange Act, to liberalise transactions within the currentaccount of the balance of payments in accordance with Article 8 of the IMFAgreement. In this way Slovakia took an important step towards full convertibility.
Liberalisation of foreign trade and foreign exchange policy is a prerequisite forSlovakia's admission to OECD, and later to the European Union. In this respect,Slovakia is faced with another demanding task: a gradual liberalisation the flow ofcapital according to the requirements of the Liberalisation Code of OECD, and tostabilise monetary development using market instruments.
Staff recruitment for the National Bank of Slovakia was virtually complete in 1995.Thanks to the staff, the Bank was able to strengthen the position of the Slovak crownin the economy, despite its short history as an independent central bank. In reviewingthe past year, I should mention the work and professional contribution of RNDr. Ing.Štefan Adamec, CSc, Chief Executive Director of the Monetary Division and Memberof the Bank's Board, who recently passed away.
In 1995, confidence in the Slovak crown and creditworthiness of the NationalBank of Slovakia increased both at home and abroad. In recognition of this, the twomost prestigious American rating agencies upgraded their ratings of the NBS.Standard and Poor's increased the Bank's long-term hard currency liability rating toBB+ with stable outlook, and Moody's Investors Service upgraded Slovakia's hardcurrency debt rating to Baa3 investment grade.
The last year was the year of a significant change in Slovakia's system ofpayment and settlement with the Czech Republic. The exchange rate deviationapplied in mutual payments was gradually removed, and the Clearing AccountAgreement with the Czech Republic was cancelled with effect from 30 September1995. In October, Slovakia started to apply the standard method of a cross borderpayment. It is an indication of the maturity of the country's banking system that thechange was effected smoothly, without serious problems.
Due to increasing confidence in the Slovak economy and expansion of the privatesector, the inflow of foreign capital underwent a significant change in 1995. Whileforeign capital in the past was absorbed mainly by the State, the inflow of the foreigncapital in 1995 was directed mostly to enterprises and commercial banks. The newsituation has complicated the stabilisation of monetary development, thoughSlovakia's gross foreign debt remains relatively low, and the level of official debt waseven reduced by debt service payments over the course of the year.
The first measure designed to get the inflow of foreign capital under control wastaken already in the first quarter of 1995 with the launch of the first issue of NBS bills.The NBS bills issues have gradually paved the way for transition from the applicationof administrative tools to indirect monetary-policy instruments. The volume of theissue and the scope of operations on the open market increased steadily throughout
1
the year. Open market operations were again employed in 1995 to correct excessliquidity and improve the situation on the money market. The introduction of interbankoffered rates (BRIBOR) made a significant contribution to stabilisation of the moneymarket.
In 1995, the National Bank of Slovakia continued working in close cooperationwith foreign and international financial institutions. While funds obtained in previousyears were used mainly to strengthen the country's balance of payments, in 1995funds were mainly drawn for the support of specific development and restructuringprojects. This involved cooperation with the IMF and the World Bank (EconomicRecovery Loan, Enterprise and Financial Sector Adjustment Loan), the EuropeanInvestment Bank (Apex Global Loan), and the EXIM Bank of Japan (Two Step Loan,Economic Recovery Loan). Technical assistance within the PHARE Programme wasalso of great importance.
The Bank's most significant achievement was a considerable reduction inconsumer-price inflation. The average annual rate of inflation fell to 9.9%, and theannual inflation to the level of 7.2%. The favourable development of inflation made itpossible for the NBS to lower the discount rate from 12% at the beginning of 1995 to9.75% at the end of the year-end. Commercial banks took this as a signal to cutinterest rates on the money market gradually. Since inflation has been sosuccessfully dealt with in Slovakia for more than two years, this has done much toincrease consumer confidence. Reducing inflation continues to be a priority for theNBS and the Slovak Government in the time ahead.
A key problem in Slovakia, in common with that in other transition economies, isthe financial recovery of the business and banking sector. Commercial banks havegradually improved their capital adequacy and liquidity ratios. The improving financialposition of the banking sector has made it possible for the Bank to commence aprocess of loan portfolio restructuring in the banking sector by stipulating regulationsfor evaluation of bank receivables and off-balance sheet liabilities according to riskexposure, and for the creation of reserve funds to cover such risk. It is essential toaccelerate this process on account of the growing competition within the Slovakbanking sector, where the number of branches and representative offices of foreignbanks is steadily increasing, particularly in respect of increased competition in foreigninvestment.
With regard to the Bank's note issuing activity, the series of Slovak banknoteswas completed in 1995 with new notes in Sk 200 and Sk 5,000 denominations.Further issuing activity will consist of new issues, withdrawals, and improvement ofbanknotes and coin in circulation. According to practical experience gained in recentyears, Slovak banknotes are well protected against forgery.
The excellent results achieved by the NBS in the past year are in no smallmeasure due to the coordination of financial and monetary policies based on respectfor the Bank's freedom to set and implement monetary policy. We emphasise this,because we realise that the Bank will be able to meet the task of maintaining thestability of the recently liberalised currency only if the policy of cooperation continuesto be developed.
Vladimír MasárGovernor
2

Bank Board of the NBS
3

A. Economic Development in 1995

1. THE WORLD ECONOMY
1.1 Global Macroeconomic Development
The development of the world economy in 1995 can be characterised asfavourable with long-term differences in the pace of economic revival in the majorindustrial countries of OECD and other global economic groupings.
The output of the world economy grew by 3% in 1995, and gross domesticproduct (GDP) in OECD countries increased by 2.7% year-on-year. The rate ofrecovery in developing countries was substantially higher. In Latin Americancountries, GDP growth ranged from 5 to 8%; the high rate of long-term economicgrowth was maintained in the region of south-east Asia, where the most rapid growthwas recorded in China (9.8%) and South Korea (9.3%). Within the group of transitioneconomies, CEFTA countries showed clear signs of revival, while the othereconomies remained in recession.
In OECD countries, the business cycle cumulated in 1995 with characteristicdifferences between the rates of recovery in the member states of this economicgrouping. The highest rate of economic growth was recorded in the US (3.3%),followed by the European Union (2.6%), and Japan (1%). However, economic activityin the USA already recorded a moderate decline this year; while the rate of economicgrowth in the European Union increased in comparison with 1994, and the Japaneseeconomy only slowly began to recover from the long-lasting economic recession.
Price developments in 1995 confirmed again the non-inflationary nature of theongoing business cycle: the average rate of inflation in OECD countries and theEuropean Union reached 3%; in the US 2.8%; and in Japan only 0.1%. In 1995,inflationary pressures were reduced to a considerable extent even in some LatinAmerican countries with traditionally inflationary economies. However, some of thefastest growing economies in south-east Asia were in danger of becomingoverheated, e.g. inflation rate in China reached 15.4%.
The rates of unemployment in OECD countries averaged 7.4%, representing amoderate fall compared with the level of 1994. However, considerable differenceswere recorded between the rates of unemployment and labour market conditions invarious economic regions. Japan's unemployment rate rose to 3.4%, while that of theUSA fell to 5.7%. The average rate of unemployment in the European Union also fellslightly, but remained above the two-digit level (10.8%).
1.2 The European Union
In the European Union, increased attention was paid to the qualitativecharacteristics of economic stability, which precondition successful implementation ofa single currency by 1999. The unbalanced process of adjusting the nationalmonetary and financial indicators to the convergence criteria of the Maastricht treatyled to the confirmation of the 'two-stage', or 'multi-stage' conception of monetaryunion. The criterion for the successful implementation of the project is the formationof a sound basis in the most stable economies, which should ensure the credibilityand stability of the single European currency on international financial markets.
In meeting the criteria for convergence, the individual member states of the EUachieved different results in the individual monetary and financial indicators in 1995.
The results in the field of price inflation were basically satisfactory in most EUcountries, the rate of inflation continued to fall, and the differences between the rates

of inflation in the individual countries also decreased. The convergence criterion forprices was met by eleven of the fifteen EU member states in 1995. The chief factorsbehind this favourable development were the moderate increase in wages and theconsiderable growth in labour productivity.
The pace of convergence of long-term interest rates slowed down in 1995. Thisdevelopment was associated with the weakening of the fast effect produced by thereduction in inflation on this indicator, and the difficult task of reducing nationalbudget deficits. The interest rate criterion was met by 10 countries.
Favourable development was recorded in the area of exchange rates as well.This applied especially to the currencies included in the European exchange ratemechanism which were relatively stable. This development was due partly tomonetary-policy measures adopted in the individual member countries, and theeconomic growth which enlarged possibilities for economic-policy decisions. Thecriterion for longer-term (two-year) stability of exchange rates was satisfied by 7member countries of the European Monetary System.
Fulfilment of convergence criteria was least satisfactory in the field of reducingpublic expenditure. The consolidation in budget performance did not make the bestuse of the possibilities arising from the increasing rate of economic growth. In anumber of countries, budget deficits were too high in relation to GDP despite theadoption of a policy of budgetary restrictions. The convergence limit (3%) was fulfilledby only three countries. The process of lowering the level of public debt to 60% ofGDP was also rather slow. This criterion was met by only four member countries ofthe EU.
1.3 Foreign Exchange Markets
In 1995, the exchange rates of the world currencies - the US dollar (US$), theGerman mark (DEM), and the Japanese yen (JPY) - on international foreignexchange markets were affected by the gradual recovery of the US dollar after theMexican crisis at the end of 1994, and the relative stability of currencies within theEuropean exchange rate mechanism (ERM) during the last phase of preparation forthe European Monetary Union. On 1 January 1995, the Austrian schilling (ATS)became the 9th currency to join ERM, as the only currency from among the newmember states of the European Union.
The exchange rates of the dollar against the German mark and the Japanese yenfell until April, when they hit the lowest average monthly figures: 1.38 DEM/US$ and83.87 JPY/US$. At the end of March, the Bundesbank lowered the discount rate by0.5%, to 4%. In April, the Bank of Japan reduced its discount rate by 0.75%, to 1%. InJune, the situation in foreign exchange markets stabilised somewhat. The dollarbegan to rise at a moderate pace, and the economic summit of the G7 in Halifax,Canada, did not result in any serious recommendations to be taken with the aim ofco-ordinating exchange-rate policies.
After August, the US dollar firmed both against the yen and the D-mark. Thechanges in foreign exchange markets were due to central banks interventions insupport of the dollar. The expected easing of monetary policies in Europe and Japanalso played a significant role in this development. At the end of August, theBundesbank lowered the discount and Lombard rates by 0.5%, to 3.5% and 5.5%respectively. This move was immediately followed by other central banks in ERMmember countries. In September, the Bank of Japan reduced its discount rate to anextremely low level (0.5%), which helped the dollar to break through the 100JPY/US$ limit.
8

In 1995, the position of the US dollar on foreign exchange markets against theJapanese yen firmed: from 99.73 JPY/US$ (in January) to 103.15 JPY/US$ (inDecember). On the other hand, the position of the German mark against the dollarimproved, due mainly to the considerable weakening of the dollar in the first half ofthe year. The exchange rate of the D-mark appreciated from 1.53 DEM/US$ (inJanuary) to 1.43 DEM/US$ (in December).
In 1995, within the European monetary system, significant progress was made inthe stabilisation of the European exchange rate mechanism. The devaluation of theSpanish peseta (by 7%) and the Portuguese escudo (by 3.5%) in March significantlystabilised the exchange rates of these currencies, which joined ERM in the middle ofthe year. After a period of temporarily increased volatility during the presidentialelections, the exchange rate of the French frank against the German mark alsostabilised. After August, a factor stabilising the ERM was the rise of the US dollaragainst the D-mark. In 1995, the weakest currency of the ERM was again the Irishpound, continuing the long-term downward trend.
Among currencies outside the ERM, the Swedish crown was slightly revalued in1995 against the D-mark, after a temporary decline associated with the lack of faith inSweden's public finance. The exchange rate of the Swiss franc also improved: itreached 0.80 CHF/DEM, the highest rate against the German mark in the last 9years, despite the 2% cut in the Swiss discount rate.
1.4 World Trade
In 1995, world trade continued growing at a faster rate than production in 1995.The total volume of trade in goods and services exceeded US$ 6 trillion for the firsttime in history. International commodity trading reached a level of US$ 4.9 trillion,increasing by 8% compared with the figure for 1994. The volume of trade in servicesstood at US$ 1.2 trillion, i.e. 14% more than in 1994.
The most dynamic development in world trade was recorded in manufacturedgoods, especially in the export of high-tech products, the volume of which hadincreased by more than a quarter.
The dynamic growth in world trade was due mainly to countries of south-eastAsia, Latin America, and Central and Eastern Europe. The dominant share of worldtrade - estimated at 2/3 of the total volume - was generated by multinationalcompanies, which earned huge profits from the extension of free business zones,especially in newly industrialised countries.
9

2. ECONOMIC DEVELOPMENT IN CENTRAL EUROPEANTRANSITION ECONOMIES
The economic revival in Poland, Hungary, Slovenia, the Czech Republic andSlovakia continued in 1995. The upward trend in industrial production wassuccessfully maintained in all five economies, due mainly to the increased export toadvanced countries. With the exception of Hungary, the rate of increase in priceinflation slowed down. A new factor influencing economic development was theinflow of short-term capital, as reflected in the level of foreign exchange reserves inthese countries. With regard to long-term development, a significant trend is therevival of investment activity in all countries of Central Europe.
In 1995, all the above countries made considerable efforts to make their nationalcurrencies convertible. The common objective was to satisfy the basic criterion ofcurrency convertibility - to remove all restrictions on current account transactions.The reason for this is that currency convertibility is a precondition for entry intointernational economic structures.
2.1 Gross Domestic Product
In 1995, the economic growth in terms of GDP that started in the previous years(in Poland in 1992, in Slovenia in 1993, and in the other economies in 1994)continued. In the Czech Republic, Poland, and Slovakia, the rate of growth in GDPincreased in comparison with 1994. The growth of GDP declined somewhat inSlovenia. Hungary maintained its rate of GDP growth, which, however, remainedbelow the level achieved in comparable countries.
In the Czech economy, the most important pillar of economic growth was theoutput of industry, construction, and trade. In the field of demand, the main stimuliwere household consumption and investment demand, whereas governmentspending declined. The economic results of Hungary were affected by measuresrestricting government spending, which led to a fall in real wages and incomes, and aconsequent decline in consumer demand and domestic trade. However, the upwardtrend in industrial production and investment demand was maintained. In Poland,economic revival continued owing to a growth in exports and investment demand,while the growth in industrial production and construction output was maintained. In
10

Slovakia, the main driving forces of economic revival were the continuing growth inexport trade, increase in private consumption, and recovery in investment activity.In Slovenia, the main stimulus to economic growth was the significant increase ininvestment demand accompanied by a growth in consumer demand.
2.2 Price Developments
In 1995, the most moderate increases in consumer prices were recorded inSlovakia and the Czech Republic. The rate of price inflation also slowed downconsiderably in Slovenia. In Poland, economic growth was accompanied by a highrate of inflation. Inflationary pressures were due mainly to strong consumer demandand inadequate supply nevertheless, the change in exchange rate mechanismintroduced in May 1995 made a significant contribution to the decline in consumer-price inflation. In Hungary, price development was influenced by the continuedderegulation of prices, devaluation of the forint, and the introduction of a surchargeon imports, which gave rise to a further increase in inflation.
2.3 State Budget
With the exception of Hungary, state budget deficits did not exceed the level of3% of GDP in any of the countries under consideration. In the Czech Republic, thestate budget in 1995 resulted in a surplus, as in the previous years.
2.4 Labour Market
A positive factor in labour market development in the countries underconsideration, with the exception of Slovenia, was a moderate fall in the rate ofunemployment. In this group of countries, the highest level of unemployment wasagain recorded in Poland.
2.5 Foreign Trade
The volume of exports and imports in the above countries has increased eachyear since the beginning of the 90s. However, the trade balance in most of thesecountries was unfavourable due to great demand for commodity imports. Theorientation of foreign trade towards advanced market-economy countries continued
11

in 1995. Over the course of the year, mutual trade among CEFTA countries wasfurther liberalised, and an agreement was signed on the extension of this grouping toinclude Slovenia.
In 1995, the unfavourable balance of Hungary's foreign trade significantlyimproved due to introduction of a surcharge on imports and devaluation of the forint.A similar development was recorded in Poland, where accelerated growth in exportmade a significant contribution to reduction of the trade deficit. In the Czech Republicand Slovenia, the trade deficit grew due to a decline in the rate of growth in exportand an increase in import. In 1995, Slovakia was the only country to achieve apositive balance of foreign trade.
2.6 Foreign Exchange Reserves
One of the main preconditions for the introduction of currency convertibility in theanalysed countries in 1995 was to achieve an adequate level of foreign exchangereserves.
2.7 Complex Comparison
The concrete results of interaction between governmental economic andmonetary policy in the fields of economic growth, labour market conditions, pricedevelopment, and foreign debt are illustrated in the accompanying diagram, the so-called magic square, in which the largest square represents the best economicperformance.
Of the group of analysed countries, the most stable macroeconomic developmentwas recorded in the Czech Republic, which achieved similarly favourable results in allfour indicators.
The above comparison shows that Slovakia's macroeconomic indicators in 1995were among the best in the group of countries under consideration. The most positiveresult was deceleration in the rate of increase in consumer prices and the dynamiceconomic growth expressed as a percentage of GDP. The position of Slovakia withregard to unemployment was less favourable.
12

Poland achieved a high rate of economic growth, but the level of inflation,unemployment, and foreign debt remained relatively high. Of the transitioneconomies, Hungary recorded a slower rate of growth in real GDP, a high level offoreign debt in relation to GDP, and the highest rate of inflation. Slovenia recordedthe lowest level of foreign debt in relation to GDP, a high year-on-year increase inGDP, and a single-digit annual rate of inflation; however, the unemployment rateremained relatively high.
Current economic development in Central Europe suggests that, after a period ofnon-standard deviation and economic recession, a phase of stabilisation is nowunder way. The most significant contribution to the achieved results came frommonetary policy, which stabilised prices, improved the competitiveness of foreigntrade through exchange rate control, and strengthened monetary and budgetarydiscipline in each country.
The stabilisation of macroeconomic development made a significant contributionto the revival of domestic consumer and investment demand, and strengthening ofthe function of the internal engines of economic growth in all countries underconsideration.
13

3. ECONOMIC DEVELOPMENT IN SLOVAKIA
3.1 General Situation
In 1995, the revival of the Slovak economy continued to accelerate, with a 7.4%growth in GDP. Slovakia's annual rate of inflation expressed in terms of theconsumer price index reached 7.2%, and the average annual rate of inflation 9.9%.Government spending resulted in a budget deficit of Sk 8.3 billion (i.e. 1.6% of GDP).The balance of foreign trade and services generated a surplus of Sk 16,944 billion.
The achieved results indicate that, in addition to the upward trend in developmentof the real sector, the macroeconomic balance of the Slovak economy furtherstabilised, due to positive effects of the interaction between various internal andexternal factors. One of these factors was continued revival of the world economy,which made it possible to sell relatively large volumes of Slovak goods on foreignmarkets. Another factor was the slightly growth-oriented anti-inflationary monetarypolicy of the NBS, which was supported by the monetarily neutral financial policy ofthe Government, designed to reduce the State budget deficit.
With regard to stimuli to economic growth, an important development in 1995 wasrevival of consumer and investment demand in the domestic economy in comparisonwith 1994, when foreign demand was the only driving force of economic growth.However, the dynamics of gross fixed capital formation was not maintained in 1995.Economic growth in Slovakia was due primarily to the utilisation of free capacity inproduction, and required additional labour only to a lesser degree. Consequently, therate of unemployment in Slovakia remained relatively high, reaching an average of13.8% per annum.
In 1995, extensive activity was recorded in the area of Slovakia's systemictransformation. To regulate the process of transformation of ownership rights, fournew laws were enacted. The new laws define the positions of the entities taking partin this process. One of these laws was the amendment to the Large Privatisation Act(No. 190/1995 Z.z. and Act No. 92/1991 Zb. on the transfer of state property to otherpersons) which closed the ongoing discussion about the legal aspects of privatisationin favour of standard methods. The second wave of privatisation in Slovakia wasreplaced by the so-called bond method. According to this, an individual registered inthe 2nd wave of privatisation is entitled to a bond issued by the National PropertyFund (NPF) at a par value of Sk 10,000, with maturity at 31 December 2000, whichmay be used for specified purposes. This amendment increased the powers of theNPF, and considerably accelerated the process of privatisation in the form of directsale, as well as public tender and sale of shares on the capital market.
Subsequent to this legislation, a law was passed to secure the interests of theState in the privatisation of strategically important public enterprises andcorporations. This law (NC SR No. 192/1995 Z.z.) defined which companies couldonly be privatised with government approval.
The amendment to the law on investment companies and investment funds (ActNo. 191/1995 Z.z. and Act No. 248/1992 Zb. with subsequent amendments) putthese entities in the position of portfolio investors, and set out the conditions ofgovernment supervision in this field.
To increase the transparency of trading in securities, an amendment was made tothe Securities Act (NC SR No. 171/1995 Z.z.), which explicitly stipulates thattransactions in securities may only be conducted on the public market.
14

The favourable trend in the development of external economic relations, theconsiderable increase in NBS foreign exchange reserves and weakening of theirdependence on foreign loans, and the overall strengthening of the country'smacroeconomic balance, paved the way for new foreign exchange legislation. TheForeign Exchange Act (NC SR No. 202/1995 Z.z.) of 1995 made the Slovak crownconvertible for current account payments with effect from 1 October 1995. Theliberalisation of Slovakia's foreign exchange regime included the standardisation ofpayments, and the termination of the clearing account agreement with the CzechRepublic.
3.2 GDP and Development in Key Sectors of the Economy
In 1995, Slovakia's gross domestic product (based on 1993 constant prices)increased by 7.4%, to Sk 416.7 billion. The rate of growth in GDP was increasingthroughout the year (increases in GDP between the individual quarters in comparisonwith the same periods of the previous year represented: 5.7%, 7.0%, 8.2%, and8.5%).
Note: At constant prices of 1993
Economic growth in 1995 was marked by two features, one of which was aconvergence of economic sector shares in the creation of GDP. The proportionbetween the outputs of productive and service sectors in particular achieved a betterbalance, which had a stabilising effect on the share of market products and servicesin the added value. The second feature was the generally high rate of growth inproduction and services - the rate of growth in industrial production increased, thedecline in public freight transport was brought to a halt, and the revival in constructioncontinued. Development in agriculture continues to be problematic: the output of thesector expressed in terms of added value decreased in comparison with the level of1994.
The volume of industrial production (in terms of commodity production) increasedby 8.3%, due primarily to the output of small businesses (with less than 24employees), while the volume of production in large and medium-sized enterprisesgrew by only 5.2%. A favourable aspect of development in industrial production(compared with 1994) was that its growth was due solely to the high rate of growth in
15

manufacturing industry (10.2%). The output of mining and power industry fell by 0.4and 1.1 % respectively.
A positive trend was also reported in manufacturing industry as well. Within thestructure of manufacturing, the most rapid growth was recorded in the production ofmachines and equipment (15%), which in 1994 was in relatively deep recession. Theoutputs of chemical and metal-working industries were also increasing faster thantotal industrial production (10.8% and 9.1% respectively), while the rate of growth inthe production of coke, petroleum products, and nuclear fuels slowed down (6.1%).Output of the food industry continued to decline (by 2.1%).
In 1995, the growth in industrial production (in statistically analysed medium andlarge-sized companies) continued to be dependent mostly on foreign demand. Thevolume of export sales increased in comparison with the 1994 figure, which resultedin a further increase in the share of production for export in the total volume ofindustrial sales, to 43.2% (compared with 40.4% in 1994).
After a period of recession, the construction sector also showed some signs ofrevival in 1995. The output of the construction sector (at current prices) increased by4.2% year-on-year. With regard to the market decline in construction during previousyears, this development should be seen as gradual recovery from recession ratherthan real growth. A special feature of revival in this sector was that it was stimulatedby a significant increase in the volume of construction projects abroad (16.9%), whilethe annual volume of domestic construction work remained roughly at the level of1994 (an increase of 0.9%). The share of construction work abroad in the total outputof the construction sector reached 14.4% in 1995.
In connection with overall economic growth, the rate of increase in the volume ofpublic freight transport changed considerably. In comparison with 1994, the volumeof freight increased by 6.4% (in 1994, it fell by 14.4% in comparison with the figure for1993).
Agricultural production in 1995 was unable to reverse the unfavourable trend ofprevious years. The volume of produced added value (in current prices) dropped by2.2%, or after taking into account price development, by 5.4%. The proceeds ofagricultural companies were 2.2% higher than in 1994; after taking into account pricedevelopment, however, they were 1 % below the level of last year.
The growth in consumer demand was reflected in a 19.6% increase in retail salesat current prices, representing an increase of 8.9% at constant prices.
3.3 Price Development and Inflation
In 1995, the annual rate of inflation expressed in terms of the consumer priceindex reached, for the first time from the beginning of transformation, a one-digitfigure (7.2%). This represented a reduction in inflation of more than one-thirdcompared with the figure for 1994. The average rate of inflation was 9.9%.
The fall in the rate of inflation was due to three factors: government economicpolicy for 1995 did not contain potencially inflation measures; the stability of the fiscalsystem, increased tax revenue and restricted government spending made asignificant contribution to the improvement in State budget performance and theconsiderable weakening of the inflationary effects of the budget deficit; favourablebalance of payments.
Measures carrying a risk of inflation were adjustments of prices, charges, andtariffs in various sectors of the economy. The increase in consumer prices was
16

caused by shortcomings in agricultural production and an increase in industrialproducer prices.
In comparison with the same period of the previous year, a key factor stabilisingthe level of consumer prices was the development of prices in agriculture, whichrecorded an average yearly increase of 3.5%. Along with the producer prices ofindustrial goods, agricultural prices increased at a much lower rate than consumerprices, especially in the second half of the year. On the other hand, the cost ofconstruction work was above the level of consumer prices throughout the year.Industrial producer prices rose by an average of 9%, and construction pricesrecorded an increase of 12.4%; this development corresponded to the trend in pricesduring the previous year.
With regard to the structure of commodities, the development of consumer priceswas marked by a tendency to fall during the first half of the year. Noticeable month-on-month fluctuations of seasonal nature were recorded mainly in the prices ofservices and foodstuff goods during the summer months.
The rise in consumer prices resulted in a yearly average increase in the cost ofliving of 9.5%, which was relatively evenly distributed over individual social groups.
3.4 Wages and Labour Productivity
Accelerated economic growth, and the removal of wage restraints applied duringthe previous year were reflected in a relatively high rate of increase in nominalwages. The average monthly nominal wage in industry (organisations with at least 25employees) reached Sk 7,492, representing an increase of 15.2% compared with thelevel of 1994. In construction, the average monthly wage amounted to Sk 7,503,representing an increase of 14.9%. Average monthly wages in transportation reachedSk 7,733 (an increase of 17.9%), in trade Sk 5,669 (an increase of 13.2%).
The average monthly wage per employee in the Slovak economy reached Sk7,195, representing an increase of 14.1% compared with the level of 1994.
The year-on-year increase in the average monthly real wage in industry reached5.2%, in construction 4.9%, in transportation 7.7%, and in trade 3.4%. The average
17

level of real wages in the economy rose by 4.4%. The relatively high increase in realwages resulted form the non-inflationary trend in the development of consumerprices.
The relation between the increase in real wages and the growth in labourproductivity recorded a less favourable development in 1995 than in 1994. In nominalterms, the increase in the average monthly wage exceeded the growth of labourproductivity expressed as a percentage of GDP, by 0.2%. The rate of increase in realwages corresponded to the rate of growth in labour productivity in terms of GDP atcomparable prices.
3.5 Labour Market
The upturn in economic activity gave rise to a gradual improvement in labourmarket conditions during the 2nd quarter of 1995. In the individual sectors of theeconomy, the number of employees developed differently. The largest increase inemployment (6.5% compared with the level of December 1994) was recorded intrade and industry (4.4%). The level of employment in transport remained virtuallyunchanged (a rise of only 0.6%), while the number of employees in constructiondecreased by 3.4%.
In all sectors of the economy, the level of employment was affected by asignificant increase in the private sector. The largest increase in the number ofprivate sector employees was recorded in transport (31.6%); however, the share ofthe private sector in the total number of employees in transport remained very low(15.8% compared with 12.2% in December 1994). Another considerable increase inthe number of employees in the private sector was recorded in trade (10.5%); theproportion of this figure to total employment in trade reached 93.7%. In industry, thenumber of employees in the private sector increased by 15%, and its share in thetotal number of industrial employees reached 68.9%. In construction, despite ageneral decline in employment, the number of people working in the private sectorincreased by 2.4%, and its share in total employment within the sector reached84.4%.
At the end of December, Slovakia's unemployment rate reached 13.1%,representing an decrease of 1.7% year-on-year. The number of unemployed pervacancy also decreased (to 22 in December 1995, from 28 in December 1994),
18

which may be attributed partly to the upswing in the economy, and partly to theincreased activity of job offices in the labour market. The inadequately slow year-on-year decrease in the average rate of unemployment with regard to the fast rate ofeconomic growth was an indication of the fact that there is still extensive latentunemployment in the Slovak economy. The beneficial effects of increased productionare in this case absorbed by over-employment, which explains why the increasedlevel of economic activity is only partially reflected in the official unemploymentfigures.
3.6 Private Sector
In 1995, 64.9% of Slovakia's GDP was generated by the private sector (includingco-operatives), which employed 56.5% of the total Slovak labour force. The privatesector accounted for 64.6% of the total annual volume of industrial production, 81.8%of the total output of the construction sector, 92.2% of total retail trade turnover, and62.1% of the volume of road haulage.
At the end of December 1995, the number of profit-based organisations doingbusiness in the Slovak Republic totalled 43,636, representing an increase of 7,449(20.6%) compared with the figure recorded at the beginning of the year. The share oforganisations in private ownership (partial or whole) in the total number of suchorganisations represented 96.4%, i.e. 0.9% more than at the end of 1994.
During 1995, the number of private entrepreneurs registered in the SlovakRepublic decreased by 4.1%, to 275,110 persons. This development was, to someextent, a reflection of the process of differentiation within the group of small privatebusinesses, due to measures regulating their activities (mainly the introduction ofcash-registers). The sharpest decrease was recorded in the number of privatefarmers (5.7%); whereas the number of those self-employed (physicians, lawyers,etc.) almost tripled during the course of the year.
At 31 December 1995, the number of organisations with foreign capitalparticipation in the Slovak Republic totalled 9,520, representing an increase of 26.6%compared with the figure for the beginning of the year.
3.7 Foreign Capital
The flow of foreign investment capital into the Slovak Republic slowed down inthe first half of 1995, for various non-economic reasons. However, development inthe second half of the year indicated rather a temporary wait-and-see attitude on thepart of foreign investors. At the end of 1995, the volume of foreign capital invested inthe Slovak Republic reached Sk 21.9 billion, representing a year-on-year increase ofSk 5.3 billion. Of this amount, Sk 4.4 billion (i.e. 82%) was invested during the secondhalf of the year.
In terms of invested capital, the largest investors in 1995 were Austria, Germany,the Czech Republic, and the USA. The share of these countries in the total volume offoreign capital in the SR ranged from 12.4% (USA) to 23.4% (Austria), and theytogether accounted for 70% of the total volume of foreign capital investment.Significant capital inflow came also from Great Britain, the Netherlands, France,Sweden, and Italy (5.7% to 2.2% of the total). The share of other countries did notexceed 1% of the total amount of invested capital.
By sector, foreign investors gave preference to industry in 1995. At the end of theyear, the share of industry in the total volume of foreign capital in the Slovakeconomy reached 43.4%; followed by trade (32.4%) and the financial sector (15.7%)in third place.
19

With regard to allocation of foreign investment, 62.1% of the capital was investedin Bratislava, the capital of Slovakia. In 1995, certain increases were reported in theflow of capital investment into regions with low levels of foreign capital and high ratesof unemployment.
3.8 Foreign Trade
In 1995, Slovakia's foreign trade continued to benefit from the ongoing business cycleof the world economy. The turnover of foreign trade reached Sk 507,481 million,representing an increase of 18.9% compared with the 1994 figure. The growth of exportsand imports began to show tendencies reflecting an upswing in the economy andincrease in domestic demand, and a gradual diminishing of the effects of devaluation.
The rate of annual growth in exports decreased to 18.5% (compared with 28.5%in 1994), while imports increased by 19.1% in 1995 (compared with 8.5% in 1994). Asa result of a faster rate of growth in imports than exports, the balance of foreign tradeachieved only a moderate surplus (Sk 717 million) in 1995. The high surplus ofexports over imports in the service sector generated a positive balance of servicesamounting to Sk 16.2 billion.
The export performance of the economy (measured as a ratio of the exports ofgoods and services to GDP at current prices) fell from 72.2% in 1994, to 62.7% in1995, as a result of increased domestic demand.
In 1995, Slovakia achieved a positive balance of trade (Sk 7.4 billion) with countries ofthe European Union (including a surplus of Sk 11.6 billion with Germany, Sk 0.5 billionwith Italy, and Sk 0.2 billion with the Netherlands). Trade with CEFTA countries resulted ina surplus of Sk 29.6 billion (including Sk 20.2 billion with the Czech Republic, Sk 6 billionwith Hungary, and Sk 4.2 billion with Poland). A favourable trade balance was achievedwith the Ukraine, India, Egypt, Rumania, and Bulgaria as well.
Slovakia had a deficit of Sk 1 billion in trade with OECD countries (including Sk3.1 billion with Japan, Sk 3 billion with the US, Sk 0.3 billion with Australia, and Sk2.3 billion with EFTA countries), a deficit of Sk 1.2 billion with China, and Sk 1.5billion with Taiwan. Trade deficit with the Russian federation remained high (Sk 33.2billion) in 1995.
20

In the territorial structure of Slovakia's foreign trade, the change in orientationtowards major industrial countries continued, especially in favour of the EuropeanUnion. The share of EU countries in Slovakia exports reached 37.4%, in imports34.7%. In this group, the most significant trading partner of the SR was Germany,with a 18.8% share in Slovak exports and 14.4% in imports.
The process of restructuring in trade with transition economies was marked by adecline in commodity trading with countries of the former USSR and the CzechRepublic, and increase in trade with CEFTA countries. The share of CEFTA countriesin Slovakia's foreign trade turnover remained below 10% without the Czech Republic.However, the rate of growth in trade with these countries is on the increase, whereasthe share of the Czech Republic is on the decrease. Despite the downward trend, theCzech Republic remained the most important trade partner of Slovakia: at the end of1995, the CR accounted for 35.2% of the total volume of Slovak exports, and 27.5%of the volume of imports.
In 1995, the commodity structure of Slovakia's foreign trade was influenced bytwo factors: the structure of exports continued to reflect the advantageous exchangerate of the Slovak koruna, which created favourable conditions for the export ofgoods with a high price flexibility and low degree of added value. The structure ofimports was affected by the growth of the economy, which created increaseddemand for the import of raw-materials and investment inputs.
The structure of exports continued to be dominated by semi-finished products. Thecommodity groups SITC 2, 3, 4, 5, 6, which include raw materials and semi-finishedproducts, accounted for 63% of Slovakia's total exports. The export of these items grew ata faster rate than other exports in 1995; consequently, their share in the structure ofexports increased in comparison with 1994. The proportion of machines and equipment(SITC 7) reached 18.8%, and that of industrial goods (SITC 8) was 12.2%.
Commodity Structure of Slovakia's Foreign Trade in 1995 (% of total volume)
(SITC 0) Foodstuffs(SITC 1) Beverages(SITC 2) Raw materials(SITC 3) Mineral fuels and lubricants(SITC 4) Animal and vegetable oils and fats(SITC 5) Chemicals(SITC 6) Market products(SITC 7) Machines and transport equipment(SITC 8) Industrial goods
Export
5.00.95.04.20.1
13.240.518.812.2
Import
6.81.15.8
17.90.2
13.517.629.08.0
The structure of imports into the Slovak Republic reflected the upturn in economicactivity, which required increased raw material and commodity imports. The import ofthese commodity groups (SITC 2, 5, 6) grew at a faster rate than the total volume ofimports. A more rapid increase was recorded in the imports of machines andequipment (SITC 7) as well. At the same time, despite the surcharge on imports, arelatively robust increase was recorded in the import of products mostly for privateconsumption (including foodstuffs), which was a reflection of the faster increase innominal household income. The most significant import items were machines andequipment (29%), followed by mineral fuels (17.9%), market products (17.6%), andchemicals (13.5%). Industrial goods accounted for 8% of the volume of imports;foodstuffs represented 6.8% of the total.
The commodity structure of Slovak exports indicates that further development ofSlovakia's foreign trade depends on successful implementation of structural changesin the production sector of the economy. It is necessary to reduce the high energy,raw material, and material intensity of production, which is covered predominantly by
21

imports, and to gradually restructure Slovakia's exports, i.e. from semi-finishedproducts (highly sensitive to price competition), in favour of products with a higherdegree of added value.
22

B. Report on Monetary Development
in the SR for 1995
1. MONETARY DEVELOPMENTS
1.1 Development of Inflation
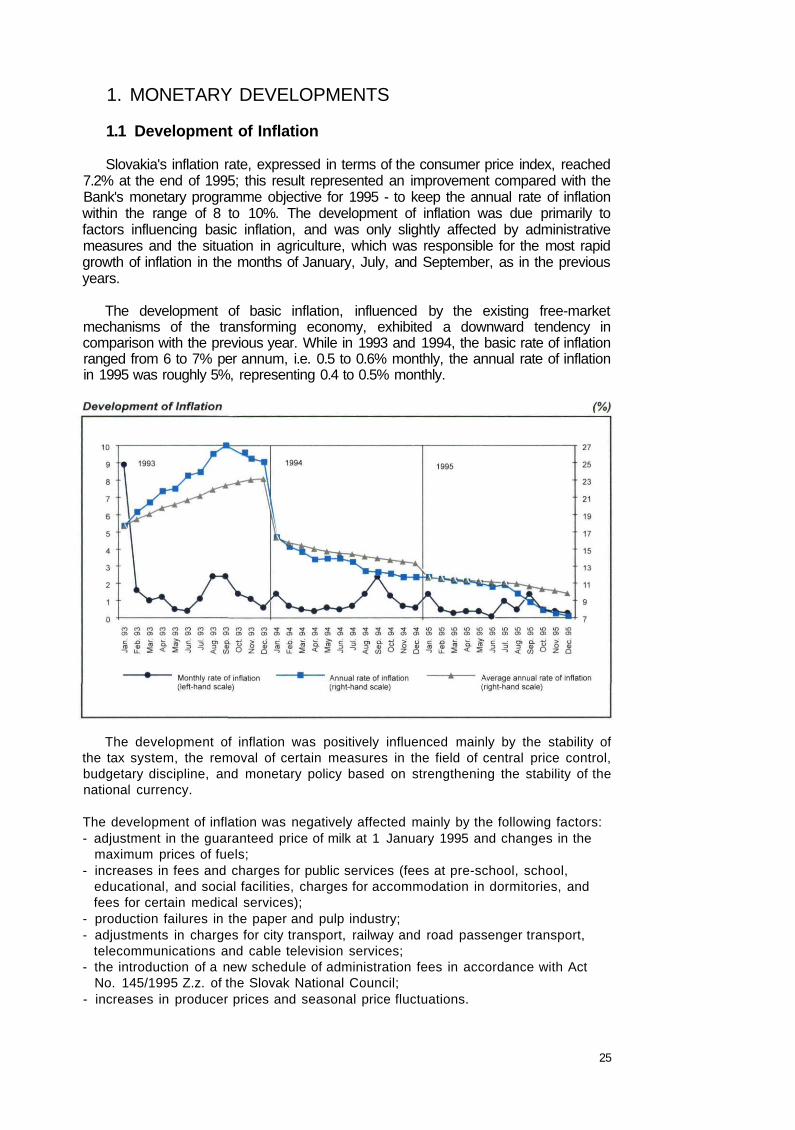
Slovakia's inflation rate, expressed in terms of the consumer price index, reached7.2% at the end of 1995; this result represented an improvement compared with theBank's monetary programme objective for 1995 - to keep the annual rate of inflationwithin the range of 8 to 10%. The development of inflation was due primarily tofactors influencing basic inflation, and was only slightly affected by administrativemeasures and the situation in agriculture, which was responsible for the most rapidgrowth of inflation in the months of January, July, and September, as in the previousyears.
The development of basic inflation, influenced by the existing free-marketmechanisms of the transforming economy, exhibited a downward tendency incomparison with the previous year. While in 1993 and 1994, the basic rate of inflationranged from 6 to 7% per annum, i.e. 0.5 to 0.6% monthly, the annual rate of inflationin 1995 was roughly 5%, representing 0.4 to 0.5% monthly.
The development of inflation was positively influenced mainly by the stability ofthe tax system, the removal of certain measures in the field of central price control,budgetary discipline, and monetary policy based on strengthening the stability of thenational currency.
The development of inflation was negatively affected mainly by the following factors:- adjustment in the guaranteed price of milk at 1 January 1995 and changes in the
maximum prices of fuels;- increases in fees and charges for public services (fees at pre-school, school,
educational, and social facilities, charges for accommodation in dormitories, andfees for certain medical services);
- production failures in the paper and pulp industry;- adjustments in charges for city transport, railway and road passenger transport,
telecommunications and cable television services;- the introduction of a new schedule of administration fees in accordance with Act
No. 145/1995 Z.z. of the Slovak National Council;- increases in producer prices and seasonal price fluctuations.
25

Despite a seasonal increase in the third quarter, the price of food had astabilising effect on consumer price levels; the level of food prices recorded thesmallest increase (only 5.3%) among the basic categories of consumer goods,compared with the level of December 1994.
The price level of industrial goods rose by 7.9%, and showed a tendency to fallduring the year; whereas prices in public catering and services recorded fluctuationsdue to seasonal effects, and the implementation of measures with regard to time (inservices).
Totalof which- foodstuffs- industrial goods- public catering- services
1995
107.2
105.3107.9107.4108.1
1st quarter
102.2
100.3102.8103.1103.2
2nd quarter
100.9
98.6102.1100.8101.0
3rd quarter
102.9
105.8101.2102.3103.1
4th quarter
101.2
100.7101.5101.2100.4
*/ Based on monthly data from the Statistical Office of the SR
The development of prices within the individual categories was influenced by avariety of factors in comparison with 1994. In the category of foodstuffs, increaseswere recorded mainly in the prices of meat and meat products (0.5%), and eggs andegg products (13.1%). The most significant increases were recorded in the price ofmilk and dairy products (6.9%), flour milling, bakery, and pastry products (5.8%),sugar and sugar products (16.9%) - due to the lack of adequate direct reaction on thepart of entities that are to offset the seasonal deviations and imbalances in themarket for agricultural produce - and in soft drinks (12.9%).
In the category of industrial goods, the most significant increases were recordedin the prices of textiles (7.4%), shoes (8.5%), household utensils (6.6%), andentertainment (13.7%).
In public catering, increases were reported mainly in the prices of meals (8.2%)and beverages (7.2%). In services, the most rapid increases were recorded in theprices of transport and communications (16.6%), recreation, health and social care(16.0%), education, culture, and sports (15.0%), and personal services (9.6%).
26
Development of Prices in the Basic Groups of Consumer Goods (%)

In 1995, the producer prices of industrial goods rose by 7.1% (in industrialproduction - excluding mineral-mining, water and gas supply, and electricitygeneration and distribution - by 7.2%), which corresponded to the rate of growth inconsumer prices. The development of producer prices reflected some irregularitiesand sectoral differences. The most significant increases were recorded in the pricesof pulp, paper, and paper products (27.2%), and transport equipment (34.4%). In thecategory of foodstuffs and beverages, the price level rose by 2.3%. Prices in thetobacco industry increased by 4.2%, in the textile industry by 2.8%, in furnitureproduction by 5.3%, and in the wood-working industry by 9.1%. In the clothingindustry, the price level fell by 2.7%.
The costs of construction work increased by 14.6%, the prices of buildingmaterials by 12.3%, and those in timber industry by 19.5%. By the end of the year,the price of agricultural produce had fallen by 4.5%; the price of plant produce hadrisen by 9.1%, and that of animal products had fallen by 5.5%.
1.2 Development of Foreign Exchange Reserves
Throughout 1995, the foreign exchange reserves of the NBS continued to beaffected by a variety of factors. One of the key factors positively influencing therevenue side of the budget was payments received from the Czech Republic. Theexpenditure side of the budget was affected by debt service payments.
At the end of 1995, the Bank's foreign exchange reserves totalled US$ 3,418.4million, representing an increase of US$ 1,673.4 million compared with the level atthe end of December 1994.
*/ Value of gold = US$ 42.22 /oz
The development of foreign exchange reserves in 1995 was positively affected bythe following factors:- payments made by the Czech Republic in respect of having exceeded the credit
limit in the clearing account and the repayment of 3/4 of the credit limit, totallingUS$ 1.034 million (44% of total revenue);
- the US$ 959.3 million surplus in the balance of NBS foreign exchange fixing (41%of total revenue);
- other NBS revenues totalling US$ 109 million (interest receipts on deposits,coupons, etc.)
- loans from international financial institutions totalling US$ 84.6 million (World Bank,EXIM Bank of Japan);
- repayment of government assets, proceeds from the sale of the same, and therectification of principal within the CDZ block (Central Foreign ExchangeResources) in the amount of US$ 56.3 million;
- interest receipts and charges received from the IMF in the amount of US$ 5.5million.
27

The development of foreign exchange reserves was negatively affected by thefollowing factors:- debt service expenditure totalling US$ 369.7 million (40% of total expenditure), of
which payments in respect of CDZ (interest + principal) accounted for US$ 279.8million;
- principal repayments on IMF loans totalling US$ 201 million;- payment of interest and charges to the IMF totalling US$ 32.2 million;- miscellaneous expenditure of the NBS totalling US$ 22.3 million.
At the end of 1995, the foreign exchange reserves of the NBS covered thevolume of Slovakia's average imports of goods and services during a four-monthperiod in 1995, whereas at the end of 1994, the level of reserves was equivalent to a2.5-month import average.
Value of gold = US$ 42.22 / oz
The category of foreign exchange reserves held by commercial banks may bedefined as short-term foreign exchange assets vis-a-vis non-residents. At thebeginning of 1995, the volume of these assets amounted to US$ 1,348 million. Overthe course of 1995, the level of foreign exchange held by commercial banks rose byUS$ 267.6 million, reaching US$ 1,615.6 million at 31 December 1995.
At the beginning of 1995, the total foreign exchange reserves of the bankingsector including the NBS, amounted to US$ 3,093 million; by the end of the year, thisfigure had increased to US$ 5,034 million. The value of the relative coefficientexpressing the foreign exchange position of the banking sector as a whole,expressed as the ratio of total foreign exchange assets to total foreign exchangeliabilities, increased from 1.12 at the beginning of the year, to 1.76 at the end of 1995.
1.3 Money Supply
At 31 December 1995, Slovakia's money supply in terms of the M2 monetaryaggregate (at the current rate of exchange) reached Sk 357.2 billion, representing ayear-on-year increase of Sk 62.5 billion (21.2%).
The growth of the money supply differed over the course of the year. In the firstquarter of 1995, the money supply experienced a decline due to the January fall in
28

demand deposits in the corporate sector. In March, the M2 aggregate decreased onlyslightly despite the tax payments made at the end of the month. In subsequentquarters, development of the money supply showed an upward tendency; in April, theM2 monetary aggregate had already exceeded the level recorded at the beginning ofthe year. The highest month-on-month increase in the money supply was recorded inDecember owing to the interest credited to accounts. The development of quasi-money and the M1 aggregate also fluctuated over the course of the year. Thedevelopment of quasi-money was characterised by a steady upward trend throughoutthe year, with the exception of September; whereas the M1 monetary aggregate wassubject to fluctuation.
Currency in circulation outside the banking sector increased month-by-monththroughout the year, with only insignificant exceptions. The circulation of money wasaffected by seasonal factors such as the Easter and Christmas holidays, and thesummer holiday season.
Development of the Money Supply in 1995
Money supply M2
Money M1
Currency 1/
Demand deposits 2/
- households- enterprises- insurance comp.
Quasi-money
Time deposits 2/
- households- enterprises- insurance comp.
Foreign currencydeposits 3/
- households- enterprises
1.1.
294.7
123.2
28.1
95.131.562.0
1.6
171.5
133.198020.314.8
38.432.36.1
31.3.
292.0
114.6
28.2
86.432.151.82.5
177.4
138.3101.821.714.8
39.133.8
5.3
Volume
30.6.
303.3
121.2
30.3
90.933.655.5
1.8
182.1
142.5105.421.615.5
39.634.74.9
30.9.
318.1
130.7
32.0
98.734.862.1
1.8
187.4
147.1108.622.715.8
40.335.35.0
31.12.
357.2
148.4
34.5
113.937.475.0
1.5
208.8
169.1125.727.715.7
39.735.44.3
Quarterly changes
Q1
-2.7
-8.6
0.1
-8.70.6
-10.20.9
5.9
5,23.81.4
0
0.71.5
-0.8
Q2
11.3
6.6
2.1
4.51.53.7
-0.7
4.7
4.23.6
-0.10.7
0.50.9
-0.4
Q3
14.8
9.5
1.7
7.81.26.6
0
5.3
4.63.21.10.3
0.70.60.1
Q4
39.1
17.7
2.5
15.22.6
12.9-0.3
21.4
22.817.15.0
-0.1
-0.60.1
-0.7
(Sk billions)Annualchange
31.12.95-1.1.95
62.5
25.2
6.4
18.85.9
13.0-0.1
37.3
36.027.7
7.40.9
1.33.1
-1.8
Index
31.12.95/1 .1 . 95
121.2
120.5
122.8
119.8118.7121.093.8
121.7
127.0128.3136.5106.1
103.4109.670.5
1/ Excluding cash in bank vaults2/ Excluding extrabudgetary funds held by the government and the National Property Fund3/ Includes only deposits held by residents (converted at the current rate of exchange)
Demand deposits increased by Sk 18.8 billion in 1995. This was due mainly to thedevelopment of demand deposits in the corporate sector, which had a decisive sharein the structure of demand deposits. The upward trend characteristic of the year as awhole culminated in the final month of the year with an increase in the lendingactivities of commercial banks. Demand deposits in the household sector recordedmonth-on-month increases throughout the year (with the exception of March). In thesame period, demand deposits held by insurance companies fluctuated to someextent, but without significantly affecting the money supply.
Time deposits increased in 1995 by Sk 36 billion, and recorded regular monthlyincreases throughout the year, with the exception of September. The upward trend intime deposits was particularly apparent in the first quarter, when the volume of timedeposits grew despite the decline in the money supply (M2). The trend in timedeposits in the corporate and household sectors reflected the utilisation of theinterest-rate differential of demand and time deposits. Another factor positivelyinfluencing the growth rate of time deposits was consolidation of liquid assets in the
29

corporate sector. This development was also influenced by the increase in economicactivity and growth of revenue in individual sectors.
Within the structure of corporate time deposits, the proportion of medium- andlong-term deposits increased to the detriment of short-term deposits. The proportionof medium-term corporate deposits increased to 13.5%, from 7.5%; this category ofdeposits was dominated by up to 2-year deposits. Time deposits held by householdsrecorded no monthly decreases during the period under consideration. The highestincrease in these deposits was recorded in December as a result of the interestaccrued and credited to accounts. In household deposits by term, the proportion oflong-term deposits increased over the course of the year. This development wassubstantially affected by the February change in the methodology of reportingbuilding savings deposits, which had been classified as medium-term deposits up tothat time. The proportion of short term deposits also recorded a moderate decrease.Deposits held by insurance companies remained more or less unchanged in 1995.
Foreign currency deposits increased slightly in 1995, by Sk 1.3 billion, with butfew monthly changes. The growth in foreign currency deposits was solely due tohousehold deposits, as deposits in the corporate sector showed a decline.
Money supply [M2]Money [M1]
Currency outside banks [MO]Demand deposits
Quasi-money [QM]Time depositsForeign currency deposits
1.1.1995
100.041.8
9.532.358.245.213.0
31.3.1995
100.039.29.7
29.660.847.413.4
30.6.1995
100.040.010.030.060.047.013.0
30.9.1995
100.041.110.131.058.946.212.7
31.12.1995
100.041.68.7
31.958.447.311.1
Within the structure of the money supply, there was little change in the proportionof quasi-money to the M1 aggregate. In comparison with the beginning of 1995, asignificant change had occurred in the structure of quasi-money by the end of theyear: the proportion of time deposits had increased, and that of foreign currencydeposits had decreased. This development confirmed the dominant orientation ofaccount holders towards crown deposits, reflecting increased faith in the domestic
30
Structure of the Money Supply (M2)

currency. In individual quarters, this structure was not predominant and changedaccording to the seasonal effects caused by tax payments, summer holidays, andinterest accrued and credited.
1.4 Bank Lending
The development of bank lending in 1995 was characterised by:- high increase in crown loans, a considerable part of which comprised interest on
non-performing loans;- slowdown in the monthly increase in foreign currency loans;- considerable growth in the share of the private sector in total crown lending, which
exceeded 50% in June and reached 57.2% at the end of 1995;- dominance of short-term loans in the total volume of new loans, with a tendency to
decrease gradually (from 89.6% in January, to 75.5% in December);- decrease in the volume of loans for investment purposes;- considerable increase in standard receivables with reserves and classified
receivables, due primarily to the reclassification of loans in accordance with DecreeNo.3 of the NBS, stipulating regulations for the valuation of receivables and off-balance sheet liabilities of banks according to risk incurred and for the creation ofrecourses designed to cover the same.
After a decline in January, bank lending in Slovak crowns and foreign currency in1995 recorded a significant increase mainly in the period from July to October and inthe month of December. The total growth in domestic credit amounted to Sk 37.3billion (13.7%), due partly to the crediting of interest on non-performing loans after theintroduction of a new method of credit classification. In respect of bank lending,Slovak-crown loans accounted for 80%, and loans in foreign currency accounted for20% of the total increase.
Most of the total increase in crown lending (89.3%) was due to bank loans to non-financial organisations in the entrepreneurial sector. The share of loans to smallbusinesses was low and showed little change throughout the year; this was duepartly to the strict security requirements of commercial banks for bank lending. Thestructure of loans by sector underwent a significant change: the share of the privatesector increased from 44.4% at the beginning of the year, to 57.4% at year end. Theshare of the public sector fell to 32.3%, from 44.7%, chiefly as a result of privatisationand restricted bank lending (newly granted loans in the public sector amounted to Sk39.8 billion, whereas loan repayments represented Sk 62.2 billion).
The development of bank lending during 1995, with the exception of December(interest credited to accounts), was characterised by a steady decline in loans tohouseholds. The decline represented, from the beginning of the year, an average ofSk 0.2 billion per month owing to the relatively high interest rates on newly grantedloans, i.e. generally 15% (19% on short-term loans).
Loans in Sk and foreigncurrenciesof which:
Short-term loansMedium- and long-term loans
1.1.1995Sk billions share in %
273.5 100.0
104.1 38.1169.4 61.9
30.6.1995Sk billions share in %
288.6 100.0
116.5 40.4172.1 59.6
31.12.1995Sk billions share in %
310.8 100.0
117.0 37.6193.8 62.4
The time structure of total domestic credit was characterised by fluctuations in thetotal of short-term loans, unchanged medium-term loans, and a decrease in long-term loans. The relatively high proportion of long-term loans was due to the high
31
Development of Bank Lending in Sk and Foreign Currencies

initial level, comprising loans made in the past for housing development schemes andlarge-scale investment projects.
Short-term loans represented one third (34.6%) of the total increase in banklending in crowns and foreign currency, the remainder (65.4%) consisted of medium-and long-term loans. Of the total increase, short-term loans in Slovak crownsaccounted for 25.8% and short-term loans in foreign currency accounted for 8.8%.
In a sectoral breakdown, a significant increase was reported in the volume ofbank loans in trade, sales, public catering, and accommodation sectors (Sk 14.5billion). This growth was in some measure due to the rapid development of thesesectors, and change in the forms of ownership and subsequent emergence of newbusiness entities. In the production sector, significant increases were recorded inloans to the food industry (Sk 3.1 billion), and metallurgy and machine engineering(Sk 8.1 billion); these funds were allocated for the reconstruction of companies andthe modernisation of technology.
Of the total volume of bank credit drawn in 1995, loans in the privateentrepreneurial sector accounted for 53.3%. The time structure of loans developed infavour of short-term loans (71 to 90% of the total volume), which could not be usedfor the financing of development programmes in the individual sectors and servedmainly to cover current operating needs of business entities.
Bank lending in foreign currency was rather unstable during the 1st half of 1995;there was, however, a dynamic and stable growth in the second half of the year. Atthe end of December 1995, the volume of foreign-currency loans totalled Sk 22.7billion, and the proportion of the total volume of bank credit had increased to 7.3%,from 5.6%. The year-on-year increase amounted to Sk 7.4 billion.
1.5 Interest Rate Development
The development of interest rates in 1995 was marked by the improvedmacroeconomic position of the SR, and especially by the reduction of inflation andsubsequent reductions in the discount rate in March and October. This reductionindirectly influenced interest rates on loans and deposits in the banking sector. Thiswas reflected mainly in the lowering of basic interest rates for various categories ofbank customers (interest rates were cut in April and May by 1.5 to 3.5 points, inNovember and December by 2.5 points). Real interest rates changed to a lesserdegree, as they were affected by various factors such as the proportion of loans todeposits by term, the type of customer (in the case of loans), and the structure ofloans by purpose. There was a shortage of medium- and long-term resources, and asurplus of short-term funds (despite the change in the time structure of deposits).
The average interest rate on the total volume of loans fell to 14.78% in December(i.e. by 1.27 points), from 16.05% in January. The most significant month-on-monthdecreases were recorded in May and November, due to the reduction in the discountrate of the Bank. The most significant reductions were recorded in interest rates onshort-term loans (by 2.54 points, to 17.17%), and medium-term loans (by 1.05 points,to 16.77%); the least significant on long-term loans (by 0,73 points, to 12.12%).
The interest rate policy of commercial banks was aptly characterised by the levelof interest rates on new loans, which included neither social loans noradministratively determined loans at the old fixed-interest rates. The average lendingrate for new loans was lowered significantly from 19.59% to 14.04% (by 5.55 points),due to the cut in the NBS discount rate and the surplus in short-term funds for theyear. The interest rate on short-term loans was cut from 19.77% in January, to13.68% in December, i.e. by 6.09 points. With regard to the shortage of funds and the
32

surplus of demand over supply, the average interest rate on medium-term loans fellby only 2.95 points, to 16.17%, and that on long-term loans by 2.42 point, to 14.37%.The most significant reductions were recorded in April, November, and December.
1. TOTAL VOLUME OF LOANS 3/
A) Loans by sectorof which:- Public sector- Private sector (incl. cooperatives)- Household sector
B) Loans by termof which:- Short-term- Medium-term- Long-term
2. NEW LOANS IN TOTALA) Loans by sector
of which:- Public sector- Private sector (incl. cooperatives)- Household sector
B) Loans by termof which:- Short-term- Medium-term- Long-term
C) Average rates up to 3% 1/
Loans by termof which:- Short-term- Medium-term- Long-term
D) Average rates above 3% 2/
Loans by termof which:- Short-term- Medium-term- Long-term
19951
16.05
17.0716.565.49
18.71188212.85
1959
19.7319 5115.43
197719.1216.791.00
1.000.051.18
1973
19.8319.4517.73
2
16.04
17.2916.365.13
18.8718.6812.75
18.49
19.3918.8014.98
18.9119.3013.460.98
1.000.920.95
18.97
19.2319.3715.09
3
16.00
17.0716.50539
18.8118.6912.71
17.92
18.56182218.54
18.1718.9313.400.42
0.121.021.05
18.25
18.2319.3319.04
4
15.94
17.0516.455.18
18.3918.6512.80
16.45
18 4016.5016.83
164217.2314.710.58
0.490.97082
17.15
17.0817.431732
5
15.83
16.9116.345.22
18.0318.6312.83
16.44
17.6316.6217 40
162417.8116.451.02
1.001.011.14
16.76
16.5118.3517.07
6
15.78
168016.395.17
178818.4012.81
15.97
1780163410.43
15.8317.1715.140.45
0.240.061.11
16.59
16.1418.5516.97
7
15.73
16.8116.335.17
17.6218.3412.89
15.94
17.4716241642
15.5817.9116.751.12
1.001.041.33
16.08
15.6718.031739
8
15.75
168716.30521
17.6018.2112.89
1625
16.6917.2116.41
15.8317.4417.061.05
1.001.001.22
16.46
16.0817.4517.24
9
15.77
16.951628525
17.461820
.13.15
15.48
165816.0211.28
15.1816.6515.85092
1.000.461.04
16.17
15.6417.6517.31
10
15.15
15.7915.91508
16.7217.9812 44
14.67
15.4716.3515.49
14.2016.1515.361.04
1.001.051.43
15.04
14.6516.1715.76
11
14.90
15.541565501
164317.7712.20
14.91
17.3716.011612
14.3516.8316.190.97
0.970.941.01
15.60
15.1716.861688
12
14.78
15.5215.595.06
16.1717.771212
14.04
14.23148915.44
13 6816.1714.370.57
0520.081.05
1455
140916.751599
1/ Long-term loans from previous years (for housing projects, construction of nuclear power plants, familyhouses, house purchases, furnishings, etc.)
2/ Interest rates updated with regard to changes in the discount rate, or the base rate + deviations3/ Excluding loans at zero interest rate
The same policy was applied in the case of deposits, where the most significantreduction was recorded in 2-year deposit rates.
Total depositsof which:Demand depositsTime deposits- 7-day deposits- 1-month- 3-month- 6-month- 9-month- 12-month- 18-month- 2-year- 3-year- 4-year- 5-year- above 5 years
1
9.80
3.6713 679.127.438.207.719.48
127415.95
-16.4113.4816.025.81
2
9.48
3.5313.548908058.847.00
10.2512.9916.03
-9.66
144217593.60
3
9.77
3.8213.655.786.877.778.38
10.4512.771589
-15.70144017.383.53
4
9.04
3.1613.195.549 049.86
12.374.61
13.4111.6315.8115.7315.0518353.87
5
8.86
3.0912.887.046.999.09
11.664.70
13.7413.75156715.8615.5418.333.43
6
915
3.3812.887.007.739.27
11.004.81
13.6813.5516.1615.8015.5018.753.77
19957
8.99
3.3812.837.017.609.07
10.645.08
13.5513.8915.9815.4115.5018.713.75
8
8.92
3.3712.736.787.248.859.295.68
13.3813.9316.0015.41155018703.72
9
8.82
3.3412.685.657.078939.185.25
13.3713.8215.9515.4015.5118.713.82
10
8.80
3.3412.606.206.868808.985.03
13.3113.7415.7214.4414.9818673.74
11
8.20
3.2911.206.696.658.788964.34
11.5413.481262143514.9718.653.70
12
8.23
3.4010.986296.308.59990
10.2911.4613.0212.531426147818.913.07
Note: Calculated according to V (NBS) 11-12
33
Average Lending Rates of Commercial Banks (%)
Average Interest Rates on Crown Deposits (%)

With regard to the average deposit rate, interest rates on time deposits fell by2.69 points, exceeding the reduction in the rate for demand deposits (0.27 points).
For time deposits, the most significant reductions were recorded in the interestrates on deposits with a period of maturity:- up to 7-day deposits (by 2.83 points),- up to 1-month deposits (by 1.13 points),- up to 1-year deposits (by 1.28 points),- up to 18-month deposits (by 2.93 points),- above 3-year deposits (by 2.15 points).
Due to the average interest rate on one-year deposits and the annual rate ofinflation, the real interest rate remained positive throughout the year, increasinggradually from 1.08% in January, to 2.91% in October 1995. It fell, however, to 1.34%in November as a result of the cut in the annual deposit rate. In December, the realinterest rate increased slightly to 1.56%.
The nominal interest margin reached its lowest level (6.23 points) in March andthe highest (7.07 points) in May. At the end of December, the gross margin stood at6.55 points. The interest margin was calculated as the difference between theaverage nominal interest rate on the total volume of crown loans and that on crowndeposits. The real interest margin was substantially lower as a result of the largeamount of unpaid interest on classified assets, accounting procedure, and taxation ofbank earnings.
1.6 Budget Performance and the Internal Debt of the Government
In 1995, the fiscal policy of the Slovak Government was implemented in twodifferent regimes. During the first three months, a provisional budget was applied.Government spending for this period was budgeted at Sk 37.9 billion. This amountwas intended to cover the most necessary non-investment and investmentrequirements, as well as payments and subsidies to the country's production andnon-production sectors. Revenues were set only for budget-financed and subsidisedorganisations.
The State budget of the Slovak Republic for 1995 was approved by Decree No.58/1995 Z.z, of 7 March 1995, of the National Council of the SR, based on thefollowing macroeconomic forecasts:- 5% growth in GDP in constant prices;- 9% rate of inflation;- maximum unemployment rate of 14%.
The total revenue of the State budget was budgeted at Sk 146.4 billion; totalexpenditure at Sk 167.4 billion, and the budget deficit at Sk 21 billion.
Over the course of the year, there were periods of relative stability combined withperiods marked by an increase in the State budget deficit. The most favourablebudget performance was recorded in June (excluding months covered by theprovisional budget), when revenue and expenditure were relatively well balanced (thebudget surplus reached Sk 97 million at the end of the month). A less favourabledevelopment was reported in the months of May (a deficit of Sk 6 billion), November(a deficit of Sk 7.8 billion), and December (a deficit of Sk 8.3 billion). Theperformance of the State budget was considerably influenced by the balance of theclearing account with the Czech Republic (i.e. until the termination of the clearingaccount agreement on 30 September 1995).
34

Budget revenue in 1995 reached a level of Sk 163.1 billion, exceeding thebudgeted figure by Sk 16.7 billion, as a result of an improvement in tax revenue(84%). State budget expectations were significantly exceeded mainly in the area ofvalue-added tax revenue (Sk 9.1 billion). Budgetary performance was favourable inother respects as well, with the exception of excise tax revenue, which remainedbelow the budgeted figure.
Government spending in 1995 exceeded the budget expenditure by Sk 4 billion.This amount was covered by revenue surplus derived from payment transferred fromthe Czech Republic for having exceeded the credit limit on the clearing account andfrom supplementary resources.
State financial assets in deposit accounts with the NBS increased by Sk 1.8billion compared with the figure for 1 January 1995. This development was mainlydue to the drawing of an Economic Recovery Loan from the Export-Import Bank ofJapan. The resulting funds were used to strengthen the foreign exchange reserves ofthe NBS.
State financial liabilities (i.e. so-called direct obligations of the Government vis-a-vis the NBS inherited from the former federation) remained unchanged through 1995.
At the end of 1995, the volume of deposits in accounts held by State fundsincreased by Sk 1.7 billion compared with the figure at the beginning of 1995. Thisincrease was due mainly to the establishment of a State fund for the elimination ofnuclear power facilities and disposal of consumed nuclear fuel rods and otherradioactive waste, and the activities of other State funds. The newly established fundrecorded the highest positive balance closely followed by the State Fund for theSupport of Agriculture and Food Industries.
At 31 December 1995, the net position of the Slovak Government vis-a-vis thebanking sector stood at Sk 63.9 billion, representing a reduction of Sk 6.5 billioncompared with the figure for the beginning of the year. The level of government debtranged from Sk 58 billion to Sk 69 billion, while the tendency towards fluctuation wasdue primarily to the actual performance of the State budget.
35

With regard to debt-structure, changes were recorded mainly in the method ofcovering the 1993 State budget deficit, when government bonds (Issues No. 010-014) were sold in the total amount of Sk 15.1 billion to replace the direct credit of theNational Bank of Slovakia.
Further changes were recorded in the gradual conversion of Treasury bills intogovernment bonds to cover the 1994 State budget deficit (Sk 23.1 billion). Of theother sub-items, which had a positive effect on the level of public debt, significantchanges were recorded in State financial assets (an increase of Sk 1.8 billion), fundsof local authorities (an increase of Sk 1.7 billion as a result of an issue of municipalbonds by the City of Bratislava in December), the volume of social insurance funds(an increase of Sk 6.2 billion due to more resources being available for the pensionfund), and other government deposits (an increase of Sk 0.8 billion compared withthe figure for the beginning of 1995). At the beginning of the year, the burden ofgovernment debt was carried by the National Bank of Slovakia (53.9%), whichprovided funds to cover debts incurred in previous years. However, the debt servicingburden was gradually transferred to commercial banks. At the end of the year,commercial banks financed 78.8% of the total debt owed by the government.
1.7 Balance of Payments
The external conditions for the development of the Slovak economy and theextension of the country's foreign relations remained relatively favourable in 1995.The continuing economic growth in advanced countries, especially in Germany, Italy,and Austria, and the improving economic situation in Central and Eastern Europeancountries, enabled a further growth in exports even though the rate slowed down byalmost 10% compared with the 1994 figure (the annual growth in exports in 1994amounted to 27.8%, compared with 18.5% in 1995). A different trend was recorded inimport: the annual growth in imports increased by 11% compared with the 1994 figure(commodity imports increased in 1994 by 8.2% year-on-year, compared with 19.2%in 1995). In the capital account, the inflow of foreign funds into the economy in theform of investment capital, bank and corporate loans showed a tendency to growduring the whole year and exceeded the outflow of capital, which was due primarily toloan repayments by the Government and the NBS, by Sk 29.4 billion (US$ 994million). The development of Slovakia's balance of payments in convertiblecurrencies was accompanied by increasing faith in the Slovak koruna and furtherliberalisation of current account transactions. The rate of growth in foreign currencydeposits slowed down in the households sector: the volume of deposits increasedonly by Sk 3.1 billion during the period under consideration, compared with Sk 8.2billion in the corresponding period of 1994.
The development of Slovakia's balance of payments vis-a-vis foreign countriesresulted in a Sk 19.3 billion (US$ 649 million) surplus in the current account.
The trade balance generated a surplus of Sk 0.7 billion according to balance ofpayments data (the figure for imports includes goods imported by private individualsto the value of Sk 1.1 billion). The favourable balance of trade was due to a 18.5%year-on-year increase in exports and a 19.2% growth in imports. With regard to theterritorial structure of foreign trade, the trend that characterised development inprevious years continued in 1995: the share of advanced European marketeconomies increased, whereas that of the Czech Republic decreased, and that ofother CEFTA countries showed a slight increase. These countries accounted for 82%of the total volume of commodity exports, and almost 70% of the volume of imports(the share of the Russian federation fell to 17%, from 18% year-on-year). In 1995, thecommodity structure of trade remained virtually unchanged: it continues to bedominated by export of products in the 6 SITC category (raw materials and semi-finished products). The existing large gap between exchange rate and purchasing
36

power parity still left sufficient room for exporters to benefit from price competition inthe specified group of products (raw materials and semi-finished products), where thedifferences in quality or technical level are negligible or insignificant. In imports,above-average increases were recorded in chemicals (22.2%), raw materials(24.5%), and machines and transport equipment (24.6%). Despite the revival ininvestment activity, the share of machines and equipment in total imports increasedonly by 1.3 points, to 29% (while motor vehicles accounted for 18.5% and transportequipment 21% of this commodity group).
Consolidated Balance of Payments for 1995
Trade balanceExports (f.o.b)Imports (f.o.b)
Services balanceRevenues
TransportationTravelOther services
ExpendituresTransportationTravelOther services
Income balanceInterest income
IncomePayments
InvestmentIncomePayments
Employee CompensationIncomePayments
Current transfersOfficialPrivate
Current accountCapital transfersNet medium and long-term fin. account
Direct investmentsPortfolio investmentLoans from abroad
DisbursementsRepayments
Lending abroadDisbursementsRepayments
Net short-term financial accountClearing balance (-, surplus)Payment for exceeding the credit limitCapital and financial accountErrors and omissionsOverall balanceChanges in reserves (-, growth)
Gold holdingsHoldings of SDRsForeign exchange assetsValuation changes
Q1
135.059,530.059,395.04,529.0
16,977.04,545.03,963.08,469.0
12,448.01,880.01,699.08,869.0
248.026.0
1,092.01,066.0
-44.039083.0
266.0275.0
9.0146.040.0
106.05,307.4
700.02,426.0
895.0-489.0
1,276.08,308.0
-7,032.0744.0-34.0492 0
-2,131.6-7,842.03,236.0
-3,611.6760.9
2,207.3-2,207.3
793.2-3,000.5
Q 1-2
-555.0124,978.0125,533.010,850.036,842.08,680.07,960.0
20,202.025,992.0
3,980.03,714.0
18,298.01,540.41,199.43,758.02,558.6
-98.0159.0257.0439.0468.0
29.0461.0-90.0551.0
12,296.41,360.07,773.01,003.02,587.03,533.0
17,280.0-13,747.0
650.0-683.0
1,282.0-2,185.0
-24,954.021,552.0
3,546.06,131.6
21,974.0-21,974.0
-16.02,313.0
-24,271.0
Q 1-3
2,333.0188,111.0185,778.016,002.056,547.013,909.013,278.029,360.040,545.0
6,76406,225.0
27,556.0152.0
-206.05,184.05,390.0-196.0237.0433.0554.0595.041.0
1,802.0345.0
1,457.020,289.0
1,360.09,171.04,171.02,928.0
-54.024,580.0
-24,634.02,126.0-723.0
2,849.0-1,705.0
-28,158.025,819.06,487.01,611.2
28,3872-28,387.2
-58.61,891.4
-30,220.0
(Sk millions)
Q 1-4
717.0254,099.0253,382.0
16,242.070,656.018,296.018,505.033,855.054,41408,930.09,526.0
35,958.0-408.0-894.0
6,322.07,216.0-204 0315.0519.0690.0766.076.0
2,742.0497.0
2,245.019,293.01,360.0
22,977.03,984.07,317.09,633.0
23,407.0-21,596.0
2,043.0-2,325 04,321.02,715.0
-28,158.030,501.529,395.5-1,741.546,947.0
-46,9470-58.0950.0
-47,839.0
Note: Exchange rate applied: US$ = 29.735 Sk
The positive balance of services, which reached Sk 16.2 billion in 1995,represented a stable factor affecting the growth of the current account surplus. Themain source of surplus in the services balance was the export of transportationservices including income from oil and gas pipelines transiting Slovak territory andtourism. Income from foreign tourism reached Sk 18.5 billion, i.e. US$ 622 million,and accounted for 5.7% of the exports of goods and services. Slovak nationalsshowed less interest in drawing on the foreign currency allowance for personal travel
37

(which was twice increased during 1995, i.e. to Sk 30,000 on 1 July, and to Sk60,000 on 1 October) than in 1994. In that period, foreign currency was drawn byroughly 10% of the population, and the average volume of sales amounted to Sk6,840. The total volume of foreign currency spent on individual travel, package tours,and business trips reached Sk 9.5 billion.
A substantial part of the income balance, which resulted in a deficit of Sk 408million, was formed by interest payments and receipts on foreign currency loans. Theexpenditure side of the balance amounted to Sk 7.2 billion and was concentrated inthree basic sections: interest on loans granted to the former CSFR (Sk 4 billion),interest on borrowings from the IMF (Sk 1 billion), and loan interest paid by banksand enterprises (Sk 2.3 billion). The income side of the balance (Sk 6.3 billion) waspositively affected by the one-off payment of interest by Russia on its trade debt withSlovakia, and the interest receipts from deposits, FIXBIS, and coupons on foreignsecurities held by the NBS totalling Sk 4.3 billion.
Under current transfers, the most significant items were private transfers fromabroad (pensions, allowances, alimony payments, legacies, benefits, and gifts toprivate individuals), which represented Sk 2.7 billion in the balance and accounted for80% of the total volume of transfers.
The capital and financial account generated a surplus of Sk 29.4 billion, i.e. US$994 million, due to increased flow of funds into the entrepreneurial and bankingsectors. These trends were accompanied by changes in the structure of capitalinflow, caused by a fall in the volume of official borrowings from financial institutionsin favour of private sources.
The capital account, comprising capital transfers from the Czech Republic,amounted to Sk 1.4 billion.
The revenue side of the financial account was dominated by net foreigninvestment (Sk 11.3 billion), which was posted mainly as portfolio investment. One ofthe more important examples of the latter was the sale of shares issued by Slovakand Czech companies to the Czech Republic in the period from March to May 1995.These portfolio investments are regarded as passive portfolio investmentscharacterised by immediate return, and where the key role is played by exchangeand interest rates. Net foreign direct investment amounted to Sk 4 billion andremained below the level of 1994. The volume of foreign capital invested in theSlovak Republic is an indication of the relative lack of interest of foreign investors inentering into international co-operation with Slovak companies. With regard to thebasic structure of foreign capital, development in 1995 was characterised by a higherinflow of portfolio than direct investment, which is hardly likely to bring about thedesired changes in competitiveness and structural reform.
The contribution of the entrepreneurial sector to the financial account surplusamounted to Sk 16.1 billion. In the form of foreign currency loans to the enterprisesector (drawing was considered without repayment), the Slovak economy hadreceived long-term capital in the amount of Sk 11.7 billion by the end of November.
The drawing of long-term loans showed an upward trend during the year, andreached Sk 20.4 billion at year end. Of this amount, long-term trade credit for theimport of goods and services represented Sk 2.6 billion. Corporate financial creditwas provided in the amount of Sk 17.8 billion for the financing of domestic activitiesin the investment area. These funds were employed in agriculture, watermanagement (completion of the hydro-electric project at Gabčíkovo), power andchemical industries. In terms of loans by country, the first place was occupied byGreat Britain (46%); this led to a reduction in the proportion in loans from international
38

banks such as EBRD and EIB, to 32%. Of the other countries, most loans of privatenature came from Austria (8.5%) and Germany (8.3%). The repayment of commercialloans from previous years exceeded the drawing of new loans, and reached Sk 5.7billion. The repayment of financial credit represented Sk 3 billion.
Net short-term capital in the entrepreneurial sector representing the differencebetween corporate liabilities and receivables amounted to Sk 4.2 billion. Short-termborrowings by the entrepreneurial sector from abroad in the amount of Sk 4.4 billion,and loans granted abroad in amount of Sk 0.2 billion were mainly in the form ofsupplier credit. Short-term loans to the entrepreneurial sector from abroad consistedof commercial loans for the promotion of commodity imports in the amount of Sk 2.3billion and financial credits in the amount of Sk 2 billion.
The financial account surplus in the period under consideration was generated bythe inflow of net capital into the banking sector (liabilities minus assets) in the amountof Sk 6.3 billion. The increased amount of long-term and short-term funds drawn bycommercial banks from abroad (drawing is considered without repayment in theanalysed period) in the amount of Sk 14.7 billion was used to cover increasedimports and to provide foreign currency loans to domestic entities.
The surplus of loan repayments by the Slovak Government and the NBS overrevenue resulted in an outflow of capital in the amount of Sk 8.2 billion. The drawingof official loans was at a relatively low level in comparison with previous years. Loansmade to the Government and the NBS in the amount of Sk 3 billion were channelledthrough the EXIM Bank of Japan (Sk 2.5 billion) and the European Investment Bank(Sk 0.5 billion). Loan repayments totalled Sk 12.9 billion. Of this amount, therepayment of IMF loans accounted for Sk 6 billion (47%). In 1995, another portion ofgovernment receivables was repaid to the Slovak Republic in the amount of Sk 1.7billion, while 86% of this amount was repaid in the form of natural gas from Russia.
In the period from January to September 1995, payments between the SR andCR continued to be settled according to the clearing account agreement signed inFebruary 1993, and which was terminated with effect from 1 October 1995. Thedevelopment of the reciprocal payments and settlement account in 1995 wascharacterised by a permanent surplus in favour of the Slovak Republic. The fastergrowth of receipts over payments in the clearing account was reflected in thecumulative balance of clearing (Sk 28.2 billion) at the end of September. The amountby which the balance had been exceeded was repaid in hard currency on a monthlybasis. The Slovak side received a total of US$ 908 million. The credit limit was repaidin accordance with the agreed schedule (3/4 of ECU 130 million was settled inDecember 1995, and 1/4 will be repaid in 1996 in the form of commodity imports).
1.8 Debt Servicing by the NBS and the Slovak Government
At 31 December 1995, the total gross debt of the Slovak Republic in convertibleand non-convertible currencies amounted to US$ 5.8 billion. On the same date, theofficial debt of the Slovak Government and the NBS stood at US$ 2 billion. Slovakia'sforeign debt in convertible currency totalled US$ 5.7 billion. The difference (US$ 0.1billion) represented the estimated debt in non-convertible currencies owed to theformer German Democratic Republic.
The total indebtedness of the commercial sector, i.e. commercial banks andentrepreneurial entities, amounted to US$ 3.7 billion at the end of 1995. The largestincrease was recorded in short-term liabilities, which reached a level of US$ 1.6billion in October 1995. This represented an increase of US$ 0.5 billion comparedwith the level of short-term debt in September 1995.
39

The absolute growth in the total gross debt of the Slovak Republic was duemainly to the gradual increase in the import obligations of entrepreneurial entities andgrowth in the hard currency liabilities of commercial banks. Substantial changes inthe structure of hard currency liabilities were recorded in the commercial sector inMarch and June 1995. These changes were reflected in the increased external debtof the Slovak Republic at year end.
The highest increase in Slovakia's foreign currency debt was due to a change inthe methodology of accounting the liabilities vis-a-vis the CR with effect from October1995. The change in the method of debt reporting vis-a-vis the CR is associated withthe fact that the Czech koruna was made convertible with effect from 1 October 1995after the termination of the clearing account agreement between the SR and the CR.As a result of the change in methodology, the total gross debt of the SR increased byUS$ 0.4 billion, and affected the growth of indebtedness after October 1995.
In connection with the development of external debt, it should be emphasised thatthe official debt of the Slovak Government and the NBS reported on a monthly basis,and the total gross hard currency debt of the Slovak Republic were influenced by theexchange rate fluctuations of fully convertible currencies against the US dollar, andare updated regularly on a monthly basis.
The volume of repaid foreign exchange liabilities, i.e. the gross debt service of theSR, reached an equivalent of US$ 602.9 million in 1995. Of this amount, principalrepayments accounted for US$ 439.7 million (principal repayments within the CDZblock amounted to US$ 238 million) and the payment of interest and chargesrepresented US$ 163.2 million. Of the total of US$ 602.9 million, the volume ofliabilities repaid to the IMF in 1995 amounted to an equivalent of US$ 232.2 million(of which, repayments of principal accounted for US$ 201.1 million).
The largest amounts of foreign exchange liabilities repaid as part of debtservicing in 1995, were the repayments of principal on two independent issues offive-year bonds launched in the total amount of US$ 490 million by CSOB Prague in1991 (both issues were guaranteed by the former State bank of Czechoslovakia).The repayments were realised in July and October in the amount of US$ 82.5 millioneach. In repaying the principal with interest, the Slovak Republic had fully dischargedits liability in this respect.
40
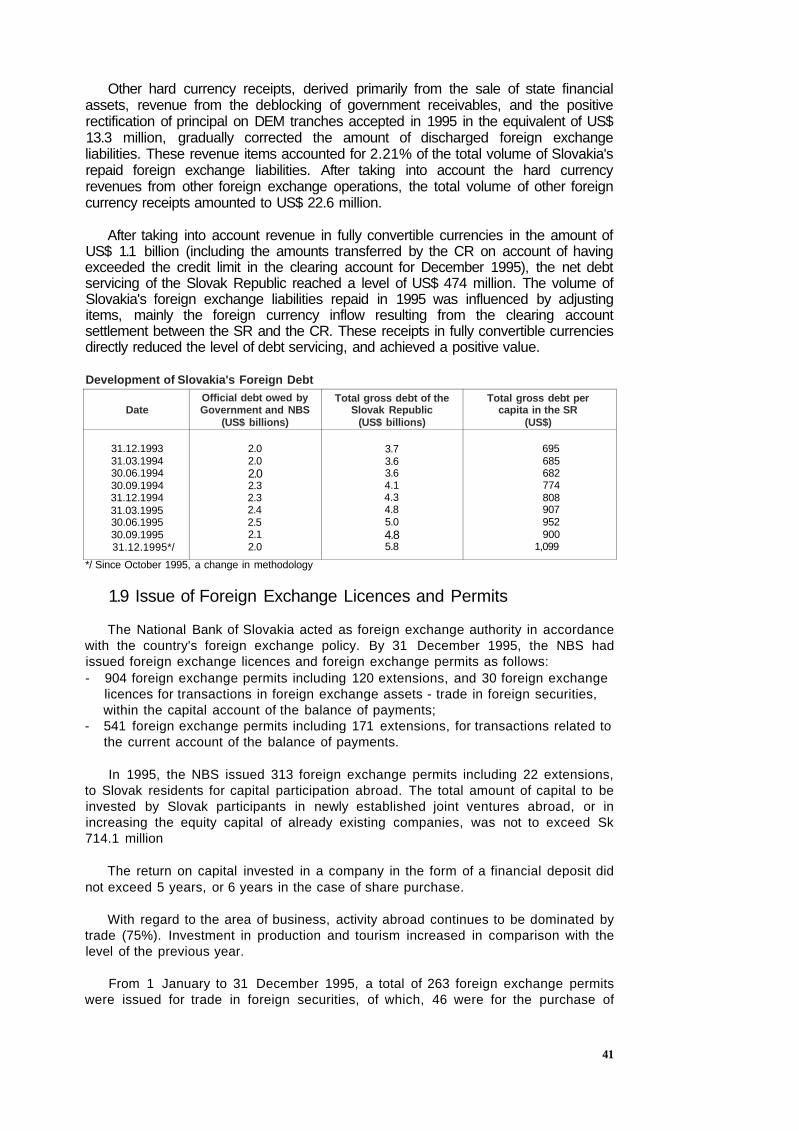
Other hard currency receipts, derived primarily from the sale of state financialassets, revenue from the deblocking of government receivables, and the positiverectification of principal on DEM tranches accepted in 1995 in the equivalent of US$13.3 million, gradually corrected the amount of discharged foreign exchangeliabilities. These revenue items accounted for 2.21% of the total volume of Slovakia'srepaid foreign exchange liabilities. After taking into account the hard currencyrevenues from other foreign exchange operations, the total volume of other foreigncurrency receipts amounted to US$ 22.6 million.
After taking into account revenue in fully convertible currencies in the amount ofUS$ 1.1 billion (including the amounts transferred by the CR on account of havingexceeded the credit limit in the clearing account for December 1995), the net debtservicing of the Slovak Republic reached a level of US$ 474 million. The volume ofSlovakia's foreign exchange liabilities repaid in 1995 was influenced by adjustingitems, mainly the foreign currency inflow resulting from the clearing accountsettlement between the SR and the CR. These receipts in fully convertible currenciesdirectly reduced the level of debt servicing, and achieved a positive value.
Date
31.12.199331.03.199430.06.199430.09.199431.12.199431.03.199530.06.199530.09.199531.12.1995*/
Official debt owed byGovernment and NBS
(US$ billions)
2.02.02.02.32.32.42.52.12.0
Total gross debt of theSlovak Republic
(US$ billions)
3.73.63.64.14.34.85.04.85.8
Total gross debt percapita in the SR
(US$)
695685682774808907952900
1,099
*/ Since October 1995, a change in methodology
1.9 Issue of Foreign Exchange Licences and Permits
The National Bank of Slovakia acted as foreign exchange authority in accordancewith the country's foreign exchange policy. By 31 December 1995, the NBS hadissued foreign exchange licences and foreign exchange permits as follows:- 904 foreign exchange permits including 120 extensions, and 30 foreign exchange
licences for transactions in foreign exchange assets - trade in foreign securities,within the capital account of the balance of payments;
- 541 foreign exchange permits including 171 extensions, for transactions related tothe current account of the balance of payments.
In 1995, the NBS issued 313 foreign exchange permits including 22 extensions,to Slovak residents for capital participation abroad. The total amount of capital to beinvested by Slovak participants in newly established joint ventures abroad, or inincreasing the equity capital of already existing companies, was not to exceed Sk714.1 million
The return on capital invested in a company in the form of a financial deposit didnot exceed 5 years, or 6 years in the case of share purchase.
With regard to the area of business, activity abroad continues to be dominated bytrade (75%). Investment in production and tourism increased in comparison with thelevel of the previous year.
From 1 January to 31 December 1995, a total of 263 foreign exchange permitswere issued for trade in foreign securities, of which, 46 were for the purchase of
41
Development of Slovakia's Foreign Debt

securities (in the amount of Sk 89.2 million) and 217 for the sale of foreign securities(in the amount of Sk 75.4 million). Foreign exchange permits in the amount of Sk10.6 million were issued for the purchase of foreign securities (government bonds) aspayment for receivables from abroad.
Capital Participation Abroad
Country
Czech RepublicAustriaUkraineLithuaniaCroatiaAustraliaSpainHungaryGermanySloveniaPolandRussiaLiechtensteinOther
Total
Number ofpermits,
licences, andextensions
1731239
1313
2841
1116
120
313
(Sk millions)
Maximum amount of invested capital
Financecapital
416.4462.5019.150.00
17.677.737.152.575.442.021.111.291.282.64
546.99
Tangibleassets
2.110.00
42.2725.02
0.003.310.000.000.000.000.040.410.000.74
73.90
Capitalisationof receivables
0.200.000.000.000.000.000.003.200.000.000.590.000.000.00
3.99
Know-how
0.110.000.000.000.000.000.000.000.000.000.000.000.000.00
0.11
Stocks andshares
89.150.000.000.000.000.000.000.000.000.000.000.000.000.00
89.15
Total
508.0162.5061.4225.0217.6711.047.155.775.442.021.741.701.283.38
714.14
Note: Exchange rate as at 29 December 1995
In the period under review, the NBS granted 373 foreign exchange permits forborrowing from abroad; of this, 225 permits were issued for the acceptance of bankloans from abroad, 38 permits for the repayment of foreign loans, and 98 existingpermits were extended. In 12 cases, the foreign exchange permits were not utilised.
Borrowing from abroad was sanctioned in the total amount of Sk 25,355.8 million,including Sk 102 million of loans drawn in 1994. Exemption from the obligation toconvert the foreign currency into Slovak crowns was granted in 16 cases, and theamount held in foreign currency accounts equalled Sk 3,315.1 million. This amountaccounted for 13.07% of the total volume of foreign currency loans.
Estimated Drawing and Repayment of Approved Loans at 31 December 1995
DrawingRepaymentBalance
1995
20,1111,859
18,252
1996
4,2945,315
-1,021
1997
5503,027
-2,477
1998
181,524
-1,506
1999
181,687
-1,669
2000
08,278
-8,278
2001
0431
-431
2002
01,431
-1,431
2003
0433
-433
2004
0318
-318
(Sk millions)
2005
0446
-446
after2005
0605
-605
Note: Exchange rate as at 29 December 1995
The volume of approved loans from banking institutions amounted to Sk 17,606.4million (69%), and borrowing from non-bank entities totalled Sk 7,749.5 million (31%).
With regard to maturity, one-year loans were approved in the amount of Sk5,554.8 million (22%), two-year loans in the amount of Sk 2,724.8 million (11%),three- to five-year loans in the amount of Sk 11,855.9 million (46%), and loans with amaturity of five and more years in the amount of Sk 5,220.3 million (21 %).
Of the total volume of approved loans from abroad, Slovak banks were offeredguarantees in 29 cases to cover Sk 5,846.9 million of loans (23.06%). Governmentguarantees were granted in 10 cases: Slovenské telekomunikácie, state company,Bratislava, (twice); Slovenský plynárenský priemysel, state company, Bratislava;Solivary a.s. Prešov; ZTS state company, Dubnica nad Váhom (5 times); and
42

Vodohospodárska výstavba, state company, Bratislava, to a total amount of Sk9,558.1 million (37.7%).
Country
Great BritainAustriaCzech RepublicGermanyLuxembourgUSAThe NetherlandsFranceItalySwitzerlandOther countries
Total
Number of licences
27101
1863
42
11398
17
263
Volume (Sk millions)
11,437.815,155.492,463.821,973.501,901.861,064.48
656.87266.03188.8887.21
159.88
25,355.83
Structure of Loans by Sector
Sector
Industrial productionBuilding and constructionTrade, catering, accommodationGeneration and distribution of energyTransport, tourism, communicationsAgricultureForestry and timber industryMining of mineralsOther
Total
Number of licences
789
11756410
43
263
Volume (Sk millions)
9,587.968,015.913,082.931,940.56
983.98543.93
18660.00
1,181.90
25,355.83
With regard to purpose, the largest volume of approved foreign loans was earmarkedfor investment and real estate purchases (59%), coverage of operating expenses (30%),purchase of technology from abroad (10%), and for privatisation (1%).
For operations related to the current account of the balance of payments, theNBS issued 370 foreign exchange permits and 171 extensions (between 1 Januaryand 31 December 1995) primarily for:- the opening of foreign currency accounts in foreign banks;- the opening of foreign currency accounts in domestic banks;- the establishment of an operational foreign currency base for financing the cost of
business trips abroad;- for the transfer of funds from crown accounts held abroad to the Czech Republic;- the establishment of a foreign exchange accounting unit and the cash purchase of
foreign currency for forwarding services;- for the import and export of foreign banknotes and coins through tourism or by post.
43
Structure of Loans by Creditor Country

2. MONETARY POLICY
The implementation of monetary policy in 1995 was based on the regulation ofthe money supply expressed in terms of the M2 aggregate as a partial monetaryobjective with respect to the development of other monetary variables and keyindicators of the real economy.
2.1 Objectives and Implementation of Monetary Policy
The primary objective of the monetary policy of the National Bank of Slovakia for1995 was to maintain the internal and external stability of the domestic currency, atthe same time as supporting economic growth.
With regard to internal stability, the Bank's task was to keep consumer priceincreases within the limits of 8 to 10%. The fall in consumer prices made it possiblefor the NBS to lower the discount rate from 12% to 11% in March, and to 9.75% inOctober 1995.
The external stability of the domestic currency is defined by the fixed exchangerate of the Slovak crown against other currencies. In 1995, the NBS continued tomaintain the crown's fixed nominal exchange rate against the basket of currencies.The stable exchange rate, the growth in foreign exchange reserves, and thefavourable development of the economy created conditions for making the Slovakcrown convertible within the current account of the balance of payments with effectfrom 1 October 1995.
The dynamic growth of the economy in comparison with 1994 was documentedby Slovakia's favourable economic indicators. The gross domestic product, convertedat 1993 prices, increased by 7.4% during 1995.
Under the influence of the twin factors of the growth in real income and thepositive level of real interest rates, households continued to receive financial benefitfrom the various forms of savings accounts offered by commercial banks.
The increase in the unrealised purchasing power of households amounted to Sk39.5 billion, of which the growth in Slovak-crown deposits represented Sk 33.5 billionand the increase in cash held by households accounted for Sk 6 billion. The ratio ofsaving, expressed as the increase in unrealised purchasing power in relation tohousehold incomes in cash, reached 7.7% (in comparison with 7.2% in 1994).
2.2 Valuation of Monetary Development
The monetary survey presents the consolidated balance of payments of the SR(NBS and commercial banks) at a fixed rate of exchange.
The money supply increased by Sk 62.3 billion (21.1%), due to increases in bothdomestic and net foreign assets.
Net foreign assets increased by Sk 46 billion compared with the initial level. Thisgrowth was due to the inflow of funds from abroad via the balance of paymentsaccount.
Newly created domestic resources expressed in terms of net domestic assetsincreased by Sk 16.3 billion. This growth was due primarily to the positive influence ofdomestic credit moderated by the development of other net items.
44

The Sk 29.3 billion growth in total domestic credit (including net credit to theGovernment, net credit to the National Property Fund, and loans to households andenterprises), was affected by the rate of growth in loans to households andenterprises, while Slovak-crown loans recorded an increase of Sk 31 billion at theend of 1995, with an accelerated rate of growth in the second half of the year. Overthe course of the year, increases were also recorded in foreign currency loans toresidents, which helped commercial banks to provide cheaper loans to solvent clientsfrom their lower priced foreign and domestic foreign exchange resources.
The development of net credit to the Government had a diminishing effect ondomestic credit not only during the first half of the year (owing to the provisionalbudget and the payment of corporate and personal income tax), but also during thelast month of 1995. The improvement in the Government's position vis-a-vis thebanking sector (by Sk 7.3 billion) tended to slow down the growth of the moneysupply.
The Sk 13 billion increase in other net items within the structure of net domesticassets exerted, in relation to other components of domestic resources, an eliminatingeffect on the growth of the money supply. This development was due mainly to thegrowth in correcting items. The volatility of other net items during 1995 wasinfluenced mainly by accrued items, both actively (concentration of payment ordersfrom tax payers at the end of 1995) and passively (accumulation of funds for thepayment of interest on deposits).
The average monetary base (adjusted balance of the NBS designed to monitorthe development of liquidity and the employment of funds in the banking sector)increased by Sk 22.1 billion, compared with the figure for the beginning of the year.
With regard to the monetary base, the main stimulating elements were theautonomous factors, the development of which is influenced by the National Bank ofSlovakia only indirectly and to a limited extent. The overall effect of autonomousfactors, which increased by Sk 24.4 billion (the elements of which developeddifferently), had a stimulating effect on the growth of free funds in the banking sector.
The most significant changes were recorded in net foreign assets, whichincreased in 1995 by Sk 43.1 billion, due to the surplus in foreign exchange fixing andthe balance of the clearing account with the Czech Republic.
During 1995, the volume of net credit to the Government fell by Sk 21.9 billion,and part of the NBS's creditor position was transferred to commercial banks throughissues of bonds designed to cover the 1993 State budget deficit.
In 1995, monetary-policy factors fell by Sk 2.3 billion, and contributed to thedecrease in the monetary base. After a considerable decline in the first half of theyear, the volume of dealing in bills of exchange recorded an increase after July 1995;it remained, however, below the initial level. Refinancing through bills of exchangewas influenced by the discount rate of the NBS and favourable developments inagriculture.
On the liability side (application of the monetary base), the resources createdwere partially absorbed by the issue of new currency. The average volume ofcurrency in circulation increased in 1995 by Sk 4.3 billion (14.8%), compared with the1994 figure.
The average volume of funds held by commercial banks in accounts with theNBS as required reserves increased - in accordance with the growth in primary
45

deposits held by commercial banks - by Sk 2.75 billion, from Sk 14.53 billionJanuary to Sk 17.28 billion in December.
in
In 1995, the NBS concentrated its effort to reduce the excessive liquidity of thebanking sector, generated by increased domestic lending activity (fear of possibleinflationary effects), through issues of NBS bills (Central Bank bills), and thesecuritisation of the Government's debt to the NBS, through the sale of governmentbonds to banks and non-bank entities. In August 1995, the NBS commenced periodicauctions of NBS bills. In the last two months, these auctions were supplemented byauctions of NBS bills for the Bank's own portfolio, earmarked for the adjustment andoptimisation of the development of free liquidity of commercial banks (of the averageamount of Sk 23 billion, the NBS held NBS bills worth Sk 9 billion an average in itsportfolio).
2.3 Utilisation of Monetary-Policy Instruments
The instruments of monetary policy in 1995 were marked by a systemic changeconsisting of the creation of conditions for transition to qualitative control of monetaryvariables.
Direct monetary-policy instruments employed by the central bank in 1995included credit limits on a group of five commercial banks with loans exceeding Sk 20billion. In these banks, the limits related to borrowings from foreign sources (EBRD,EIB, EXIM Bank of Japan, PHARE, NARMSP - National Agency for the Support ofSmall- and Medium-Sized Businesses). At the end of 1995, in the category of bankswith limited lending, loans were made from the specified sources in the amount of Sk1.8 billion. Other commercial banks were not limited in this way.
To ensure the goals of monetary policy, the NBS set a credit limit for the wholebanking sector in the amount of Sk 285.9 billion. At the end of December, the volumeof bank loans to households and enterprises amounted to Sk 306.5 billion, exceedingthe credit limit by Sk 20.6 billion (representing fulfilment to 107.2%). Lending in fullyconvertible currencies accelerated at a faster rate (index of growth: 157.6%) thanlending in Slovak-crowns (index of growth: 112.3%).
The exceeding of the credit limit determined by monetary-policy objectivesconsiderably influenced the development of lending by banks not subject to creditlimit.
The structure of bills of exchange transactions concluded by the NBS in 1995 wasas follows:- rediscounting of bills for the support of agriculture,- discounting of bills for financing the export activities of domestic producers.
46

In 1995, the NBS did not have to provide refinancing funds through creditauctions or Lombard loans to bridge over the short-term liquidity problems ofcommercial banks.
Bills of Exchange Operations of the NBS
End-of-month figures
Bills of exchange operationsin total
- rediscounting of bills 1/
- discounting of bills 2I
Utilisation - rediscount (%)Utilisation - discount (%)
(Sk millions)1995
1
1,577.41,320.2
257.266.034.3
2
1,270.1998.7271.449.9362
3
8106535.2275426836.7
4
469.827401958
13.7261
5
322 4147.3175.1
98233
6
360.7158.72020
10.626.9
7
3456152.2193.4
10.125.8
8
431.1253.1178.016.9237
9
662.6481 4181.232.1242
10
9000721.3178.748.123.8
11
1.194.41,059.8
134 670.717.9
12
1,334 01,215.9
118.181.115.7
1/ From January to April 1995, Sk 2,000 million was allocated for the rediscounting of bills;after May 1995, the amount was Sk 1,500 million
2/ The amount earmarked for export promotion was Sk 750 million
47
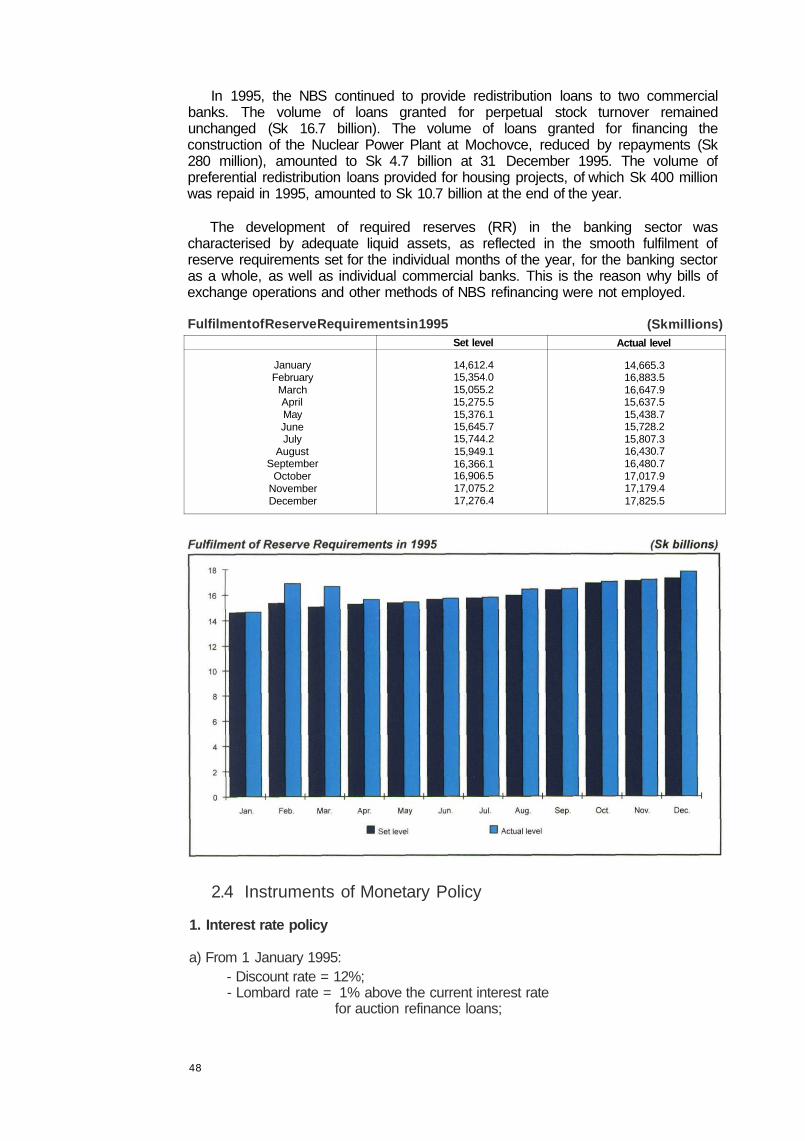
In 1995, the NBS continued to provide redistribution loans to two commercialbanks. The volume of loans granted for perpetual stock turnover remainedunchanged (Sk 16.7 billion). The volume of loans granted for financing theconstruction of the Nuclear Power Plant at Mochovce, reduced by repayments (Sk280 million), amounted to Sk 4.7 billion at 31 December 1995. The volume ofpreferential redistribution loans provided for housing projects, of which Sk 400 millionwas repaid in 1995, amounted to Sk 10.7 billion at the end of the year.
The development of required reserves (RR) in the banking sector wascharacterised by adequate liquid assets, as reflected in the smooth fulfilment ofreserve requirements set for the individual months of the year, for the banking sectoras a whole, as well as individual commercial banks. This is the reason why bills ofexchange operations and other methods of NBS refinancing were not employed.
Fulfilment of Reserve Requirements in 1995
JanuaryFebruary
MarchAprilMayJuneJuly
AugustSeptember
OctoberNovemberDecember
Set level
14,612.415,354.015,055.215,275.515,376.115,645.715,744.215,949.116,366.116,906.517,075.217,276.4
(Sk millions)Actual level
14,665.316,883.516,647.915,637.515,438.715,728.215,807.316,430.716,480.717,017.917,179.417,825.5
2.4 Instruments of Monetary Policy
1. Interest rate policy
a) From 1 January 1995:- Discount rate = 12%;- Lombard rate = 1% above the current interest rate
for auction refinance loans;
48

- Penalty rate on stand-by loans = three times the discountrate = 36%;
- Penalty rate for exceeding the technical debit of the State budgetperformance = 18%.
b)From 17 March 1995:- Discount rate = 11%;-Lombard rate = 13.1%;- Penalty rate on stand-by loans = three times the discount
rate = 33%.c) From 6 October 1995:
- Discount rate = 9.75%;- Penalty rate on stand-by loans = three times the discount
rate = 29.25%.
2. Reserve requirements
- The ratio of primary deposits for the calculation of the level of required reserves= 3% of time deposits, 9% of demand deposits, and 1% of building savingdeposits (from 1 April 1995).
3. Credit limits
- A direct instrument for the regulation of asset portfolios held by commercialbanks;
- Credit limits are imposed only on those banks whose lending exceeds Sk 20billion.
4. System of refinancing
- The refinancing of commercial banks took one of the following forms:a) Auction refinance loans (monthly) at auction interest rates (not drawn);b) Redistribution loans:
Traditional - at a rate of 9.5%;Soft loan - at a rate of 7.5%;
c) Lombard loans - loans associated with the pledge of securities at Lombardinterest rate (not drawn);
d) Rediscounting of bills - bills of exchange are rediscounted at the discount rate;this form of refinancing included bills discounted for export promotion and billsrediscounted for the support of agriculture.
5. Treasury bills
- An effective means of financing the State budget deficit:- A means of managing the liquidity of commercial banks through:
a) Secondary sales and purchases;b) REPO operations (repurchase agreements).
49

6. NBS bills
- An instrument used by the central bank to influence liquidity of commercial banksvia the same trading sectors as for Treasury bills;
7. Exchange-rate and foreign-exchange policy
a) The currency basket of the SKK as of 14 July 1994:
Absolute definition of the currency basket:1 IDX = 0.012817 US$ + 0.029663 DEM
Currency
WeightExchange rate SKK
USD
40%31.209
DEM
60%20.227
b) Evaluation of the currency basket of the SKK:-The turnover of foreign exchange transactions (according to the payment items
specified in groups 1 to 6 in convertible currencies) reached a level of Sk 441.8billion in the period January to November 1995. The average monthly turnoveramounted to Sk 40.2 billion, representing an increase of 35.8% compared withthe same period of last year. The currency structure of the turnover of foreignexchange transactions was stable in the period under consideration, andcorresponded to the structure of the currency basket to which the exchange rateof the Slovak crown is pegged. The leading currencies (DEM and US$) had adominant share in this turnover (39.2% and 36.3% respectively). The otherEuropean currencies, with a strong correlation to DEM, accounted for 22.5%.Together with DEM, these currencies represented 61.7% of the total turnover.The share of non-continental currencies including GBP was substantially lower(2%), which, together with US$, accounted for 38.3% of the turnover.
c) Management of the foreign exchange position of commercial banks:- Approach to NBS foreign exchange fixing in the case of a FXA/FXL ratio (foreign
exchange assets / foreign exchange liabilities) was lower than 1.05; i.e. thecommercial bank can adjust its foreign exchange position to adjust to the 1.05coefficient at any time, by the sale or purchase of foreign exchange upon foreignexchange fixing by the NBS.
d) Exchange rate fluctuation:- The exchange rates of the Slovak crown against fully convertible currencies
upon foreign exchange fixing are influenced by the rate of IDX/SKK, whichrepresents the effect of demand and supply on the part of commercial banks.The IDX/SKK rate may move within the fluctuation band (±1.5%).
2.5 Monetary Calendar
January- 1st January: the Monetary Programme of the NBS for 1995 came into effect;- 1st January: the Act No. 374/1994 Z.z. of the National Council of the SR on the
adoption of measures relating to the State budget of the SR for 1995 (provisionalbudget) came into effect.
50
February- The Association Agreement between the European Union and the Slovak Republic
made it possible for Slovak investors to establish and operate enterprises in EUcountries from 1st February 1995;
- The Board of the Bank approved a decree stipulating the terms and conditions ofrendering exchange office services by legal entities and private individuals, and theNBS Decree stipulating the terms and conditions of transactions in foreignexchange by non-bank entities;
- Release of the 3rd tranche of the loan from the European Investment Bank;- The first issue of Central Bank bills (NBS bills).
March- 3rd March: the Board of the Bank approved a decree setting regulations for
evaluating the receivables and off-balance sheet liabilities of banks according to therisk incurred and for the creation of resources to cover such risk;
- 17th March: lowering of the discount rate from 12% to 11%;- The American rating agency Standard & Poor's raised the the hard currency long-
term liability rating of the NBS to BB+ with stable outlook.
April- The decision of Bank's Board to set reserve requirements for building savings
banks at 1% of deposits, came into effect.
May- The Board of the Bank decided to revalue the clearing XCU by 4% with effect from
19 May 1995. The new rate was set at XCU/ECU = 1.01;- 23rd May: the President of the SR appointed Jozef Mudrík as Vice-Governor of the
NBS;- Moody's Investment Service assigned a hard currency debt rating of Baa3
(investment grade) to the SR as represented by the NBS.
June- The Board of the Bank decided to raise the limit on the sale of foreign currency to
citizens for 1995 to Sk 30,000, or the equivalent of US$ 1,000, with effect from1 July 1995;
- 27th June: the application of the SR for admission to the EU was officially filed inCannes.
July- The signing of an agreement with the European Investment Bank on an ECU 50
million loan for financing small and medium-sized businesses in selected areas ofthe economy;
- 3rd July; the official fixing of interest rates on the interbank money market BRIBORwas introduced.
September- The NBS decided to revalue the clearing XCU by 1% with effect from 5 September;
thus the value of XCU rose to the ECU level;- 30th September: the clearing account agreement between the Slovak Republic and
the Czech Republic was terminated.
October- 1st October: the Foreign Exchange Act (No. 202/1995 Z.z.) came into effect. The
new law made the Slovak crown convertible for current account payments inaccordance with Article 8 of the International Monetary Fund Agreement. At thesame time, the NBS decrees issued by the Board to implement the ForeignExchange Act also came into effect;
51

- The Board of the Bank decided to lower the discount rate from 11% to 9.75%, witheffect from 6 October 1995;
- The NBS included the exchange rate of the Czech crown, and the Czech NationalBank that of the Slovak crown, in its official list of daily exchange rates.
November- The Government of the SR approved the 1996 State Budget Bill (No. 304/1995 Z.z.)
with a deficit of Sk 27 billion, a minimum of 5% growth in GDP, and an annual rateof inflation between 6 and 8%.
December- The Government of the SR approved an amendment to the Banking Act. The
amendment introduced mortgage banking and strengthened the powers of theBanking Supervision Department of the NBS;
- 21st December: the Board of the Bank approved the Monetary Programme andMonetary Instruments of the NBS for 1996.
52

3. INTERNATIONAL RELATIONS AND FOREIGN LOANS
The foreign activities of the National Bank of Slovakia in 1995 were based on thegeneral conception of Slovakia's foreign policy and were determined by the Bank'slong-term monetary-policy objectives, as well as its specific tasks for the year.
One of the Bank's priorities in the area of foreign relations was the furtherimprovement of cooperation with major international economic groupings such as theOrganisation for Economic Cooperation and Development (OECD) and the EuropeanUnion (EU). The banking sector gradually fulfilled the requirements for Slovakia'sintegration into the European Union and OECD in accordance with the country'sambition to gain full membership of these organisations. On 1 February 1995, theAssociation Agreement between the European Union and the Slovak Republic cameinto effect.
To achieve the goals in the area of foreign credit and capital relations in 1995, theBank continued to expand its international activities, which were based on thefulfilment of commitments arising from Slovakia's membership in leading internationalinstitutions such as the International Monetary Fund (IMF), the World Bank (WB), theBank for International Settlements (BIS), the European Investment Bank (EIB), theEuropean Bank for Reconstruction and Development (EBRD), the International Bankfor Reconstruction and Development (IBRD), and the International Investment Bank(IIB).
An important part of the Bank's foreign activities in 1995 was the furtherdevelopment of bilateral relations, especially the expansion of cooperation with thecentral banks of neighbouring countries and those of the European Union.
3.1 Foreign Credit and Capital Relations
The International Monetary Fund
In July 1994, the IMF Board of Directors approved, upon agreement with theSlovak Government, a Stand-by loan for the Slovak Republic in the amount of US$183.41 million. Of this loan, only two tranches were drawn in the 2nd half of 1994 inthe total amount of US$ 46.78 million. After talks with IMF representatives, theGovernment of the SR issued a new memorandum on economic policy in January1995. In this connection, the Government decided that further tranches would not bedrawn from this Stand-by loan in 1995. Due to the favourable development ofmacroeconomic indicators, especially the growth in foreign exchange reserves in1995, the Government of the SR did not apply to IMF for the drawing of the remainingpart of the Stand-by loan in 1995.
According to the agreement with the International Monetary Fund, the SlovakRepublic may draw the remainder of the Stand-by loan in the amount of US$ 136.63million by the middle of March 1996.
In meeting the financial obligations of the Slovak Republic, the National Bank ofSlovakia ensured the repayment of principal on loans received from the InternationalMonetary Fund according to the schedule of repayments and the payment of intereston the outstanding amount of these loans. In 1995, the NBS repaid US$ 200.87million in principal, and US$ 32.21 million in interest.
On 1 September 1995, the IMF Board of Directors discussed the conclusionsdrawn from consultations with the Slovak Republic according to Article IV of the IMFAgreement, which are held once a year with each member country. The economic
53

results of the Slovak Republic, due partly to the monetary policy of the NBS, wereevaluated by the International Monetary Fund as very positive.
With effect from 1 October 1995, the Slovak Republic accepted the provisions ofArticle 8 of the IMF Agreement, in which the Government undertook to make theSlovak crown convertible for payments and financial transactions on the currentaccount of the balance of payments.
The World Bank
The last loan made to the Slovak Republic by the World Bank was a US$ 80million Economic Recovery Loan (ERL) in 1994. The remaining part of this loanamounting to US$ 0.5 million was drawn in January 1995. The borrowed funds wereincorporated into the foreign exchange reserves of the NBS, and the equivalentamount in Slovak crowns was transferred to the account of State financial assets.
In meeting the financial obligations of the Slovak Republic, the National Bank ofSlovakia paid US$ 16.67 million in interest on World Bank loans. The repayment ofprincipal of World Bank loans will start in 1997.
In 1995, representatives of the Slovak Government, the NBS, and the ministriesconcerned continued to negotiate with World Bank officials for an Enterprise andFinancial Sector Adjustment Loan (EFSAL) for the restructuring of the country'senterprise and banking sector.
The EXIM Bank of JapanTwo Step Loan
In 1995, the National Bank of Slovakia continued to draw funds under the TwoStep Loan which was granted to Slovakia by the EXIM Bank of Japan in 1994 in thetotal amount of JPY 4,290 million. The loan was earmarked for the support of smalland medium-sized private businesses and joint ventures. After the loan agreementhad been signed, the first tranche of the loan amounting to JPY 2,145 million wasreleased in March 1994. The funds received were incorporated into the foreignexchange reserves of the NBS. The second tranche of the loan was released on 15February 1995 in the amount of JPY 1,072.5 million. The third and last tranche of theloan was transferred to the account of the NBS on 16 May 1995 in the amount of JPY1,072.5 million.
The NBS was in the position of debtor vis-a-vis the Japanese side; the selectedcommercial banks played the role of mediators and debtors vis-a-vis tne NBS. TheEXIM Bank of Japan selected the following mediators for the Two Step Loan:Všeobecná úverová banka (VÚB), Československá obchodná banka, foreign branchin Slovakia (ČOB), Slovenská poľnohospodárska banka (SPB), and Tatra banka(TB).
By 31 December 1995, the NBS had released a total of Sk 1,347 million for theabove commercial banks (which in JPY represents 99.41% of the loan). By the end of1995, a total of 172 projects had been financed from these funds.
Economic Recovery Loan
Preparations for the next loan from the EXIM Bank of Japan in the form of jointfinancing of a World Bank Economic Recovery Loan began on the basis of Slovakia'sapplication for financial assistance from the EU/G-24 countries in the amount ofroughly US$ 300 million. At the meeting of the G-24 in July 1994, the Japanese
54

government undertook to extend a loan to the Slovak Republic through the EXIMBank of Japan.
On 28 February 1995, the Government of the SR gave its consent to theconclusion of the loan agreement (Decision No. 115). The agreement between theEXIM Bank of Japan and the Ministry of Finance of the SR was signed on 7 March1995. The EXIM Bank of Japan released the loan in Japanese yen equivalent to US$60 million.
On 8 May 1995, the EXIM Bank of Japan transferred the whole amount of theloan to the account of the NBS. The funds received were used to strengthen theBank's foreign exchange reserves; the equivalent amount in Slovak crowns wastransferred to the account of the Ministry of Finance of the SR.
The European Investment Bank
Apex Global Loan
In 1995, the National Bank of Slovakia continued to draw funds under the ApexGlobal Loan (AGL) Agreement signed with the European Investment Bank in 1993 forECU 28 million. The loan was earmarked for the support of projects in the field ofenvironmental protection, tourism, and energy efficiency improvement. The costs ofsuch projects may be financed from EIB funds up to 50%.
The European Investment Bank selected two commercial banks to channel thefunds: Všeobecná úverová banka (VÚB) and Tatra banka.
By the end of 1995, a total of five projects had been submitted to and approvedby EIB; four of which were granted full financial assistance, one project receivedpartial financial coverage. The total amount approved for funding was ECU 22.05million, i.e. roughly 80% of the volume of AGL. By 31 December 1995, the NBS haddrawn 7 tranches of the loan (of which, 5 were drawn in 1995) at the request ofcommercial banks.
With regard to the smooth realisation of the first loan and the large volume ofapproved funds, the European Investment Bank offered the NBS another loan of thesame type. The new loan agreement (Apex Global Loan II) for ECU 50 million wassigned in Luxembourg on 18 July 1995.
In addition to the larger volume, AGL II provides more flexible conditions andextended drawing rights.
The AGL and AGL II loans provided Slovak entrepreneurs with the possibility ofdrawing relatively inexpensive long-term funds, which are still in short supply in theSlovak financial market.
The European Bank for Reconstruction and Development
Slovakia's subscribed capital in EBRD represents 4,267 shares with a nominalvalue of ECU 10,000 per share. In 1995, the payment of capital deposit, i.e. ECU12.8 million, continued with five annual instalments amounting to ECU 2.56 million,i.e. US$ 2,987,779.
By the end of 1995, EBRD had financed a total of 13 investment projects in theSlovak Republic (of which, six projects in 1995) in the total amount of ECU 367.7million. Projects were approved in the amount of ECU 321.7 million. Ninetransactions were funded directly, and four projects were financed throughinvestment funds, credit lines, and so-called multi-project techniques. Most of the
55
funds (84%) were invested in the private sector, only three transactions were backedby government guarantee.
Bank for International Settlements
In 1993, at the request of the NBS and the CNB, the Bank for InternationalSettlements (BIS) cancelled the originally Czechoslovak issue of 8,000 shares andreplaced it with Slovak and Czech issues. According to the resolution of theExtraordinary General Meeting of BIS in 1993, the NBS acquired 2,670 shares, with anominal value of 2.500 gold francs each, and membership in BIS. The NBS has a0.56% share in the subscribed capital of BIS. However, the importance of NBSmembership in this renowned and experienced international financial institution(founded in 1930) by far outweighs the actual size of NBS share. The abovementioned capital participation grants the NBS the right to vote (corresponding to theweight of its shares) and the right of representation at annual general meetings.
On the basis of its capital participation, the NBS received dividends worth CHF667,500 for the fiscal year 1994/95 (ending 31 March 1995). The equivalent amountin Slovak crowns represented Sk 16,921,800.
Payments Between the SR and the CR
Mutual payments and settlement between the SR and the CR continuedaccording to the Clearing Account Agreement, which came into effect on 4 February1993. The Clearing Account Agreement between the SR and the CR was terminatedby the Czech side with effect from 1 October 1995. Subsequently, the two centralbanks agreed to include the other country's currency in their daily lists of exchangerates.
After the termination of the Clearing Account Agreement, it was necessary tosettle the clearing account balance up to the amount of the credit limit, i.e. ECU 130million, which the Czech side owed to the NBS.
On 14 December 1995, an agreement was signed between the governments ofthe SR and the CR on settlement of the clearing account balance and the balance ofreceivables and payables of businesses in the two republics after the termination ofthe Clearing Account Agreement of 4 February 1993. According to this agreement,three-quarters of the credit limit was to be settled in freely convertible currency (thepayment was made by the CR on 19 December 1995), and one-quarter throughsupply of Czech made products. On the basis of this inter-state agreement, the twosides started to make preparations for the signing of an agreement between the NBSand ČSOB, a.s. on the technical and financial conditions for the discharge of theCzech Republic's obligations to the Slovak Republic arising from the termination ofthe Clearing Account Agreement, and an agreement on financial transactionsbetween the Ministry of Finance of the SR and the NBS in account No. 8010-026564903/0300 at ČSOB, a.s. Prague. According to the specified technicalagreements, one-quarter of the credit limit will be discharged through the delivery ofgoods.
Czechoslovak Commercial Bank (ČSOB)
In 1995, ČSOB (Československá obchodná banka, a.s. ) continued to play asignificant role in Slovakia's cross-border payments within the framework ofinternational trade. The capital participation of the NBS in ČSOB, a.s. amounted to Kč1,232 million (Sk 1,441 million). The NBS held a total of 1,978 shares, representing a24.13% stake in the equity capital of ČSOB. A further 847 shares were owned by
56

other Slovak shareholders. At 31 December 1995, Slovakia's total share of ČSOBequity amounted to 25.79%.
In July 1995, the National Bank of Slovakia received dividends from ČSOB for1994 in the total amount of Kč 104,694,500. In 1995, the NBS was represented onthe Supervisory Board of ČSOB.
The International Investment Bank and the InternationalBank for Economic Cooperation
The NBS conducted activities arising from Slovakia's membership in theInternational Investment Bank (IIB) and the International Bank for EconomicCooperation (IBEC), and pushed for measures designed to improve the difficultfinancial situation of banks due to the non-payment of loans by some member states.
The Slovak Republic has a 6% share in the equity capital of IBEC, with paid-upcapital amounting to ECU 8.6 million. The share of the SR in the equity capital of MBis 4.83%, with paid-up capital amounting to ECU 10.4 million. In 1995, the SlovakRepublic received dividends from MB for 1994 in the amount of US$ 313,916.25.IBEC paid no dividends in 1995.
At its autumn session in Krakow, the Board of MB decided to create the post offourth vice-chairman of the General Meeting of MB. The new post was to be held by arepresentative of the SR from 1 January 1996. In 1995, the Slovak Republic wasrepresented in IBEC by a member of the General Meeting.
Agreements on Taking Over the Financial Obligationsof the Former CSFRAB Svensk Exportkredit (Sweden)
On 18 January 1995, NBS Governor V. Masár signed an agreement with ABSvensk Exportkredit, representing the Swedish government, on taking over the loanextended to the government of the former CSFR by Sweden in 1991 for the supportof the country's balance of payments. Within the division of the federal property, theSlovak Republic inherited financial obligations in the amount of US$ 8.3 million; theNBS acting as the Government's representative.
The European Union
On 13 April 1995, NBS Governor V. Masár signed an agreement between theEuropean Economic Community (EEC) and the SR on taking over loans extended tothe government of the former CSFR by the European Community (represented by theEuropean Commission) in 1991 an 1992, for the support of the country's balance ofpayments. Within the division of federal property, the Slovak Republic inheritedfinancial obligations in the amount of ECU 125 million; the NBS acting as theGovernment's representative.
Finnish Export Credit (Finland)
On 2 November 1995, NBS Governor V. Masár signed an agreement concludedbetween Finnish Export Credit Ltd (creditor), the Slovak Republic (debtor), and theNational Bank of Slovakia (debtor's agent) on the taking over of loans granted to theformer CSFR in 1991 and 1992, for the support of the country's balance of payments.As successor to the former CSFR, the Slovak Republic took over financial obligationsin the amount of US$ 5 million.
57

3.2 Foreign Relations of the NBS with Respect to Slovakia'sIntegration into the European Union
The European Union
With the Europe Agreement Establishing an Association between the EuropeanCommunities and their Member States, of the one part, and the Slovak Republic onthe other part (Europe Agreement) coming into effect on 1 February 1995, Slovakiagained a qualitatively new position in relation to the European Union.
The implementation of the Europe Agreement in the field of banking in line withthe time schedule, i.e. during a temporary period of roughly 10 years, forms the basisfor the creation of a legal and economic environment compatible with that of theEuropean Union.
During 1995, in accordance with Article 104 of the Europe Agreement, a supremejoint authority was constituted for the implementation of the Agreement - theAssociation Board. Under Article 108 of the Agreement, an Association Committeewas established to facilitate the implementation of measures recommended by theAssociation Board. By Decree No. 10 of 3 January 1995, the Slovak Governmentestablished a government committee to coordinate the integration of the SR into theEuropean Union. The NBS had a representative on the Government's committee forSlovakia's integration into the EU.
The material aspects of creating a legal environment in Slovakia compatible withthat of the EU are specified in the 'White Book - Preparation of Associated Countriesof Central and Eastern Europe for Integration into the Internal Market of the EU',which was prepared and approved, after consultations with the individual associatedcountries, by the European Commission on 3-10 may 1995. After approval at themeeting of the European Committee in Cannes in June 1995, the White Bookbecame the official document of assistance to the associated countries in theirintegration into the EU.
In the appendix, the White Book presents 23 official regulations governing theinternal market of the EU. The National Bank of Slovakia is directly involved in theregulations governing the free flow of capital (Chapter 1) and the internal market offinancial services (Chapter 13). The individual chapters of the White Book are beinganalysed by groups of experts specially appointed for this purpose. The NBS isrepresented in the following groups: Free Flow of Capital, Financial Services,Protection of Personal Data, Accountancy, and Customs Union.
To support the implementation of the directives laid down in the White Book onbanking and public finance, and the articles of the Association Agreement, the EUestablished the PHARE Programme of technical assistance. The aim of technicalassistance under PHARE is to support the development of central banks and therestructuring and privatisation of commercial banks. The PHARE Programme isbased on Slovakia's ambition to join the EU in the near future, its prime task istherefore to ensure the implementation of the Europe Agreement as described in theWhite Book by 1999.
PHARE Programme
The Project Management Unit (PMU) of PHARE at the Foreign Department of theNBS was established to control and coordinate the implementation of programmesdesigned to strengthen the position of the central bank, and to ensure long-termstability of the banking sector.
58

Since 1995, funds within the PHARE Programme have been applied directly byPMU PHARE in the form of financial aid. Upon approval by the EuropeanCommission, the PMU keeps the funds allocated within the framework of individualwork programmes (WP) in the nostro account of the NBS at the Bank Generate inBrussels. In this way, the allocated funds benefit the foreign exchange reserves ofthe NBS.
In 1995, technical assistance to the NBS and Slovak commercial banks underPHARE was requested simultaneously by financial resolutions, especially thefinancial resolution of 1993 and the remaining funds of GTAF 2, which were allocatedto the PMU before 1995 and which were subject to special requirements.
Within the framework of the WPI 9302 and WPII 9302 working programmes, atotal of ECU 1,444,461 was provided, i.e. roughly 73% of the total volume of funds tobe granted before the end of the three-year term of validity of the 1993 financialresolution. Of the remaining funds of GTAF 2, ECU 87,775 was granted for theFOREX training programme.
In December 1995, within the framework of the Indicative Programme and theCountry Operational Programme 1995, a total of ECU 1.8 million was allocated forthe banking sector. These funds may be drawn by 31 July 1998.
The most significant PHARE activity in 1995 was the implementation of a projectfor the Investment and Development Bank, a.s. A Consortium of AIB InternationalConsultants of Ireland in close cooperation with Gartside Miller Associates of GreatBritain, and Grupo Espirito Santo of Portugal, worked on the project designed tostrengthen the strategy and activity of this bank with the aim of ensuring its primaryposition among Slovak investment banks.
As one of the long-term priorities of the PHARE Programme is to ensure thestability of the Slovak banking sector, the Fund regularly allocates resources to theBanking Supervision Department of the NBS. In addition, the Bank has acquired aspecial advisor for long-term cooperation in the person of Mr Philippe Aquera,general inspector of the Bank of France, whose responsibilities are coordinated withthe requirements of the Monetary and Exchange Affairs Department of theInternational Monetary Fund.
Though the restructuring of the Slovak banking sector is still awaiting majordecisions, the PHARE programme has allocated considerable amounts for projectsof technical assistance, which will be available for the banks as soon as the methodof their restructuring has been approved. In May 1995, the Bank's ForeignDepartment obtained a special advisor to PMU PHARE in the person of Mr CharlesDe Smet, who has prepared and coordinated technical assistance projects for Slovakcommercial banks, and who has prepared a so-called twinning programme forVšeobecná úverová banka, a.s. (VÚB).
In the field of training, the PHARE Programme funded a large-scale project inconnection with the introduction of par-time banking study. In accordance with theresults of public tender, the implementation of the project will be coordinated byInstituto de Formacao Bancaria of Lisbon, a Portuguese-French-Austrian consortium.
Organisation for Economic Cooperation and Development
In accordance with the priorities of foreign activities, the Slovak Republic appliedfor full membership of the Organisation for Economic Cooperation and Development(OECD) in February 1994. In November 1995, the Economic Department of OECD
59

dispatched a mission to the SR with the aim of obtaining data for the preparation ofthe 'Economic Survey of the SR'. During the mission, the OECD representatives paida visit to the NBS to discuss the country's macroeconomic results, monetary-policyobjectives, and foreign exchange policy. With regard to Slovakia's integration intoOECD, a matter of key importance for NBS is the application of the liberalisationcodes of OECD in the field of capital flow and current invisible transactions. Withregard to the fact that the NBS had some objections to the chapters of the Code ofLiberalisation concerning capital flows and current invisible operations, negotiationswere held between the NBS and OECD, during which the Bank's representativesexplained the philosophy behind the new foreign exchange legislation, and theprinciple of non-discrimination and deregulation of the balance of payments currentaccount. In accordance with the requirements of OECD and the EU, the NBS madepreparations for the amendment to Banking Acts No. 21/1992 Zb. and 264/1992 Zb.The Foreign Department initiated the removal of reciprocity and the liberalisation ofthe foreign exchange regime in line with the requirements of OECD.
In 1995, the NBS held negotiations with the highest representatives of OECD andprovided information about the Slovak banking sector for the 'Economic Survey of theSR' and the 'Survey of the Financial and Banking Sector of the SR'. Duringpreparation of the planned liberalisation of foreign exchange operations and its timeschedule, the NBS coordinated the activities of OECD and the EU. In the course of1995, cooperation between representatives of OECD and NBS was very intense withregard to the important position of the NBS and the Ministry of Finance of the SR inthe evaluation and liberalisation of financial flow from the Slovak Republic to OECDcountries.
World Trade Organisation
On 1 January 1993, the Slovak Republic joined the General Agreement on Tariffsand Trade (GATT). In this way, Slovakia took over the rights and obligations of theformer CSFR to GATT member states, and commenced the application of customsduties based on the most-favoured-nation clause, in respect of all GATT membercountries.
As a full member of GATT, the Slovak Republic took part in the Uruguay round ofmultilateral trade negotiations, where the member countries of GATT verifiedSlovakia's List of Customs Concessions and the List of Initial Obligations in Tradeand Services, which is a key part of GATS (General Agreement on Trade inServices). In this way, the Slovak Republic acquired all rights to become one of thefounding members of the World Trade Organisation (WTO), which commencedoperations on 1 January 1995.
The establishment of WTO and Slovakia's membership in this organisationmeans that international trade will be conducted in accordance with the agreed ruleswhich guarantee that the member countries will pursue a non-discriminative andopen trade policy under the supervision of the other member states. The rules of thisorganisation will gradually remove trade policy instruments which create barriers inforeign trade relations.
In 1995, talks on the liberalisation of trade in financial services continued withinthe framework of WTO. The session of the WTO Committee for Financial Servicesand the bilateral talks with the US in May 1995 were attended by the representativeof the NBS. In July 1995, the Slovak Republic submitted a revised List ofConcessions in Trade in Services and in the field of financial services in accordancewith the new Foreign Exchange Bill and the amendment to the Banking Act.
60

In June 1995, the delegation of the SR (in which the NBS was represented byVice-Governor M. Jusko) took part in the negotiations on the extension of the validityof the 10% surcharge on imports at a meeting of the Committee for Balance ofPayments of WTO in Geneva. The Committee agreed with the application of theimport surcharge until not later than 30 June 1996.
The Secretariat of WTO included the Slovak Republic in the list of countriesrequired to submit a survey of their trade policies to other member countries forapproval. Two such surveys had been prepared. The first survey of trade policy wasprepared by the staff of the Secretariat of WTO based on data obtained during theirfirst visit to Slovakia in March 1995. The second survey submitted to WTO by theSlovak Government, was prepared by the staff of the Ministry of the Economy incooperation with other ministries. In December 1995, the two surveys of Slovakia'seconomic policy were discussed in the relevant committee of WTO. The course andresults of this presentation, which was attended by NBS representatives, confirmedthat the SR has received a favourable evaluation as far as its trading practices andlegislation are concerned.
Loans Received
At the end of December 1995, the structure of loans received by the NationalBank of Slovakia was as follows:
Source
EXIM Bank of Japan
European Investment
Bank
International MonetaryFund
Type of loan
Two Step Loan
Apex Global Loan
Compensatory and ContingencyFinancing Facility (CCFF)Stand-by Loan ISystemic Transformation Facility(STF)Stand-by Loan II
Year ofmaturity
2009
2008
1997
1999
2004
2004
Volume of loanin foreign currency
currency
JPY
USDDEMCHFFRF
SDR
SDR
SDR
SDR
amount(thousands)
4,290,000
10,5145,785
10,81316,600
36,247
110,446
128,700
32,150
in SKKamount
(thousands)
1,236,979
310,880119,439277,327100,164
1,593,197
4,854,555
5,656,880
1,413,121
Capital Participation
At the end of December 1995, the National Bank of Slovakia had interests in thefollowing financial institutions:
Shares and other variable dividend securitiesof which:Bank for International Settlements (BIS), Basle,Switzerland
Shares in other banks and institutionsof which:Czechoslovak Commercial Bank (ČSOB, a.s.),Prague, Czech Republic
Numberof shares
2,670
_
1,978
Book valuein foreign
currency
GF
_
CZK
currencyamount
(thousands)
6,675
_
1,231,700
in SKKamount
(thousands)
24,816
24,784
1,484,724
1,364,724
Sharein capital
(%)
0.56
24.13
61

4. FINANCIAL MARKET DEVELOPMENTS
4.1 Money Market
To cover the State budget deficit, the Ministry of Finance launched 33 issues ofTreasury bills in 1995, i.e. 27 less than in the previous year. In all cases, the sale ofTreasury bills was organised in the form of American-style auctions, whereby thevolume of issues was not announced in advance.
Review of Treasury-bill Issues in 1995
RegistrationNumber
502020015090210250604303516021045230210550203106509031075160310851008609523031105300311150604112513041135071291452004115527041165040511751105118518051195130732052505121508061225150612350911624522061255161112653011127514121285211212952112130526099315031093251010933
Dateof issue
5 January12 January12 January19 January26 January2 February9 February16 February16 February23 February
2 March9 March16 March16 March23 March30 March
6 April13 April20 April20 April27 April11 May18 May18 May25 May
19 October9 November16 November30 November7 December14 December21 December28 December
Dateof maturity
2 February9 February
6 April16 February23 February
2 March9 March16 March10 August23 March30 March
6 April13 April
7 December20 April27 April4 May11 May18 May13 July25 May8 June15 June
9 November22 June
16 November30 November14 December21 December21 December
26 Sep. 963 October 9610 October 96
Timeto maturity
2828842828282828
17528282828
266282828282884282828
175282821282114
287287287
Volumeof T-bills sold
(pcs)
2,5610
528880
00
1,1552,200
8800
1,157610
1,3202,850
83600000
1001,375
4842,9702,0451,9992,4992,5002,0005,0004,0007,8303,000
of which:to NBS
2000
4880
00
105200
00
1050
1200
76000000
12544
0180200200250200500
000
Averageinterest(% p.a.)
5,901-
7,7654,932
--
2,4462,6916,450
-2,5512,2132,2067,6391,951
-----
3,1693,9154,5075,9894,0813,9006,0186,8756,8356,8457,5797,3547,462
The Ministry of Finance of the SR sold Treasury-bill issues with the followingmaturities:
28 days, or up to 28 days: 25 issues84 days: 2 issues
175 days: 2 issues266 days: 1 issues287 days: 3 issues
The volume of Treasury bills issued in 1995 totalled Sk 50.8 billion, falling behindthe previous year's figure by Sk 78.2 billion. This development was due to thebalance of the State budget, which ranged from a surplus of Sk 2.9 billion to a deficitof Sk 10.2 billion. The average volume of Treasury bills sold was roughly Sk 1.5billion per auction, i.e. Sk 0.7 billion less than in the previous year. At 9 auctions, theMinistry of Finance did not accept a single bid. At the remaining 24 auctions, thevolume of accepted bids ranged from Sk 0.1 billion to Sk 7.8 billion at par values.
62
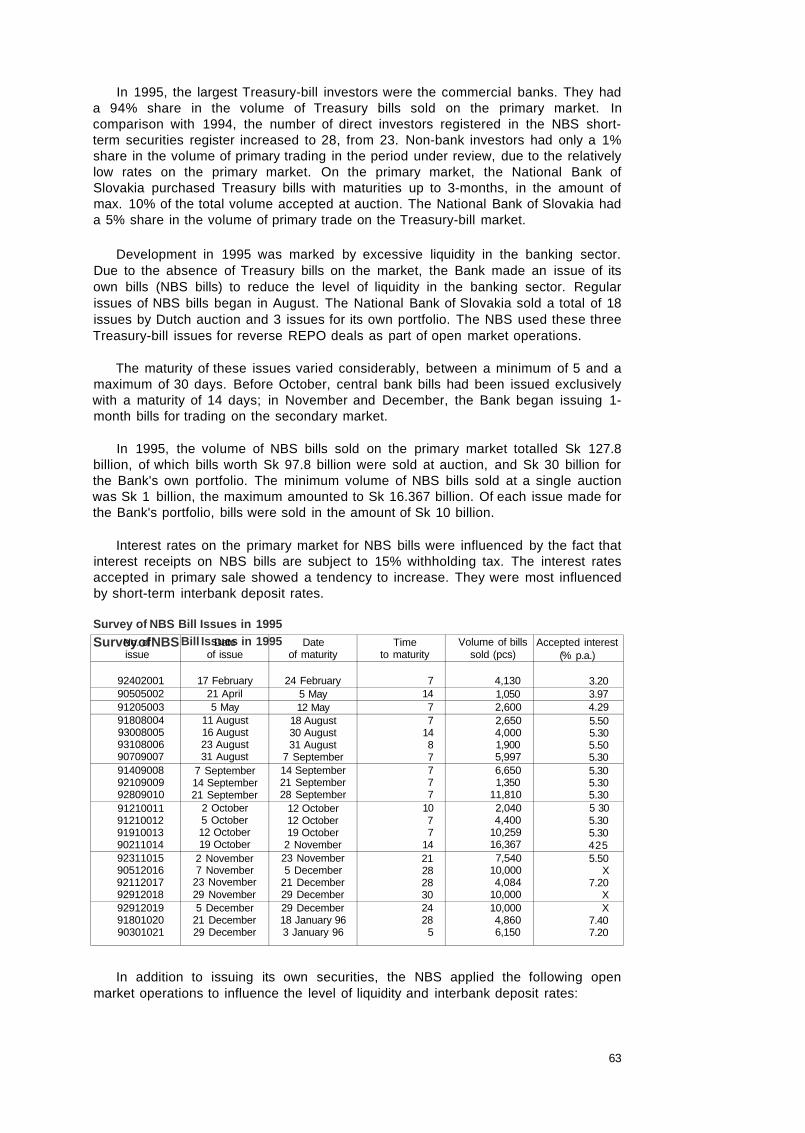
In 1995, the largest Treasury-bill investors were the commercial banks. They hada 94% share in the volume of Treasury bills sold on the primary market. Incomparison with 1994, the number of direct investors registered in the NBS short-term securities register increased to 28, from 23. Non-bank investors had only a 1%share in the volume of primary trading in the period under review, due to the relativelylow rates on the primary market. On the primary market, the National Bank ofSlovakia purchased Treasury bills with maturities up to 3-months, in the amount ofmax. 10% of the total volume accepted at auction. The National Bank of Slovakia hada 5% share in the volume of primary trade on the Treasury-bill market.
Development in 1995 was marked by excessive liquidity in the banking sector.Due to the absence of Treasury bills on the market, the Bank made an issue of itsown bills (NBS bills) to reduce the level of liquidity in the banking sector. Regularissues of NBS bills began in August. The National Bank of Slovakia sold a total of 18issues by Dutch auction and 3 issues for its own portfolio. The NBS used these threeTreasury-bill issues for reverse REPO deals as part of open market operations.
The maturity of these issues varied considerably, between a minimum of 5 and amaximum of 30 days. Before October, central bank bills had been issued exclusivelywith a maturity of 14 days; in November and December, the Bank began issuing 1-month bills for trading on the secondary market.
In 1995, the volume of NBS bills sold on the primary market totalled Sk 127.8billion, of which bills worth Sk 97.8 billion were sold at auction, and Sk 30 billion forthe Bank's own portfolio. The minimum volume of NBS bills sold at a single auctionwas Sk 1 billion, the maximum amounted to Sk 16.367 billion. Of each issue made forthe Bank's portfolio, bills were sold in the amount of Sk 10 billion.
Interest rates on the primary market for NBS bills were influenced by the fact thatinterest receipts on NBS bills are subject to 15% withholding tax. The interest ratesaccepted in primary sale showed a tendency to increase. They were most influencedby short-term interbank deposit rates.
Survey of NBSNo. ofissue
924020019050500291205003918080049300800593108006907090079140900892109009928090109121001191210012919100139021101492311015905120169211201792912018929120199180102090301021
Bill Issues in 1995Dateof issue
17 February21 April5 May
11 August16 August23 August31 August
7 September14 September21 September
2 October5 October12 October19 October
2 November7 November
23 November29 November5 December
21 December29 December
Dateof maturity
24 February5 May12 May
18 August30 August31 August
7 September14 September21 September28 September
12 October12 October19 October
2 November23 November5 December
21 December29 December29 December18 January 963 January 96
Timeto maturity
71477
1487777
1077
14212828302428
5
Volume of billssold (pcs)
4,1301,0502,6002,6504,0001,9005,9976,6501,350
11,8102,0404,400
10,25916,3677,540
10,0004,084
10,00010,0004,8606,150
Accepted interest(% p.a.)
3.203.974.295.505.305.505.305.305.305.305 305.305.304255.50
X7.20
XX
7.407.20
In addition to issuing its own securities, the NBS applied the following openmarket operations to influence the level of liquidity and interbank deposit rates:
63
Survey of NBS Bill Issues in 1995
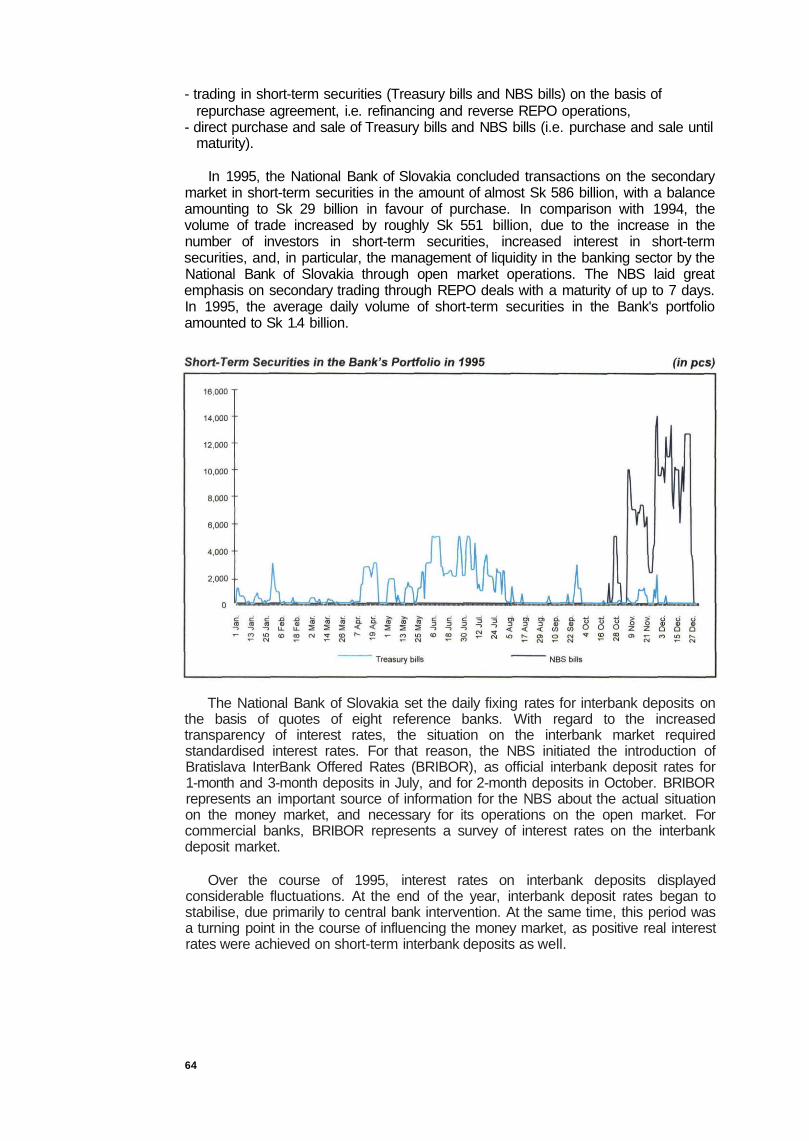
- trading in short-term securities (Treasury bills and NBS bills) on the basis ofrepurchase agreement, i.e. refinancing and reverse REPO operations,
- direct purchase and sale of Treasury bills and NBS bills (i.e. purchase and sale untilmaturity).
In 1995, the National Bank of Slovakia concluded transactions on the secondarymarket in short-term securities in the amount of almost Sk 586 billion, with a balanceamounting to Sk 29 billion in favour of purchase. In comparison with 1994, thevolume of trade increased by roughly Sk 551 billion, due to the increase in thenumber of investors in short-term securities, increased interest in short-termsecurities, and, in particular, the management of liquidity in the banking sector by theNational Bank of Slovakia through open market operations. The NBS laid greatemphasis on secondary trading through REPO deals with a maturity of up to 7 days.In 1995, the average daily volume of short-term securities in the Bank's portfolioamounted to Sk 1.4 billion.
The National Bank of Slovakia set the daily fixing rates for interbank deposits onthe basis of quotes of eight reference banks. With regard to the increasedtransparency of interest rates, the situation on the interbank market requiredstandardised interest rates. For that reason, the NBS initiated the introduction ofBratislava InterBank Offered Rates (BRIBOR), as official interbank deposit rates for1-month and 3-month deposits in July, and for 2-month deposits in October. BRIBORrepresents an important source of information for the NBS about the actual situationon the money market, and necessary for its operations on the open market. Forcommercial banks, BRIBOR represents a survey of interest rates on the interbankdeposit market.
Over the course of 1995, interest rates on interbank deposits displayedconsiderable fluctuations. At the end of the year, interbank deposit rates began tostabilise, due primarily to central bank intervention. At the same time, this period wasa turning point in the course of influencing the money market, as positive real interestrates were achieved on short-term interbank deposits as well.
64

The National Bank of Slovakia conducted operations on the open market in theform of REPO deals, direct trading, and issues of own bills, to influence the level ofliquidity in the banking sector, and the development of interbank deposit rates.
4.2 Capital Market
Under Act No. 184/1994 Z.z. on Slovak government bonds and Act No. 141/1995Z.z. on the issue government bonds to cover the 1994 State budget deficit, a total often government bond issues were launched in 1995 (issues 010 to 019) in the totalamount of Sk 38,166 million. The issues were sold by American-style auction withunlimited issue-amount.
No, ofissue
010011012013014015016017018019
Total
Date ofissue
28.2.199516.5.199515.6.199527.6.199518.7.199531.8.199514.9.199528.9.1995
12.10.199523.10.1995
Maturityin years
4532234534
Par valuein Sk
10,00010,00020,00010,00010,00010,00020,00020,00050,00050,000
Yieldin %
11.0010.9010.5010.009.509.50
10.009.809.009.50
Yieldpayment
semi-annuallysemi-annuallysemi-annuallysemi-annuallysemi-annuallysemi-annuallysemi-annuallysemi-annuallysemi-annuallysemi-annually
Demand in Sk thousandstotal
4,630,0007,230,0007,460,0005,560,0003,000,0006,430,0005,760,0008,620,0006,060,0007,340,000
62,090,000
accepted
2,310,0006,040,000
620,0004,460,0001,670,0004,860,0004,260,0006,640,0004,000,0003,305,500
38,165,500
Yield until maturity in %min.
108410.0010.509.999.509.50
10.009.808.899.40
average
11.2610.9710.5010.17101610.1310 1810.009.599.48
max
11 4911.1010.50102810.2010.2510.2010.0810.129.50
The government bond auctions held in 1995 were attended by 21 commercialbanks, which purchased bonds at a book value of Sk 37,387 million. Non-bankentities purchased government bonds in the amount of Sk 500 million, representing1.3% of the total volume of bonds sold at auction.
At the end of 1995, the volume of government bond issues (No. 001 to 019)totalled Sk 55,096 million, and the volume of existing bond issues reached Sk 54,096million. The difference was caused by the redemption of the 007 issue in the amountof Sk 1,000 million in February.
65
Issues of Government Bonds in 1995

The positive consequences of government bond issues in 1995 were thefollowing:- through issues of bonds in the period under review, the government fully repaid the
direct credit it had received from the National Bank of Slovakia for covering the1993 State budget deficit amounting to Sk 15,100 million;
- the bond issues fully covered the 1994 State budget deficit in the amount of Sk22,854 million;
- the issues reduced excessive liquidity in the banking sector in the total amount ofSk 37,387 million;
- the yield curve of government bonds issues sold on the primary market wasaugmented and reduced, providing a useful indicator for potential issuers of fixed-interest securities;
- the spread of yields on the total demand gradually decreased at auctions, the yieldspread fell from 7.77% (Issue No. 011) to 1.88% (Issue No. 019);
- the total amount of government bonds issued increased from Sk 16,930 million toSk 54,096 million, representing an increase of 219.5%, compared with the figure for31 December 1994.
In 1995, the volume of publicly negotiable non-government bonds issues(corporate and municipal bonds) gradually increased, while the most significantincrease was recorded in the second half of the year. The total volume of bondsissued reached Sk 10,940 million, representing an increase of 726.3% compared withthe figure for 1994.
A positive development in the issue of non-government bonds was, in addition tothe growth in volume, the increase in maturity and decrease in yield, due to thereduction of inflation and the issue of government bonds. The average yield fell to14.75% in 1995, from 19.03% in 1994.
Certificates of deposit were issued by commercial banks in the total amount of Sk4,710 million, representing an increase of 119.1% compared with the 1994 figure(issuers: ČSOB, VÚB, Slovenská sporiteľňa, Poľnobanka, IRB, Poštová banka, Prvákomunálna banka, and Istrobanka).
66

Over the course of 1995, eleven issues of government bonds (No. 009 to 019)were traded on the Bratislava Stock Exchange (BCPB). With completion of trading inthe 007 issue in February, a total of 15 issues of government bonds had been tradedon the market in the amount of Sk 49,286 million by the end of December 1995.
Trading in bonds on BCPB was affected by the high level of liquidity in thebanking sector, falling interest rates on the interbank market, and the issue ofgovernment bonds on the primary market.
In January and February 1995, the market was characterised by continuingabsence of offers for sale. This development was due mainly to the reduction ininterest rates on fixed-interest securities and the resulting lack of interest in sellingassets, which paid high yields compared with the potential return on investment.Trading in February was influenced by a new issue of government bonds (Issue No.010) with a maturity of 4 years, designed to confirm the trend in interest rates onfixed-interest securities with medium-term maturity.
In March and April, BCPB saw the largest trading volumes since the beginning oftrading in government bonds. This development was due mainly to the high level ofliquidity in the banking sector, the issuer's reluctance to accept bids for the 010 issue(Sk 2,320 million), and the generally high demand for bonds issued by non-bankentities. The subsequent three months witnessed a sharp decline in trading due tothe increased interest of investors in the primary market for government bonds.Between August and October, the monthly volumes of transactions in governmentbonds significantly increased. This growth was due mainly to the amendment to theSecurities Act, which allowed trading in securities solely on the public market. Thelast two months of the year were marked by a sharp decline in trading, for more orless the same reasons as during the first months of the year. The only exceptionswere four direct transactions in the 011 issue totalling Sk 4,884 million in December,which should only be regarded as an increase in the market valuation of the portfoliosheld by the owners of this issue.
With regard to the Bank's activity on the bond market, the last day of October1995 was an important event: the NBS started trading on the Bratislava StockExchange. The total volume of transactions reached Sk 2,303 million at the end ofthe year. These transactions were conducted in accordance with the National Bank of
67

Slovakia Act No. 566/1992 Zb. passed by the National Council of the SR, with theaim of providing refinancing funds for commercial banks.
A positive aspect of trading in government bonds was the fact that the yield curveof government bond issues on the secondary market gradually stabilised. Anotherpositive development was that government bonds continued to have a decisive sharein the volume of trading on BCPB. In 1995, transactions in government bondsaccounted for 92.4% of the volume of trade in listed bonds (compared with 75% in1994). Government bonds accounted for 72.7% (71.5% in 1994) of the total volumeof bond transactions, and 27.8% (9.7% in 1994) of the total volume of trade on theBratislava Stock Exchange.
In a breakdown of government bond holders, the share of commercial banksincreased in 1995 to 95.6%, from 89% (at 31 December 1994), due mainly to theirhigh proportion of purchases on the primary market. In proportion to this increase, theshare of corporate investors fell to zero, from 1.2%. The share of individual investorsremained virtually unchanged.
Structure of Bondholders at 31 December
Issue No.
001002004005006008009010011012013014015016017018019
Totalin%
Commercialbanks
4,200,000600,000876,505
71,270987,270
4,239,4403,448,0002,122,0305,933,800
270,0004,440,0001,660,3104,822,5504,260,0006,540,8403,932,0003,304,500
51,708,51595.59 %
Corporateinvestors
00
1,067,770735
118,470217,500
52,000147,970104,200350,000
20,0009,690
37,4500
99,16068,000
1,0002,293,945
4.24 %
1995Individualinvestors
00
5,7253,995
18,2603,060
20,00040,000
2,00000000000
93,0400.17%
Foreigninvestors
000000000000000000
0.00 %
(Sk thousands)
NBS
000000000000000000
0.00 %
Total
4,200,000600,000
1,950,00076,000
1,124,0004,460,0003,520,0002,310,0006,040,000
620,0004,460,0001,670,0004,860,0004,260,0006,640,0004,000,0003,305,500
54,095,500100.00%
4.3 Foreign Exchange Market
In 1995, the volume of transactions in NBS foreign exchange fixing reached US$4,553.7 million, representing an increase of 111.2% compared with the 1994 figure.With regard to the currency structure of transactions in foreign exchange fixing, mosttrading was concluded in DEM (54.7%), followed by US$ (45.3%), and otherEuropean currencies. The number of contracts in foreign exchange fixing increasedto 2,321, exceeding the previous year's figure more than twice (979 contracts). On adaily basis, an average of 10 transactions were concluded at an average volume ofUS$ 2 million per contract.
In 1995, the NBS purchased funds in foreign exchange fixing from commercialbanks in the total amount of US$ 959.3 million, i.e. 16% more than in the previousyear. In comparison with 1994, when the ratio of US dollars to D-marks purchased infixing transactions corresponded well to their ratio within the currency basket, thesituation in 1995 had changed considerably. The structure of funds purchased inforeign exchange fixing was as follows:-US$123.7 million (12.8%),-DEM 1,203.1 million (87.2%).
68
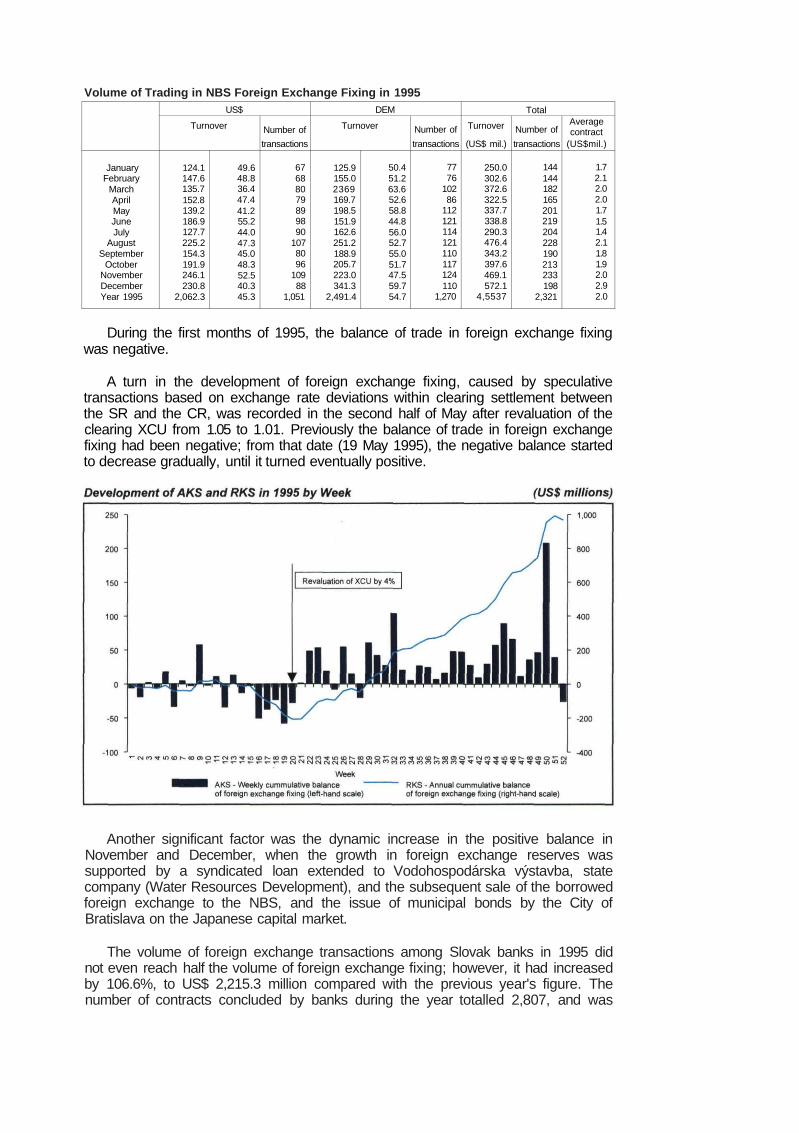
Volume of Trading in NBS Foreign Exchange Fixing in 1995
JanuaryFebruary
MarchAprilMayJuneJuly
AugustSeptember
OctoberNovemberDecemberYear 1995
US$
Turnover
124.1147.6135.7152.8139.2186.9127.7225.2154.3191.9246.1230.8
2,062.3
49.648.836.447.441.255.244.047.345.048.352.540.345.3
Number of
transactions
67688079899890
1078096
10988
1,051
DEM
Turnover
125.9155.02369169.7198.5151.9162.6251.2188.9205.7223.0341.3
2,491.4
50.451.263.652.658.844.856.052.755.051.747.559.754.7
Number of
transactions
7776
10286
112121114121110117124110
1,270
Total
Turnover
(US$ mil.)
250.0302.6372.6322.5337.7338.8290.3476.4343.2397.6469.1572.1
4,5537
Number of
transactions
144144182165201219204228190213233198
2,321
Averagecontract
(US$mil.)
1.72.12.02.01.71.51.42.11.81.92.02.92.0
During the first months of 1995, the balance of trade in foreign exchange fixingwas negative.
A turn in the development of foreign exchange fixing, caused by speculativetransactions based on exchange rate deviations within clearing settlement betweenthe SR and the CR, was recorded in the second half of May after revaluation of theclearing XCU from 1.05 to 1.01. Previously the balance of trade in foreign exchangefixing had been negative; from that date (19 May 1995), the negative balance startedto decrease gradually, until it turned eventually positive.
Another significant factor was the dynamic increase in the positive balance inNovember and December, when the growth in foreign exchange reserves wassupported by a syndicated loan extended to Vodohospodárska výstavba, statecompany (Water Resources Development), and the subsequent sale of the borrowedforeign exchange to the NBS, and the issue of municipal bonds by the City ofBratislava on the Japanese capital market.
The volume of foreign exchange transactions among Slovak banks in 1995 didnot even reach half the volume of foreign exchange fixing; however, it had increasedby 106.6%, to US$ 2,215.3 million compared with the previous year's figure. Thenumber of contracts concluded by banks during the year totalled 2,807, and was

comparable with the number of transactions in NBS foreign exchange fixing. Mosttrading was concluded in DEM (50.1%), followed by US$ (35.1%), and otherEuropean currencies (14.7%). On a daily basis, an average of 12 transactions wereconcluded at an average volume of US$ 0.8 million per contract.
70

C. Banking Sector

1. DEVELOPMENT OF THE BANKING SECTOR
At the end of December 1995, there were 24 domestic banks (resident legalentities), 9 branches of foreign banks, and 12 representative offices of foreign banksoperating in Slovakia.
In 1995, the National Bank of Slovakia issued 5 licences to operate as a bank fornew banking institutions - Bank Austria, a.s. Bratislava, Banka Slovakia, a.s. BanskáBystrica, Citibank (Slovakia), a.s. Bratislava, HYPO-BANK Slovakia, a.s. Bratislava,and Komerční banka Bratislava, a.s. Bratislava.
Most of the commercial banks operating in Slovakia are registered as joint stockcompanies (22 banks); only two are state-owned financial institutions. Most of thesebanks have their head offices in Bratislava (20), two are based in Banská Bystrica,and the remaining two are based in Žilina and Košice. Eight of the foreign bankshave their head offices in the Czech Republic, and one foreign bank has its headoffice in the Netherlands.
Of the total number of domestic commercial banks (24), twenty banks have beengranted a universal banking licence, and four are holders of a specialised bankinglicence for specific activities (building savings banks, guarantee and consolidationbanks).
Sixteen commercial banks are licenced to conduct foreign exchange activities.The other banks operating in the Slovak banking sector have a limited licence toconduct foreign exchange business according to the requirements and conditions fortrading in foreign exchange.
Note: Branch offices of foreign banks: permanent funds granted by foreign bank
By 31 December 1995, the volume of subscribed capital in the banking sectorincluding the initial capital provided to branches of foreign banks (excluding the NBS)had passed the level of Sk 25 billion. The share of foreign capital in the Slovakbanking sector represented 32.7%. Controlling foreign capital participation wasreported in 14 domestic commercial banks, which were all medium-sized banks withshare capital ranging from Sk 300 million to Sk 1 billion. Of the total volume of foreign
73

capital in the Slovak banking sector, the Czech Republic accounted for 48%, Austria for24%, Germany for 8%, and the US for 6%.
At the end of 1995, the number of staff in the banking sector of the SR totalled 22thousand, of whom 1,367 were employed by branches of foreign banks.
On 31 December 1995, there were 1,843 operating units registered in the Slovakbanking sector. Of which, 1,793 were banks and 50 were registered as branches offoreign banks.
74

2. PRUDENTIAL BANKING REGULATIONS
Evaluation of the prudential conduct of bank business in the SR is based on theanalysis of accounting documents and reports made by commercial banks on theirprudential behaviour in accordance with the NBS regulations governing capitaladequacy, credit risk exposure, liquidity ratio, and regulation of the monetary position.
Based on the current prudential regulations and with regard to the programme forrestructuring of commercial banks, the NBS approved a decree stipulatingregulations for the evaluation of the receivables and off-balance sheet liabilities ofbanks according to the risk incurred and the creation of resources to cover such risk(NBS Decree No.3 of 3 March 1995).
The above decree unified the classification of bank receivables and tightened thecriteria for the calculation of uncovered estimated loss on receivables, andsubstantially influenced the evaluation of the banking sector as a whole, especiallyindicators such as capital adequacy, credit risk exposure, and the monetary positionof banks.
2.1 Structure of Resources and Capital Adequacy
2.1.1 Structure of Resources
Over the course of 1995, the volume of resources in the banking sector of the SRincreased by Sk 3.47 billion (7%), to Sk 52 billion.
This growth was accompanied by structural changes in these resources, duemainly to the enactment of Decree No.3, which brought about an increase in thecreation of provisions and a decrease in general reserves.
For this reason, at the end of 1995, the volume of resources was dominated bysubscribed capital (38.8%). General reserves accounted for 32.7%, and reservefunds for 27.2% of the total volume of resources.
75

2.1.2 Capital Adequacy
The minimum ratio of capital adequacy, which had been set at 8% for 1995 (or7.25% for banks established before 1992), was achieved by all commercial bankswith the exception of one bank undergoing transformation and one state financialinstitution, the credit portfolios of which are to be restructured with the participation ofthe State.
A characteristic development in 1995 was the over 20% increase in the volume ofequity capital (to Sk 35 billion) as a result of the opening of new banks and increaseof capital in existing banks. Despite this development, the volume of additional capitalfell by 38.6%, to Sk 1.3 billion, in connection with the use of general reservesearmarked for risk coverage.
Capital applied for the calculation of capital adequacy reached Sk 24 billion at theend of 1995. The average capital adequacy ratio for banks operating in the SRexcluding branches of foreign banks was 7.9%.
2.2 Large Credit Exposure
2.2.1 Net Credit Exposure to Non-bank Customers
The limit for net credit risk exposure to a non-bank customer was set at 40% ofthe ratio of net credit exposure to an individual borrower or a group of economicallyconnected borrowers to the bank's capital adequacy reserve.
In the period under consideration, this limit was exceeded by eight banks;however, the number of borrowers who exceeded the limit was no larger than in theprevious year. A positive development was the shift of customers classified as highcredit risk exposure to a lower category.
2.2.2 Net Credit Exposure to Bank Customers
The net credit risk exposure to a banking institution may not exceed 80% of thecapital adequacy reserve.
76

In 1995, the number of banks exceeding the limit of credit risk exposure tobanking clients decreased to 7, from 12.
2.2.3 Aggregate Net Credit Risk Exposure
The aggregated amount of net credit exposures was defined as 800% of thecapital adequacy reserve. In this category of credit exposure, the limit was notexceeded by any of the banks during the period under consideration.
2.3 Liquidity
In 1995, commercial banks in Slovakia had no serious liquidity problems. Banksmaintained the required level of liquidity, fulfilled their required reserve requirements,without having to draw a stand-by loan from the National Bank of Slovakia.
2.3.1 Liquid Assets
At 31 December 1995, highly liquid assets accounted for 12.8% of the volume oftotal assets in the banking sector. The ratio of liquid assets to other assets was asfollows: 1.5% in cash assets, 4% in funds deposited in central bank accounts, 1.5%in interbank market for liquid assets, 4.2% in short-term securities, and 1.5% in othernegotiable securities.
The share of individual banks in the total volume of liquid assets variedconsiderably within the sector. This was due mainly to the different types of banks,i.e. their main activities, and the length of service. The trend of developmentindicated that the ratio of highly liquid assets to total assets decreased as a result ofan increase in the volume of total assets, especially in respect of interest accrued butunpaid.
2.3.2 Investment in Property
The total book value of funds invested in fixed assets and intangible assets,including the equity capital of banks, amounted to Sk 23 billion.
77

The ratio of this amount to the capital adequacy reserve reached a level of 96.2%,meeting the requirements laid down in the NBS Decree on capital adequacy. Thissituation reflects the increasing amount of investment in fixed property by banks(construction, reconstruction, purchase of equipment, etc.)
2.4 Monetary Positions
Reports on monetary positions made by banks at 31 December 1995 allow us tostate that the majority of banks kept within the limits for foreign exchange positions.In some cases, the limits for individual currencies, especially US$ and DEM, and theoverall monetary and crown positions, were exceeded for short periods.Subsequently, banks adopted measures to remedy these deficiencies within timelimits agreed with the banking supervision authority.
In connection with the liberalisation of the Foreign Exchange Act and thesubsequent transition to a standard method of payments and settlement between theSR and the CR, the Banking Supervision Division of the NBS modified the limit forthe individual overnight monetary position of the Czech crown, from 2% to 10% of thebank's capital as defined by the NBS Decree on capital adequacy.
78

D. Note Issuing Activity of the NBS
and Money Circulation

1. NEW SLOVAK CURRENCY DENOMINATIONS
In 1995, the National Bank of Slovakia issued new banknotes in thedenominations of Sk 5,000 and Sk 200, thus completing the series of Slovakbanknotes. The new notes showing the portraits of Milan Rastislav Štefánik (Sk5,000) and Anton Bernolák (Sk 200) are printed by Giesecke & Devrient of Munich,Germany. There are now seven denominations of notes in circulation. The remainingdenominations of Sk 20, Sk 50, and Sk 1,000 notes were printed by BA Banknote(Canada) and Thomas De La Rue (Great Britain), which now supply new notesaccording demand.
In line with the issue programme for the year, the National Bank of Slovakiaissued five silver coins to commemorate the anniversaries of memorable events inSlovak history and culture. The coins were minted by the State Mint at Kremnica,state company.
Nominalvalue
Sk 500
Sk 200
Sk 200
Sk 200
Sk 200
Event to becommemorated
Protection of nature -Slovenský Raj National Park
200th anniversary of thebirth of Pavol Jozef Šafárik
100th anniversary of thebirth of Mikuláš Galanda
European nature conservation year
100th anniversary of the firsttramway in Bratislava
Number of coins issued
29,900
26,500
26,500
30,000
27,600
2,400
1,500
1,500
2,000
1,600
NBSDecree No.
8/1995 Z.z.
88/1995 Z.z.
120/1995 Z.z.
168/1995 Z.z.
185/1995 Z.z.
1.1 Cash in Circulation
By issuing new note denominations, the National Bank of Slovakia improved thestructure of notes in circulation. The issue of Sk 5,000 and Sk 200 notes favourablyinfluenced the proportion of Sk 1,000, Sk 500, and Sk 100 banknotes in the totalvolume of notes in circulation. The demand for cash in circulation was fully satisfiedthroughout the SR without any problems or failures in money circulation.
Denomination
Banknotes in totalSk 5,000Sk 1,000
Sk 500Sk 200Sk 100
Sk 50Sk 20
Coin in circulationSk 10
Sk 5Sk 2Sk 1
Sk O.50Sk 0.20Sk O.10
Commemorativecoins
Total
Volume of currency (at 31.12.1995)Amount
(pcs)
85,425,707.01,594,063.3
22,377,742.39,799,897.82,968,088.5
22,961,314.08,950,622.5
16,773,978.8
436,039,948.043,010,910.031,688,589.043,949,165.063,838,610.047,134,910.097,178,811.0
109,238,953.0
345,839.0
521,811,494.0
Value(Sk)
38,920,767,175.07,970,316,250.0
22,377,742,250.04,899,948,875.0
593,617,700.02,296,131,400.0
447,531,125.0335,479,575.0
794,216,097.5430,109,100.0158,442,945.087,898,330.063,838,610.023,567,455.019,435,762.210,923,895.3
281,972,085.0
39,996,955,357.5
Percentage (%)Amount
(pcs)
100.001.87
26.2011.473.47
26.8810.8819.63
100.009.867.27
10.08. 14.64
10.8122.2925.05
100.00
100.00
Value(Sk)
100.0020.4857.5012.59
1.525.901.150.86
100.0054.1519.9511.078042.972.451.37
100.00
100.00
Growth index (%)Amount
(pcs)
107.11-
102.3386.09
-96.65
110.44114.57
131.01121.81107.40120.22117.08123.95144.65152.30
152.35
126.40
Value(Sk)
127.06-
102.3386.09
-96.65
110.44114.57
118.91121.81107.40120.2211708123.95144.65152.30
127.58
126.89
81
Commemorative Coins Issued by the NBS in 1995
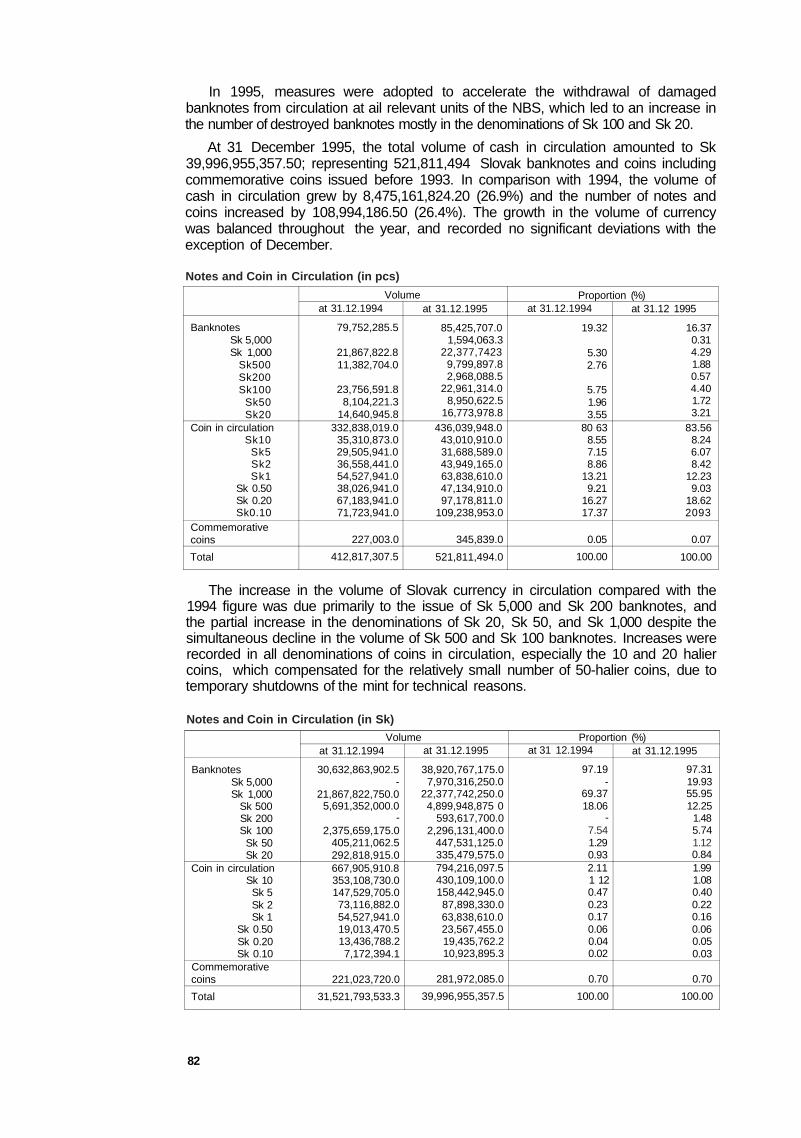
In 1995, measures were adopted to accelerate the withdrawal of damagedbanknotes from circulation at ail relevant units of the NBS, which led to an increase inthe number of destroyed banknotes mostly in the denominations of Sk 100 and Sk 20.
At 31 December 1995, the total volume of cash in circulation amounted to Sk39,996,955,357.50; representing 521,811,494 Slovak banknotes and coins includingcommemorative coins issued before 1993. In comparison with 1994, the volume ofcash in circulation grew by 8,475,161,824.20 (26.9%) and the number of notes andcoins increased by 108,994,186.50 (26.4%). The growth in the volume of currencywas balanced throughout the year, and recorded no significant deviations with theexception of December.
BanknotesSk 5,000Sk 1,000
Sk500Sk200Sk100
Sk50Sk20
Coin in circulationSk10
Sk5Sk2Sk1
Sk 0.50Sk 0.20Sk0.10
Commemorativecoins
Total
Volumeat 31.12.1994
79,752,285.5
21,867,822.811,382,704.0
23,756,591.88,104,221.3
14,640,945.8332,838,019.0
35,310,873.029,505,941.036,558,441.054,527,941.038,026,941.067,183,941.071,723,941.0
227,003.0
412,817,307.5
at 31.12.1995
85,425,707.01,594,063.3
22,377,74239,799,897.82,968,088.5
22,961,314.08,950,622.5
16,773,978.8436,039,948.0
43,010,910.031,688,589.043,949,165.063,838,610.047,134,910.097,178,811.0
109,238,953.0
345,839.0
521,811,494.0
Proportion (%)at 31.12.1994
19.32
5.302.76
5.751.963.55
80 638.557.158.86
13.219.21
16.2717.37
0.05
100.00
at 31.12 1995
16.370.314.291.880.574.401.723.21
83.568.246.078.42
12.239.03
18.622093
0.07
100.00
The increase in the volume of Slovak currency in circulation compared with the1994 figure was due primarily to the issue of Sk 5,000 and Sk 200 banknotes, andthe partial increase in the denominations of Sk 20, Sk 50, and Sk 1,000 despite thesimultaneous decline in the volume of Sk 500 and Sk 100 banknotes. Increases wererecorded in all denominations of coins in circulation, especially the 10 and 20 haliercoins, which compensated for the relatively small number of 50-halier coins, due totemporary shutdowns of the mint for technical reasons.
BanknotesSk 5,000Sk 1,000
Sk 500Sk 200Sk 100
Sk 50Sk 20
Coin in circulationSk 10Sk 5Sk 2Sk 1
Sk 0.50Sk 0.20Sk 0.10
Commemorativecoins
Total
Volumeat 31.12.1994
30,632,863,902.5-
21,867,822,750.05,691,352,000.0
-2,375,659,175.0
405,211,062.5292,818,915.0667,905,910.8353,108,730.0147,529,705.073,116,882.054,527,941.019,013,470.513,436,788.27,172,394.1
221,023,720.0
31,521,793,533.3
at 31.12.1995
38,920,767,175.07,970,316,250.0
22,377,742,250.04,899,948,875 0
593,617,700.02,296,131,400.0
447,531,125.0335,479,575.0794,216,097.5430,109,100.0158,442,945.087,898,330.063,838,610.023,567,455.019,435,762.210,923,895.3
281,972,085.0
39,996,955,357.5
Proportion (%)at 31 12.1994
97.19-
69.3718.06
-7.541.290.932.111 120.470.230.170.060.040.02
0.70
100.00
at 31.12.1995
97.3119.9355.9512.25
1.485.741.120.841.991.080.400.220.160.060.050.03
0.70
100.00
82
Notes and Coin in Circulation (in pcs)
Notes and Coin in Circulation (in Sk)
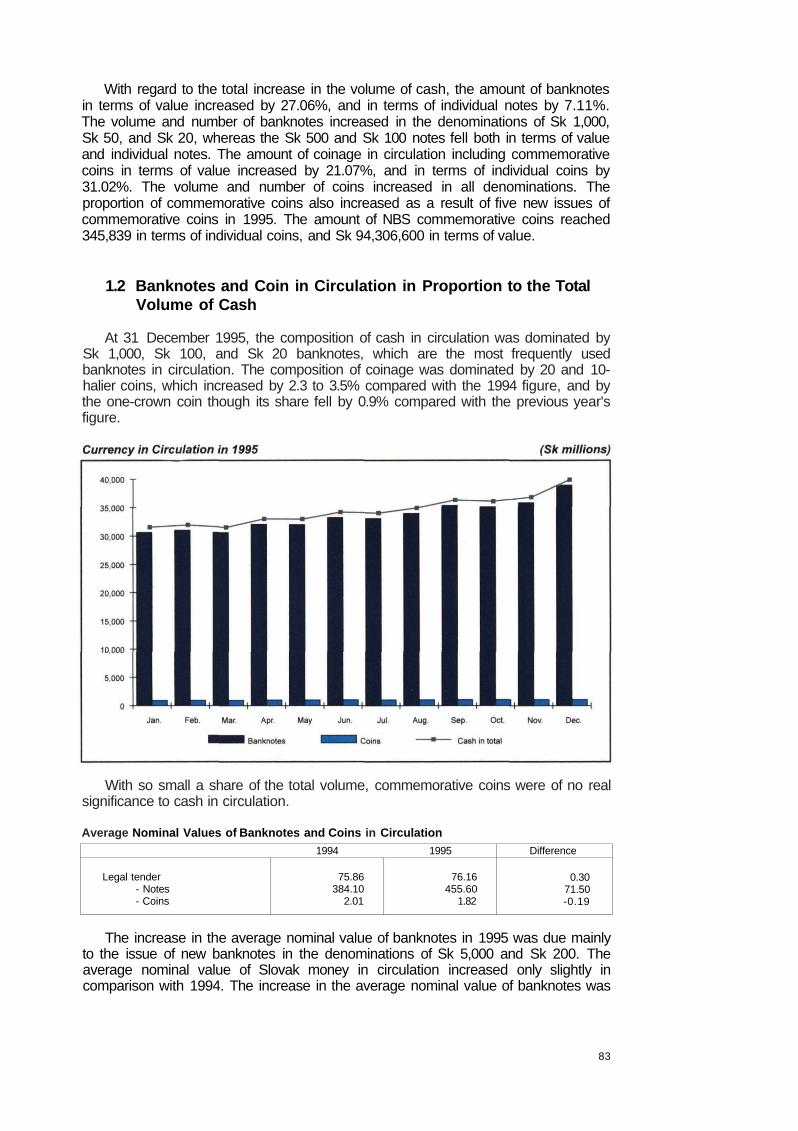
With regard to the total increase in the volume of cash, the amount of banknotesin terms of value increased by 27.06%, and in terms of individual notes by 7.11%.The volume and number of banknotes increased in the denominations of Sk 1,000,Sk 50, and Sk 20, whereas the Sk 500 and Sk 100 notes fell both in terms of valueand individual notes. The amount of coinage in circulation including commemorativecoins in terms of value increased by 21.07%, and in terms of individual coins by31.02%. The volume and number of coins increased in all denominations. Theproportion of commemorative coins also increased as a result of five new issues ofcommemorative coins in 1995. The amount of NBS commemorative coins reached345,839 in terms of individual coins, and Sk 94,306,600 in terms of value.
1.2 Banknotes and Coin in Circulation in Proportion to the TotalVolume of Cash
At 31 December 1995, the composition of cash in circulation was dominated bySk 1,000, Sk 100, and Sk 20 banknotes, which are the most frequently usedbanknotes in circulation. The composition of coinage was dominated by 20 and 10-halier coins, which increased by 2.3 to 3.5% compared with the 1994 figure, and bythe one-crown coin though its share fell by 0.9% compared with the previous year'sfigure.
With so small a share of the total volume, commemorative coins were of no realsignificance to cash in circulation.
1994 1995
Legal tender- Notes- Coins
75.86384.10
2.01
76.16455.60
1.82
Difference
0.3071.50-0.19
The increase in the average nominal value of banknotes in 1995 was due mainlyto the issue of new banknotes in the denominations of Sk 5,000 and Sk 200. Theaverage nominal value of Slovak money in circulation increased only slightly incomparison with 1994. The increase in the average nominal value of banknotes was
83
Average Nominal Values of Banknotes and Coins in Circulation

offset by the 31% increase in the number of coins of all denominations, while thecirculation of halier coins decreased.
In 1995, the average number of banknotes per capita was 15.9, equivalent to Sk7,247.8; and the average number of coins was 81.2, equivalent to Sk 147.9. At theend of the year, the total per-capita value of Slovak currency in circulation includingcommemorative coins amounted to Sk 7,448.2, representing an increase of Sk1,644.1 in comparison with the previous year's figure.
84

2. OCCURRENCE OF COUNTERFEIT MONEY IN THESLOVAK REPUBLIC
2.1 Counterfeit Slovak Banknotes
In 1995, a total of 27 pieces of counterfeit Slovak banknotes amounting to Sk19,950 were detected in the Slovak Republic and passed to the National Bank ofSlovakia.
Number of Detected Counterfeit Banknotes
Year
199319941995
Sk 1,000
03
18
Sk 500
053
Sk1 00
013
Sk 50
023
Sk 10
060
0
Total
07127
Slovak-crownequivalent
06,300
19,950
Note: In 1993 and 1994, only new banknotes (not stamped)
The majority of these counterfeit notes were produced using electronic colourphoto copiers without trying to imitate the security features, and were classified assubstandard quality counterfeits (Class 4) and poor quality counterfeits (Class 5),which are easily recognised even by laymen. The security features were imitated onlyon three forged banknotes which were classified as good quality counterfeits.
2.2 Counterfeit Foreign Banknotes
In 1995, the most frequently detected counterfeit notes in the Slovak Republicwere US$ (1,998 pcs), CZK (447 pcs), and DEM (311 pcs).
US$DEMCZKSKKOther
1994Number (pcs)
1,709463
071
201
Percentage (%)
7019038
1995Number (pcs)
1,998311447
27185
Percentage (%)
68101516
In the case of US dollars and Czech crowns, the number of counterfeit banknotesdetected in the Slovak Republic increased in 1995. The number of counterfeit notesin other currencies decreased in comparison with the previous year's figure. Apositive development was that more than 50% of counterfeit notes had beendetected and seized by police even before they could be put into circulation.
85
Composition of Counterfeit Foreign Banknotes

Up to now, US dollar notes have been the poorest protected against forgery.Nowadays forgers are able to produce counterfeit US dollars of very good quality,and to put these notes into circulation in large amounts. These forged banknotes arealmost impossible to detect, and are therefore classified as good quality counterfeits(Class 3).
Year US$ DEM CZK
199319941995
1,5401,7091,998
1,579463311
280
447
Other
266201185
Total
3,4132,3732,941
Classification
Number (pcs)Percentage (%)
1
954.7
2
251.2
3
1,85793.1
4
100.5
5
20.1
N
90.4
Total
1,998100
Composition of Other Counterfeit Foreign Notes Detected in 1995 by Classification
Classification
Number (pcs)Percentage (%)
1
00
2
141.5
3
92197.7
4
10.1
5
20.2
N
50.5
Total
943100
2.3 Examination of Damaged Banknotes
In 1995, the National Bank of Slovakia received 74 applications for theexamination of damaged banknotes and compensation. In most cases, the damagewas due to natural causes, or other unpredictable events.
The nominal value of the damaged banknotes and coins totalled Sk 1,959,958.60;and compensation was paid in the total amount of Sk 1,926,569.10, i.e. 98.3% of thenominal value.
86
Counterfeit Foreign Banknotes Detected in the SR
Composition of Counterfeit US Dollars Detected in 1995 by Classification

2.4 International Cooperation
In 1995, the National Bank of Slovakia continued to exchange specimenbanknotes with central banks all over the world, and to build a collection of Slovaknotes and coins. At the end of December 1995, specimens of Slovak banknotes andcoins were sent to 171 issuing banks. The NBS has a collection consisting of thenotes and coins of 86 central banks.
The most important event in the field of international cooperation was theInternational Seminar on the Forgery of Banknotes and Coins organised by the NBSin June 1995. The meeting, which laid the foundations for bilateral cooperationamong the central banks of Europe, was attended by central bank representativesfrom the Czech Republic, Hungary, Poland, Austria, Slovenia, Italy, Ukraine, andSlovakia, as well as police officials from the INTERPOL, the US Secret Service, theMinistry of the Interior of the SR, Presidium of the Police Corps of the SR, theCriminal Institute of the Police Corps, and the Slovak Government Council forProtection Against Antisocial Activity.
87

E. Auditors' Report
89

Deloitte &Touche
Kupeckého 3 Telephone: +42 (7) 566 0661821 08 BratislavaSlovakia Facsimile: +42 (7) 566 0662
INDEPENDENT AUDITORS' REPORTTO THE BANK BOARD OF THE NATIONAL BANK OF SLOVAKIA
We have audited the accompanying balance sheets of the National Bank of Slovakia (the"Bank") as of 31 December 1995 and 1994 and the related profit and loss accounts forthe years then ended. These financial statements, set out on pages 2 through 12, are theresponsibility of the Bank's Board. Our responsibility is to express an opinion on thesefinancial statements based on our audits.
We conducted our audits in accordance with International Standards on Auditing andguidelines recommended by the Slovak Chamber of Auditors. Those standards andguidelines require that we plan and perform the audit to obtain reasonable assuranceabout whether the financial statements are free of material misstatement. An auditincludes examining, on a test basis, evidence supporting the amounts and disclosures inthe financial statements. An audit also includes assessing the accounting principles usedand significant estimates made by management, as well as evaluating the overallfinancial statement presentation. We believe that our audits provide a reasonable basis forour opinion.
The Bank is required to prepare the accompanying financial statements in accordancewith Act No. 563/1991 on Accounting and with relevant laws and regulations of theSlovak Republic. The accompanying financial statements have been reformatted to makethem more comparable in appearance to financial statements issued for internationalpurposes.
In our opinion, the accompanying financial statements present fairly, in all materialrespects, the financial position of the National Bank of Slovakia as of 31 December 1995and 1994 and the results of its operations for the years then ended in accordance with ActNo. 563/1991 on Accounting and relevant legislation issued by the Ministry of Financeof the Slovak Republic.
15 March 1996
Deloitte & Touche
DeloitteToucheTohmatsuInternational
91

NATIONAL BANK OF SLOVAKIABALANCE SHEETS
AS OF31 DECEMBER 1995 AND 1994
in millions of Slovak crowns
ASSETS Notes 1995 1994
Gold 3.1. 1904.4 2 306.5
Deposits with the International Monetary Fund 3.2. 28 381.6 35 055.0
*Reserve position with the InternationalMonetary Fund and Special Drawing Rights 11 628.8
*Guarantee deposits on loans from theInternational Monetary Fund 16 752.8
Deposits with foreign banks and international 3.3. 40 062.0 48 143.4institutions
Receivables from domestic banks 3.4. 36 484.6 36 143.4
Receivables from the State budget 3.5. 25 742.1 46 437 2
Securities 3.6. 63 676.4 8 266 7
Investments and participations 3.7. 1 509.6 1 585.8
Other assets 3.8. 4 304.8 2 605.8
Total assets 202 065.5 180 543.8
LIABILITIES AND EQUITY
Currency in circulation 4.1. 39 795.8 31265.4
Liabilities to the International Monetary Fund 4.2. 41 899.6 54 986.8
*Intemational Monetary Fund holdings 25 734.5*Loans from International Monetary Fund 16 165.1
Liabilities to foreign banks and international 4.3. 3 167.3 2 039.0institutions
*Deposits from foreign banks and international 1 091.9institutions
*Loans from foreign banks and international 2 075.4institutions
Securities issued 4.4. 25 830.7 16 111.8Deposits of domestic banks 4.5. 24 060.8 17 667.5
Liabilities to the State budget 4.6. 12 213.3 10 127.2
*State financial assets 9 349.4*State funds 2 863.9
Other liabilities 4.7. 46 991.1 42 022.7
Total liabilities 193 958.6 174 220.4
Net equity 4.8. 8 106.9 6 323.4
Total liabilities and equity 202 065.5 180 543.8
The notes on pages 4 to 12 form an integral part of the financial statements.
2
92

NATIONAL BANK OF SLOVAKIAPROFIT AND LOSS ACCOUNTS AND PROFIT ALLOCATIONS
FOR THE YEARS ENDED31 DECEMBER 1995 AND 1994
in millions of Slovak crowns
EXPENDITURES Notes 1995 1994
Interest and fee expenditures 5.1. 8 592.0 4 779.2
Staff costs 5.2. 298.1 256.3
Other expenditures 5.3. 6 003.8 2 710.1
Profit 3 590.0 8 956.8
Total 18 483.9 16 702.4
REVENUES
Interest and fee revenues 6.1. 15 798.8 16 190.6
Net result of foreign currency valuation 6.2. 2 654.6 256.2
Other revenues 30.5 255.6
Total 1 8 483.9 16 702.4
PROFIT ALLOCATIONS 7.
Transfer to the State budget 1530.8 6 746.3
Allocation to funds 2 059.2 2 210.5
Profit 3 590.0 8 956.8
The notes on pages 4 to 12 form an integral part of the financial statements.
3
93

NATIONAL BANK OF SLOVAKIANOTES TO THE FINANCIAL STATEMENTS
AS OF 31 DECEMBER 1995
1. General information
The National Bank of Slovakia (the "Bank") was established in accordance with Act No.566/1992 on the National Bank of Slovakia ("Bank Act") and started its operations as the centralbank of the Slovak Republic on 1 January 1993.
Under the guidelines of the Bank Act, the Bank's main responsibilities are to:
• define the monetary policy,• issue banknotes and coins,• direct the circulation of money, coordinate payments and the settlement of accounts
between banks and ensure the efficient and economical performance of these operations,• supervise the banking sector,• administer the accounts of the state budget, and• represent the Slovak Republic in world capital markets and with international financial
institutions.
2. Statement of Accounting Policies
Accounting policies applied in the accompanying financial statements are summarised below.
2. 1. Basic principles
The accounting of the Bank is maintained in accordance with the Accounting Act No. 563/1991(the "Accounting Act"). The accompanying financial statements have been reformatted to makethem more comparable in appearance to financial statements issued for international purposes.The 1994 comparative information disclosed in the financial statements has been reclassifiedinto a format comparable with the current year information.
2.2. Valuation of individual assets and liabilities
The financial statements are prepared under the historical cost basis of accounting in accordancewith the Accounting Act.
The valuation of assets and liabilities considers financial risks known to the Bank at the date ofpreparation of the financial statements.
The following mandatory methods of valuation were applied:
• purchased supplies were valued at acquisition cost,• purchased tangible and intangible fixed assets were valued at acquisition cost,• cash, stamps and vouchers were valued at nominal value,• securities tradable on the capital market and investments were valued at acquisition cost.
Securities traded in the capital market are mainly shares, participation certificates, bonds andmortgage bonds.
• securities tradable on the financial market were valued at their nominal value. Securitiestraded in the financial market are mainly bills of exchange, cheques, govemmentals, treasurynotes of the Bank, certificates of deposit and depositary receipts. Discounts related to thesecurities tradable on the financial market are included in liabilities in the Balance Sheet andin revenues in the Profit and loss account.
• receivables and liabilities were valued at their nominal value.
94

NATIONAL BANK OF SLOVAKIANOTES TO THE FINANCIAL STATEMENTS
AS OF 31 DECEMBER 1995
2.3. Valuation of foreign currency transactions and holdings
The Bank converts assets and liabilities expressed in foreign currency to Slovak currency usingthe foreign exchange rate for accounting purposes on the day of the accounting event and in thefinancial statements using the foreign exchange rate as of 31 December 1995:
• the "foreign exchange - buying rate" for receivables,• the "foreign exchange - selling rate" for payables and tangible and intangible fixed assets
except for receivables,• the "foreign exchange - mid rate" for bank accounts, and receivables from and payables to
banks, including branches of foreign banks.
The exchange rates for the main foreign currencies used by the Bank for translation of assets andliabilities as of 31 December 1995 are as follows:
Currency Unit Foreign exchange ratesBuying rate Selling rate Mid rate
USDDEMJPYSDR
111001
29.42120.54328.69043.734
29.71720.74928 97844.174
29.56920.64628.83443.954
Realised exchange rate gains and losses from the recalculation of foreign currencies to Slovakcrowns are included in the Profit and loss account. Unrealised exchange rate losses are includedin the Profit and loss account and unrealised exchange rate gains are included in the BalanceSheet.
2.4. Tangible and intangible fixed assets
Tangible and intangible fixed assets are valued at their acquisition cost. Depreciation iscalculated on the straight-line basis, based on estimated useful lives of the fixed assets.
The estimated useful lives of fixed assets are as follows:
Depreciation category Type of fixed asset Useful lives1
234
2.5. Income tax
office equipment, data processing machines, 4 yearspersonal and delivery cars, and softwareinstruments and special technical equipment 8 yearssecurity equipment 15 yearsenergy production equipment, (the Bank does not 30 yearshave any fixed assets in this depreciation category)buildings, constructions 50 years
The Bank is exempt from income tax under Article 17 of the Income Tax Act No. 286/92 andsubsequent amendments.
95

NATIONAL BANK OF SLOVAKIANOTES TO THE FINANCIAL STATEMENTS
AS OF 31 DECEMBER 1995
2.6. Profit allocation
The profit generated by the Bank is used to replenish the level of reserve funds and other fundscreated from profits, and for other purposes according to the Bank budget. The Bank transfersthe remaining profit to the State budget of the Slovak Republic.
3. Assets
3.1. Gold
This item represents the gold reserves administered by the Bank. The Bank administers in total30.4 million grams of fine gold, valued at a historical purchase price of Sk 62.54 per gram.
This item does not include 9.7 million grams of gold used for swap operations for foreigncurrency.
Part of the gold in the amount Sk 570.4 million, resulting from the split of gold reserves of theformer State Bank of Czechoslovakia ("ŠBČS"), has not been released to the Bank. This goldwill be part of the final settlement regarding the separation of the former ŠBČS balance sheet.
Market value of gold as of 31 December 1995 is 12.433 USD per gram (386.7 USD per OZS),i.e. 367.60 Sk per gram (11 434.30 Sk per OZS). The total market value of gold administered bythe Bank as of 31 December 1995 is Sk 11 193.6 million.
3.2. Deposits with the International Monetary Fund
This item consists of receivables from the International Monetary Fund ("IMF") resulting fromthe membership of the Slovak Republic in the International Monetary Fund. Special drawingrights ("SDR") within the reserve tranche are equal to the Slovak Republic's membership quotapaid to the International Monetary Fund in SDR and Slovak crowns. Based on the InternationalMonetary Fund rules and regulations, "Guarantee deposits on loans from the IMF", are depositsin Slovak crowns and represent the counterpart of loans, which were granted to the SlovakRepublic (see Note 4.2. "Liabilities to the International Monetary Fund").
3.3. Deposits with foreign banks and international institutions
This item consists primarily of deposits held in foreign banks, mainly denominated in Germanmarks and United States dollars.
3.4. Receivables from domestic banks
As of 31 December 1995, this item represents long-term redistribution loans in the amount ofSk 32 107.0 million, re-financing loans in the amount of Sk 1 333.9 million and loans granted tocommercial banks for the restructuring and development of the Slovak economy in the amountof Sk 2 264.4 million. It also includes other current and short-term deposit accounts withcommercial banks in the amount of Sk 779.3 million. Reserves have been created to cover risksrelating to the above loans (see Note 4.7. "Other liabilities").
3.5. Receivables from the State budget
Transactions with the Slovak Republic regarding State budget operations are set forth in Article25 of the Bank Act.
96
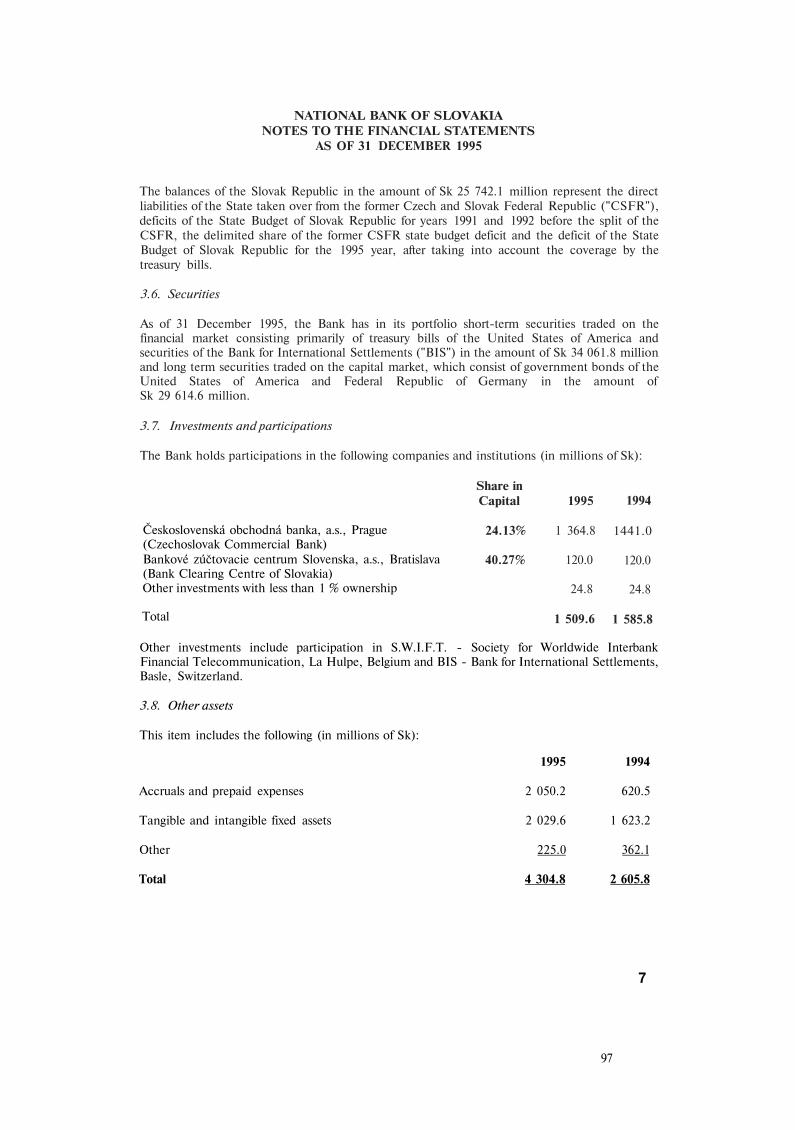
NATIONAL BANK OF SLOVAKIANOTES TO THE FINANCIAL STATEMENTS
AS OF 31 DECEMBER 1995
The balances of the Slovak Republic in the amount of Sk 25 742.1 million represent the directliabilities of the State taken over from the former Czech and Slovak Federal Republic ("CSFR"),deficits of the State Budget of Slovak Republic for years 1991 and 1992 before the split of theCSFR, the delimited share of the former CSFR state budget deficit and the deficit of the StateBudget of Slovak Republic for the 1995 year, after taking into account the coverage by thetreasury bills.
3.6. Securities
As of 31 December 1995, the Bank has in its portfolio short-term securities traded on thefinancial market consisting primarily of treasury bills of the United States of America andsecurities of the Bank for International Settlements ("BIS") in the amount of Sk 34 061.8 millionand long term securities traded on the capital market, which consist of government bonds of theUnited States of America and Federal Republic of Germany in the amount ofSk 29 614.6 million.
3.7. Investments and participations
The Bank holds participations in the following companies and institutions (in millions of Sk):
Československá obchodná banka, a.s., Prague(Czechoslovak Commercial Bank)Bankové zúčtovacie centrum Slovenska, a.s., Bratislava(Bank Clearing Centre of Slovakia)Other investments with less than 1 % ownership
Total
Other investments include participation in S.W.I.F.T. - Society for Worldwide InterbankFinancial Telecommunication, La Hulpe, Belgium and BIS - Bank for International Settlements,Basle, Switzerland.
3.8. Other assets
This item includes the following (in millions of Sk):
1995 1994
Accruals and prepaid expenses 2 050.2 620.5
Tangible and intangible fixed assets 2 029.6 1 623.2
Other 225.0 362.1
Total 4 304.8 2 605.8
Share inCapital
24.13%
40.27%
1995
1 364.8
120.0
24.8
1 509.6
1994
1441.0
120.0
24.8
1 585.8
97
7

NATIONAL BANK OF SLOVAKIANOTES TO THE FINANCIAL STATEMENTS
AS OF 31 DECEMBER 1995
4. Liabilities and equity
4.1. Currency in circulation
This item comprises valid domestic banknotes and coins issued by the Bank. During 1995 theBank issued banknotes with new nominal values of Sk 200 and Sk 5 000.
4.2. Liabilities to the International Monetary Fund
The item "International Monetary Fund holdings" includes deposits of the InternationalMonetary Fund in Slovak crowns held by the Bank.
The item "Loans from International Monetary Fund" includes loans provided in fully convertiblecurrency to strengthen the balance of payments of the Slovak Republic and its foreign exchangereserves. These loans are secured by guarantee deposits with the International Monetary Fund(see Note 3.2. "Deposits with the International Monetary Fund").
Liabilities to foreign banks and international institutions4.3.
"Deposits from foreign banks and international institutions" represents short-term fullyconvertible currency deposits held at the Bank.
"Loans from foreign banks and international institutions" represents loans granted by theExport-Import Bank of Japan, the European Investment Bank of Luxembourg and money fromfund PHARE from the European Union. The loans are designed to provide financing to selecteddomestic banks, to support small and medium businesses and certain sectors of the economy ofthe Slovak Republic.
4.4. Securities issued
"Securities issued" includes medium-term and long-term bonds in Japanese yen with maturitiesof 5 and 7 years, placed on international capital markets. In 1994 the Bank issued bonds in theamount of JPY 25 000 million with a coupon of 6.3%. This item also includes bonds issued in1993 in the amount of JPY 25 000 million with coupons of 7.75% and 8.0%, and bonds issuedby the former ŠBČS in the amount of JPY 1 400 million with a coupon of 8.5%.
During 1994, the Bank entered into contracts on long-term swap operations to convert the risk offoreign exchange rate changes from JPY to DEM in respect of Bank bonds issued in 1993 and1994. These swap contracts mature one day before the due date of the respective bonds.
This item also includes the liability from the issue of short-term treasury bills of the Bank in theamount of Sk 11 010.0 million. During 1995, there were 21 issues of Bank treasury bills placedon the domestic financial market.
4.5. Deposits of domestic banks
As of 31 December 1995 this item represents primarily the obligatory minimum reserves ofdomestic banks deposited at the Bank in the total amount of Sk 21 470.4 million. The remainingbalance represents other deposits from domestic banks.
8

NATIONAL BANK OF SLOVAKIANOTES TO THE FINANCIAL STATEMENTS
AS OF 31 DECEMBER 1995
4.6. Liabilities to the State budget
"State financial assets" in the form of deposits in the accounts of the Bank as of 31 December1995 amount to Sk 9 349.4 million.
"State funds" in the amount of Sk 2 863.9 million represents other deposits of the State in theBank.
4.7. Other liabilities
Other liabilities comprise the following (in millions of Sk):
Accruals
Unrealised exchange gains
Reserves
Other
Total
"Reserves" as of 31 December 1995 consists of reserves in the amount of Sk 3 831.4 million tocover risks resulting from long-term redistribution loans ( see Note 3.4. "Receivables fromdomestic banks"), reserves in the amount of Sk 2 945.0 million to cover for the differencebetween the market value and the historical cost of gold used for swap operations, and otherreserves in the amount of Sk 8.6 million.
The main component in "Other" represents the amount incurred from the activity of separatingthe balance sheet of the former ŠBČS. The final amount of these liabilities will be determined asa part of the final settlement regarding the separation of the former ŠBČS balance sheet.
"Other" also includes deposits of clients and employees of the Bank in the amount ofSk 2 062.2 million as of 31 December 1995.
4.8. Net equity
This item represents the capital taken over from the separation of the balance sheet of the formerŠBČS in the amount of Sk 466.7 million, the legal reserve fund in the amount ofSk 7 573.0 million and the capital fund in the amount of Sk 67.2 million.
The balance of net equity as of 31 December 1994 in the amount of Sk 6 323.4 million increasedduring 1995 by additions to the legal reserve fund in the amount of Sk 1 782.5 million (see Note7. "Profit allocations") and by additions to the capital fund in the amount of Sk 1.0 million.
1995
1 484.9
3 340.0
6 785.0
35 381.2
46 991.1
1994
1461.3
1 923.2
1641.4
36 996.8
42 022.7
99

NATIONAL BANK OF SLOVAKIANOTES TO THE FINANCIAL STATEMENTS
AS OF 31 DECEMBER 1995
1995
673.52 712.9
1 123.34 082.3
8 592.0
1994
739.62 400.7
1091.5547.4
4 779.2
5. Expenditures
5.7. Interest and fee expenditures
Interest and fee expenditures comprise the following (in millions of Sk):
Interest and fees paid to State treasuryInterest and fees paid to foreign banksand international institutionsInterest and fees on bonds issuedOther interest, fees and commissions
Total
5.2. Staff costs
"Staff costs" consist of wage and social costs. Social costs represent mainly costs forcompulsory contributions to the Health Insurance Fund, Social Security Fund, Pension Fund andEmployment Fund, and compulsory additions to the social fund in accordance with the SocialFund Act No. 152/1994 and in terms of the amendment to the Income Tax Act No. 286/1992.
As of 31 December 1995 the Bank had 1 187 employees, representing an increase of 51employees compared to 31 December 1994.
5.3. Other expenditures
This item includes the following (in millions of Sk):
General operating expendituresExpenditures on banknotes and coinsDepreciation of fixed assetsReservesOther
Total
The main component in "other expenditures" represents reserves of Sk 5 145.7 millioncomprising mainly reserves created in 1995 to cover risks resulting from long-termredistribution loans in the amount of Sk 2 192.0 million (see Note 3.4. "Receivables fromdomestic banks" and Note 4.7. "Other liabilities"), and reserves to cover for the differencebetween the market price and historical cost of gold used for swap operations in the amount ofSk 2 945.0 million (see Note 4.7. "Other liabilities").
1995
266.5259.8164.4
5 145.7167.4
6 003.8
1994
277.6198.2124.2
1 639.4470.7
2 710.1
10
100

NATIONAL BANK OF SLOVAKIANOTES TO THE FINANCIAL STATEMENTS
AS OF 31 DECEMBER 1995
6. Revenues
6.1. Interest and fee revenues
Interest and fee revenues comprise the following (in millions of Sk):
1995 1994
Interest and fees received from State treasury 3 413.8 9 648.9Interest and fees received from domestic banks 5 951.6 4 160.1Interest and fees received from foreign banks 4 400.7 2 300.2and international institutionsOther interest and fees 2 032.7 81.4
Total 15 798.8 16190.6
6.2. Net result of foreign currency valuation
This item reflects the net translation differences resulting from realised exchange rate gains andlosses and unrealised exchange rate losses.
7. Profit allocations
The activities of the Bank resulted in an overall profit for the 1995 year of Sk 3 590.0 million ofwhich Sk 1 530.8 million was transferred to the State Budget in accordance with Bank Boarddecisions.
The remaining balance of the 1995 profit, in the amount of Sk 2 059.2 million, was used toreplenish the following funds (in millions of Sk):
1995 1994
Legal reserve fund 1782.5 2 124.6
Other funds 276.7 85.9
Total 2 059.2 2 210.5
11
101

NATIONAL BANK OF SLOVAKIANOTES TO THE FINANCIAL STATEMENTS
AS OF 31 DECEMBER 1995
8. Off- balance sheet items
As of 31 December 1995 the Bank has off-balance sheet receivables in the amount ofSk 22 101.3 million and liabilities in the amount of Sk 25 384.2 million from foreign exchangeterm operations, which consist of the following items:
• deferred receivables in the amount of Sk 15 004.9 million and deferred liabilities in theamount of Sk 15 395.6 million from the long-term swap operations which were entered intoto convert the risk of foreign exchange rate changes from JPY to DEM in respect of Bankbonds issued in 1993 and 1994 (see Note 4.4. "Securities issued"),
• deferred receivables in the amount of Sk 6 491.2 million and liabilities in the amount ofSk 6 465.5 million from short-term foreign exchange swap operations which were enteredinto in order to hedge the Bank's risk of foreign exchange rate changes, and to manage theforeign currency reserves,
• deferred receivables from gold swap operations in the amount of Sk 605.2 million anddeferred liabilities in the amount of Sk 3 523.1 million.
The Bank provides guarantees on loans granted by foreign banks and international institutions todomestic commercial banks up to the current balance of these loans amounting toSk 2 154.4 million as of 31 December 1995.
12
102

F. Appendices

Monetary Survey(Sk billion)
Current exchange rate SKK/USD
ASSETS
Net foreign assets
Foreign assets
Foreign liabilities
Net domestic assets
Domestic credit
- Net credit to Government
- Net credit to FNM */
- Credit to households and enterprises
- Credit in Sk
- Credit to enterprises
- Credit to households
- Credit in foreign currency
LIABILITIES
Liquid liabilities (M2)
Money (M1)
Currency outside banks (MO)
Demand deposits
- Households
- Enterprises
- Insurance companies
Quasi-money
Time and savings deposits
- Households
- Enterprises
- Insurance companies
Foreign currency deposits
- Households
- Enterprises
Other net items
1995
1.1.95
31,277
15.6
101.8
86.2
279.1
367.5
99.3
1.0
267.2
252.8
236.4
16.4
14.4
294.7
123.2
28.1
95.1
31.5
62.0
1.6
171.5
133.1
98.0
20.3
14.8
38.4
32.3
6.1
88.4
1
30,740
18.0
103.8
85.8
270.3
361.1
93.7
0.9
266.5
252.6
236.4
16.2
13.9
288.3
114.7
28.2
86.5
32.0
53.0
1.5
173.6
135.2
99.4
21.0
14.8
38.4
33.0
5.4
90.8
2
30,064
18.2
106.6
88.4
273.9
366.3
96.2
0.9
269.2
253.2
237.3
15.9
16.0
292.1
116.8
28.6
88.2
32.3
53.9
2.0
175.3
137.2
100.7
21.7
14.8
38.1
33.4
4.7
92.4
3
28,995
22.2
112.8
90.6
269.8
373.1
94.1
0.8
278.2
260.9
245.2
15.7
17.3
292.0
114.6
28.2
86.4
32.1
51.8
2.5
177.4
138.3
101.8
21.7
14.8
39.1
33.8
5.3
103.3
4
28,958
23.5
116.1
92.6
273.2
371.6
90.3
0.4
280.9
264.2
248.7
15.5
16.7
296.7
119.2
29.5
89.7
32.8
54.1
2.8
177.5
138.4
102.7
21.0
14.7
39.1
34.1
5.0
98.4
5
29,271
27.2
122.7
95.5
271.5
374.4
91.0
1.8
281.6
264.8
249.5
15.3
16.8
298.7
119.6
29.4
90.2
33.2
54.8
2.2
179.1
139.9
103.9
20.3
15.7
39.2
34.3
4.9
102.9
6
29,350
36.7
130.8
94.1
266.6
375.8
89.7
2.0
284.1
267.5
252.3
15.2
16.6
303.3
121.2
30.3
90.9
33.6
55.5
1.8
182.1
142.5
105.4
21.6
15.5
39.6
34.7
4.9
109.2
7
29,194
43.1
130.3
87.2
265.0
376.5
87.1
1.6
287.8
269.7
254.7
15.0
18.1
308.1
123.9
30.4
93.5
34.2
57.8
1.5
184.2
144.4
106.5
22.0
15.9
39.8
35.0
4.8
111.5
8
30,329
49.6
135.2
85.6
265.6
377.5
85.9
1.0
290.6
271.8
256.9
14.9
18.8
315.2
126.8
31.2
95.6
34.3
59.7
1.6
188.4
148.6
107.7
25.0
15.9
39.8
34.9
4.9
111.9
9
29,538
52.4
136.1
83.7
265.7
379.8
85.2
1.3
293.3
273.4
258.6
14.8
19.9
318.1
130.7
32.0
98.7
34.8
62.1
1.8
187.4
147.1
108.6
22.7
15.8
40.3
35.3
5.0
114.1
10
29,437
54.3
135.4
81.1
265.4
379.7
81.7
0.4
297.6
276.8
262.1
14.7
20.8
319.7
130.0
31.8
98.2
34.9
62.0
1.3
189.7
150.1
110.6
23.4
16.1
39.6
35.1
4.5
114.3
11
29,710
57.9
142.7
84.8
268.1
387.0
88.1
0.3
298.6
277.2
262.7
14.5
21.4
326.0
134.1
32.7
101.4
35.5
64.6
1.3
191.9
152.4
112.6
23.8
16.0
39.5
35.0
4.5
118.9
12
29,569
63.9
150.1
86.2
293.3
395.2
91.0
-2.3
306.5
283.8
268.5
15.3
22.7
357.2
148.4
34.5
113.9
37.4
75.0
1.5
208.8
169.1
125.7
27.7
15.7
39.7
35.4
4.3
101.9
*/ National Property Fund

Consolidated Balance of Payments for 1995(Sk millions)
Trade balance
Exports (f.o.b.)
Imports (f.o.b.)
Services balance
Receipts
Transportation
Travel
Other services
Expenditures
Transportation
Travel
Other services
Income balance
Interest
Income
Payments
Investment
Income
Payments
Employee compensation
Income
Payments
Current transfers
Official
Private
Current account
Capital transfers
Net medium- and long-term financial account
Direct investment
Portfolio investment
Credit received
Disbursements
Repayments
Credit extended
Disbursements
Repayments
Net short-term financial account
Clearing balance (-, surplus)
Payments for overflow of marginal credit
Total capital and financial account
Errors and omissions
Overall balance
Change in reserves (-, increase)
Gold holdings
Holdings of SDRs
Foreign exchange assets
Valuation changes
Q1
135.0
59,530.0
59,395.0
4,529.0
16,977.0
4,545.0
3,963.0
8,469.0
12,448.0
1,880.0
1,699.0
8,869.0
248.0
26.0
1,092.0
1,066.0
-44.0
39.0
83.0
266.0
275.0
9.0
146.0
40.0
106.0
5,307.4
700.0
2,426.0
895.0
-489.0
1,276.0
8,308.0
-7,032.0
744.0
-34.0
492.0
-2,131.6
-7,842.0
3,236.0
-3,611.6
760.9
2,207.3
-2,207.3
793.2
-3,000.5
Q1 -Q2
-555.0
124,978.0
125,533.0
10,850.0
36,842.0
8,680.0
7,960.0
20,202.0
25,992.0
3,980.0
3,714.0
18,298.0
1,540.4
1,199.4
3,758.0
2,558.6
-98.0
159.0
257.0
439.0
468.0
29.0
461.0
-90.0
551.0
12,296.4
1,360.0
7,773.0
1,003.0
2,587.0
3,533.0
17,280.0
-13,747.0
650.0
-683.0
1,282.0
-2,185.0
-24,954.0
21,552.0
3,546.0
6,131.6
21,974.0
-21,974.0
-16.0
2,313.0
-24,271.0
Q1 -Q3
2,333.0
188,111.0
185,778.0
16,002.0
56,547.0
13,909.0
13,278.0
29,360.0
40,545.0
6,764.0
6,225.0
27,556.0
152.0
-206.0
5,184.0
5,390.0
-196.0
237.0
433.0
554.0
595.0
41.0
1,802.0
345.0
1,457.0
20,289.0
1,360.0
9,171.0
4,171.0
2,928.0
-54.0
24,580.0
-24,634.0
2,126.0
-723.0
2,849.0
-1,705.0
-28,158.0
25,819.0
6,487.0
1,611.2
28,387.2
-28,387.2
-58.6
1,891.4
-30,220.0
Q1 -Q4
717.0
254,099.0
253,382.0
16,242.0
70,656.0
18,296.0
18,505.0
33,855.0
54,414.0
8,930.0
9,526.0
35,958.0
-408.0
-894.0
6,322.0
7,216.0
-204.0
315.0
519.0
690.0
766.0
76.0
2,742.0
497.0
2,245.0
19,29
1,360.0
22,977.0
3,984.0
7,317.0
9,633.0
23,407.0
-21,596.0
2,043.0
-2,325.0
4,321.0
2,715.0
-28,158.0
30,501.5
29,395.5
-1,741.0
46,947.0
-46,947.0
-58.0
950.0
-47,839.0
Note: Cumulative figures
108

Detailed Balance of Consolidated Payments Capital Account for 1995(Sk millions)
Capital transfers
Direct investment
SR abroad
in the SR
Portfolio investment
SR abroad
in the SR
Other long-term financial account
Assets
Government
Disbursements
Repayments
Commercial banks
Disbursements
Repayments
Enterprises
Disbursements
Repayments
Liabilities
Government
Disbursements
IMF
WB
EXIM BANK
G24
EC
EIB
Others
Repayments
Commercial banks
Disbursements
Repayments
Enterprises
Disbursements
Repayments
Short-term financial account
Bank assets
Bank liabilities
Corporate assets
Corporate liabilities
Other assets
Other liabilities
Clearing balance( -, surplus)
Payments for overflow of marginal credit
Total capital and financial account
Q1
700.0
895.0
-85.0
980.0
-489.0
-234.0
-255.0
2,020.0
744.0
459.0
459.0
286.0
-1.0
-34.0
33.0
1,276.0
-982.0
459.0
17.0
334.0
108.0
-1,441.0
1,024.0
5,527.0
-4,503.0
1,234.0
2,322.0
1,088.0
-2,131.6
-4,357.0
3,127.0
-2,779.0
1,156.0
721.4
-7,842.0
3,236.0
-3,611.6
Q1 -Q2
1,360.0
1,003.0
-148.0
1,151.0
2,587.0
2,155.0
432.0
4,183.0
650.0
917.0
917.0
-35.0
-86.0
-232.0
-597.0
365.0
3,533.0
-618.0
2,831.0
17.0
2,465.0
349.0
-3,449.0
1,926.0
9,411.0
-7,485.0
2,225.0
5,038.0
-2,813.0
-2,185.0
-4,515.0
3,483.0
-4,011.0
1,686.0
1,172.0
-24,954.0
21,552.0
3,546.0
Q1 -Q3
1,360.0
4,171.0
-173.0
4,344.0
2,928.0
2,713.0
215.0
2,072.0
2,126.0
1,282.0
66.0
66.0
778.0
-789.0
1,567.0
-54.0
-5,429.0
2,861.0
17.0
2,466.0
378.0
-8,290.0
1,727.0
13,407.0
-11,680.0
3,648.0
8,312.0
-4,664.0
-1,705.0
-4,239.0
2,659.0
-1,108.0
989.0
-6.0
-28,158.0
25,819.0
6,487.0
Q1 -Q4
1,360.0
3,984.0
-234.0
4,218.0
7,317.0
5,105.0
2,212.0
11,676.0
2,043.0
1,685.0
1,685.0
126.0
232.0
-2,404.0
2,636.0
9,633.0
-9,850.0
3,031.0
17.0
2,466.0
548.0
-12,881.0
7,822.0
11,661.0
20,376.0
-8,715.0
2,715.0
-8,358.0
6,843.0
-164.0
4,394.0
-28,158.0
30,501.5
29,395.5
Note: Cumulative figures
109

Assets of Commercial Banks(Sk millions)
ASSETS
Cash valuesCash on handGoldOther cash items
Accounts with banks of issue and postal checking accountsAccounts of monetary reserves with NBSAccounts of government bodies, local authorities, and state funds
Social security fundsGovernment bodiesLocal authoritiesFunds
Accounts of other banksCurrent accounts with other banksTime deposits with other banksCredits and loansSpecial mention claims and clasified claims on banks
Collateral acceptedState treasury billsShort-term NBS Treasury bills and othersimilar values issued in Slovakia and abroadSpecial agenda commisionedStandard loans to clientsOther claims on clientsDebit current accounts and overdraftsInventoriesItems for collection received from correspondents and clientsAdjustment and other suspense accountsSecurities transactionsPurchased securities in portfolioEquity participationForeign branches, representative offices, and other entitiesTangible fixed assetsAcquisition of fixed assetsShareholders and partnersLeased tangible fixed assetsIntangible fixed assetsUnsettled loss from previous yearLoss in current periodLoss in the process of approvalTotal assets
of which: in convertible currencyin non-convertible currency
19951.1.95
6,171.26,087.2
0.083.9
280.316,210.85,324.3
9.03,428.11,887.2
0.0122,373.010,657.7
109,045.12,670.2
0.0272.6
26,023.8
25.40.0
252,075.2425.3
8,237.762.8
162.213,712.6
37.131,911.8
1,962.7352.2
12,145.66,182.1
433.626.6
505.414.80.0
400.1505,329.261,225.4
3,142.0
1
6,038.85,584.3
0.0454.5865.8
15,299.54,729.9
20.72,817.91,891.3
0.0119,157.9
9,368.6106,770.3
3,019.10.0
295.325,441.3
0.00.0
250,656.21,668.69,176.1
68.9184.3
12,664.768.4
32,021.41,965.4
352.211,938.26,539.3
62.223.0
457.714.8
527.6119.9
500,337.662,468.32,156.0
2
5,840.45,571.4
0.1269.0625.1
15,628.44,519.6
21.72,610.01,887.9
0.0123,515.4
8,921.1113,569.9
1,024.30.0
372.231,224.3
0.10.0
252,962.6504.4
9,301.970.1
163.013,826.7
103.033,089.1
1,969.8352.2
12,367.26,191.9
279.121.8
480.914.8
655.5241.8
514,321.266,590.1
2,221.1
3
5,745.95,307.7
0.1438.2656.1
14,860.84,323.3
23.02,435.21,865.0
0.0132,934.6
8,423.0123,152.3
1,359.30.0
467.531,631.8
0.10.0
261,342.3531.1
9,195.272.6
178.711,582.6
64.334,242.82,159.6
354.012,622.46,174.5
141.620.7
523.514.848.7
393.7530,283.068,981.2
2,279.5
4
6,253.15,664.9
0.0588.2896.7
14,726.24,048.6
26.82,127.01,894.8
0.0121,546.2
9,199.3111,101.9
1,245.00.0
430.228,815.6
650.00.0
262,963.1633.8
9,974.974.0
202.513,676.8
125.433,440.22,152.5
354.012,737.26,217.1
62.195.8
512.814.857.7
393.7521,054.968,164.1
3,291.7
5
5,935.95,592.2
0.0343.6
1,249.78,376.64,167.4
77.12,160.71,929.6
0.0120,321.5
7,337.0110,064.9
2,919.60.0
431.233,330.7
0.10.0
263,926.82,171.89,176.1
75.2169.7
11,484.81,080.5
37,042.22,430.5
342.012,909.36,196.3
62.194.6
528.4296.5
57.7111.9
521,969.569,149.1
3,617.2
6
6,561.46,109.0
0.0452.4751.1
14,766.73,557.2
91.21,499.91,966.1
0.0118,042.6
5,864.7110,550.9
1,627.00.0
478.529,099.0
0.10.0
265,322.01,328.09,807.8
80.5229.5
11,999.8360.6
43,726.02,550.4
342.013,059.56,495.8
62.417.0
513.9296.3103.3111.9
529,663.369,187.9
3,555.9
7
6,488.56,167.6
0.0320.8795.3
15,328.43,899.6
91.71,784.92,023.0
0.0115,825.5
6,070.4108,163.0
1,592.10.0
654.333,247.7
0.50.0
268,497.61,701.09,758.5
82.9257.7
12,738.6716.8
44,768.02,856.6
342.013,071.56,758.9
2.115.9
501.8296.3184.3111.9
538,902.370,469.33,198.0
8
6,309.05,984.2
0.0324.8560.0
14,018.04,389.2
58.32,277.82,053.1
0.0124,408.6
6,620.6115,889.7
1,898.30.0
787.526,900.0
5,997.00.0
268,656.82,162.76,601.0
102.5369.6
12,965.6180.2
49,056.92,670.0
342.013,108.17,051.9
0.414.8
499.9321.3
5,650.383.8
553,207.072,378.1
3,166.9
9
6,740.06,210.4
0.0529.6706.8
25,480.34,550.9
79.02,472.11,999.7
0.0120,756.2
6,016.5113,252.2
1,487.50.0
578.711,232.0
200.00.0
267,716.41,239.38,213.6
113.4409.5
15,602.0339.1
60,882.32,568.5
339.013,417.37,159.1
319.213.8
533.5331.9
5,279.242.8
554,764.872,811.32,799.6
10
6,698.06,613.1
0.084.9
1,093.19,255.44,580.8
79.02,425.42,076.4
0.0125,365.8
7,989.7115,112.1
2,264.00.0
205.77,550.0
14,896.30.0
272,780.01,050.17,426.9
127.9578.5
14,341.0712.2
68,593.92,586.3
339.013,920.77,223.3
195.415.0
597.6339.3
5,296.8141.3
565,910.172,968.74,968.1
11
6,711.96,445.8
0.0266.1
1,123.424,011.34,428.0
45.02,275.42,107.6
0.0126,041.1
6,718.4116,332.4
2,990.40.0
239.05,016.0
10,077.00.0
272,649.8677.6
7,440.1135.7629.1
18,555.81024.8
70,617.12,586.7
337.814,458.27,144.5
195.213.9
620.2339.3
5,285.2141.3
580,499.974,880.95,561.3
12
8,928.38,634.3
0.0294.0
2,346.621,433.34,342.5
46.52,200.72,095.3
0.0128,823.9
9,647.4115,364.1
3,450.4362.0226.8
14,830.0
11,040.00.0
274,160.32,103.78,762.8
93.1469.2
13,152.2401.1
70,710.03,530.2
334.216,503.76,493.4
194.847.4
667.9480.5
7,945.00.0
598,021.076,890.84,742.0
Note: The difference between 1994 figures published in the Annual Report for 1994 and those at the beginning of 1995 is due to a difference in methodology.

Liabilities of Commercial Banks(Sk millions)
LIABILITIES
Accounts with banks of issueAccounts of banks of issue
Redistributional loansRefinancing loans
of which: Lombard loansAccounts of government bodies, local authorities, and state funds
Social security fundsGovernment bodies
Extrabudgetary fundsFunds
Local authoritiesOrdinary accountsExtrabudgetary fundsFunds
Accounts of other banksCurrent accounts with other banksCurrent accounts of other banksBorrowingsTime deposits of other banks
Items pledged as collateralClients' deposits
Credit current accountsClients' time depositsSavings deposits
Savings giro accountsDemand savings depositsOther short-term savings depositsMedium-term savings depositsLong-term savings deposits
Other liabilities towards clientsCertificates of deposit and Treasury billsEarmarked depositsCorrespondents' and clients' accounts credited after collectionAdjustment and others suspense accountsSecurities transactionsLiabilities from unpaid securitiesSubsidies and funds of similar natureBonds issuesLong-term borrowings of special natureReservesFunds created from net profitsRegistered capitalLong-term obligations of foreign banks' branches towards headquartersShare premium fundsOther capital fundsGains or losses from investmentsOwn shares issued to decrease reg. capitalGains or losses from reevaluation of reg. capital in foreign currencyRetained earnings from previous yearsProfit earned in current periodProfit in process of approvalTotal liabilities
of which: in convertible currencyin non-convertible currency
19951.1.95
2,938.734,766.032,787.0
1,979.00.0
15,456.23,188.79,094.77,469.71,624.93,172.91,260.01,912.4
0.697,823.5
135.78,723.2
14,839.474,125.3
101.4264,251.179,621.459,819.0
124,810.74,034.9
27,176.545,891.039,463.88,244.44,535.52,927.0
667.8139.0
14,052.338.533.3
3,356.2952.3
0.025,217.813,981.216,968.72,365.8
628.611.063.0
0.08.5
318.60.0
3,727.0505,329.258,382.52,586.2
1
4,807.234,364.432,787.0
1,577.40.0
16,805.03,087.0
10,057.98,641.21,416.83,660.01,434.72,024.8
200.693,655.8
494.27,743.9
14,519.370,898.4
117.4258,367.070,548.762,457.4
125,360.94,244.5
27,242.447,411.844,167.22,295.04,918.03,122.0
839.0159.5
14,495.03.0
33.13,335.2
952.30.0
25,301.115,613.517,101.0
695.7576.794.762.9
0.0-0.7
328.1721.2
3,869.6500,337.658,775.72,614.6
2
7,012.134,057.132,787.0
1,270.10.0
19,001.85,345.5
10,012.68,559.31,453.33,643.71,360.92,088.9
194.097,875.4
180.37,423.3
15,521.974,749.9
113.5261,085.7
71,215.563,426.4
126,443.84,375.7
27,075.746,926.940,357.47,708.25,790.93,286.2
910.1246.7
15,592.018.433.2
3,331.4952.3
0.025,356.613,900.717,121.42,319.7
686.514.363.1
0.024.2
318.31,524.53,685.3
514,321.261,230.4
2,522.2
3
9,200.533,597.732,787.0
810.60.0
18,188.95,903.38,678.06,991.31,686.73,607.61,419.62,188.0
0.0107,758.6
324.26,989.2
20,281.580,163.7
113.5261,441.9
70,031.363,197.1
128,213.54,352.4
26,954.147,213.840,663.1
9,030.16,230.23,371.7
897.1134.0
18,954.532.332.9
2,996.5952.321.8
25,598.613,898.817,080.72,588.3
731.0361.063.10.0
47.6376.3
1,944.53,668.5
530,283.063,041.0
2,707.9
4
6,665.433,256.832,787.0
469.80.0
20,074.86,540.09,996.46,732.23,264.23,538.41,382.12,156.3
0.096,826.7
413.87,294.0
14,410.174,708.8
113.5265,315.972,883.362,986.3
129,446.34,588.4
27,190.147,551.440,918.89,197.65,817.33,336.3
490.5152.7
18,544.7243.9
32.94,094.0
952.321.9
25,746.211,351.717,128.92,692.7
731.2761.063.1
0.050.9
412.12,612.13,565.4
521,054.963,465.12,793.5
5
6,957.433,109.532,787.0
322.40.0
19,784.57,226.39,175.07,201.71,973.33,383.21,277.62,105.6
0.096,563.0
388.56,002.5
15,854.874,317.2
111.5265,908.672,212.062,021.1
131,675.64,713.3
27,382.148,035.341,799.79,745.25,188.23,926.5
566.5136.0
20,506.8301.328.3
4,094.0952.3
21.925,727.411,837.217,127.42,661.0
731.2780.862.8
0.050.4
612.92,939.61,282.5
521,969.564,904.3
2,729.7
6
7,488.332,767.732,407.0
360.70.0
19,512.16,745.29,445.47,877.81,567.63,321.51,245.32,076.2
0.095,909.5
204.94,453.4
14,405.076,846.2
108.0269,979.1
73,939.162,524.7
133,515.34,912.3
27,510.848,641.042,479.19,972.16,766.44,075.6
612.2137.0
22,090.0369.871.8
4,090.8968.5
0.026,336.712,586.417,128.12,676.0
731.1780.862.8
0.048.8
1,002.03,358.1
5.5529,663.366,143.6
2,727.7
7
10,845.332,752.732,407.0
345.70.0
21,430.58,311.39,552.87,720.61,832.23,566.31,119.52,446.9
0.092,291.6
215.14,458.7
14,384.073,233.8
111.5274,285.576,261.663,331.7
134,692.25,118.3
27,649.248,858.042,858.510,208.38,212.34,543.2
599.4146.7
21,893.9175.0108.3
4,174.81,952.3
0.026,380.612,257.417,230.72,673.1
831.7797.957.00.0
51.21,002.04,092.3
5.5538,902.365,654.9
2,783.5
8
8,310.932,838.232,407.0
431.10.0
23,996.311,149.69,373.17,403.71,969.43,473.51,023.72,449.8
0.099,357.4
891.85,255.3
13,493.779,716.6
107.9280,982.278,337.566,592.9
136,051.85,217.6
27,632.249,257.143,270.710,674.27,432.94,470.3
581.4164.5
22,182.6310.3108.3
4,170.41,952.3
0.027,048.512,207.817,238.12,668.4
831.4797.9
57.00.0
40.01,002.04,343.3
6.7553,207.066,265.8
2,621.4
9
7,458.733,069.732,407.0
662.60.0
24,239.99,107.3
11,795.710,152.31,643.53,336.91,065.72,271.2
0.096,411.9
288.43,942.9
13,337.778,842.8
54.1282,311.981,563.963,322.5
137,425.45,422.1
27,765.049,635.643,644.110,958.69,569.14,487.5
868.6164.6
22,839.7180.0110.3
4,243.01,952.3
0.025,701.312,232.718,273.22,436.2
831.0797.9
57.00.0
39.1922.0
5,507.55.5
554,764.867,160.2
2,446.9
10
6,308.233,307.032,407.0
899.90.0
26,362.010,060.212,904.710,367.72,537.03,397.21,056.42,340.8
0.0101,854.2
1,023.74,637.6
14,818.681,374.2
112.1284,393.780,149.164,857.2
139,387.45,441.6
27,857.750,429.144,352.811,306.18,545.94,551.4
721.9154.0
24,345.9197.8112.4
4,237.71,952.3
0.025,717.212,237.719,076.52,599.3
831.0797.9
57.20.0
39.0922.0
6,470.55.5
565,910.169,113.8
3,161.3
11
13,950.533,601.632,407.0
1,194.60.0
25,992.59,482.9
13,269.410,609.42,659.93,240.2
942.92,297.3
0.0102,546.8
570.54,850.7
17,849.079,276.7
109.6290,006.0
84,012.964,285.4
141,707.75,588.9
28,076.250,999.644,928.912,114.08,547.64,785.6
884.4226.8
25,129.1229.9106.9
3,234.31,742.7
0.025,739.812,178.620,278.12,594.9
831.0797.957.20.0
37.7927.5
5,963.00.0
580,499.971,903.14,043.0
12
4,965.433,440.932,107.0
1,333.90.0
26,531.910,288.511,150.29,031.12,119.15,093.21,096.53,995.5
1.1108,450.6
310.55,609.6
18,642.183,888.4
110.8318,447.695,153.466,659.8
156,634.45,910.4
29,301.456,173.250,324.114,925.46,833.65,228.4
833.6156.7
18,206.7186.3114.3
3,230.94,242.7
0.024,382.712,307.020,283.5
3,752.9831.0789.057.20.00.0
793.43,844.0
0.0598,021.075,295.2
3,531.1
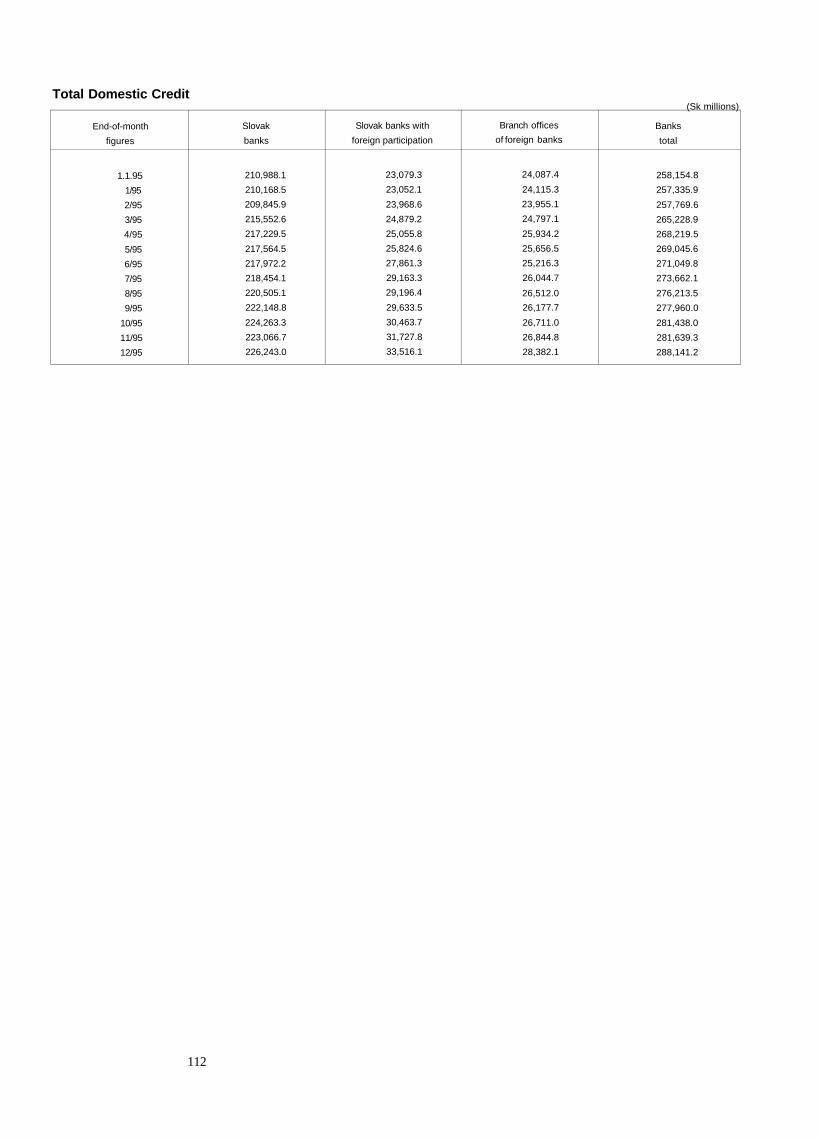
Total Domestic Credit(Sk millions)
End-of-month
figures
1.1.95
1/95
2/95
3/95
4/95
5/95
6/95
7/95
8/95
9/95
10/95
11/95
12/95
Slovak
banks
210,988.1
210,168.5
209,845.9
215,552.6
217,229.5
217,564.5
217,972.2
218,454.1
220,505.1
222,148.8
224,263.3
223,066.7
226,243.0
Slovak banks with
foreign participation
23,079.3
23,052.1
23,968.6
24,879.2
25,055.8
25,824.6
27,861.3
29,163.3
29,196.4
29,633.5
30,463.7
31,727.8
33,516.1
Branch offices
of foreign banks
24,087.4
24,115.3
23,955.1
24,797.1
25,934.2
25,656.5
25,216.3
26,044.7
26,512.0
26,177.7
26,711.0
26,844.8
28,382.1
Banks
total
258,154.8
257,335.9
257,769.6
265,228.9
268,219.5
269,045.6
271,049.8
273,662.1
276,213.5
277,960.0
281,438.0
281,639.3
288,141.2
112

Allocation of Bank Credit by Sector(Sk millions)
End-
of-month
figures
1.1.95
1/95
2/95
3/95
4/95
5/95
6/95
7/95
8/95
9/95
10/95
11/95
12/95
Total
258,154.8
257,335.9
257,769.6
265,228.9
268,219.5
269,045.6
271,049.8
273,662.1
276,213.5
277,960.0
281,438.0
281,639.3
288,141.2
Nonfinancial organizations
Total
215,898.3
215,581.6
216,903.6
220,031.7
223,092.6
223,867.1
227,204.5
228,800.8
230,559.5
232,117.3
234,646.8
234,654.9
242,782.8
Public
(state
and mu-
nicipal)
108,311.2
106,734.1
106,230.0
101,693.3
101,040.5
98,707.9
98,000.7
96,691.1
90,706.7
89,384.7
87,658.0
83,931.0
84,654.4
Private
(incl.
coopera-
tives)
102,543 8
103,705.7
105,566.0
113,294.0
116,838.0
119,725.4
123,342.4
126,031.5
133,750.0
136,705.0
140,682.3
143,500.4
150,113.5
Under
foreign
control
5,043.3
5,141.8
5,107.6
5,044.4
5,214.1
5,433.8
5,861.4
6,078.2
6,102.8
6,027.6
6,306.5
7,223.5
8,014.9
Financial institutions
Total
8,197.1
8,651.5
8,586.6
9,080.4
9,091.3
9,231.4
8,947.4
9,227.4
9,172.3
9,182.9
9,204.7
9,012.1
11,158.7
Public
(state
and mu-
nicipal)
6,485.6
6,484.2
6,485.5
6,394.5
6,476.3
6,478.4
6,226.6
6,226.1
6,226.1
6,225.6
6,224.8
6,223.4
8,285.1
Private
(incl.
coopera-
tives)
1,545.1
2,001.4
1,970.6
2,556.9
2,487.6
2,629.2
2,602.0
2,879.3
2,824.3
2,895.7
2,861.9
2,674.7
2,662.0
Under
foreign
control
166.4
165.9
130.5
129.0
127.4
123.8
118.8
122.0
121.9
61.6
118.0
114.0
211.6
Insurance companies
Total
565.8
235.3
28.8
43.1
53.8
151.4
167.4
203.3
209.9
208.7
225.1
216.1
248.1
Public
(state
and mu-
nicipal)
549.2
213.8
1.8
3.7
0.6
9.8
3.5
Private
(incl.
coopera-
tives)
16.6
21.5
28.8
43.1
52.0
151.4
163.7
203.3
209.3
208.7
215.3
216.1
244.6
Under
foreign
control
Government authorities
Total
5,324.3
4,729.8
4,519.7
4,323.2
4,048.3
4,167.5
3,557.1
3,899.7
4,388.9
4,589.5
4,619.6
4,460.2
4,358.9
Central
govern-
ment
(EBR)
3,428.0
2,817.9
2,609.9
2,435.2
2,126.9
2,160.7
1,499.9
1,785.0
2,277.7
2,472.1
2,425.3
2,275.3
2,200.6
Central
gov.:
public
funds
End-
of-month
figures
1.1.95
1/95
2/95
3/95
4/95
5/95
6/95
7/95
8/95
9/95
10/95
11/95
12/95
Government authorities
Central
gov.:
FNM
Local
govern-
ment
(EBR)
1,887.3
1,891.2
1,888.1
1,865.0
1,894.6
1,929.7
1,966.0
2,023.0
2,052.9
2,038.4
2,115.3
2,139.9
2,111.8
SIC-
Total
9.0
20.7
21.7
23.0
26.8
77.1
91.2
91.7
58.3
79.0
79.0
45.0
46.5
SIC-
Employ-
ment
fund
SIC-
Health
insu-
rance
9.0
20.7
21.7
23.0
26.8
77.1
91.2
91.7
58.3
79.0
79.0
45.0
46.5
SIC-
Sickness
insu-
rance
SIC-
Pension
fund
Nonprofit organizations
Total
191.0
189.4
182.8
223.4
183.1
168.1
160.3
157.1
129.1
127.7
126.9
243.9
245.0
Public
(state
and mu-
nicipal)
177.2
172.4
167.9
203.7
159.3
145.4
135.7
133.2
105.1
101.4
101.5
157.1
144.0
Private
(incl.
coopera-
tives)
13.8
17.0
14.9
19.7
23.8
21.6
24.6
23.9
24.0
21.3
20.4
81.8
96.5
Under
foreign
control
1 1
5.0
5.0
5.0
4.5
House -
holds
(entre-
preneurs)
10,512.0
10,614.5
10,577.4
10,589.9
10,746.3
10,411.7
9,875.2
10,146.9
10,370.6
10,416.0
10,438.9
11,183.6
12,340.5
Personal
sector
(private
accounts)
16,389.1
16,214.4
15,904.3
15,686.4
15,489.5
15,340.2
15,197.5
15,032.2
14,894.6
14,775.0
14,668.8
14,525.2
15,303.4
Abroad
(non-
resi-
dents)
1,039.6
1,100.2
1,046.5
1,057.0
1,110.0
1,097.6
1,103.1
1,171.3
1,131.5
1,113.6
1,117.9
1,120.9
1,281.7
Not
included
in
sectors
32.1
13.7
14.4
4,188.7
4,399.5
4,605.5
4,832.5
5,018.3
5,352.3
5,424.5
6,389.3
6,222.4
422.1
Organi-
zations
without
Reg. No.
5.5
5.5
5.5
5.1
5.1
5.1
4.8
5.1
4.8
4.8
EBR - Extrabudgetary resourcesSIC - Social Insurance FundFNM - National Property Fund
113

Short-Term Loans by Sector(Sk millions)
End-
of-month
figures
1.1.95
1/95
2/95
3/95
4/95
5/95
6/95
7/95
8/95
9/95
10/95
11/95
12/95
Total
96,039.8
96,278.7
96,596.6
104,097.9
105,922.6
106,114.0
108,770.7
111,154.8
111,944.6
112,504.2
113,849.7
112,685.6
105,754.1
Nonfinancial organizations
Total
90,879.0
91,740.9
92,454.5
95,613.4
97,614.5
97,532.1
100,632.2
102,185.4
101,970.6
102,477.6
103,478.0
102,348.2
101,244.2
Public
(state
and mu-
nicipal)
48,813.1
48,298.6
48,010.6
44,399.6
43,450.4
41,569.4
41,152.6
41,072.2
37,861.5
36,651.3
35,587.1
32,667.2
29,554.6
Private
(incl.
coopera-
tives)
38,160.2
39,398.9
40,396.6
47,311.3
49,976.6
51,620.5
54,792.3
56,002.4
59,541.5
61,353.0
63,565.9
64,883.1
66,185.6
Under
foreign
control
3,905.7
4,043.4
4,047.3
3,902.5
4,187.5
4,342.2
4,687.3
5,110.8
4,567.6
4,473.3
4,325.0
4,797.9
5,504.0
Financial institutions
Total
869.2
1,244.1
1,245.8
1,466.6
1,370.5
1,508.8
1,248.5
1,470.0
1,462.6
1,439.8
1,242.6
1,064.7
960.4
Public
(state
and mu-
nicipal)
1.4
1.3
90.5
172.3
174.4
18.2
17.7
17.7
17.2
16.4
15.0
Private
(incl.
coopera-
tives)
736.4
1,096.7
1,131.0
1,262.6
1,198.2
1,334.4
1,230.3
1,452.3
1,439.9
1,422.6
1,226.2
1,049.7
860.4
Under
foreign
control
131.4
147.4
113.5
113.5
5.0
100.0
Insurance companies
Total
549.2
213.8
1.8
3.7
0.6
9.8
3.5
Public
(state
and mu-
nicipal)
549.2
213.8
1.8
3.7
0.6
9.8
3.5
Private
(incl.
coopera-
tives)
Under
foreign
control
'
Government authorities
Total
1,074.5
924.7
820.2
656.6
352.3
383.7
240.7
536.0
1,008.4
1,224.8
1,164.5
988.6
1,095.5
Central
govern-
ment
(EBR)
898.4
798.5
698.4
523.7
215.4
249.2
98.6
383.7
876.4
1,070.8
1,024.0
874.0
964.7
Central
gov.:
public
funds
End-
of-month
figures
1.1.95
1/95
2/95
3/95
4/95
5/95
6/95
7/95
8/95
9/95
10/95
11/95
12/95
Government authorities
Central
gov.:
FNM
Local
govern-
ment
(EBR)
176.1
126.2
121.8
132.9
136.9
134.5
128.8
139.0
118.7
120.0
106.5
114.6
130.8
SIC-
Total
13.3
13.3
13.3
34.0
34.0
SIC-
Employ-
ment
fund
SIC-
Health
insu-
rance
13.3
13.3
13.3
34.0
34.0
SIC-
Sickness
insu-
rance
SIC-
Pension
fund
Nonprofit organizations
Total
39.1
40.5
37.9
80.6
41.7
32.5
27.6
27.3
26.3
23.1
25.3
35.1
33.5
Public
(state
and mu-
nicipal)
29.1
27.4
26.6
67.8
27.0
16.2
11.2
11.5
10.3
9.5
10.5
10.7
9.8
Private
(incl.
coopera-
tives)
10.0
13.1
11.3
12.8
14.7
15.2
16.4
15.8
16.0
13.6
14.8
24.4
23.7
Under
foreign
control
1.1
House -
holds
(entre-
preneurs)
2,285.2
1,708.7
1,693.6
1,757.8
1,826.2
1,742.7
1,476.9
1,585.9
1,816.1
1,624.3
1,662.0
1,750.1
1,710.2
Personal
sector
(private
accounts)
82.0
80.1
92.6
92.3
73.4
87.6
89.3
80.2
86.3
110.4
131.5
113.3
89.4
Abroad
(non-
resi-
dents)
252.2
316.9
242.9
246.7
247.5
233.2
233.8
277.3
247.9
226.0
224.4
223.4
253.3
Not
included
in
sectors
9.4
9.0
9.1
4,183.9
4,394.7
4,593.4
4,818.0
4,992.7
5,325.8
5,378.2
5,911.6
6,162.2
364.1
Organi-
zations
without
Reg. No.
EBR - Extrabudgetary resourcesSIC - Social Insurance FundFNM - National Property Fund
114

Medium-Term Loans by Sector(Sk millions)
End-
of-month
figures
1.1.95
1/95
2/95
3/95
4/95
5/95
6/95
7/95
8/95
9/95
10/95
11/95
12/95
Total
47,307.8
46,431.3
46,607.3
46,232.7
46,817.7
47,127.9
47,235 4
47,336.7
48,876.6
48,633.1
50,364 fl
51,266.9
57,437.1
Nonfinancial organizations
Total
34,932.7
34,189.1
34,507.5
33,780.9
34,213.3
34,243.3
34,816.8
34,725.8
36,225.1
36,232.8
37,852.3
38,793.9
43,902.3
Public
(state
and mu-
nicipal)
12,904.5
12,209.9
12,003.1
11,394.3
11,145.7
10,965.5
11,105.8
10,723.1
10,419.6
10,180.4
10,338.8
10,477.5
12,700.3
Private
(incl.
coopera-
tives)
21,049.3
21,068.4
21,610.1
21,428.6
22,243.1
22,411.3
22,772.8
23,259.6
24,418.7
24,721.3
25,750.5
26,561.2
29,436.2
Under
foreign
control
978.9
910.8
894.3
958.0
824.5
866.5
938.2
743.1
1,386.8
1,331.1
1,763.0
1,755.2
1,765.8
f
Total
803.7
883.2
816.6
1,269.8
1,376.8
1,378.6
1,450.5
1,509.0
1,461.3
1,099.7
1,183.9
955.2
1,079.2
Financial institutions
Public
(state
and mu-
nicipal)
Private
(incl.
coopera-
tives)
768.7
864.7
799.6
1,254.3
1,249.4
1,254.8
1,331.7
1,387.0
1,344.4
1,038.1
1,065.9
841.2
967.6
Under
foreign
control
35.0
18.5
17.0
15.5
127.4
123.8
118.8
122.0
116.9
61.6
118.0
114.0
111.6
Insurance companies
Total
16.6
21.5
28.8
43.1
52.0
151.4
163.7
203.3
209.3
208.7
215.3
216.1
204.1
Public
(state
and mu-
nicipal)
Private
(incl.
coopera-
tives)
16.6
21.5
28.8
43.1
52.0
151.4
163.7
203.3
209.3
208.7
215.3
216.1
204.1
Under
foreign
control
Government authorities
Total
3,985.9
3,537.8
3,432.9
3,420.0
3,454.1
3,541.3
3,078.8
3,126.2
3,142.5
3,122.7
3,181.1
3,213.5
2,991.2
Central
govern-
ment
(EBR)
2,529.6
2,019.4
1,911.5
1,911.5
1,911.5
1,911.5
1,401.3
1,401.3
1,401.3
1,401.3
1,401.3
1,401.3
1,235.9
Central
gov.:
public
funds
End-
of-month
figures
1.1.95
1/95
2/95
3/95
4/95
5/95
6/95
7/95
8/95
9/95
10/95
11/95
12/95
Government authorities
Central
gov.:
FNM
Local
govern-
ment
(EBR)
1,447.3
1,497.7
1,499.7
1,485.5
1,515.8
1,552.7
1,599.6
1,646.5
1,696.2
1,676.4
1,734.8
1,767.2
1,708.8
SIC-
Total
9.0
20.7
21.7
23.0
26.8
77.1
77.9
78.4
45.0
45.0
45.0
45.0
46.5
SIC-
Employ-
ment
fund
SIC-
Health
insu-
rance
9.0
20.7
21.7
23.0
26.8
77.1
77.9
78.4
45.0
45.0
45.0
45.0
46.5
SIC-
Sickness
insu-
rance
SIC-
Pension
fund
Nonprofit organizations
Total
45.1
57.5
57.0
56.0
57.2
53.8
51.5
51.5
51.9
54.2
53.4
87.7
91.2
Public
(state
and mu-
nicipal)
41.3
53.6
53.4
50.3
49.3
48.5
44.4
44.5
44.9
42.5
43.8
76.2
64.8
Private
(incl.
coopera-
tives)
3.8
3.9
3.6
5.7
7.9
5.3
7.1
7.0
7.0
6.7
4.6
6.5
21.9
Under
foreign
control
5.0
5.0
5.0
4.5
House -
holds
(entre-
preneurs)
4,713.8
4,983.9
5,080.9
5,009.3
5,008.5
5,098.6
5,001.8
5,026.9
5,108.6
5,214.0
5,155.2
5,250.4
6,083.3
Personal
sector
(private
accounts)
2,159.3
2,087.5
2,035.6
1,998.1
1,983.6
1,979.4
1,982.5
1,967.2
1,954.3
1,953.5
1,965.2
1,984.4
2,202.9
Abroad
(non-
resi-
dents)
622.5
660.6
637.2
645.6
662.3
664.3
670.5
696.1
692.3
696.4
701.9
705.5
824.9
Not
included
in
sectors
22.7
4.7
5.3
4.8
4.8
12.1
14.5
25.6
26.5
46.3
55.7
60.2
58.0
Organi-
zations
without
Reg. No.
5.5
5.5
5.5
5.1
5.1
5.1
4.8
5.1
4.8
4.8
EBR - Extrabudgetary resourcesSIC - Social Insurance FundFNM - National Property Fund
115

Long-Term Loans by Sector(Sk millions)
End-
of-month
figures
1.1.95
1/95
2/95
3/95
4/95
5/95
6/95
7/95
8/95
9/95
10/95
11/95
12/95
Total
114,807.2
114,625.9
114,565.7
114,898.3
115,479.2
115,803.7
115,043.7
115,170.6
115,392.3
116,822.7
117,224.3
117,686.8
124,950.0
Nonfinancial organizations
Total
90,086.6
89,651.6
89,941.6
90,637.4
91,264.8
92,091.7
91,755.5
91,889.6
92,363.8
93,406.9
93,316.5
93,512.8
97,636.3
Public
(state
and mu-
nicipal)
46,593.6
46,225.6
46,216.3
45,899.4
46,444.4
46,173.0
45,742.3
44,895.8
42,425.6
42,553.0
41,732.1
40,786.3
42,399.5
Private
(incl.
coopera-
tives)
43,334.3
43,238.4
43,559.3
44,554.1
44,618.3
45,693.6
45,777.3
46,769.5
49,789.8
50,630.7
51,365.9
52,056.1
54,491.7
Under
foreign
control
158.7
187.6
166.0
183.9
202.1
225.1
235.9
224.3
148.4
223.2
218.5
670.4
745.1
Total
6,524.2
6,524.2
6,524.2
6,344.0
6,344.0
6,344.0
6,248.4
6,248.4
6,248.4
6,643.4
6,778.2
6,992.2
9,119.1
Financial
Public
(state
and mu-
nicipal)
6,484.2
6,484.2
6,484.2
6,304.0
6,304.0
6,304.0
6,208.4
6,208.4
6,208.4
6,208.4
6,208.4
6,208.4
8,285.1
nstitutions
Private
(incl.
coopera-
tives)
40.0
40.0
40.0
40.0
40.0
40.0
40.0
40.0
40.0
435.0
569.8
783.8
834.0
Under
foreign
control
Insurance companies
Total
40.5
Public
(state
and mu-
nicipal)
Private
(incl.
coopera-
tives)
40.5
Under
foreign
control
Government authorities
Total
263.9
267.3
266.6
246.6
241.9
242.5
237.6
237.5
238.0
242.0
274.0
258.1
272.2
Central
govern-
ment
(EBR)
Central
gov.:
public
funds
End-
of-month
figures
1.1.95
1/95
2/95
3/95
4/95
5/95
6/95
7/95
8/95
9/95
10/95
11/95
12/95
Government authorities
Central
gov.:
FNM
Local
govern-
ment
(EBR)
263.9
267.3
266.6
246.6
241.9
242.5
237.6
237.5
238.0
242.0
274.0
258.1
272.2
SIC-
Total
SIC-
Employ-
ment
fund
SIC-
Health
insu-
rance
SIC-
Sickness
insu-
rance
SIC-
Pension
fund
Nonprofit organizations
Total
106.8
91.4
87.9
86.8
84.2
81.8
81.2
78.3
50.9
50.4
48.2
121.1
120.3
Public
(state
and mu-
nicipal)
106.8
91.4
87.9
85.6
83.0
80.7
80.1
•77.2
49.9
49.4
47.2
70.2
69.4
Private
(incl.
coopera
-tives)
1.2
1.2
1.1
1.1
1.1
1.0
1.0
1.0
50.9
50.9
Under
foreign
control
House -
holds
(entre-
preneurs)
3,513.0
3,921.9
3,802.9
3,822.8
3,911.6
3,570.4
3,396.5
3,534.1
3,445.9
3,577.7
3,621.7
4,183.1
4,547.0
Personal
sector
(private
accounts)
14,147.8
14,046.8
13,776.1
13,596.0
13,432.5
13,273.2
13,125.7
12,984.8
12,854.0
12,711.1
12,572.1
12,427.5
13,011.1
Abroad
(non-
resi-
dents)
164.9
122.7
166.4
164.7
200.2
200.1
198.8
197.9
191.3
191.2
191.6
192.0
203.5
Not
included
in
sectors
422.0
Organi-
zations
without
Reg. No.
EBR - Extrabudgetary resourcesSIC - Social Insurance FundFNM - National Property Fund
116

Credit and Loans to Selected Sectors(Sk millions)
End-of
-month
figures
1.1.95
1/95
2/95
3/95
4/95
5/95
6/95
7/95
8/95
9/95
10/95
11/95
12/95
Agricul.,
hunting,
and
fishing
17,281.5
16,543.3
17,217.7
17,766.1
19,643.3
19,589.0
18,715.9
18,707.7
18,908.7
18,696.7
18,826.7
18,359.3
18,308.8
Forestry
and
timber
industry
345.3
343.1
327.7
494.2
282.4
268.3
274.0
221.6
266.9
282.1
228.2
255.9
276.0
Raw
material
extrac-
tion
2,348.3
2,384.3
2,316.2
2,134.5
2,196.7
2,223.8
2,122.5
2,229.3
2,295.9
2,453.3
2,405.2
2,521.8
2,614.6
Manufacturing industries
Total
85,726.7
87,282.6
88,591.8
88,527.3
89,562.1
90,706.8
95,540.6
96,918.0
96,908.7
96,977.3
97,850.0
98,565.3
103,289.2
Food
industry
14,354.0
14,339.6
14,388.7
13,991.7
14,413.3
14,837.9
16,123.0
16,035.3
16,106.3
16,333.9
16,909.6
17,103.8
17,526.9
Chemical
and phar-
maceutical
industry
8,912.9
9,496.6
8,981.2
9,370.3
9,374.3
9,276.4
10,170.2
10,431.9
10,703.9
10,360.3
9,989.5
10,168.3
10,228.4
Metallurgy
and
machine
industry
35,212.7
36,033.9
36,750.8
36,376.2
36,480.2
37,647.9
39,505.9
40,164.5
40,126.3
39,546.2
40,355.0
40,789.8
43,289.2
Electrical
and
electronic
industry
6,004.5
5,913.0
6,082.7
6,070.1
6,150.2
6,494.8
6,808.3
6,865.4
7,257.2
7,364.4
7,435.8
7,453.6
7,467.5
Textile,
clothing,
leather
industry
5,192.2
5,284.4
5,635.9
5,842.7
5,811.1
5,772.9
6,074.4
6,049.0
6,139.8
6,222.0
6,058.1
6,116.2
6,127.0
Other
industries
16,050.4
16,215.1
16,752.5
16,876.3
17,333.0
16,676.9
16,858.8
17,371.9
16,575.2
17,150.5
17,102.0
16,933.6
18,650.2
Power
industry,
gas and
water
supply
14,533.6
16,564.0
16,339.2
16,266.6
16,215.0
16,242.9
15,801.1
16,141.2
15,131.9
16,264.3
16,571.2
16,160.2
18,171.1
Building
and
construc-
tion
19,598.9
18,582.5
18,824.4
18,928.2
19,216.8
19,224.9
19,302.7
19,313.7
19,405.1
19,273.3
19,370.2
19,673.7
19,446.5
End-
of-month
figures
1.1.95
1/95
2/95
3/95
4/95
5/95
6/95
7/95
8/95
9/95
10/95
11/95
12/95
Trade,
sales,
catering
and hotel
services
46,012.6
45,633.4
47,793.9
49,401.6
51,039.4
51,413.4
54,571.4
54,640.3
55,691.2
56,753.5
57,525.7
59,174.5
60,460.5
Tourism
592.9
725.9
548.3
668.2
525.9
467.2
475.6
506.0
485.9
520.6
489.0
511.3
533.4
Transport
and
telecom-
munication
3,258.8
2,439.3
2,343.4
2,249.2
2,702.8
3,017.8
4,151.6
4,050.0
4,158.0
4,123.5
4,042.2
4,083.6
3,560.8
Banking
and
finance
8197.1
8651.5
8586.6
9080.4
9091.3
9231.4
8947.4
9227.4
9172.3
9182.9
9204.7
9012.1
1,1158.7
Insu-
rance
sector
565.8
235.3
28.8
43.1
53.8
151.4
167.4
203.3
209.9
208.7
225.1
216.1
248.1
Other
sectors
59,693.3
57,950.7
54,851.6
59,669.5
57,690.0
56,508.7
50,979.6
51,503.6
53,579.0
53,223.8
54,699.8
53,105.5
50,073.5
Re-
search
and
deve-
lopment
450.5
622.6
659.9
669.3
729.2
576.4
603.4
610.6
659.0
653.1
637.4
637.9
647.8
Admin.,
defence,
compul.
social
insurance
5,178.2
4,659.9
4,541.9
4,356.2
4,043.9
4,097.0
3,510.1
3,664.0
4,132.9
4,357.3
4,539.8
4,522.6
4,253.9
NGOs,
church
org.,
political
parties
275.9
214.1
266.0
249.9
293.1
249.1
255.4
217.6
214.2
155.1
151.2
202.1
178.6
Recrea-
tion,
culture
and
sport
457.3
514.5
514.7
514.2
505.7
472.7
542.1
568.3
569.0
622.4
626.8
638.5
644.2
House-
holds
16,506.7
16,299.7
15,979.4
15,762.1
15,606.1
15,444.9
15,345.5
15,359.1
15,163.8
15,109.7
14,988.2
14,850.2
15,665.3
Other
36,824.7
35,639.9
32,889.7
38,117.8
36,512.0
35,668.6
30,723.1
31,084.0
32,840.1
32,326.2
33,756.4
32,254.2
28,683.7
117

Total Domestic Credit by Term(Sk millions)
End-of-month figures
1.1.95
1/95
2/95
3/95
4/95
5/95
6/95
7/95
8/95
9/95
10/95
11/95
12/95
Short-term
96,039.8
96,278.7
96,596.6
104,097.9
105,922.6
106,114.0
108,770.7
111,154.8
111,944.6
112,504.2
113,849.7
112,685.6
105,754.1
Medium-term
47,307.8
46,431.3
46,607.3
46,232.7
46,817.7
47,127.9
47,235.4
47,336.7
48,876.6
48,633.1
50,364.0
51,266.9
57,437.1
Long-term
114,807.2
114,625.9
114,565.7
114,898.3
115,479.2
115,803.7
115,043.7
115,170.6
115,392.3
116,822.7
117,224.3
117,686.8
124,950.0
Total
258,154.8
257,335.9
257,769.6
265,228.9
268,219.5
269,045.6
271,049.8
273,662.1
276,213.5
277,960.0
281,438.0
281,639.3
288,141.2
118

Total Deposits(Sk millions)
End-of-month
figures
1.1.95
1/95
2/95
3/95
4/95
5/95
6/95
7/95
8/95
9/95
10/95
11/95
12/95
Slovak
banks
198,555.2
193,177.3
196,570.0
196,814.5
198,510.5
197,485.0
198,903.5
201,198.7
208,556.0
209,087.0
211,579.9
217,088.0
238,577.3
Slovak banks with
foreign participation
31,481.1
30,344.4
31,706.1
31,270.1
32,351.6
35,016.2
36,164.5
38,854.1
39,565.3
40,764.1
41,401.5
42,924.7
52,211.5
Branch offices of
foreign banks
15,350.5
14,932.4
15,306.0
13,943.3
16,554.4
16,363.0
17,069.2
18,536.9
19,719.7
19,661.4
21,185.9
22,594.0
24,067.8
Banks
total
245,386.8
238,454.1
243,582.1
242,027.9
247,416.5
248,864.2
252,137.2
258,589.7
267,841.0
269,512.5
274,167.3
282,606.7
314,856.6
119

Total Deposits by Sector(Sk millions)
End-
of-month
figures
1.1.95
1/95
2/95
3/95
4/95
5/95
6/95
7/95
8/95
9/95
10/95
11/95
12/95
Total
245,386.8
238,454.1
243,582.1
242,027.9
247,416.5
248,864.2
252,137.2
258,589.7
267,841.0
269,512.5
274,167.3
282,606 7
314,856.6
Nonfinancial organizations
Total
63,568.4
58,958.3
59,336.9
56,754.8
58,946.8
57,367.8
58,739.4
60,115.1
64,883.2
64,518.8
64,377.6
66,948.9
80,449.9
Public
(state
and mu-
nicipal)
27,048.0
26,300.8
25,887.9
24,180.0
26,765.4
23,218.0
24,032.6
22,409.1
24,696.4
22,370.9
18,432.2
18,700.8
25,484.2
Private
(incl.
coopera-
tives)
33,613.0
30,564.2
30,920.8
30,409.2
29,991.4
32,014.0
32,400.7
34,708.7
37,265.1
39,202.9
42,837.0
44,821.5
50,563.3
Under
foreign
control
2,907.4
2,093.3
2,528.2
2,165.6
2,190.0
2,135.8
2,306.1
2,997.3
2,921.7
2,945.0
3,108.4
3,426.6
4,402.4
Financial institutions
Total
787.9
674.1
1,044.4
615.5
798.1
1,010.2
1,158.2
1,678.3
1,624.1
1,737.9
1,832.3
2,185.7
2,350.4
Public
(state
and mu-
nicipal)
219.5
38.2
348.5
108.8
129.0
173.6
89.4
114.1
218.3
163.6
157.1
292.8
118.1
Private
(incl.
coopera-
tives)
508.6
559.1
622.8
436.3
587.9
650.4
868.0
1,371.2
1,280.6
1,426.3
1,507.4
1,672.9
2,038.9
Under
foreign
control
59.8
76.8
73.1
70.4
81.2
186.2
200.8
193.0
125.2
148.0
167.8
220.0
193.4
Insurance companies
Total
16,388.7
16,368.6
16,751.8
17,323.5
17,558.2
17,866.3
17,296.4
17,357.0
17,553.7
17,616.8
17,416.3
17,312.9
17,227.4
Public
(state
and mu-
nicipal)
12,071.2
11,769.5
12,364.1
12,688.2
12,372.3
11,852.6
11,522.6
10,724.8
11,351.6
11,215.7
5,649.6
5,721.9
5,779.6
Private
(incl.
coopera-
tives)
4,317.4
4,599.0
4,387.3
4,609.8
5,160.5
5,970.2
5,735.5
6,607.6
6,138.5
6,321.4
11,612.3
11,417.8
11,216.5
Under
foreign
control
0.1
0.1
0.4
25.5
25.4
43.5
38.3
24.6
63.6
79.7
154.4
173.2
231.3
Government authorities
Total
17,260.5
16,074.5
18,230.5
17,268.9
19,240.3
18,918.1
18,726.4
20,803.2
23,527.2
23,712.4
25,789.7
28,767.0
31,963.8
Central
govern-
ment
(EBR)
12,159.2
10,762.0
10,602.1
9,177.7
10,543.6
9,586.4
9,904,7
10,044.7
9,927.7
12,334.0
13,388.8
16,987.0
17,678.6
Central
gov.:
public
funds
1,864.6
1,601.7
1,679.0
1,699.7
3,277.2
1,986.1
1,580.7
1,845.1
1,982.4
1,657.3
2,550.7
2,673.6
2,133.2
End-
of-month
figures
1.1.95
1/95
2/95
3/95
4/95
5/95
6/95
7/95
8/95
9/95
10/95
11/95
12/95
Government authorities
Central
gov.:
FNM
1,436.4
1,429.4
1,465.7
1,505.7
2,903.2
1,515.5
1,133.1
1,415.2
1,924.3
1,595.4
2,516.2
2,657.3
2,133.0
Local
govern-
ment
(EBR)
1,912.7
2,225.4
2,283.0
2,187.9
2,156.7
2,105.5
2,076.5
2,447.1
2,449.9
2,271.1
2,340.7
2,297.2
3,996.6
SIC-
Total
3,188.6
3,087.1
5,345.4
5,903.3
6,540.0
7,226.2
6,745.2
8,311.4
11,149.6
9,107.3
10,060.2
9,482.8
10,288.6
SIC-
Employ-
ment
fund
455.2
839.1
921.2
1,013.6
1,072.0
1,131.0
1,272.1
1,709.3
1,750.8
1,783.6
1,645.9
1,413.7
SIC-
Health
insu-
rance
515.6
951.6
1,640.6
2,080.2
2,203.4
2,249.9
1,752.9
2,317.9
2,340.6
1,844.3
2,128.9
2,915.6
2,200.5
SIC-
Sickness
insu-
rance
621.7
971.6
SIC-
Pension
fund
2,217.8
1,513.8
1,894.1
2,901.9
3,323.0
3,904.3
3 861 3
4,721.4
7,099.7
5,512.2
6,147.7
4,921.3
6,674.4
Nonprofit organizations
Total
11,380.8
8,929.8
9,079.5
9,672.2
9,002.1
9,334.1
9,886.6
10,212.3
9,765.2
10,017.5
9,867.6
9,789.4
10,422.3
Public
(state
and mu-
nicipal)
7,821.5
6,236.9
6,828.5
7,443.6
6,591.4
7,077.3
7,576.2
7,751.1
7,434.7
7,633.3
7,544.3
7,539.3
8,105.0
Private
(incl.
coopera-
tives)
3,555.3
2,686.9
2,165.8
2,166.2
2,369.7
2,226.0
2,278.3
2,430.9
2,305.4
2,378.7
2,320.4
2,244.6
2,304.7
Under
foreign
control
4.0
6.0
85.2
62.4
41.0
30 R
32.1
30.3
25.1
5.5
2.9
5.5
12.6
House -
holds
(entre-
preneurs)
4,390.4
4,005.5
4,156.6
4,390.1
4,442.5
4,766.1
4,580.5
4,969.7
5,602.8
5,837.3
6,049.4
6,278.8
5,862.2
Personal
sector
(private
accounts)
129,505.8
131,423.3
133,060.4
133,925.2
135,489.7
137,062.7
139,024.4
140,657.9
141,996.8
143,378.3
145,505.5
148,089.6
163,036.0
Abroad
(non-
resi-
dents)
499.7
462.3
503.9
579.4
498.9
529.3
555.1
583.2
567.4
554.9
633.0
703.9
606.0
Not
ncluded
in
sectors
1,571.7
1,524.4
1,386.9
1,466.1
1,407.7
1,988.9
2,143.1
2,151.6
2,165.8
2,046.2
2,525.1
2,395.3
2,883.4
Organi-
zations
without
Reg. No.
32.9
33.3
31.2
32.2
32.2
20.7
27.1
61.4
154.8
92.4
170.8
135.2
55.2
EBR - Extrabudgetary resourcesSIC - Social Insurance FundFNM - National Property Fund
120

Demand Deposits by Sector(Sk millions)
End-
of-month
figures
1.1.95
1/95
2/95
3/95
4/95
5/95
6/95
7/95
8/95
9/95
10/95
11/95
12/95
Total
106,264.6
96,897.6
98,316.3
96,618.6
101,906.9
101,422.2
101,945.2
106,994.9
111,664.1
112,251.4
113,575.5
120,091.1
135,686.7
Nonfinancial organizations
Total
47,732.6
41,897.7
41,725.0
39,546.7
42,343.9
42,146.8
42,141.8
43,260.9
45,237.2
47,245.1
46,520.8
48,925.7
58,631.8
Public
(state
and mu-
nicipal)
18,627.1
17,465.8
17,068.7
15,353.1
17,377.4
15,636.4
15 379.1
14,244.7
14,355.3
15,442.6
13,394.9
13,570.3
17,101.9
Private
(incl.
coopera-
tives)
26,573.6
22,723.4
22,503.5
22,689.0
23,434.1
24,870.2
24,988.5
26,892.6
28,859.5
29,705.4
30,757.4
32,697.5
38,171.6
Under
foreign
control
2,531.9
1,708.5
2,152.8
1,504.6
1,532.4
1,640.2
1,774.2
2,123.6
2,022.4
2,097.1
2,368.5
2,657.9
3,358.3
Financial institutions
Total
532.1
443.2
750.2
372.3
516.4
657.7
933.7
1,129.5
960.4
1,114.1
822.8
979.6
1,146.9
Public
(state
and mu-
nicipal)
217.5
15.9
326.5
41.4
61.6
106.2
64.0
88.7
215.9
161.2
154.7
280.2
115.7
Private
(incl.
coopera-
tives)
305.9
407.8
416.7
325.0
428.2
420.8
722.3
911.2
682.6
819.7
590.5
570.2
930.5
Under
foreign
control
8.7
19.5
7.0
5.9
26.6
130.7
147.4
129.6
61.9
133.2
77.6
129.2
100.7
Insurance companies
Total
1,610.7
1,542.0
1,987.2
2,474.0
2,818.4
2,214.7
1,770.6
1,454.8
1,637.0
1,842.0
1,292.8
1,269.2
1,546.9
Public
(state
and mu-
nicipal)
1,091.1
1,189.8
1,856.8
2,017.4
1,940.4
1,412.3
1,102.8
968.0
762.4
613.5
560.2
579.0
613.9
Private
(incl.
coopera-
tives)
519.5
352.1
130.0
456.1
877.6
798.9
664.5
482.2
872.0
1,224.8
644.2
685.0
896.8
Under
foreign
control
0.1
0.1
0.4
0.5
0.4
3.5
3.3
4.6
2.6
3.7
88.4
5.2
36.2
Government authorities
Total
11,203.5
9,740.3
10,124.7
10,241.3
12,126.8
11,288.2
11,109.7
13,589.7
15,999.7
13,492.3
15,399.8
18,715.6
21,800.6
Central
govern-
ment
(EBR)
6,892.1
5,520.5
4,108.9
3,678.7
4,790.0
3,342.7
3,592.1
4,149.2
4,325.3
4,019.4
4,980.9
8,827.0
11,152.8
Central
gov.:
public
funds
419.1
421.2
498.5
314.2
1,748.6
457.5
233.5
500.1
1,010.5
683.0
1,537.6
1,660.5
1,065.8
End-
of-month
figures
1.1.95
1/95
2/95
3/95
4/95
5/95
6/95
7/95
8/95
9/95
10/95
11/95
12/95
Government authorities
Central
gov.:
FNM
190.9
248.9
285.2
313.8
1,747.8
360.1
159.1
443.3
952.4
621.1
1,503.1
1,644.2
1,065.6
Local
govern-
ment
(EBR)
1,122.8
1,132.7
1,070.4
1,149.3
1,186.8
1,141.3
1,179.4
1,536.1
1,547.9
1,440.2
1,483.3
1,490.4
1,374.4
SIC-
Total
3,188.6
3,087.1
4,945.4
5,413.3
6,150.0
6,804.2
6,338.2
7,904.4
10,126.5
8,032.7
8,935 6
8,398.2
9,273.4
SIC-
Employ-
ment
fund
455.2
839.1
921.2
1,013.6
1,072.0
1,131.0
1,272.1
1,336.2
1,366.2
1,349.0
1,211.3
958.5
SIC-
Health
insu-
rance
515.6
951.6
1,240.6
1,590.2
1,813,4
1,827.9
1,345.9
1,910.9
1,690.6
1,154.3
1,438.9
2,265.6
1640.5
SIC-
Sickness
insu-
rance
621.7
971.6
SIC-
Pension
fund
2,217.8
1,513.8
1,894.1
2,901.9
3,323.0
3,904.3
3,861.3
4,721.4
7,099.7
5,512.2
6,147.7
4,921.3
6,674.4
Nonprofit organizations
Total
9,050.9
6,976.0
7,038.1
7,294.0
6,723.5
7,083.5
7,590.9
8,151.8
7,606.0
7,665.6
7,849.4
7,715.0
8,505.0
Public
(state
and mu-
nicipal)
6,442.1
5,135.0
5,642.9
5,964.6
5,209.8
5,658.9
6,164.7
6,632.6
6,120.1
6,156.9
6,348.0
6,252.7
7,049.1
Private
(incl.
coopera-
tives)
2,604.8
1,835.1
1,310.1
1,307.1
1,492.8
1,393.9
1,404.2
1,503.9
1,480.8
1,503.2
1,499.1
1,458.4
1,449.0
Under
foreign
control
4.0
5.9
85.1
22.3
20.9
30.7
22.0
15.3
5.1
5.5
2.3
3.9
6.9
House -
holds
(entre-
preneurs)
4,159.2
3,807.0
3,923.2
4,050.3
4,136.4
4,460.8
4,259.5
4,645.7
5,251.6
5,432.0
5,613.4
5,782.0
5,412.1
Personal
sector
(private
accounts)
31,488.5
32,024.2
32,322.7
32,099.7
32,829.0
33,157.6
33,611.8
34,196.2
34,296.8
34,783.5
34,866.1
35,500.7
37,360.0
Abroad
(non-
resi-
dents)
287.9
258.8
273.6
286.1
195.1
207.9
237.7
253.6
236.8
366.1
357.0
335.4
338.7
Not
included
in
sectors
178.3
200.3
165.1
246.9
200.9
198.7
263.9
271.7
357.5
272.4
781.9
837.1
916.0
Organi-
zations
without
Reg. No.
20.9
8.1
6.5
7.3
16.5
6.3
25.6
41.0
81.1
38.3
71.5
30.8
28.7
EBR - Extrabudgetary resourcesSIC - Social Insurance FundFNM - National Property Fund
121

Time Deposits by Sector(Sk millions)
End-
of-month
figures
1.1.95
1/95
2/95
3/95
4/95
5/95
6/95
7/95
8/95
9/95
10/95
11/95
12/95
Total
139,122.2
141,556.5
145,265.8
145,409.3
145,509.6
147,442.0
150,192.0
151,594.8
156,176.9
157,261.1
160,591.8
162,515.6
179,169.9
Nonfinancial organizations
Total
15,835.8
17,060.6
17,611.9
17,208.1
16,602.9
15,221.0
16,597.6
16,854.2
19,646.0
17,273.7
17,856.8
18,023.2
21,818.1
Public
(state
and mu-
nicipal)
8,420.9
8,835.0
8,819.2
8,826.9
9,388.0
7,581.6
8,653.5
8,164.4
10,341.1
6,928.3
5,037.3
5,130.5
8,382.3
Private
(incl.
coopera-
tives)
7,039.4
7,840.8
8,417.3
7,720.2
6,557.3
7,143.8
7,412.2
7,816.1
8,405.6
9,497.5
12,079.6
12,124.0
12,391.7
Under
foreign
control
375.5
384.8
375.4
661.0
657.6
495.6
531.9
873.7
899.3
847.9
739.9
768.7
1,044.1
Financial institutions
Total
255.8
230.9
294.2
243.2
281.7
352.5
224.5
548.8
663.7
623.8
1,009.5
1,206.1
1,203.5
Public
(state
and mu-
nicipal)
2.0
22.3
22.0
67.4
67.4
67.4
25.4
25.4
2.4
2.4
2.4
12.6
2.4
Private
(incl.
coopera-
tives)
202.7
151.3
206.1
111.3
159.7
229.6
145.7
460.0
598.0
606.6
916.9
1,102.7
1,108.4
Under
foreign
control
51.1
57.3
66.1
64.5
54.6
55.5
53.4
63.4
63.3
14.8
90.2
90.8
92.7
Insurance companies
Total
14,778.0
14,826.6
14,764.6
14,849.5
14,739.8
15,651.6
15,525.8
15,902.2
15,916.7
15,774.8
16,123.5
16,043.7
15,680.5
Public
(state
and mu-
nicipal)
10,980.1
10,579.7
10,507.3
10,670.8
10,431.9
10,440.3
10,419.8
9,756.8
10,589.2
10,602.2
5,089.4
5,142.9
5,165.7
Private
(incl.
coopera-
tives)
3,797.9
4,246.9
4,257.3
4,153.7
4,282.9
5,171.3
5,071.0
6,125.4
5,266.5
5,096.6
10,968.1
10,732.8
10,319.7
Under
foreign
control
25.0
25.0
40.0
35.0
20.0
61.0
76.0
66.0
168.0
195.1
Government authorities
Total
6,057.0
6,334.2
8,105.8
7,027.6
7,113.5
7,629.9
7,616.7
7,213.5
7,527.5
10,220.1
10,389.9
10,051.4
10,163.2
Central
govern-
ment
(EBR)
5,267.1
5,241.5
6,493.2
5,499.0
5,753.6
6,243.7
6,312.6
5,895.5
5,602.4
8,314.6
8,407.9
8,160.0
6,525.8
Central
gov.:
public
funds
1,445.5
1,180.5
1,180.5
1,385.5
1,528.6
1,528.6
1,347.2
1,345.0
,971.9
,974.3
1,013.1
1,013.1
1,067.4
End-
of-month
figures
1.1.95
1/95
2/95
3/95
4/95
5/95
6/95
7/95
8/95
9/95
10/95
11/95
12/95
Government authorities
Central
gov.:
FNM
1,245.5
1,180.5
1,180.5
1,191.9
1,155.4
1,155.4
974.0
971.9
971.9
974.3
1,013.1
1,013.1
1,067.4
Local
govern-
ment
(EBR)
789.9
1,092.7
1,212.6
1,038.6
969.9
964.2
897.1
911.0
902.0
830.9
857.4
806.8
2,622.2
SIC-
Total
400.0
490.0
390.0
422.0
407.0
407.0
1,023.1
1,074.6
1,124.6
1,084.6
1,015.2
SIC-
Employ-
ment
fund
373.1
384.6
434.6
434.6
455.2
SIC-
Health
insu-
rance
400.0
490.0
390.0
422.0
407.0
407.0
650.0
690.0
690.0
650.0
560.0
SIC-
Sickness
insu-
rance
SIC-
Pension
fund
Nonprofit organizations
Total
2,329.9
1,953.8
2,041.4
2,378.2
2,278.6
2,250.6
2,295.7
2,060.5
2,159.2
2,351.9
2,018.2
2,074.4
1,917.3
Public
(state
and mu-
nicipal)
1,379.4
1,101.9
1,185.6
1,479.0
1,381.6
1,418.4
1,411.5
1,118.5
1,314.6
1,476.4
1,196.3
1,86.6
1,055.9
Private
(incl.
coopera-
tives)
950.5
851.8
855.7
859.1
876.9
832.1
874.1
927.0
824.6
875.5
821.3
786.2
855.7
Under
foreign
control
0.1
0.1
40.1
20.1
0.1
10.1
15.0
20.0
0.6
1.6
5.7
House -
holds
(entre-
preneurs)
231.2
198.5
233.4
339.8
306.1
305.3
321.0
324.0
351.2
405.3
436.0
496.8
450.1
Personal
sector
(private
accounts)
98,017.3
99,399.1
100,737.7
101,825.5
102,660.7
103,905.1
105,412.6
106,461.7
107,700.0
108,594.8
110,639.4
112,588.9
125,676.0
Abroad
(non-
resi-
dents)
211.8
203.5
230.3
293.3
303.8
321.4
317.4
329.6
330.6
188.8
276.0
368.5
267.3
Not
included
in
sectors
1,393.4
1,324.1
1,221.8
1,219.2
1,206.8
1,790.2
1,879.2
1,879.9
1,808.3
1,773.8
1,743.2
1,558.2
1,967.4
Organi-
zations
without
Reg. No.
12.0
25.2
24.7
24.9
15.7
14.4
1.5
20.4
73.7
54.1
99.3
104.4
26.5
EBR - Extrabudgetary resourcesSIC - Social Insurance FundFNM - National Property Fund
122

Short-Term Deposits by Sector(Sk millions)
End-
of-month
figures
1.1.95
1/95
2/95
3/95
4/95
5/95
6/95
7/95
8/95
9/95
10/95
11/95
12/95
Total
73,865.2
77,136.3
78,925.8
78,257.0
77,138.6
77,017.3
78,384.1
77,586.1
80,754.7
80,594.3
82,304.8
82,673.3
90,639.0
Nonfinancial organizations
Total
14,731.0
15,954.9
16,502.5
16,143.1
15,095.8
13,590.0
14,903.2
14,691.9
17,426.5
14,963.0
15,208.4
15,284.6
18,795.9
Public
(state
and mu-
nicipal)
8,007.4
8,400.8
8,377.2
8,419.5
8,810.5
6,972.9
8,013.0
7,527.7
9,656.7
6,303.0
4,433.6
4,541.3
7,762.0
Private
(incl.
coopera-
tives)
6,349.1
7,170.3
7,750.9
7,063.6
5,638.7
6,135.5
6,373.3
6,765.9
7,346.6
8,288.4
10,413.3
10,353.0
10,287.2
Under
foreign
control
374.5
383.8
374.4
660.0
646.6
481.6
516.9
398.3
423.2
371.6
361.5
390.3
746.7
Financial institutions
Total
255.8
229.5
294.2
243.2
281.7
322.5
194.5
517.8
621.7
483.0
795.7
934.7
950.0
Public
(state
and mu-
nicipal)
2.0
22.0
22.0
67.4
67.4
67.4
25.4
25.4
2.4
2.4
2.4
12.6
2.4
Private
(incl.
coopera-
tives)
202.7
150.2
206.1
111.3
159.7
199.6
115.7
429.0
556.0
465.8
703.1
831.3
854.9
Under
foreign
control
51.1
57.3
66.1
64.5
54.6
55.5
53.4
63.4
63.3
14.8
90.2
90.8
92.7
Insurance companies
Total
5,653.3
6,304.1
6,040.8
6,059.3
5,887.2
5,971.1
5,925.0
5,286.6
4,783.0
4,604.3
5,028.8
4,914.0
4,313.0
Public
(state
and mu-
nicipal)
2,746.6
2,964.9
2,691.2
2,803.3
2,613.0
1,990.0
1,968.1
1,303.6
1,519.6
1,528.2
,536.8
,588.9
604.6
Private
(incl.
coopera-
tives)
2,906.7
3,339.2
3,349.6
3,256.0
3,274.2
3,966.1
3,946.9
3,973.0
3,212.4
3,010.1
4,436.0
4,167.1
3,523.3
Under
foreign
control
15 0
10.0
10.0
51.0
66.0
56.0
158.0
185.1
Government authorities
Total
4,083.2
4,275.1
6,050.0
4,958.7
4,864.1
5,365.7
5,270.4
4,848.5
5,361.2
7,839.5
7,890.7
7,515.3
7,542.7
Central
govern-
ment
(EBR)
3,317.7
3,207.0
4,459.1
3,452.8
3,524.0
4,014.0
3,998.1
3,563.8
3,472.7
5,981.3
6,012.3
5,726.7
4,034.0
Central
gov.:
public
funds
355.7
55.7
55.8
249.3
378.1
378.1
377.3
377.2
4.1
4.1
End-
of-month
figures
1.1.95
1/95
2/95
3/95
4/95
5/95
6/95
7/95
8/95
9/95
10/95
11/95
12/95
Government authorities
Central
gov.:
FNM
155.7
55.7
55.8
55.7
4.9
4.9
4.1
4.1
4.1
4.1
Local
govern-
ment
(EBR)
765.5
1,068.1
1,190.9
1,015.9
950.1
939.7
875.3
887.7
875.4
793.6
813.8
764.0
2,553.5
SIC-
Total
400.0
490.0
390.0
412.0
397.0
397.0
1,013.1
1,064.6
1,064.6
1,024.6
955.2
SIC-
Employ-
ment
fund
373.1
384.6
384.6
384.6
405.2
SIC-
Health
insu-
rance
400.0
490.0
390.0
412.0
397.0
397.0
640.0
680.0
680.0
640.0
550.0
SIC-
Sickness
insu-
rance
SIC-
Pension
fund
Nonprofit organizations
Total
1,896.4
1,586.2
1,633.7
1,977.4
1,841.9
1,796.5
1,816.3
1,568.6
1,579.2
1,721.8
1,437.3
1,470.3
1,305.3
Public
(state
and mu-
nicipal)
1,157.4
861.8
936.2
1,231.4
1,100.7
1,135.0
1,093.2
790.8
975.2
1,086.7
849.3
923.2
603.2
Private
(incl.
coopera-
tives)
739.0
724.3
697.4
705.9
721.1
661.4
713.0
762.8
584.0
635.1
587.4
546.9
696.4
Under
foreign
control
0.1
0.1
40.1
20.1
0.1
10.1
15.0
20.0
0.6
0.2
5.7
House -
holds
(entre-
preneurs)
221.5
190.5
218.4
251.2
207.1
184.7
180.0
184.6
210.1
223.9
208.6
266.9
214.9
Personal
sector
(private
accounts)
45,419.2
47,049.6
46,725.1
47,108.1
47,476.1
47,701.4
47,937.3
48,302.3
48,606.1
48,796.8
49,679.7
50,305.9
55,298.7
Abroad
(non-
resi-
dents)
202.0
203.5
221.3
284.4
276.8
293.7
289.7
300.5
300.9
158.3
244.6
336.7
242.9
Not
included
in
sectors
1,390.8
1,317.7
1,215.2
1,206.8
1,192.2
1,777.4
1,866.3
1,865.0
1,793.9
1,751.2
1,713.3
1,542.1
1,950.7
Organi-
zations
without
Reg. No.
12.0
25.2
24.6
24.8
15.7
14.3
1.4
20.3
72.1
52.5
97.7
102.8
24.9
EBR - Extrabudgetary resourcesSIC - Social Insurance FundFNM - National Property Fund
123

Medium-Term Deposits by Sector(Sk millions)
End-
of-month
figures
1.1.95
1/95
2/95
3/95
4/95
5/95
6/95
7/95
8/95
9/95
10/95
11/95
12/95
Total
51,739.7
55,888.6
52,364.2
52,829.7
53,719.8
55,192.4
56,335.0
58,286.5
59,234.2
60,096.3
61,255.6
62,091.9
67,921.8
Nonfinancial organizations
Total
1,066.0
1,067.0
1,070.8
1,025.4
1,329.0
1,422.9
1,482.6
1,949.8
2,005.6
2,100.8
2,430.5
2,519.9
2,805.1
Public
(state
and mu-
nicipal)
391.5
412.2
420.0
385.4
420.3
451.0
481.2
476.8
524.0
464.3
442.2
426.8
475.7
Private
(incl.
coopera-
tives)
673.5
653.8
649.8
639.0
897.7
960.9
989.4
1,000.6
1,008.5
1,163.2
1,612.9
1,717.7
2,035.0
Under
foreign
control
1.0
1.0
1.0
1.0
11.0
11.0
12.0
472.4
473.1
473.3
375.4
375.4
294.4
Total
0.5
30.0
30.0
31.0
42.0
40.0
106.2
156.2
133.4
Financial institutions
Public
(state
and mu-
nicipal)
0.3
Private
(incl.
coopera-
tives)
0.2
30.0
30.0
31.0
42.0
40.0
106.2
156.2
133.4
Under
foreign
control
Insurance companies
Total
8,916.6
8,314.5
8,515.8
8,582.2
8,644.6
9,472.5
9,392.8
10,407.6
10,925.7
10,962.5
10,886.7
10,921.7
10,959.5
Public
(state
and mu-
nicipal)
8,072.8
7,454.1
7,655.4
7,706.8
7,658.2
8,289.6
8,291.0
8,292.5
8,908.9
8,913.3
4,391.9
4,393.3
4,400.4
Private
(incl.
coopera-
tives)
843.8
860.4
860.4
850.4
961.4
1,157.9
1,076.8
2,105.1
2,006.8
2,039.2
6,484.8
6,518.4
6,549.1
Under
foreign
control
25.0
25.0
25.0
25.0
10.0
10.0
10.0
10.0
10.0
10.0
Government authorities
Total
1,101.6
1,151.8
1,148.5
1,149.1
1,301.1
1,305.8
1,372.3
1,373.5
1,174.8
1,385.5
1,439.1
1,475.7
1,601.4
Central
govern-
ment
(EBR)
1,077.8
1,127.8
1,127.4
1,127.0
1,281.9
1,281.9
1,351.1
1,351.1
1,148.8
1,348.8
1,346.1
1,383.5
1,483.3
Central
gov.:
public
funds
237.4
237.4
237.3
236.4
241.4
241.4
64.4
64.4
64.4
63.5
60.7
60.7
58.9
End-
of-month
figures
1.1.95
1/95
2/95
3/95
4/95
5/95
6/95
7/95
8/95
9/95
10/95
11/95
12/95
Government authorities
Central
gov.:
FNM
237.4
237.4
237.3
236.4
241.4
241.4
64.4
64.4
64.4
63.5
60.7
60.7
58.9
Local
govern-
ment
(EBR)
23.8
24.0
21.1
22.1
19.2
23.9
21.2
22.4
26.0
36.7
43.0
42.2
68.1
SIC-
Total
50.0
50.0
50.0
SIC-
Employ-
ment
fund
50.0
50.0
50.0
SIC-
Health
insu-
rance
SIC-
Sickness
insu-
rance
SIC-
Pension
fund
Nonprofit organizations
Total
433.1
367.1
407.2
400.3
435.7
453.2
478.4
490.9
579.1
629.2
580.0
603.2
513.9
Public
(state
and mu-
nicipal)
221.6
239.6
248.9
247.1
279.9
282.5
317.3
326.7
338.5
388.8
346.1
362.5
354.6
Private
(incl.
coopera-
tives)
211.5
127.5
158.3
153.2
155.8
170.7
161.1
164.2
240.6
240.4
233.9
239.3
159.3
Under
foreign
control
1.4
House -
holds
(entre-
preneurs)
9.7
8.0
15.0
88.6
99.0
120.6
141.0
,139.4
141.1
181.4
227.4
229.9
235.2
Personal
sector
(private
accounts)
40,200.3
44,973.3
41,191.2
41,562.7
41,868.8
42,346.8
43,397.2
43,850.2
44,320.2
44,742.2
45,522.8
46,135.8
51,630.9
Abroad
(non-
resi-
dents)
9.8
9.0
8.9
27.0
27.7
27.7
29.1
29.7
30.5
31.4
31.8
24.4
Not
included
in
sectors
2.6
6.4
6.6
12.4
14.6
12.8
12.9
14.9
14.4
22.6
29.9
16.1
16.4
Organi-
zations
without
Reg. No.
0.1
0.1
0.1
0.1
0.1
1.6
1.6
1.6
1.6
1.6
EBR - Extrabudgetary resourcesSIC - Social Insurance FundFNM - National Property Fund
124

Long-Term Deposits by Sector(Sk millions)
End-
of-month
figures
1.1.95
1/95
2/95
3/95
4/95
5/95
6/95
7/95
8/95
9/95
10/95
11/95
12/95
Total
13,517.3
8,531.6
13,975.8
14,322.6
14,651.2
15,232.3
15,472.9
15,722.2
16,188.0
16,570.5
17,031.4
17,750.4
20,609.1
Nonfinancial organizations
Total
38.8
38.7
38.6
39.6
178.1
208.1
211.8
212.5
213.9
209.9
217.9
218.7
217.1
Public
(state
and mu-
nicipal)
22.0
22.0
22.0
22.0
157.2
157.7
159.3
159.9
160.4
161.0
161.5
162.4
144.6
Private
(incl.
coopera-
tives)
16.8
16.7
16.6
17.6
20.9
47.4
49.5
49.6
50.5
45.9
53.4
53.3
69.5
Under
foreign
control
3.0
3.0
3.0
3.0
3.0
3.0
3.0
3.0
Total
0.9
100.8
107.6
115.2
120.1
Financial institutions
Public
(state
and mu-
nicipal)
Private
(incl.
coopera-
tives)
0.9
100.8
107.6
115.2
120.1
Under
foreign
control
Insurance companies
Total
208.1
208.0
208.0
208.0
208.0
208.0
208.0
208.0
208.0
208.0
208.0
208.0
408.0
Public
(state
and mu-
nicipal)
160.7
160.7
160.7
160.7
160.7
160.7
160.7
160.7
160.7
160.7
160.7
160.7
160.7
Private
(incl.
coopera-
tives)
47.4
47.3
47.3
47.3
47.3
47.3
47.3
47.3
47.3
47.3
47.3
47.3
247.3
Under
foreign
control
Government authorities
Total
872.2
907.3
907.3
919.8
948.3
958.4
974.0
991.5
991.5
995.1
1,060.1
1,060.4
1,019.1
Central
govern-
ment
(EBR)
871.6
906.7
906.7
919.2
947.7
947.8
963.4
980.6
980.9
984.5
1,049.5
1,049.8
1,008.5
Central
gov.:
public
funds
852.4
887.4
887.4
899.8
909.1
909.1
905.5
903.4
903.4
906.7
952.4
952.4
1,008.5
End-
of-month
figures
1.1.95
1/95
2/95
3/95
4/95
5/95
6/95
7/95
8/95
9/95
10/95
11/95
12/95
Government authorities
Central
gov.:
FNM
852.4
887.4
887.4
899.8
909.1
909.1
905.5
903.4
903.4
906.7
952.4
952.4
1,008.5
Local
govern-
ment
(EBR)
0.6
0.6
0.6
0.6
0.6
0.6
0.6
0.9
0.6
0.6
0.6
0.6
0.6
SIC-
Total
10.0
10.0
10.0
10.0
10.0
10.0
10.0
10.0
SIC-
Employ-
ment
fund
SIC-
Health
insu-
rance
10.0
10.0
10.0
10.0
10.0
10.0
10.0
10.0
SIC-
Sickness
insu-
rance
SIC-
Pension
fund
Nonprofit organizations
Total
0.4
0.5
0.5
0.5
1.0
0.9
1.0
1.0
0.9
0.9
0.9
0.9
98.1
Public
(state
and mu-
nicipal)
0.4
0.5
0.5
0.5
1.0
0.9
1.0
1.0
0.9
0.9
0.9
0.9
98.1
Private
(incl.
coopera-
tives)
Under
foreign
control
House -
holds
(entre-
preneurs)
Personal
sector
(private
accounts)
12,397.8
7,376.2
12,821.4
13,154.7
13,315.8
13,856.9
14,078.1
14,309.2
14,773.7
15,055.8
15,436.9
16,147.2
18,746.4
Abroad
(non-
resi-
dents)
Not
included
in
sectors
0.3
Organi-
zations
without
Reg. No.
EBR - Extrabudgetary resourcesSIC - Social Insurance FundFNM - National Property Fund
125

Short-Term Deposits by Term(Sk millions)
End-
of-month
figures
1.1.95
1/95
2/95
3/95
4/95
5/95
6/95
7/95
8/95
9/95
10/95
11/95
12/95
Total
73,865.2
77,136.3
78,925.8
78,257.0
77,138.6
77,017.3
78,384.1
77,586.1
80,754.7
80,594.3
82,304.8
82,673.3
90,639.0
1 month
or
less
7,858.8
9,756.9
10,381.1
8,373.6
6,970.0
6,851.7
7,707.8
6,597.4
6,540.7
6,316.4
6,348.1
7,181.9
13,319.7
3 months
or
less
8,467.9
7,759.1
8,191.0
8,866.3
7,907.2
7,300.0
6,510.2
6,630.9
7,061.5
6,441.0
7,168.3
6,534.7
6,137.6
6 months
or
less
6,552.1
7,528.7
8,730.9
7,727.1
6,914.0
6,452.7
6,623.2
6,201.9
7,101.0
7,521.6
7,502.1
7,246.3
5,937.8
9 months
or
less
709.2
702.2
774.7
865.4
3,005.4
3,059.0
3,087.0
3,238.3
3,860.7
3,854.3
3,688.5
3,417.0
1,363.3
1 year
or
less
7,337.6
7,129.7
7,307.3
8,754.8
8,884.5
9,386.2
10,000.2
10,291.2
11,243.3
11,000.5
11,526.1
11,620.3
11,976.1
Short-term
savings
deposits
42,455.6
43,590.1
42,865.7
43,019.4
43,246.3
43,693.8
44,159.6
44,384.7
44,709.3
45,008.1
45,793.0
46,329.6
51,544.2
Short-term
guarantee
deposits
484.0
669.6
675.1
650.4
211.2
273.9
296.1
241.7
238.2
452.4
278.7
343.5
360.3
126

Medium-
End-
of-month
figures
1.1.95
1/95
2/95
3/95
4/95
5/95
6/95
7/95
8/95
9/95
10/95
11/95
12/95
and Long-Term Deposits by Term
Medium-Term Deposits
Total
51,739.7
55,888.6
52,364.2
52,829.7
53,719.8
55,192.4
56,335.0
58,286.5
59,234.2
60,096.3
61,255.6
62,091.9
67,921.8
2 years or
less
3,134.5
5,983.6
6,194.0
6,322.1
6,723.2
7,333.6
7,730.6
8,832.0
9,309.6
9,695.8
9,980.3
10,205.6
10,604.7
3 years or
less
117.3
116.5
119.2
121.7
170.1
174.4
176.7
639.2
639.0
666.5
765.3
772.9
782.9
4 years or
less
8,889.9
5,486.3
5,495.7
5,510.3
5,673.9
5,642.9
5,670.9
5,685.2
5,764.3
5,790.7
5,841.5
5,864.1
5,883.6
Savings
deposits
39,465.1
44,167.0
40,354.7
40,663.2
40,922.4
41,801.5
42,493.5
42,867.9
43,270.9
43,647.6
44,355.5
44,932.0
50,327.4
Guarantee
deposits
132.9
135.2
200.6
212.4
230.2
240.0
263.3
262.2
250.4
295.7
313.0
317.3
323.2
(Sk millions
Long-Term Deposits
Total
13,517.3
8,531.6
13,975.8
14,322.6
14,651.2
15,232.3
15,472.9
15,722.2
16,188.0
16,570.5
17,031.4
17,750.4
20,609.1
5 years
or less
4,545.6
4,537.1
4,524.2
4,530.2
4,544.5
4,537.9
4,552.1
4,563.6
4,561.6
4,559.6
4,599.7
4,503.3
4,291.4
5 years
or more
694.9
1,665.6
729.0
727.2
874.1
910.9
907.2
908.9
909.9
1,015.0
1,081.6
1,089.1
1,351.2
Savings
deposits
8,241.9
2,293.5
8,687.2
9,030.1
9,197.5
9,745.0
9,972.1
10,208.3
10,674.2
10,958.5
11,306.0
12,113.9
14,925.4
Guarantee
deposits
34.9
35.4
35.4
35.1
35.1
38.5
41.5
41.4
42.3
37.4
44.1
44.1
41.1
127
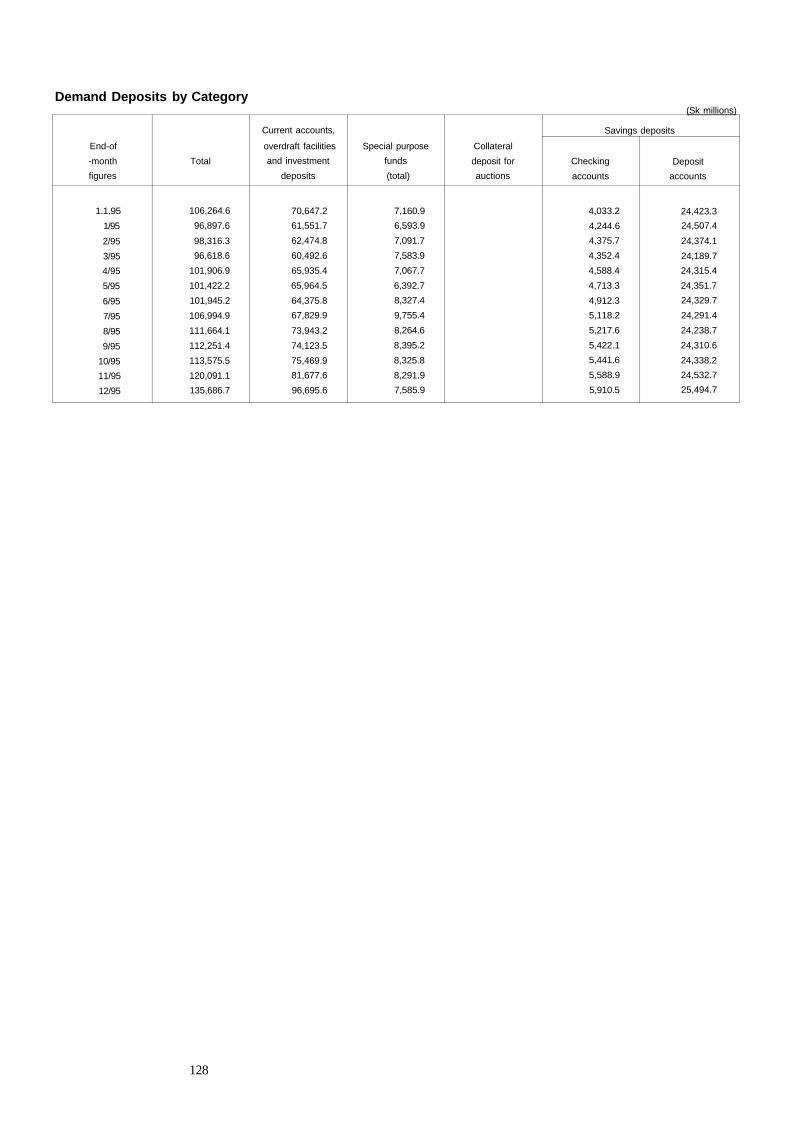
Demand Deposits by Category(Sk millions)
End-of
-month
figures
1.1.95
1/95
2/95
3/95
4/95
5/95
6/95
7/95
8/95
9/95
10/95
11/95
12/95
Total
106,264.6
96,897.6
98,316.3
96,618.6
101,906.9
101,422.2
101,945.2
106,994.9
111,664.1
112,251.4
113,575.5
120,091.1
135,686.7
Current accounts,
overdraft facilities
and investment
deposits
70,647.2
61,551.7
62,474.8
60,492.6
65,935.4
65,964.5
64,375.8
67,829.9
73,943.2
74,123.5
75,469.9
81,677.6
96,695.6
Special purpose
funds
(total)
7,160.9
6,593.9
7,091.7
7,583.9
7,067.7
6,392.7
8,327.4
9,755.4
8,264.6
8,395.2
8,325.8
8,291.9
7,585.9
Collateral
deposit for
auctions
Savings deposits
Checking
accounts
4,033.2
4,244.6
4,375.7
4,352.4
4,588.4
4,713.3
4,912.3
5,118.2
5,217.6
5,422.1
5,441.6
5,588.9
5,910.5
Deposit
accounts
24,423.3
24,507.4
24,374.1
24,189.7
24,315.4
24,351.7
24,329.7
24,291.4
24,238.7
24,310.6
24,338.2
24,532.7
25,494.7
128

Deposits - Selected Sectors(Sk millions)
End-
of-month
figures
1.1.95
1/95
2/95
3/95
4/95
5/95
6/95
7/95
8/95
9/95
10/95
11/95
12/95
Agricul.,
hunting,
and
fishing
3,413.8
2,044.3
1,971.3
2,098.0
2,104.6
1,970.6
2,109.4
2,344.9
2,451.5
2,368.0
2,446.3
2,540.4
2,774.3
Forestry
and
timber
industry
395.7
453.7
520.6
548.2
570.7
508.7
834.3
759.8
886.1
774.5
836.7
707.8
722.2
Raw
material
extrac-
tion
2,038.4
776.7
721.5
609.5
587.2
459.5
520.7
856.7
813.4
762.3
656.8
521.1
846.5
Manufacturing industries
Total
9,983.7
11,705.6
11,767.8
12,384.2
11,644.6
11,722.6
12,216.7
11,879.5
14,363.7
15,442.1
16,876.0
16,975.2
19,618.9
Food
industry
1,275.3
967.9
1090.8
947.7
924.1
1,117.0
1,148.8
1,116.7
1,167.3
1,631.8
2,248.8
1,687.7
1,911.3
Chemical
and phar-
maceut.
industry
2,547.8
3,038.2
2,742.5
3,592.3
2,954.6
2,340.2
2,239.2
1,983.0
2,675.6
3,258.4
2,975.3
3,496.1
4,112.0
Metallurgy
and
machine
industry
2,960.9
3,619.1
3,850.7
3,896.4
3,638.6
3,922.1
4,433.0
4,267.1
5,642.5
5,238.0
6,148.2
6,369.6
7,303.7
Electrical
and
electronic
industry
769.6
993.1
1,091.6
933.3
899.9
797.5
1,032.8
1,163.1
1,102.1
1,048.8
1,257.7
1,144.8
1,545.7
Textile,
clothing,
leather
industry
1,024.0
952.4
785.4
703.8
720.9
688.1
841.8
889.2
840.3
1,071.0
966.2
919.9
1,032.8
Other
industries
1,406.1
2,134.9
2,206.8
2,310.7
2,506.5
2,857.7
2,521.1
2,460.4
2,935.9
3,194.1
3,279.8
3,357.1
3,713.4
Power
industry,
gas and
water
supply
2,451.4
1,914.3
1,822.6
2,071.1
1,665.4
1,578.2
3,370.6
3,180.6
2,972.7
4,055.4
3,672.1
3,437.0
5,154.5
Building
and
constr.
2,906.2
4,015.9
3,598.3
3,333.2
4,058.2
3,871.4
3,686.1
3,576.3
4,116.7
4,217.5
4,274.6
4,317.0
8,566.4
End-
of-month
figures
1.1.95
1/95
2/95
3/95
4/95
5/95
6/95
7/95
8/95
9/95
10/95
11/95
12/95
Trade,
sales,
catering
and hotel
services
13,193.1
13,177.5
14,192.5
13,919.0
14,413.8
13,984.2
14,058.2
15,177.2
15,965.1
17,202.0
17,812.3
19,537.7
21,950.2
Tourism
2,704.9
292.1
268.3
294.5
427.2
385.4
390.8
403.4
357.5
288.9
260.5
256.7
287.3
Transport
and
telecom-
munications
663.8
865.1
808.3
777.9
709.0
1,480.7
1,732.3
1,385.9
1,198.1
1,549.3
1,423.3
1,614.7
1,527.5
Bank-
ing
and
finance
787.9
674.1
1,044.4
615.5
798.1
1,010.2
1,158.2
1,678.3
1,624.1
1,737.9
1,832.3
2,185.7
2,350.4
Insu-
rance
sector
16,388.7
16,368.6
16,751.8
17,323.5
17,558.2
17,866.3
17,296.4
17,357.0
17,553.7
17,616.8
17,416.3
17,312.9
17,227.4
Other
sectors
190,459.2
186,166.2
190,114.7
188,053.3
192,879.5
194,026.4
194,763.5
199,990.1
205,538.4
203,497.8
206,660.1
213,200.5
233,831.0
Re-
search
and
deve-
lopment
1,272.2
1,338.6
922.5
1,293.5
1,026.2
844.0
727.7
595.3
513.6
625.4
626.7
596.0
693.7
Admin.,
defence,
compul.
social
insurance
10,884.9
8,393.4
8,104.7
8,737.6
9,635.7
9,775.0
16,646.0
18,578.2
18,317.5
15,959.1
16,031.3
21,170.4
25,012.2
NGOs,
church
org.,
polit,
parties
905.1
1,825.7
1,906.2
1,949.8
1,886.0
1,749.1
1,795.8
1,689.9
1,784.1
1,779.3
1,857.4
1,938.4
2,171.6
Recre-
ation,
culture
and
sport
1,134.7
1,111.8
1,061.1
1,142.9
1,081.4
1,154.6
1,132.2
1,035.9
1,037.0
1,099.5
1,250.6
1,155.8
1,144.1
House-
holds
129,781.2
131,725.3
133,377.8
134,208.3
135,782.7
137,445.5
139,397.9
141,073.5
142,646.1
143,991.3
146,358.3
149,016.0
163,846.2
Other
46,481.1
41,771.4
44,742.4
40,721.2
43,467.5
43,058.2
35,063.9
37,017.3
41,240.1
40,043.2
40,535.8
39,323.9
40,963.2
129

Average Monthly Lending Rates - Total Credit
Period
1/95
2/953/95
4/95
5/956/95
7/95
8/959/95
10/95
11/95
12/95
Discount rate
12.00
12.0012.00
11.0011.00
11.00
11.0011.00
11.009.75
9.75
9.75
Short-term
15.56
15.66
15.0314.8314.66
14.38
14.1014.18
13.9713.28
12.91
13.73
Medium-term
17.4017.24
17.0917.06
17.0216.72
16.5816.47
16.4516.2716.04
16.27
Long-term
11.6211.5011.67
11.4511.48
11.0710.6410.74
11.1110.55
10.35
10.28
Total credit
14.1414.0913.93
13.7613.70
13.3813.0713.15
13.2012.6812.41
12.74
Average Monthly Lending Rates - Public Sector
Period
1/952/95
3/954/95
5/956/95
7/958/959/95
10/9511/9512/95
Discount rate
12.0012.0012.0011.0011.0011.0011.0011.0011.00
9.759.759.75
Short-term
14.8214.85
14.6014.1914.14
13.8013.4513.94
13.2812.61-12.4213.07
Medium-term
17.2717.12
16.9617.0116.9716.3415.9016.2016.1416.40
16.1316.67
Long-term
13.4214.0113.6913.71
13.7013.01
12.2012.4612.7211.44
11.1410.93
Total credit
14.5814.77
14.4814.3314.3113.7513.1713.5313.39
12.5612.32
12.53
Average Monthly Lending Rates - Private Sector
Period
1/952/953/954/955/956/957/958/959/95
10/9511/9512/95
Discount rate
12.0012.0012.0011.0011.0011.0011.00
11.0011.009.759.759.75
Short-term
16.1816.3316.5316.5016.2315.9815.7515.5515.5814.7514.2814.18
Medium-term
17.3317.2617.0717.0617.0316.8716.8716.6016.5816.3116.0816.17
Long-term
12.0711.0211.7211.1711.2211.0110.8710.8911.4111.34
11.2011.23
Total credit
14.6414.4114.8114.6314.5514.3714.2314.0814.2713.8513.5413.55
Average Monthly Lending Rates - Households
Period
1/952/953/954/955/956/957/958/959/95
10/9511/9512/95
Discount rate
12.0012.0012.0011.0011.0011.0011.0011.0011.009.759.759.75
Short-term
11.1110.3010.1812.9912.6512.1012.9112.0914.0115.0911.9314.30
Medium-term
17.0916.7917.1317.0216.8116.77
16.7616.7116.5615.6915.8015.90
Long-term
3.723.373.633.383.443.363.363.413.423.303.223.15
Total credit
5.485.125.385.175.215.165.165.205.245.075.005.05
130

Average Lending Rates - Total Credit
Period
Q1 1995
Q2 1995
Q1-2 1995
Q3 1995
Q4 1995
Q3-4 1995
1995
Short-term
15.41
14.62
15.00
14.09
13.30
13.69
14.32
Medium-term
17.24
16.93
17.09
16.50
16.19
16.34
16.70
Long-term
11.60
11.33
11.46
10.83
10.39
10.61
11.03
Total credit
14.05
13.61
13.83
13.14
12.61
12.87
13.34
Average Lending Rates - Public Sector
Period
Q1 1995
Q2 1995
Q1-2 1995
Q3 1995
Q4 1995
Q3-4 1995
1995
Short-term
14.76
14.05
14.42
13.56
12.68
13.16
13.86
Medium-term
17.12
16.78
16.96
16.07
16.42
16.25
16.61
Long-term
13.72
13.48
13.60
12.46
11.17
11.82
12.73
Total credit
14.62
14.13
14.38
13.36
12.47
12.93
13.69
Average Lending Rates - Private Sector
Period
Q1 1995
Q2 1995
Q1-2 1995
Q3 1995
Q4 1995
Q3-4 1995
1995
Short-term
16.36
16.23
16.29
15.62
14.40
14.98
15.55
Medium-term
17.22
16.98
17.10
16.68
16.19
16.42
16.74
Long-term
11.62
11.13
11.38
11.06
11.26
11.16
11.27
Total credit
14.62
14.52
14.57
.14.19
13.64
13.91
14.21
Average Lending Rates - Households
Period
Q1 1995
Q2 1995
Q1-2 1995
Q3 1995
Q4 1995
Q3-4 1995
1995
Short-term
10.51
12.55
11.52
13.09
13.81
13.49
12.60
Medium-term
17.00
16.87
16.94
16.68
15.80
16.23
16.58
Long-term
3.57
3.39
3.49
3.40
3.22
3.31
3.40
Total credit
5.33
5.18
5.26
5.20
5.04
5.12
5.19
131

Average Monthly Deposit Rates - Total Deposits
Period
1/952/953/954/955/956/957/958/959/95
10/9511/9512/95
Discount rate
12.0012.0012.0011.0011.0011.0011.0011.0011.009.759.759.75
Short-term
13.2713.1013.2011.4511.1010.9510.9010.7010.6710.249.60
10.08
Medium-term
14.3915.4415.3914.6114.5514.5914.6014.6114.5913.2712.3012.85
Long-term
14.6210.039.929.789.509.389.289.078.758.788.527.67
Time
13.8013.6413.6712.4512.2212.1512.1512.0211.9611.2410.5110.85
Demand
2.903.193.222.792.682.602.602.592.542.562.462.44
Demand andshort-term
8.787.637.716.546.346.256.116.015.965.805.435.60
Total deposits
9.409.459.528.498.378.318.228.118.067.667.167.34
Average Monthly Deposit Rates - Public Sector
Period
1/952/953/954/955/956/957/958/959/95
10/9511/9512/95
Discount rate
12.0012.0012.0011.0011.0011.0011.0011.0011.009.759.759.75
Short-term
12.8811.9112.649.919.429.268.838.188.167.747.057.82
Medium-term
14.5314.9014.6314.4714.5114.6514.6514.7214.6914.9814.3414.13
Long-term
10.9911.5010.9310.1310.1710.089.879.539.468.498.498.36
Time
13.3712.8913.2511.4811.3911.3111.2010.6410.7110.009.399.59
Demand
3.093.263.352.692.462.422.372.412.252.392.212.13
Demand andshort-term
6.396.266.585.054.704.694.284.284.173.903.563.80
Total deposits
7.747.657.916.576.516.526.186.116.115.314.945.00
Average Monthly Deposit Rates - Private Sector
Period
1/952/953/954/955/956/957/958/959/95
10/9511/9512/95
Discount rate
12.0012.0012.0011.0011.0011.0011.0011.0011.009.759.759.75
Short-term
12.8612.7112.4612.3310.5710.5510.4710.5210.1610.1610.069.67
Medium-term
15.3115.3415.1613.7912.3012.1412.8912.7712.7212.9912.9512.83
Long-term
6.406.41
14.2014.049.718.499.859.895.135.104.982.75
Time
13.0512.9212.8312.5910.8710.8111.0011.0110.6711.0911.0310.70
Demand
2.972.842.912.322.272.222.272.232.232.192.122.11
Demand andshort-term
5.765.835.614.804.424.394.414.244.184.544.364.00
Total deposits
6.146.216.025.264.854.815.004.814.755.685.515.11
Average Monthly Deposit Rates - Households
Period
1/952/953/954/955/956/957/958/959/95
10/9511/9512/95
Discount rate
12.0012.0012.0011.0011.0011.0011.0011.0011.009.759.759.75
Short-term
13.5413.7013.6611.8411.7611.6211.6311.6411.6410.9310.0910.88
Medium-term
14.3315.5715.5714.6914.6814.7114.7114.7214.7113.0611.8512.67
Long-term
15.429.979.819.739.449.329.229.028.748.858.577.73
Time
14.0313.9813.9412.7312.6412.5812.5812.5512.5011.5210.5911.14
Demand
2.613.403.403.343.313.163.183.193.203.183.163.21
Demand andshort-term
9.119.499.508.378.308.138.138.158.137.737.227.79
Total deposits
11.2511.4211.4210.4510.3910.3110.2910.2910.259.528.819.33
132

Average Deposit Rates • Total Deposits
Period
Q1 1995
Q2 1995
Q1-2 1995
Q31995
Q4 1995
Q3-4 1995
1995
Short-term
13.19
11.16
12.18
10.75
9.97
10.35
11.24
Medium-term
15.06
14.58
14.82
14.60
12.81
13.67
14.21
Long-term
11.06
9.55
10.23
9.03
8.28
8.63
9.34
Time
13.70
12.27
12.98
12.04
10.87
11.43
12.17
Demand
3.10
2.69
2.89
2.58
2.49
2.53
2.70
Demand andshort-term
7.62
6.38
6.99
6.02
5.61
5.81
6.37
Total deposits
9.46
8.39
8.92
8.13
7.38
7.74
8.29
Average Deposit Rates - Public Sector
Period
Q1 1995
Q2 1995
Q1-2 1995
Q3 1995
Q4 1995
Q3-4 1995
1995
Short-term
12.46
9.54
11.04
8.37
7.56
7.98
9.58
Medium-term
14.69
14.54
14.61
14.69
14.48
14.61
14.61
Long-term
11.14
10.13
10.59
9.62
8.45
9.02
9.75
Time
13.16
11.39
12.28
10.84
9.66
10.31
11.34
Demand
3.23
2.53
2.88
2.35
2.24
2.29
2.57
Demand andshort-term
6.41
4.82
5.62
4.24
3.75
4.00
4.80
Total deposits
7.77
6.53
7.15
6.13
5.08
5.62
6.39
Average Deposit Rates - Private Sector
Period
Q1 1995
Q2 1995
Q1-2 1995
Q3 1995
Q4 1995
Q3-4 1995
1995
Short-term
12.68
11.11
11.92
10.38
9.97
10.14
10.93
Medium-term
15.27
12.70
13.78
12.79
12.92
12.89
13.10
Long-term
7.35
10.39
8.34
7.50
3.88
5.01
6.30
Time
12.93
11.38
12.16
10.89
10.94
10.92
11.41
Demand
2.91
2.27
2.57
2.24
2.14
2.19
2.35
Demand andshort-term
5.73
4.53
5.12
4.27
4.29
4.28
4.64
Total deposits
6.12
4.97
5.53
4.85
5.42
5.17
5.32
Average Deposit Rates - Households
Period
Q1 1995
Q2 1995
Q1-2 1995
Q3 1995
Q4 1995
Q3-4 1995
1995
Short-term
13.63
11.74
12.68
11.64
10.64
11.12
11.88
Medium-term
15.13
14.69
14.91
14.71
12.53
13.58
14.22
Long-term
11.11
9.49
10.22
8.99
8.34
8.65
9.34
Time
13.99
12.65
13.31
12.54
11.08
11.78
12.51
Demand
3.14
3.27
3.20
3.19
3.18
3.19
3.19
Demand andshort-term
9.37
8.27
8.81
8.13
7.59
7.85
8.32
Total deposits
11.36
10.38
10.86
10.28
9.22
9.73
10.27
133

Refinancing, Redistributional, and Stand-by Loans
REFINANCING LOANS- Auction refinancing loans with 1-month maturity
- Volume (end-of-month figure)- Average volume of loans- Average interest rate */- Average interest rate since beginning of year
- Lombard loans- Volume (end-of-month figure)- Average volume of loans- Average interest rate
- Loans for bills of exchange rediscount- Volume (end-of-month figure)- Average volume of loans- Average interest rate- Average interest rate since beginning of year
of which:- Loans for bills of exchange red.
- Volume (end-of-month figure)- Average volume of loans- Average interest rate- Average interest rate since beginning of year
- Bills of exchange rediscounted for export promotion- Volume (end-of-month figure)- Average volume of loans- Average interest rate- Average interest rate since beginning of year
- Bills of exchange rediscounted for the supportof privatization- Volume (end-of-month figure)- Average volume of loans- Average interest rate- Average interest rate since beginning of year
REFINANCING LOANS - TOTAL- Volume (end-of-month figure)- Average volume of loans- Average interest rate- Average interest rate since beginning of year
REDISTRIBUTIONAL LOANS- Volume (end-of-month figure)- Average volume of loans- Average interest rate
STAND-BY LOANS- Volume (end-of-month figure)- Average volume of loans- Average interest rate
REFINANCING, REDISTRIBUTIONAL AND STAND-BYLOANS - TOTAL
- Volume (end-of-month figure)- Average volume of loans
Unit
Sk mil.Sk mil.
%%
Sk mil.Sk mil.
%
Sk mil.Sk mil.
%%
Sk mil.Sk mil.
%%
Sk mil.Sk mil.
%%
Sk mil.Sk mil.
%%%
Sk mil.Sk mil.
%%
Sk mil.Sk mil.
%
Sk mil.Sk mil.
%
Sk mil.Sk mil.
1995
1
00
13.10
1,577.41,741.9
12.0012.00
1,320.21,469.7
12.0012.00
257.2272.212.0012.00
1,577.41,741.9
12.0012.00
32,787.032,787.0
8.82
00
36.00
34,364.434,528.9
2
00
13.10
1,270.11,417.1
12.0012.00
998.71,143.3
12.0012.00
271.4273.812.0012.00
1,270.11,417.1
12.0012.00
32,787.032,787.0
8.82
00
36.00
34,057.134,204.1
3
00
13.10
810.61,025.2
11.9711.99
535.2791.211.9912.00
275.4234.011.9111.97
810.61,025.2
11.9711.99
32,787.032,787.0
8.82
00
34.55
33,597.633,812.2
4
00
13.10
469.8593.011.7811.97
274.0373.011.8611.98
195.8220.011.6511.90
469.8593.011.7811.97
32,787.032,787.0
8.82
00
33.00
33,256.833,380.0
5
00
13.10
322.4372.111.4911.93
147.3191.511.4711.96
175.1180.711.5011.84
322.4372.111.4911.93
32,787.032,787.0
8.82
00
33.00
33,109.433,159.1
6
00
13.10
360.7325.411.2411.89
158.7144.411.1711.93
202.0181.111.2911.77
360.7325.411.2411.89
32,407.032,678.0
8.82
00
33.00
32,767.733,003.1
7
00
13.10
345.6346.011.1011.84
152.2156.111.1011.90
193.4190.011.1011.69
345.6346.011.1011.84
32,407.032,407.0
8.83
00
33.00
32,752.632,753.0
8
00
13.10
431.1389.911.0211.79
253.1203.211.0111.86
178.0186.611.0411.62
431.1389.911.0211.79
32,407.032,407.0
8.83
00
33.00
32,838.132796.9
9
00
13.10
662.6520.311.0011.73
481.4357.811.0011.80
181.2162.411.0011.56
662.6520.311.0011.73
32,407.032,407.0
8.83
00
33.00
33,069.632,927.3
10
00
13.10
900.0758.310.9011.65
721.3580.210.8711.70
178.7178.010.9911.51
900.0758.310.9011.65
32,407.032,407.0
8.83
00
29.85
33,307.033,165.3
11
00
13.10
1,194.51,051.1
10.4611.50
1,059.8914.510.4111.51
134.7136.610.8011.47
1,194.51,051.1
10.4611.5
32,407.032,407.0
8.83
00.02
29.25
33,601.533,458.2
12
00
13.10
1,334.01,235.4
10.2111.19
1,215.91,119.7
10.1711.31
118.1115.710.5211.42
1,334.01,235.4
10.2111.34
32,107.032,310.2
8.83
00
29.25
33,441.033,545.6
Note: The discount rate was lowered from 11 % to 9.75% with effect from 6 October 1995*/ The average interest rate corresponds to the discount rate if auction credit is not provided.

Foreign Exchange Position of the Banking Sector vis-a-vis Foreign Countries(USD thousands)
End-of-month
figures
1/95
2/95
3/95
4/95
5/95
6/95
7/95
8/95
9/95
10/95
11/95
12/95
Foreign exchange assets
Convertible
currencies
1,421,368
1,513,099
1,602,767
1,595,077
1,568,022
1,581,858
1,594,422
1,587,810
1,581,206
1,556,247
1,590,186
1,618,322
Nonconvertible
currencies
26,048
30,430
31,327
68,250
79,979
79,032
66,730
62,872
53,960
123,738
138,437
112,321
Foreign exchange liabilities
Convertible
currencies
499,662
595,786
632,897
655,555
657,644
662,867
639,380
626,623
657,432
714,339
823,129
917,654
Nonconvertible
currencies
84,277
82,755
91,735
94,367
90,820
90,084
92,054
86,122
82,205
103,620
127,521
110,741
Foreign exchange position
Convertible
currencies
921,707
917,313
969,870
939,523
910,378
918,991.
955,042
961,186
923,775
841,908
767,057
700,668
Nonconvertible
currencies
-58,229
-52,325
-60,407
-26,117
-10,842
-11,052
-25,325
-23,249
-28,245
20,117
10,916
1,579
135

Foreign Exchange Position of the Banking
End-of-month
figures
1/95
2/95
3/95
4/95
5/95
6/95
7/95
8/95
9/95
10/95
11/95
12/95
Total
FX position
28,333,267
27,578,099
28,121,371
27,206,694
26,647,682
26,972,378
27,881,487
29,151,820
27,286,460
24,783,236
22,789,265
20,718,051
Assets
43,692,867
45,489,798
46,472,232
46,190,245
45,897,572
46,427,522
46,547,542
48,156,682
46,705,673
45,811,240
47,244,417
47,852,167
Liabilities
15,359,600
17,911,699
18,350,861
18,983,551
19,249,890
19,455,144
18,666,055
19,004,862
19,419,213
21,028,004
24,455,152
27,134,116
Sector vis-a-vis Foreign Countries in Convertible Currencies
Short-term
FX position
37,037,663
36,318,297
37,516,826
36,546,256
36,431,093
37,212,360
38,522,135
39,799,228
37,645,266
34,934,827
37,613,084
35,824,305
Assets
43,615,912
45,429,230
46,413,793
46,131,877
45,897,121
46,399,746
46,547,091
48,156,243
46,705,227
45,801,907
47,243,920
47,851,670
Liabilities
6,578,249
9,110,933
8,896,967
9,585,621
9,466,028
9,187,386
8,024,956
8,357,015
9,059,961
10,867,080
9,630,836
12,027,365
(Sk thousands)
Medium-term
FX position
-8,704,396
-8,740,198
-9,395,455
-9,339,562
-9,783,411
-10,239,982
-10,640,648
-10,647,408
-10,358,806
-10,151,591
-14,823,819
-15,106,254
Assets
76,955
60,568
58,439
58,368
451
27,776
451
439
446
9,333
497
497
Liabilities
8,781,351
8,800,766
9,453,894
9,397,930
9,783,862
10,267,758
10,641,099
10,647,847
10,359,252
10,160,924
14,824,316
15,106,751
136

Foreign Exchange Position of the Banking
End-of-month
figures
1/95
2/95
3/95
4/95
5/95
6/95
7/95
8/95
9/95
10/95
11/95
12/95
Total
FX position
-1,789,952
-1,573,084
-1,751,509
-756,299
-317,343
-324,379
-739,326
-705,132
-834,291
592,196
324,306
46,703
Assets
800,714
914,850
908,334
1,976,378
2,341,053
2,319,580
1,948,105
1,906,850
1,593,885
3,642,469
4,112,966
3,321,213
Liabilities
2,590,666
2,487,934
2,659,843
2,732,677
2,658,396
2,643,959
2,687,431
2,611,982
2,428,176
3,050,273
3,788,660
3,274,510
Sector vis-a-vis Foreign Countries in Nonconvertible Currencies
Short-term
FX position
-1,590,118
-1,352,088
-327,502
672,258
1,056,935
1,063,633
648,686
684,692
480,847
1,932,979
1,638,389
1,297,574
Assets
800,714
914,850
908,334
1,976,378
2,341,053
2,319,580
1,948,105
1,906,850
1,593,885
3,642,469
4,112,966
3,276,791
Liabilities
2,390,832
2,288,100
1,235,836
1,304,120
1,284,118
1,255,947
1,299,419
1,222,158
1,113,038
1,709,490
2,474,577
1,979,217
(Sk thousands)
Medium- and Long- term
FX position
-199,834
-199,834
-1,424,007
-1,428,557
-1,374,278
-1,388,012
-1,388,012
-1,389,824
-1,315,138
-1,340,783
-1,314,083
-1,250,871
Assets
0
0
0
0
0
0
0
0
0
0
0
44,422
Liabilities
199,834
199,834
1,424,007
1,428,557
1,374,278
1,388,012
1,388,012
1,389,824
1,315,138
1,340,783
1,314,083
1,295,293
137

SKK Exchange Rates(midpoint rate)
End-of-month figures
1/95
2/95
3/95
4/95
5/95
6/95
7/95
8/95
9/95
10/95
11/95
12/95
1 FRF
5.849
5.838
5.959
5.983
5.970
5.993
6.089
5.967
6.036
6.001
6.031
6.034
1,000 ITL
19.203
17.951
16.907
17.105
17.867
17.913
18.358
18.607
18.318
18.422
18.575
18.661
100 JPY
31.091
31.055
32.893
34.743
35.118
34.436
32.950
30.697
29.648
28.917
29.282
28.834
1 CAD
21.746
21.544
20.728
21.246
21.369
21.327
21.389
22.627
21.828
21.561
21.884
21.766
1 NLG
18.106
18.386
18.797
18.877
18.826
18.754
18.795
18.319
18.610
18.603
18.451
18.436
1 ATS
2.886
2.929
2.992
3.005
2.998
2.987
2.993
2.919
2.962
2.961
2.937
2.934
1 DEM
20.298
20.597
21.052
21.142
21.075
21.017
21.057
20.530
20.841
20.845
20.669
20.646
1 CHF
24.091
24.294
25.524
25.604
25.569
25.280
25.340
24.962
25.831
25.797
25.537
25.647
1 USD
30.740
30.064
28.995
28.958
29.271
29.350
29.194
30.329
29.538
29.437
29.710
29.569
1 GBP
48.824
47.519
46.711
46.863
46.793
46.408
46.608
46.843
46.708
46.340
45.551
46.006
1 XEU
38.348
38.223
38.343
38.789
38.828
38.730
39.146
38.381
38.521
38.298
38.299
37.872
1 ECU
40.265
40.134
40.260
40.728
39.216
39.117
39.537
38.765
38.521
-
-
-
1 CZK
-
-
-
-
-
-
-
-
1.124
1.120
1.108
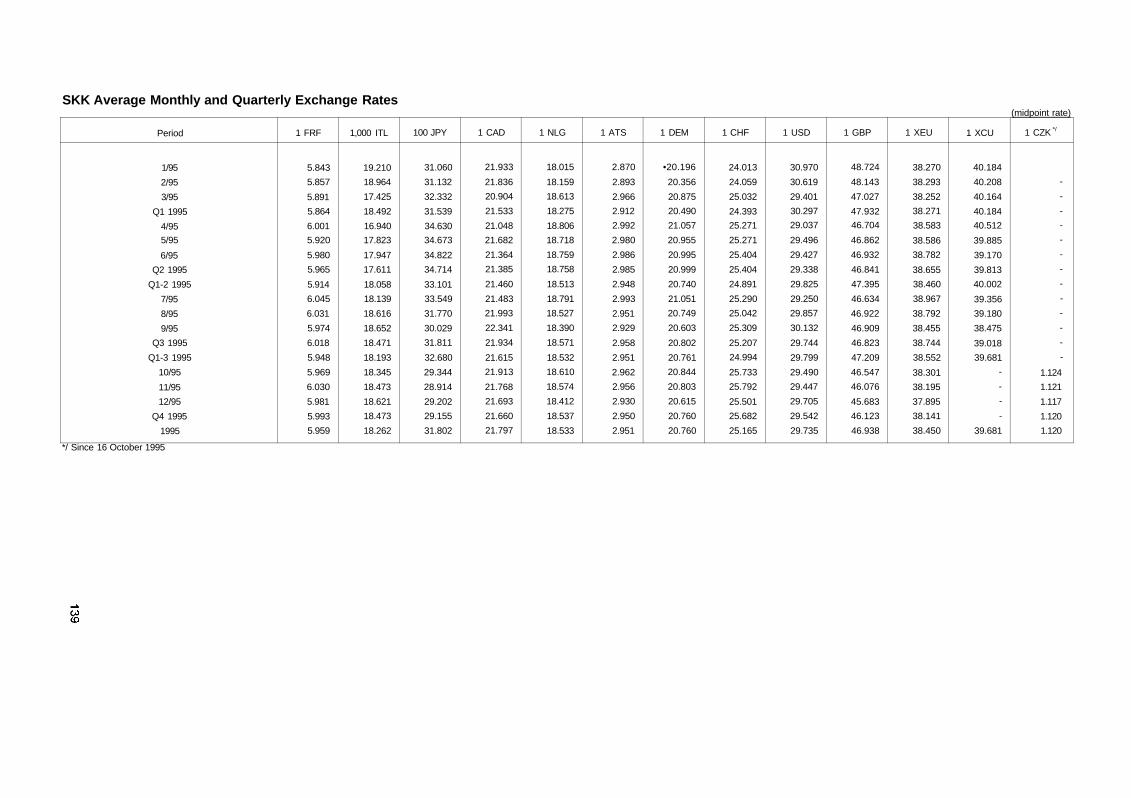
SKK Average Monthly and Quarterly Exchange Rates(midpoint rate)
Period
1/95
2/95
3/95
Q1 1995
4/95
5/95
6/95
Q2 1995
Q1-2 1995
7/95
8/95
9/95
Q3 1995
Q1-3 1995
10/95
11/95
12/95
Q4 1995
1995
1 FRF
5.843
5.857
5.891
5.864
6.001
5.920
5.980
5.965
5.914
6.045
6.031
5.974
6.018
5.948
5.969
6.030
5.981
5.993
5.959
1,000 ITL
19.210
18.964
17.425
18.492
16.940
17.823
17.947
17.611
18.058
18.139
18.616
18.652
18.471
18.193
18.345
18.473
18.621
18.473
18.262
100 JPY
31.060
31.132
32.332
31.539
34.630
34.673
34.822
34.714
33.101
33.549
31.770
30.029
31.811
32.680
29.344
28.914
29.202
29.155
31.802
1 CAD
21.933
21.836
20.904
21.533
21.048
21.682
21.364
21.385
21.460
21.483
21.993
22.341
21.934
21.615
21.913
21.768
21.693
21.660
21.797
1 NLG
18.015
18.159
18.613
18.275
18.806
18.718
18.759
18.758
18.513
18.791
18.527
18.390
18.571
18.532
18.610
18.574
18.412
18.537
18.533
1 ATS
2.870
2.893
2.966
2.912
2.992
2.980
2.986
2.985
2.948
2.993
2.951
2.929
2.958
2.951
2.962
2.956
2.930
2.950
2.951
1 DEM
•20.196
20.356
20.875
20.490
21.057
20.955
20.995
20.999
20.740
21.051
20.749
20.603
20.802
20.761
20.844
20.803
20.615
20.760
20.760
1 CHF
24.013
24.059
25.032
24.393
25.271
25.271
25.404
25.404
24.891
25.290
25.042
25.309
25.207
24.994
25.733
25.792
25.501
25.682
25.165
1 USD
30.970
30.619
29.401
30.297
29.037
29.496
29.427
29.338
29.825
29.250
29.857
30.132
29.744
29.799
29.490
29.447
29.705
29.542
29.735
1 GBP
48.724
48.143
47.027
47.932
46.704
46.862
46.932
46.841
47.395
46.634
46.922
46.909
46.823
47.209
46.547
46.076
45.683
46.123
46.938
1 XEU
38.270
38.293
38.252
38.271
38.583
38.586
38.782
38.655
38.460
38.967
38.792
38.455
38.744
38.552
38.301
38.195
37.895
38.141
38.450
1 XCU
40.184
40.208
40.164
40.184
40.512
39.885
39.170
39.813
40.002
39.356
39.180
38.475
39.018
39.681
-
-
-
-
39.681
1 CZK */
-
-
-
-
-
-
-
-
-
-
-
-
-
1.124
1.121
1.117
1.120
1.120
*/ Since 16 October 1995

Capital Market(Sk millions, pcs)
I. Bratislava Stock
Exchange (BCPB)
A. VOLUME OF TRANSACTIONS
1. Volume of transactions - total
of which:
a/ Transactions carried out on BCPB
b/ Direct transactions
2. Number of securities sold (pcs)
B. STRUCTURE OF TRANSACTIONS
Volume of transactions - total
of which:
a/ Listed securities
- stocks and shares
- bonds
b/ Unlisted securities
- stocks and shares
- bonds
1993
1-12
166.3
37.9
128.4
115,863
- 166.3
95.7
18.7
77.0
70.7
70.7
0.0
1994
1-12
6,283.5
829.4
5,454.1
8,598,516
6,283.5
4,654.4
3,838.7
815.0
1,629.1
1,589.6
39.5
1995
1
4,726.5
23.1
4,703.4
4,000,403
4,726.5
2,919.3
2,911.3
8.0
1,807.2
1,796.5
10.7
2
430.7
39.6
391.1
591,374
430.7
159.2
108.1
51.1
271.5
264.5
7.0
3
2,296.6
39.2
2,257.4
948,398
2,296.6
2,101.4
411.3
1,690.1
195.2
195.2
0.0
4
2,664.3
23.0
2,641.3
892,492
2,664.0
2,544.7
291.0
2,253.7
119.6
119.6
0.0
5
1,110.5
34.4
1,076.1
2,697,184
1,110.5
832.2
719.1
113.1
278.3
278.0
0.3
6
633.6
46.6
587.0
1,358,879
633.6
250.0
219.0
31.0
383.6
379.4
4.2
7
844.3
35.4
808.9
1,566,834
844.3
429.5
402.9
26.6
414.8
414.8
0.0
8
1,617.4
55.8
1,561.6
3,006,800
1,617.4
973.0
576.8
396.2
644.4
570.9
73.5
9
4,070.0
32.2
4,037.8
6,997,471
4,070.0
3,008.5
1,987.3
1,021.2
1,061.5
1,019.0
42.5
10
6,900.0
44.6
6,855.4
7,759,495
6,900.0
2,341.4
1,229.7
1,111.7
4,558.6
3,416.5
1,142.1
11
2,041.8
42.3
1,999.5
3,564,339
2,041.8
848.1
564.7
283.4
1,193.7
783.0
410.7
12
12,733.0
54.6
12,678.4
11,775,001
12,733.0
7,147.4
2,066.1
5,081.3
5,585.6
4,006.0
1,579.6
1 -12
40,068.7
470.8
39,597.9
45,158,670
40,068.7
23,554.7
11,487.3
12,067.4
16,514.0
13,243.4
3,270.6
(Sk millions)
II. Bratislava Options Exchanqe (BOB)
Volume of trading - total
1993
1-12
39.5
1994
1-12
1,798.9
1995
1
247.7
2
120.1
3
160.3
4
85.3
5
125
6
84
7
45.5
8
83.3
9
56.8
10
106.2
11
-
12
-
1-12
1,114.2
Note: As of 2 November 1995, the Ministry of Finance of the SR withdrew the licence of the BOB.
(Sk millions)
III. RM - System Slovakia, Bratislava
Volume of trading - total
of which:
a/ periodic auctions
b/ regular auctions
1993
1-12
43.3
43.3
0.0
1994
1-12
1,970.3
1,581.7
388.6
1995
1
121.1
7.1
114.0
2
160.3
29.9
130.4
3
167.2
20.1
147.1
4
82.6
3.6
79.0
5
165.1
38.5
126.6
6
842.2
0.7
841.5
7
149.0
0.1
148.9
8
567.3
0.0
567.3
9
11,320.2
0.0
11,320.2
10
1,865.4
0.0
1,865.4
11
1,195.8
0.0
1,195.8
12
1,415.5
0.0
1,415.5
1 -12
18,051.7
100.0
17,951.7

Gross Domestic Product (estimates)
GDP at constant prices of 1993
Same period of previous year = 100
GDP at current prices
Same period of previous year = 100
Unit
Sk billions
index
Sk billions
index
1994
Q1
90.1
103.6
102.1
117.4
Q2
97.7
105.6
111.7
120.8
Q3
100.3
105.1
114.1
119.6
Q4
100.0
105.3
113.4
119.4
Year
388.1
104.9
441.3
119.3
1995
Q1
95.2
105.7
117.6
115.2
Q2
104.5
107.0
130.0
116.4
Q3
108.5
108.2
135.4
118.7
Q4
108.5
108.5
135.0
119.0
Year
416.7
107.4
518.0
117.4
Note: Method applied - ESA Source: Statistical Office of the SR

Unemployment
Number of vacancies
Number of unemployed
(end-of-month figures)
Number of unemployed
per vacancy
Unemployment % rate
(end-of-month figures)
a
b
a
b
a
a
1
13,207
161
387,086
15,605
29
15.2
2
13,700
493
384,887
-2,199
28
15.1
3
13,298
-402
371,577
-13,310
28
14.6
4
14,194
896
354,147
-17,430
25
13.9
5
14,584
390
338,935
-15,212
23
13.3
1995
6
16,993
2,409
339,051
116
20
13.3
7
18,638
1,645
343,147
4,096
18
13.5
8
17,273
-1,365
338,843
-4,304
20
13.3
9
16,328
-945
336,023
-2,820
21
13.2
10
16,902
574
325,490
-10,533
19
12.8
11
16,162
-740
326,279
789
20
12.8
12
15,473
-689
333,291
7,012
22
13.1
Source: Statistical Office of the SRLegend:a - in specified unitsb - difference (+, -) compared with previous period

Consumer Price Development
Goods and services
of which:
Foodstuffs
Nonfood products
Public catering
Services paid by households
ab
cd
ab
cd
ab
cd
abcd
ab
cd
1995
1
101.4113.2101.4111.7
101.0119.6101.0118.2
101.6109.9101.6
108.6
101.7
115.7101.7113.7
101.4110.7101.4
108.9
2
100.5113.8101.9111.5
99.7119.2100.7117.4
100.6110.7102.2
108.6
100.7116.5102.4113.7
101.1112.0
102.6108.4
3
100.3114.1102.2111.3
99.5118.7100.3116.7
100.6111.3102.8108.6
100.7117.3103.1113.3
100.6112.7103.2108.4
4
100.4114.6102.6111.2
99.8118.4100.1
116.0
100.9
112.3103.7109.0
99.9
117.2103.0112.9
100.5113.3103.8108.7
5
100.4115.0103.0111.0
100.2
118.7100.3115.2
100.5112.9
104.3109.0
100.4117.6103.3112.9
100.1113.4103.9108.7
6
100.1115.1103.1110.6
98.6117.098.9
113.1
100.7113.7
105.0109.1
100.5118.1103.8
112.9
100.4
113.9104.4108.9
7
101.0116.2104.1110.8
101.2118.3100.0113.1
100.3114.1105.4108.7
101.2119.5105.1113.6
102.7
117.0107.1111.5
8
100.5116.8104.6109.8
101.0119.5101.0111.0
100.4
114.5105.8108.5
100.4120.0105.5
112.3
100.1117.1107.3110.6
9
101.4118.3106.0108.8
103.5123.7
104.5108.1
100.5115.1106.3108.3
100.7120.8106.2
111.0
100.3117.5107.7109.8
10
100.5118.9106.5107.9
100.4124.2105.0106.5
100.6115.8107.0108.2
100.5121.4106.7
109.0
100.2117.8107.9108.5
11
100.4119.3106.9107.6
100.1124.4
105.1106.1
100.5116.4107.5108.2
100.4121.8107.1
108.0
100.1117.9
108.0108.2
12
100.3119.7107.2107.2
100.2124.6105.3105.3
100.4116.8107.9107.9
100.3122.2107.4
107.4
100.1118.1108.1108.1
1-12
116.3104.1
109.9
-
120.5101.8111.9
113.6105.0108.6
_
119.0104.6111.6
115.1105.5109.0
Source: Statistical Office of the SRLegend:a - index (previous month = 100)b - index (December 1993 = 100)c - index (December I994 = 100)d - index (same period of previous year = 100)

Producer Price Development - Selected Products and Materials
Industrial products
Building materials
Agricultural products
of which:
Plant products
Animal products
a
b
c
de
a
b
c
d
e
a
b
c
d
e
a
b
c
de
a
b
c
d
e
1995
1
102.1
102.1
112.0
254.5
104.7
104.7
235.9
113.4
•
112.0
154.7
_
-
120.1
135.0
-
111.8
155.4
2
101.5
-
111.2
258.2
103.6
108.5
244.5
112.8
-
109.8
149.3
_
-
122.4
155.3
-
109.5
149.2
3
100.3
104.0
111.1
259.1
100.5
109.1
245.7
111.3
-
109.4
144.6
-
136.9
147.1
-
109.0
144.5
4
100.7
104.7
112.5
260.9
101.2
110.3
248.6
112.6
-
109.7
140.9
_
-
130.1
138.3
-
109.2
141.0
5
100.5
105.2
112.4
262.1
100.2
110.6
249.2
112.8
-
109.3
138.9
-
132.0
138.0
-
108.4
138.9
6
100.3
105.5
112.6
262.8
99.9
110.5
249.0
112.5
-
111.9
143.5
-
137.1
189.4
-
108.7
138.1
7
100.3
105.8
111.6
263.6
100.2
110.8
249.6
112.4
-
97.3
144.8
-
94.9
146.8
105.7
138.9
8
100.6
106.4
102.1
265.2
100.6
111.4
251.0
110.1
-
98.8
140.9
-
96.6
141.5
-
102.2
140.0
9
100.6
107.1
101.3
266.9
100.6
112.1
252.5
110.1
-
102.5
147.5
_
-
105.4
145.6
-
100.1
149.2
10
100.4
107.6
108.9
268.1
100.1
112.2
252.7
113.0
-
106.4
147.4
_
-
111.3
142.5
-
98.5
157.1
11
99.6
107.1
107.6
267.0
100.2
112.3
253.1
112.7
-
102.3
155.8
_
-
108.8
147.0
-
99.2
160.9
12
99.9
107.1
107.1
266.8
100.0
112.3
253.1
112.3
-
95.5
156.0
_
-
109.1
148.2
-
94.5
156.7
1-12
100.6
109.0
262.9
101.0 .
110.4
248.7
112.2
-
103.3
146.3
_
-
101.9
145.2
-
104.3
147.1
Legend:a - index (previous month = 100)b - index (December 1994 = 100)c - index (December 1990 = 100, in construction: 1 Jan. 1990 = 100)d - index (same period of previous year = 100)e-index (1989 = 100)
Source: Statistical Office of the SR

Industrial Production
Total industrial production
(Sk millions)
of which:
in private sector
Labour productivity
(Sk/employee)
a
b
c
d
e
f
g
a
b
c
d
e
h
a
b
c
1995
1
35,590
92.4
104.4
35,590
104.4
15,066
104.5
20,866
90.7
138.6
20,866
138.6
58.6
58,419
90.9
101.4
2
36,322
100.5
106.6
71,912
105.5
15,137
106.6
22,194
104.8
143.0
43,060
140.8
61.1
59,457
100.3
103.0
3
41,340
113.5
106.0
113,252
105.7
17,183
106.0
25,611
115.1
122.0
68,671
133.1
62.0
67,298
112.9
102.5
4
39,061
93.8
110.4
152,313
106.8
15,326
110.4
24,683
95.7
113.0
93,354
127.1
63.2
63,198
93.3
105.3
5
43,231
110.1
110.2
195,544
107.6
16,961
110.3
27,526
111.0
119.0
120,880
125.2
63.7
69,934
110.1
106.0
6
43,244
99.7
107.9
238,788
107.7
17,565
107.9
28,385
102.8
119.0
149,265
124.1
65.6
69,830
99.6
104.0
7
37,687
86.8
105.4
276,475
107.3
15,252
105.4
24,837
87.2
116.7
174,102
122.9
65.9
60,457
86.2
102.0
8
41,834
110.3
110.4
318,309
107.7
16,828
110.4
27,554
110.3
119.5
201,656
122.4
65.9
66,905
110.0
106.7
9
43,641
103.6
112.9
361,950
108.3
17,429
112.9
29,008
104.5
122.3
230,664
122.4
66.5
69,444
103.1
108.2
10
46,428
106.5
112.8
408,378
108.7
18,460
112.8
30,781
105.6
123.6
261,445
122.6
66.3
73,569
106.1
107.3
11
47,020
101.7
109.9
455,398
108.9
18,778
109.9
31,786
103.7
122.9
293,231
122.6
67.6
74,639
101.9
104.8
12
42,023
89.4
102.7
497,421
108.3
16,796
102.7
28,123
88.5
114.0
321,354
121.8
66.9
67,154
90.0
98.2
Legend:a - in specified unitb - index (previous month = 100)c - index (same period of previous year = 100)d - cumulative figures from beginning of year (Sk millions)e - index (same period of previous year = 100, cumulative figures)f - in specified unit (at constant prices as at 1 January 1989)g - index (same period of previous year = 100, at constant prices as at 1 January 1989)h - percentage of private sector in industrial production
Source: Statistical Office of the SR

Construction
Total output of construction
sector (Sk millions)
of which:
in private sector
Domestic construction output
Construction output abroad
Labour productivity in construction
(Sk/employee)
a
b
c
d
e
a
b
c
d
e
h
a
b
c
d
e
f
g
a
b
c
d
e
a
b
c
1995
1
2,657
61.2
94.6
2,657
94.6
2,199
63.4
116.9
2,199
116.9
82.8
2,437
65.2
92.9
2,437
92.9
1,031
92.7
220
37.9
118.9
220
118.9
17,692
64.5
94.4
2
2,992
111.2
108.8
5,649
100.5
2,487
111.6
130.8
4,686
122.7
83.1
2,669
108.1
111.0
5,106
100.8
1,114
111.4
323
145.2
93.8
543
98.3
19,973
111.4
108.7
3
3,571
118.1
104.3
9,220
101.9
2,906
115.7
133.1
7,592
126.4
81.4
3,066
113.7
100.5
8,172
100.6
1,267
100.3
505
154.8
135.7
1,048
113.2
23,854
118.2
103.6
4
3,826
105.3
100.4
13,046
101.5
3,108
105.1
113.3
10,700
122.4
81.2
3,247
104.0
96.3
11,419
99.4
1,318
96.5
579
112.4
131.3
1,627
118.8
24,955
102.8
98.7
5
4,438
116.0
104.4
17,484
102.2
3,588
115.4
109.3
14,288
118.9
80.8
3,697
113.8
95.9
15,116
98.5
1,500
95.5
741
128.1
185.8
2,368
133.7
28,820
115.5
104.1
6
4,824
108.7
105.0
22,308
102.8
3,792
105.7
108.0
18,080
116.5
78.6
3,946
106.7
98.5
19,062
98.5
1,601
98.6
878
118.3
150.2
3,246
137.8
31,234
108.3
106.2
7
4,467
92.5
102.4
26,775
102.7
3,577
94.3
106.8
21,657
114.8
80.1
3,697
93.6
96.5
22,759
98.2
1,499
96.5
770
87.6
145.8
4,016
139.2
28,523
91.2
103.1
8
4,796
106.0
104.8
31,571
103.0
3,780
104.3
107.6
25,437
113.7
78.8
4,019
107.3
100.6
26,778
98.5
1,608
101.6
777
99.7
133.5
4,793
138.3
30,579
105.9
106.2
9
4,881
100.9
100.3
36,452
102.6
3,975
104.2
106.4
29,412
112.6
81.4
4,202
103.7
103.5
30,980
99.2
1,667
103.6
679
86.5
84.1
5,472
128.2
31,219
101.2
101.2
10
5,381
109.2
107.9
41,833
103.3
4,435
110.6
112.8
33,847
112.7
82.4
4,656
109.8
110.1
35,636
100.4
1,830
111.2
725
105.9
95.3
6,197
123.3
34,921
110.8
111.3
11
5,073
92.9
102.2
46,906
103.2
4,306
95.7
109.1
38,153
112.3
84.9
4,460
94.4
104.0
40,096
100.8
1,728
106.0
613
83.5
90.8
6,810
119.6
33,330
94.1
106.5
12
4,629
90.4
98.4
51,535
102.7
4,003
92.1
104.9
42,156
111.6
86.5
4,025
89.4
99.4
44,121
100.7
1,544
100.1
604
97.5
92.4
7,414
116.9
30,946
92.0
103.0
Source: Statistical Office of the SRLegend:a - in specified unitb - index (previous month = 100)c - index (same period of previous year = 100)d - cumulative figures from beginning of year (Sk million)e - index (same period of previous year = 100, cumulative figures)f - in specified unit (at constant prices as at 1 January 1990)g - index (same period of precious year = 100, at constant prices as at 1 January 1990)h - percentage of private sector in construction
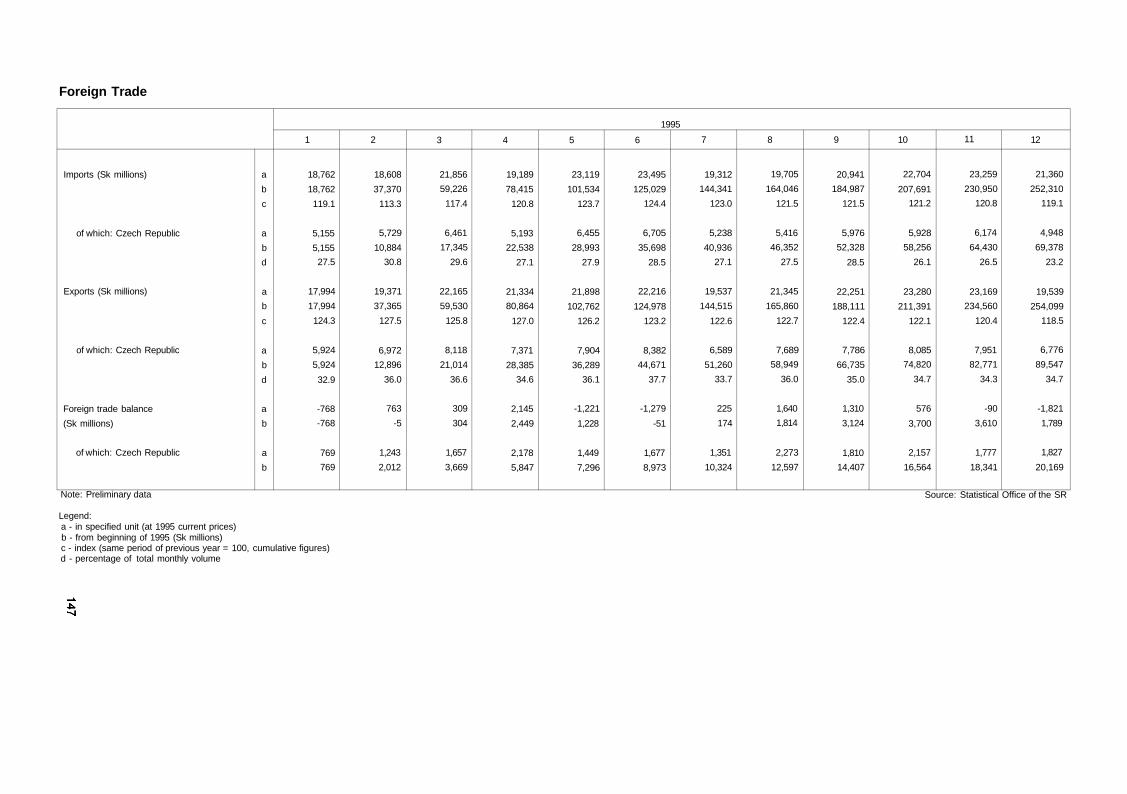
Foreign Trade
Imports (Sk millions)
of which: Czech Republic
Exports (Sk millions)
of which: Czech Republic
Foreign trade balance
(Sk millions)
of which: Czech Republic
a
b
c
a
b
d
a
b
c
a
b
d
a
b
a
b
1995
1
18,762
18,762
119.1
5,155
5,155
27.5
17,994
17,994
124.3
5,924
5,924
32.9
-768
-768
769
769
2
18,608
37,370
113.3
5,729
10,884
30.8
19,371
37,365
127.5
6,972
12,896
36.0
763
-5
1,243
2,012
3
21,856
59,226
117.4
6,461
17,345
29.6
22,165
59,530
125.8
8,118
21,014
36.6
309
304
1,657
3,669
4
19,189
78,415
120.8
5,193
22,538
27.1
21,334
80,864
127.0
7,371
28,385
34.6
2,145
2,449
2,178
5,847
5
23,119
101,534
123.7
6,455
28,993
27.9
21,898
102,762
126.2
7,904
36,289
36.1
-1,221
1,228
1,449
7,296
6
23,495
125,029
124.4
6,705
35,698
28.5
22,216
124,978
123.2
8,382
44,671
37.7
-1,279
-51
1,677
8,973
7
19,312
144,341
123.0
5,238
40,936
27.1
19,537
144,515
122.6
6,589
51,260
33.7
225
174
1,351
10,324
8
19,705
164,046
121.5
5,416
46,352
27.5
21,345
165,860
122.7
7,689
58,949
36.0
1,640
1,814
2,273
12,597
9
20,941
184,987
121.5
5,976
52,328
28.5
22,251
188,111
122.4
7,786
66,735
35.0
1,310
3,124
1,810
14,407
10
22,704
207,691
121.2
5,928
58,256
26.1
23,280
211,391
122.1
8,085
74,820
34.7
576
3,700
2,157
16,564
11
23,259
230,950
120.8
6,174
64,430
26.5
23,169
234,560
120.4
7,951
82,771
34.3
-90
3,610
1,777
18,341
12
21,360
252,310
119.1
4,948
69,378
23.2
19,539
254,099
118.5
6,776
89,547
34.7
-1,821
1,789
1,827
20,169
Note: Preliminary data
Legend:a - in specified unit (at 1995 current prices)b - from beginning of 1995 (Sk millions)c - index (same period of previous year = 100, cumulative figures)d - percentage of total monthly volume
Source: Statistical Office of the SR

State Budget
State budget revenue
(Sk millions) */
State budget expenditure
(Sk millions) */
State budget balance
(Sk millions)
a
b
a
b
a
1995
1
11,071
-
9,120
24.1
1,951
2
17,739
-
21,913
57.8
-4,174
3
33,222
22.7
37,275
22.3
-4,053
4
47,642
32.5
50,651
30.3
-3,009
5
60,352
41.2
66,382
39.6
-6,030
6
75,414
51.5
75,317
45.0
97
7
90,895
62.1
92,344
55.2
-1,450
8
101,994
69.7
102,937
61.5
-943
9
114,349
78.1
117,227
70.0
-2,878
10
130,881
89.4
133,068
79.5
-2,187
11
142,654
97.4
150,427
89.9
-7,773
12
163,138
111.4
171,437
102.4
-8,299
*/ January to February 1995: in comparison with the provisional budget; since March 1995: in comparison with the approved budget
Legend:a - in specified unit, cumulative figuresb - percentage of budget performance
Sources: Statistical Office of the SR and Ministry of Finance
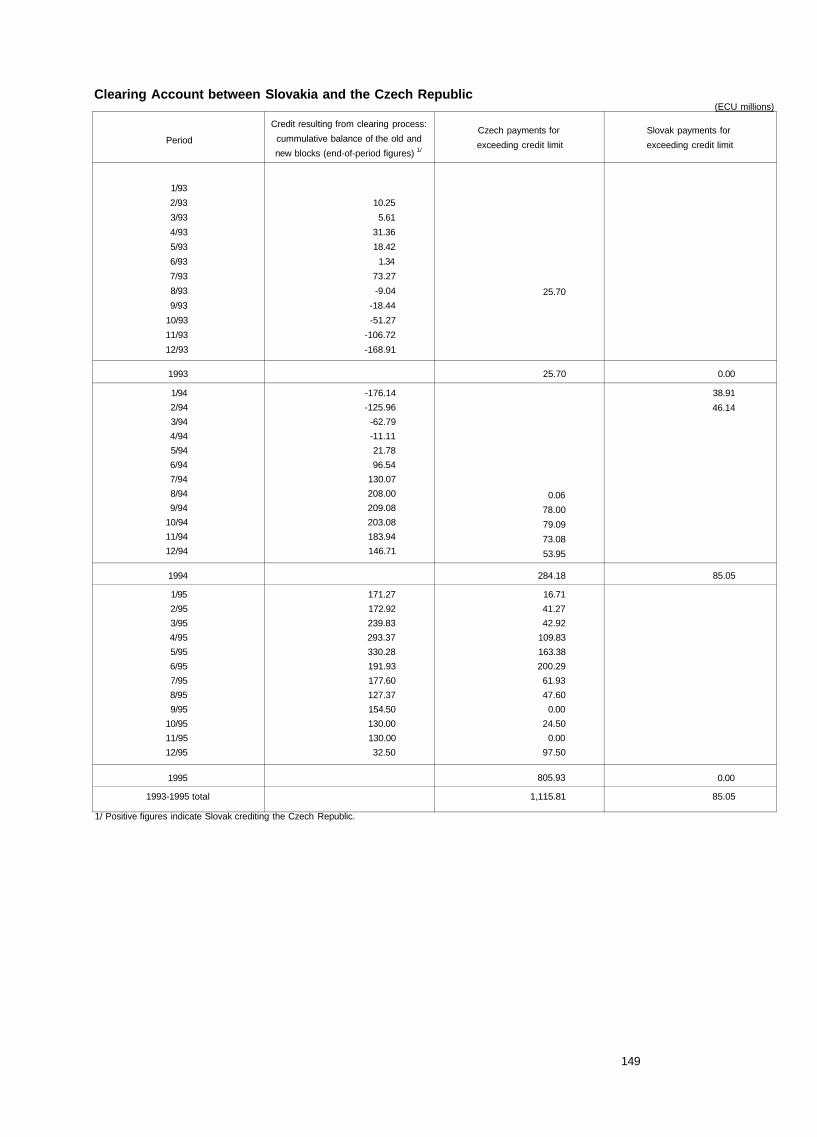
Clearing Account between Slovakia and the Czech Republic(ECU millions)
Period
1/93
2/93
3/93
4/93
5/93
6/93
7/93
8/93
9/93
10/93
11/93
12/93
1993
1/94
2/94
3/94
4/94
5/94
6/94
7/94
8/94
9/94
10/94
11/94
12/94
1994
1/95
2/95
3/95
4/95
5/95
6/95
7/95
8/95
9/95
10/95
11/95
12/95
1995
1993-1995 total
Credit resulting from clearing process:
cummulative balance of the old and
new blocks (end-of-period figures) 1/
10.25
5.61
31.36
18.42
1.34
73.27
-9.04
-18.44
-51.27
-106.72
-168.91
-176.14
-125.96
-62.79
-11.11
21.78
96.54
130.07
208.00
209.08
203.08
183.94
146.71
171.27
172.92
239.83
293.37
330.28
191.93
177.60
127.37
154.50
130.00
130.00
32.50
Czech payments for
exceeding credit limit
25.70
25.70
0.06
78.00
79.09
73.08
53.95
284.18
16.71
41.27
42.92
109.83
163.38
200.29
61.93
47.60
0.00
24.50
0.00
97.50
805.93
1,115.81
Slovak payments for
exceeding credit limit
0.00
38.91
46.14
85.05
0.00
85.05
1/ Positive figures indicate Slovak crediting the Czech Republic.
149
The National Bank of Slovakia Publications
Regular publications
Menový prehl'ad / Monetary Survey (monthly bulletin)Výročná správa / Annual ReportBanky na Slovensku / Banks in Slovakia (yearly)
BIATEC - banking journal (monthly, selected articles in English)
Other publications
- Legislation documents:National Bank of Slovakia ActAccountancy ActDevízový zákon / Foreign Exchange ActZákon o bankách / Act on Banks (1996)Zákon o ochrane vkladov / Act on Protection of Bank Deposits (1996)
- Working papers of the Institute of monetary and financial studies of the NBS:Money Supply in the Slovak RepublicHypotekárne nástrojeMortgage InstrumentsZahraničný kapitál v ekonomike Slovenska (1996)Foreign Capital in the Economy of Slovakia (1996)
- Information on Slovak banknotes, coins, and commemorative coins