Embed Size (px)
Citation preview
IBE5670/DC004 Rev 0
NS2 Freshwater Pearl Mussel Sub-Basin Management Plans
Phytobenthos monitoring of the Clodiagh Catchment, Co.
Waterford. (SERBD)
June & July 2009
Clodiagh, downstream Clonea Bridge
Dr Bernadette Ní Chatháin
RPS Consulting Engineers, Mulkear House, Newtown Centre, Annacotty, Co. Limerick.
IBE5670/DC004 Rev 0
DOCUMENT CONTROL SHEET
Client Donegal County Council
Project Title National Freshwater Pearl Mussel Sub-Basin Management Plans
Document Title NS2 Clodiagh Phytobenthos Report
Document No. DC026
DCS TOC Text List of Tables List of Figures No. of
Appendices This Document Comprises
1 1 20 0 0 2
Rev. Status Author(s) Reviewed By Approved By Office of Origin Issue Date
0 Draft Bernadette Ní
Chatháin
Bernadette Ní Chatháin
Limerick March 2010
IBE5670/DC004 Rev 0
Table of contents
1.0 Introduction............................................................................................................. 4 2 Methodology ............................................................................................................... 6
2.1 Macroscopic algae .............................................................................................. 6 2.2 Diatoms ............................................................................................................... 7
3 Results......................................................................................................................... 9 3.1 Macroscopic algae .............................................................................................. 9 3.2 Diatoms ............................................................................................................. 13
4.0 Discussion of results ............................................................................................. 17 References......................................................................................................................... 19 Appendix I – Site survey condition assessments .............................................................. 21 Appendix II – Site photographs and macroalgal photographs.......................................... 23
IBE5670/DC004 Rev 0
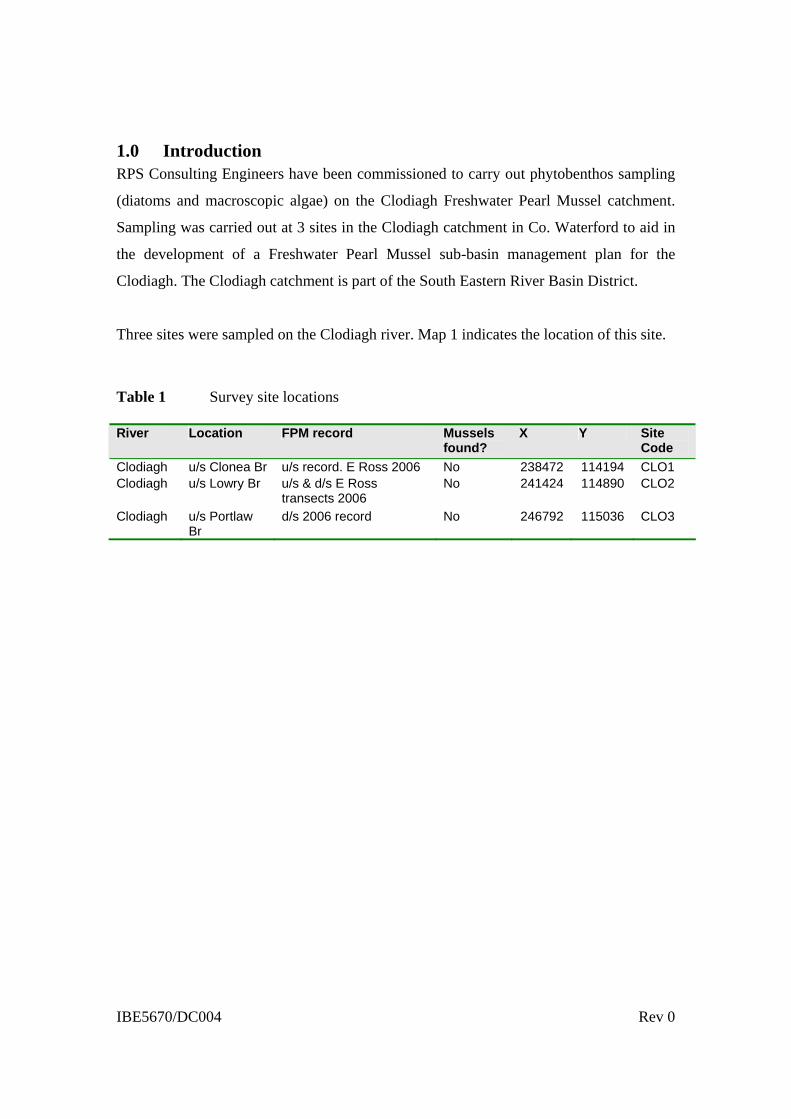
1.0 Introduction RPS Consulting Engineers have been commissioned to carry out phytobenthos sampling
(diatoms and macroscopic algae) on the Clodiagh Freshwater Pearl Mussel catchment.
Sampling was carried out at 3 sites in the Clodiagh catchment in Co. Waterford to aid in
the development of a Freshwater Pearl Mussel sub-basin management plan for the
Clodiagh. The Clodiagh catchment is part of the South Eastern River Basin District.
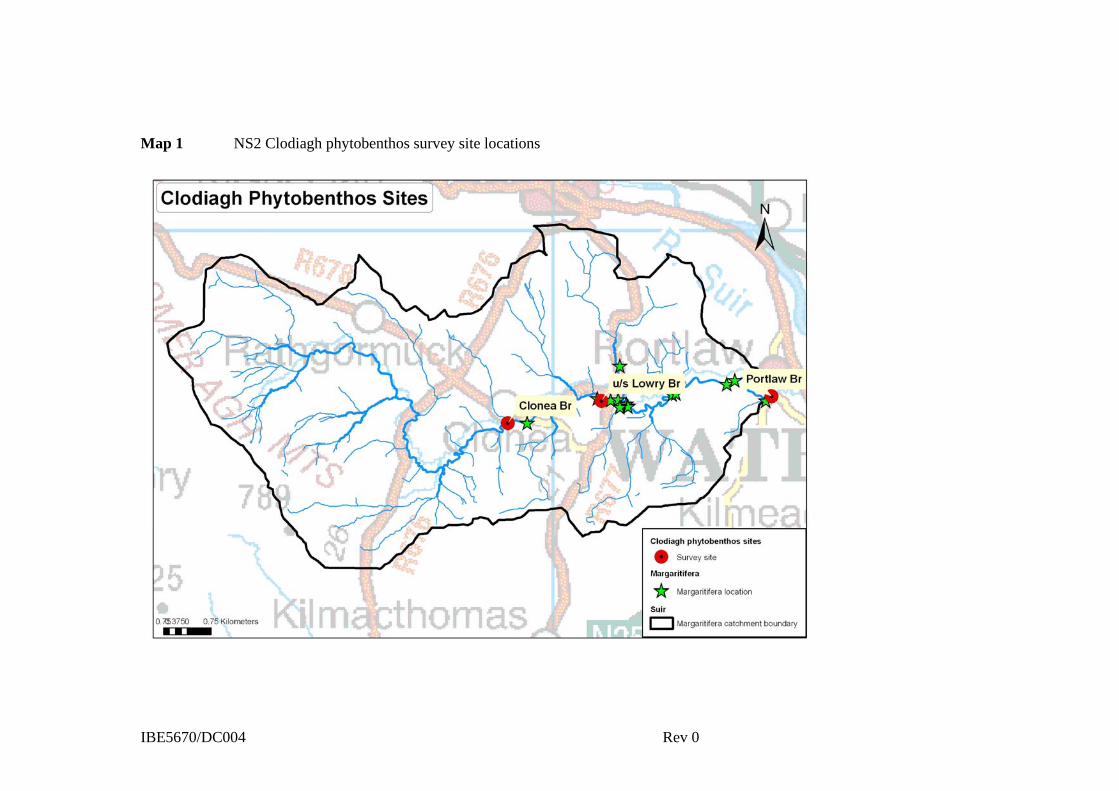
Three sites were sampled on the Clodiagh river. Map 1 indicates the location of this site.
Table 1 Survey site locations River Location FPM record Mussels
found? X Y Site
Code
Clodiagh u/s Clonea Br u/s record. E Ross 2006 No 238472 114194 CLO1 Clodiagh u/s Lowry Br u/s & d/s E Ross
transects 2006 No 241424 114890 CLO2
Clodiagh u/s Portlaw Br
d/s 2006 record No 246792 115036 CLO3
IBE5670/DC004 Rev 0
Map 1 NS2 Clodiagh phytobenthos survey site locations
IBE5670/DC004 Rev 0
2 Methodology
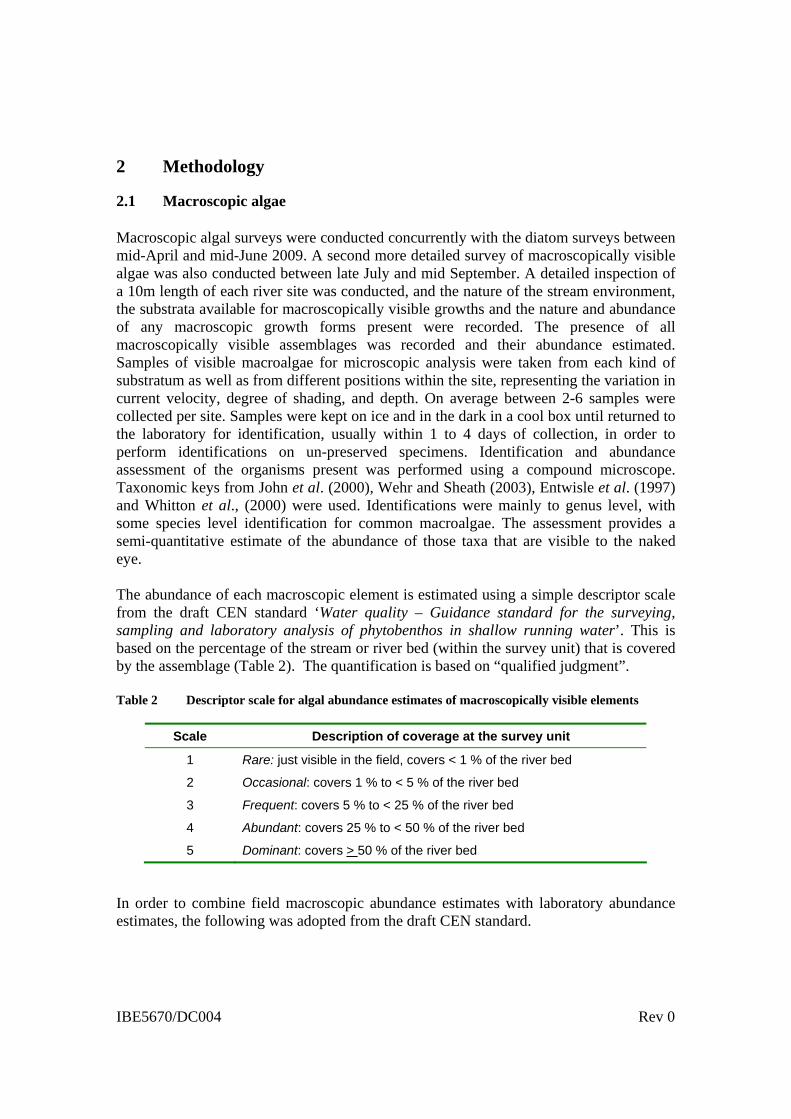
2.1 Macroscopic algae Macroscopic algal surveys were conducted concurrently with the diatom surveys between mid-April and mid-June 2009. A second more detailed survey of macroscopically visible algae was also conducted between late July and mid September. A detailed inspection of a 10m length of each river site was conducted, and the nature of the stream environment, the substrata available for macroscopically visible growths and the nature and abundance of any macroscopic growth forms present were recorded. The presence of all macroscopically visible assemblages was recorded and their abundance estimated. Samples of visible macroalgae for microscopic analysis were taken from each kind of substratum as well as from different positions within the site, representing the variation in current velocity, degree of shading, and depth. On average between 2-6 samples were collected per site. Samples were kept on ice and in the dark in a cool box until returned to the laboratory for identification, usually within 1 to 4 days of collection, in order to perform identifications on un-preserved specimens. Identification and abundance assessment of the organisms present was performed using a compound microscope. Taxonomic keys from John et al. (2000), Wehr and Sheath (2003), Entwisle et al. (1997) and Whitton et al., (2000) were used. Identifications were mainly to genus level, with some species level identification for common macroalgae. The assessment provides a semi-quantitative estimate of the abundance of those taxa that are visible to the naked eye. The abundance of each macroscopic element is estimated using a simple descriptor scale from the draft CEN standard ‘Water quality – Guidance standard for the surveying, sampling and laboratory analysis of phytobenthos in shallow running water’. This is based on the percentage of the stream or river bed (within the survey unit) that is covered by the assemblage (Table 2). The quantification is based on “qualified judgment”. Table 2 Descriptor scale for algal abundance estimates of macroscopically visible elements
Scale Description of coverage at the survey unit
1 Rare: just visible in the field, covers < 1 % of the river bed
2 Occasional: covers 1 % to < 5 % of the river bed
3 Frequent: covers 5 % to < 25 % of the river bed
4 Abundant: covers 25 % to < 50 % of the river bed
5 Dominant: covers > 50 % of the river bed
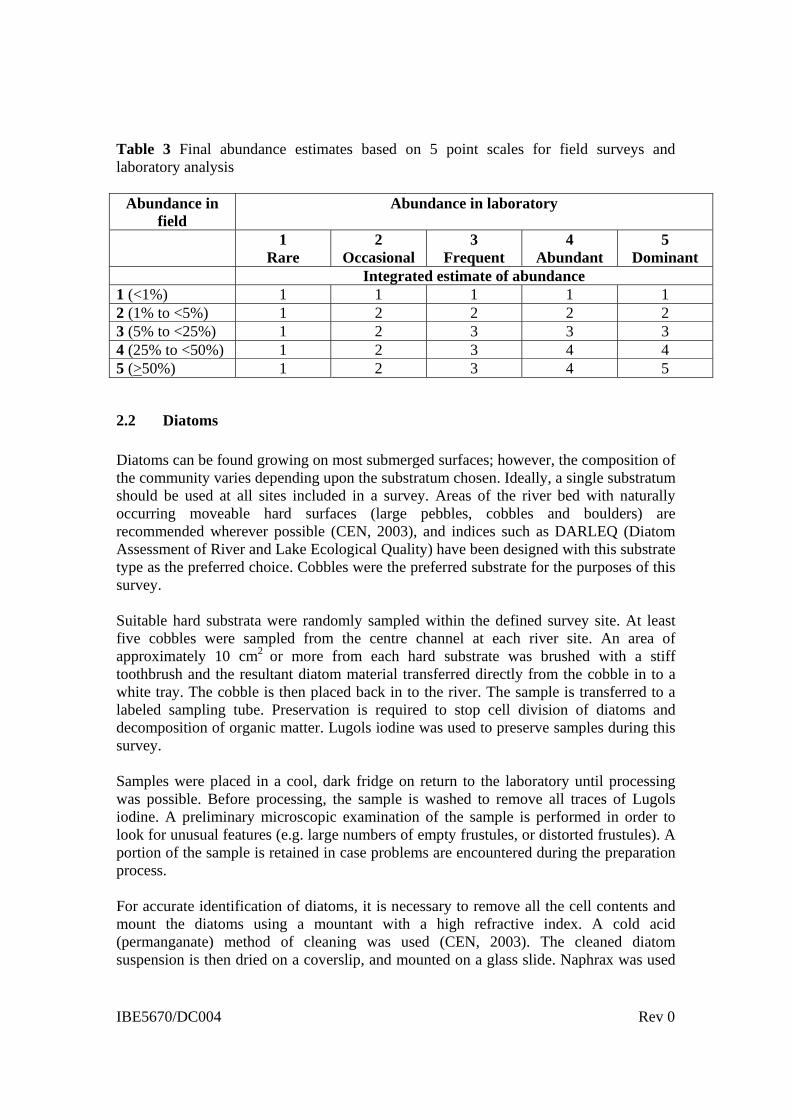
In order to combine field macroscopic abundance estimates with laboratory abundance estimates, the following was adopted from the draft CEN standard.
IBE5670/DC004 Rev 0
Table 3 Final abundance estimates based on 5 point scales for field surveys and laboratory analysis
Abundance in field
Abundance in laboratory
1 Rare
2 Occasional
3 Frequent
4 Abundant
5 Dominant
Integrated estimate of abundance 1 (<1%) 1 1 1 1 1 2 (1% to <5%) 1 2 2 2 2 3 (5% to <25%) 1 2 3 3 3 4 (25% to <50%) 1 2 3 4 4 5 (>50%) 1 2 3 4 5
2.2 Diatoms
Diatoms can be found growing on most submerged surfaces; however, the composition of the community varies depending upon the substratum chosen. Ideally, a single substratum should be used at all sites included in a survey. Areas of the river bed with naturally occurring moveable hard surfaces (large pebbles, cobbles and boulders) are recommended wherever possible (CEN, 2003), and indices such as DARLEQ (Diatom Assessment of River and Lake Ecological Quality) have been designed with this substrate type as the preferred choice. Cobbles were the preferred substrate for the purposes of this survey. Suitable hard substrata were randomly sampled within the defined survey site. At least five cobbles were sampled from the centre channel at each river site. An area of approximately 10 cm2
or more from each hard substrate was brushed with a stiff toothbrush and the resultant diatom material transferred directly from the cobble in to a white tray. The cobble is then placed back in to the river. The sample is transferred to a labeled sampling tube. Preservation is required to stop cell division of diatoms and decomposition of organic matter. Lugols iodine was used to preserve samples during this survey. Samples were placed in a cool, dark fridge on return to the laboratory until processing was possible. Before processing, the sample is washed to remove all traces of Lugols iodine. A preliminary microscopic examination of the sample is performed in order to look for unusual features (e.g. large numbers of empty frustules, or distorted frustules). A portion of the sample is retained in case problems are encountered during the preparation process. For accurate identification of diatoms, it is necessary to remove all the cell contents and mount the diatoms using a mountant with a high refractive index. A cold acid (permanganate) method of cleaning was used (CEN, 2003). The cleaned diatom suspension is then dried on a coverslip, and mounted on a glass slide. Naphrax was used
IBE5670/DC004 Rev 0
as the mounting medium. The slide is labeled with details of the river, site, sampling date, type of sample (riffle) and analyst’s initials. Diatom valves were identified and counted at 1000x magnification until a minimum of 300 valves are enumerated and identified. The identification of diatoms followed the nomenclature in the monographs of Krammer and Lange-Bertalot (1986-1991), and any subsequent revisions of taxa were also adhered to. Results were entered in to excel and then analysed using a Microsoft windows programme designed as part of the DARLEQ project – Diatom Assessment of River and Lake Ecological Quality. The program implements a classification algorithm using a metric based on a revised Trophic Diatom Index (TDI). Details of the metric, algorithm and derivation of the status class boundaries are provided in Kelly et al. (2006 and 2008). The programme calculates the TDI score, Ecological Quality Ratio (EQR) and status class for each sample. EQRs are produced by comparing the observed TDI with that expected to be obtained if the site was at reference condition i.e. in the absence of eutrophication pressures.
IBE5670/DC004 Rev 0
3 Results The composition and abundance of the macroscopically visible algae at the sampling sites are presented in Section 3.1 below. The results from the diatom assessment includes the composition and abundance of each taxon and the results from the calculation of the Trophic Diatom Index which provides an EQR and Water Framework Directive status class for each site. These results are presented in Section 3.2. Site survey condition assessments were also completed for each site, and results are presented in Appendix I. Photographs taken of each site during sampling, and of macroalgae identified from each site are included in Appendix II.
3.1 Macroscopic algae
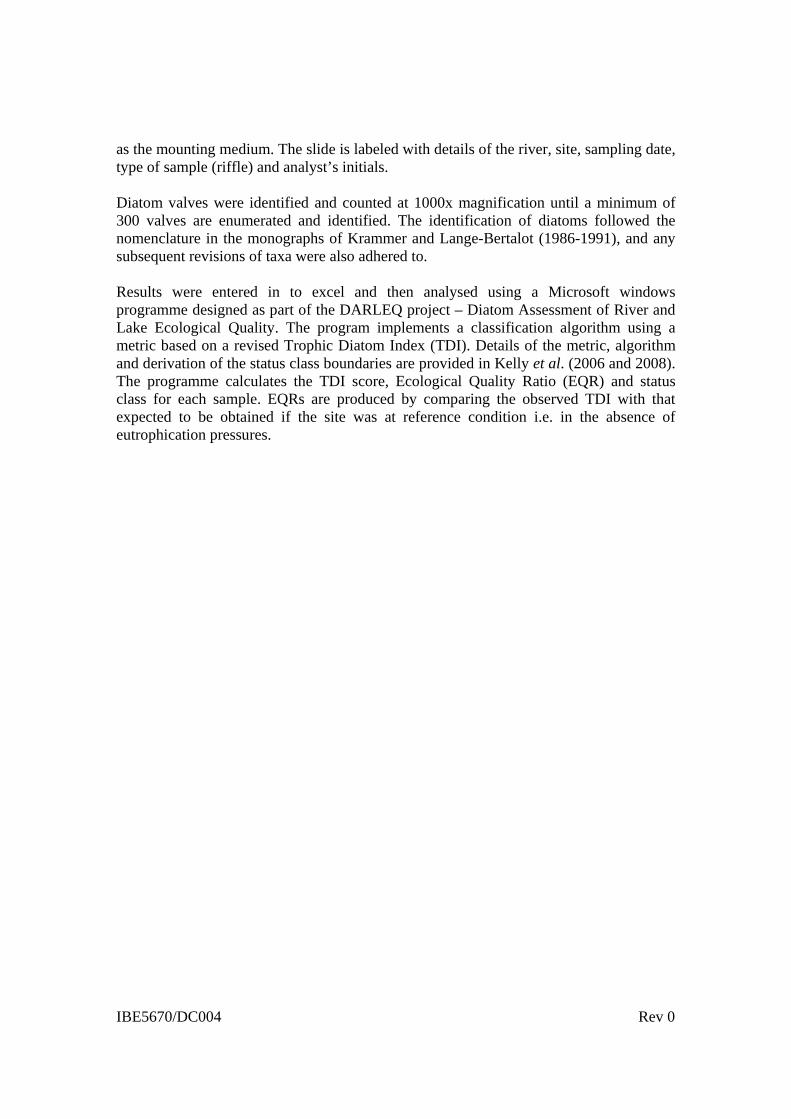
Table 4 June 2009 macroscopic algal composition and abundance (See Table 3 for explanation of ‘final abundance’)
Site No NS2_FPM_59 NS2_FPM_60 NS2_FPM_61 Catchment Clodiagh Clodiagh Clodiagh River Clodiagh Clodiagh Clodiagh Location u/s Clonea Br u/s Lowry Br u/s Portlaw Br FPM record u/s record. E Ross 2006 u/s & d/s E Ross
transects 2006 d/s 2006 record
Mussels found? No No No X 238472 241424 246792 Y 114194 114890 115036 Site Code CLO1 CLO2 CLO3 Date sampled 08/06/2009 08/06/2009 08/06/2009 % Abundance of MA in field
5 to <10% none visible none visible
Presence/ absence
Final abundance
Cladophora glomerata Present 3
IBE5670/DC004 Rev 0
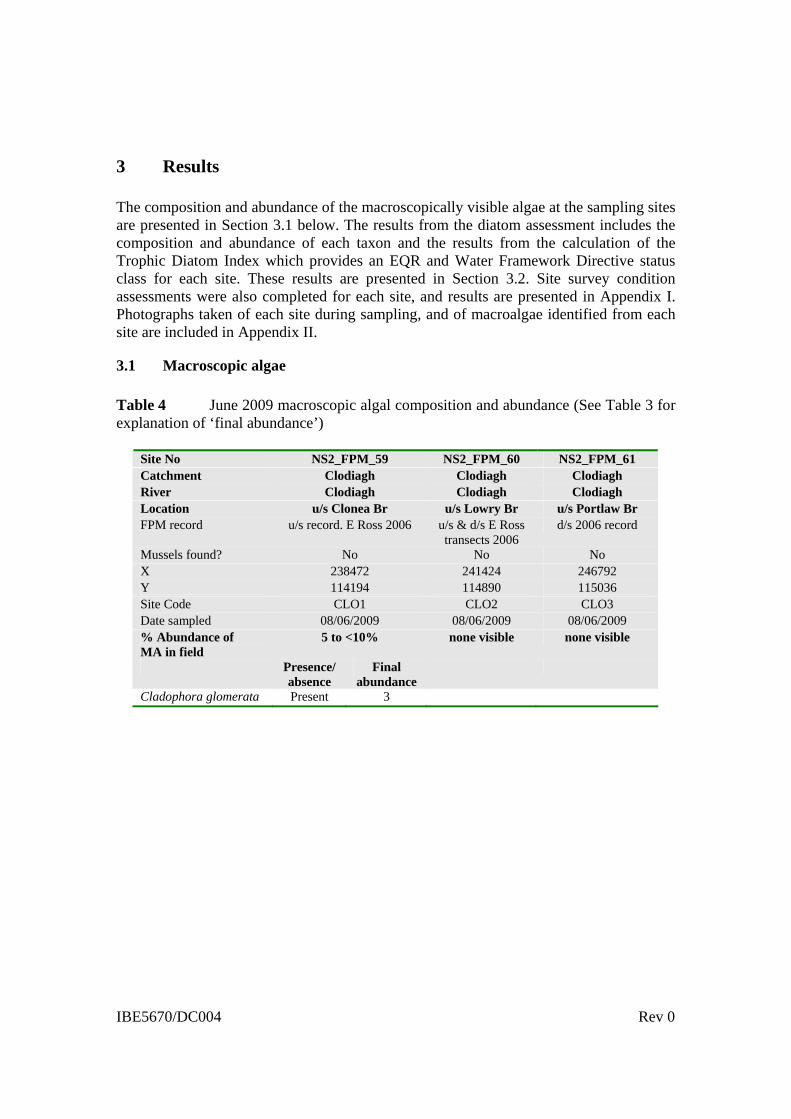
Table 5 July 2009 macroscopic algal composition and abundance (See Table 3 for explanation of ‘final abundance’) Sample No NS2_FPM_59 NS2_FPM_60 NS2_FPM_61 Catchment Clodiagh Clodiagh Clodiagh River Clodiagh Clodiagh Clodiagh Location u/s Clonea Br u/s Lowry Br u/s Portlaw Br FPM record u/s record. E Ross 2006 u/s & d/s E Ross
transects 2006 d/s 2006 record
Mussels found? No No No X 238472 241424 246792 Y 114194 114890 115036 Site Code CLO1 CLO2 CLO3 Date sampled 27/07/2009 27/07/2009 % Abundance of MA in field 5 to <10% Not sampled due
High water levels 1 to <5%
Presence/ Absence
Final abundance
Presence/ Absence
Final abundance
Chamaesiphon incrustans Present 1 Cladophora glomerata Present 2 Hildenbrandia rivulare Present 1 Lemanea fluviatilis Present 1
IBE5670/DC004 Rev 0
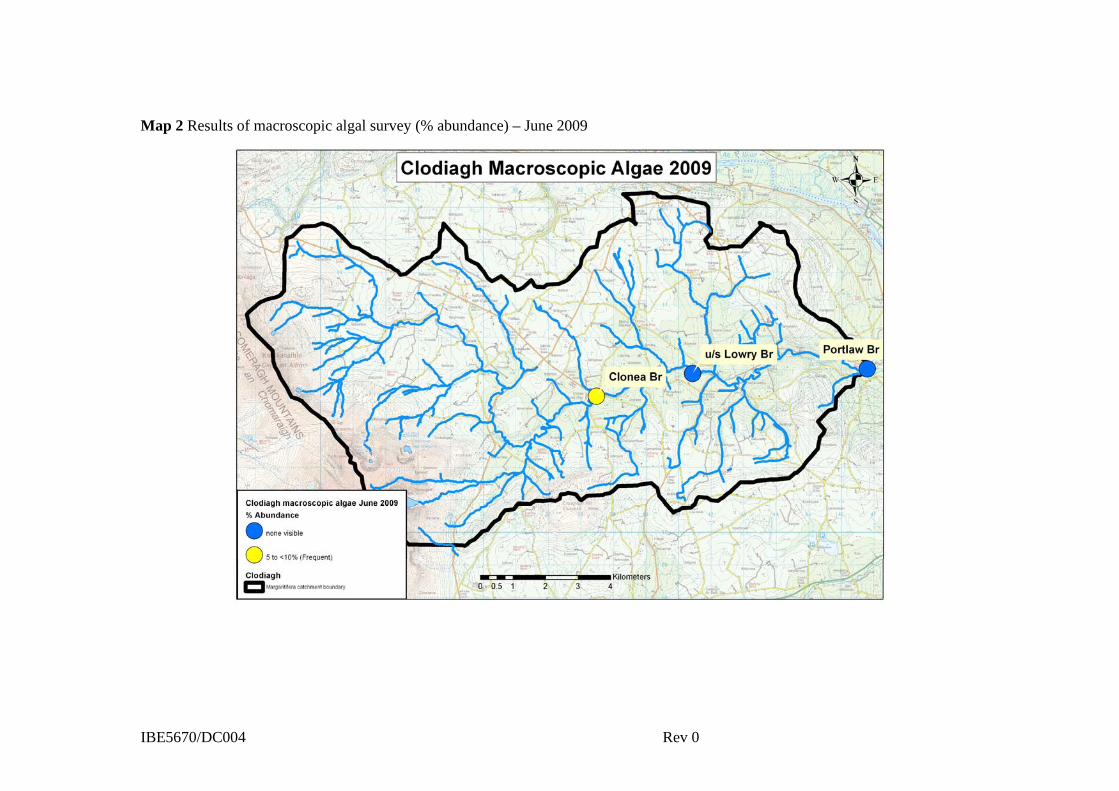
Map 2 Results of macroscopic algal survey (% abundance) – June 2009
IBE5670/DC004 Rev 0
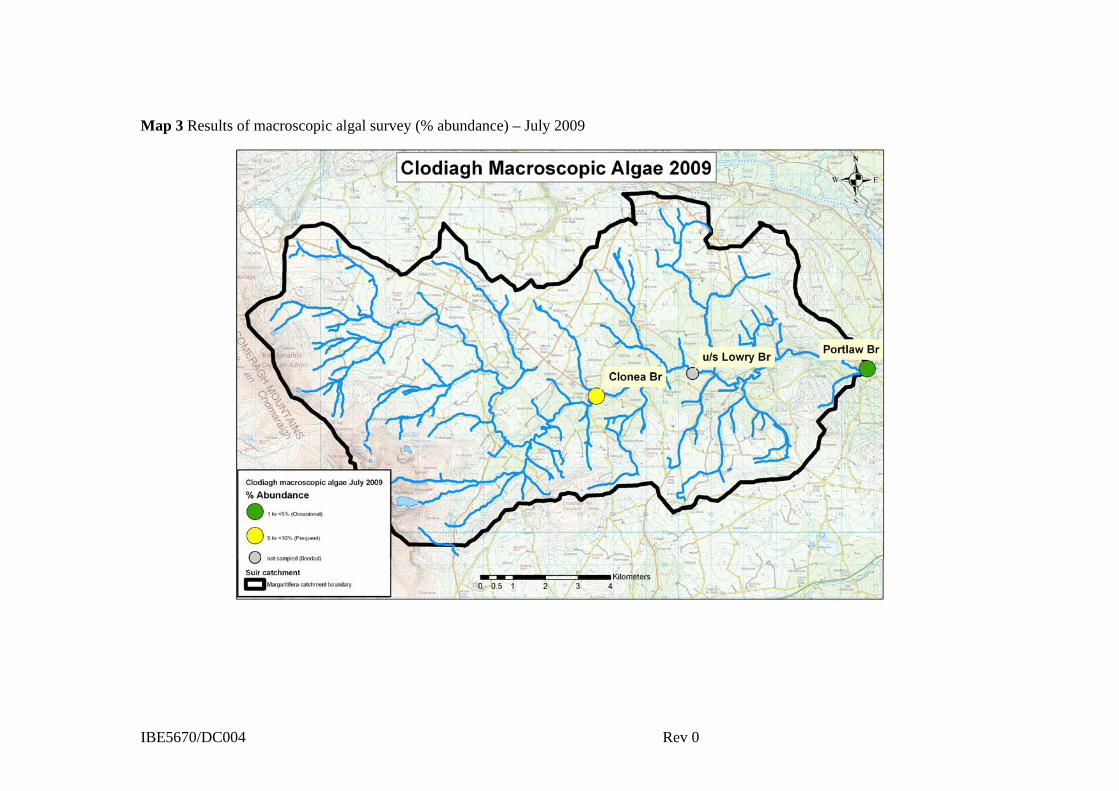
Map 3 Results of macroscopic algal survey (% abundance) – July 2009
IBE5670/DC004 Rev 0
3.2 Diatoms
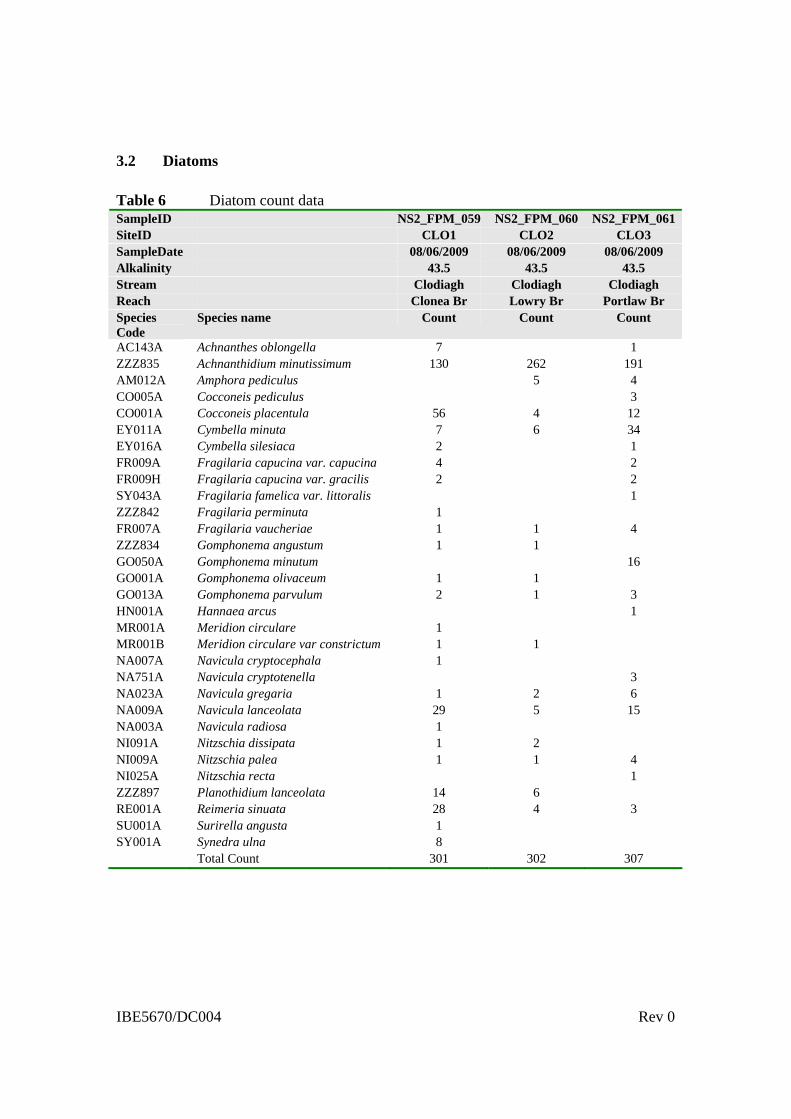
Table 6 Diatom count data SampleID NS2_FPM_059 NS2_FPM_060 NS2_FPM_061 SiteID CLO1 CLO2 CLO3 SampleDate 08/06/2009 08/06/2009 08/06/2009 Alkalinity 43.5 43.5 43.5 Stream Clodiagh Clodiagh Clodiagh Reach Clonea Br Lowry Br Portlaw Br Species Code
Species name Count Count Count
AC143A Achnanthes oblongella 7 1 ZZZ835 Achnanthidium minutissimum 130 262 191 AM012A Amphora pediculus 5 4 CO005A Cocconeis pediculus 3 CO001A Cocconeis placentula 56 4 12 EY011A Cymbella minuta 7 6 34 EY016A Cymbella silesiaca 2 1 FR009A Fragilaria capucina var. capucina 4 2 FR009H Fragilaria capucina var. gracilis 2 2 SY043A Fragilaria famelica var. littoralis 1 ZZZ842 Fragilaria perminuta 1 FR007A Fragilaria vaucheriae 1 1 4 ZZZ834 Gomphonema angustum 1 1 GO050A Gomphonema minutum 16 GO001A Gomphonema olivaceum 1 1 GO013A Gomphonema parvulum 2 1 3 HN001A Hannaea arcus 1 MR001A Meridion circulare 1 MR001B Meridion circulare var constrictum 1 1 NA007A Navicula cryptocephala 1 NA751A Navicula cryptotenella 3 NA023A Navicula gregaria 1 2 6 NA009A Navicula lanceolata 29 5 15 NA003A Navicula radiosa 1 NI091A Nitzschia dissipata 1 2 NI009A Nitzschia palea 1 1 4 NI025A Nitzschia recta 1 ZZZ897 Planothidium lanceolata 14 6 RE001A Reimeria sinuata 28 4 3 SU001A Surirella angusta 1 SY001A Synedra ulna 8 Total Count 301 302 307
IBE5670/DC004 Rev 0
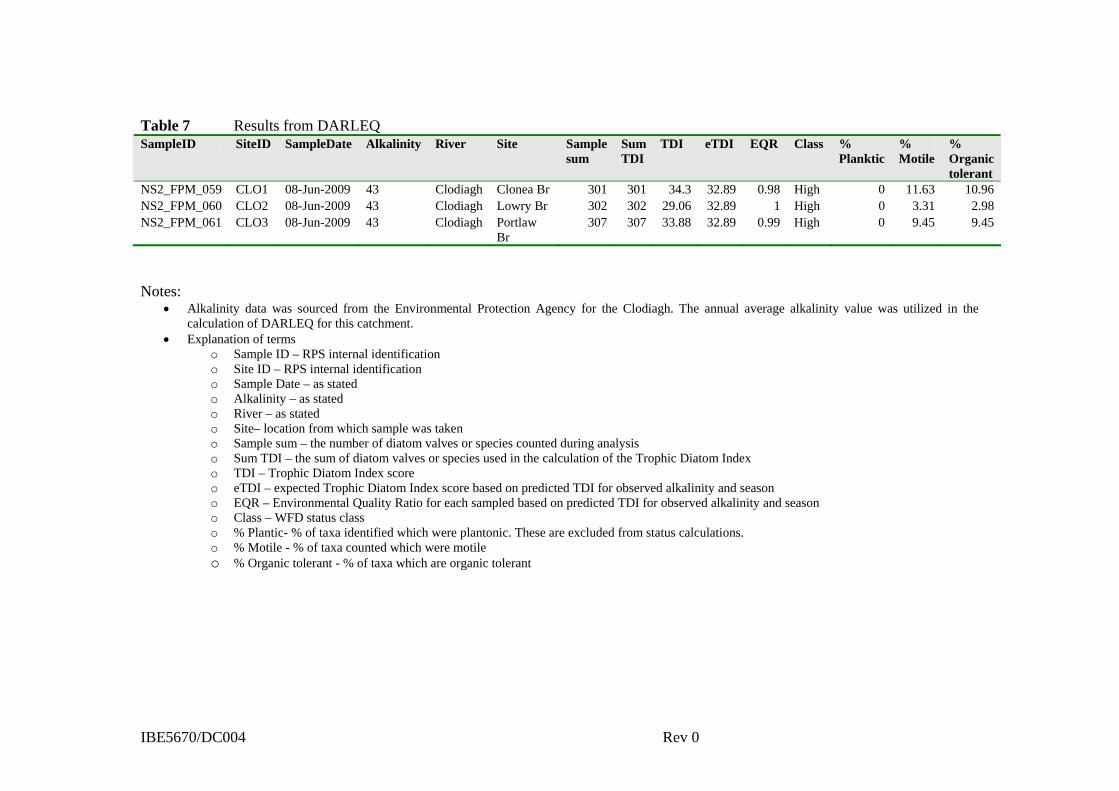
Table 7 Results from DARLEQ SampleID SiteID SampleDate Alkalinity River Site Sample
sum Sum TDI
TDI eTDI EQR Class % Planktic
% Motile
% Organic tolerant
NS2_FPM_059 CLO1 08-Jun-2009 43 Clodiagh Clonea Br 301 301 34.3 32.89 0.98 High 0 11.63 10.96 NS2_FPM_060 CLO2 08-Jun-2009 43 Clodiagh Lowry Br 302 302 29.06 32.89 1 High 0 3.31 2.98 NS2_FPM_061 CLO3 08-Jun-2009 43 Clodiagh Portlaw
Br 307 307 33.88 32.89 0.99 High 0 9.45 9.45
Notes:
Alkalinity data was sourced from the Environmental Protection Agency for the Clodiagh. The annual average alkalinity value was utilized in the calculation of DARLEQ for this catchment.
Explanation of terms o Sample ID – RPS internal identification o Site ID – RPS internal identification o Sample Date – as stated o Alkalinity – as stated o River – as stated o Site– location from which sample was taken o Sample sum – the number of diatom valves or species counted during analysis o Sum TDI – the sum of diatom valves or species used in the calculation of the Trophic Diatom Index o TDI – Trophic Diatom Index score o eTDI – expected Trophic Diatom Index score based on predicted TDI for observed alkalinity and season o EQR – Environmental Quality Ratio for each sampled based on predicted TDI for observed alkalinity and season o Class – WFD status class o % Plantic- % of taxa identified which were plantonic. These are excluded from status calculations. o % Motile - % of taxa counted which were motile o % Organic tolerant - % of taxa which are organic tolerant
IBE5670/DC004 Rev 0
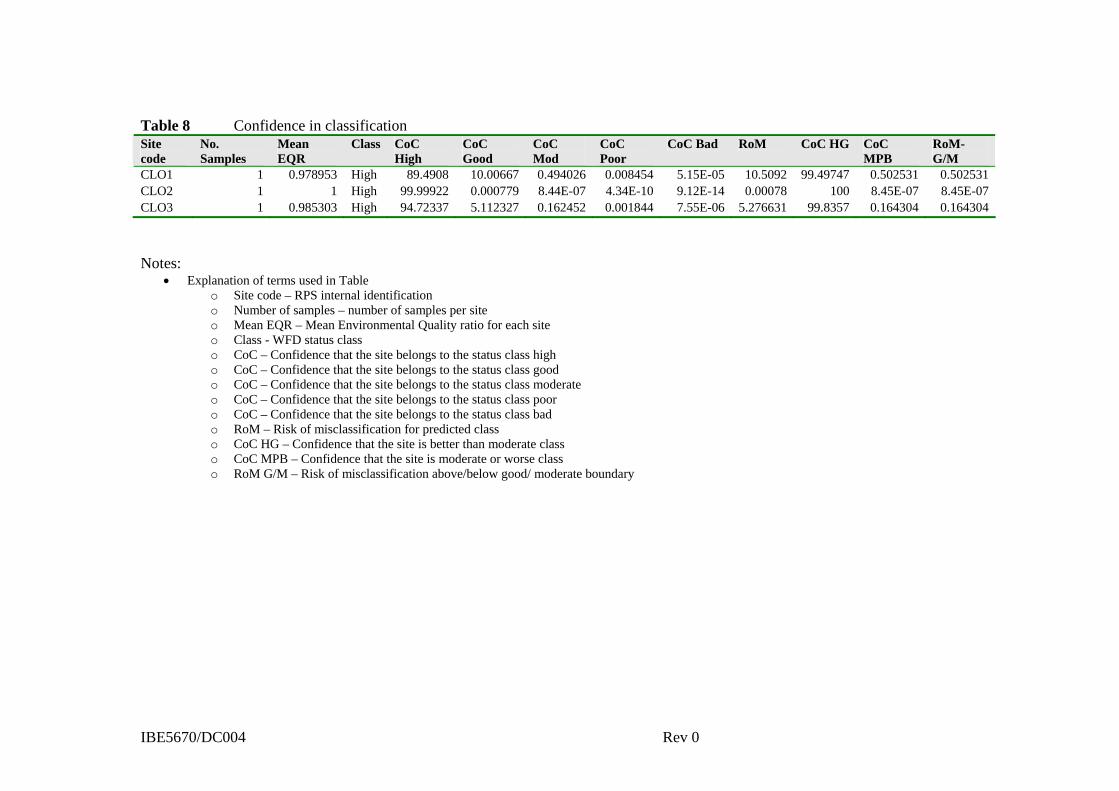
Table 8 Confidence in classification Site code
No. Samples
Mean EQR
Class CoC High
CoC Good
CoC Mod
CoC Poor
CoC Bad RoM CoC HG CoC MPB
RoM-G/M
CLO1 1 0.978953 High 89.4908 10.00667 0.494026 0.008454 5.15E-05 10.5092 99.49747 0.502531 0.502531 CLO2 1 1 High 99.99922 0.000779 8.44E-07 4.34E-10 9.12E-14 0.00078 100 8.45E-07 8.45E-07 CLO3 1 0.985303 High 94.72337 5.112327 0.162452 0.001844 7.55E-06 5.276631 99.8357 0.164304 0.164304
Notes:
Explanation of terms used in Table o Site code – RPS internal identification o Number of samples – number of samples per site o Mean EQR – Mean Environmental Quality ratio for each site o Class - WFD status class o CoC – Confidence that the site belongs to the status class high o CoC – Confidence that the site belongs to the status class good o CoC – Confidence that the site belongs to the status class moderate o CoC – Confidence that the site belongs to the status class poor o CoC – Confidence that the site belongs to the status class bad o RoM – Risk of misclassification for predicted class o CoC HG – Confidence that the site is better than moderate class o CoC MPB – Confidence that the site is moderate or worse class o RoM G/M – Risk of misclassification above/below good/ moderate boundary
IBE5670/DC004 Rev 0
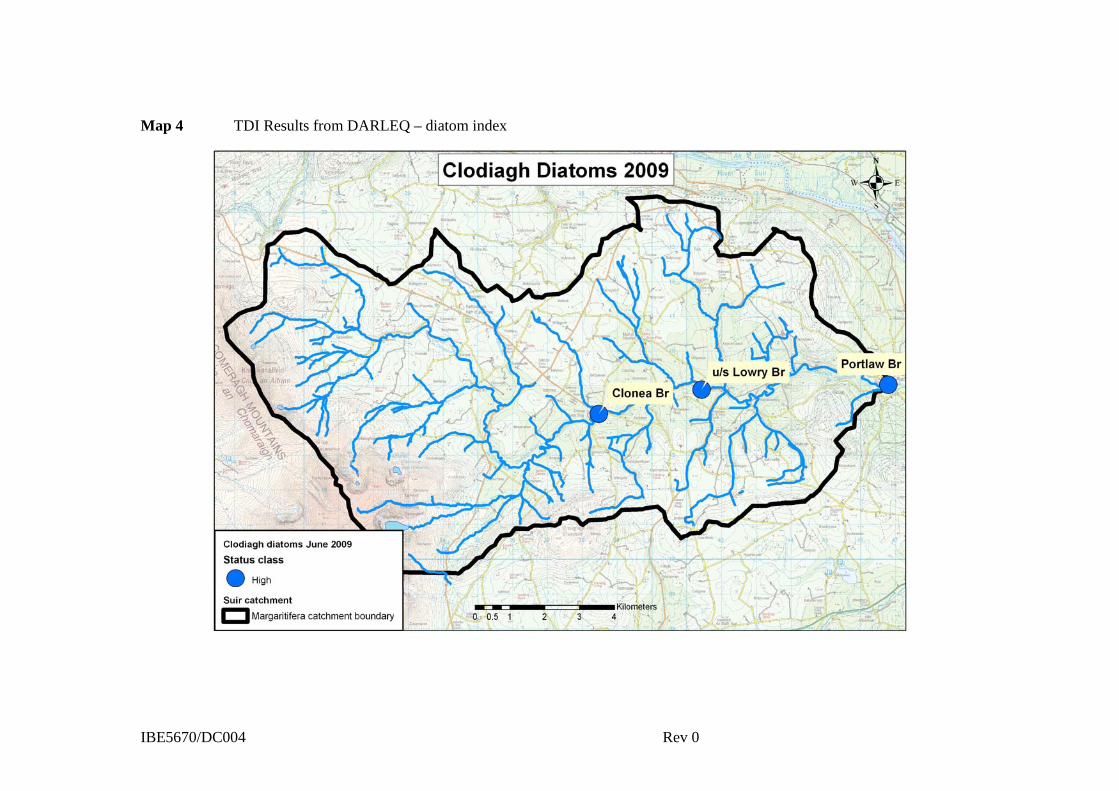
Map 4 TDI Results from DARLEQ – diatom index
IBE5670/DC004 Rev 0
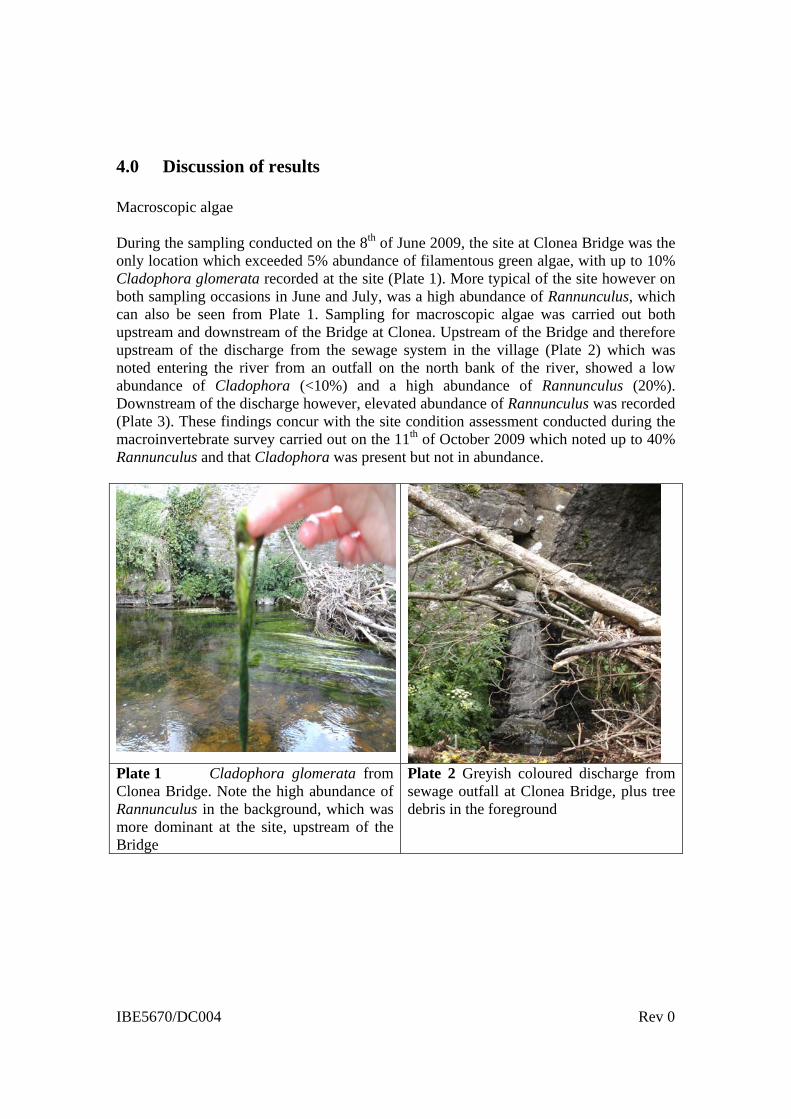
4.0 Discussion of results Macroscopic algae During the sampling conducted on the 8th of June 2009, the site at Clonea Bridge was the only location which exceeded 5% abundance of filamentous green algae, with up to 10% Cladophora glomerata recorded at the site (Plate 1). More typical of the site however on both sampling occasions in June and July, was a high abundance of Rannunculus, which can also be seen from Plate 1. Sampling for macroscopic algae was carried out both upstream and downstream of the Bridge at Clonea. Upstream of the Bridge and therefore upstream of the discharge from the sewage system in the village (Plate 2) which was noted entering the river from an outfall on the north bank of the river, showed a low abundance of Cladophora (<10%) and a high abundance of Rannunculus (20%). Downstream of the discharge however, elevated abundance of Rannunculus was recorded (Plate 3). These findings concur with the site condition assessment conducted during the macroinvertebrate survey carried out on the 11th of October 2009 which noted up to 40% Rannunculus and that Cladophora was present but not in abundance.
Plate 1 Cladophora glomerata from Clonea Bridge. Note the high abundance of Rannunculus in the background, which was more dominant at the site, upstream of the Bridge
Plate 2 Greyish coloured discharge from sewage outfall at Clonea Bridge, plus tree debris in the foreground
IBE5670/DC004 Rev 0
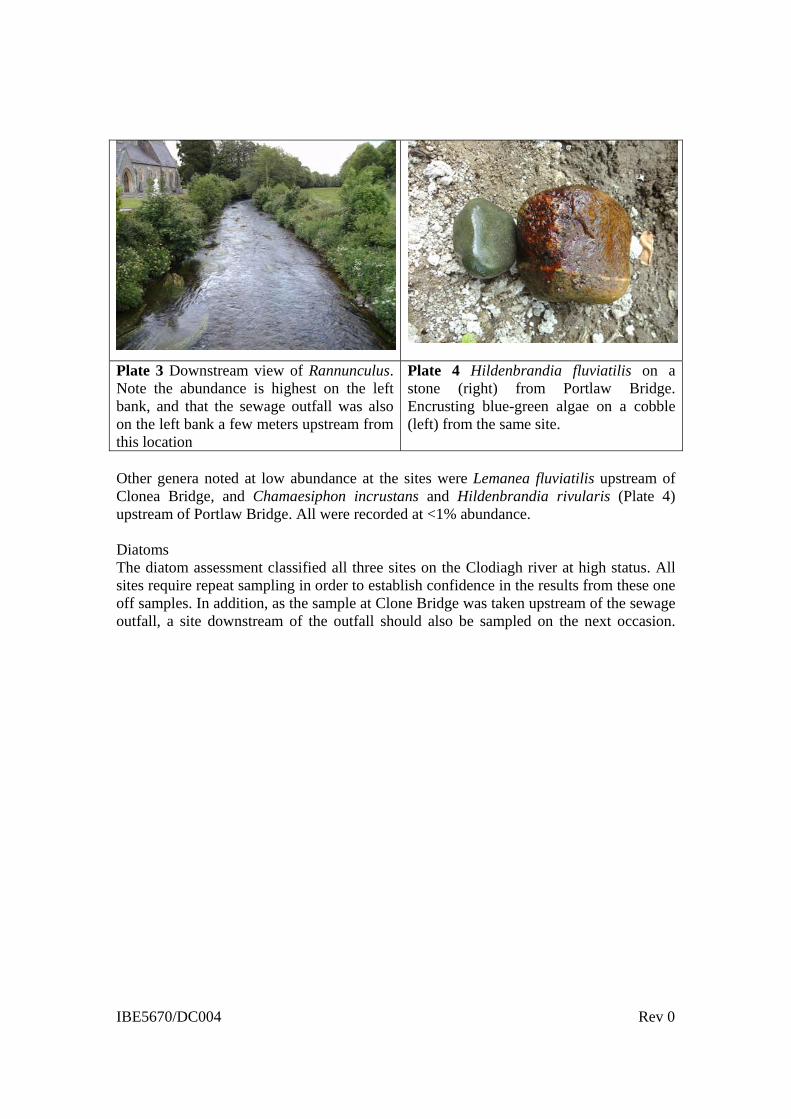
Plate 3 Downstream view of Rannunculus. Note the abundance is highest on the left bank, and that the sewage outfall was also on the left bank a few meters upstream from this location
Plate 4 Hildenbrandia fluviatilis on a stone (right) from Portlaw Bridge. Encrusting blue-green algae on a cobble (left) from the same site.
Other genera noted at low abundance at the sites were Lemanea fluviatilis upstream of Clonea Bridge, and Chamaesiphon incrustans and Hildenbrandia rivularis (Plate 4) upstream of Portlaw Bridge. All were recorded at <1% abundance. Diatoms The diatom assessment classified all three sites on the Clodiagh river at high status. All sites require repeat sampling in order to establish confidence in the results from these one off samples. In addition, as the sample at Clone Bridge was taken upstream of the sewage outfall, a site downstream of the outfall should also be sampled on the next occasion.
IBE5670/DC004 Rev 0
References CEN (2003). Water quality - Guidance standard for the routine sampling and pretreatment of benthic diatoms from rivers. EN 13946: 2003. Comité European de Normalisation, Geneva. CEN (2004). Water quality - Guidance standard for the identification, enumeration and interpretation of benthic diatom samples from running waters. EN 14407:2004. Comité European de Normalisation, Geneva. CEN standard (draft). Water quality – Guidance standard for the surveying, sampling and laboratory analysis of phytobenthos in shallow running water. John, D.M., Whitton, B.A. and Brook, A.J. (eds.) 2002 The freshwater algal flora of the British Isles. An identification guide to freshwater and terrestrial algal. Cambridge University Press. Kelly, M.G., Rippey, B., King, L., Ní Chatháin, B., McQuillan, C., and Poole, M. 2006. Use of phytobenthos for evaluating ecological status in Ireland. North South Shared Aquatic Resource (NS Share). Kelly, M.G., Juggins, S., Bennion, H., Burgess, A., Yallop, M., Hirst, H., King, L., Jamieson, J., Guthrie, R., Rippey, B. 2006. Use of diatoms for evaluating ecological status in UK freshwaters. Science Report – SC030103/SR4. Kelly. M.G., Juggins, S., Guthrie, R., Pritchard, S., Jamieson, J., Rippey, B., Hirst, H., and Yallop, M. 2008. Assessment of ecological status in U.K. rivers using diatoms. Freshwater Biology, 53, 403-422. Krammer, K. and Lange-Bertalot, H. 1986 Süsswasserflora von Mitteleuropa. Bacillariophyceae 2/1 Naviculaceae. Gustav Fischer, Stuttgart. Krammer, K. and Lange-Bertalot, H. 1988 Süsswasserflora von Mitteleuropa. Bacillariophyceae 2/2 Epithemiaceae, Surirellaceae. Gustav Fischer, Stuttgart. Krammer, K. and Lange-Bertalot, H. 1991a Süsswasserflora von Mitteleuropa. Bacillariophyceae 2/3 Centrales, Fragilariaceae, Eunotiaceae. Gustav Fischer, Stuttgart. Krammer, K. and Lange-Bertalot, H. 1991b Süsswasserflora von Mitteleuropa. Bacillariophyceae 2/4 Achnanthaceae und Gomphonema. Gustav Fischer, Stuttgart. Wehr, John D., and Sheath, Robert G. 2003. Freshwater Algae of North America – Ecology and Classification. Academic Press.

IBE5670/DC004 Rev 0
Whitton, B.A., Balbi, D.M., Gemmell, J.J., and Robinson, P.J. 2000 Blue-green algae of the British Isles interactive key to the species. (CD ROM). Department of Biological Sciences, University of Durham, Durham.

IBE5670/DC004 Rev 0
Appendix I – Site survey condition assessments
IBE5670/DC004 Rev 0
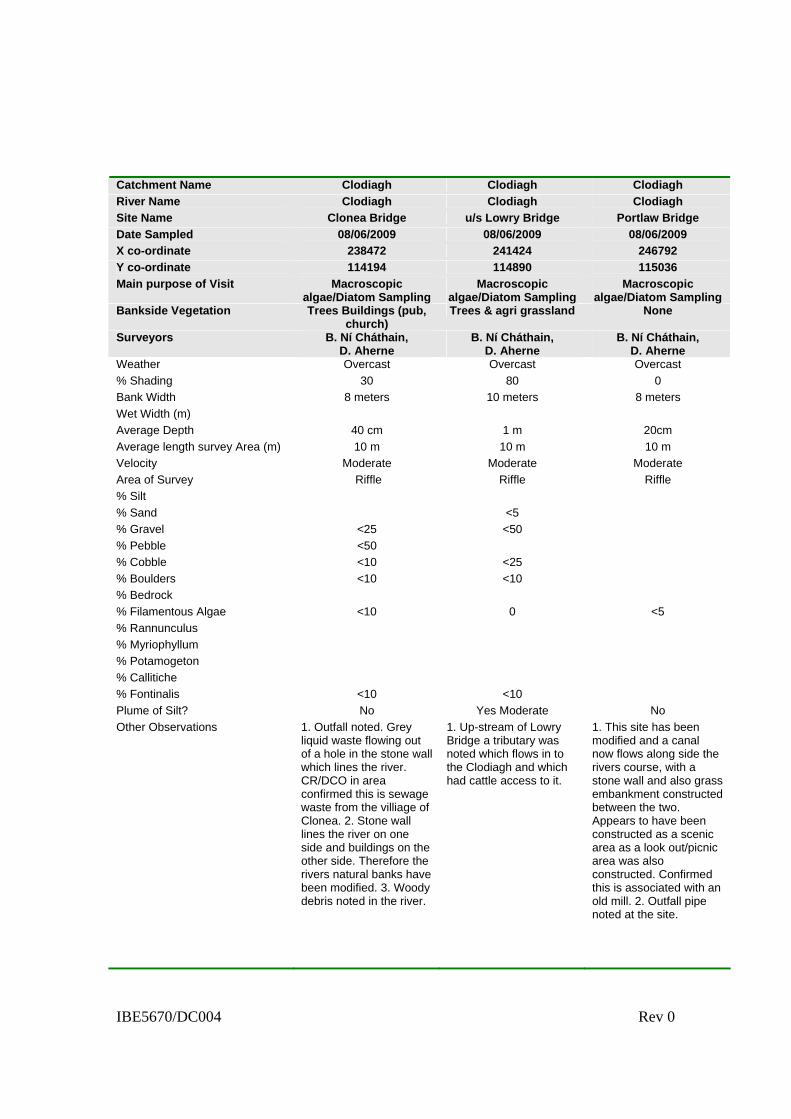
Catchment Name Clodiagh Clodiagh Clodiagh
River Name Clodiagh Clodiagh Clodiagh
Site Name Clonea Bridge u/s Lowry Bridge Portlaw Bridge
Date Sampled 08/06/2009 08/06/2009 08/06/2009
X co-ordinate 238472 241424 246792
Y co-ordinate 114194 114890 115036
Main purpose of Visit Macroscopic algae/Diatom Sampling
Macroscopic algae/Diatom Sampling
Macroscopic algae/Diatom Sampling
Bankside Vegetation Trees Buildings (pub, church)
Trees & agri grassland None
Surveyors B. Ní Cháthain, D. Aherne
B. Ní Cháthain, D. Aherne
B. Ní Cháthain, D. Aherne
Weather Overcast Overcast Overcast
% Shading 30 80 0
Bank Width 8 meters 10 meters 8 meters
Wet Width (m)
Average Depth 40 cm 1 m 20cm
Average length survey Area (m) 10 m 10 m 10 m
Velocity Moderate Moderate Moderate
Area of Survey Riffle Riffle Riffle
% Silt
% Sand <5
% Gravel <25 <50
% Pebble <50
% Cobble <10 <25
% Boulders <10 <10
% Bedrock
% Filamentous Algae <10 0 <5
% Rannunculus
% Myriophyllum
% Potamogeton
% Callitiche
% Fontinalis <10 <10
Plume of Silt? No Yes Moderate No
Other Observations 1. Outfall noted. Grey liquid waste flowing out of a hole in the stone wall which lines the river. CR/DCO in area confirmed this is sewage waste from the villiage of Clonea. 2. Stone wall lines the river on one side and buildings on the other side. Therefore the rivers natural banks have been modified. 3. Woody debris noted in the river.
1. Up-stream of Lowry Bridge a tributary was noted which flows in to the Clodiagh and which had cattle access to it.
1. This site has been modified and a canal now flows along side the rivers course, with a stone wall and also grass embankment constructed between the two. Appears to have been constructed as a scenic area as a look out/picnic area was also constructed. Confirmed this is associated with an old mill. 2. Outfall pipe noted at the site.

IBE5670/DC004 Rev 0
Appendix II – Site photographs and macroalgal photographs