Embed Size (px)
Citation preview

NSS Discipline Report – Nursing
2
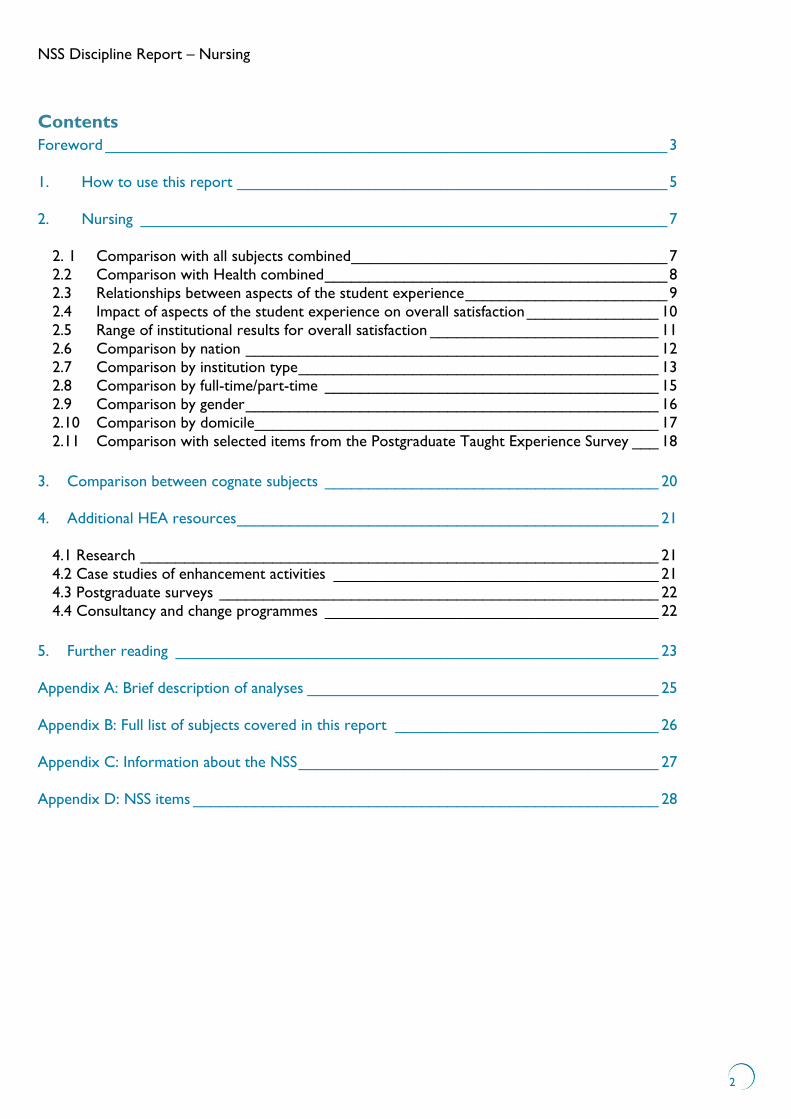
Contents
Foreword ________________________________________________________________ 3
1. How to use this report _________________________________________________ 5
2. Nursing ____________________________________________________________ 7
2. 1 Comparison with all subjects combined ____________________________________ 7
2.2 Comparison with Health combined _______________________________________ 8
2.3 Relationships between aspects of the student experience _______________________ 9
2.4 Impact of aspects of the student experience on overall satisfaction _______________ 10
2.5 Range of institutional results for overall satisfaction __________________________ 11
2.6 Comparison by nation _______________________________________________ 12
2.7 Comparison by institution type _________________________________________ 13
2.8 Comparison by full-time/part-time ______________________________________ 15
2.9 Comparison by gender _______________________________________________ 16
2.10 Comparison by domicile ______________________________________________ 17
2.11 Comparison with selected items from the Postgraduate Taught Experience Survey ___ 18
3. Comparison between cognate subjects ______________________________________ 20
4. Additional HEA resources ________________________________________________ 21
4.1 Research ___________________________________________________________ 21
4.2 Case studies of enhancement activities _____________________________________ 21
4.3 Postgraduate surveys __________________________________________________ 22
4.4 Consultancy and change programmes ______________________________________ 22
5. Further reading _______________________________________________________ 23
Appendix A: Brief description of analyses ________________________________________ 25
Appendix B: Full list of subjects covered in this report ______________________________ 26
Appendix C: Information about the NSS _________________________________________ 27
Appendix D: NSS items _____________________________________________________ 28

NSS Discipline Report – Nursing
3
Foreword
The National Student Survey (NSS) is an annual survey of all higher education students in their final year of
study in England, Wales and Northern Ireland, and for some institutions in Scotland. It was introduced in
2005, and is an important source of information for anyone interested in the quality of an undergraduate
degree programme. It is administered by Ipsos-MORI on behalf of HEFCE, and aims to “gather feedback on
the quality of students‟ courses in order to contribute to public accountability as well as to help inform the
choices of future applicants to higher education”.1
The NSS Discipline Reports have been produced by the Higher Education Academy in order to help
departments, faculties and institutions to contextualise and understand their NSS data at the subject level.
This report focuses on Nursing, and is one of a series of 28 NSS discipline-based reports that have been
initiated, compiled and written by the HEA and their survey team. The report offers a high-level analysis of the
discipline of Nursing and aims to provide the higher education sector with a better understanding of the
experiences of this student community. The data in this report can be used as a first step into further
qualitative investigation, which can ultimately lead to a genuine quality enhancement of the students‟ learning
experience. The importance of using the NSS scores only as an instigator for further investigation, however,
must be stressed; the true worth of the NSS is only apparent when the data it provides are used as a
benchmark, and/or to compare with like disciplines and institutions across the sector.
The NSS asks participants to rate their level of agreement with 22 positive statements, on a five-point scale (in
addition to „not applicable‟). As well as an overall statement, the statements are grouped into six areas:
teaching; assessment and feedback; academic support; organisation and management; learning resources;
personal development. In addition to asking participants to rate their agreement with 22 statements, the
survey also invites them to add free-text comments about particular positive or negative aspects of their
experience. Institutions can choose to utilise a bank of optional statements in addition to the 22 core
statements, which are not publicly reported. This report focuses on the quantitative data for the 22 core
statements for the Nursing subjects to enable like-with-like comparisons as far as possible. It is also important to compare results for departments/faculties with similar students, and this has been approximated by
comparing with mission groups or institution types. Not all differences will be reliable or statistically
significant, and caution must always be taken when interpreting or relying on small differences.
The analysis given in this report represents the student responses for the JACS codes covering Nursing – a
range of subjects undertaken by undergraduate pre-registration and post-registration students including
Midwifery, Community Nursing, Dental Nursing and the „fields‟ of Nursing (Adult, Mental Health, Learning
Disability and Children). Please refer to Appendix B for a detailed list of the Nursing subjects covered by this
report.
It is interesting to note that in six out of the seven areas of the NSS, Nursing discipline students have a higher
satisfaction score when compared with all other students responding to the NSS. These areas include:
teaching; assessment and feedback; academic support; learning resources; and personal development. A more
focused comparison with the Health subject area reveals Nursing students‟ higher satisfaction scores for the
assessment and feedback, and personal development areas.
Within all seven areas of the Nursing discipline covered in this report, the overall satisfaction of the students
is most strongly correlated to their satisfaction on the quality of learning and teaching scale, followed by
academic support, and organisation and management. Student satisfaction scores for organisation and
management items, however, appear to be lower than for all combined students. Given the strong correlation
of the organisation and management items to student satisfaction within Nursing, it appears that the
1 http://www.hefce.ac.uk/whatwedo/lt/publicinfo/nationalstudentsurvey/ [Accessed 16 May 2012]
NSS Discipline Report – Nursing
4
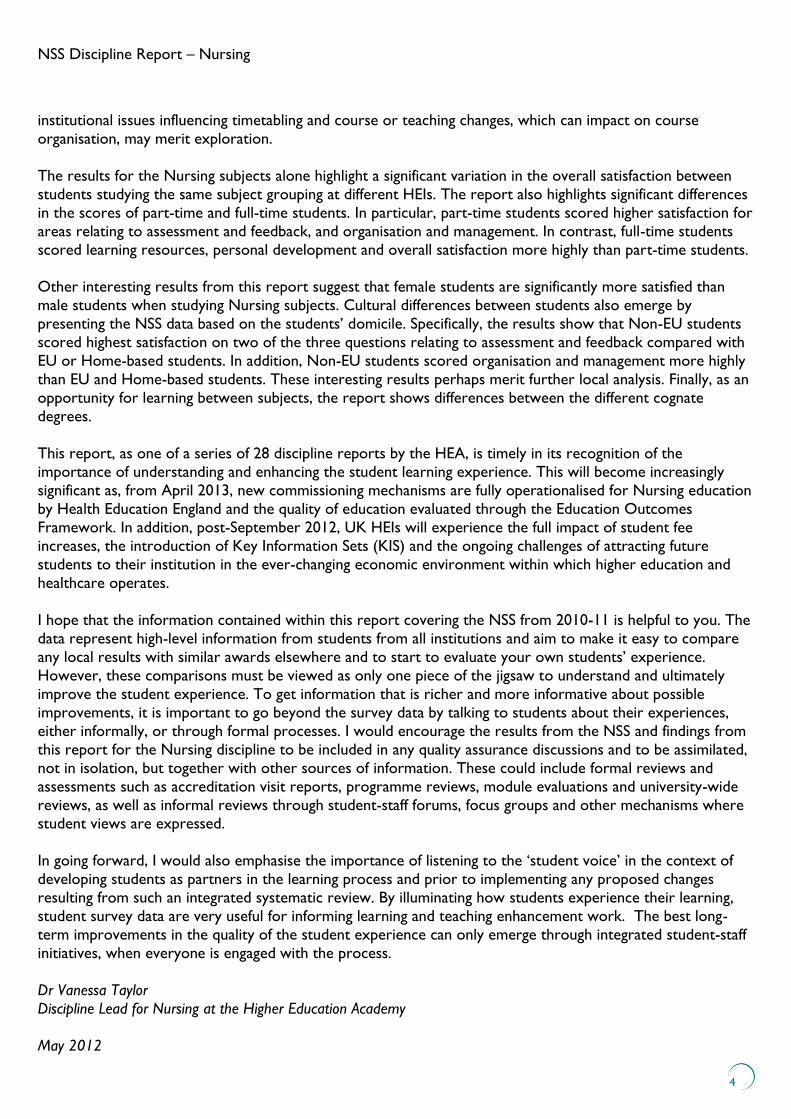
institutional issues influencing timetabling and course or teaching changes, which can impact on course
organisation, may merit exploration.
The results for the Nursing subjects alone highlight a significant variation in the overall satisfaction between
students studying the same subject grouping at different HEIs. The report also highlights significant differences
in the scores of part-time and full-time students. In particular, part-time students scored higher satisfaction for
areas relating to assessment and feedback, and organisation and management. In contrast, full-time students
scored learning resources, personal development and overall satisfaction more highly than part-time students.
Other interesting results from this report suggest that female students are significantly more satisfied than
male students when studying Nursing subjects. Cultural differences between students also emerge by
presenting the NSS data based on the students‟ domicile. Specifically, the results show that Non-EU students
scored highest satisfaction on two of the three questions relating to assessment and feedback compared with
EU or Home-based students. In addition, Non-EU students scored organisation and management more highly
than EU and Home-based students. These interesting results perhaps merit further local analysis. Finally, as an
opportunity for learning between subjects, the report shows differences between the different cognate
degrees.
This report, as one of a series of 28 discipline reports by the HEA, is timely in its recognition of the
importance of understanding and enhancing the student learning experience. This will become increasingly
significant as, from April 2013, new commissioning mechanisms are fully operationalised for Nursing education
by Health Education England and the quality of education evaluated through the Education Outcomes
Framework. In addition, post-September 2012, UK HEIs will experience the full impact of student fee
increases, the introduction of Key Information Sets (KIS) and the ongoing challenges of attracting future
students to their institution in the ever-changing economic environment within which higher education and
healthcare operates.
I hope that the information contained within this report covering the NSS from 2010-11 is helpful to you. The
data represent high-level information from students from all institutions and aim to make it easy to compare
any local results with similar awards elsewhere and to start to evaluate your own students‟ experience.
However, these comparisons must be viewed as only one piece of the jigsaw to understand and ultimately
improve the student experience. To get information that is richer and more informative about possible
improvements, it is important to go beyond the survey data by talking to students about their experiences,
either informally, or through formal processes. I would encourage the results from the NSS and findings from
this report for the Nursing discipline to be included in any quality assurance discussions and to be assimilated,
not in isolation, but together with other sources of information. These could include formal reviews and
assessments such as accreditation visit reports, programme reviews, module evaluations and university-wide
reviews, as well as informal reviews through student-staff forums, focus groups and other mechanisms where
student views are expressed.
In going forward, I would also emphasise the importance of listening to the „student voice‟ in the context of
developing students as partners in the learning process and prior to implementing any proposed changes
resulting from such an integrated systematic review. By illuminating how students experience their learning,
student survey data are very useful for informing learning and teaching enhancement work. The best long-
term improvements in the quality of the student experience can only emerge through integrated student-staff
initiatives, when everyone is engaged with the process.
Dr Vanessa Taylor
Discipline Lead for Nursing at the Higher Education Academy
May 2012

NSS Discipline Report – Nursing
5
1. How to use this report
This report presents data from the 2011 National Student Survey (NSS) for specific subjects, aggregated
across all institutions. By providing information about how subjects are reflected nationally in the NSS, the
charts and tables are designed to help departments, faculties and institutions to contextualise and understand
their own results.
This report includes NSS data for the following subjects, as classified in the Joint Academic Coding System
(JACS) (see the Appendix for a more detailed list)
Nursing (B700)
Note about students studying multiple subjects
Unless otherwise indicated, all students studying a subject at 50% FPE (full-person equivalent) or more will
have their responses allocated to that subject. Students studying two subjects at 50% FPE may therefore have
their responses allocated twice. In addition, students studying multiple courses, all at less than 50% FPE, will
be excluded from the data. These decisions have been taken to ensure that a response is allocated to a
subject when the student has had a significant experience of that subject.
When used with an awareness of the limitations, NSS data can play a useful role in supporting improvements
in learning and teaching. By allowing comparisons and benchmarking, the data can highlight areas that would
reward further investigation, either as areas of apparent success or challenge. NSS results can be a useful
starting point for discussions about learning and teaching, either with colleagues, senior managers, student
representatives or students themselves. It is also advisable to triangulate the data with quantitative and
qualitative information from other sources in order to effectively target, design and evaluate enhancement
activities.
This report presents a high-level picture of the discipline through the lens of NSS data, broken down and
analysed in a number of different ways. It does not provide a detailed picture of students‟ learning
experiences, nor does it dictate specific areas for intervention. However, it can be used in conjunction with
local NSS data to gain an overview of the views of a group of students, which can provide an excellent starting
point for further investigation and discussion.
As with all uses of quantitative data, caution should be exercised when interpreting small differences between
respondent groups. Small differences may be due to random variations in response, demographic
characteristics of the respondents, method of response and many other factors, and small numerical
differences may not in fact correspond to genuine differences in experience. A further reason for caution is
that for those comparisons involving institutional-level characteristics (UK nation, institution type and mission
group) where small numbers of respondents are reported these may represent a cohort from one single
institution, rather than respondents from a range of institutions.
A standard method of evaluating whether patterns in the survey sample are likely to reflect patterns in the wider population is to use tests of statistical significance. Methods of analysis used in this report are detailed in
Appendix A. Significance levels are included in the tables, but for ease of use significance levels of 0.05 or
lower have been highlighted in bold – this is the level at which results are standardly taken to be significant,
and suggests that there is a 95% or greater probability that the patterns found in the survey sample are
reflective of the final-year undergraduate population as a whole. Unless otherwise stated, where differences

NSS Discipline Report – Nursing
6
are significant (at the 0.05 level) the higher score is in bold text. Where there are more than two scores being
compared and the significance level is 0.05 or lower, the significance level itself is in bold text, and indicates
that there is at least one significant different between two of the scores.
It should be noted, however, that significance testing assumes that the survey has been conducted using a
random sample, or a design that approximates this. In fact, the NSS attempts to survey the whole final-year
undergraduate population and, while all surveys may experience non-response bias, it can be more difficult to
correct for this in a „census‟ type survey. A review by Paula Surridge for the HEA described tests for non-response bias that found no significant effect2 and the overall profile of NSS respondents is broadly
representative of the wider student body. However, it is not possible to say whether each subgroup explored
in this report (such as part-time students, or the results for HEI „mission groups‟) is similarly representative.
For this reason, the significance levels included in this report should only be taken as indications of confidence
in the survey results and we recommend that caution be exercised when interpreting, using or relying on
small differences. Similarly, the error bars placed around institutional scores may, if anything, be too narrow
where non-response bias is substantial.
In order to present the data in a more complete manner, tables rather than charts have been used for the
majority of this report3. Because there are different response rates for each item in the NSS, no single number
of responses can be included for each group in a table. Instead, the range between the lowest and the highest
number of responses is shown.
The percentage values included in the tables correspond to the proportion of students who agreed with the
relevant statement (survey item), i.e. selected either „definitely agree‟ or „mostly agree‟. The number of
responses to each item includes all of the responses (including those who disagreed).
This report contains high-level analyses involving institutional and demographic characteristics. Other than
The Open University, no institutions are identified anywhere in the report – in the section on part-time
students, the OU‟s results have been separated out as they constitute such a large proportion of the part-time
student responses. No group smaller than 23 students is reported, and every care has been taken to ensure
that no student can be identified either directly or through implication.
The analyses included in this report were carried out by Mrs Gosia Turner. The HEA acknowledges the
assistance of the Higher Education Funding Council for England (HEFCE) in providing the NSS dataset used in
this report.
2 The National Student Survey three years on: What have we learned (Surridge, 2009). 3 The data contained in the tables can be used to create charts, if desired, by copying the entire table into a Microsoft Word
document, and then copying the required data from that document into a Microsoft Excel spreadsheet.

NSS Discipline Report – Nursing
7
2. Nursing
There are 15239 students in the NSS dataset who study Nursing at 50% FPE or more. 90.1% of students who
responded are women, 98% are from the UK, and 95.4% study full-time.
2. 1 Comparison with all subjects combined
This table compares the experiences of students across the UK responding to the NSS in Nursing with the
experience of all other students responding to the NSS.
These percentages, in this table and all other tables in the report, correspond to the proportion of students
who agreed with the relevant statement, i.e. selected either „definitely agree‟ or „mostly agree‟. The number of
responses to each item includes all of the responses (including those who disagreed).
All (excl. Nursing) Nursing Sig.
Q1. Staff are good at explaining things 88.0% 88.8% .000
Q2. Staff have made the subject interesting 80.7% 83.8% .000
Q3. Staff are enthusiastic about what they are teaching 85.2% 87.4% .000
Q4. The course is intellectually stimulating 83.6% 84.7% .000
Q5. The criteria used in marking have been made clear in advance 72.8% 77.1% .000
Q6. Assessment arrangements and marking have been fair 74.6% 72.4% .000
Q7. Feedback on my work has been prompt 62.2% 69.8% .000
Q8. I have received detailed comments on my work 66.6% 72.4% .000
Q9. Feedback on my work has helped me clarify things I did not understand 61.2% 65.0% .000
Q10. I have received sufficient advice and support with my studies 74.8% 77.1% .000
Q11. I have been able to contact staff when I needed to 83.3% 77.9% .000
Q12. Good advice was available when I needed to make study choices 71.9% 75.2% .000
Q13. The timetable works effectively as far as my activities are concerned 79.2% 65.6% .000
Q14. Any changes in the course or teaching have been communicated
effectively
74.3% 58.6% .000
Q15. The course is well organised and is running smoothly 73.4% 57.2% .000
Q16. The library resources and services are good enough for my needs 80.7% 85.9% .000
Q17. I have been able to access general IT resources when I needed to 83.0% 88.5% .000
Q18. I have been able to access specialised equipment, facilities, or rooms when
I needed to
75.5% 78.7% .000
Q19. The course has helped me to present myself with confidence 78.5% 86.8% .000
Q20. My communication skills have improved 81.3% 91.1% .000
Q21. As a result of the course, I feel confident in tackling unfamiliar problems 78.7% 87.2% .000
Q22. Overall, I am satisfied with the quality of the course 83.1% 83.2% .013
Number of responses to each item (range lowest – highest) 226666 - 249093 14156 - 15230

NSS Discipline Report – Nursing
8
2.2 Comparison with Health combined
This table compares the experience of students across the UK responding to the NSS in Nursing with the
experience of all other students in the wider subject area of Health responding to the NSS.
Health (excl.
Nursing)
Nursing Sig.
Q1. Staff are good at explaining things 90.0% 88.8% .002
Q2. Staff have made the subject interesting 85.2% 83.8% .000
Q3. Staff are enthusiastic about what they are teaching 87.5% 87.4% .539
Q4. The course is intellectually stimulating 89.8% 84.7% .000
Q5. The criteria used in marking have been made clear in advance 68.9% 77.1% .000
Q6. Assessment arrangements and marking have been fair 70.6% 72.4% .001
Q7. Feedback on my work has been prompt 55.8% 69.8% .000
Q8. I have received detailed comments on my work 53.6% 72.4% .000
Q9. Feedback on my work has helped me clarify things I did not understand 53.4% 65.0% .000
Q10. I have received sufficient advice and support with my studies 74.8% 77.1% .000
Q11. I have been able to contact staff when I needed to 84.7% 77.9% .000
Q12. Good advice was available when I needed to make study choices 72.9% 75.2% .000
Q13. The timetable works effectively as far as my activities are concerned 75.0% 65.6% .000
Q14. Any changes in the course or teaching have been communicated
effectively
70.2% 58.6% .000
Q15. The course is well organised and is running smoothly 69.2% 57.2% .000
Q16. The library resources and services are good enough for my needs 83.3% 85.9% .000
Q17. I have been able to access general IT resources when I needed to 86.6% 88.5% .000
Q18. I have been able to access specialised equipment, facilities, or rooms when
I needed to
81.4% 78.7% .000
Q19. The course has helped me to present myself with confidence 84.3% 86.8% .000
Q20. My communication skills have improved 88.8% 91.1% .000
Q21. As a result of the course, I feel confident in tackling unfamiliar problems 84.7% 87.2% .000
Q22. Overall, I am satisfied with the quality of the course 85.2% 83.2% .000
Number of responses to each item (range lowest – highest) 20535 - 21464 14156 - 15230

NSS Discipline Report – Nursing
9
2.3 Relationships between aspects of the student experience
21 items in the NSS are grouped into 6 scales, each measuring a different aspect of the student experience
(see Appendix D), while item 22 examines overall satisfaction. This table shows the extent to which these
different scales are correlated with one another. In other words, it gives an indication of the strength of the
relationship between different aspects of the student experience. Values nearer 1.000 indicate a stronger
relationship. However, due to the fact that this analysis shows correlations rather than causal relationships, it
is not possible to conclude that improving one aspect of the student experience will automatically lead to
improvements in another aspect, even where the relationship appears strong.
Q22. Overall,
I am satisfied
with the
quality of the
course
Quality of
Learning
and
Teaching
scale
Assessment
and Feedback
scale
Academic
Support
scale
Organisation
and
Management
scale
Learning
Resources
scale
Personal
Development
scale
Q22. Overall, I am satisfied
with the quality of the course 1 .653 .572 .639 .610 .356 .595
Quality of Learning and
Teaching scale 1 .549 .605 .540 .329 .519
Assessment and Feedback
scale 1 .598 .547 .324 .445
Academic Support scale 1 .545 .361 .501
Organisation and
Management scale 1 .322 .423
Learning resources scale 1 .371
Personal Development scale 1
All correlations are statistically significant at 0.01 level. The strongest relationship appears to be between
overall satisfaction and quality of learning and teaching.

NSS Discipline Report – Nursing
10
2.4 Impact of aspects of the student experience on overall satisfaction
The different aspects of the student experience, as measured by the 6 item scales in the NSS, are likely to
impact upon students‟ overall satisfaction with their course, as measured by question 22. To test this, a
multiple regression has been performed, examining the extent to which the results for different item scales
explain or predict overall satisfaction. In the table below, the higher the size of the standardised coefficient,
the greater the influence of that aspect of the student experience on overall satisfaction.
All scales combined explain 61% (Adjusted R2 = 0.611) of the variability of the overall satisfaction item. This is
a strong effect but nevertheless suggests the existence of other factors affecting the overall experience but
not measured by the NSS survey.
Unstandardised
Coefficients
Standardised
Coefficients t Sig.
B Std. Error Beta
(Constant) -.672 .040 -16.975 .000
Quality of Learning and Teaching scale .337 .011 .229 30.666 .000
Assessment and Feedback scale .109 .008 .099 13.515 .000
Academic Support scale .209 .008 .196 25.652 .000
Organisation and Management scale .201 .006 .219 31.253 .000
Learning resources scale .026 .007 .021 3.492 .000
Personal Development scale .307 .009 .232 34.471 .000
This analysis shows that the personal development is the most important factor affecting the overall
experience while the learning resources have the weakest impact.
NSS Discipline Report – Nursing
11
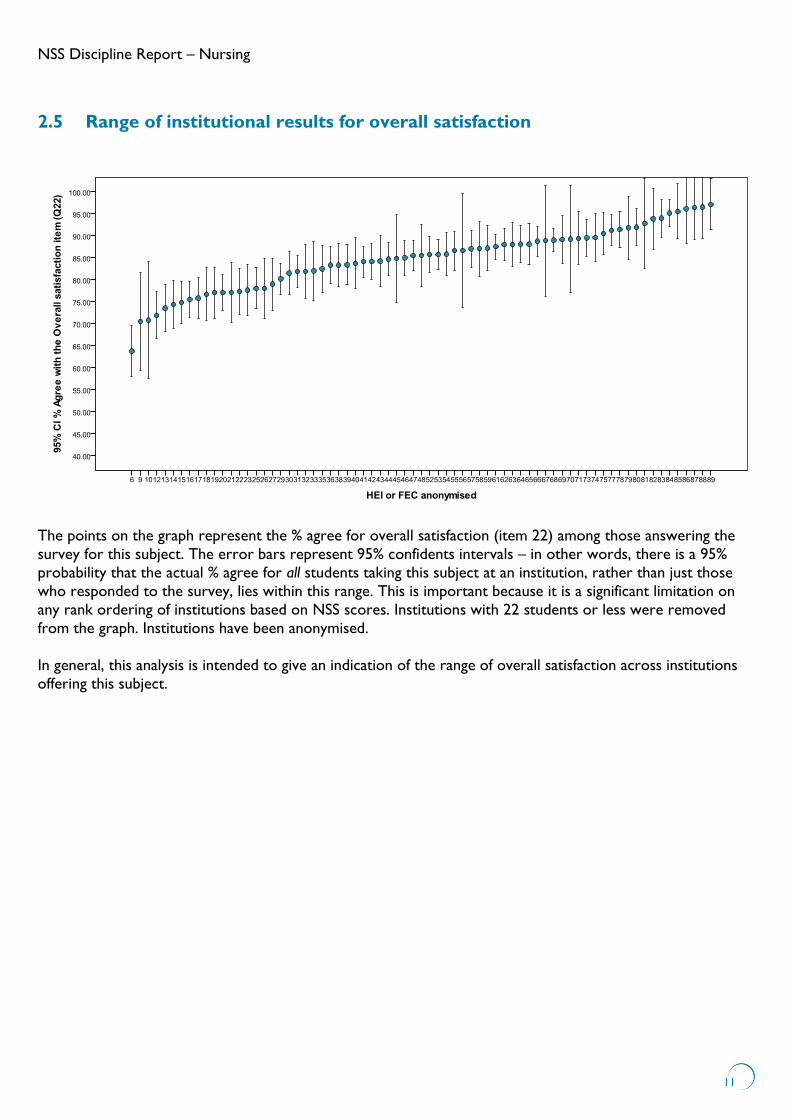
2.5 Range of institutional results for overall satisfaction
The points on the graph represent the % agree for overall satisfaction (item 22) among those answering the
survey for this subject. The error bars represent 95% confidents intervals – in other words, there is a 95%
probability that the actual % agree for all students taking this subject at an institution, rather than just those
who responded to the survey, lies within this range. This is important because it is a significant limitation on
any rank ordering of institutions based on NSS scores. Institutions with 22 students or less were removed
from the graph. Institutions have been anonymised.
In general, this analysis is intended to give an indication of the range of overall satisfaction across institutions
offering this subject.

NSS Discipline Report – Nursing
12
2.6 Comparison by nation
This analysis breaks down the results for the subject by the UK nation in which the institution is located.
Results from The Open University have not been included in this analysis.
England Scotland Wales Northern
Ireland Sig.
Q1. Staff are good at explaining things 88.3% 90.5% 92.3% 91.8% .001
Q2. Staff have made the subject interesting 83.2% 86.7% 85.5% 86.1% .001
Q3. Staff are enthusiastic about what they are teaching 87.1% 88.3% 88.6% 89.6% .150
Q4. The course is intellectually stimulating 84.4% 85.0% 86.2% 91.3% .019
Q5. The criteria used in marking have been made clear in
advance
76.9% 77.7% 77.8% 78.4% .289
Q6. Assessment arrangements and marking have been fair 72.3% 74.0% 71.7% 69.9% .028
Q7. Feedback on my work has been prompt 70.6% 65.2% 71.4% 58.4% .000
Q8. I have received detailed comments on my work 72.3% 70.6% 77.2% 73.2% .001
Q9. Feedback on my work has helped me clarify things I
did not understand
64.5% 64.9% 68.1% 69.6% .065
Q10. I have received sufficient advice and support with
my studies
76.5% 80.0% 81.1% 75.7% .002
Q11. I have been able to contact staff when I needed to 77.1% 80.5% 81.8% 85.0% .000
Q12. Good advice was available when I needed to make
study choices
74.6% 77.3% 78.7% 75.8% .030
Q13. The timetable works effectively as far as my
activities are concerned
64.9% 67.8% 69.1% 71.3% .001
Q14. Any changes in the course or teaching have been
communicated effectively
58.2% 60.2% 55.1% 68.9% .000
Q15. The course is well organised and is running
smoothly
56.8% 56.7% 59.7% 65.0% .000
Q16. The library resources and services are good enough
for my needs
85.6% 89.1% 81.8% 90.4% .000
Q17. I have been able to access general IT resources
when I needed to
88.5% 89.6% 83.8% 93.4% .000
Q18. I have been able to access specialised equipment,
facilities, or rooms when I needed to
78.8% 78.6% 73.0% 87.9% .000
Q19. The course has helped me to present myself with
confidence
86.5% 86.7% 89.6% 90.4% .022
Q20. My communication skills have improved 91.0% 90.0% 92.8% 96.2% .002
Q21. As a result of the course, I feel confident in tackling
unfamiliar problems
87.0% 86.6% 90.3% 91.3% .011
Q22. Overall, I am satisfied with the quality of the course 82.4% 85.2% 86.9% 88.5% .000
Number of responses to each item (range lowest – highest) 11462 - 12336 1556 - 1686 763 - 817 355 - 366
Where there are statistically significant differences for an item, this is highlighted in bold in the „Sig.‟ column.

NSS Discipline Report – Nursing
13
2.7 Comparison by institution type
This analysis categorises the results for the subject according to the institution‟s „mission group‟. Mission
group membership is correct for the time the survey took place (Spring 2011).
Russell
Group
1994
Group
Million+ University
Alliance*
Guild
HE** Sig.
Q1. Staff are good at explaining things 88.6% 92.5% 88.5% 87.6% 96.0% .010
Q2. Staff have made the subject interesting 83.9% 88.1% 84.8% 81.5% 94.4% .000
Q3. Staff are enthusiastic about what they are teaching 88.7% 89.7% 87.4% 86.2% 93.6% .002
Q4. The course is intellectually stimulating 85.6% 88.8% 85.7% 82.1% 92.0% .000
Q5. The criteria used in marking have been made clear in
advance
71.2% 76.6% 80.2% 77.4% 78.4% .000
Q6. Assessment arrangements and marking have been fair 66.9% 73.5% 74.5% 72.0% 74.4% .000
Q7. Feedback on my work has been prompt 63.2% 72.3% 70.8% 74.4% 72.8% .000
Q8. I have received detailed comments on my work 65.8% 72.1% 76.1% 72.1% 80.0% .000
Q9. Feedback on my work has helped me clarify things I did
not understand
56.0% 64.2% 69.8% 63.6% 71.0% .000
Q10. I have received sufficient advice and support with my
studies
74.0% 79.9% 78.2% 75.9% 84.8% .001
Q11. I have been able to contact staff when I needed to 81.1% 84.1% 77.5% 76.5% 83.2% .000
Q12. Good advice was available when I needed to make study
choices
73.5% 79.1% 76.5% 74.0% 86.6% .001
Q13. The timetable works effectively as far as my activities are
concerned
62.9% 68.3% 70.4% 61.6% 68.0% .000
Q14. Any changes in the course or teaching have been
communicated effectively
56.9% 63.9% 61.7% 57.1% 65.3% .000
Q15. The course is well organised and is running smoothly 54.4% 64.8% 59.8% 54.1% 62.4% .000
Q16. The library resources and services are good enough for
my needs
87.6% 84.8% 84.0% 86.8% 82.4% .000
Q17. I have been able to access general IT resources when I
needed to
90.4% 86.7% 88.7% 87.0% 84.8% .001
Q18. I have been able to access specialised equipment,
facilities, or rooms when I needed to
79.6% 77.9% 78.1% 79.4% 72.8% .027
Q19. The course has helped me to present myself with
confidence
86.7% 87.8% 87.5% 85.5% 81.6% .143
Q20. My communication skills have improved 91.0% 93.1% 91.4% 91.0% 88.8% .579
Q21. As a result of the course, I feel confident in tackling
unfamiliar problems
87.8% 90.5% 87.2% 86.4% 84.0% .046
Q22. Overall, I am satisfied with the quality of the course 82.1% 87.6% 83.6% 82.1% 89.6% .002
Number of responses to each item (range lowest – highest) 2013 -
2130
569 -
623
4544 -
4927
4153 - 4425 114 -
125
*Excluding Bucks New University (included in Million+). **Excluding Kingston University (included in
Million+).
Where there are statistically significant differences for an item, this is highlighted in bold in the „Sig.‟ column.
NSS Discipline Report – Nursing
14
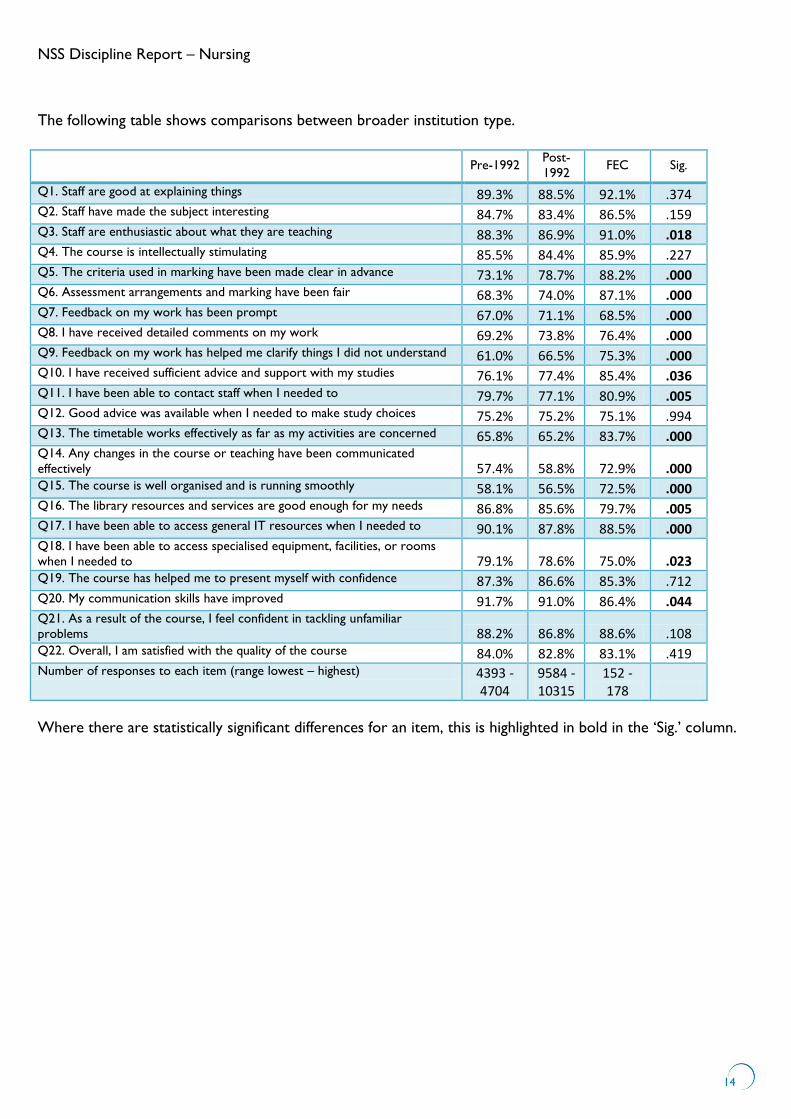
The following table shows comparisons between broader institution type.
Pre-1992 Post-
1992 FEC Sig.
Q1. Staff are good at explaining things 89.3% 88.5% 92.1% .374 Q2. Staff have made the subject interesting 84.7% 83.4% 86.5% .159 Q3. Staff are enthusiastic about what they are teaching 88.3% 86.9% 91.0% .018 Q4. The course is intellectually stimulating 85.5% 84.4% 85.9% .227 Q5. The criteria used in marking have been made clear in advance 73.1% 78.7% 88.2% .000 Q6. Assessment arrangements and marking have been fair 68.3% 74.0% 87.1% .000 Q7. Feedback on my work has been prompt 67.0% 71.1% 68.5% .000 Q8. I have received detailed comments on my work 69.2% 73.8% 76.4% .000 Q9. Feedback on my work has helped me clarify things I did not understand 61.0% 66.5% 75.3% .000 Q10. I have received sufficient advice and support with my studies 76.1% 77.4% 85.4% .036 Q11. I have been able to contact staff when I needed to 79.7% 77.1% 80.9% .005 Q12. Good advice was available when I needed to make study choices 75.2% 75.2% 75.1% .994 Q13. The timetable works effectively as far as my activities are concerned 65.8% 65.2% 83.7% .000 Q14. Any changes in the course or teaching have been communicated
effectively 57.4% 58.8% 72.9% .000 Q15. The course is well organised and is running smoothly 58.1% 56.5% 72.5% .000 Q16. The library resources and services are good enough for my needs 86.8% 85.6% 79.7% .005 Q17. I have been able to access general IT resources when I needed to 90.1% 87.8% 88.5% .000 Q18. I have been able to access specialised equipment, facilities, or rooms
when I needed to 79.1% 78.6% 75.0% .023 Q19. The course has helped me to present myself with confidence 87.3% 86.6% 85.3% .712 Q20. My communication skills have improved 91.7% 91.0% 86.4% .044 Q21. As a result of the course, I feel confident in tackling unfamiliar
problems 88.2% 86.8% 88.6% .108 Q22. Overall, I am satisfied with the quality of the course 84.0% 82.8% 83.1% .419 Number of responses to each item (range lowest – highest) 4393 -
4704 9584 - 10315
152 - 178
Where there are statistically significant differences for an item, this is highlighted in bold in the „Sig.‟ column.

NSS Discipline Report – Nursing
15
2.8 Comparison by full-time/part-time
Full-time Part-time Sig.
Q1. Staff are good at explaining things 88.9% 87.8% .495
Q2. Staff have made the subject interesting 83.7% 85.6% .401
Q3. Staff are enthusiastic about what they are teaching 87.3% 88.4% .218
Q4. The course is intellectually stimulating 84.6% 86.7% .053
Q5. The criteria used in marking have been made clear in advance 76.8% 83.4% .000
Q6. Assessment arrangements and marking have been fair 72.0% 81.8% .000
Q7. Feedback on my work has been prompt 69.6% 73.3% .108
Q8. I have received detailed comments on my work 72.0% 81.4% .000
Q9. Feedback on my work has helped me clarify things I did not understand 64.5% 73.9% .000
Q10. I have received sufficient advice and support with my studies 77.0% 78.3% .083
Q11. I have been able to contact staff when I needed to 78.1% 74.9% .012
Q12. Good advice was available when I needed to make study choices 75.2% 74.0% .177
Q13. The timetable works effectively as far as my activities are concerned 65.1% 76.1% .000
Q14. Any changes in the course or teaching have been communicated effectively 58.1% 68.0% .000
Q15. The course is well organised and is running smoothly 56.6% 69.8% .000
Q16. The library resources and services are good enough for my needs 85.9% 84.8% .037
Q17. I have been able to access general IT resources when I needed to 88.8% 83.1% .000
Q18. I have been able to access specialised equipment, facilities, or rooms when I needed to 78.9% 72.3% .001
Q19. The course has helped me to present myself with confidence 86.9% 83.4% .025
Q20. My communication skills have improved 91.6% 80.1% .000
Q21. As a result of the course, I feel confident in tackling unfamiliar problems 87.5% 80.2% .000
Q22. Overall, I am satisfied with the quality of the course 83.2% 82.9% .001
Number of responses to each item (range lowest – highest) 13647 -
14528
509 - 706
NSS Discipline Report – Nursing
16
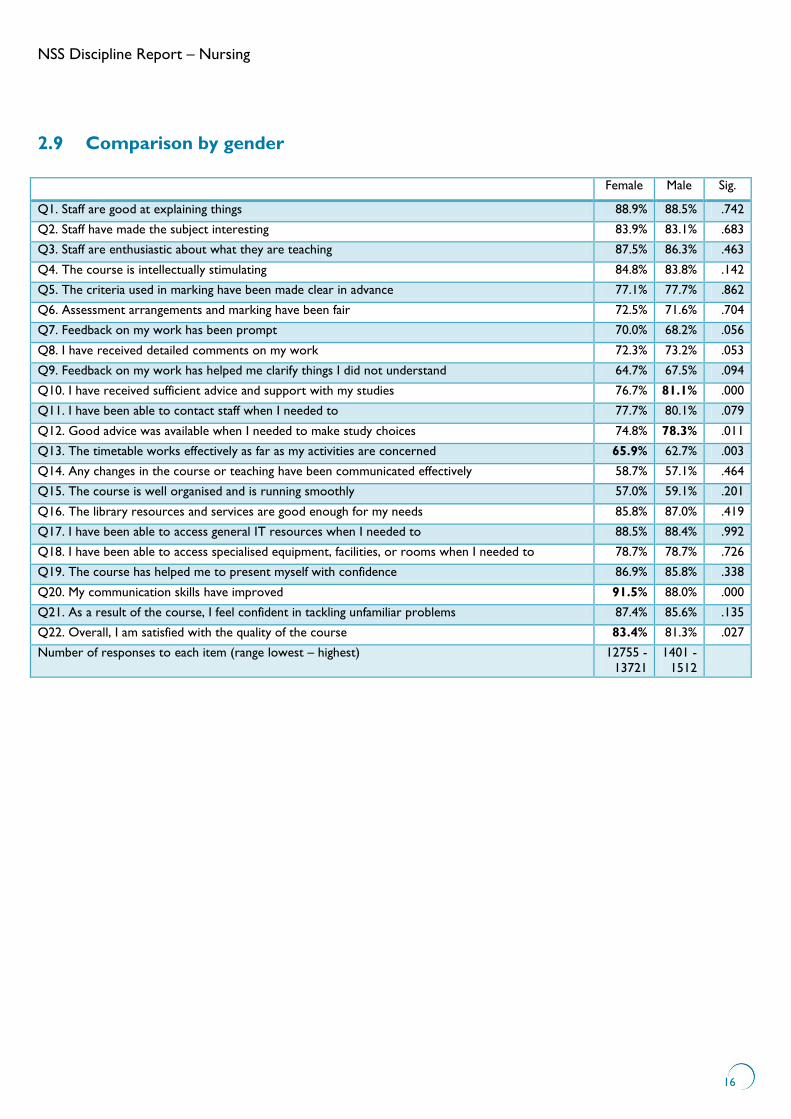
2.9 Comparison by gender
Female Male Sig.
Q1. Staff are good at explaining things 88.9% 88.5% .742
Q2. Staff have made the subject interesting 83.9% 83.1% .683
Q3. Staff are enthusiastic about what they are teaching 87.5% 86.3% .463
Q4. The course is intellectually stimulating 84.8% 83.8% .142
Q5. The criteria used in marking have been made clear in advance 77.1% 77.7% .862
Q6. Assessment arrangements and marking have been fair 72.5% 71.6% .704
Q7. Feedback on my work has been prompt 70.0% 68.2% .056
Q8. I have received detailed comments on my work 72.3% 73.2% .053
Q9. Feedback on my work has helped me clarify things I did not understand 64.7% 67.5% .094
Q10. I have received sufficient advice and support with my studies 76.7% 81.1% .000
Q11. I have been able to contact staff when I needed to 77.7% 80.1% .079
Q12. Good advice was available when I needed to make study choices 74.8% 78.3% .011
Q13. The timetable works effectively as far as my activities are concerned 65.9% 62.7% .003
Q14. Any changes in the course or teaching have been communicated effectively 58.7% 57.1% .464
Q15. The course is well organised and is running smoothly 57.0% 59.1% .201
Q16. The library resources and services are good enough for my needs 85.8% 87.0% .419
Q17. I have been able to access general IT resources when I needed to 88.5% 88.4% .992
Q18. I have been able to access specialised equipment, facilities, or rooms when I needed to 78.7% 78.7% .726
Q19. The course has helped me to present myself with confidence 86.9% 85.8% .338
Q20. My communication skills have improved 91.5% 88.0% .000
Q21. As a result of the course, I feel confident in tackling unfamiliar problems 87.4% 85.6% .135
Q22. Overall, I am satisfied with the quality of the course 83.4% 81.3% .027
Number of responses to each item (range lowest – highest) 12755 -
13721
1401 -
1512

NSS Discipline Report – Nursing
17
2.10 Comparison by domicile
The following analysis breaks down the NSS results for the subject by students‟ place of residence. Students
are allocated to one category only, so those based in the UK are not included in the EU category for the
purpose of this analysis.
UK EU Non-
EU
Sig.
Q1. Staff are good at explaining things 88.8% 85.5% 91.2% .089
Q2. Staff have made the subject interesting 83.9% 78.6% 83.0% .172
Q3. Staff are enthusiastic about what they are teaching 87.4% 83.0% 89.1% .074
Q4. The course is intellectually stimulating 84.8% 79.2% 87.1% .319
Q5. The criteria used in marking have been made clear in advance 77.1% 74.2% 83.6% .262
Q6. Assessment arrangements and marking have been fair 72.5% 63.5% 76.0% .064
Q7. Feedback on my work has been prompt 69.8% 64.8% 78.8% .053
Q8. I have received detailed comments on my work 72.4% 67.9% 81.4% .008
Q9. Feedback on my work has helped me clarify things I did not understand 64.8% 66.7% 82.2% .001
Q10. I have received sufficient advice and support with my studies 77.1% 70.4% 82.9% .128
Q11. I have been able to contact staff when I needed to 77.8% 75.9% 89.0% .026
Q12. Good advice was available when I needed to make study choices 75.1% 70.3% 83.4% .054
Q13. The timetable works effectively as far as my activities are concerned 65.4% 72.3% 78.9% .004
Q14. Any changes in the course or teaching have been communicated effectively 58.3% 62.7% 79.5% .000
Q15. The course is well organised and is running smoothly 57.1% 52.2% 76.2% .000
Q16. The library resources and services are good enough for my needs 85.8% 89.9% 86.4% .261
Q17. I have been able to access general IT resources when I needed to 88.5% 91.2% 89.1% .574
Q18. I have been able to access specialised equipment, facilities, or rooms when I needed
to
78.6% 88.5% 80.4% .064
Q19. The course has helped me to present myself with confidence 86.7% 89.3% 89.0% .581
Q20. My communication skills have improved 91.1% 94.3% 89.7% .569
Q21. As a result of the course, I feel confident in tackling unfamiliar problems 87.2% 89.2% 86.9% .591
Q22. Overall, I am satisfied with the quality of the course 83.2% 80.5% 81.6% .184
Number of responses to each item (range lowest – highest) 13870 -
14924
148 -
159
138 -
147
Where there are statistically significant differences for an item, this is highlighted in bold in the „Sig.‟ column.

NSS Discipline Report – Nursing
18
2.11 Comparison with selected items from the Postgraduate Taught Experience
Survey
The national Postgraduate Taught Experience Survey (PTES) is run annually by the Higher Education Academy
in conjunction with institutions. This table shows comparisons between data from NSS items and data from
relevant items in PTES. The PTES data are from the 2011 administration of the survey, and the full report can
be accessed on the HEA‟s website. There are relevant items in PTES for all NSS items except items 10, 11, 12
and 22. For NSS items 7 and 16 there are multiple relevant items in PTES. Unless otherwise stated, the
relevant item wording in PTES is either identical to the NSS item, or contains only insignificant differences.
The relevant PTES item numbers are in square brackets.
Please note that whereas the NSS is compulsory for HE providers in England, Wales and Northern Ireland,
PTES is voluntary. 80 institutions took part in PTES 2011, as opposed to the 253 institutions that took part in
NSS 2011. Differences in results between PTES and the NSS may, therefore, reflect differences between the
institutions taking part. Nonetheless, PTES includes many of the same questions as found in the NSS as well as
some that add further information to the NSS-type questions. The results below compare the experience of
those final-year undergraduates studying Nursing across the UK answering the NSS with the experience of taught postgraduates studying Nursing.

NSS Discipline Report – Nursing
19
Please also note that no tests for significance have been undertaken for this table; the differences between
results for NSS and PTES items are provided for interest only, and should only be taken as indicative.
NSS PTES
Q1. Staff are good at explaining things [PTES Q4a] 88.8% 82.0%
Q2. Staff have made the subject interesting [PTES Q4b] 83.8% 81.6%
Q3. Staff are enthusiastic about what they are teaching [PTES Q4c] 87.4% 86.6%
Q4. The course is intellectually stimulating [PTES Q3d] 84.7% 85.9%
Q5. The criteria used in marking have been made clear in advance [PTES Q11a] 77.1% 81.7%
Q6. Assessment arrangements and marking have been fair [PTES Q11b] 72.4% 77.3%
Q7. Feedback on my work has been prompt [PTES Q11c] 69.8% 70.3%
I received feedback in time to allow me to improve my next assignment [PTES Q11d – no
direct NSS equivalent]
N/A 72.0%
Q8. I have received detailed comments on my work [PTES Q11e] 72.4% 74.6%
Q9. Feedback on my work has helped me clarify things I did not understand [PTES Q11f] 65.0% 66.3%
Q13*. The timetable works efficiently as far as my activities are concerned [PTES Q14a] 65.6% 75.5%
Q14. Any changes in the course of teaching have been communicated effectively [PTES Q14b] 58.6% 70.2%
Q15. The course is well organised and is running smoothly [PTES Q14c] 57.2% 69.9%
Q16. The library resources and services are good enough for my needs [PTES Q16a] 85.9% 80.8%
The library resources and services are easily accessible [PTES Q16b – no NSS equivalent] N/A 80.2%
I am satisfied with the quality of learning materials available to me (Print, online material,
DVDs etc.) [PTES Q16f – no NSS equivalent]
N/A 78.4%
Q17. I have been able to access general IT resources when I needed to [PTES Q16c] 88.5% 79.1%
Q18. I have been able to access specialised equipment, facilities or rooms when I needed to [PTES
Q16e]
78.7% 60.4%
Q19. The course has helped me to present myself with confidence [PTES Q17d] 86.8% 69.7%
Q20. My communication skills have improved [PTES Q17e] 91.1% 64.0%
Q21. As a result of my course, I feel confident in tackling unfamiliar problems [PTES Q17f] 87.2% 69.3%
Number of responses to each item (range lowest – highest) 14156 -
15230
545 - 990
* PTES Q14a, the equivalent of the NSS item Q13, is slightly differently worded: „The timetable fits well with
my other commitments‟.
NSS Discipline Report – Nursing
20
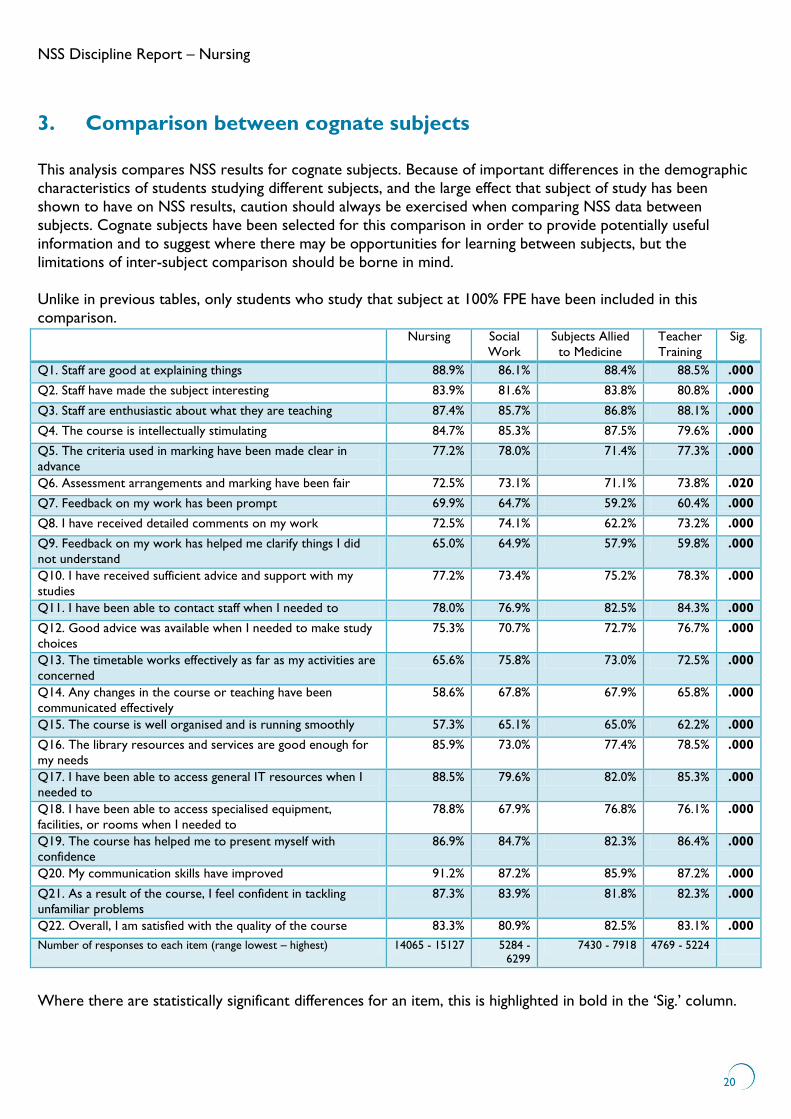
3. Comparison between cognate subjects
This analysis compares NSS results for cognate subjects. Because of important differences in the demographic
characteristics of students studying different subjects, and the large effect that subject of study has been
shown to have on NSS results, caution should always be exercised when comparing NSS data between
subjects. Cognate subjects have been selected for this comparison in order to provide potentially useful
information and to suggest where there may be opportunities for learning between subjects, but the
limitations of inter-subject comparison should be borne in mind.
Unlike in previous tables, only students who study that subject at 100% FPE have been included in this
comparison. Nursing Social
Work
Subjects Allied
to Medicine
Teacher
Training
Sig.
Q1. Staff are good at explaining things 88.9% 86.1% 88.4% 88.5% .000
Q2. Staff have made the subject interesting 83.9% 81.6% 83.8% 80.8% .000
Q3. Staff are enthusiastic about what they are teaching 87.4% 85.7% 86.8% 88.1% .000
Q4. The course is intellectually stimulating 84.7% 85.3% 87.5% 79.6% .000
Q5. The criteria used in marking have been made clear in
advance
77.2% 78.0% 71.4% 77.3% .000
Q6. Assessment arrangements and marking have been fair 72.5% 73.1% 71.1% 73.8% .020
Q7. Feedback on my work has been prompt 69.9% 64.7% 59.2% 60.4% .000
Q8. I have received detailed comments on my work 72.5% 74.1% 62.2% 73.2% .000
Q9. Feedback on my work has helped me clarify things I did
not understand
65.0% 64.9% 57.9% 59.8% .000
Q10. I have received sufficient advice and support with my
studies
77.2% 73.4% 75.2% 78.3% .000
Q11. I have been able to contact staff when I needed to 78.0% 76.9% 82.5% 84.3% .000
Q12. Good advice was available when I needed to make study
choices
75.3% 70.7% 72.7% 76.7% .000
Q13. The timetable works effectively as far as my activities are
concerned
65.6% 75.8% 73.0% 72.5% .000
Q14. Any changes in the course or teaching have been
communicated effectively
58.6% 67.8% 67.9% 65.8% .000
Q15. The course is well organised and is running smoothly 57.3% 65.1% 65.0% 62.2% .000
Q16. The library resources and services are good enough for
my needs
85.9% 73.0% 77.4% 78.5% .000
Q17. I have been able to access general IT resources when I
needed to
88.5% 79.6% 82.0% 85.3% .000
Q18. I have been able to access specialised equipment,
facilities, or rooms when I needed to
78.8% 67.9% 76.8% 76.1% .000
Q19. The course has helped me to present myself with
confidence
86.9% 84.7% 82.3% 86.4% .000
Q20. My communication skills have improved 91.2% 87.2% 85.9% 87.2% .000
Q21. As a result of the course, I feel confident in tackling
unfamiliar problems
87.3% 83.9% 81.8% 82.3% .000
Q22. Overall, I am satisfied with the quality of the course 83.3% 80.9% 82.5% 83.1% .000
Number of responses to each item (range lowest – highest) 14065 - 15127 5284 - 6299
7430 - 7918 4769 - 5224
Where there are statistically significant differences for an item, this is highlighted in bold in the „Sig.‟ column.

NSS Discipline Report – Nursing
21
4. Additional HEA resources
The Higher Education Academy supports institutions and discipline communities to use student survey data to
bring about the enhancement of the student learning experience. For more about our work on the National
Student Survey please visit http://www.heacademy.ac.uk/nss.
4.1 Research
The HEA has produced a number of key pieces of research relating to the NSS:
Dimensions of Quality (2010)
Produced by Graham Gibbs, this report sets out to identify those factors that give a reliable indication of the
quality of student learning. Its focus is broader than just the use of student survey data, but it provides a useful
overview of different mechanisms of evaluating educational quality.
Available from:
http://www.heacademy.ac.uk/assets/documents/evidence_informed_practice/Dimensions_of_Quality.pdf.
The National Student Survey three years on: What have we learned? (2009)
This report by Paula Surridge summarises some key pieces of research to give an overview of findings relating
to the NSS. It also gives recommendations for future work. It is a very useful guide to NSS data, especially
regarding the important question of what it can and cannot tell us.
Available from:
http://www.heacademy.ac.uk/assets/documents/research/surveys/nss/NSS_three_years_on_surridge_02.06.09.pdf.
National Student Survey of Teaching in UK Universities: Dimensionality, multilevel structure
and differentiation at the level of university and discipline: preliminary results (2008)
This report, by Herb Marsh and Jacqueline Cheng, is a technical investigation of a number of issues, focusing in
particular on the relative effects on NSS scores of various factors such as institution and discipline. It is a rich
source of information that can help to illuminate raw NSS data.
Available from: http://www.heacademy.ac.uk/assets/documents/research/surveys/nss/NSS_herb_marsh-
28.08.08.pdf.
4.2 Case studies of enhancement activities
Through its Institutional Working Group, the HEA has collected case studies describing how NSS data have
been used to enhance learning and teaching within institutions:
12 case studies from 2007, available from:
http://www.heacademy.ac.uk/assets/documents/subjects/bioscience/nss-case-studies.doc
5 case studies from 2010, available from: http://www.heacademy.ac.uk/assets/EvidenceNet/Case_studies/NSS_case_studies_Nov_2010.pdf.
NSS Discipline Report – Nursing
22
4.3 Postgraduate surveys
In addition to supporting the sector to use NSS data for the enhancement of learning and teaching, the HEA
has also developed its own national surveys, looking at the postgraduate student experience.
Postgraduate Taught Experience Survey
PTES has been running since 2009, and in 2011 about 39,000 students from 80 institutions completed the
survey. The survey asks students about a wide range of elements of their learning experience, including
feedback, teaching and skills development. It also asks about the depth and sophistication of the learning they
have engaged in. 85 institutions are taking part in the survey in 2012.
For more information visit: http://www.heacademy.ac.uk/ptes.
Postgraduate Research Experience Survey
PRES is the sister survey of PTES and is aimed at postgraduate research students. It runs every two years, and
in 2011 over 31,000 students from 102 institutions completed the survey. The survey will next run in 2013.
For more information please visit: http://www.heacademy.ac.uk/pres.
4.4 Consultancy and change programmes
The HEA runs regular change programmes for departments and faculties wishing to explore their NSS results.
More information can be found here: http://www.heacademy.ac.uk/change.
The HEA is also currently developing an institutional consultancy service, which will provide senior managers
with advice, tailored analysis and support to help them use survey data to strategically address issues in learning and teaching. If you are interested in this service then please email: [email protected].
NSS Discipline Report – Nursing
23
5. Further reading
In addition to the research produced by the HEA described in the previous section, there are number of
other studies and reviews that provide useful information about the strengths and limitations of NSS data.
Alan Fielding, Peter Dunleavy and Mark Langan (2010) Interpreting context to the UK‟s National
Student (Satisfaction) Survey for science subjects. Journal of Further and Higher Education. 34 (3), 347-
368.
This is an investigation into the complex issues that can arise when interpreting NSS data. A number of
important findings are contained in the article, such as the absence of a strong correlation between the
experience of feedback and overall satisfaction, and the important subject differences in students‟ responses
to the NSS items.
Abbi Flint, Anne Oxley, Paul Helm and Sally Bradley (2009) Preparing for success: one institution‟s aspirational and student focused response to the National Student Survey. Teaching in Higher Education.
14 (6), 608-618.
This article discusses the involvement of students in the process of using NSS data for quality enhancement
purposes. Various activities are described, including an event to allow academics to hear student perspectives
in detail, and the publication of a „You Said, We Did...‟ document to inform students of the changes that had
resulted from their feedback.
HEFCE (2011) National Student Survey: Findings and trends 2006 to 2010. Bristol: HEFCE.
This is the latest annual report on the NSS by HEFCE. It provides an overview of the 2010 data, as well as
looking at trends in the data from 2006 to 2010 around various demographic characteristics of the student
population.
Paul Ramsden, Denise Batchelor, Alison Peacock, Paul Temple and David Watson (2010) Enhancing and
developing the National Student Survey: report to HEFCE. Bristol: HEFCE.
This report, commissioned by HEFCE, provided an interim evaluation of the functions and performance of the
NSS, in order to arrive at recommendations about whether the survey should be updated or developed. The
study proposed no substantial changes to the survey, but recommended that a full review be undertaken in
2015.
John Richardson (2005) Instruments for obtaining student feedback: a review of the literature. Assessment and Evaluation in Higher Education. 30 (4), 387-415.
This is a very useful review of the research literature concerning the different kinds of survey tools that can
be used to gather information about students‟ learning experiences.
John Richardson, John Slater and Jane Wilson (2007) The National Student Survey: development,
findings and implications. Studies in Higher Education. 32 (5), 557-580.
This article describes the history and development of the NSS, focusing on the mechanisms and findings of the
two pilot surveys that took place in 2003 and 2004.
Ruth Williams and John Brennan (2003) Collecting and using student feedback on quality and standards of
learning and teaching in HE. Bristol: HEFCE.

NSS Discipline Report – Nursing
24
This is a report commissioned by HEFCE in order to: i) to identify good practice in collecting feedback from
students, for quality enhancement; and ii) to make recommendations about the design and implementation of
a national survey of students. This report played an important role in the development of the NSS.
Mantz Yorke (2009) Student experience surveys: some methodological considerations and an empirical investigation. Assessment & Evaluation in Higher Education. 34 (6), 721-739.
This article looks at a number of issues and controversies around the design and administration of sector-
wide student surveys, including the NSS.
NSS Discipline Report – Nursing
25
Appendix A: Brief description of analyses
Differences between subjects and between various demographic groups within each subject were analysed
using the chi-square test. Each NSS item was recoded from the 5 point Likert scale into the 3 point Likert
scale and was treated as a discrete variable. The Pearson chi-square statistics were calculated for each NSS
item separately and relevant statistical significance values are reported in the tables. If the statistical
significance value is equal or less than 0.05 then the difference between groups on the particular NSS item is
statistically significant.
NSS scale scores were calculated for each student as the averages taken over all items that belong to the
same scale. The averages were taken over the original 5 point Likert scale items, hence they take values
between 1 and 5. Some missing values were allowed, i.e. scale score was computed even if a student did not
provide an answer to all questions in the scale. The minimum number of answers required per scale was 3.
The correlation coefficients between scales and Q22 (the overall satisfaction item) were calculated using the
Bivariate correlation (Two-tailed)4.
The regression analysis employs simple linear regression. The dependent variable – Q22 on a 5 point Likert scale – was treated as a continuous variable, which is fairly common although not the only method used to
analyse this type of data. This method was chosen for the simplicity of the output and interpretation of the
regression coefficients. The NSS scale scores were used as the explanatory variables in the regression
equation. Some of them are highly correlated, hence the regression analysis may be subject to the
multicolinearity issue. Multicolinearity usually inflates the standard errors of the coefficients, but it does not
affect the main conclusion from the model.
The graph(s) shown in the report are simple error bar graph(s). The dots represent the proportion of
students who agreed with the overall satisfaction item (Q22). Error bars represent 95% confidence intervals.
Please see the Introduction for further guidance on the interpretation of statistical significance and confidence
intervals as used in this report.
4 Mean scale scores can oversimplify Likert scale categories, and have only been used in this report where necessary – to undertake
correlations and multiple regression analyses.
NSS Discipline Report – Nursing
26
Appendix B: Full list of subjects covered in this report
Nursing includes:
B700 Nursing Vocational science concerning the practical care of sick, injured or infirm patients in hospital and the
community. May include allied subjects in behavioural, social and biological sciences.
B701 Palliative Care Nursing
The study of principles and techniques for the provision of palliative care of the sick, disabled and infirm.
B710 Community Nursing
The study of principles and techniques for the provision of care for the sick, disabled and infirm within a community.
B711 District Nursing
The vocational study of principles and techniques associated with the peripatetic care of individuals within a
community.
B712 Health Visiting
The study of the techniques of assisting elderly, convalescent or disabled persons in their homes, and
providing for their physical, mental and social healthcare needs.
B713 School Nursing
The vocational study of principles and techniques for the provision of care within a school setting.
B714 Practice Nursing
The vocational study of principles and techniques associated with a doctor's surgery.
B720 Midwifery
The vocational study of principles and techniques to allow midwives to deliver babies and treat mothers in the
pre-natal, delivery and post-delivery periods.
B730 Paediatric Nursing
The vocational study of the principles and techniques to allow nurses to provide care for children, from
infancy to adolescence.
B740 Adult Nursing
The vocational study of the principles and techniques to allow nurses to provide care for adults
B741 Geriatric Nursing
The vocational study of the principles and techniques to allow nurses to provide care for the elderly.
B750 Dental Nursing
The study of principles and techniques in providing assistance to dentists undertaking dental procedures and
care to persons undergoing such procedures.
B760 Mental Health Nursing
The study of principles and techniques to allow nurses to provide care for persons with mental, emotional or
behavioural disorders.
B761 Learning Disability Nursing
The study of the principles and techniques to provide support for learning needs.
B770 Medical Nursing
The study of principles and techniques to allow nurses to provide care to patients before and during surgery
and to provide assistance to surgeons.
B771 Critical Care Nursing
The study of principles and techniques for care of critically ill patients.
B780 Paramedical Nursing
The study of principles and techniques to allow nurses to provide on-site care for persons with acute illnesses or injuries.
B790 Nursing not elsewhere classified
Miscellaneous grouping for related subjects which do not fit into other Nursing categories.

NSS Discipline Report – Nursing
27
Appendix C: Information about the NSS
The NSS is a survey of final-year students on undergraduate programmes. It is compulsory for publicly-funded
HE providers in England, Wales and Northern Ireland, and some Scottish institutions take part on a voluntary
basis5. Ipsos-MORI administer the survey on behalf of HEFCE, and contact all suitable students using a variety
of methods (including email and telephone). The survey was introduced in 2005, and in 2011 154 HEIs and 99
FECs took part, and 265,000 students responded – an overall response rate of 65%.
NSS data are currently available primarily from the Unistats website (http://unistats.direct.gov.uk), which
allows visitors to compare overall satisfaction results at course and institutional level, as well as download
spreadsheets with more comprehensive information. In addition HEFCE releases headline figures, as well as
annual reports providing national-level analysis. From September 2012, course-level NSS data will be
incorporated into Key Information Sets, which will be available on institutional websites and on a new central
website.
For reasons of reliability and confidentiality, the threshold for public reportability of the results is a response
rate of 23 responses, which must also represent at least 50% of the eligible students. Where there are less
than 23 responses, responses from more than one year, or from across different courses, can be aggregated
to produce publicly reportable data.
In addition to the public availability of the data, institutions receive their own data at a more detailed subject
level. The reportability threshold for the data that institutions receive is 10 responses, rather than 23.
Data at the individual student level are also available for researchers on application to HEFCE. Data at that
level have been used in this report.
The NSS is based to a significant extent on the Course Experience Questionnaire (CEQ), which has been in
use in Australia since 1993. There has been a significant amount of research on the CEQ, and a more limited
amount on the NSS, and this research indicates that the two surveys are both reliable – they yield consistent and repeatable data – and valid – they measure what they purport to measure.
The NSS asks participants to rate their level of agreement with 22 positive statements, on a five-point scale (in
addition to „not applicable‟): definitely disagree; mostly disagree; neither agree nor disagree; mostly agree;
definitely agree. The statements are grouped into six areas, or „scales‟, in addition to an overall statement:
teaching; assessment and feedback; academic support; organisation and management; learning resources;
personal development.
As well as asking participants to rate their agreement with 22 statements, the survey also invites them to add
free-text comments about particular positive or negative aspects of their experience. Institutions can choose
to utilise a bank of optional statements in addition to the 22 core statements, which are not publicly reported.
5 14 Scottish institutions took part in 2011.
NSS Discipline Report – Nursing
28
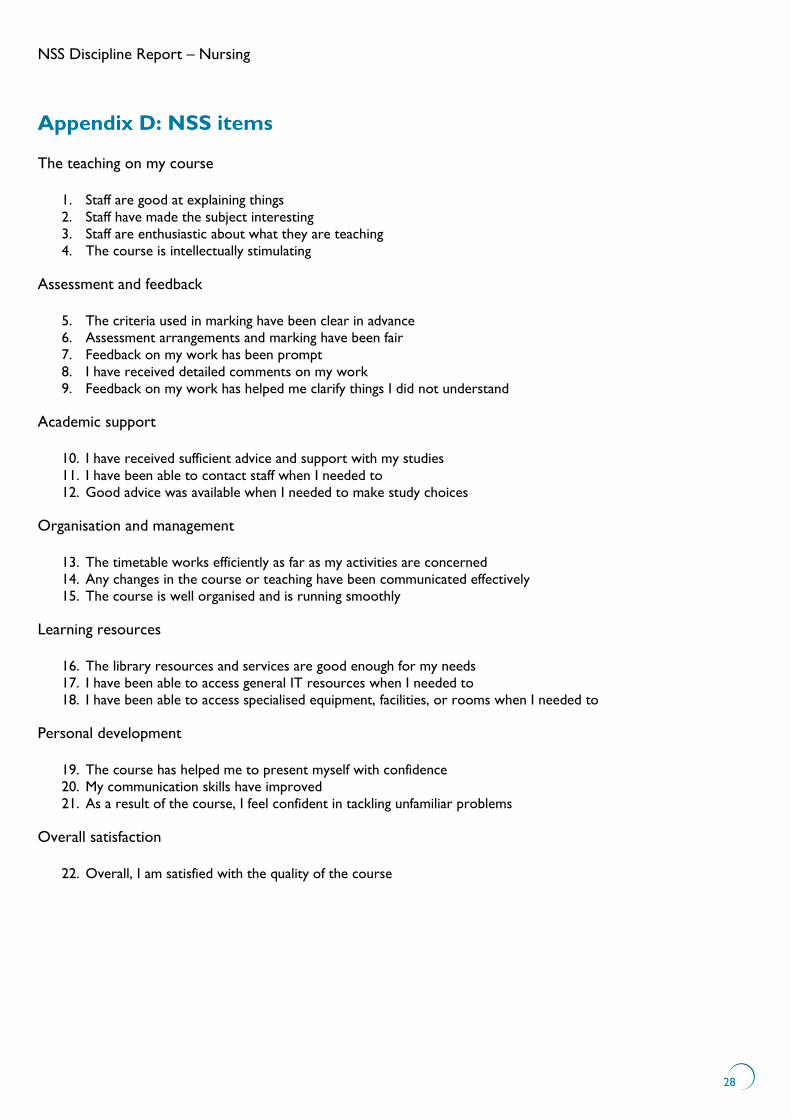
Appendix D: NSS items
The teaching on my course
1. Staff are good at explaining things
2. Staff have made the subject interesting
3. Staff are enthusiastic about what they are teaching
4. The course is intellectually stimulating
Assessment and feedback
5. The criteria used in marking have been clear in advance
6. Assessment arrangements and marking have been fair
7. Feedback on my work has been prompt
8. I have received detailed comments on my work
9. Feedback on my work has helped me clarify things I did not understand
Academic support
10. I have received sufficient advice and support with my studies
11. I have been able to contact staff when I needed to
12. Good advice was available when I needed to make study choices
Organisation and management
13. The timetable works efficiently as far as my activities are concerned
14. Any changes in the course or teaching have been communicated effectively
15. The course is well organised and is running smoothly
Learning resources
16. The library resources and services are good enough for my needs
17. I have been able to access general IT resources when I needed to
18. I have been able to access specialised equipment, facilities, or rooms when I needed to
Personal development
19. The course has helped me to present myself with confidence
20. My communication skills have improved
21. As a result of the course, I feel confident in tackling unfamiliar problems
Overall satisfaction
22. Overall, I am satisfied with the quality of the course