Embed Size (px)
Citation preview
NSSF® Report
AMERICANS ATTITUDES
Toward Hunting, Fishing, Sport Shooting
and Trapping 2019
Conducted for the National Shooting Sports Foundation®
by Responsive Management

AMERICANS’ ATTITUDES TOWARD HUNTING, FISHING, SPORT SHOOTING, AND TRAPPING
Conducted for the Association of Fish and Wildlife Agencies Under Multistate Conservation Grant Number F19AP00100
National Shooting Sports Foundation and Responsive Management
2019
AMERICANS’ ATTITUDES TOWARD HUNTING, FISHING, SPORT SHOOTING, AND TRAPPING
2019
National Shooting Sports FoundationJim Curcuruto, Director, Research & Market Development
11 Mile Hill Rd Newtown, CT 06470
Phone: 203-426-1320 E-mail: [email protected]
www.nssf.org
Responsive Management National Office Mark Damian Duda, Executive Director
Martin Jones, Senior Research Associate Tom Beppler, Senior Research Associate
Steven J. Bissell, Ph.D., Qualitative Research Associate Amanda Center, Research Associate
Andrea Criscione, Senior Research Associate Patrick Doherty, Research Associate
Gregory L. Hughes, P.E., Research Associate Caroline Gerken, Survey Center Manager
Alison Lanier, Business Manager
130 Franklin Street Harrisonburg, VA 22801
Phone: 540/432-1888 E-mail: [email protected]
www.responsivemanagement.com
Although NSSF partnered with Responsive Management for this report and the
Association of Fish and Wildlife Agencies provided funding for it, any errors in the
report are the sole responsibility of Responsive Management.
Americans’ Attitudes Toward Hunting, Fishing, Sport Shooting, and Trapping i
EXECUTIVE SUMMARY
This study was conducted by Responsive Management and the National Shooting Sports
Foundation to assess trends in Americans’ attitudes toward hunting, fishing, sport shooting, and
trapping. Responsive Management has tracked public attitudes on the four activities in various forms
since 1995, and the study makes use of this trend data by examining how Americans’ attitudes have
changed over the years.1 The project was funded by a Multistate Conservation Grant from the
Association of Fish and Wildlife Agencies. The study entailed a scientific telephone survey of adult
Americans, ages 18 and older. Details of the survey methodology are shown in the body of the
report.
Overall, 80% of Americans approve of legal hunting. Approval of hunting is highest in the
Midwest (at 86% approval) and is lowest in the Northeast (72%). Americans’ level of approval of
hunting has remained generally consistent over the past quarter century, with a gradual increase in
approval since 1995 when approval was at 73%.
However, approval of hunting varies considerably depending on the stated reason for
hunting. When the reasons are utilitarian in nature—for meat, to protect humans or property, for
wildlife management—approval is very high, but hunting drops substantially when the reason is for
the sport or for the challenge; meanwhile, less than a third of Americans approve of hunting for a
trophy. Nonetheless, approval of these less popular hunting motivations has rebounded following
rather sharp declines in 2016 (note that administration of the 2016 survey followed several high-
profile news stories that depicted trophy hunting in a negative light).
The species being hunted also affects approval of hunting. Hunting of ungulates and
waterfowl is more accepted than hunting of predator species, while the hunting of African lions and
elephants has even less approval among Americans. Similarly, approval of hunting depends on the
technique being used, especially the extent to which the technique in question allows for fair chase
(i.e., whether the animal has a reasonable chance to evade the hunter). For example, more Americans
approve of hunting with archery equipment than approve of hunting with high-tech gear or hunting
on property that has a high fence around it.
The survey findings suggest that fishing is less controversial than hunting: 93% of Americans
approve of legal recreational fishing (compared to 80% who approve of legal hunting). Like hunting,
however, approval of fishing depends on the motivation: more Americans approve of fishing for food
than fishing for the sport, for the challenge, or for a trophy fish. Meanwhile, most methods of fishing
have high approval, with the exceptions of gigging and snagging.
The survey also examined attitudes toward shooting, finding that 81% of Americans approve
of legal recreational shooting. This finding is consistent with the approval rates for shooting found in
previous survey years, with the exception of a slight dip in approval in 2011.
Trapping is more controversial than the other outdoor recreational activities explored in this
study. Public opinion on regulated trapping is split: 52% of Americans approve while 31%
disapprove. Again, attitudes appear to be influenced by the stated motivation for the activity: there is
relatively high approval of trapping for wildlife restoration, population control, food, and property
protection, but less approval of trapping for money, fur clothing, and recreation.
Higher approval of all four activities (hunting, fishing, shooting, and trapping) is correlated
with being male, white, living in a rural area, living in the Midwest or Southeast regions, and
growing up with firearms. Conversely, lower approval of the activities is associated with being
female, Hispanic, black, living in an urban area, living in the Northeast or West regions, and not
growing up with firearms.
1 For the trend results in this report, comparisons of the new data are made only to previous Responsive
Management survey questions that used consistent wording.
ii Responsive Management
TABLE OF CONTENTS
Introduction and Methodology ........................................................................................................1
Use of Telephones for the Survey ...........................................................................................1
Questionnaire Design ..............................................................................................................2
Survey Sample .........................................................................................................................2
Telephone Interviewing Facilities ...........................................................................................2
Interviewing Dates and Times .................................................................................................3
Telephone Survey Data Collection and Quality Control .........................................................3
Data Analysis ...........................................................................................................................3
Sampling Error ........................................................................................................................4
Additional Information About the Presentation of Results in the Report ...............................5
Demographic Correlation Graphs and How to Interpret Them ...............................................6
Attitudes Toward Hunting in the United States ...............................................................................7
Attitudes Toward Hunting in General .....................................................................................7
Motivations for Hunting ........................................................................................................12
Attitudes Toward Hunting Different Species ........................................................................23
Methods of Hunting ...............................................................................................................34
Attitudes Toward Fishing in the United States ..............................................................................44
Attitudes Toward Fishing in General ....................................................................................44
Motivations for Fishing .........................................................................................................48
Methods of Fishing ................................................................................................................57
Attitudes Toward Sport Shooting in the United States ..................................................................67
Attitudes Toward Trapping in the United States ...........................................................................72
Demographics ................................................................................................................................85
About Responsive Management ....................................................................................................89
Americans’ Attitudes Toward Hunting, Fishing, Sport Shooting, and Trapping 1
INTRODUCTION AND METHODOLOGY
This study was conducted by Responsive Management and the National Shooting Sports
Foundation (NSSF) to measure Americans’ attitudes toward hunting, fishing, sport shooting, and
trapping. Responsive Management has tracked public attitudes on the four activities in various
forms since 1995, and the study makes use of this trend data by examining how Americans’
attitudes have changed over the years.1 The study also examines how approval of hunting,
fishing, and trapping varies by motivation, species, and method. The study entailed a scientific
telephone survey of adult Americans, ages 18 and older. Data from the survey were weighted to
ensure that the results were representative of adult Americans as a whole.
In the survey, the four activities are referred to as follows: “legal hunting,” “legal recreational
fishing,” “legal recreational shooting,” and “regulated trapping.” The qualifying terms before
each activity serve to exclude any illegal or improper variations of the activity, as might be the
case if a respondent were to interpret the single term “hunting” as being inclusive of poaching.
The project was funded by a Multistate Conservation Grant from the Association of Fish and
Wildlife Agencies (AFWA). Previous similar trend surveys have been funded by a variety of
partners and grants, including through the National Shooting Sports Foundation, the Association
of Fish and Wildlife Agencies’ Multistate Conservation Grant Program, the U.S. Fish and
Wildlife Service, the Hunters’ Leadership Forum, the Northeast Association of Fish and Wildlife
Agencies, the Southeast Association of Fish and Wildlife Agencies, the Midwest Association of
Fish and Wildlife Agencies, and the Western Association of Fish and Wildlife Agencies.
Other sources for the data used in the hunting, fishing, and trapping trend analysis include
surveys for the Professional Outdoor Media Association and the Archery Trade Association;
additionally, the trend analysis on shooting uses data from a survey by Roper Starch Worldwide.
Sample sizes for these surveys range from 800 to 5,103, with sampling error ranging from plus
or minus 1.4 to 3.5 percentage points. All telephone surveys administered since 2006 entailed
landlines and cell phones called in their proper state and regional proportions.
Specific aspects of the research methodology are discussed below.
USE OF TELEPHONES FOR THE SURVEY
For the survey, telephones were selected as the preferred sampling medium because of the
almost universal ownership of telephones among Americans (both landlines and cell phones
were called in their exact state and regional proportions). Additionally, telephone surveys,
relative to mail or Internet surveys, allow for more scientific sampling and data collection,
provide higher quality data, obtain higher response rates, are more timely, and are more
cost-effective. Telephone surveys also have better representation of the sample than mail surveys
because the latter systematically exclude those who are not literate enough to complete the
surveys or who would be intimidated by having to complete a written survey—by an estimate of
the U.S. Department of Education’s National Institute of Literacy (2016), up to 43% of the
general population read no higher than a “basic level,” suggesting that they would be reticent to
1 For the trend results in this report, comparisons of the new data are made only to previous Responsive
Management survey questions that used consistent wording.
2 Responsive Management
complete a written survey. Finally, telephone surveys also have fewer negative effects on the
environment than do mail surveys because of reduced use of paper and reduced energy
consumption for delivering and returning the questionnaires.
QUESTIONNAIRE DESIGN
The telephone survey questionnaire was developed cooperatively by Responsive Management
and NSSF, based on the research team’s familiarity with similar surveys. In addition, the
questionnaire in part included questions from previous surveys to allow for a trend analysis.
Responsive Management conducted pre-tests of the questionnaire to ensure proper wording,
flow, and logic in the survey.
SURVEY SAMPLE
The sample of adult Americans was obtained from Dynata (formerly known as Survey Sampling
International), a firm that specializes in providing scientifically valid samples for survey
research. The sample included both landlines and cell phones, which were called in the exact
proportions that they exist on a state-by-state and regional basis—the resulting national sample
was representative of all Americans living in households with a landline, cell phone, or both. A
probability-based selection process ensured that each eligible American had an equal chance of
being selected for the survey. This process ensured that the sample was valid because every
resident had a known chance of participating in the survey.
Responsive Management obtained a total of 3,014 completed interviews. The sample size is less
than 3,014 on some graphs because certain questions were asked only of a random subset of the
entire sample. This was done to minimize respondent burden by reducing the overall survey
length for each respondent.
TELEPHONE INTERVIEWING FACILITIES
A central polling site at the Responsive Management office allowed for rigorous quality control
over the interviews and data collection. Responsive Management maintains its own in-house
telephone interviewing facilities. These facilities are staffed by interviewers with experience
conducting computer-assisted telephone interviews on the subjects of outdoor recreation and
natural resources.
To ensure the integrity of the telephone survey data, Responsive Management has interviewers
who have been trained according to the standards established by the Council of American Survey
Research Organizations. Methods of instruction included lecture and role-playing. The Survey
Center Managers and other professional staff conducted a project briefing with the interviewers
prior to the administration of this survey. Interviewers were instructed on type of study, study
goals and objectives, handling of survey questions, interview length, termination points and
qualifiers for participation, interviewer instructions within the survey questionnaire, reading of
the survey questions, skip patterns, and probing and clarifying techniques necessary for specific
questions on the survey questionnaire.
Americans’ Attitudes Toward Hunting, Fishing, Sport Shooting, and Trapping 3
INTERVIEWING DATES AND TIMES
Telephone surveying times are Monday through Friday from noon to 9:00 p.m., Saturday from
noon to 5:00 p.m., and Sunday from 5:00 p.m. to 9:00 p.m., local time. A five-callback design
was used to maintain the representativeness of the sample, to avoid bias toward people easy to
reach by telephone, and to provide an equal opportunity for all to participate. When a respondent
could not be reached on the first call, subsequent calls were placed on different days of the week
and at different times of the day. The survey was conducted in January 2019.
TELEPHONE SURVEY DATA COLLECTION AND QUALITY CONTROL
The software used for data collection was Questionnaire Programming Language (QPL). The
survey data were entered into the computer as each interview was being conducted, eliminating
manual data entry after the completion of the survey and the concomitant data entry errors that
may occur with manual data entry. The survey questionnaire was programmed so that QPL
branched, coded, and substituted phrases in the survey based on previous responses to ensure the
integrity and consistency of the data collection.
The Survey Center Managers and statisticians monitored the data collection, including
monitoring of the actual telephone interviews without the interviewers’ knowledge, to evaluate
the performance of each interviewer and ensure the integrity of the data. The survey
questionnaire itself contains error checkers and computation statements to ensure quality and
consistent data. After the surveys were obtained by the interviewers, the Survey Center
Managers and/or statisticians checked each completed survey to ensure clarity and completeness.
DATA ANALYSIS
The analysis of data was performed using IBM SPSS Statistics as well as proprietary software
developed by Responsive Management. The survey data were weighted by age, gender, race/
ethnicity, and geographic region, based on the latest population proportions obtained from the
U.S. Census Bureau. Note that this weighting resulted in only minimal adjustments to the results
(typically 1-2%), as the raw data collected were quite close to actual population proportions. The
findings shown in this report are representative of adult Americans as a whole (see the
“Demographics” section at the end of the report for a breakdown of the characteristics of adult
Americans used for the weighting of survey data).
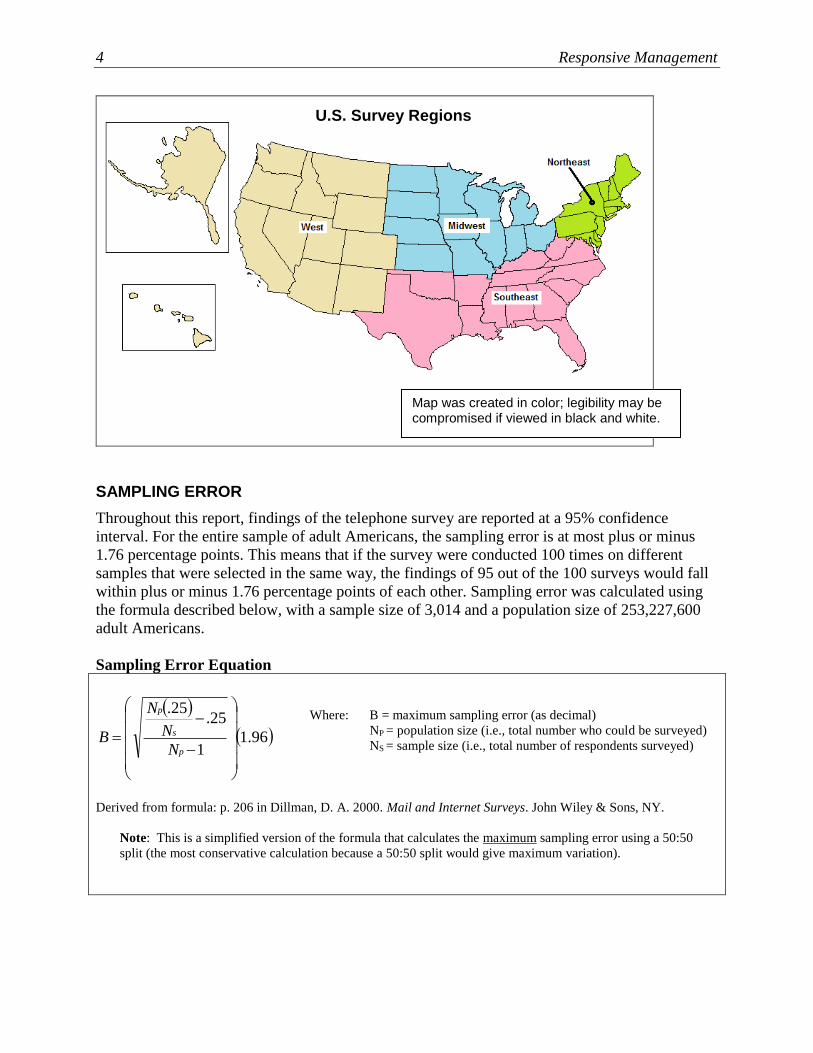
For all questions in the survey, crosstabulations were run to compare and contrast regional
differences. The four geographic regions used for these analyses are shown in the map on the
following page.
4 Responsive Management
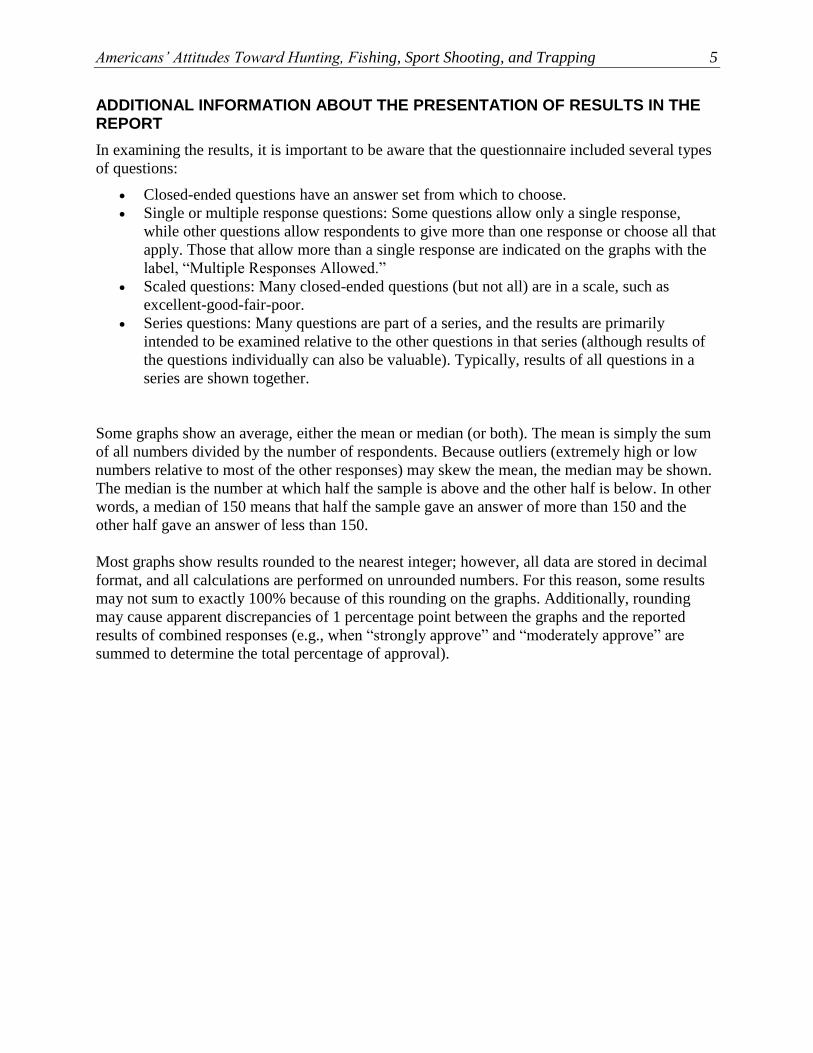
SAMPLING ERROR
Throughout this report, findings of the telephone survey are reported at a 95% confidence
interval. For the entire sample of adult Americans, the sampling error is at most plus or minus
1.76 percentage points. This means that if the survey were conducted 100 times on different
samples that were selected in the same way, the findings of 95 out of the 100 surveys would fall
within plus or minus 1.76 percentage points of each other. Sampling error was calculated using
the formula described below, with a sample size of 3,014 and a population size of 253,227,600
adult Americans.
Sampling Error Equation
( )
( )96.11
25.25.
−
−
=p
s
p
N
N
N
B
Derived from formula: p. 206 in Dillman, D. A. 2000. Mail and Internet Surveys. John Wiley & Sons, NY.
Note: This is a simplified version of the formula that calculates the maximum sampling error using a 50:50
split (the most conservative calculation because a 50:50 split would give maximum variation).
Where: B = maximum sampling error (as decimal)
NP = population size (i.e., total number who could be surveyed)
NS = sample size (i.e., total number of respondents surveyed)
Map was created in color; legibility may be compromised if viewed in black and white.
U.S. Survey Regions
Americans’ Attitudes Toward Hunting, Fishing, Sport Shooting, and Trapping 5
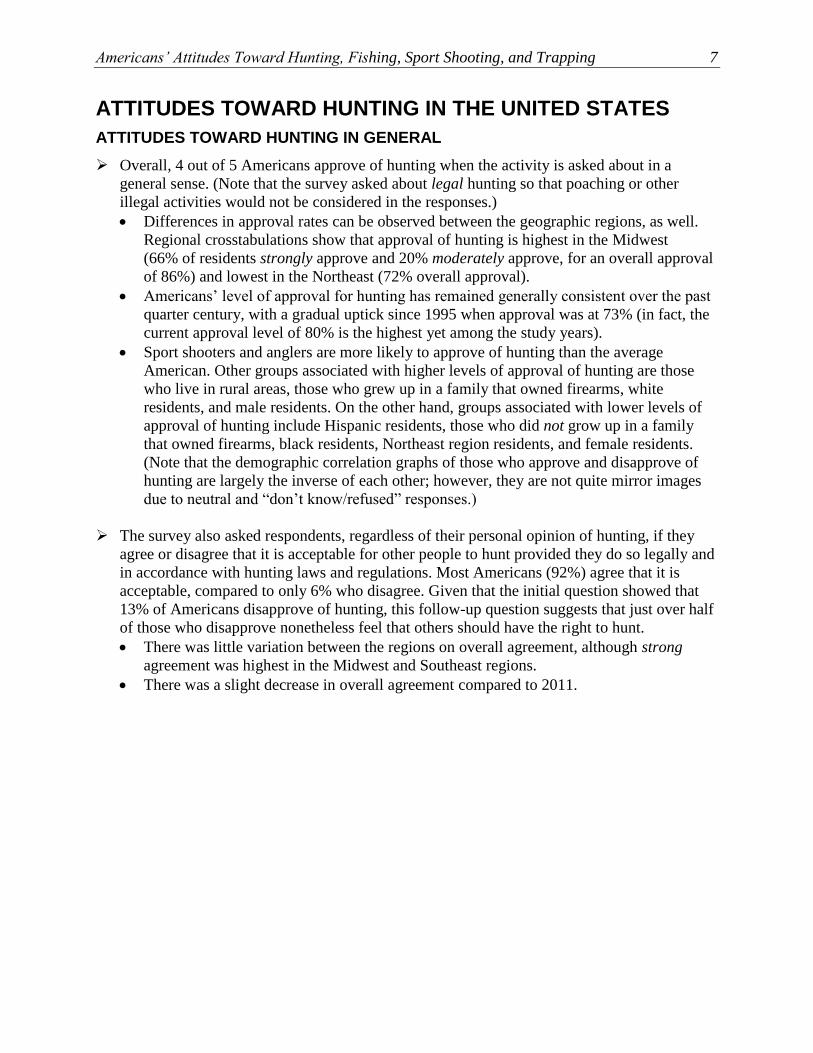
ADDITIONAL INFORMATION ABOUT THE PRESENTATION OF RESULTS IN THE REPORT
In examining the results, it is important to be aware that the questionnaire included several types
of questions:
• Closed-ended questions have an answer set from which to choose.
• Single or multiple response questions: Some questions allow only a single response,
while other questions allow respondents to give more than one response or choose all that
apply. Those that allow more than a single response are indicated on the graphs with the
label, “Multiple Responses Allowed.”
• Scaled questions: Many closed-ended questions (but not all) are in a scale, such as
excellent-good-fair-poor.
• Series questions: Many questions are part of a series, and the results are primarily
intended to be examined relative to the other questions in that series (although results of
the questions individually can also be valuable). Typically, results of all questions in a
series are shown together.
Some graphs show an average, either the mean or median (or both). The mean is simply the sum
of all numbers divided by the number of respondents. Because outliers (extremely high or low
numbers relative to most of the other responses) may skew the mean, the median may be shown.
The median is the number at which half the sample is above and the other half is below. In other
words, a median of 150 means that half the sample gave an answer of more than 150 and the
other half gave an answer of less than 150.
Most graphs show results rounded to the nearest integer; however, all data are stored in decimal
format, and all calculations are performed on unrounded numbers. For this reason, some results
may not sum to exactly 100% because of this rounding on the graphs. Additionally, rounding
may cause apparent discrepancies of 1 percentage point between the graphs and the reported
results of combined responses (e.g., when “strongly approve” and “moderately approve” are
summed to determine the total percentage of approval).
6 Responsive Management
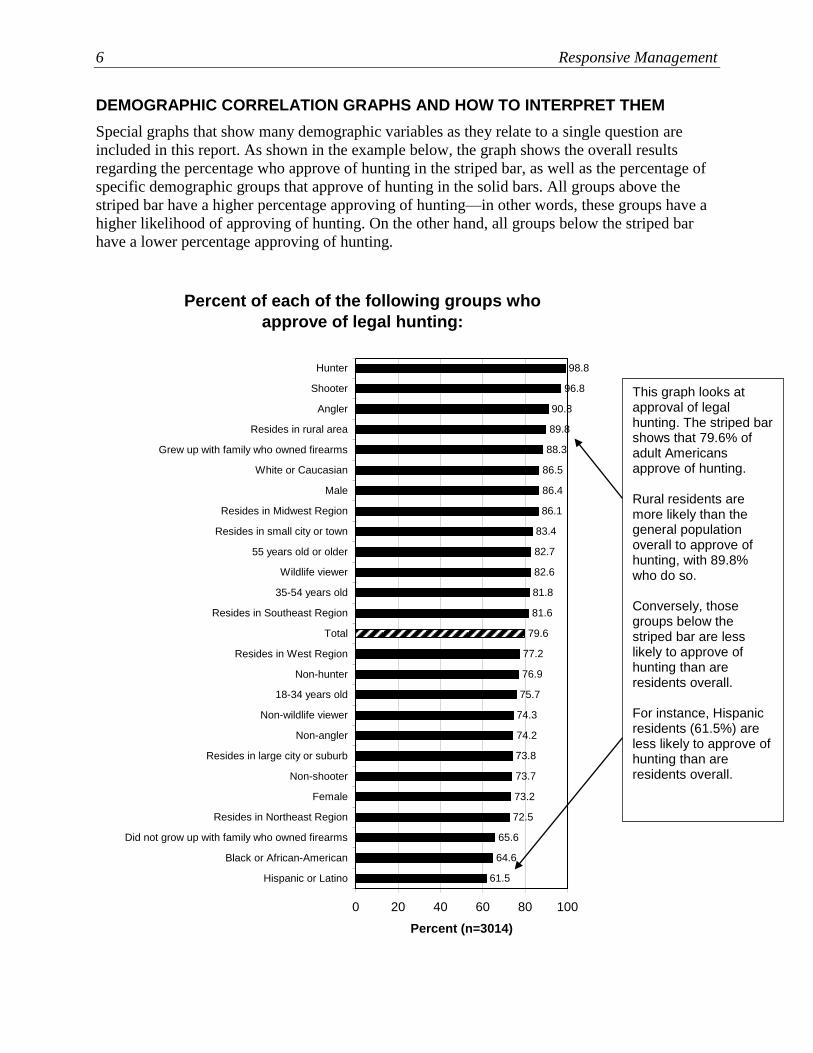
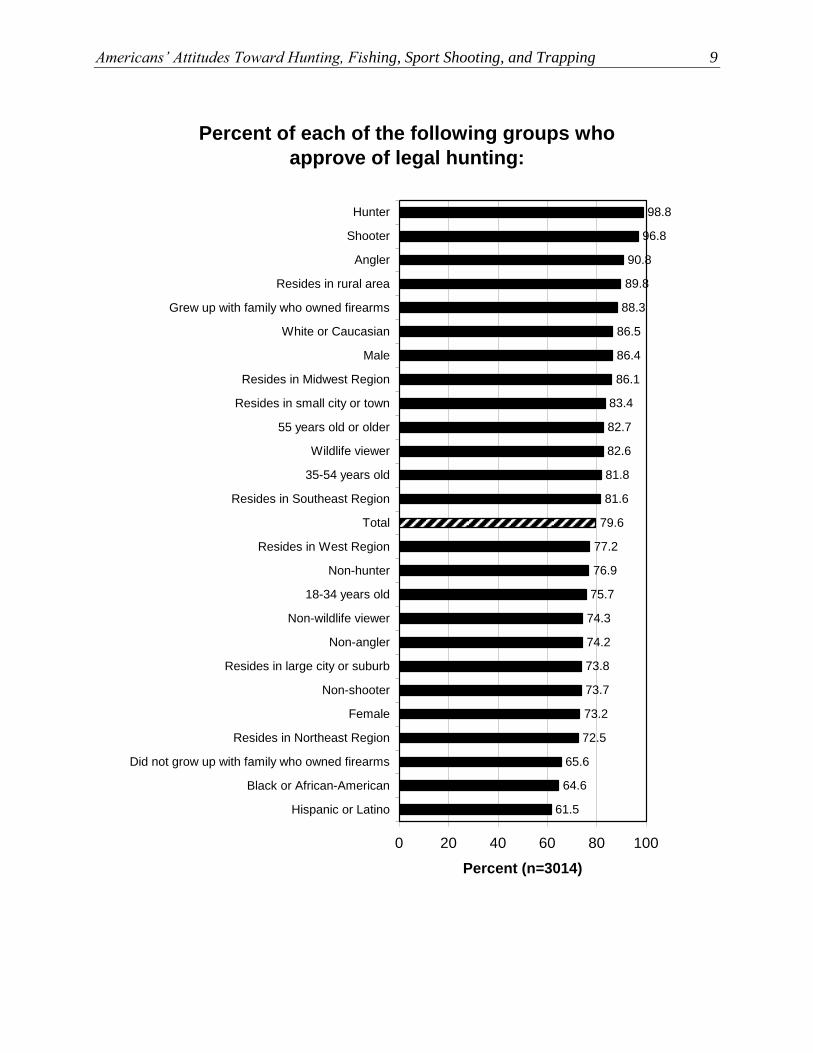
DEMOGRAPHIC CORRELATION GRAPHS AND HOW TO INTERPRET THEM
Special graphs that show many demographic variables as they relate to a single question are
included in this report. As shown in the example below, the graph shows the overall results
regarding the percentage who approve of hunting in the striped bar, as well as the percentage of
specific demographic groups that approve of hunting in the solid bars. All groups above the
striped bar have a higher percentage approving of hunting—in other words, these groups have a
higher likelihood of approving of hunting. On the other hand, all groups below the striped bar
have a lower percentage approving of hunting.
Percent of each of the following groups who
approve of legal hunting:
76.9
75.7
74.3
74.2
73.8
73.7
73.2
72.5
65.6
64.6
61.5
83.4
86.1
86.4
98.8
96.8
90.8
89.8
88.3
86.5
82.7
82.6
81.8
81.6
79.6
77.2
0 20 40 60 80 100
Hunter
Shooter
Angler
Resides in rural area
Grew up with family who owned firearms
White or Caucasian
Male
Resides in Midwest Region
Resides in small city or town
55 years old or older
Wildlife viewer
35-54 years old
Resides in Southeast Region
Total
Resides in West Region
Non-hunter
18-34 years old
Non-wildlife viewer
Non-angler
Resides in large city or suburb
Non-shooter
Female
Resides in Northeast Region
Did not grow up with family who owned firearms
Black or African-American
Hispanic or Latino
Percent (n=3014)
This graph looks at approval of legal hunting. The striped bar shows that 79.6% of adult Americans approve of hunting. Rural residents are more likely than the general population overall to approve of hunting, with 89.8% who do so. Conversely, those groups below the striped bar are less likely to approve of hunting than are residents overall. For instance, Hispanic residents (61.5%) are less likely to approve of hunting than are residents overall.
Americans’ Attitudes Toward Hunting, Fishing, Sport Shooting, and Trapping 7
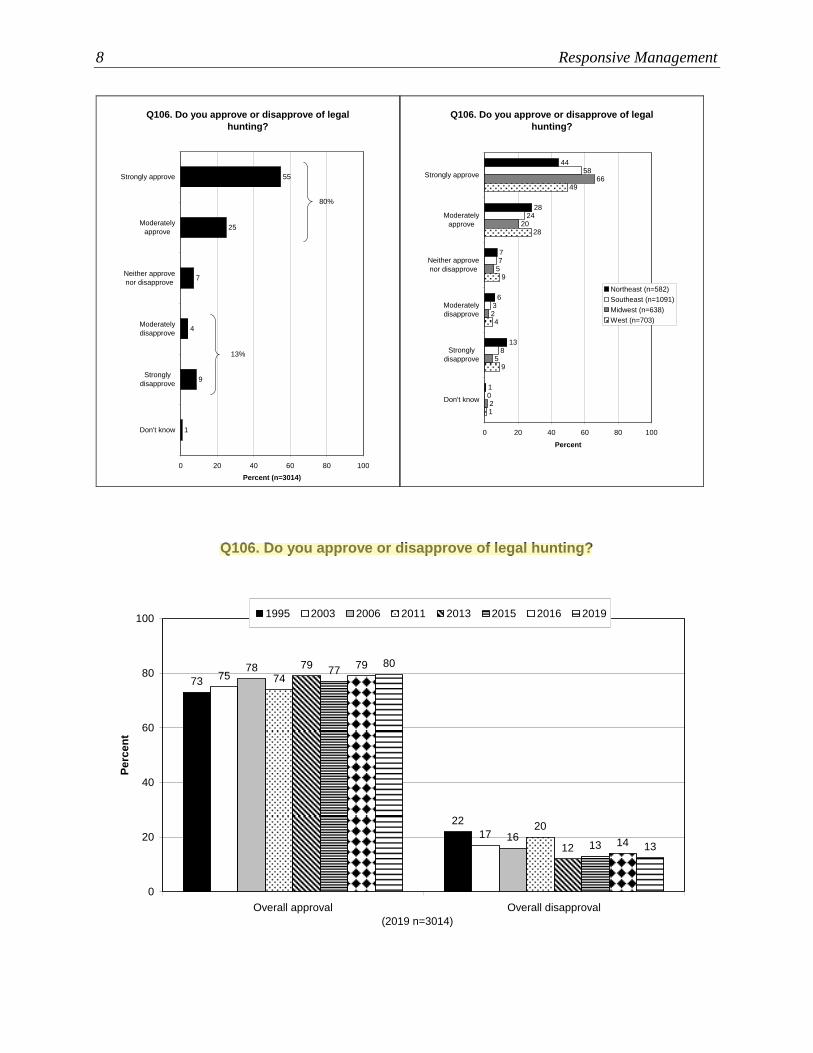
ATTITUDES TOWARD HUNTING IN THE UNITED STATES
ATTITUDES TOWARD HUNTING IN GENERAL
➢ Overall, 4 out of 5 Americans approve of hunting when the activity is asked about in a
general sense. (Note that the survey asked about legal hunting so that poaching or other
illegal activities would not be considered in the responses.)
• Differences in approval rates can be observed between the geographic regions, as well.
Regional crosstabulations show that approval of hunting is highest in the Midwest
(66% of residents strongly approve and 20% moderately approve, for an overall approval
of 86%) and lowest in the Northeast (72% overall approval).
• Americans’ level of approval for hunting has remained generally consistent over the past
quarter century, with a gradual uptick since 1995 when approval was at 73% (in fact, the
current approval level of 80% is the highest yet among the study years).
• Sport shooters and anglers are more likely to approve of hunting than the average
American. Other groups associated with higher levels of approval of hunting are those
who live in rural areas, those who grew up in a family that owned firearms, white
residents, and male residents. On the other hand, groups associated with lower levels of
approval of hunting include Hispanic residents, those who did not grow up in a family
that owned firearms, black residents, Northeast region residents, and female residents.
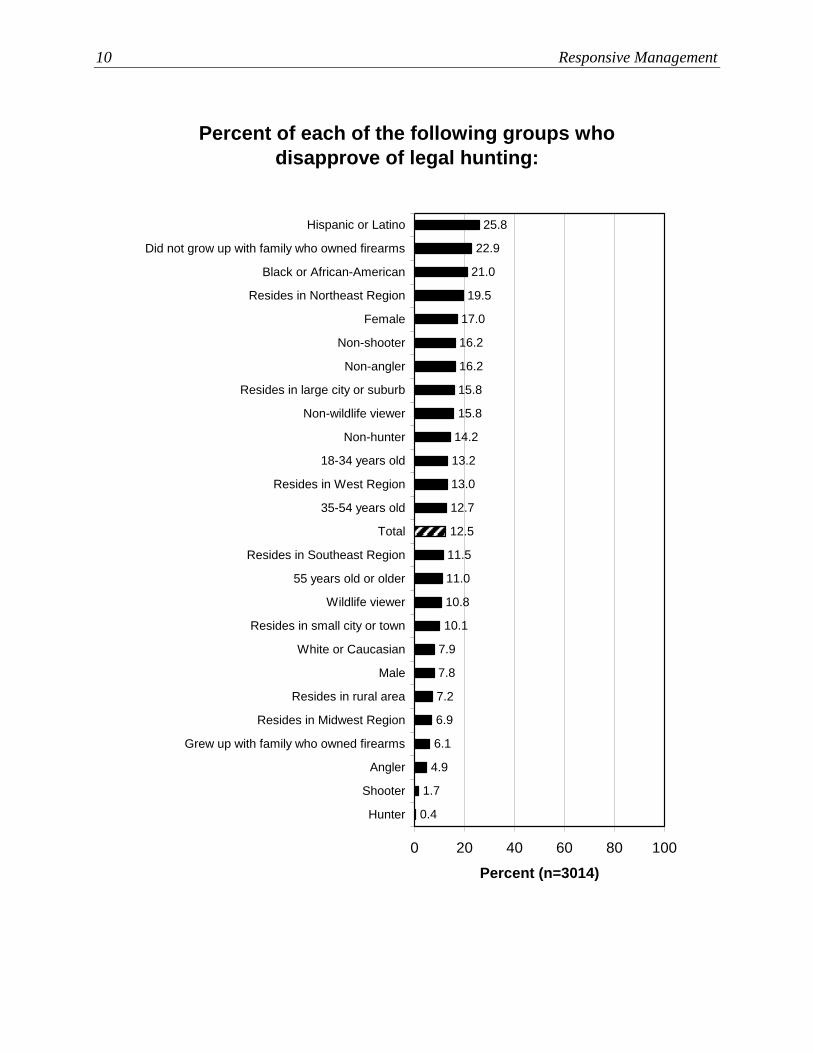
(Note that the demographic correlation graphs of those who approve and disapprove of
hunting are largely the inverse of each other; however, they are not quite mirror images
due to neutral and “don’t know/refused” responses.)
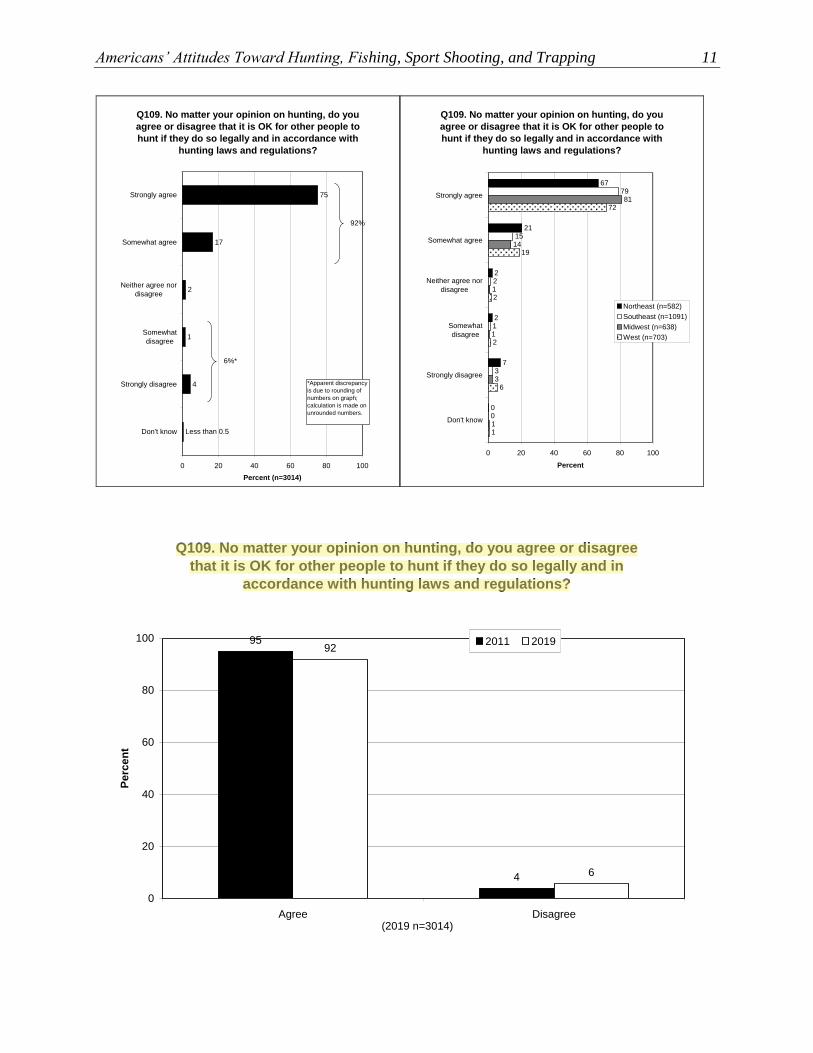
➢ The survey also asked respondents, regardless of their personal opinion of hunting, if they
agree or disagree that it is acceptable for other people to hunt provided they do so legally and
in accordance with hunting laws and regulations. Most Americans (92%) agree that it is
acceptable, compared to only 6% who disagree. Given that the initial question showed that
13% of Americans disapprove of hunting, this follow-up question suggests that just over half
of those who disapprove nonetheless feel that others should have the right to hunt.
• There was little variation between the regions on overall agreement, although strong
agreement was highest in the Midwest and Southeast regions.
• There was a slight decrease in overall agreement compared to 2011.
8 Responsive Management
Q106. Do you approve or disapprove of legal
hunting?
55
25
7
4
9
1
0 20 40 60 80 100
Strongly approve
Moderately
approve
Neither approve
nor disapprove
Moderately
disapprove
Strongly
disapprove
Don't know
Percent (n=3014)
80%
13%
Q106. Do you approve or disapprove of legal
hunting?
44
28
7
6
13
10
8
3
7
24
58
2
5
2
66
20
5
1
9
4
49
28
9
0 20 40 60 80 100
Strongly approve
Moderately
approve
Neither approve
nor disapprove
Moderately
disapprove
Strongly
disapprove
Don't know
Percent
Northeast (n=582)
Southeast (n=1091)
Midwest (n=638)
West (n=703)
Q106. Do you approve or disapprove of legal hunting?
22
7375
17 16
78
20
74
12
79
13
77
14
79
13
80
0
20
40
60
80
100
Overall approval Overall disapproval
Pe
rce
nt
1995 2003 2006 2011 2013 2015 2016 2019
(2019 n=3014)
Americans’ Attitudes Toward Hunting, Fishing, Sport Shooting, and Trapping 9
Percent of each of the following groups who
approve of legal hunting:
76.9
75.7
74.3
74.2
73.8
73.7
73.2
72.5
65.6
64.6
61.5
83.4
86.1
86.4
98.8
96.8
90.8
89.8
88.3
86.5
82.7
82.6
81.8
81.6
79.6
77.2
0 20 40 60 80 100
Hunter
Shooter
Angler
Resides in rural area
Grew up with family who owned firearms
White or Caucasian
Male
Resides in Midwest Region
Resides in small city or town
55 years old or older
Wildlife viewer
35-54 years old
Resides in Southeast Region
Total
Resides in West Region
Non-hunter
18-34 years old
Non-wildlife viewer
Non-angler
Resides in large city or suburb
Non-shooter
Female
Resides in Northeast Region
Did not grow up with family who owned firearms
Black or African-American
Hispanic or Latino
Percent (n=3014)
10 Responsive Management
Percent of each of the following groups who
disapprove of legal hunting:
11.0
10.8
10.1
7.9
7.8
7.2
6.9
6.1
4.9
1.7
0.4
15.8
15.8
16.2
25.8
22.9
21.0
19.5
17.0
16.2
14.2
13.2
13.0
12.7
12.5
11.5
0 20 40 60 80 100
Hispanic or Latino
Did not grow up with family who owned firearms
Black or African-American
Resides in Northeast Region
Female
Non-shooter
Non-angler
Resides in large city or suburb
Non-wildlife viewer
Non-hunter
18-34 years old
Resides in West Region
35-54 years old
Total
Resides in Southeast Region
55 years old or older
Wildlife viewer
Resides in small city or town
White or Caucasian
Male
Resides in rural area
Resides in Midwest Region
Grew up with family who owned firearms
Angler
Shooter
Hunter
Percent (n=3014)
Americans’ Attitudes Toward Hunting, Fishing, Sport Shooting, and Trapping 11
Q109. No matter your opinion on hunting, do you
agree or disagree that it is OK for other people to
hunt if they do so legally and in accordance with
hunting laws and regulations?
75
17
2
1
4
Less than 0.5
0 20 40 60 80 100
Strongly agree
Somewhat agree
Neither agree nor
disagree
Somewhat
disagree
Strongly disagree
Don't know
Percent (n=3014)
92%
6%*
*Apparent discrepancy
is due to rounding of
numbers on graph;
calculation is made on
unrounded numbers.
Q109. No matter your opinion on hunting, do you
agree or disagree that it is OK for other people to
hunt if they do so legally and in accordance with
hunting laws and regulations?
67
21
2
2
7
00
3
1
2
15
79
1
3
1
81
14
1
1
6
2
72
19
2
0 20 40 60 80 100
Strongly agree
Somewhat agree
Neither agree nor
disagree
Somewhat
disagree
Strongly disagree
Don't know
Percent
Northeast (n=582)
Southeast (n=1091)
Midwest (n=638)
West (n=703)
Q109. No matter your opinion on hunting, do you agree or disagree
that it is OK for other people to hunt if they do so legally and in
accordance with hunting laws and regulations?
4
9592
6
0
20
40
60
80
100
Agree Disagree
Pe
rce
nt
2011 2019
(2019 n=3014)
12 Responsive Management
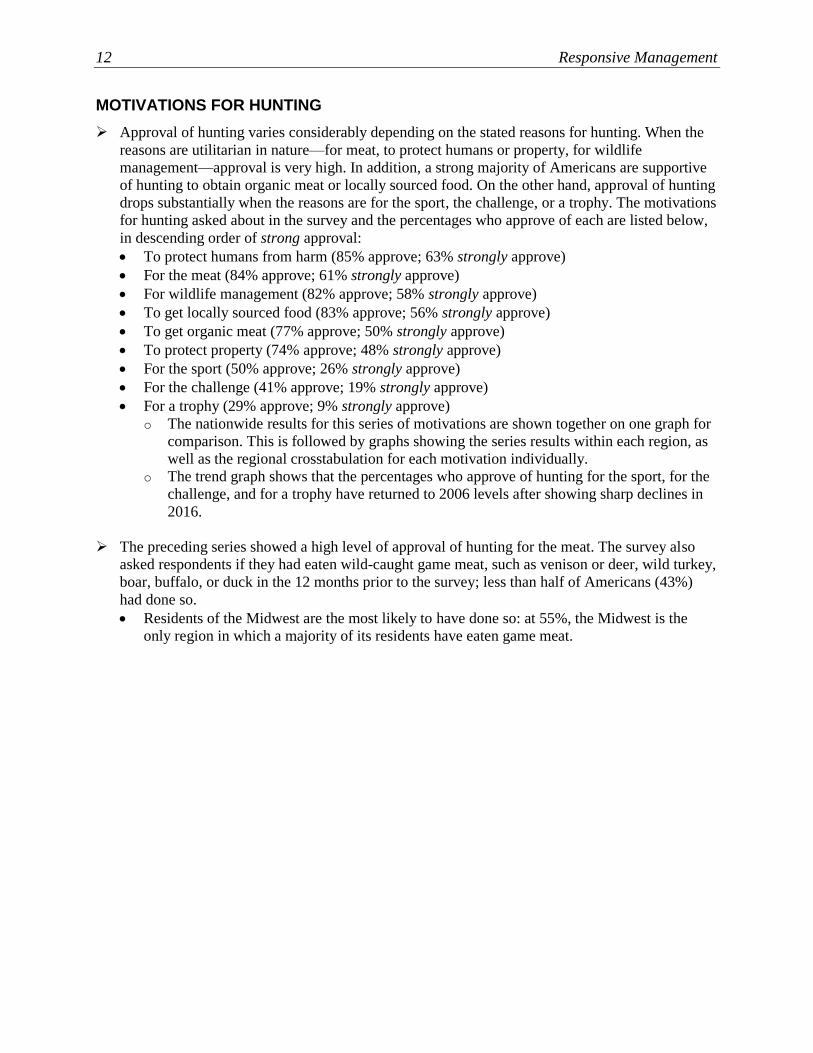
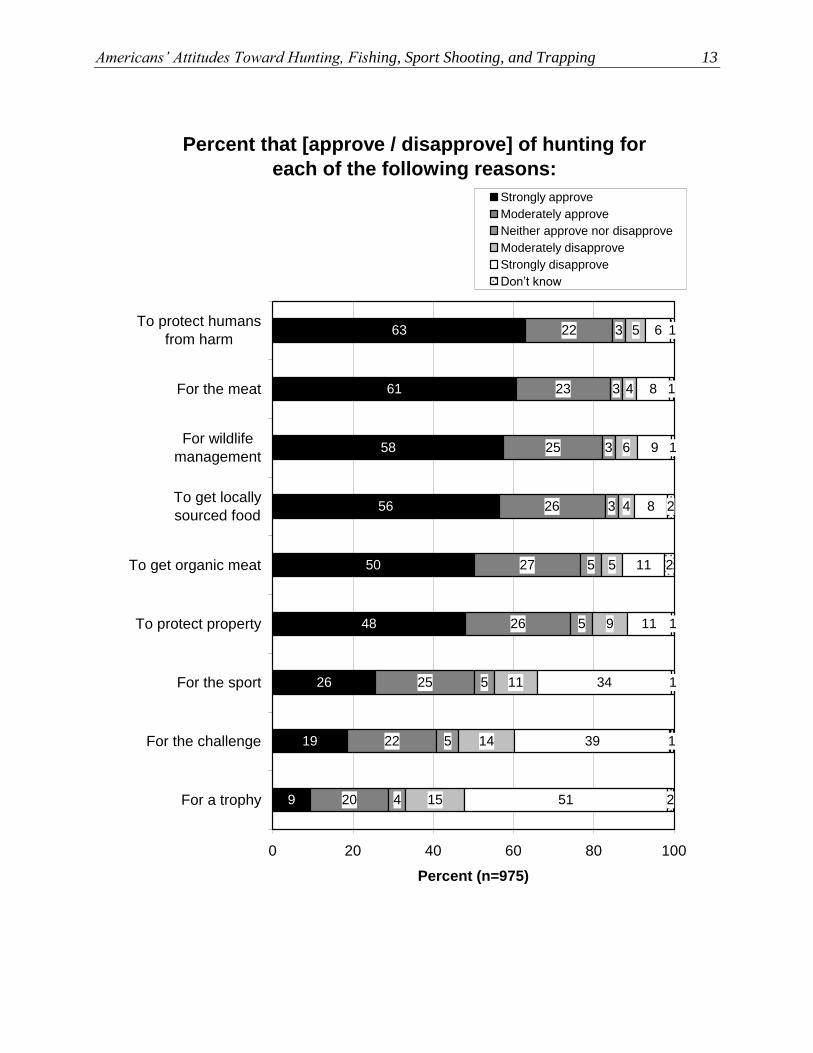
MOTIVATIONS FOR HUNTING
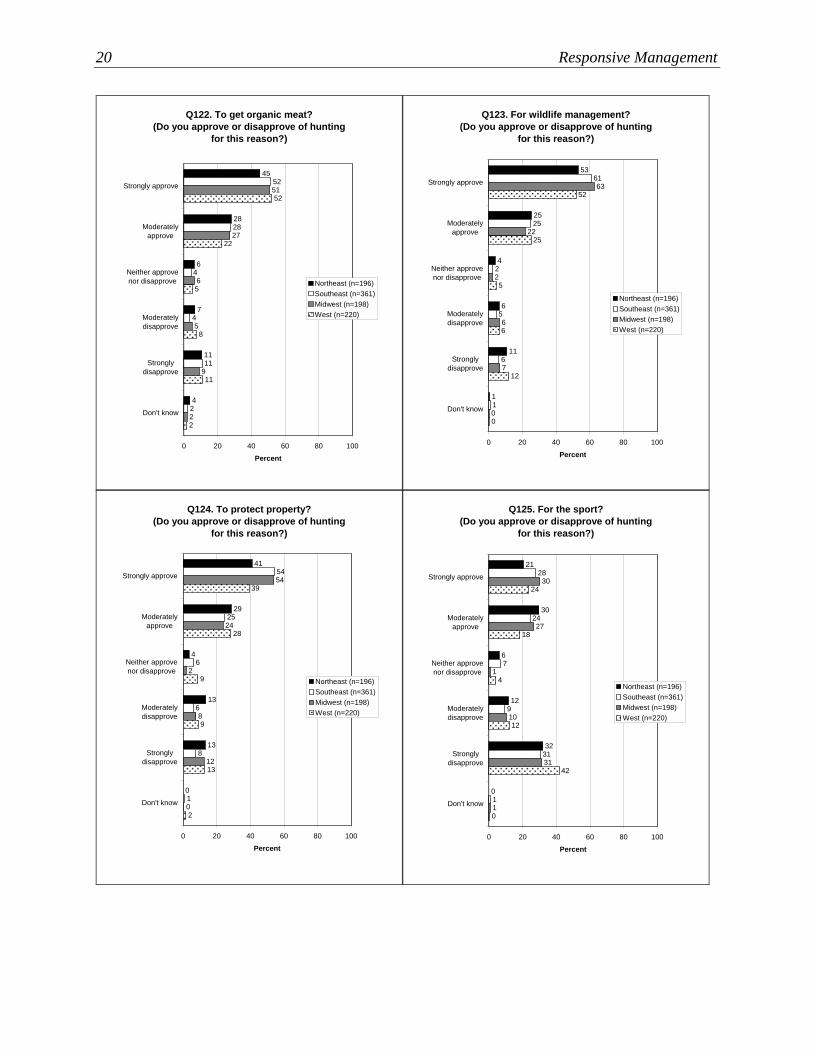
➢ Approval of hunting varies considerably depending on the stated reasons for hunting. When the
reasons are utilitarian in nature—for meat, to protect humans or property, for wildlife
management—approval is very high. In addition, a strong majority of Americans are supportive
of hunting to obtain organic meat or locally sourced food. On the other hand, approval of hunting
drops substantially when the reasons are for the sport, the challenge, or a trophy. The motivations
for hunting asked about in the survey and the percentages who approve of each are listed below,
in descending order of strong approval:
• To protect humans from harm (85% approve; 63% strongly approve)
• For the meat (84% approve; 61% strongly approve)
• For wildlife management (82% approve; 58% strongly approve)
• To get locally sourced food (83% approve; 56% strongly approve)
• To get organic meat (77% approve; 50% strongly approve)
• To protect property (74% approve; 48% strongly approve)
• For the sport (50% approve; 26% strongly approve)
• For the challenge (41% approve; 19% strongly approve)
• For a trophy (29% approve; 9% strongly approve)
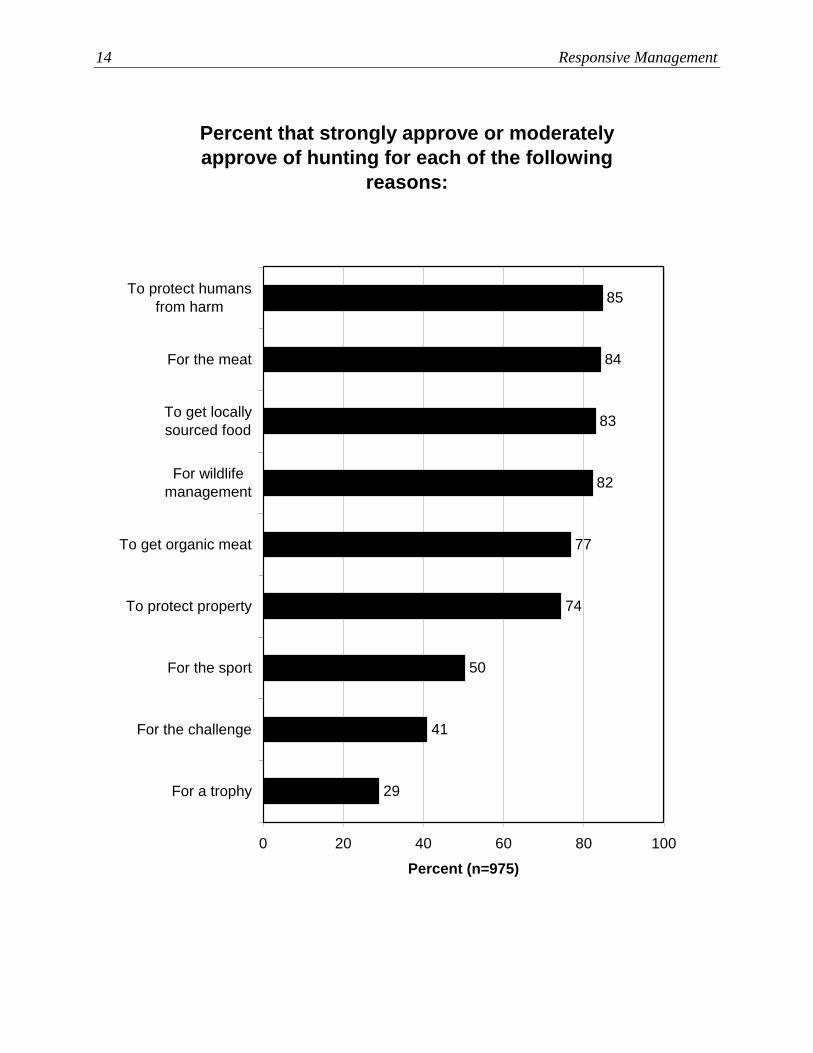
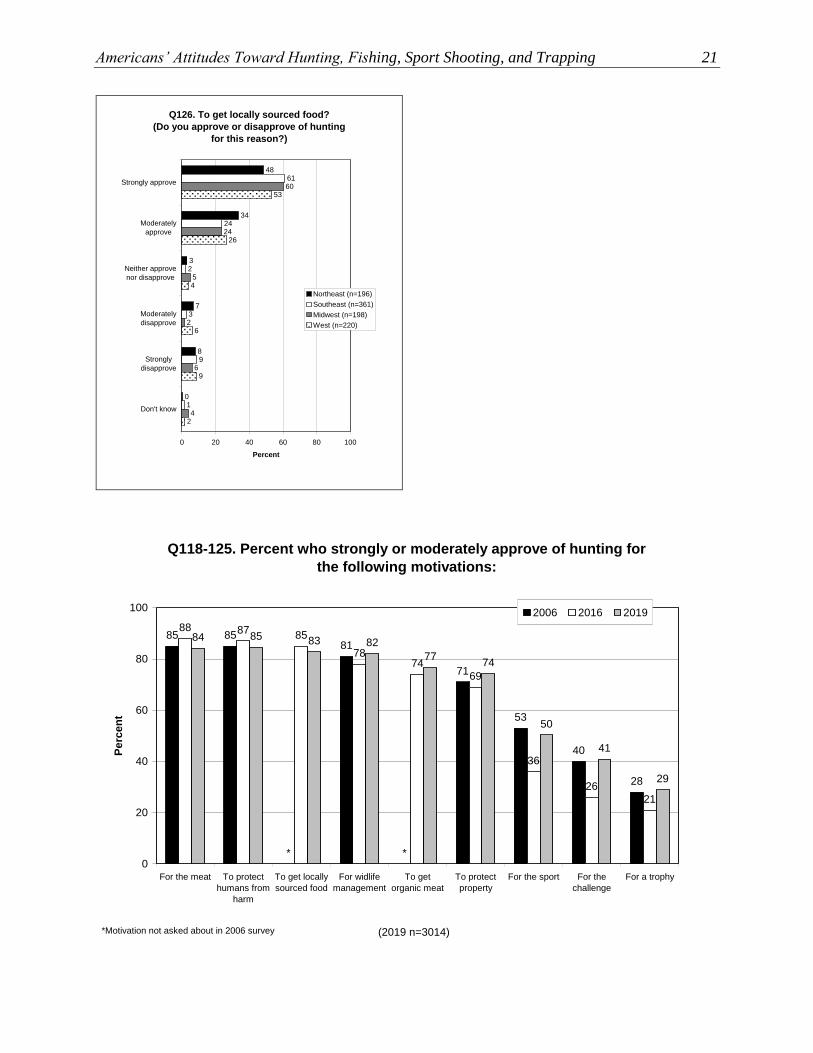
o The nationwide results for this series of motivations are shown together on one graph for
comparison. This is followed by graphs showing the series results within each region, as
well as the regional crosstabulation for each motivation individually.
o The trend graph shows that the percentages who approve of hunting for the sport, for the
challenge, and for a trophy have returned to 2006 levels after showing sharp declines in
2016.
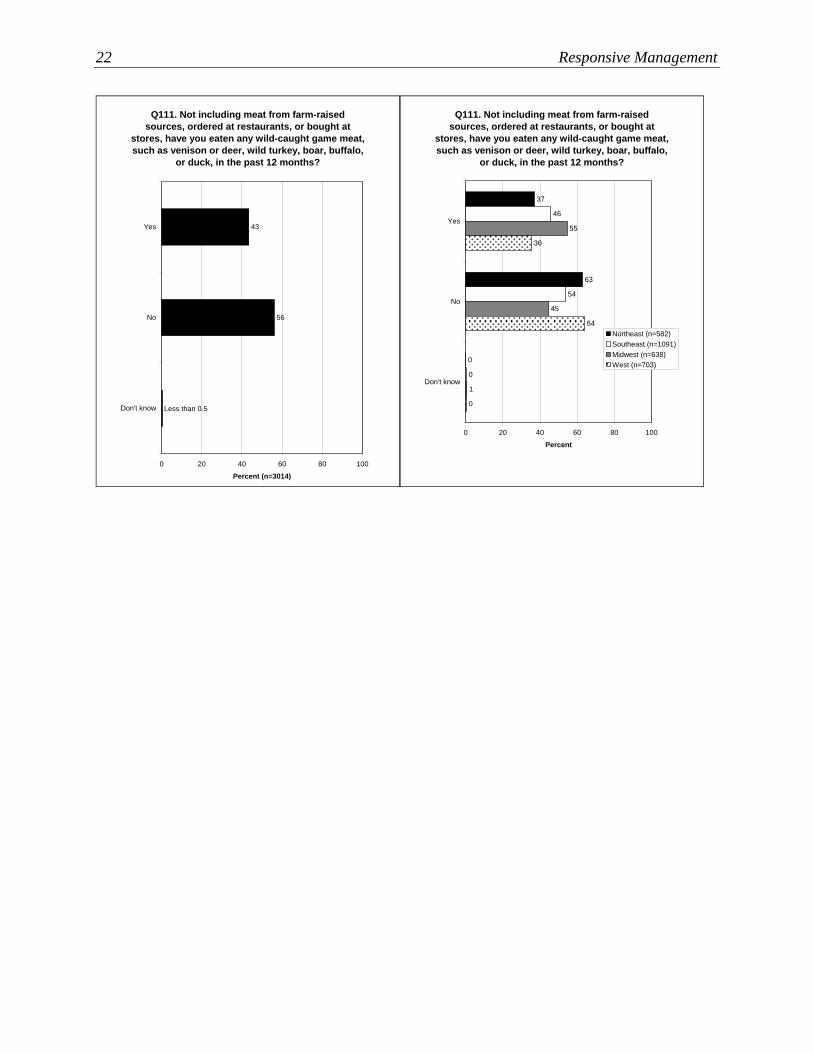
➢ The preceding series showed a high level of approval of hunting for the meat. The survey also
asked respondents if they had eaten wild-caught game meat, such as venison or deer, wild turkey,
boar, buffalo, or duck in the 12 months prior to the survey; less than half of Americans (43%)
had done so.
• Residents of the Midwest are the most likely to have done so: at 55%, the Midwest is the
only region in which a majority of its residents have eaten game meat.
Americans’ Attitudes Toward Hunting, Fishing, Sport Shooting, and Trapping 13
Percent that [approve / disapprove] of hunting for
each of the following reasons:
63
61
58
56
50
48
26
19
9
22
23
25
26
27
26
25
22
20
3
3
3
3
5
5
5
5
4
5
4
6
4
5
9
11
14
15
6
8
9
8
11
11
34
39
51
1
1
1
2
2
1
1
1
2
0 20 40 60 80 100
To protect humans
from harm
For the meat
For wildlife
management
To get locally
sourced food
To get organic meat
To protect property
For the sport
For the challenge
For a trophy
Percent (n=975)
Strongly approve
Moderately approve
Neither approve nor disapprove
Moderately disapprove
Strongly disapprove
Don’t know
14 Responsive Management
Percent that strongly approve or moderately
approve of hunting for each of the following
reasons:
74
77
82
83
84
85
50
41
29
0 20 40 60 80 100
To protect humans
from harm
For the meat
To get locally
sourced food
For wildlife
management
To get organic meat
To protect property
For the sport
For the challenge
For a trophy
Percent (n=975)
Americans’ Attitudes Toward Hunting, Fishing, Sport Shooting, and Trapping 15
Percent that strongly or moderately approve of
hunting for each of the following reasons:
(Northeast Region)
25
38
50
83
82
81
79
73
70
0 20 40 60 80 100
To protect
humans from
harm
To get locally
sourced food
For the meat
For wildlife
management
To get organic
meat
To protect
property
For the sport
For the challenge
For a trophy
Northeast (n=196)
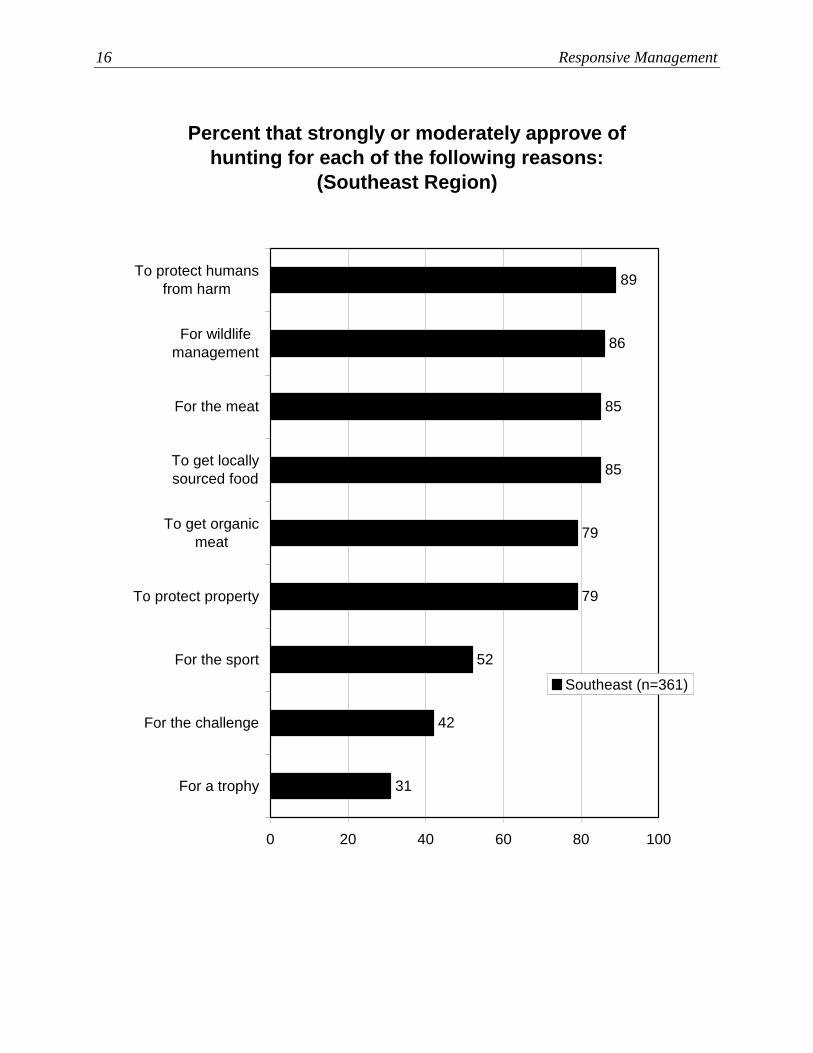
16 Responsive Management
Percent that strongly or moderately approve of
hunting for each of the following reasons:
(Southeast Region)
31
42
52
89
86
85
85
79
79
0 20 40 60 80 100
To protect humans
from harm
For wildlife
management
For the meat
To get locally
sourced food
To get organic
meat
To protect property
For the sport
For the challenge
For a trophy
Southeast (n=361)
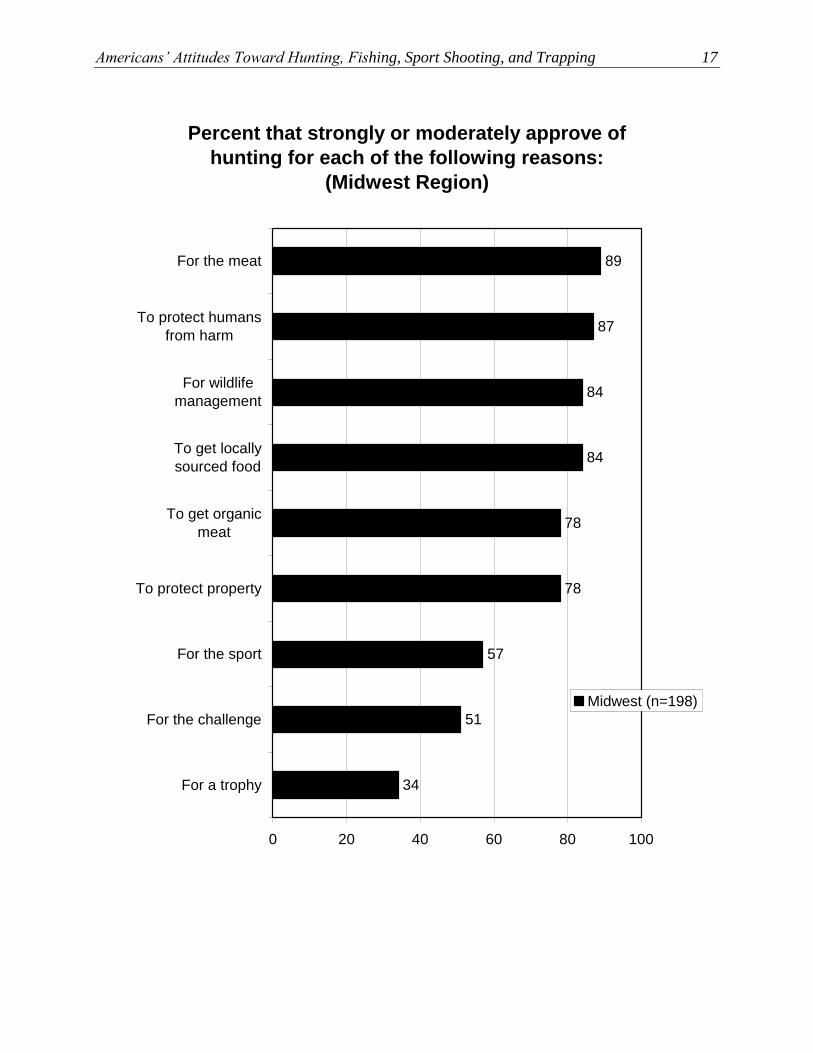
Americans’ Attitudes Toward Hunting, Fishing, Sport Shooting, and Trapping 17
Percent that strongly or moderately approve of
hunting for each of the following reasons:
(Midwest Region)
34
51
57
89
87
84
84
78
78
0 20 40 60 80 100
For the meat
To protect humans
from harm
For wildlife
management
To get locally
sourced food
To get organic
meat
To protect property
For the sport
For the challenge
For a trophy
Midwest (n=198)
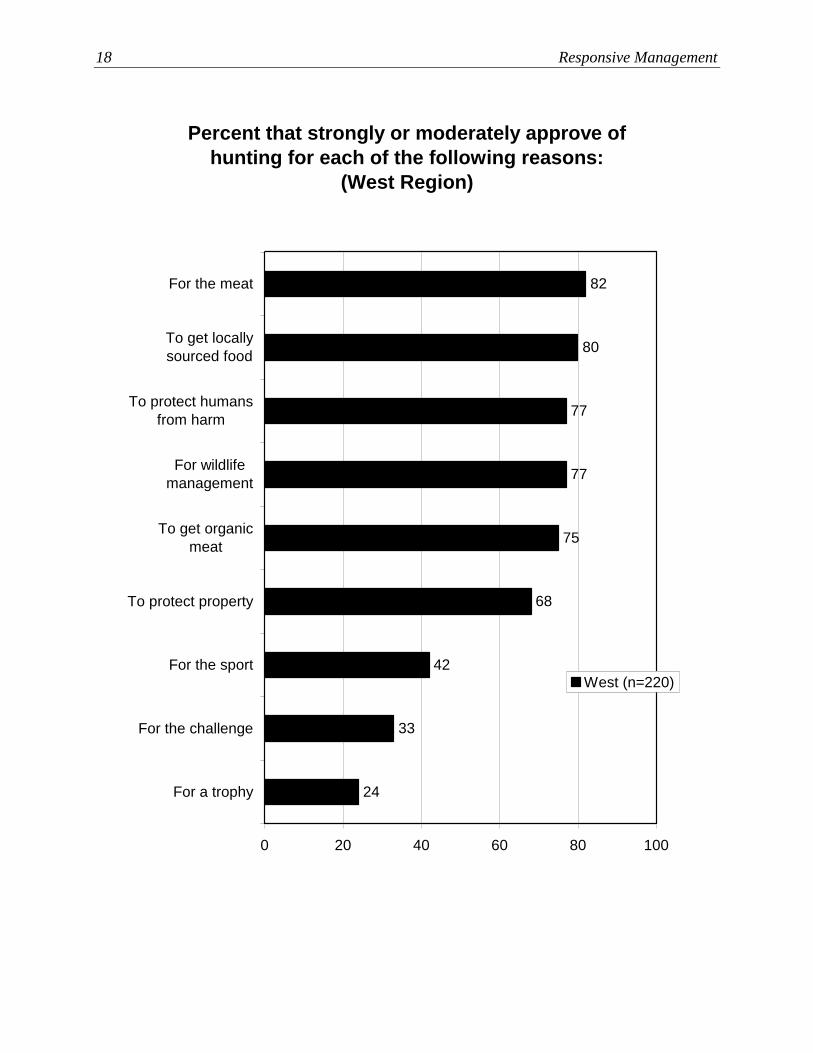
18 Responsive Management
Percent that strongly or moderately approve of
hunting for each of the following reasons:
(West Region)
24
33
42
82
80
77
77
75
68
0 20 40 60 80 100
For the meat
To get locally
sourced food
To protect humans
from harm
For wildlife
management
To get organic
meat
To protect property
For the sport
For the challenge
For a trophy
West (n=220)
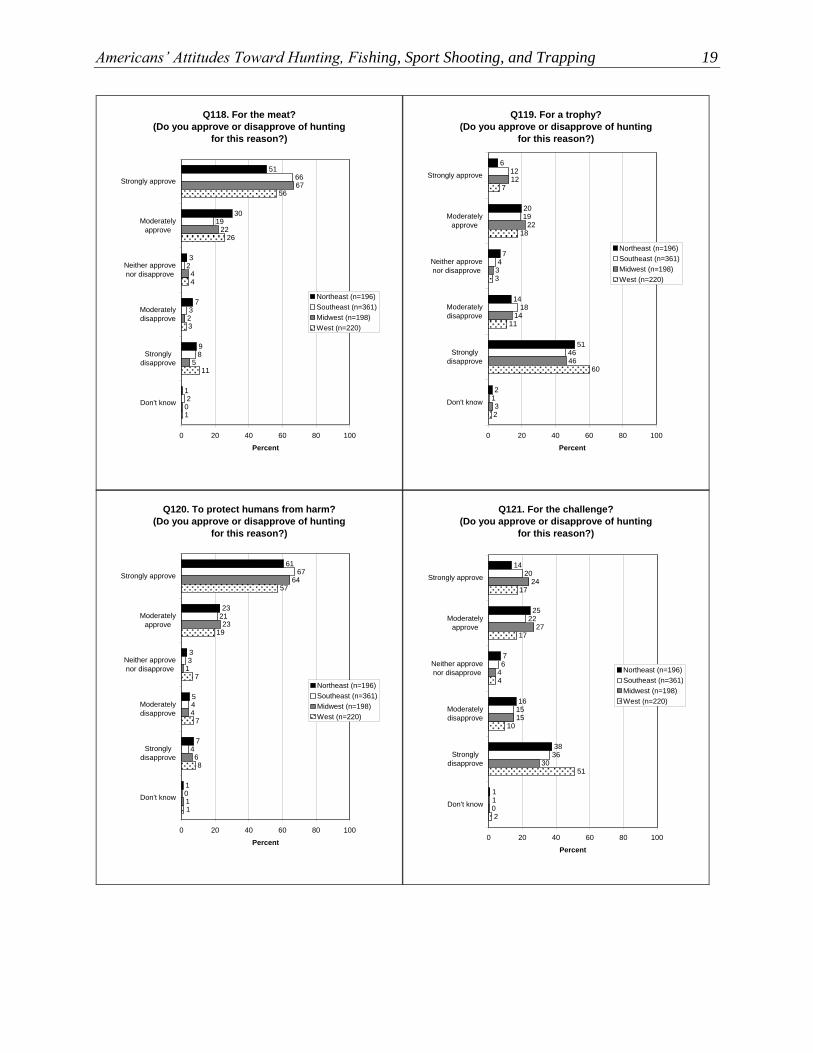
Americans’ Attitudes Toward Hunting, Fishing, Sport Shooting, and Trapping 19
Q118. For the meat?
(Do you approve or disapprove of hunting
for this reason?)
51
30
3
7
9
12
8
3
2
19
66
0
5
2
67
22
4
1
11
3
56
26
4
0 20 40 60 80 100
Strongly approve
Moderately
approve
Neither approve
nor disapprove
Moderately
disapprove
Strongly
disapprove
Don't know
Percent
Northeast (n=196)
Southeast (n=361)
Midwest (n=198)
West (n=220)
Q119. For a trophy?
(Do you approve or disapprove of hunting
for this reason?)
6
20
7
14
51
21
46
18
4
19
12
3
46
14
12
22
3
2
60
11
7
18
3
0 20 40 60 80 100
Strongly approve
Moderately
approve
Neither approve
nor disapprove
Moderately
disapprove
Strongly
disapprove
Don't know
Percent
Northeast (n=196)
Southeast (n=361)
Midwest (n=198)
West (n=220)
Q120. To protect humans from harm?
(Do you approve or disapprove of hunting
for this reason?)
61
23
3
5
7
10
4
4
3
21
67
1
6
4
64
23
1
1
8
7
57
19
7
0 20 40 60 80 100
Strongly approve
Moderately
approve
Neither approve
nor disapprove
Moderately
disapprove
Strongly
disapprove
Don't know
Percent
Northeast (n=196)
Southeast (n=361)
Midwest (n=198)
West (n=220)
Q121. For the challenge?
(Do you approve or disapprove of hunting
for this reason?)
14
25
7
16
38
11
36
15
6
22
20
0
30
15
24
27
4
2
51
10
17
17
4
0 20 40 60 80 100
Strongly approve
Moderately
approve
Neither approve
nor disapprove
Moderately
disapprove
Strongly
disapprove
Don't know
Percent
Northeast (n=196)
Southeast (n=361)
Midwest (n=198)
West (n=220)
20 Responsive Management
Q122. To get organic meat?
(Do you approve or disapprove of hunting
for this reason?)
45
28
6
7
11
42
11
4
4
28
52
2
9
5
51
27
6
2
11
8
52
22
5
0 20 40 60 80 100
Strongly approve
Moderately
approve
Neither approve
nor disapprove
Moderately
disapprove
Strongly
disapprove
Don't know
Percent
Northeast (n=196)
Southeast (n=361)
Midwest (n=198)
West (n=220)
Q123. For wildlife management?
(Do you approve or disapprove of hunting
for this reason?)
53
25
4
6
11
11
6
5
2
25
61
0
7
6
63
22
2
0
12
6
52
25
5
0 20 40 60 80 100
Strongly approve
Moderately
approve
Neither approve
nor disapprove
Moderately
disapprove
Strongly
disapprove
Don't know
Percent
Northeast (n=196)
Southeast (n=361)
Midwest (n=198)
West (n=220)
Q124. To protect property?
(Do you approve or disapprove of hunting
for this reason?)
41
29
4
13
13
01
8
6
6
25
54
0
12
8
54
24
2
2
13
9
39
28
9
0 20 40 60 80 100
Strongly approve
Moderately
approve
Neither approve
nor disapprove
Moderately
disapprove
Strongly
disapprove
Don't know
Percent
Northeast (n=196)
Southeast (n=361)
Midwest (n=198)
West (n=220)
Q125. For the sport?
(Do you approve or disapprove of hunting
for this reason?)
21
30
6
12
32
01
31
9
7
24
28
1
31
10
30
27
1
0
42
12
24
18
4
0 20 40 60 80 100
Strongly approve
Moderately
approve
Neither approve
nor disapprove
Moderately
disapprove
Strongly
disapprove
Don't know
Percent
Northeast (n=196)
Southeast (n=361)
Midwest (n=198)
West (n=220)
Americans’ Attitudes Toward Hunting, Fishing, Sport Shooting, and Trapping 21
Q126. To get locally sourced food?
(Do you approve or disapprove of hunting
for this reason?)
48
34
3
7
8
01
9
3
2
24
61
4
6
2
60
24
5
2
9
6
53
26
4
0 20 40 60 80 100
Strongly approve
Moderately
approve
Neither approve
nor disapprove
Moderately
disapprove
Strongly
disapprove
Don't know
Percent
Northeast (n=196)
Southeast (n=361)
Midwest (n=198)
West (n=220)
Q118-125. Percent who strongly or moderately approve of hunting for
the following motivations:
7469
36
26
21
7774
50
41
29
71
*
81
*
8585
53
40
28
78
88 8785
83858482
0
20
40
60
80
100
For the meat To protect
humans from
harm
To get locally
sourced food
For widlife
management
To get
organic meat
To protect
property
For the sport For the
challenge
For a trophy
Pe
rce
nt
2006 2016 2019
(2019 n=3014)*Motivation not asked about in 2006 survey
22 Responsive Management
Q111. Not including meat from farm-raised
sources, ordered at restaurants, or bought at
stores, have you eaten any wild-caught game meat,
such as venison or deer, wild turkey, boar, buffalo,
or duck, in the past 12 months?
43
56
Less than 0.5
0 20 40 60 80 100
Yes
No
Don't know
Percent (n=3014)
Q111. Not including meat from farm-raised
sources, ordered at restaurants, or bought at
stores, have you eaten any wild-caught game meat,
such as venison or deer, wild turkey, boar, buffalo,
or duck, in the past 12 months?
37
63
0
0
54
46
55
45
1
36
64
0
0 20 40 60 80 100
Yes
No
Don't know
Percent
Northeast (n=582)
Southeast (n=1091)
Midwest (n=638)
West (n=703)
Americans’ Attitudes Toward Hunting, Fishing, Sport Shooting, and Trapping 23
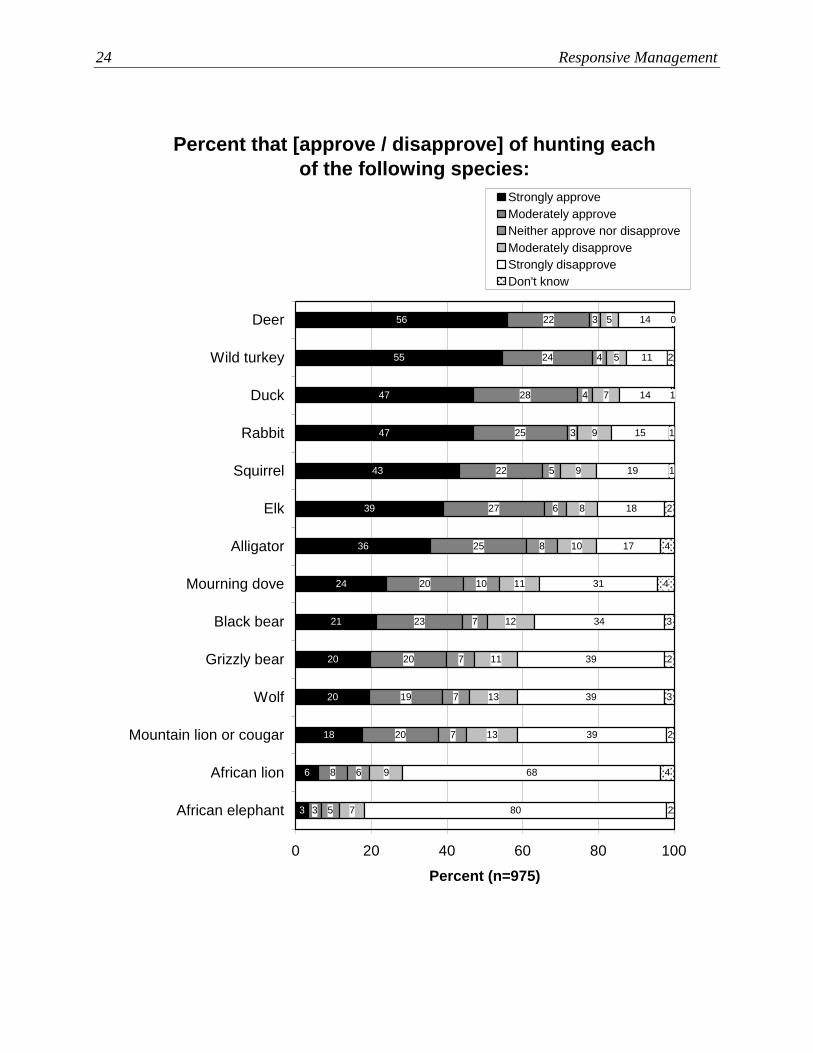
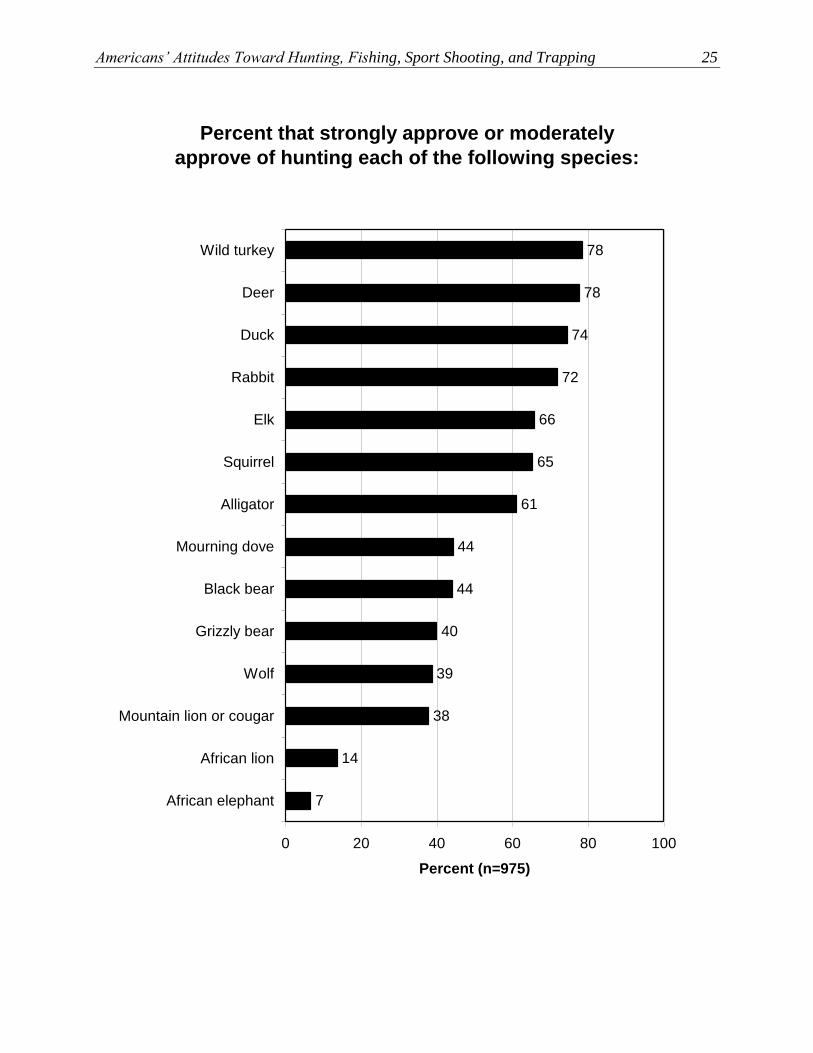
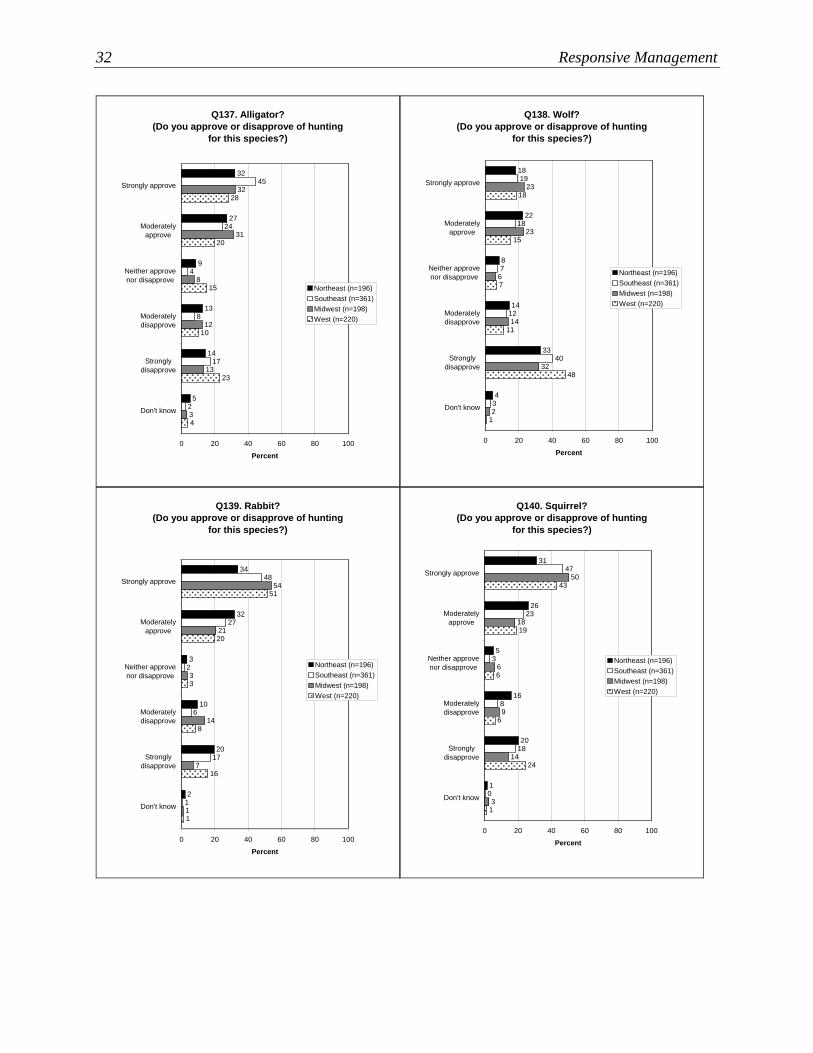
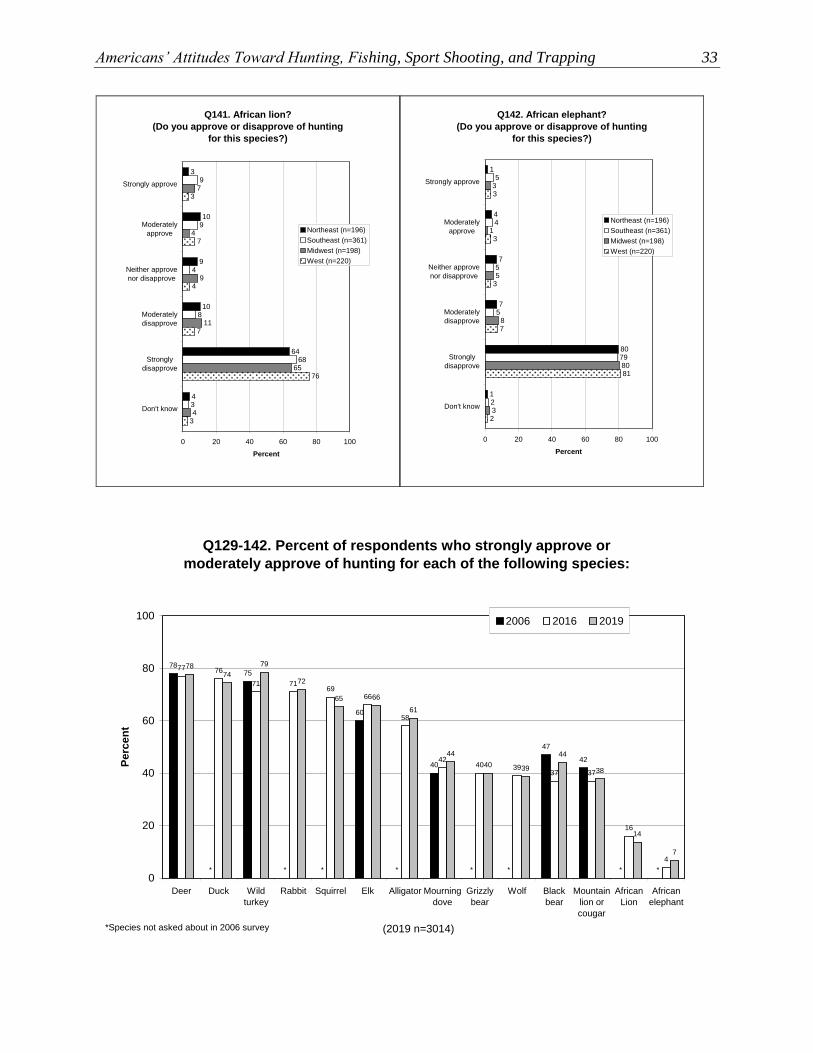
ATTITUDES TOWARD HUNTING DIFFERENT SPECIES
➢ Attitudes toward hunting vary according to the species being hunted. This study, consistent with
others, shows that hunting of ungulates, such as deer and elk, or waterfowl is more acceptable
than is hunting of predators, such as bear, mountain lions, or wolves. Meanwhile, less than a fifth
of Americans approve of hunting for exotic species such as African lions and elephants. The
species asked about in the survey and the percentages who approve of hunting each are listed
below, in descending order of strong approval:
• Deer (78% approve; 56% strongly approve)
• Wild turkey (78% approve; 55% strongly approve)
• Duck (74% approve; 47% strongly approve)
• Rabbit (72% approve; 47% strongly approve)
• Squirrel (65% approve; 43% strongly approve)
• Elk (66% approve; 39% strongly approve)
• Alligator (61% approve; 36% strongly approve)
• Mourning dove (44% approve; 24% strongly approve)
• Black bear (44% approve; 21% strongly approve)
• Grizzly bear (40% approve; 20% strongly approve)
• Wolf (39% approve; 20% strongly approve)
• Mountain lion or cougar (38% approve; 18% strongly approve)
• African lion (14% approve; 6% strongly approve)
• African elephant (7% approve; 3% strongly approve)
o The nationwide results for this series of species are shown together on one graph,
followed by graphs showing the series results within each region and the regional
crosstabulation for each species individually.
o The trend graph shows that approval of hunting black bear and wild turkey has increased
since 2016.
o It is interesting to note that there is no species for which hunting approval is as high as it
is for hunting in general. This suggests that, for some, it is easier to approve of hunting in
general when specific animals are not being considered.
24 Responsive Management
Percent that [approve / disapprove] of hunting each
of the following species:
56
55
47
47
43
39
36
24
21
20
20
18
6
3
22
24
28
25
22
27
25
20
23
20
19
20
8
3
3
4
4
3
5
6
8
10
7
7
7
7
6
5
5
5
7
9
9
8
10
11
12
11
13
13
9
7
14
11
14
15
19
18
17
31
34
39
39
39
68
80
0
2
1
1
1
2
4
4
3
2
3
2
4
2
0 20 40 60 80 100
Deer
Wild turkey
Duck
Rabbit
Squirrel
Elk
Alligator
Mourning dove
Black bear
Grizzly bear
Wolf
Mountain lion or cougar
African lion
African elephant
Percent (n=975)
Strongly approve
Moderately approve
Neither approve nor disapprove
Moderately disapprove
Strongly disapprove
Don't know
Americans’ Attitudes Toward Hunting, Fishing, Sport Shooting, and Trapping 25
Percent that strongly approve or moderately
approve of hunting each of the following species:
7
14
38
39
40
65
66
72
74
78
78
61
44
44
0 20 40 60 80 100
Wild turkey
Deer
Duck
Rabbit
Elk
Squirrel
Alligator
Mourning dove
Black bear
Grizzly bear
Wolf
Mountain lion or cougar
African lion
African elephant
Percent (n=975)
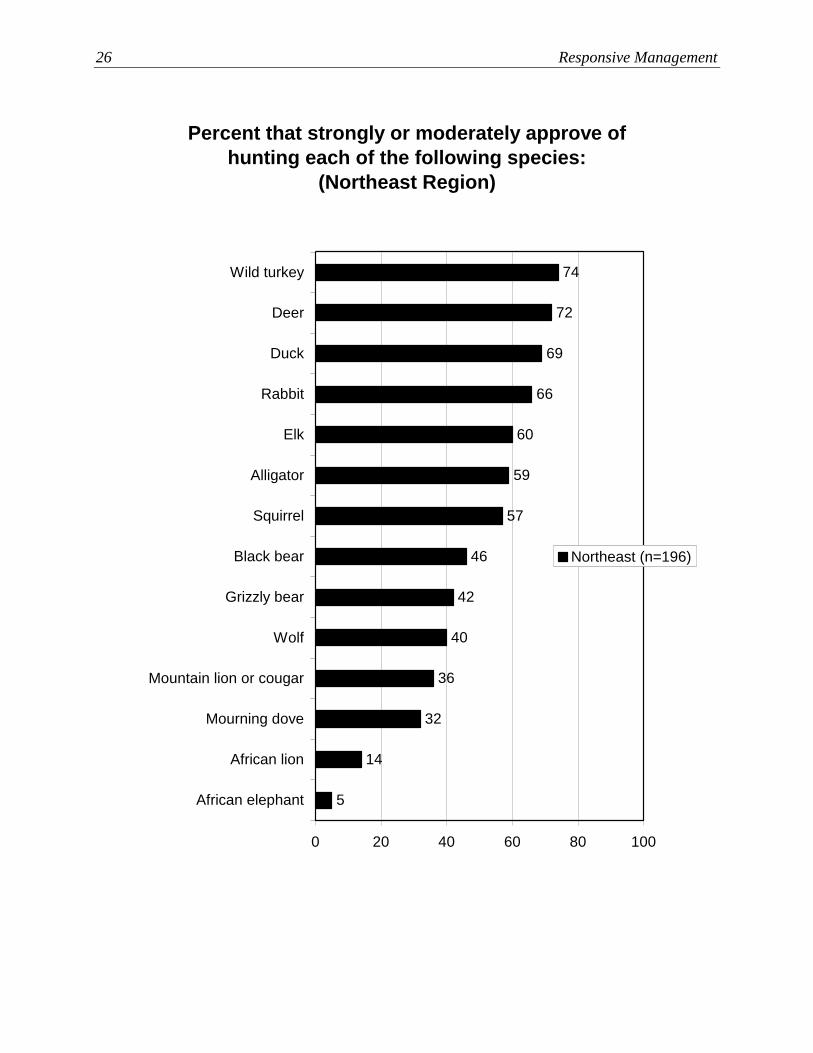
26 Responsive Management
Percent that strongly or moderately approve of
hunting each of the following species:
(Northeast Region)
42
46
57
74
72
69
66
60
59
40
36
32
14
5
0 20 40 60 80 100
Wild turkey
Deer
Duck
Rabbit
Elk
Alligator
Squirrel
Black bear
Grizzly bear
Wolf
Mountain lion or cougar
Mourning dove
African lion
African elephant
Northeast (n=196)
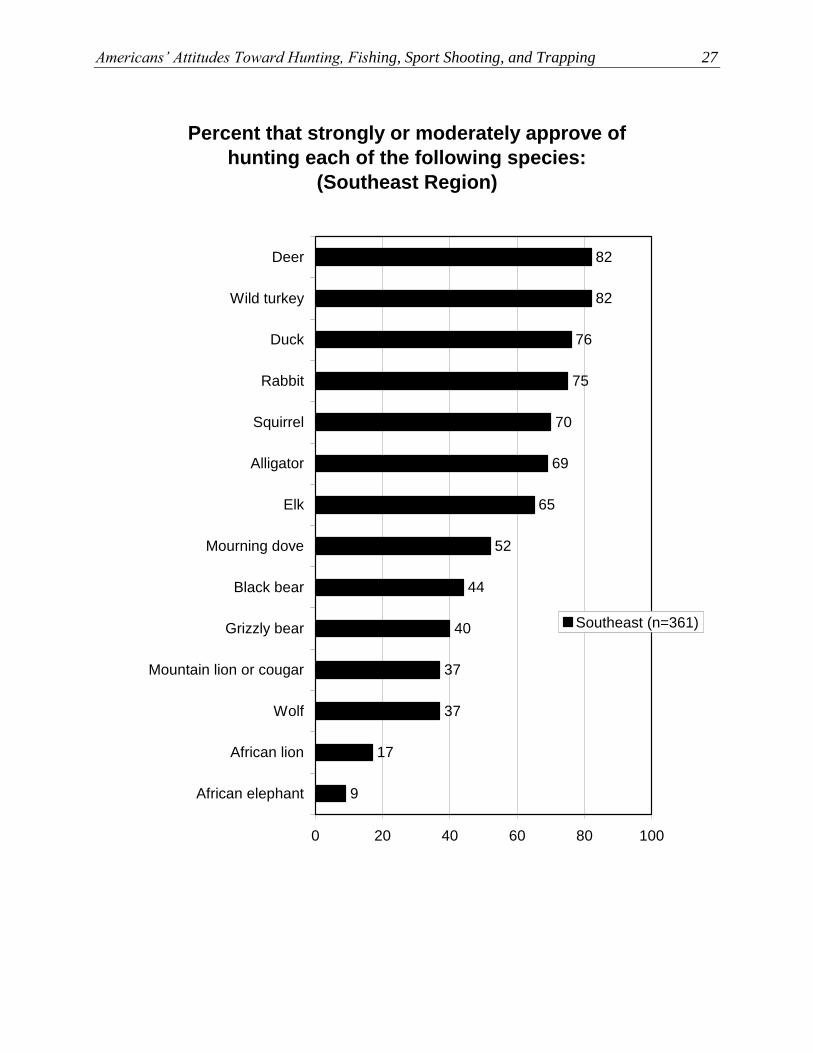
Americans’ Attitudes Toward Hunting, Fishing, Sport Shooting, and Trapping 27
Percent that strongly or moderately approve of
hunting each of the following species:
(Southeast Region)
44
52
65
82
82
76
75
70
69
40
37
37
17
9
0 20 40 60 80 100
Deer
Wild turkey
Duck
Rabbit
Squirrel
Alligator
Elk
Mourning dove
Black bear
Grizzly bear
Mountain lion or cougar
Wolf
African lion
African elephant
Southeast (n=361)
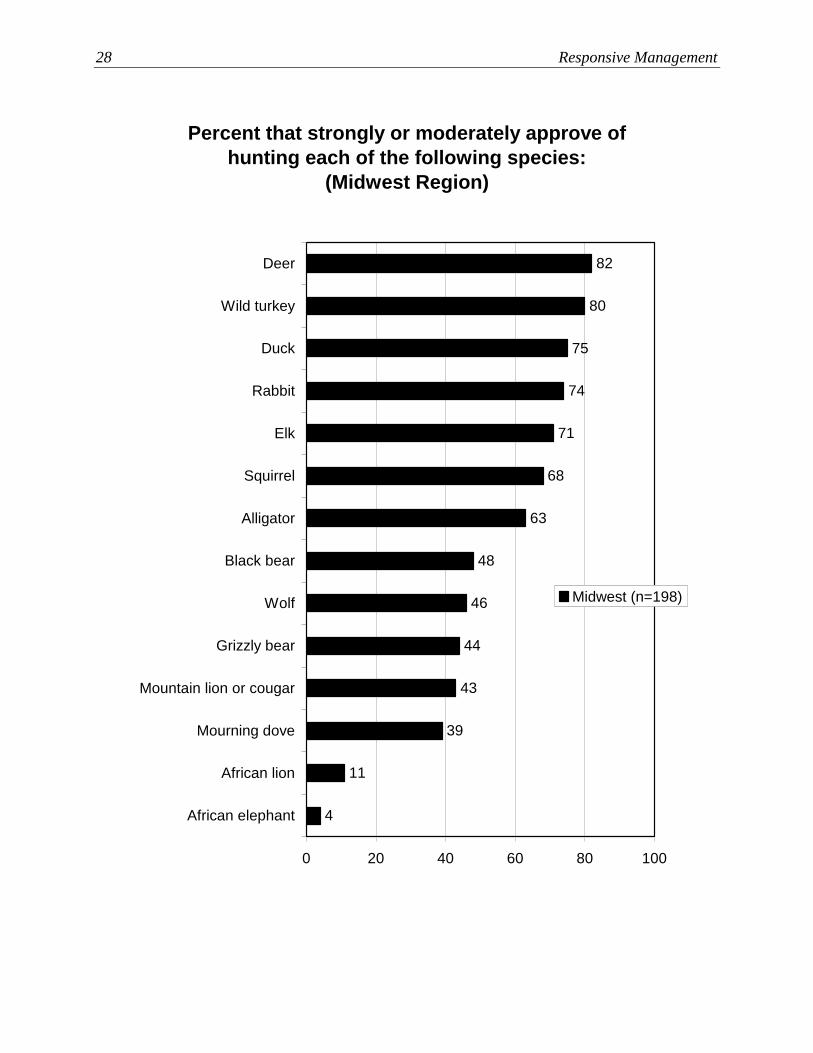
28 Responsive Management
Percent that strongly or moderately approve of
hunting each of the following species:
(Midwest Region)
46
48
63
82
80
75
74
71
68
44
43
39
11
4
0 20 40 60 80 100
Deer
Wild turkey
Duck
Rabbit
Elk
Squirrel
Alligator
Black bear
Wolf
Grizzly bear
Mountain lion or cougar
Mourning dove
African lion
African elephant
Midwest (n=198)
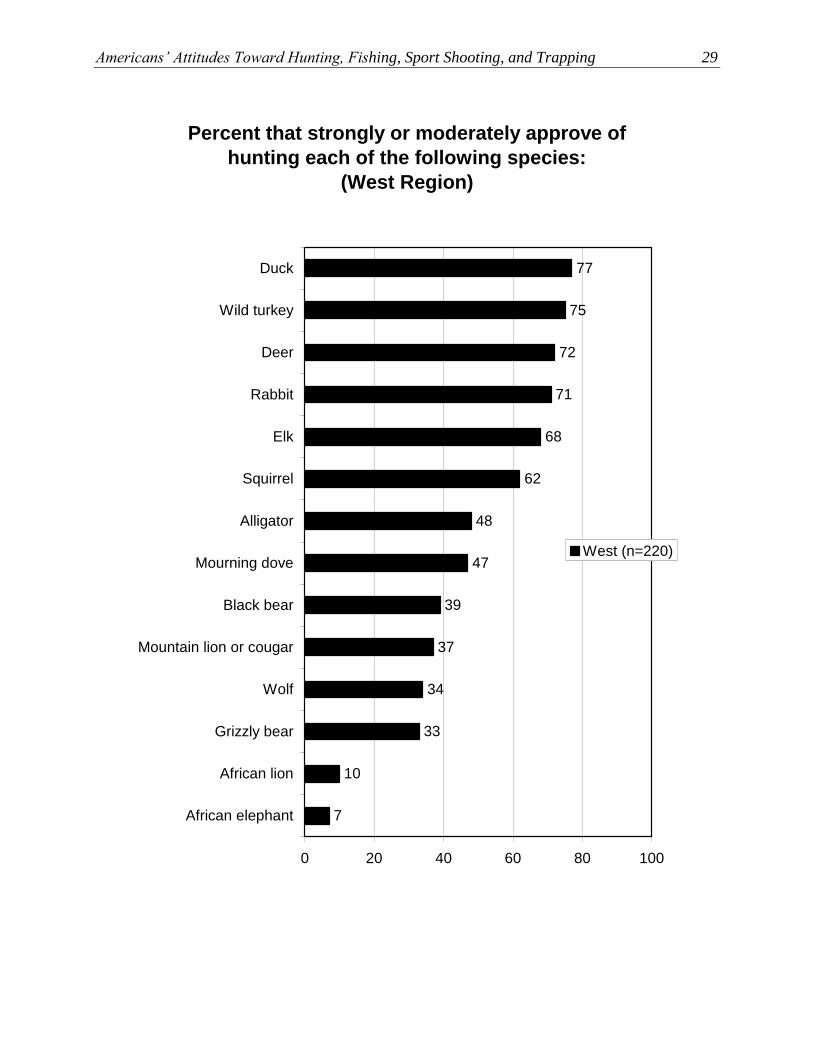
Americans’ Attitudes Toward Hunting, Fishing, Sport Shooting, and Trapping 29
Percent that strongly or moderately approve of
hunting each of the following species:
(West Region)
39
47
48
77
75
72
71
68
62
37
34
33
10
7
0 20 40 60 80 100
Duck
Wild turkey
Deer
Rabbit
Elk
Squirrel
Alligator
Mourning dove
Black bear
Mountain lion or cougar
Wolf
Grizzly bear
African lion
African elephant
West (n=220)
30 Responsive Management
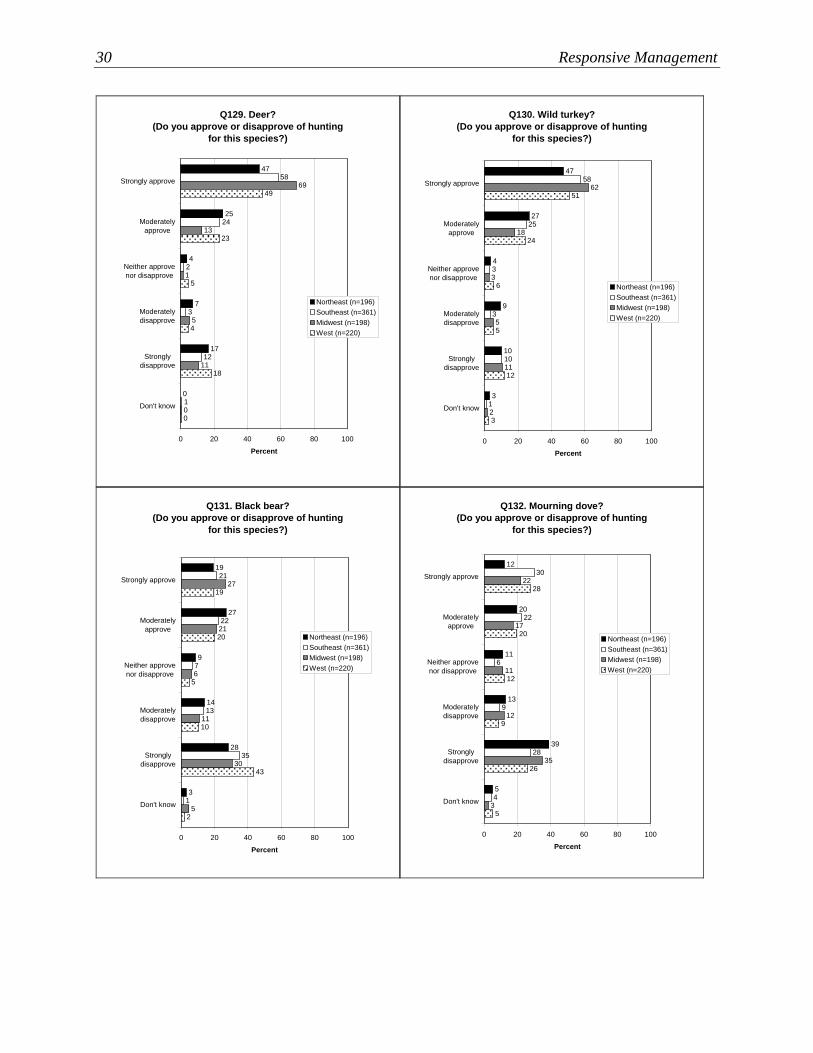
Q129. Deer?
(Do you approve or disapprove of hunting
for this species?)
47
25
4
7
17
01
12
3
2
24
58
0
11
5
69
13
1
0
18
4
49
23
5
0 20 40 60 80 100
Strongly approve
Moderately
approve
Neither approve
nor disapprove
Moderately
disapprove
Strongly
disapprove
Don't know
Percent
Northeast (n=196)
Southeast (n=361)
Midwest (n=198)
West (n=220)
Q130. Wild turkey?
(Do you approve or disapprove of hunting
for this species?)
47
27
4
9
10
31
10
3
3
25
58
2
11
5
62
18
3
3
12
5
51
24
6
0 20 40 60 80 100
Strongly approve
Moderately
approve
Neither approve
nor disapprove
Moderately
disapprove
Strongly
disapprove
Don't know
Percent
Northeast (n=196)
Southeast (n=361)
Midwest (n=198)
West (n=220)
Q131. Black bear?
(Do you approve or disapprove of hunting
for this species?)
19
27
9
14
28
31
35
13
7
22
21
5
30
11
27
21
6
2
43
10
19
20
5
0 20 40 60 80 100
Strongly approve
Moderately
approve
Neither approve
nor disapprove
Moderately
disapprove
Strongly
disapprove
Don't know
Percent
Northeast (n=196)
Southeast (n=361)
Midwest (n=198)
West (n=220)
Q132. Mourning dove?
(Do you approve or disapprove of hunting
for this species?)
12
20
11
13
39
54
28
9
6
22
30
3
35
12
22
17
11
5
26
9
28
20
12
0 20 40 60 80 100
Strongly approve
Moderately
approve
Neither approve
nor disapprove
Moderately
disapprove
Strongly
disapprove
Don't know
Percent
Northeast (n=196)
Southeast (n=361)
Midwest (n=198)
West (n=220)
Americans’ Attitudes Toward Hunting, Fishing, Sport Shooting, and Trapping 31
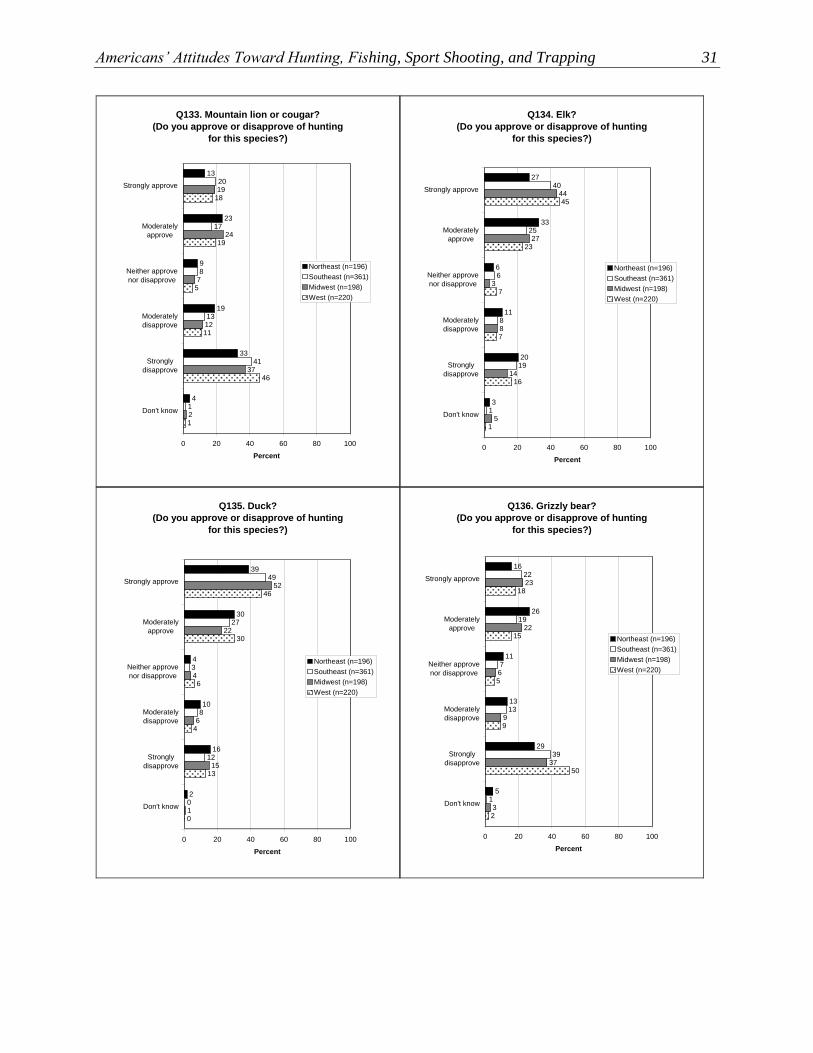
Q133. Mountain lion or cougar?
(Do you approve or disapprove of hunting
for this species?)
13
23
9
19
33
41
41
13
8
17
20
2
37
12
19
24
7
1
46
11
18
19
5
0 20 40 60 80 100
Strongly approve
Moderately
approve
Neither approve
nor disapprove
Moderately
disapprove
Strongly
disapprove
Don't know
Percent
Northeast (n=196)
Southeast (n=361)
Midwest (n=198)
West (n=220)
Q134. Elk?
(Do you approve or disapprove of hunting
for this species?)
27
33
6
11
20
31
19
8
6
25
40
5
14
8
44
27
3
1
16
7
45
23
7
0 20 40 60 80 100
Strongly approve
Moderately
approve
Neither approve
nor disapprove
Moderately
disapprove
Strongly
disapprove
Don't know
Percent
Northeast (n=196)
Southeast (n=361)
Midwest (n=198)
West (n=220)
Q135. Duck?
(Do you approve or disapprove of hunting
for this species?)
39
30
4
10
16
20
12
8
3
27
49
1
15
6
52
22
4
0
13
4
46
30
6
0 20 40 60 80 100
Strongly approve
Moderately
approve
Neither approve
nor disapprove
Moderately
disapprove
Strongly
disapprove
Don't know
Percent
Northeast (n=196)
Southeast (n=361)
Midwest (n=198)
West (n=220)
Q136. Grizzly bear?
(Do you approve or disapprove of hunting
for this species?)
16
26
11
13
29
51
39
13
7
19
22
3
37
9
23
22
6
2
50
9
18
15
5
0 20 40 60 80 100
Strongly approve
Moderately
approve
Neither approve
nor disapprove
Moderately
disapprove
Strongly
disapprove
Don't know
Percent
Northeast (n=196)
Southeast (n=361)
Midwest (n=198)
West (n=220)
32 Responsive Management
Q137. Alligator?
(Do you approve or disapprove of hunting
for this species?)
32
27
9
13
14
52
17
8
4
24
45
3
13
12
32
31
8
4
23
10
28
20
15
0 20 40 60 80 100
Strongly approve
Moderately
approve
Neither approve
nor disapprove
Moderately
disapprove
Strongly
disapprove
Don't know
Percent
Northeast (n=196)
Southeast (n=361)
Midwest (n=198)
West (n=220)
Q138. Wolf?
(Do you approve or disapprove of hunting
for this species?)
18
22
8
14
33
43
40
12
7
18
19
2
32
14
23
23
6
1
48
11
18
15
7
0 20 40 60 80 100
Strongly approve
Moderately
approve
Neither approve
nor disapprove
Moderately
disapprove
Strongly
disapprove
Don't know
Percent
Northeast (n=196)
Southeast (n=361)
Midwest (n=198)
West (n=220)
Q139. Rabbit?
(Do you approve or disapprove of hunting
for this species?)
34
32
3
10
20
21
17
6
2
27
48
1
7
14
54
21
3
1
16
8
51
20
3
0 20 40 60 80 100
Strongly approve
Moderately
approve
Neither approve
nor disapprove
Moderately
disapprove
Strongly
disapprove
Don't know
Percent
Northeast (n=196)
Southeast (n=361)
Midwest (n=198)
West (n=220)
Q140. Squirrel?
(Do you approve or disapprove of hunting
for this species?)
31
26
5
16
20
10
18
8
3
23
47
3
14
9
50
18
6
1
24
6
43
19
6
0 20 40 60 80 100
Strongly approve
Moderately
approve
Neither approve
nor disapprove
Moderately
disapprove
Strongly
disapprove
Don't know
Percent
Northeast (n=196)
Southeast (n=361)
Midwest (n=198)
West (n=220)
Americans’ Attitudes Toward Hunting, Fishing, Sport Shooting, and Trapping 33
Q141. African lion?
(Do you approve or disapprove of hunting
for this species?)
3
10
9
10
64
43
68
8
4
9
9
4
65
11
7
4
9
3
76
7
3
7
4
0 20 40 60 80 100
Strongly approve
Moderately
approve
Neither approve
nor disapprove
Moderately
disapprove
Strongly
disapprove
Don't know
Percent
Northeast (n=196)
Southeast (n=361)
Midwest (n=198)
West (n=220)
Q142. African elephant?
(Do you approve or disapprove of hunting
for this species?)
1
4
7
7
80
12
79
5
5
4
5
3
80
8
3
1
5
2
81
7
3
3
3
0 20 40 60 80 100
Strongly approve
Moderately
approve
Neither approve
nor disapprove
Moderately
disapprove
Strongly
disapprove
Don't know
Percent
Northeast (n=196)
Southeast (n=361)
Midwest (n=198)
West (n=220)
Q129-142. Percent of respondents who strongly approve or
moderately approve of hunting for each of the following species:
6966
58
4240 39
37 37
16
4
78
74
79
72
65 66
61
44
4039
44
38
14
7
**
42
47
*
60
**
75
*
78
*
40
*
71
77 76
71
0
20
40
60
80
100
Deer Duck Wild
turkey
Rabbit Squirrel Elk Alligator Mourning
dove
Grizzly
bear
Wolf Black
bear
Mountain
lion or
cougar
African
Lion
African
elephant
Pe
rce
nt
2006 2016 2019
(2019 n=3014)*Species not asked about in 2006 survey
34 Responsive Management
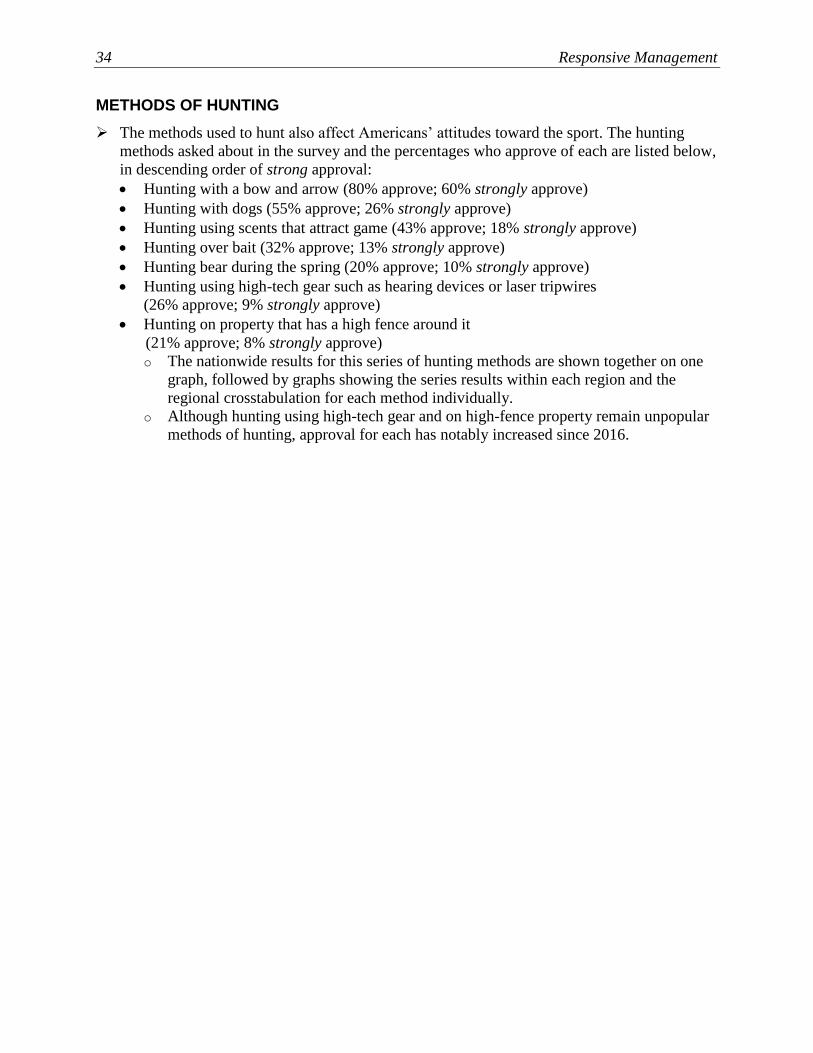
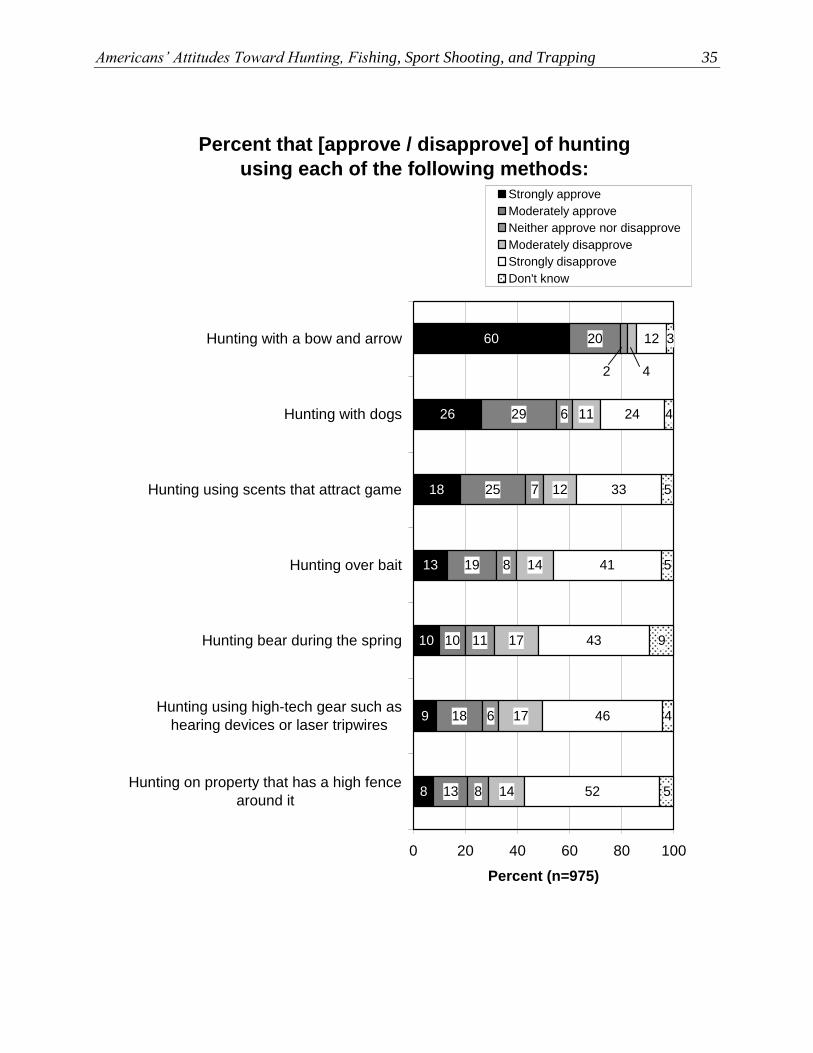
METHODS OF HUNTING
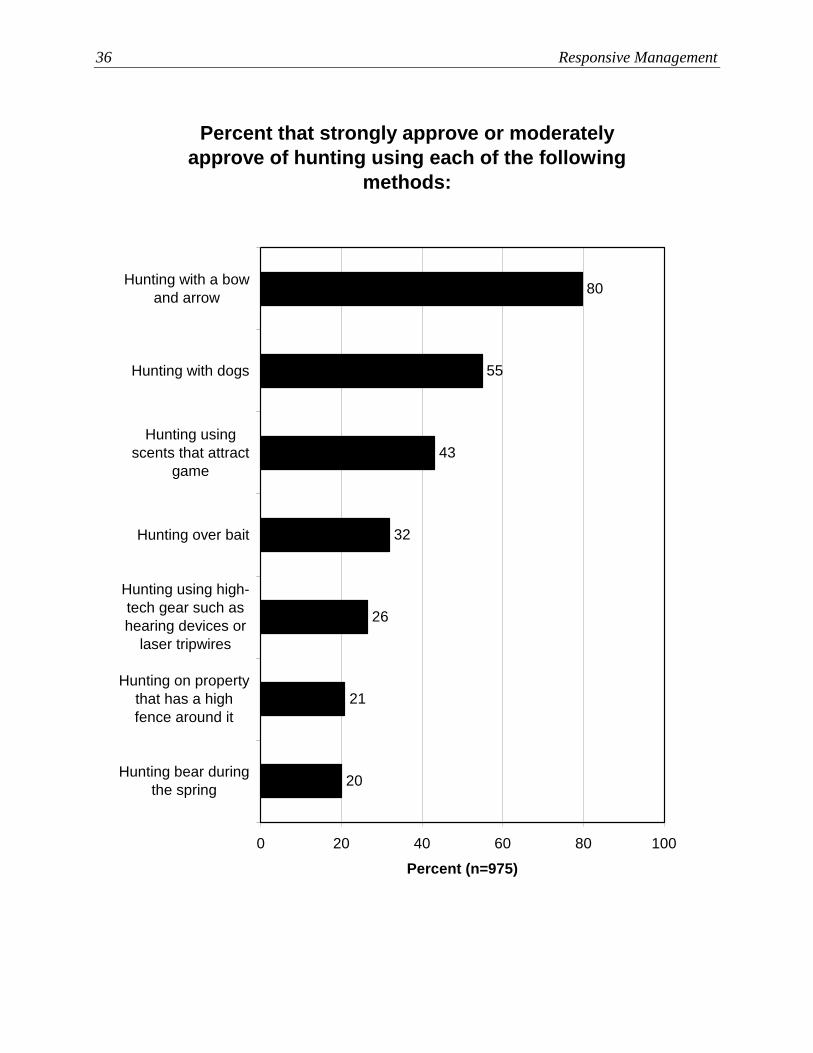
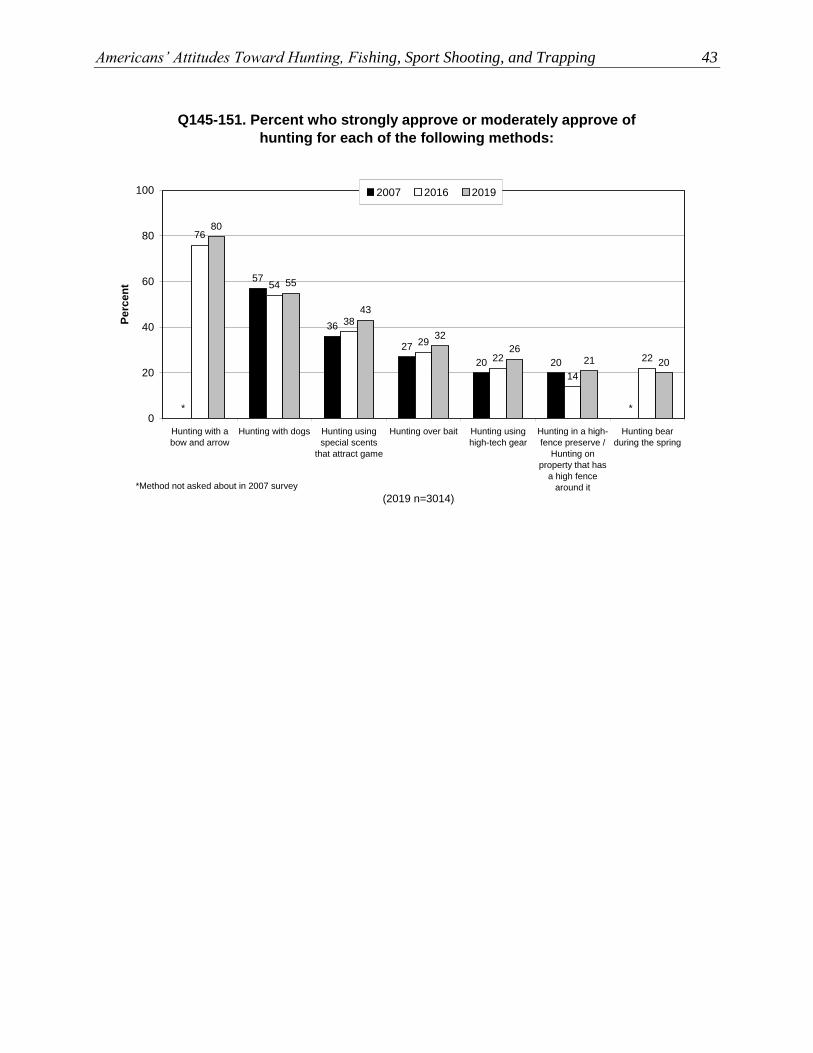
➢ The methods used to hunt also affect Americans’ attitudes toward the sport. The hunting
methods asked about in the survey and the percentages who approve of each are listed below,
in descending order of strong approval:
• Hunting with a bow and arrow (80% approve; 60% strongly approve)
• Hunting with dogs (55% approve; 26% strongly approve)
• Hunting using scents that attract game (43% approve; 18% strongly approve)
• Hunting over bait (32% approve; 13% strongly approve)
• Hunting bear during the spring (20% approve; 10% strongly approve)
• Hunting using high-tech gear such as hearing devices or laser tripwires
(26% approve; 9% strongly approve)
• Hunting on property that has a high fence around it
(21% approve; 8% strongly approve)
o The nationwide results for this series of hunting methods are shown together on one
graph, followed by graphs showing the series results within each region and the
regional crosstabulation for each method individually.
o Although hunting using high-tech gear and on high-fence property remain unpopular
methods of hunting, approval for each has notably increased since 2016.
Americans’ Attitudes Toward Hunting, Fishing, Sport Shooting, and Trapping 35
Percent that [approve / disapprove] of hunting
using each of the following methods:
60
26
18
13
10
9
8
6
7
8
11
6
8
11
12
14
17
17
14
12
24
33
41
43
46
52
3
4
5
5
9
4
513
18
10
19
25
29
20
2 4
0 20 40 60 80 100
Hunting with a bow and arrow
Hunting with dogs
Hunting using scents that attract game
Hunting over bait
Hunting bear during the spring
Hunting using high-tech gear such as
hearing devices or laser tripwires
Hunting on property that has a high fence
around it
Percent (n=975)
Strongly approve
Moderately approve
Neither approve nor disapprove
Moderately disapprove
Strongly disapprove
Don't know
36 Responsive Management
Percent that strongly approve or moderately
approve of hunting using each of the following
methods:
21
26
32
43
55
80
20
0 20 40 60 80 100
Hunting with a bow
and arrow
Hunting with dogs
Hunting using
scents that attract
game
Hunting over bait
Hunting using high-
tech gear such as
hearing devices or
laser tripwires
Hunting on property
that has a high
fence around it
Hunting bear during
the spring
Percent (n=975)
Americans’ Attitudes Toward Hunting, Fishing, Sport Shooting, and Trapping 37
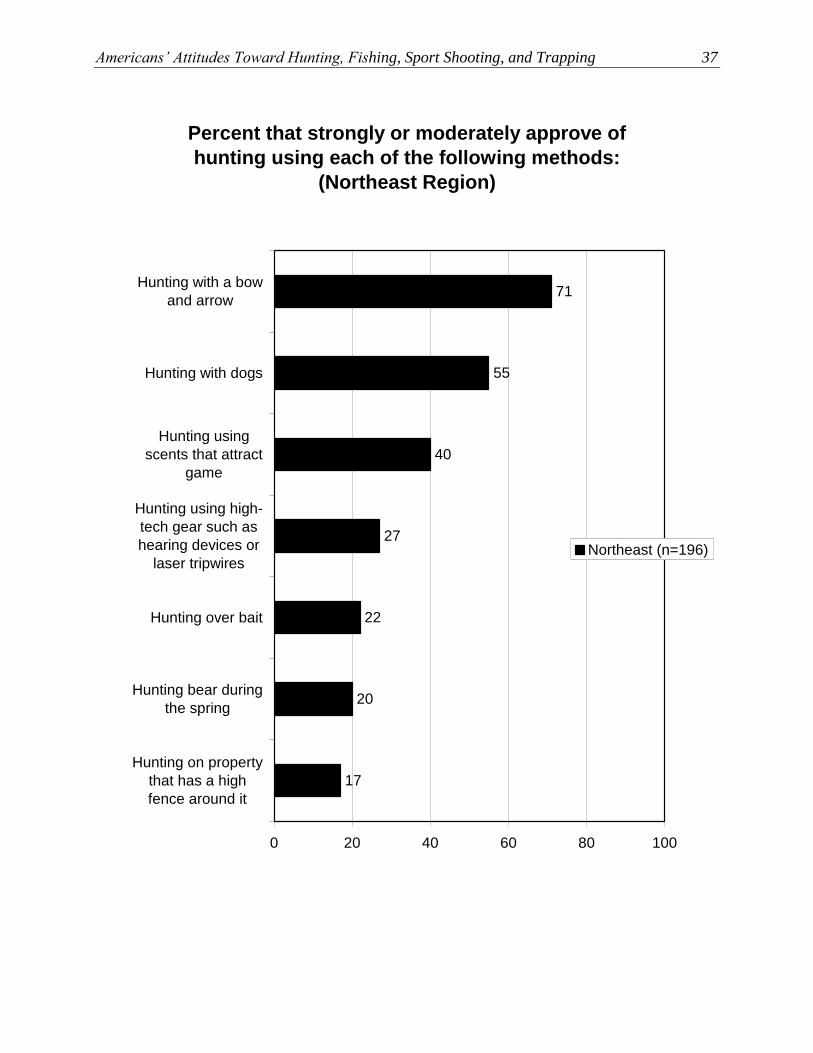
Percent that strongly or moderately approve of
hunting using each of the following methods:
(Northeast Region)
17
71
55
40
27
22
20
0 20 40 60 80 100
Hunting with a bow
and arrow
Hunting with dogs
Hunting using
scents that attract
game
Hunting using high-
tech gear such as
hearing devices or
laser tripwires
Hunting over bait
Hunting bear during
the spring
Hunting on property
that has a high
fence around it
Northeast (n=196)
38 Responsive Management
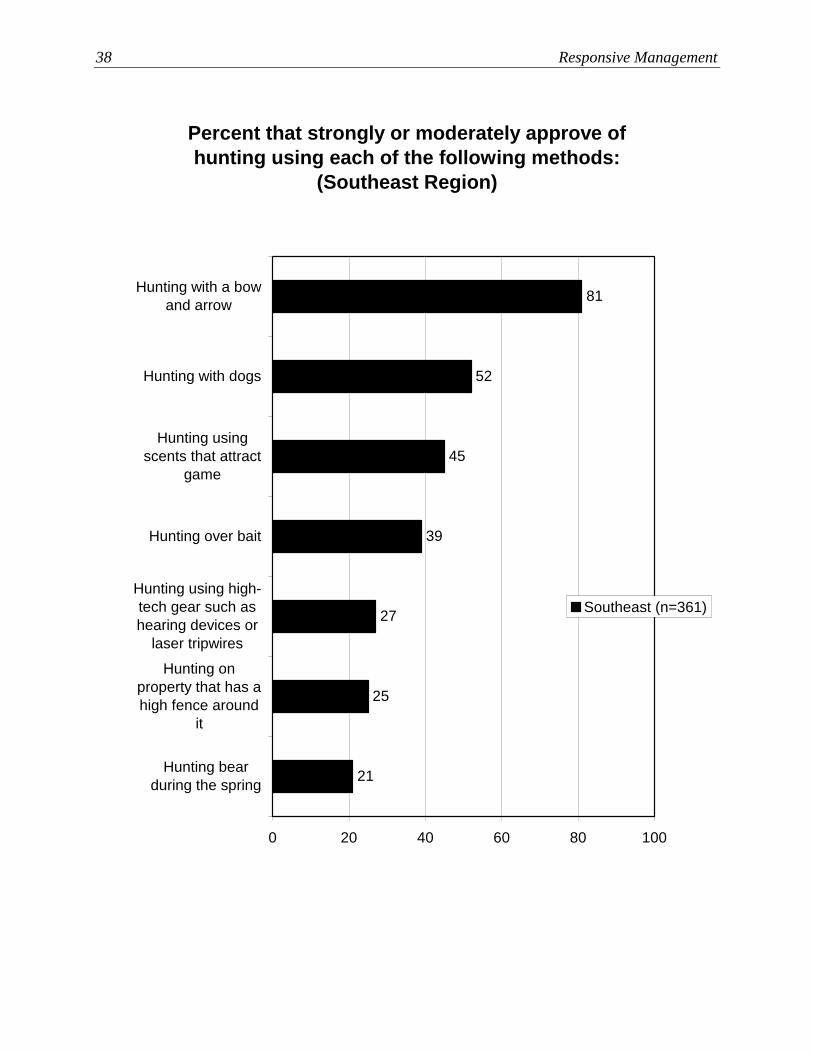
Percent that strongly or moderately approve of
hunting using each of the following methods:
(Southeast Region)
25
27
39
45
52
81
21
0 20 40 60 80 100
Hunting with a bow
and arrow
Hunting with dogs
Hunting using
scents that attract
game
Hunting over bait
Hunting using high-
tech gear such as
hearing devices or
laser tripwires
Hunting on
property that has a
high fence around
it
Hunting bear
during the spring
Southeast (n=361)
Americans’ Attitudes Toward Hunting, Fishing, Sport Shooting, and Trapping 39
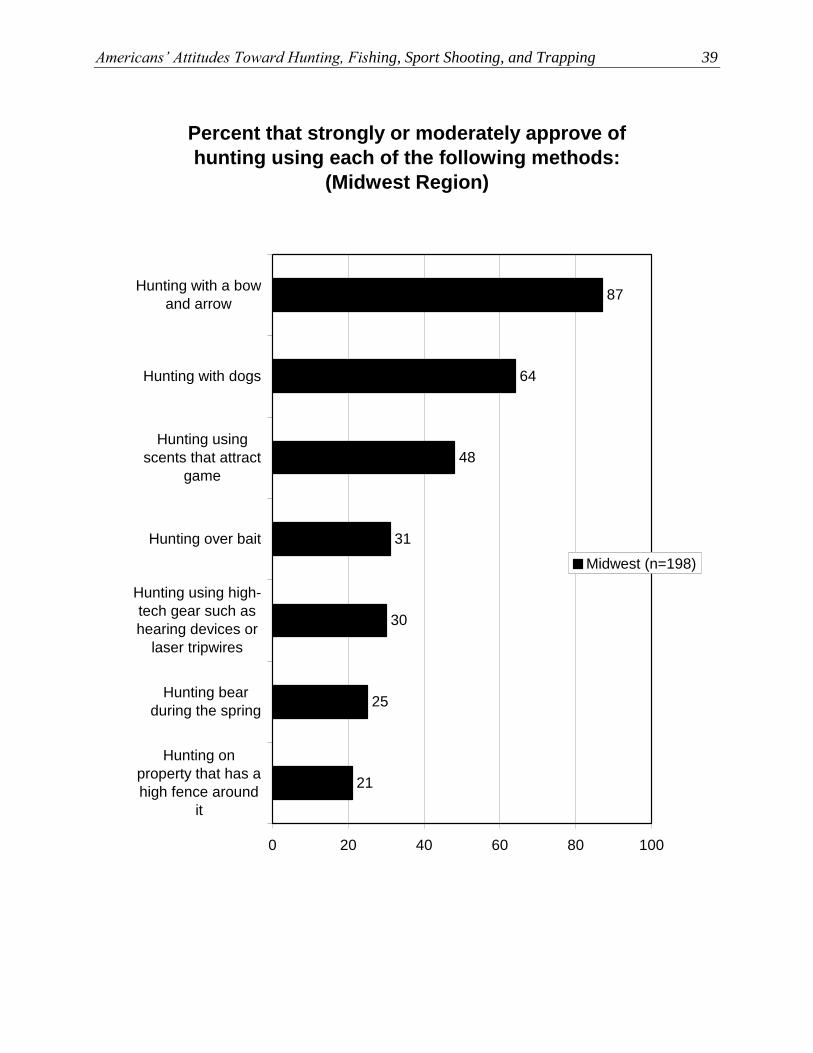
Percent that strongly or moderately approve of
hunting using each of the following methods:
(Midwest Region)
21
87
64
48
31
30
25
0 20 40 60 80 100
Hunting with a bow
and arrow
Hunting with dogs
Hunting using
scents that attract
game
Hunting over bait
Hunting using high-
tech gear such as
hearing devices or
laser tripwires
Hunting bear
during the spring
Hunting on
property that has a
high fence around
it
Midwest (n=198)
40 Responsive Management
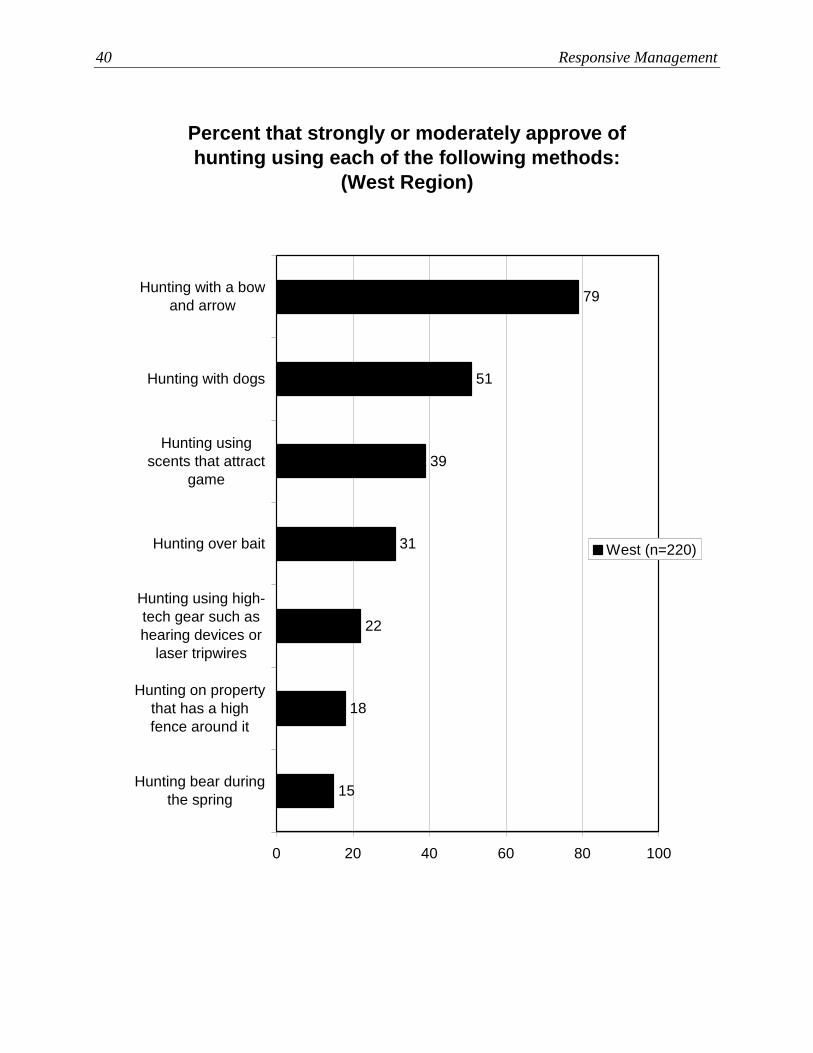
Percent that strongly or moderately approve of
hunting using each of the following methods:
(West Region)
15
79
51
39
31
22
18
0 20 40 60 80 100
Hunting with a bow
and arrow
Hunting with dogs
Hunting using
scents that attract
game
Hunting over bait
Hunting using high-
tech gear such as
hearing devices or
laser tripwires
Hunting on property
that has a high
fence around it
Hunting bear during
the spring
West (n=220)
Americans’ Attitudes Toward Hunting, Fishing, Sport Shooting, and Trapping 41
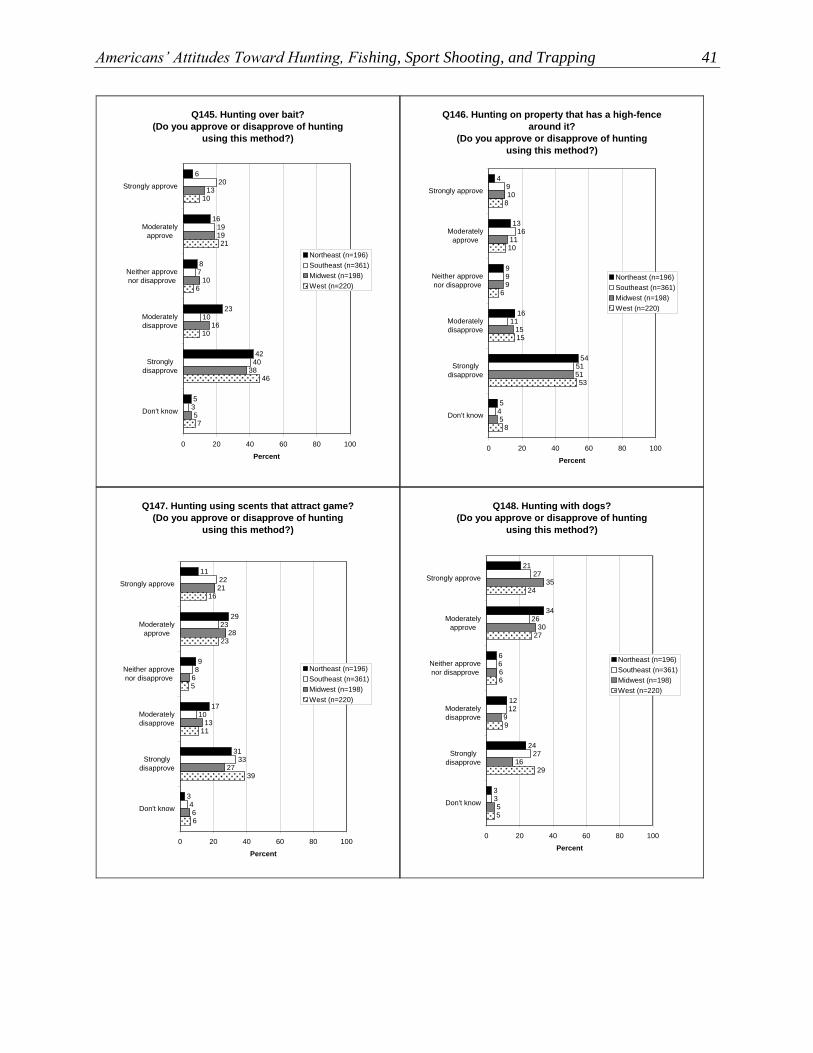
Q145. Hunting over bait?
(Do you approve or disapprove of hunting
using this method?)
6
16
8
23
42
53
40
10
7
19
20
5
38
16
13
19
10
7
46
10
10
21
6
0 20 40 60 80 100
Strongly approve
Moderately
approve
Neither approve
nor disapprove
Moderately
disapprove
Strongly
disapprove
Don't know
Percent
Northeast (n=196)
Southeast (n=361)
Midwest (n=198)
West (n=220)
Q146. Hunting on property that has a high-fence
around it?
(Do you approve or disapprove of hunting
using this method?)
4
13
9
16
54
54
51
11
9
16
9
5
51
15
10
11
9
8
53
15
8
10
6
0 20 40 60 80 100
Strongly approve
Moderately
approve
Neither approve
nor disapprove
Moderately
disapprove
Strongly
disapprove
Don't know
Percent
Northeast (n=196)
Southeast (n=361)
Midwest (n=198)
West (n=220)
Q147. Hunting using scents that attract game?
(Do you approve or disapprove of hunting
using this method?)
11
29
9
17
31
34
33
10
8
23
22
6
27
13
21
28
6
6
39
11
16
23
5
0 20 40 60 80 100
Strongly approve
Moderately
approve
Neither approve
nor disapprove
Moderately
disapprove
Strongly
disapprove
Don't know
Percent
Northeast (n=196)
Southeast (n=361)
Midwest (n=198)
West (n=220)
Q148. Hunting with dogs?
(Do you approve or disapprove of hunting
using this method?)
21
34
6
12
24
33
27
12
6
26
27
5
16
9
35
30
6
5
29
9
24
27
6
0 20 40 60 80 100
Strongly approve
Moderately
approve
Neither approve
nor disapprove
Moderately
disapprove
Strongly
disapprove
Don't know
Percent
Northeast (n=196)
Southeast (n=361)
Midwest (n=198)
West (n=220)
42 Responsive Management
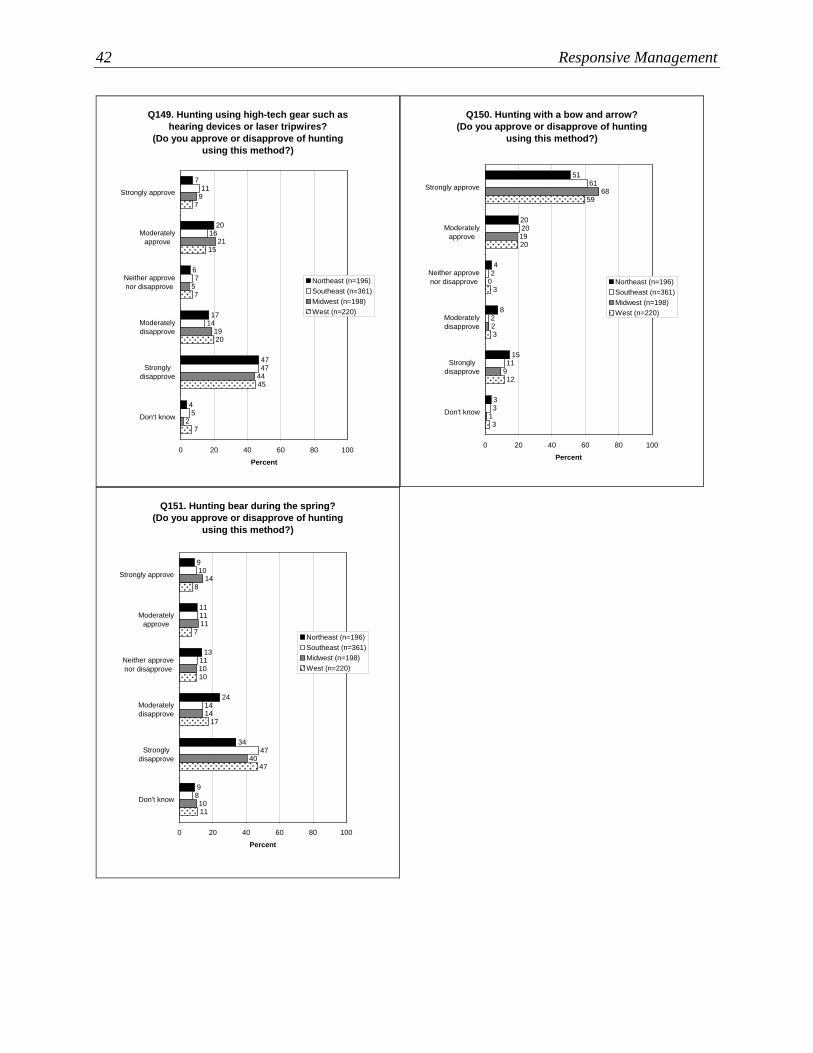
Q149. Hunting using high-tech gear such as
hearing devices or laser tripwires?
(Do you approve or disapprove of hunting
using this method?)
7
20
6
17
47
45
47
14
7
16
11
2
44
19
9
21
5
7
45
20
7
15
7
0 20 40 60 80 100
Strongly approve
Moderately
approve
Neither approve
nor disapprove
Moderately
disapprove
Strongly
disapprove
Don't know
Percent
Northeast (n=196)
Southeast (n=361)
Midwest (n=198)
West (n=220)
Q150. Hunting with a bow and arrow?
(Do you approve or disapprove of hunting
using this method?)
51
20
4
8
15
33
11
2
2
20
61
1
9
2
68
19
0
3
12
3
59
20
3
0 20 40 60 80 100
Strongly approve
Moderately
approve
Neither approve
nor disapprove
Moderately
disapprove
Strongly
disapprove
Don't know
Percent
Northeast (n=196)
Southeast (n=361)
Midwest (n=198)
West (n=220)
Q151. Hunting bear during the spring?
(Do you approve or disapprove of hunting
using this method?)
9
11
13
24
34
98
47
14
11
11
10
10
40
14
14
11
10
11
47
17
8
7
10
0 20 40 60 80 100
Strongly approve
Moderately
approve
Neither approve
nor disapprove
Moderately
disapprove
Strongly
disapprove
Don't know
Percent
Northeast (n=196)
Southeast (n=361)
Midwest (n=198)
West (n=220)
Americans’ Attitudes Toward Hunting, Fishing, Sport Shooting, and Trapping 43
Q145-151. Percent who strongly approve or moderately approve of
hunting for each of the following methods:
22
14
22
80
55
43
32
2621 202020
27
36
57
* *
29
76
54
38
0
20
40
60
80
100
Hunting with a
bow and arrow
Hunting with dogs Hunting using
special scents
that attract game
Hunting over bait Hunting using
high-tech gear
Hunting in a high-
fence preserve /
Hunting on
property that has
a high fence
around it
Hunting bear
during the spring
Pe
rce
nt
2007 2016 2019
*Method not asked about in 2007 survey
(2019 n=3014)
44 Responsive Management
ATTITUDES TOWARD FISHING IN THE UNITED STATES
ATTITUDES TOWARD FISHING IN GENERAL
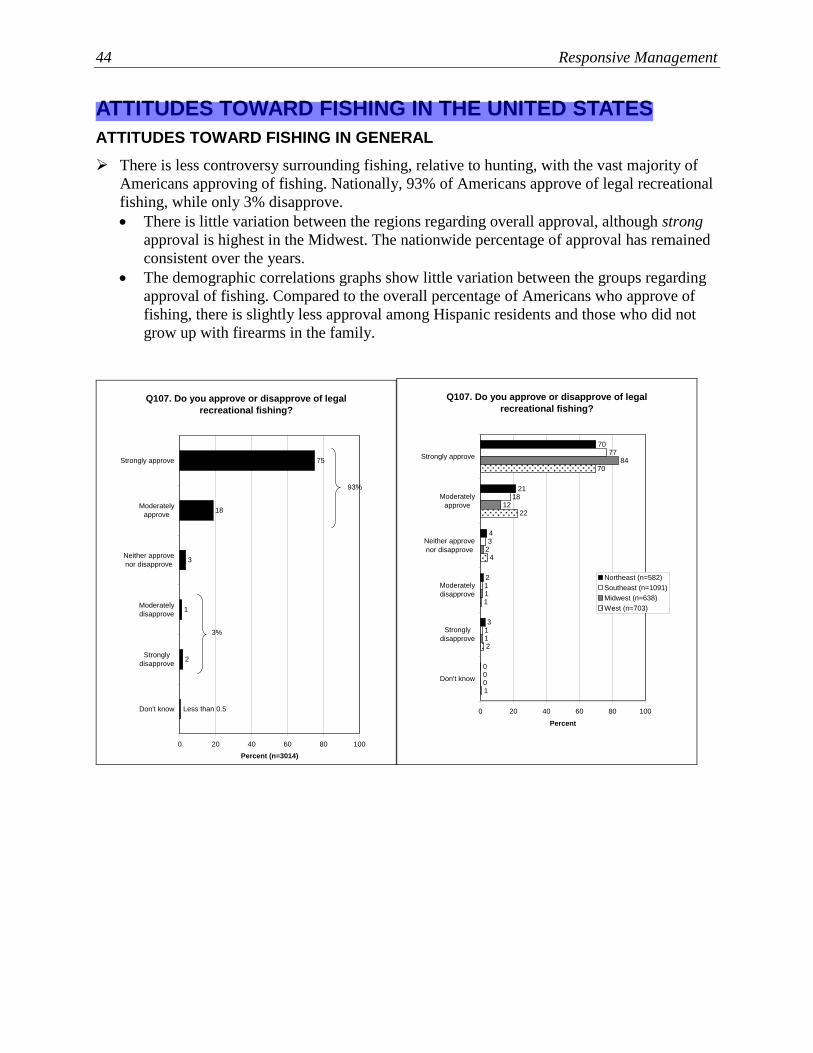
➢ There is less controversy surrounding fishing, relative to hunting, with the vast majority of
Americans approving of fishing. Nationally, 93% of Americans approve of legal recreational
fishing, while only 3% disapprove.
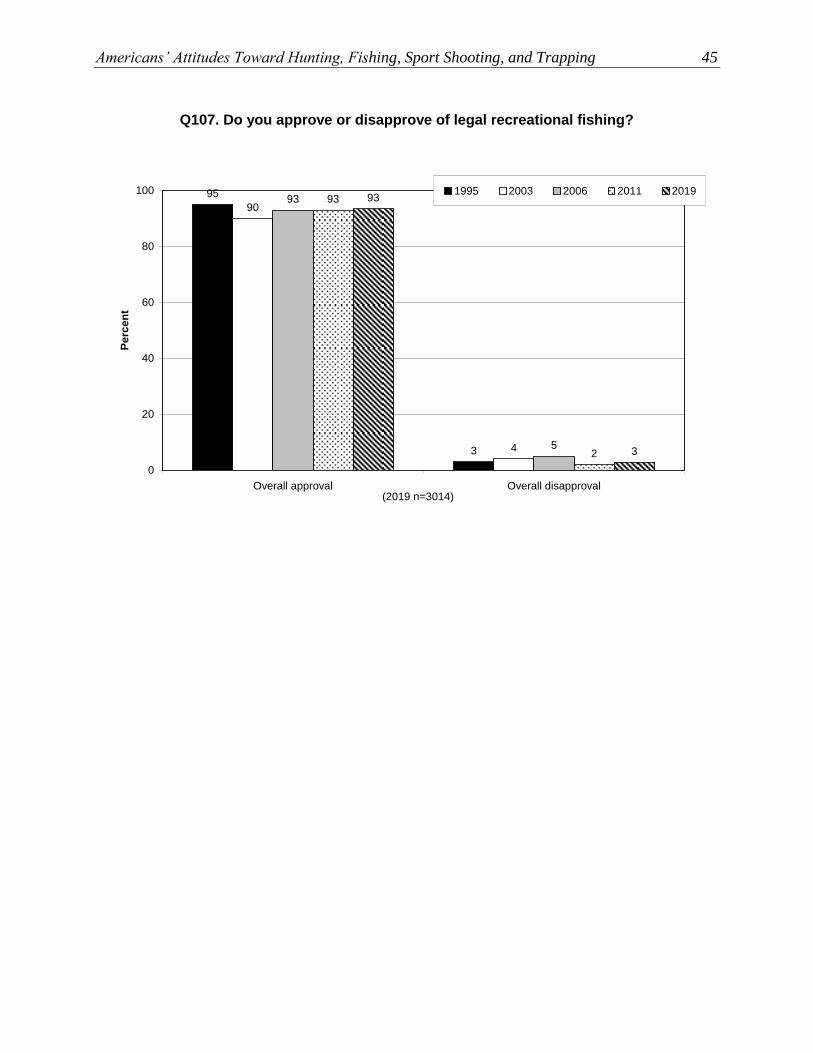
• There is little variation between the regions regarding overall approval, although strong
approval is highest in the Midwest. The nationwide percentage of approval has remained
consistent over the years.
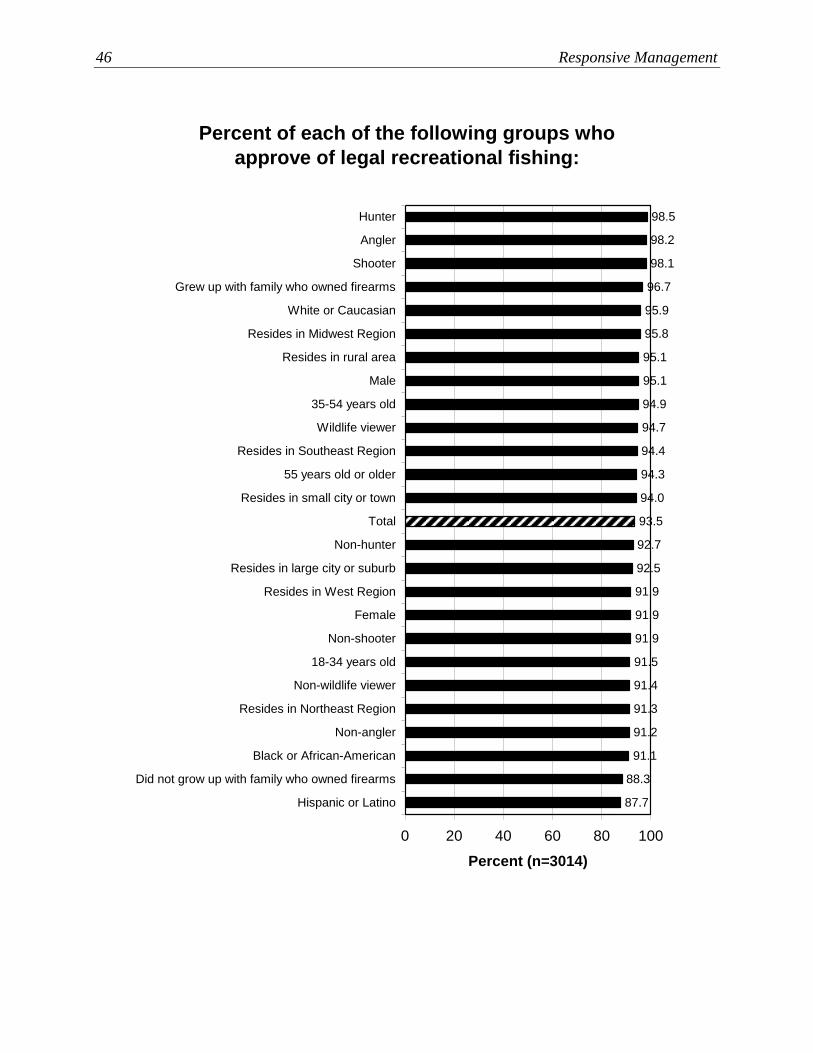
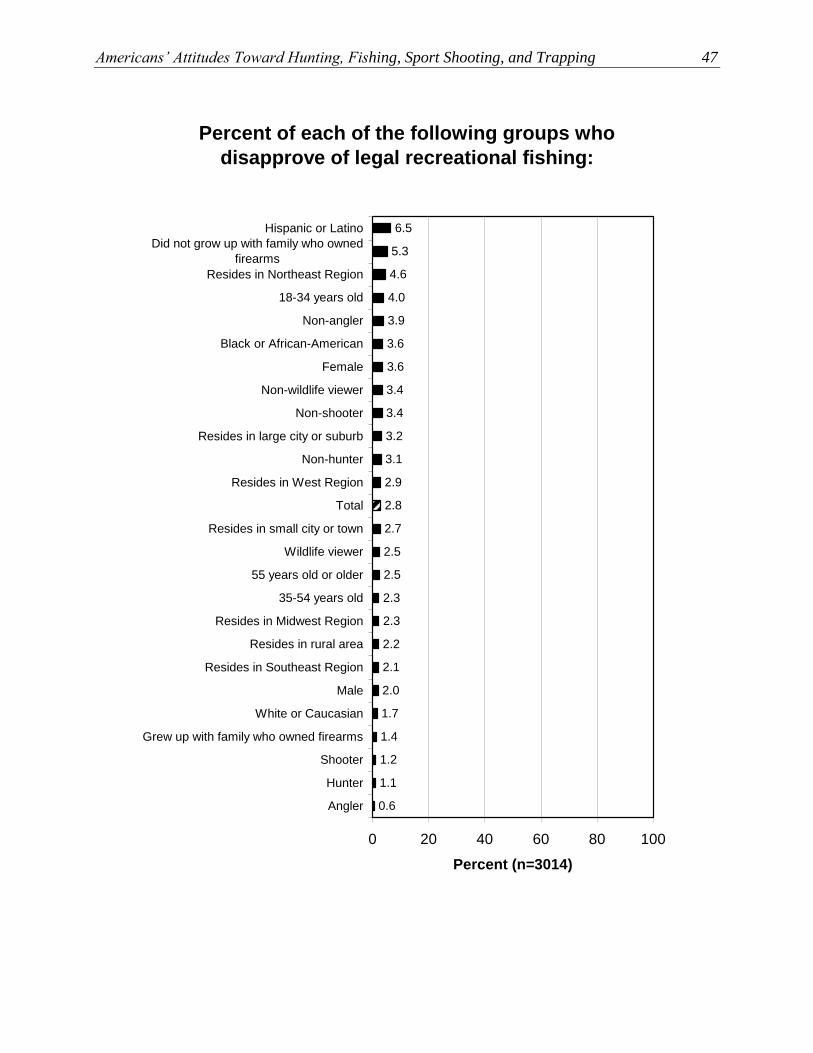
• The demographic correlations graphs show little variation between the groups regarding
approval of fishing. Compared to the overall percentage of Americans who approve of
fishing, there is slightly less approval among Hispanic residents and those who did not
grow up with firearms in the family.
Q107. Do you approve or disapprove of legal
recreational fishing?
75
18
3
1
2
Less than 0.5
0 20 40 60 80 100
Strongly approve
Moderately
approve
Neither approve
nor disapprove
Moderately
disapprove
Strongly
disapprove
Don't know
Percent (n=3014)
93%
3%
Q107. Do you approve or disapprove of legal
recreational fishing?
70
21
4
2
3
00
1
1
3
18
77
0
1
1
84
12
2
1
2
1
70
22
4
0 20 40 60 80 100
Strongly approve
Moderately
approve
Neither approve
nor disapprove
Moderately
disapprove
Strongly
disapprove
Don't know
Percent
Northeast (n=582)
Southeast (n=1091)
Midwest (n=638)
West (n=703)
Americans’ Attitudes Toward Hunting, Fishing, Sport Shooting, and Trapping 45
Q107. Do you approve or disapprove of legal recreational fishing?
3
95
90
4 5
93
2
93
3
93
0
20
40
60
80
100
Overall approval Overall disapproval
Pe
rce
nt
1995 2003 2006 2011 2019
(2019 n=3014)
46 Responsive Management
Percent of each of the following groups who
approve of legal recreational fishing:
92.5
91.9
91.9
91.9
91.5
91.4
91.3
91.2
91.1
88.3
87.7
94.9
95.1
95.1
98.5
98.2
98.1
96.7
95.9
95.8
94.7
94.4
94.3
94.0
93.5
92.7
0 20 40 60 80 100
Hunter
Angler
Shooter
Grew up with family who owned firearms
White or Caucasian
Resides in Midwest Region
Resides in rural area
Male
35-54 years old
Wildlife viewer
Resides in Southeast Region
55 years old or older
Resides in small city or town
Total
Non-hunter
Resides in large city or suburb
Resides in West Region
Female
Non-shooter
18-34 years old
Non-wildlife viewer
Resides in Northeast Region
Non-angler
Black or African-American
Did not grow up with family who owned firearms
Hispanic or Latino
Percent (n=3014)
Americans’ Attitudes Toward Hunting, Fishing, Sport Shooting, and Trapping 47
Percent of each of the following groups who
disapprove of legal recreational fishing:
2.5
2.3
2.3
2.2
2.1
2.0
1.7
1.4
1.2
1.1
0.6
3.4
3.4
3.6
6.5
5.3
4.6
4.0
3.9
3.6
3.2
3.1
2.9
2.8
2.7
2.5
0 20 40 60 80 100
Hispanic or Latino
Did not grow up with family who owned
firearms
Resides in Northeast Region
18-34 years old
Non-angler
Black or African-American
Female
Non-wildlife viewer
Non-shooter
Resides in large city or suburb
Non-hunter
Resides in West Region
Total
Resides in small city or town
Wildlife viewer
55 years old or older
35-54 years old
Resides in Midwest Region
Resides in rural area
Resides in Southeast Region
Male
White or Caucasian
Grew up with family who owned firearms
Shooter
Hunter
Angler
Percent (n=3014)
48 Responsive Management
MOTIVATIONS FOR FISHING
➢ Approval of fishing can vary depending on the motivations for fishing. Fishing for food is
considered much more acceptable than fishing for the sport, for the challenge, or for a trophy
fish. These results largely mirror those of the hunting portion of the survey, indicating that
Americans approve of fishing for utilitarian purposes much more than they approve of
fishing for sport. The motivations for fishing asked about in the survey and the percentages
who approve of each are listed below, in descending order of strong approval:
• For fish to eat (96% approve; 84% strongly approve)
• To supplement income (82% approve; 55% strongly approve)
• For the challenge (70% approve; 43% strongly approve)
• For the sport (73% approve; 43% strongly approve)
• For a trophy fish (53% approve; 26% strongly approve)
o The nationwide results for this series of motivations are shown together on one graph,
followed by graphs showing the series results within each region and the regional
crosstabulation for each motivation individually.
o For most motivations, strong approval is highest in the Midwest and strong
disapproval is highest in the Northeast.
o Approval of fishing to supplement income has increased substantially, going from
65% in 2006 to 82% in 2019. The percentages of Americans who approve of fishing
for the challenge and for a trophy fish have also notably increased.
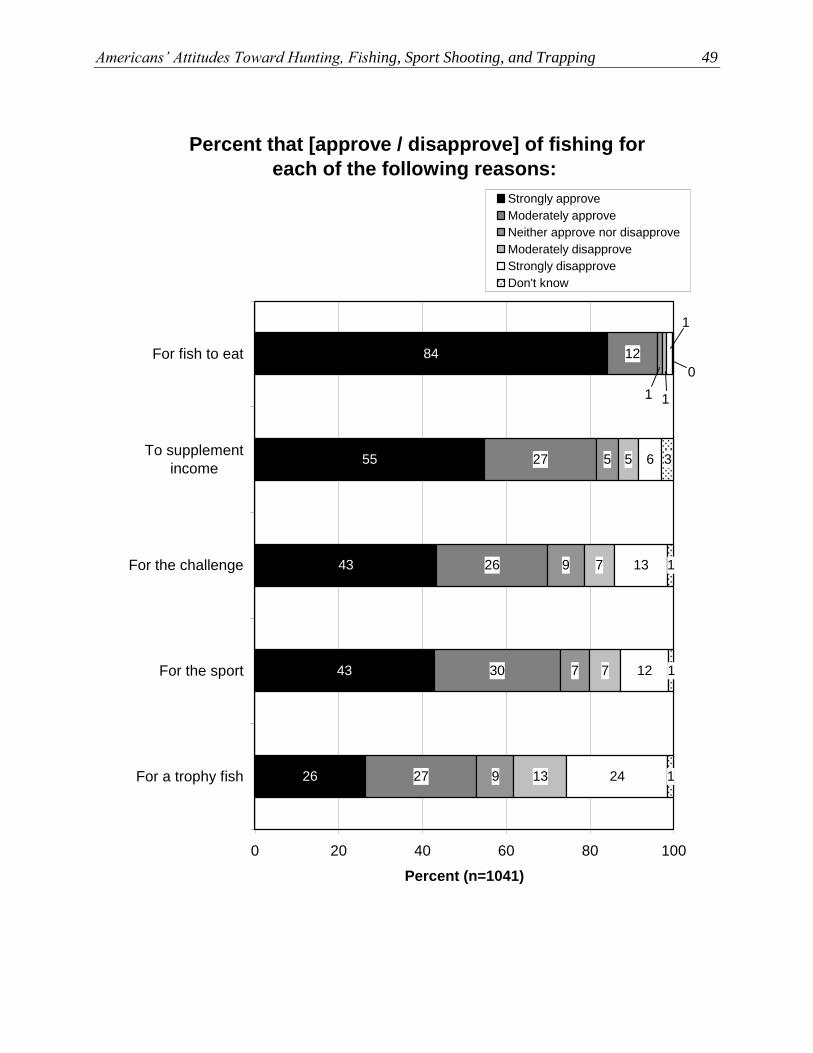
Americans’ Attitudes Toward Hunting, Fishing, Sport Shooting, and Trapping 49
Percent that [approve / disapprove] of fishing for
each of the following reasons:
84
55
43
43
26
12
27
26
30
27
5
9
7
9
5
7
7
13
6
13
12
24
3
1
1
1
1 1
1
0
0 20 40 60 80 100
For fish to eat
To supplement
income
For the challenge
For the sport
For a trophy fish
Percent (n=1041)
Strongly approve
Moderately approve
Neither approve nor disapprove
Moderately disapprove
Strongly disapprove
Don't know
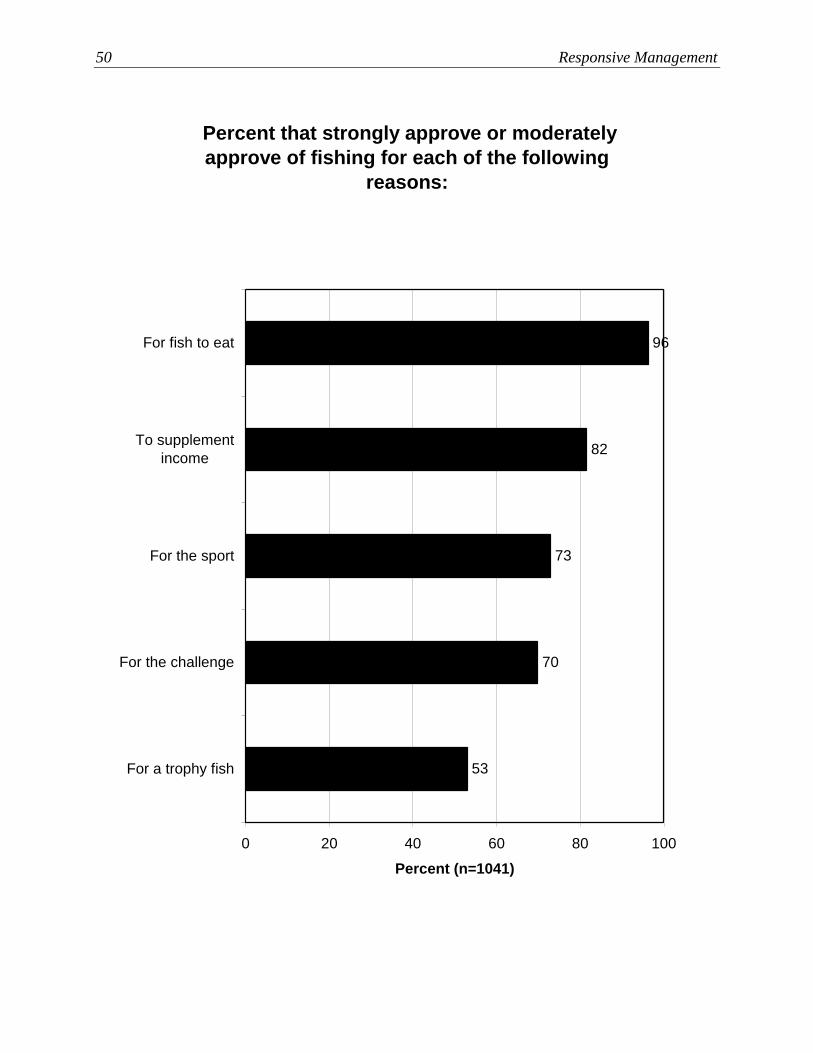
50 Responsive Management
Percent that strongly approve or moderately
approve of fishing for each of the following
reasons:
53
70
73
82
96
0 20 40 60 80 100
For fish to eat
To supplement
income
For the sport
For the challenge
For a trophy fish
Percent (n=1041)
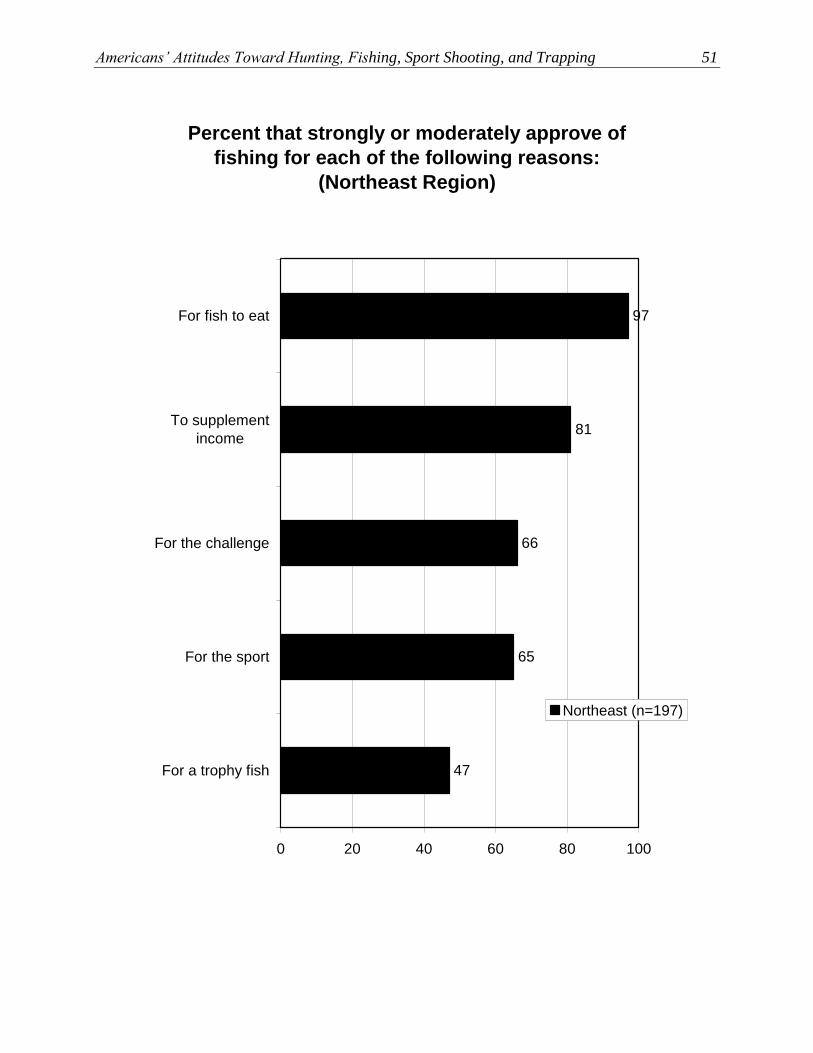
Americans’ Attitudes Toward Hunting, Fishing, Sport Shooting, and Trapping 51
Percent that strongly or moderately approve of
fishing for each of the following reasons:
(Northeast Region)
97
81
66
65
47
0 20 40 60 80 100
For fish to eat
To supplement
income
For the challenge
For the sport
For a trophy fish
Northeast (n=197)
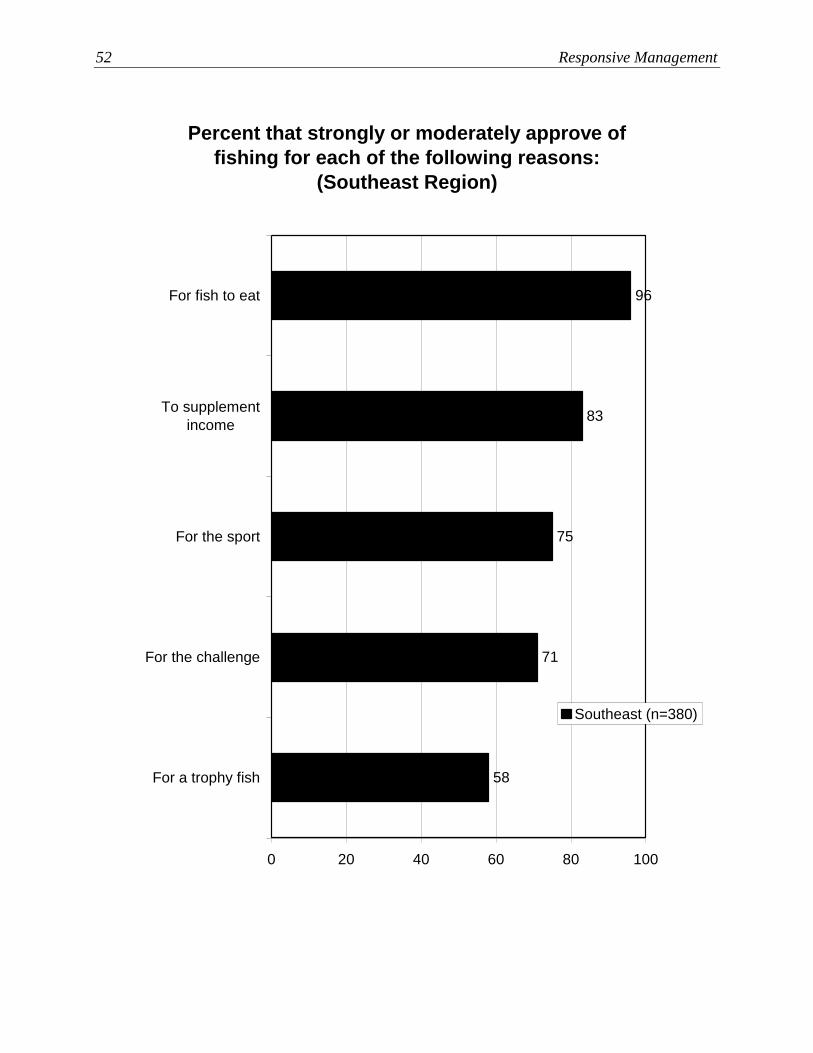
52 Responsive Management
Percent that strongly or moderately approve of
fishing for each of the following reasons:
(Southeast Region)
96
83
75
71
58
0 20 40 60 80 100
For fish to eat
To supplement
income
For the sport
For the challenge
For a trophy fish
Southeast (n=380)
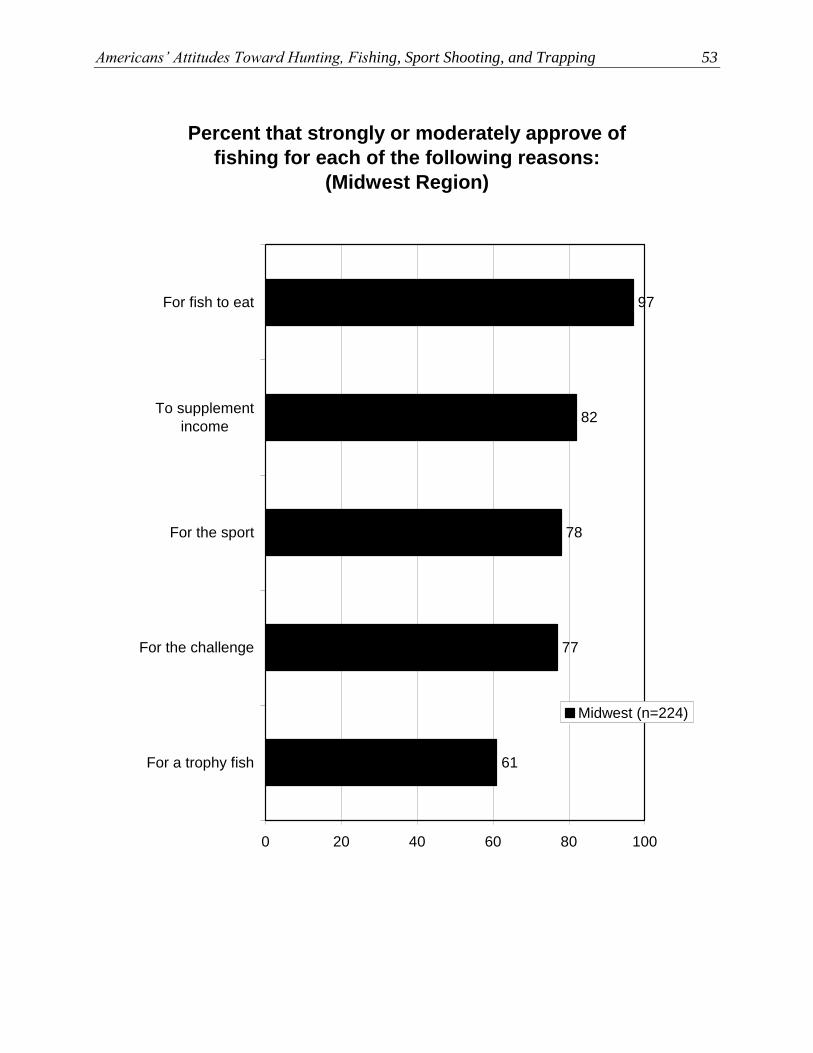
Americans’ Attitudes Toward Hunting, Fishing, Sport Shooting, and Trapping 53
Percent that strongly or moderately approve of
fishing for each of the following reasons:
(Midwest Region)
97
82
78
77
61
0 20 40 60 80 100
For fish to eat
To supplement
income
For the sport
For the challenge
For a trophy fish
Midwest (n=224)
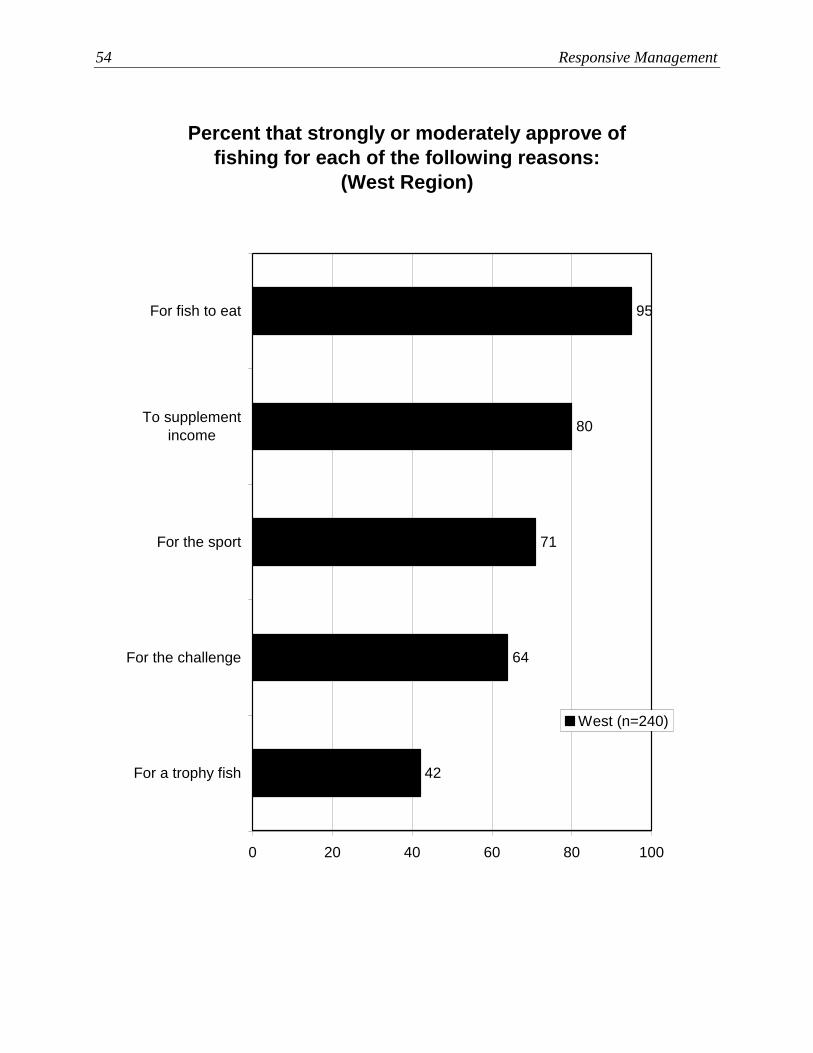
54 Responsive Management
Percent that strongly or moderately approve of
fishing for each of the following reasons:
(West Region)
95
80
71
64
42
0 20 40 60 80 100
For fish to eat
To supplement
income
For the sport
For the challenge
For a trophy fish
West (n=240)
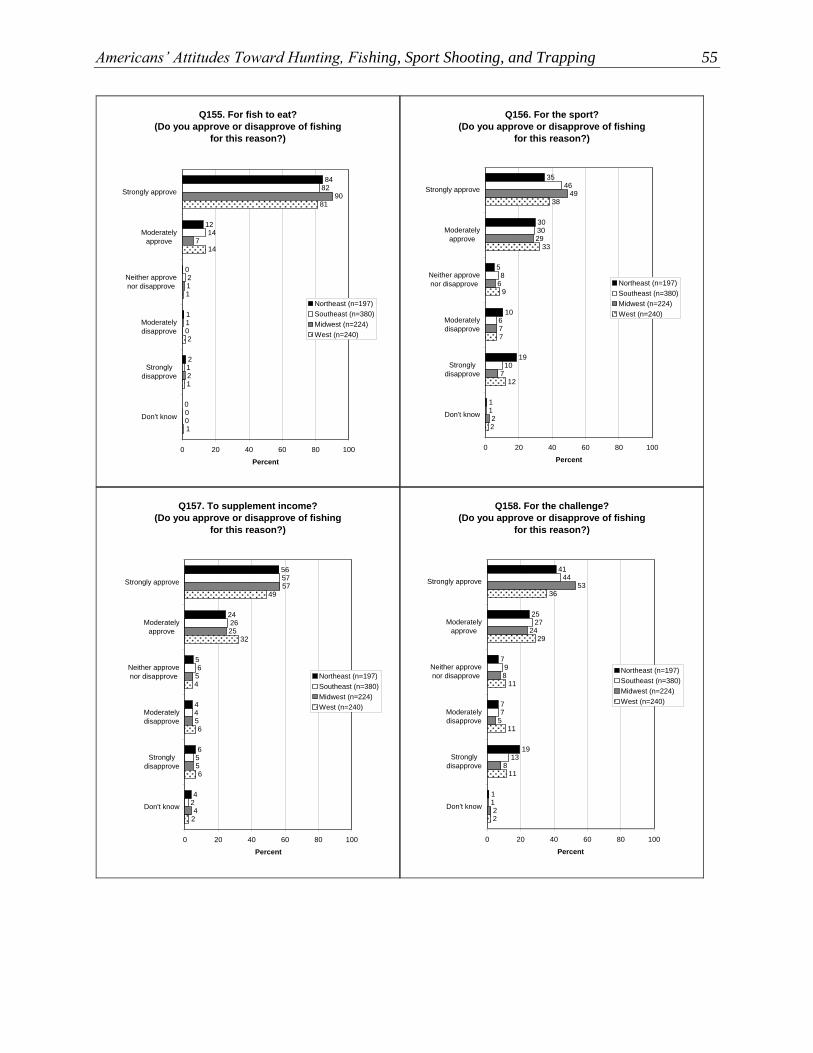
Americans’ Attitudes Toward Hunting, Fishing, Sport Shooting, and Trapping 55
Q155. For fish to eat?
(Do you approve or disapprove of fishing
for this reason?)
84
12
0
1
2
00
1
1
2
14
82
0
2
0
90
7
1
1
1
2
81
14
1
0 20 40 60 80 100
Strongly approve
Moderately
approve
Neither approve
nor disapprove
Moderately
disapprove
Strongly
disapprove
Don't know
Percent
Northeast (n=197)
Southeast (n=380)
Midwest (n=224)
West (n=240)
Q156. For the sport?
(Do you approve or disapprove of fishing
for this reason?)
35
30
5
10
19
11
10
6
8
30
46
2
7
7
49
29
6
2
12
7
38
33
9
0 20 40 60 80 100
Strongly approve
Moderately
approve
Neither approve
nor disapprove
Moderately
disapprove
Strongly
disapprove
Don't know
Percent
Northeast (n=197)
Southeast (n=380)
Midwest (n=224)
West (n=240)
Q157. To supplement income?
(Do you approve or disapprove of fishing
for this reason?)
56
24
5
4
6
42
5
4
6
26
57
4
5
5
57
25
5
2
6
6
49
32
4
0 20 40 60 80 100
Strongly approve
Moderately
approve
Neither approve
nor disapprove
Moderately
disapprove
Strongly
disapprove
Don't know
Percent
Northeast (n=197)
Southeast (n=380)
Midwest (n=224)
West (n=240)
Q158. For the challenge?
(Do you approve or disapprove of fishing
for this reason?)
41
25
7
7
19
11
13
7
9
27
44
2
8
5
53
24
8
2
11
11
36
29
11
0 20 40 60 80 100
Strongly approve
Moderately
approve
Neither approve
nor disapprove
Moderately
disapprove
Strongly
disapprove
Don't know
Percent
Northeast (n=197)
Southeast (n=380)
Midwest (n=224)
West (n=240)
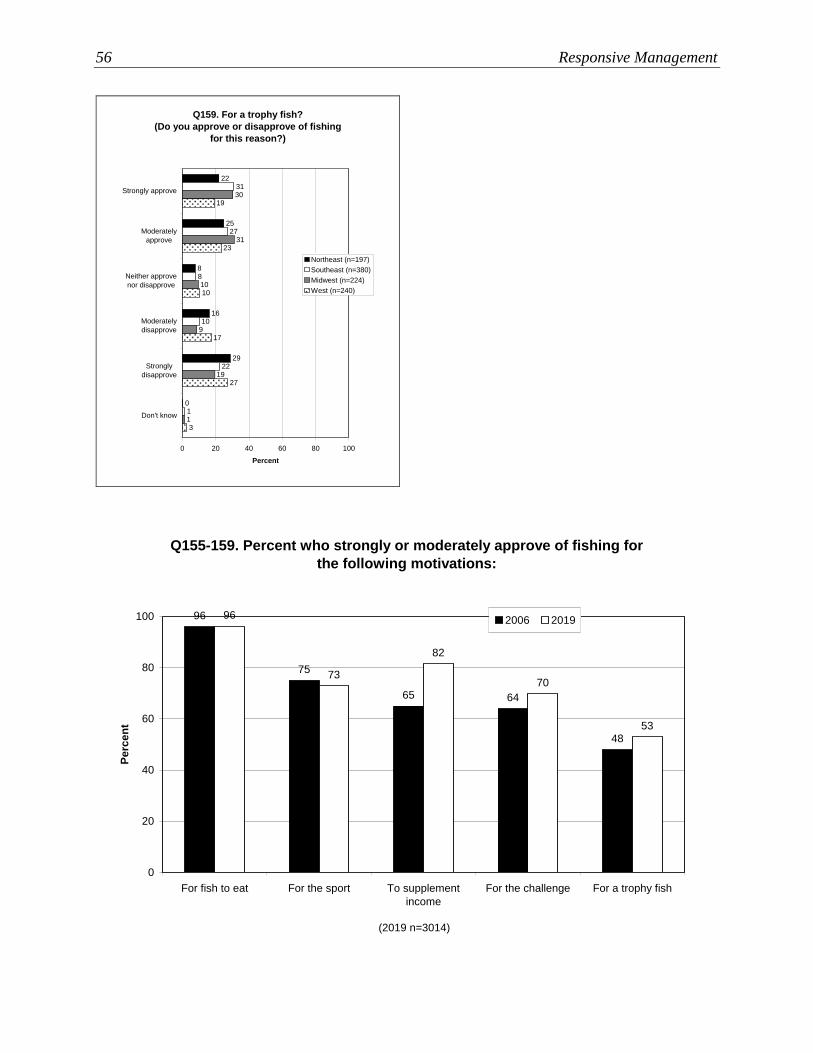
56 Responsive Management
Q159. For a trophy fish?
(Do you approve or disapprove of fishing
for this reason?)
22
25
8
16
29
01
22
10
8
27
31
1
19
9
30
31
10
3
27
17
19
23
10
0 20 40 60 80 100
Strongly approve
Moderately
approve
Neither approve
nor disapprove
Moderately
disapprove
Strongly
disapprove
Don't know
Percent
Northeast (n=197)
Southeast (n=380)
Midwest (n=224)
West (n=240)
Q155-159. Percent who strongly or moderately approve of fishing for
the following motivations:
5348
6465
75
96
70
96
73
82
0
20
40
60
80
100
For fish to eat For the sport To supplement
income
For the challenge For a trophy fish
Pe
rce
nt
2006 2019
(2019 n=3014)
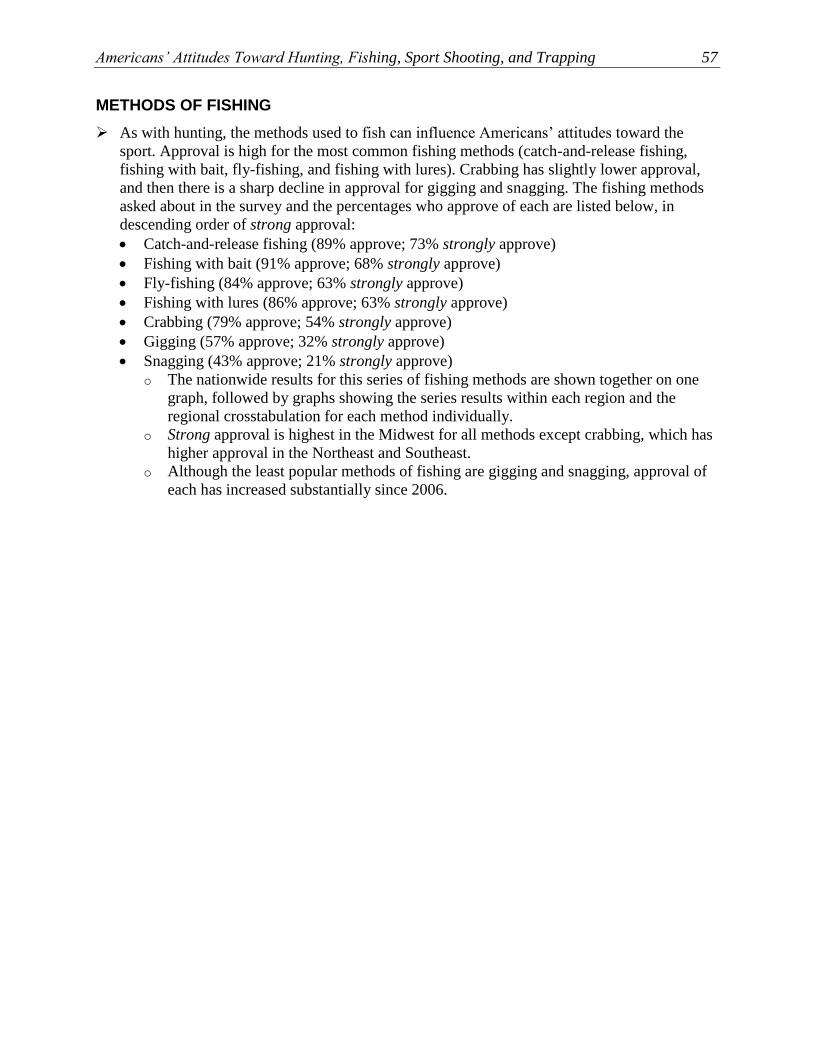
Americans’ Attitudes Toward Hunting, Fishing, Sport Shooting, and Trapping 57
METHODS OF FISHING
➢ As with hunting, the methods used to fish can influence Americans’ attitudes toward the
sport. Approval is high for the most common fishing methods (catch-and-release fishing,
fishing with bait, fly-fishing, and fishing with lures). Crabbing has slightly lower approval,
and then there is a sharp decline in approval for gigging and snagging. The fishing methods
asked about in the survey and the percentages who approve of each are listed below, in
descending order of strong approval:
• Catch-and-release fishing (89% approve; 73% strongly approve)
• Fishing with bait (91% approve; 68% strongly approve)
• Fly-fishing (84% approve; 63% strongly approve)
• Fishing with lures (86% approve; 63% strongly approve)
• Crabbing (79% approve; 54% strongly approve)
• Gigging (57% approve; 32% strongly approve)
• Snagging (43% approve; 21% strongly approve)
o The nationwide results for this series of fishing methods are shown together on one
graph, followed by graphs showing the series results within each region and the
regional crosstabulation for each method individually.
o Strong approval is highest in the Midwest for all methods except crabbing, which has
higher approval in the Northeast and Southeast.
o Although the least popular methods of fishing are gigging and snagging, approval of
each has increased substantially since 2006.
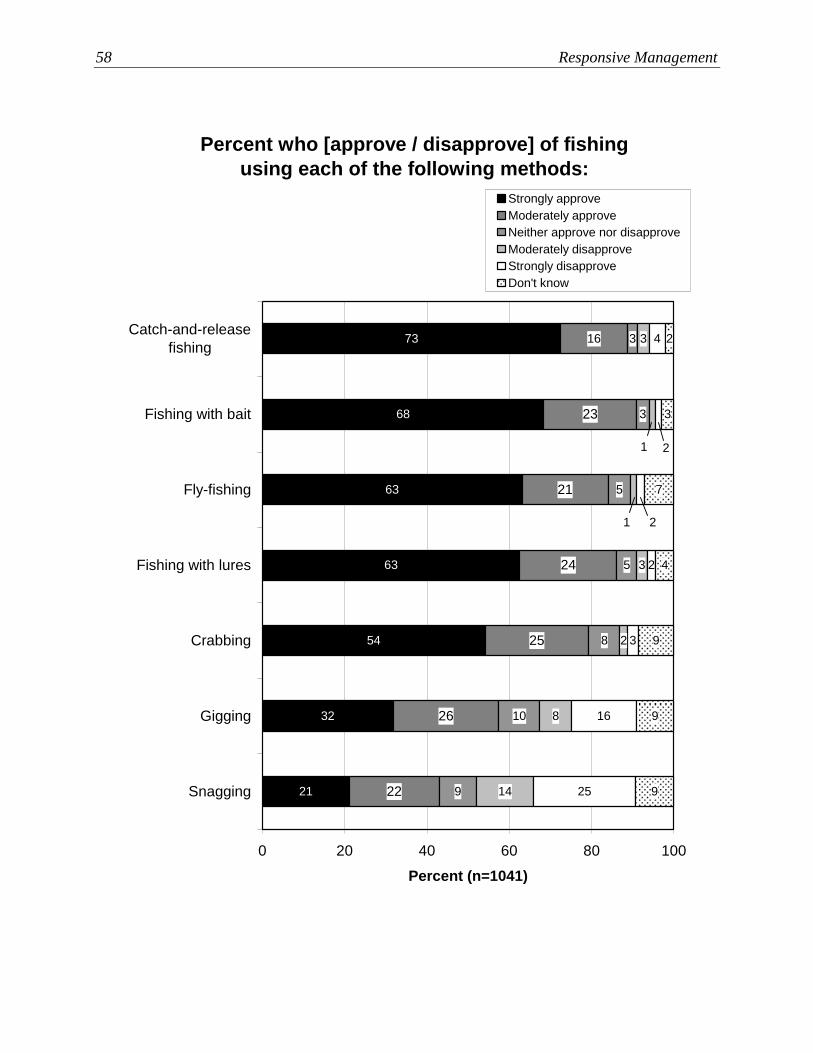
58 Responsive Management
Percent who [approve / disapprove] of fishing
using each of the following methods:
73
68
63
63
54
32
21
23
21
24
25
26
22
3
3
5
5
8
10
9
3
3
2
8
14
4
2
3
16
25
2
3
7
4
9
9
9
16
1
1
2
2
0 20 40 60 80 100
Catch-and-release
fishing
Fishing with bait
Fly-fishing
Fishing with lures
Crabbing
Gigging
Snagging
Percent (n=1041)
Strongly approve
Moderately approve
Neither approve nor disapprove
Moderately disapprove
Strongly disapprove
Don't know
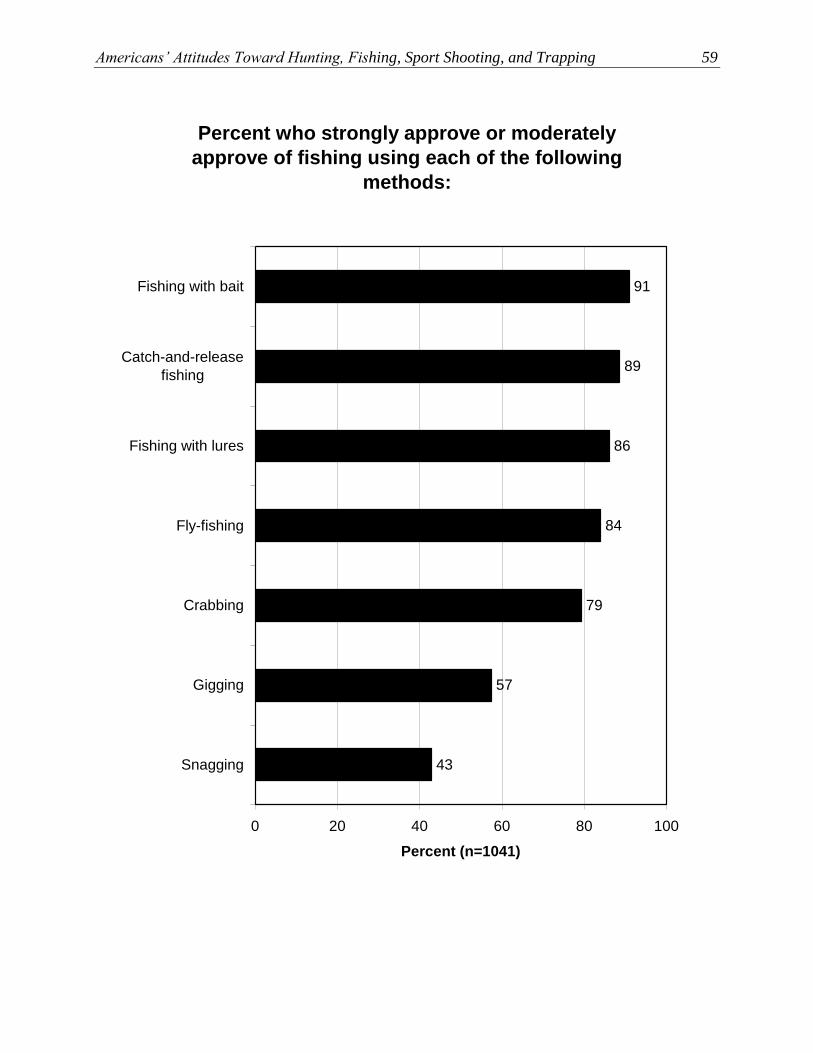
Americans’ Attitudes Toward Hunting, Fishing, Sport Shooting, and Trapping 59
Percent who strongly approve or moderately
approve of fishing using each of the following
methods:
57
79
84
86
89
91
43
0 20 40 60 80 100
Fishing with bait
Catch-and-release
fishing
Fishing with lures
Fly-fishing
Crabbing
Gigging
Snagging
Percent (n=1041)
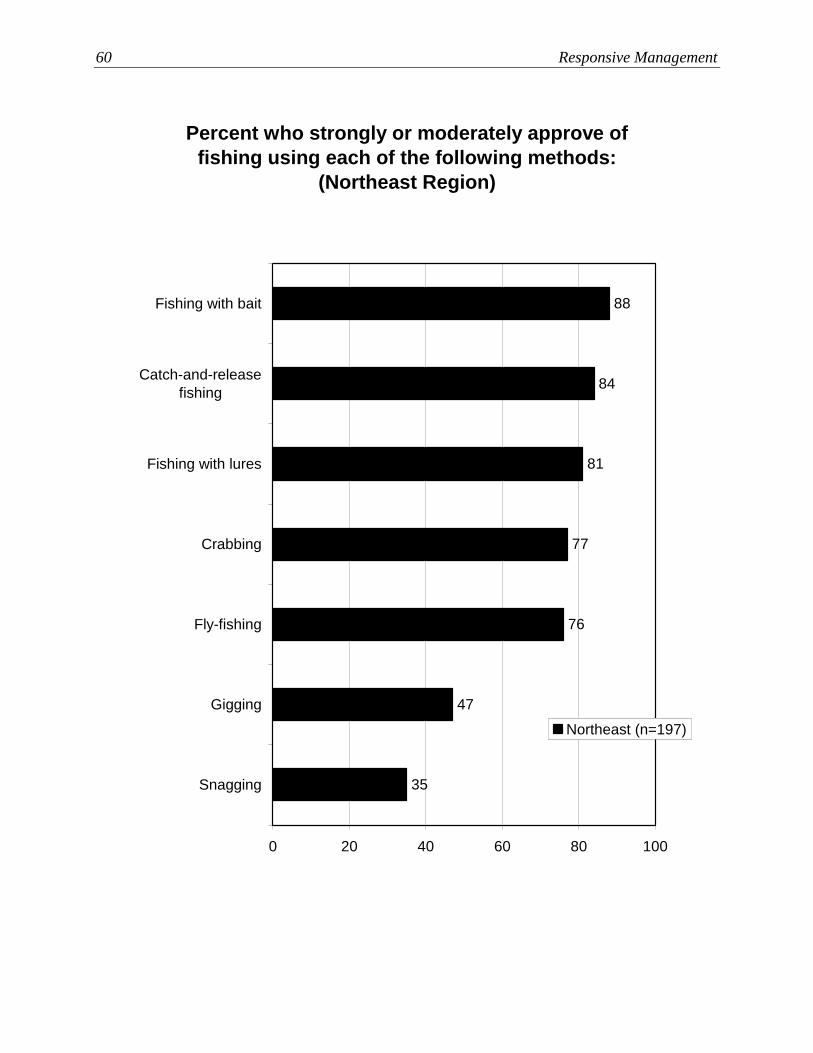
60 Responsive Management
Percent who strongly or moderately approve of
fishing using each of the following methods:
(Northeast Region)
35
88
84
81
77
76
47
0 20 40 60 80 100
Fishing with bait
Catch-and-release
fishing
Fishing with lures
Crabbing
Fly-fishing
Gigging
Snagging
Northeast (n=197)
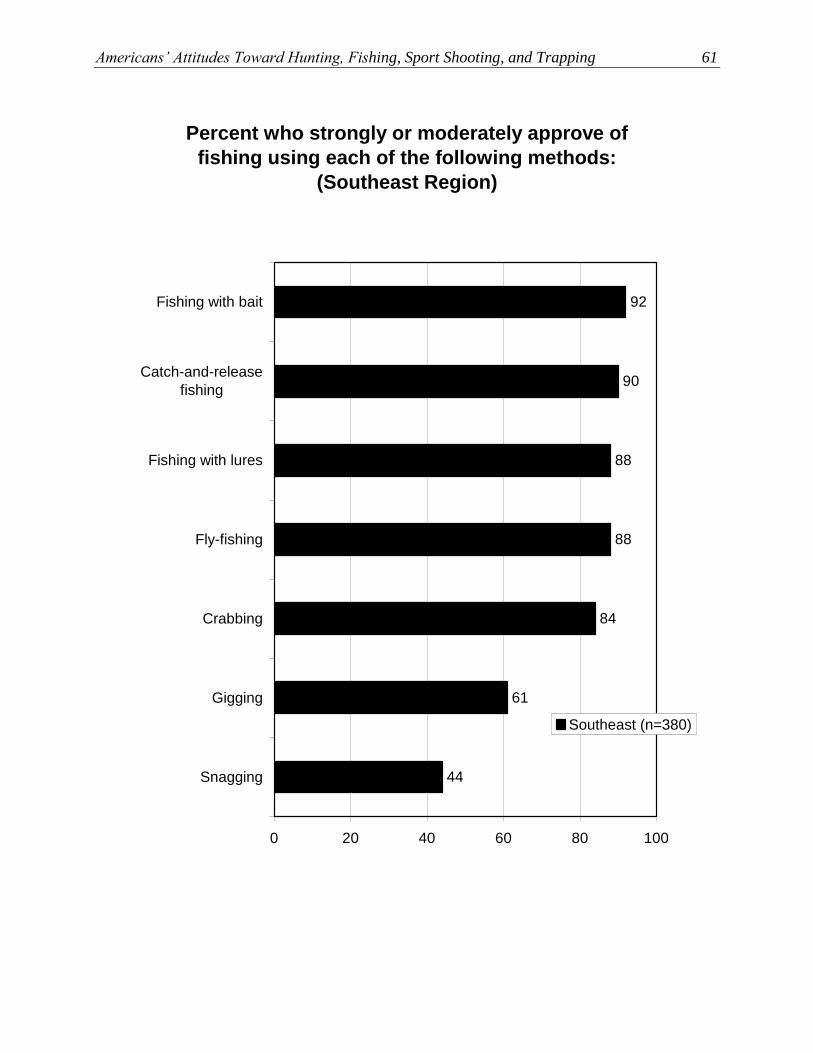
Americans’ Attitudes Toward Hunting, Fishing, Sport Shooting, and Trapping 61
Percent who strongly or moderately approve of
fishing using each of the following methods:
(Southeast Region)
44
92
90
88
88
84
61
0 20 40 60 80 100
Fishing with bait
Catch-and-release
fishing
Fishing with lures
Fly-fishing
Crabbing
Gigging
Snagging
Southeast (n=380)
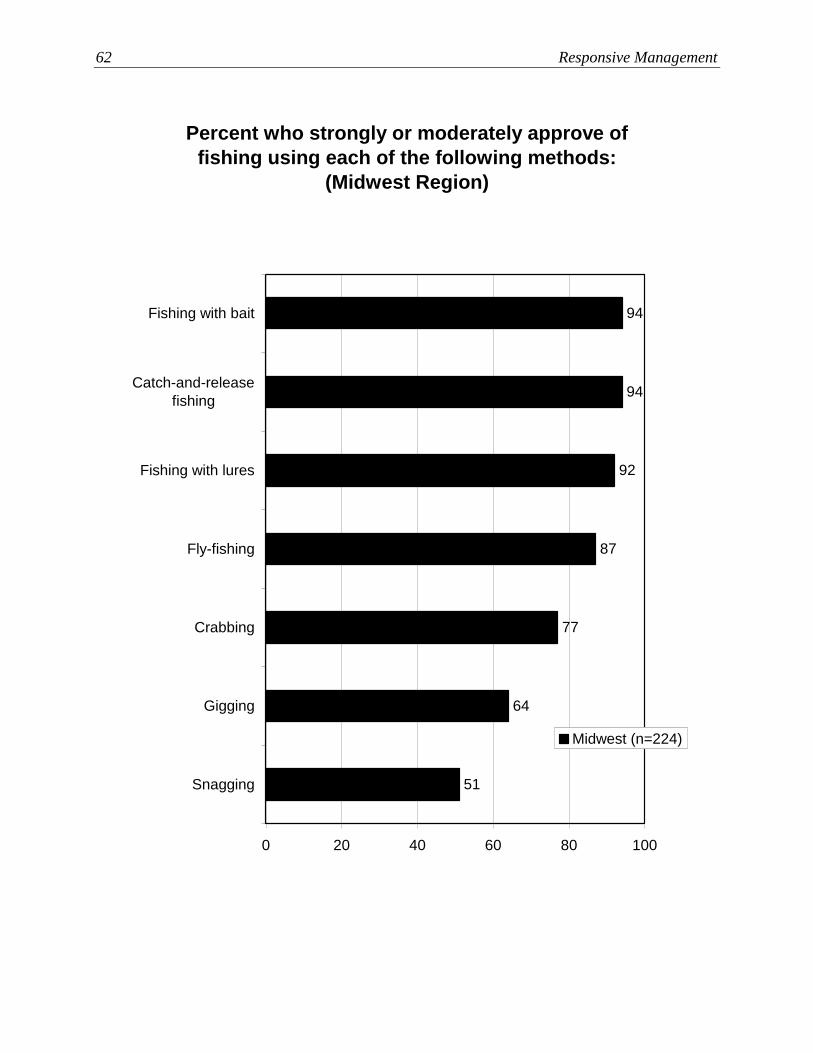
62 Responsive Management
Percent who strongly or moderately approve of
fishing using each of the following methods:
(Midwest Region)
51
94
94
92
87
77
64
0 20 40 60 80 100
Fishing with bait
Catch-and-release
fishing
Fishing with lures
Fly-fishing
Crabbing
Gigging
Snagging
Midwest (n=224)
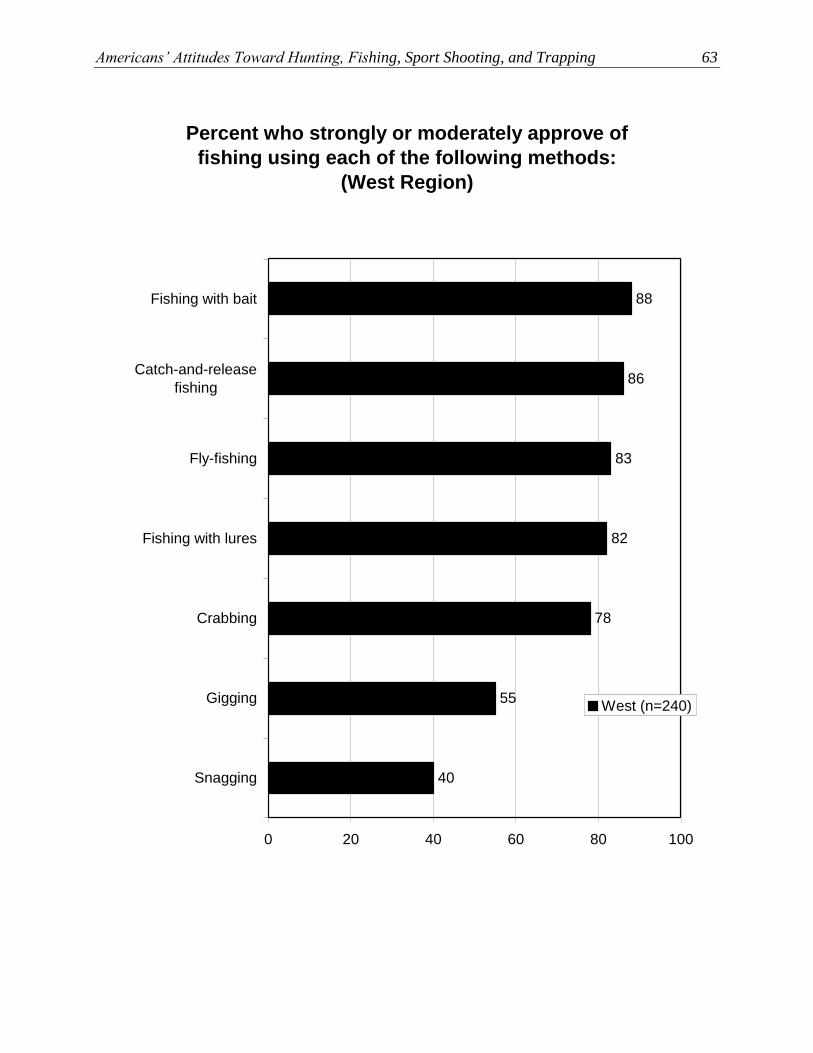
Americans’ Attitudes Toward Hunting, Fishing, Sport Shooting, and Trapping 63
Percent who strongly or moderately approve of
fishing using each of the following methods:
(West Region)
40
88
86
83
82
78
55
0 20 40 60 80 100
Fishing with bait
Catch-and-release
fishing
Fly-fishing
Fishing with lures
Crabbing
Gigging
Snagging
West (n=240)
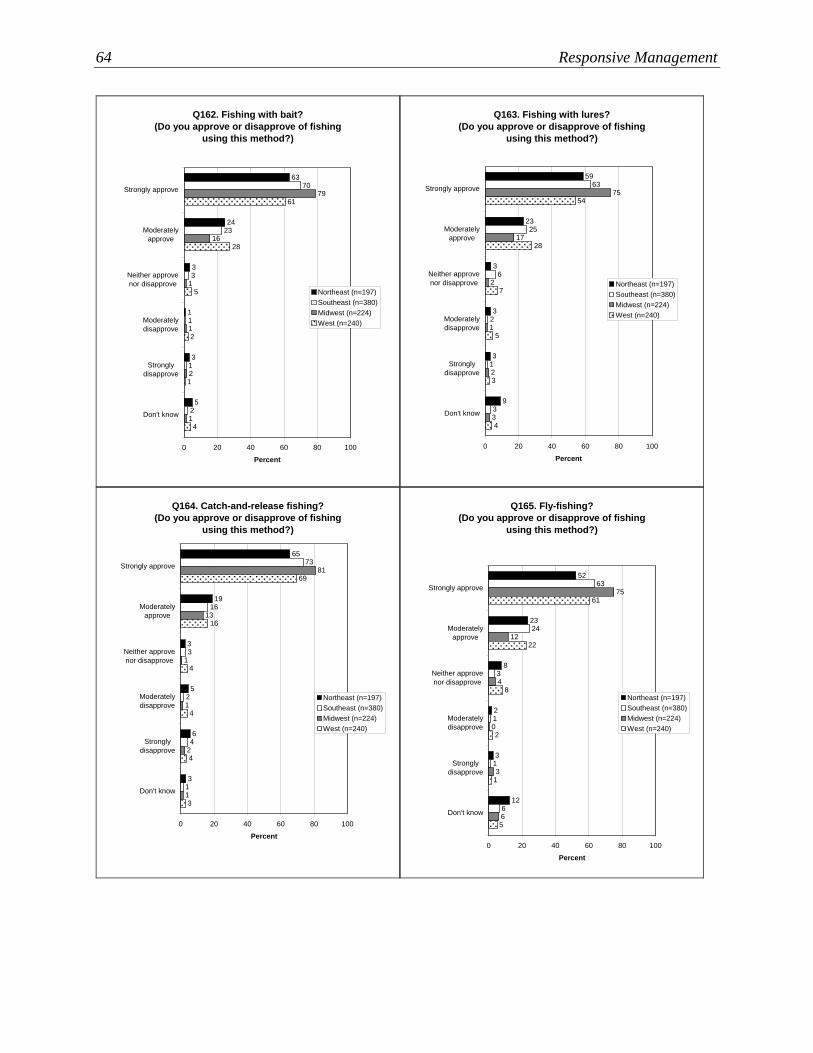
64 Responsive Management
Q162. Fishing with bait?
(Do you approve or disapprove of fishing
using this method?)
63
24
3
1
3
52
1
1
3
23
70
1
2
1
79
16
1
4
1
2
61
28
5
0 20 40 60 80 100
Strongly approve
Moderately
approve
Neither approve
nor disapprove
Moderately
disapprove
Strongly
disapprove
Don't know
Percent
Northeast (n=197)
Southeast (n=380)
Midwest (n=224)
West (n=240)
Q163. Fishing with lures?
(Do you approve or disapprove of fishing
using this method?)
59
23
3
3
3
93
1
2
6
25
63
3
2
1
75
17
2
4
3
5
54
28
7
0 20 40 60 80 100
Strongly approve
Moderately
approve
Neither approve
nor disapprove
Moderately
disapprove
Strongly
disapprove
Don't know
Percent
Northeast (n=197)
Southeast (n=380)
Midwest (n=224)
West (n=240)
Q164. Catch-and-release fishing?
(Do you approve or disapprove of fishing
using this method?)
65
19
3
5
6
31
4
2
3
16
73
1
2
1
81
13
1
3
4
4
69
16
4
0 20 40 60 80 100
Strongly approve
Moderately
approve
Neither approve
nor disapprove
Moderately
disapprove
Strongly
disapprove
Don't know
Percent
Northeast (n=197)
Southeast (n=380)
Midwest (n=224)
West (n=240)
Q165. Fly-fishing?
(Do you approve or disapprove of fishing
using this method?)
52
23
8
2
3
126
1
1
3
24
63
6
3
0
75
12
4
5
1
2
61
22
8
0 20 40 60 80 100
Strongly approve
Moderately
approve
Neither approve
nor disapprove
Moderately
disapprove
Strongly
disapprove
Don't know
Percent
Northeast (n=197)
Southeast (n=380)
Midwest (n=224)
West (n=240)
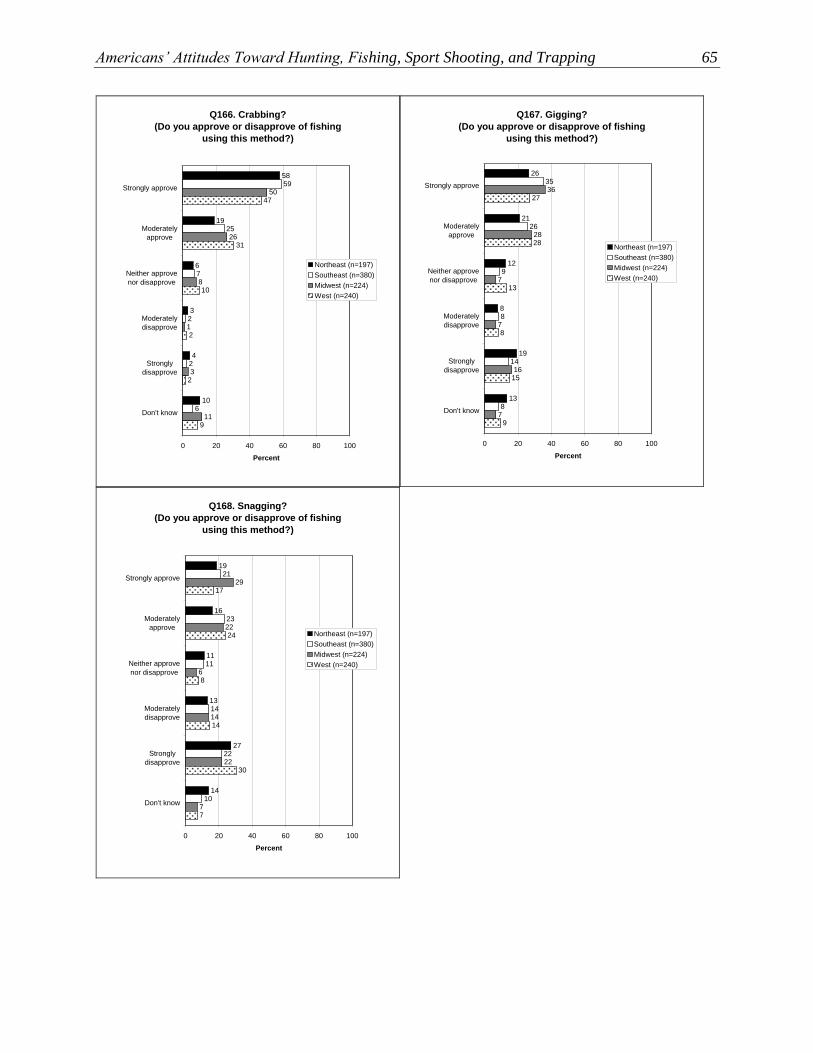
Americans’ Attitudes Toward Hunting, Fishing, Sport Shooting, and Trapping 65
Q166. Crabbing?
(Do you approve or disapprove of fishing
using this method?)
58
19
6
3
4
106
2
2
7
25
59
11
3
1
50
26
8
9
2
2
47
31
10
0 20 40 60 80 100
Strongly approve
Moderately
approve
Neither approve
nor disapprove
Moderately
disapprove
Strongly
disapprove
Don't know
Percent
Northeast (n=197)
Southeast (n=380)
Midwest (n=224)
West (n=240)
Q167. Gigging?
(Do you approve or disapprove of fishing
using this method?)
26
21
12
8
19
138
14
8
9
26
35
7
16
7
36
28
7
9
15
8
27
28
13
0 20 40 60 80 100
Strongly approve
Moderately
approve
Neither approve
nor disapprove
Moderately
disapprove
Strongly
disapprove
Don't know
Percent
Northeast (n=197)
Southeast (n=380)
Midwest (n=224)
West (n=240)
Q168. Snagging?
(Do you approve or disapprove of fishing
using this method?)
19
16
11
13
27
1410
22
14
11
23
21
7
22
14
29
22
6
7
30
14
17
24
8
0 20 40 60 80 100
Strongly approve
Moderately
approve
Neither approve
nor disapprove
Moderately
disapprove
Strongly
disapprove
Don't know
Percent
Northeast (n=197)
Southeast (n=380)
Midwest (n=224)
West (n=240)
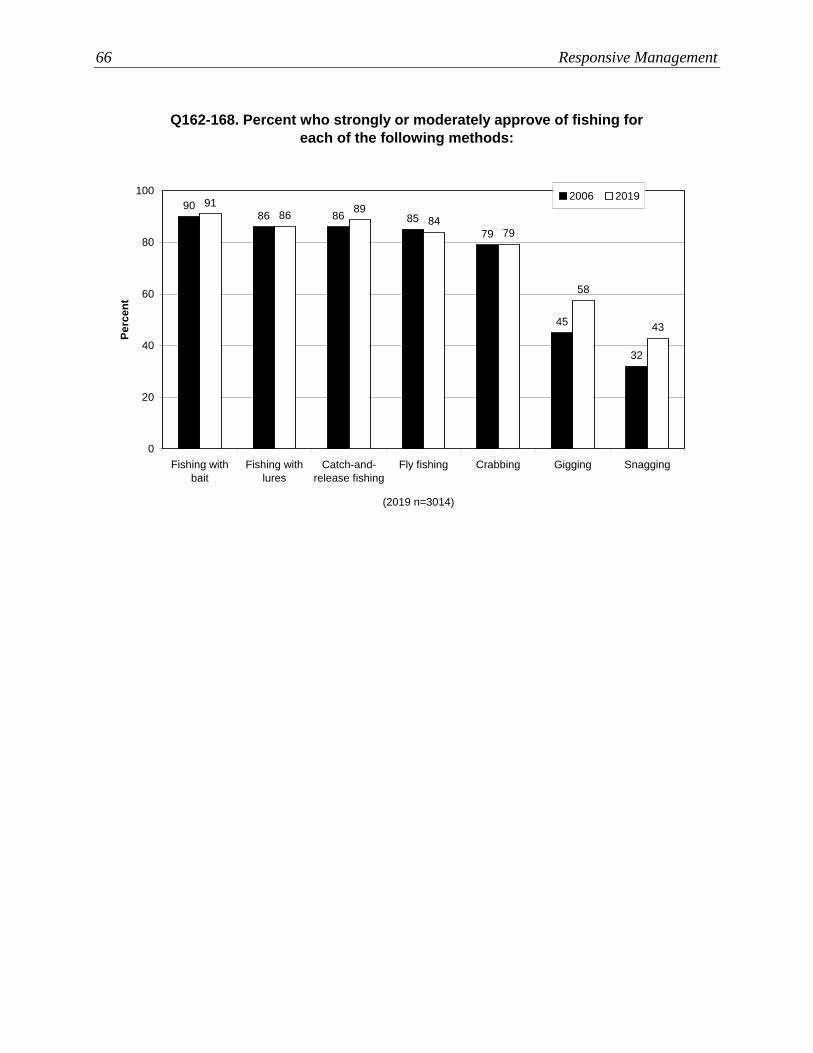
66 Responsive Management
Q162-168. Percent who strongly or moderately approve of fishing for
each of the following methods:
79
58
4345
79
85868690
32
84
9186
89
0
20
40
60
80
100
Fishing with
bait
Fishing with
lures
Catch-and-
release fishing
Fly fishing Crabbing Gigging Snagging
Pe
rce
nt
2006 2019
(2019 n=3014)
Americans’ Attitudes Toward Hunting, Fishing, Sport Shooting, and Trapping 67
ATTITUDES TOWARD SPORT SHOOTING IN THE UNITED STATES
➢ Overall, 81% of Americans approve of legal recreational shooting, compared to 12% who
disapprove.
• As with hunting and fishing, approval is highest in the Midwest and lowest in the
Northeast.
• This approval rate is consistent with the 2016 survey.
o Groups most commonly associated with approval of sport shooting are hunters and
anglers, those who grew up with a family that owned firearms, those who live in rural
areas, white residents, and male residents. At the opposite end, the groups most
commonly associated with disapproval of shooting are black residents, those who did
not grow up with a family that owned firearms, Northeast region residents, Hispanic
residents, and female residents.
➢ The survey also asked respondents to select a statement that best reflects their opinion of
recreational shooting sports. The three statements and the percentages who selected each are
as follows:
• Shooting sports are perfectly acceptable. (65%)
• Shooting sports are OK, but maybe a little inappropriate now. (23%)
• Shooting sports are inappropriate nowadays. (9%)
o Residents of the Midwest and Southeast regions are the most likely to say shooting
sports are perfectly acceptable, whereas those in the Northeast are the least likely to
say this.
o These results are consistent with the findings from 2011.
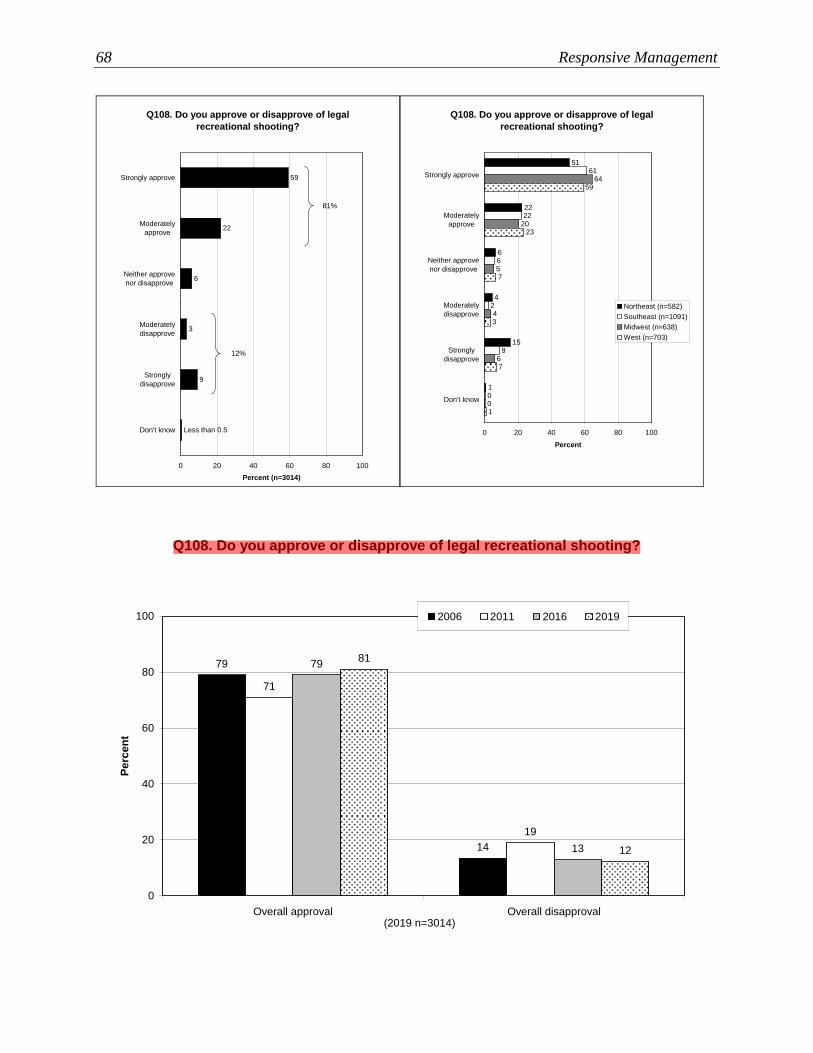
68 Responsive Management
Q108. Do you approve or disapprove of legal
recreational shooting?
59
22
6
3
9
Less than 0.5
0 20 40 60 80 100
Strongly approve
Moderately
approve
Neither approve
nor disapprove
Moderately
disapprove
Strongly
disapprove
Don't know
Percent (n=3014)
81%
12%
Q108. Do you approve or disapprove of legal
recreational shooting?
51
22
6
4
15
10
9
2
6
22
61
0
6
4
64
20
5
1
7
3
59
23
7
0 20 40 60 80 100
Strongly approve
Moderately
approve
Neither approve
nor disapprove
Moderately
disapprove
Strongly
disapprove
Don't know
Percent
Northeast (n=582)
Southeast (n=1091)
Midwest (n=638)
West (n=703)
Q108. Do you approve or disapprove of legal recreational shooting?
14
79
71
19
13
79
12
81
0
20
40
60
80
100
Overall approval Overall disapproval
Pe
rce
nt
2006 2011 2016 2019
(2019 n=3014)
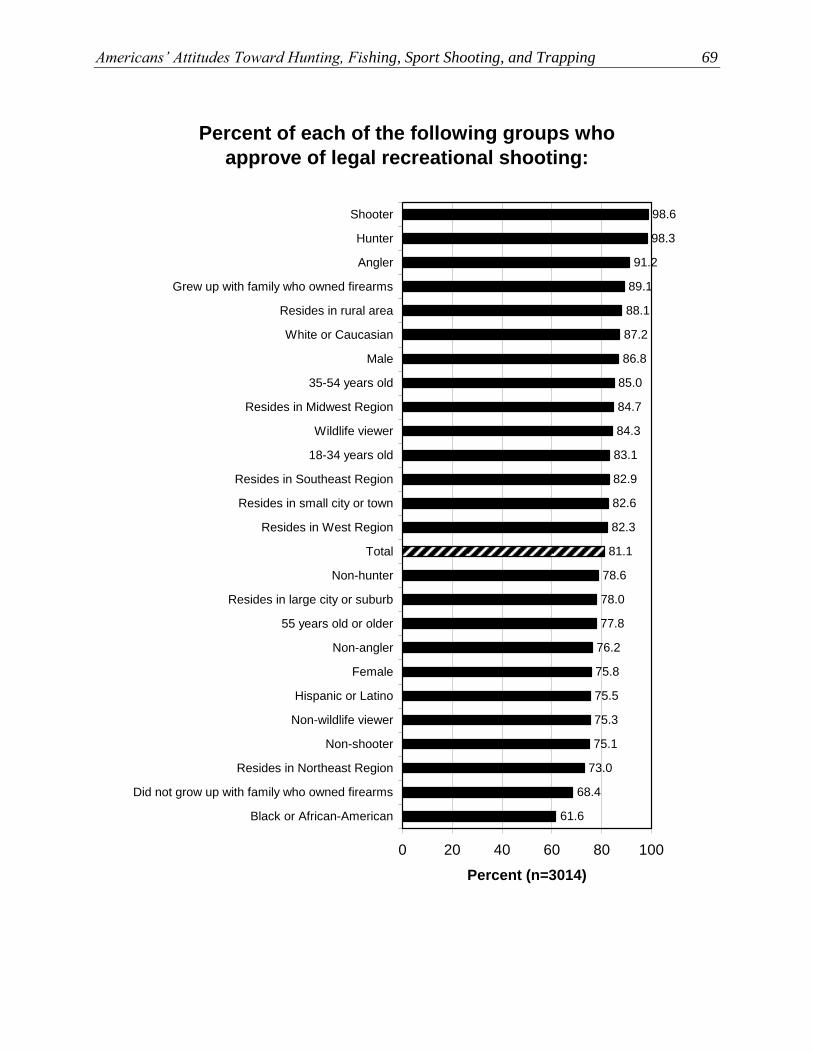
Americans’ Attitudes Toward Hunting, Fishing, Sport Shooting, and Trapping 69
Percent of each of the following groups who
approve of legal recreational shooting:
78.6
78.0
77.8
76.2
75.8
75.5
75.3
75.1
73.0
68.4
61.6
84.7
85.0
86.8
98.6
98.3
91.2
89.1
88.1
87.2
84.3
83.1
82.9
82.6
82.3
81.1
0 20 40 60 80 100
Shooter
Hunter
Angler
Grew up with family who owned firearms
Resides in rural area
White or Caucasian
Male
35-54 years old
Resides in Midwest Region
Wildlife viewer
18-34 years old
Resides in Southeast Region
Resides in small city or town
Resides in West Region
Total
Non-hunter
Resides in large city or suburb
55 years old or older
Non-angler
Female
Hispanic or Latino
Non-wildlife viewer
Non-shooter
Resides in Northeast Region
Did not grow up with family who owned firearms
Black or African-American
Percent (n=3014)
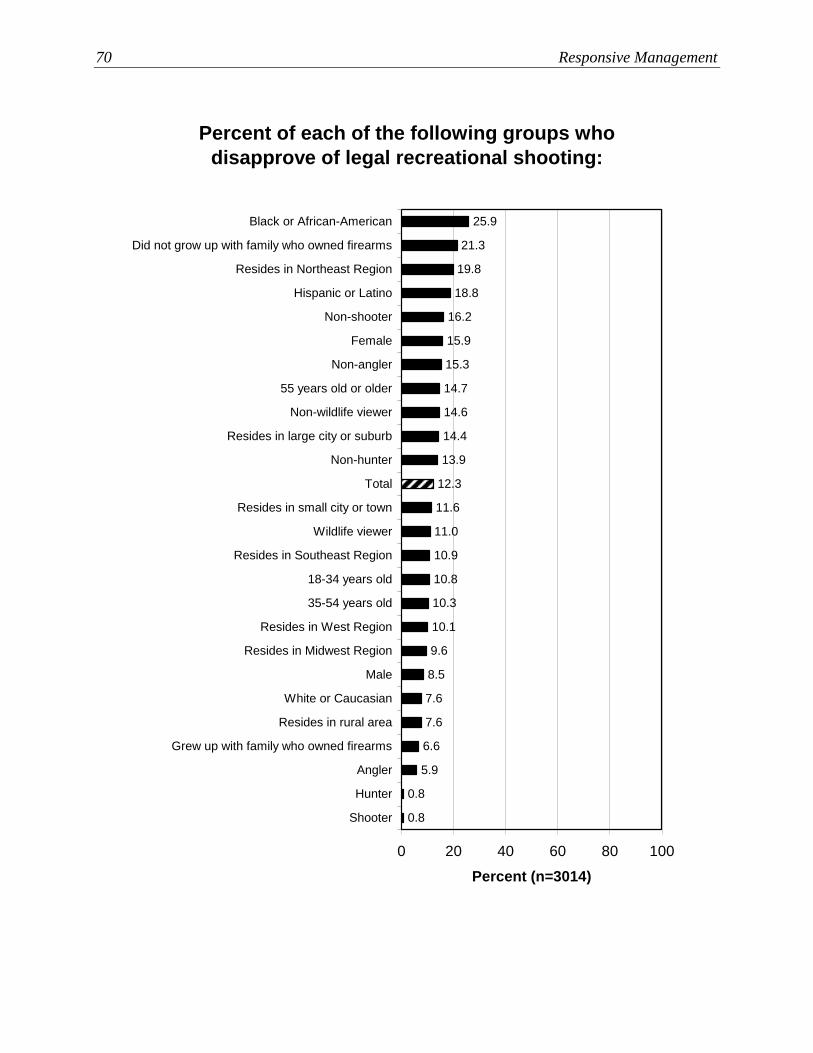
70 Responsive Management
Percent of each of the following groups who
disapprove of legal recreational shooting:
10.8
10.3
10.1
9.6
8.5
7.6
7.6
6.6
5.9
0.8
0.8
14.6
14.7
15.3
25.9
21.3
19.8
18.8
16.2
15.9
14.4
13.9
12.3
11.6
11.0
10.9
0 20 40 60 80 100
Black or African-American
Did not grow up with family who owned firearms
Resides in Northeast Region
Hispanic or Latino
Non-shooter
Female
Non-angler
55 years old or older
Non-wildlife viewer
Resides in large city or suburb
Non-hunter
Total
Resides in small city or town
Wildlife viewer
Resides in Southeast Region
18-34 years old
35-54 years old
Resides in West Region
Resides in Midwest Region
Male
White or Caucasian
Resides in rural area
Grew up with family who owned firearms
Angler
Hunter
Shooter
Percent (n=3014)
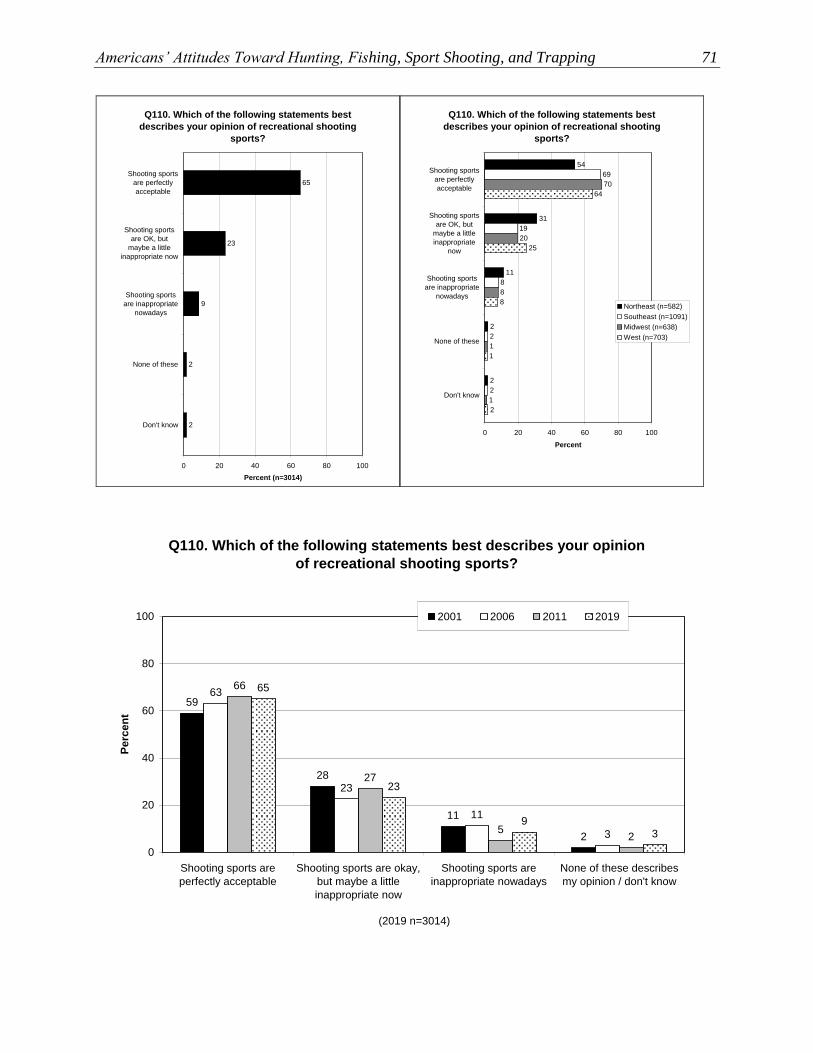
Americans’ Attitudes Toward Hunting, Fishing, Sport Shooting, and Trapping 71
Q110. Which of the following statements best
describes your opinion of recreational shooting
sports?
65
23
9
2
2
0 20 40 60 80 100
Shooting sports
are perfectly
acceptable
Shooting sports
are OK, but
maybe a little
inappropriate now
Shooting sports
are inappropriate
nowadays
None of these
Don't know
Percent (n=3014)
Q110. Which of the following statements best
describes your opinion of recreational shooting
sports?
54
31
11
2
2
2
2
8
19
69
1
1
70
20
8
2
1
64
25
8
0 20 40 60 80 100
Shooting sports
are perfectly
acceptable
Shooting sports
are OK, but
maybe a little
inappropriate
now
Shooting sports
are inappropriate
nowadays
None of these
Don't know
Percent
Northeast (n=582)
Southeast (n=1091)
Midwest (n=638)
West (n=703)
Q110. Which of the following statements best describes your opinion
of recreational shooting sports?
2
11
28
59
3
63
23
11
5
27
66
2 39
23
65
0
20
40
60
80
100
Shooting sports are
perfectly acceptable
Shooting sports are okay,
but maybe a little
inappropriate now
Shooting sports are
inappropriate nowadays
None of these describes
my opinion / don't know
Pe
rce
nt
2001 2006 2011 2019
(2019 n=3014)
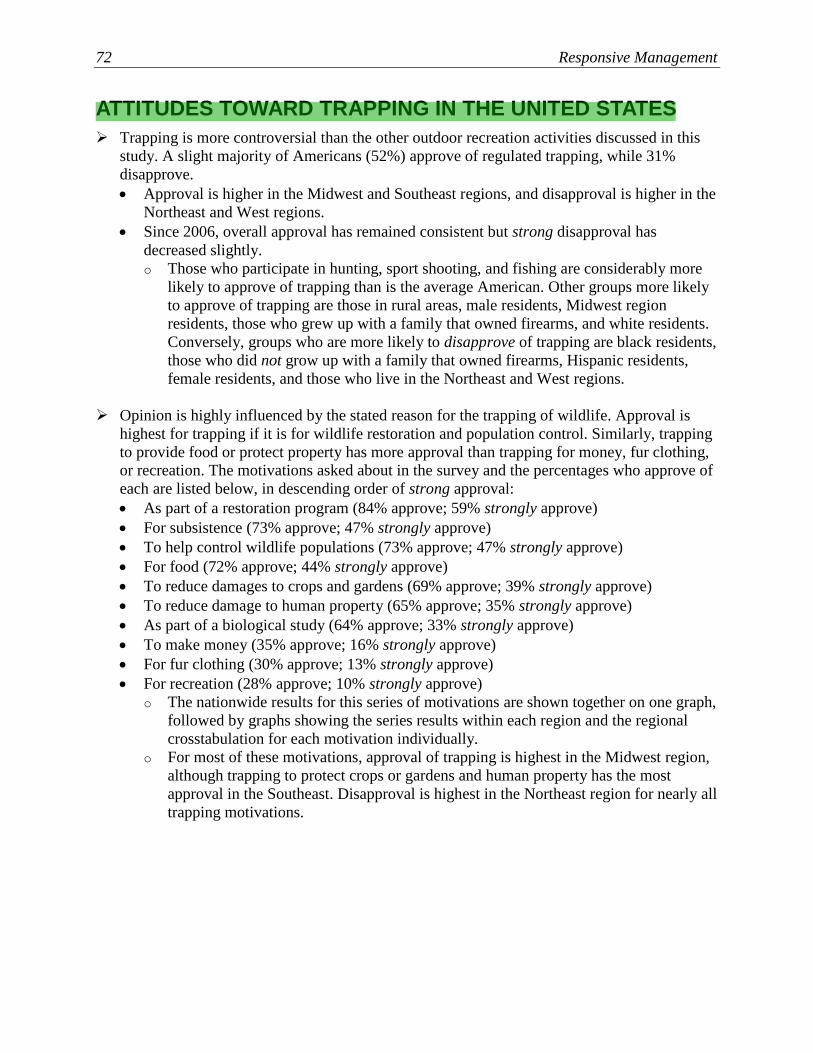
72 Responsive Management
ATTITUDES TOWARD TRAPPING IN THE UNITED STATES
➢ Trapping is more controversial than the other outdoor recreation activities discussed in this
study. A slight majority of Americans (52%) approve of regulated trapping, while 31%
disapprove.
• Approval is higher in the Midwest and Southeast regions, and disapproval is higher in the
Northeast and West regions.
• Since 2006, overall approval has remained consistent but strong disapproval has
decreased slightly.
o Those who participate in hunting, sport shooting, and fishing are considerably more
likely to approve of trapping than is the average American. Other groups more likely
to approve of trapping are those in rural areas, male residents, Midwest region
residents, those who grew up with a family that owned firearms, and white residents.
Conversely, groups who are more likely to disapprove of trapping are black residents,
those who did not grow up with a family that owned firearms, Hispanic residents,
female residents, and those who live in the Northeast and West regions.
➢ Opinion is highly influenced by the stated reason for the trapping of wildlife. Approval is
highest for trapping if it is for wildlife restoration and population control. Similarly, trapping
to provide food or protect property has more approval than trapping for money, fur clothing,
or recreation. The motivations asked about in the survey and the percentages who approve of
each are listed below, in descending order of strong approval:
• As part of a restoration program (84% approve; 59% strongly approve)
• For subsistence (73% approve; 47% strongly approve)
• To help control wildlife populations (73% approve; 47% strongly approve)
• For food (72% approve; 44% strongly approve)
• To reduce damages to crops and gardens (69% approve; 39% strongly approve)
• To reduce damage to human property (65% approve; 35% strongly approve)
• As part of a biological study (64% approve; 33% strongly approve)
• To make money (35% approve; 16% strongly approve)
• For fur clothing (30% approve; 13% strongly approve)
• For recreation (28% approve; 10% strongly approve)
o The nationwide results for this series of motivations are shown together on one graph,
followed by graphs showing the series results within each region and the regional
crosstabulation for each motivation individually.
o For most of these motivations, approval of trapping is highest in the Midwest region,
although trapping to protect crops or gardens and human property has the most
approval in the Southeast. Disapproval is highest in the Northeast region for nearly all
trapping motivations.
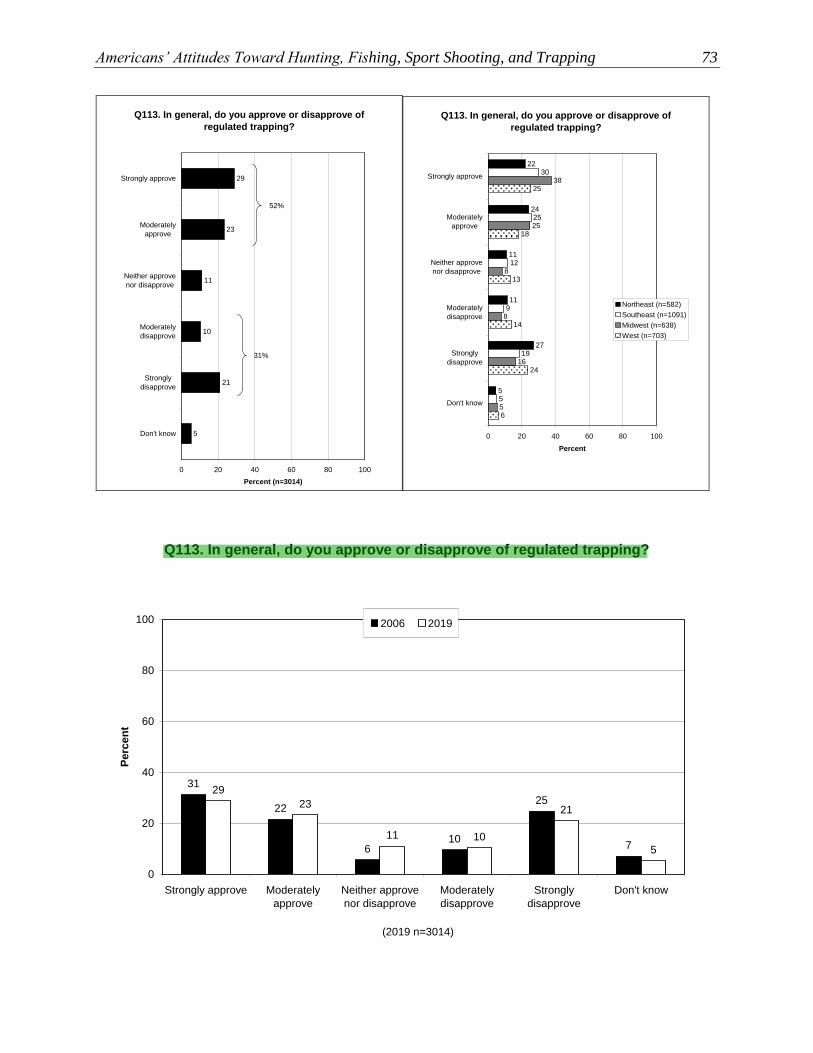
Americans’ Attitudes Toward Hunting, Fishing, Sport Shooting, and Trapping 73
Q113. In general, do you approve or disapprove of
regulated trapping?
29
23
11
10
21
5
0 20 40 60 80 100
Strongly approve
Moderately
approve
Neither approve
nor disapprove
Moderately
disapprove
Strongly
disapprove
Don't know
Percent (n=3014)
52%
31%
Q113. In general, do you approve or disapprove of
regulated trapping?
22
24
11
11
27
55
19
9
12
25
30
5
16
8
38
25
8
6
24
14
25
18
13
0 20 40 60 80 100
Strongly approve
Moderately
approve
Neither approve
nor disapprove
Moderately
disapprove
Strongly
disapprove
Don't know
Percent
Northeast (n=582)
Southeast (n=1091)
Midwest (n=638)
West (n=703)
Q113. In general, do you approve or disapprove of regulated trapping?
21
57
25
106
22
31
10
29
23
11
0
20
40
60
80
100
Strongly approve Moderately
approve
Neither approve
nor disapprove
Moderately
disapprove
Strongly
disapprove
Don't know
Pe
rce
nt
2006 2019
(2019 n=3014)
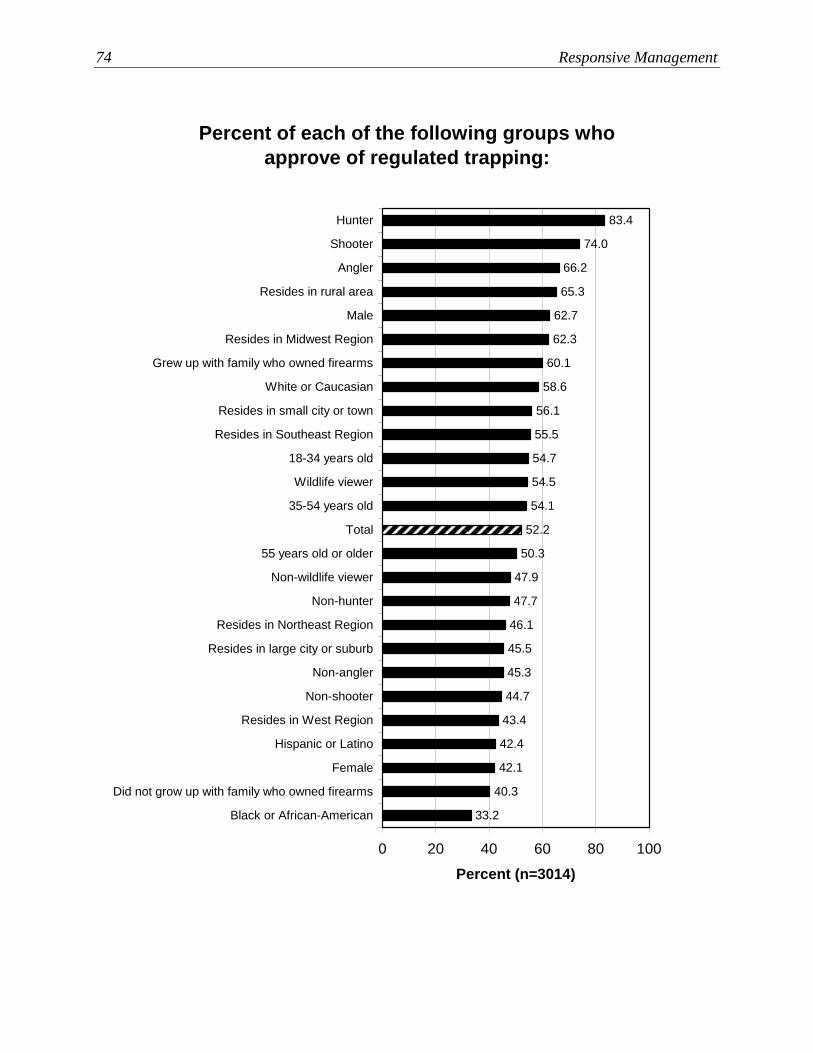
74 Responsive Management
Percent of each of the following groups who
approve of regulated trapping:
47.9
47.7
46.1
45.5
45.3
44.7
43.4
42.4
42.1
40.3
33.2
56.1
58.6
60.1
83.4
74.0
66.2
65.3
62.7
62.3
55.5
54.7
54.5
54.1
52.2
50.3
0 20 40 60 80 100
Hunter
Shooter
Angler
Resides in rural area
Male
Resides in Midwest Region
Grew up with family who owned firearms
White or Caucasian
Resides in small city or town
Resides in Southeast Region
18-34 years old
Wildlife viewer
35-54 years old
Total
55 years old or older
Non-wildlife viewer
Non-hunter
Resides in Northeast Region
Resides in large city or suburb
Non-angler
Non-shooter
Resides in West Region
Hispanic or Latino
Female
Did not grow up with family who owned firearms
Black or African-American
Percent (n=3014)
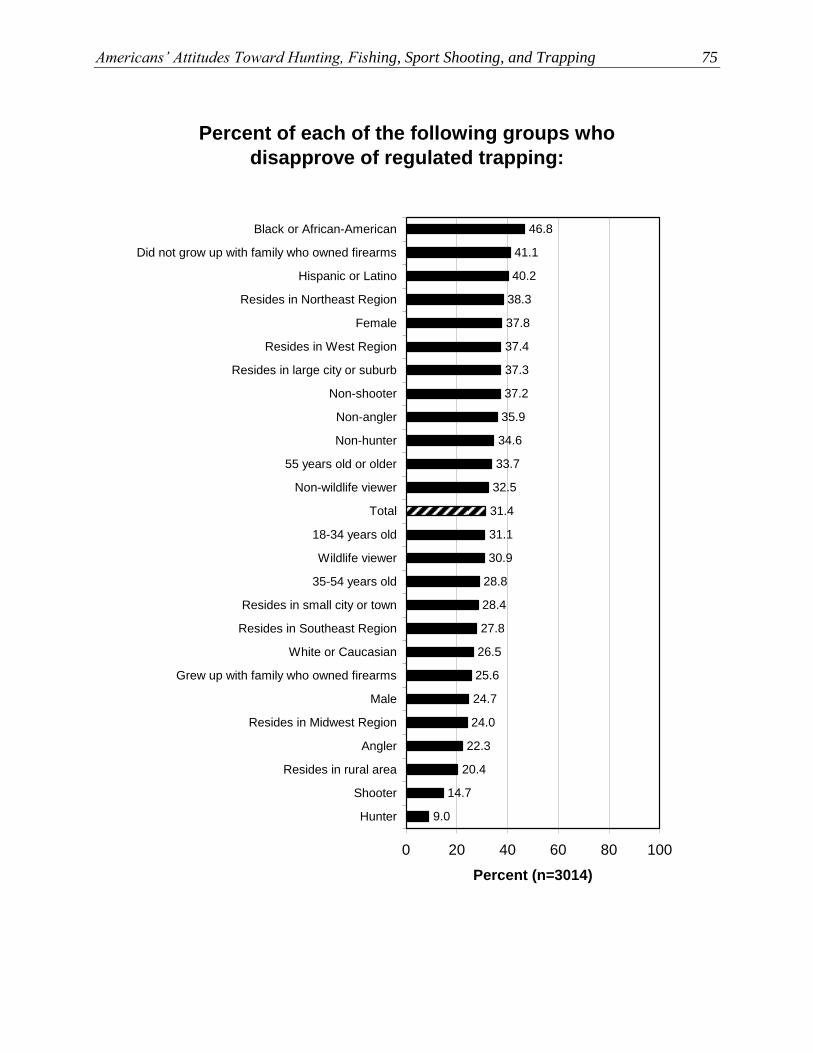
Americans’ Attitudes Toward Hunting, Fishing, Sport Shooting, and Trapping 75
Percent of each of the following groups who
disapprove of regulated trapping:
28.8
28.4
27.8
26.5
25.6
24.7
24.0
22.3
20.4
14.7
9.0
35.9
37.2
37.3
46.8
41.1
40.2
38.3
37.8
37.4
34.6
33.7
32.5
31.4
31.1
30.9
0 20 40 60 80 100
Black or African-American
Did not grow up with family who owned firearms
Hispanic or Latino
Resides in Northeast Region
Female
Resides in West Region
Resides in large city or suburb
Non-shooter
Non-angler
Non-hunter
55 years old or older
Non-wildlife viewer
Total
18-34 years old
Wildlife viewer
35-54 years old
Resides in small city or town
Resides in Southeast Region
White or Caucasian
Grew up with family who owned firearms
Male
Resides in Midwest Region
Angler
Resides in rural area
Shooter
Hunter
Percent (n=3014)
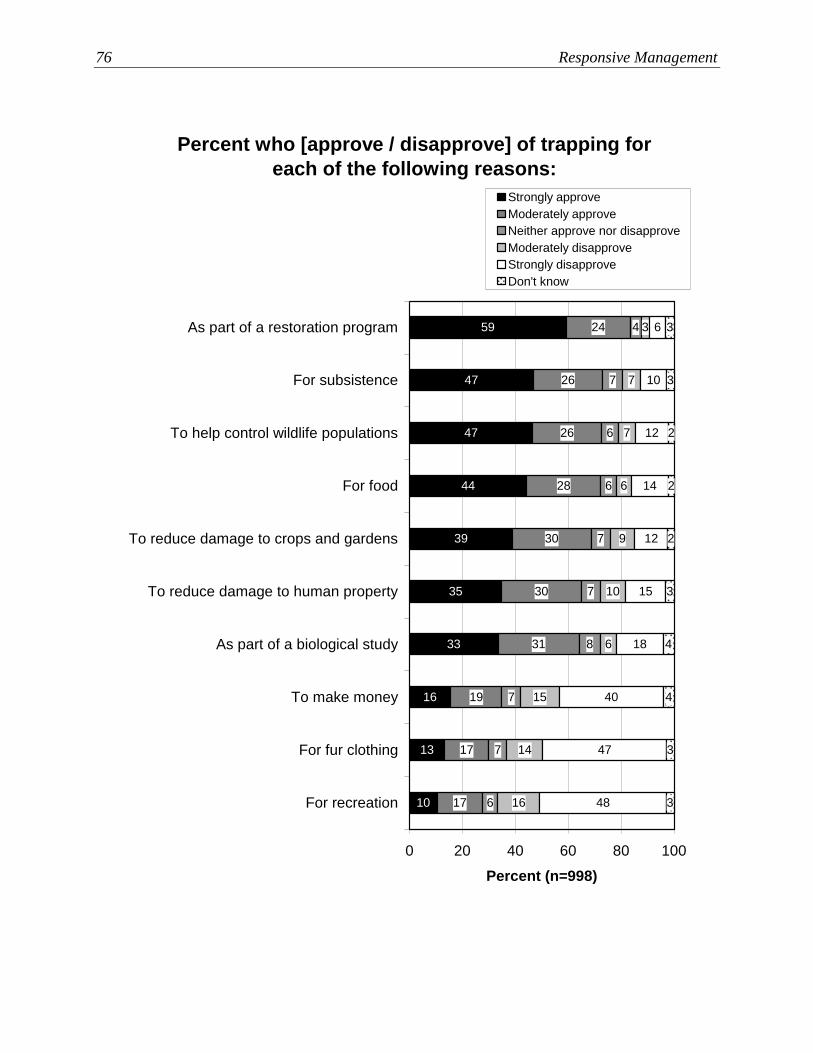
76 Responsive Management
Percent who [approve / disapprove] of trapping for
each of the following reasons:
59
47
47
44
39
35
33
16
13
10
24
26
26
28
30
30
31
19
17
17
4
7
6
6
7
7
8
7
7
6
3
7
7
6
9
10
6
15
14
16
6
10
12
14
12
15
18
40
47
48
3
3
2
2
2
3
4
4
3
3
0 20 40 60 80 100
As part of a restoration program
For subsistence
To help control wildlife populations
For food
To reduce damage to crops and gardens
To reduce damage to human property
As part of a biological study
To make money
For fur clothing
For recreation
Percent (n=998)
Strongly approve
Moderately approve
Neither approve nor disapprove
Moderately disapprove
Strongly disapprove
Don't know
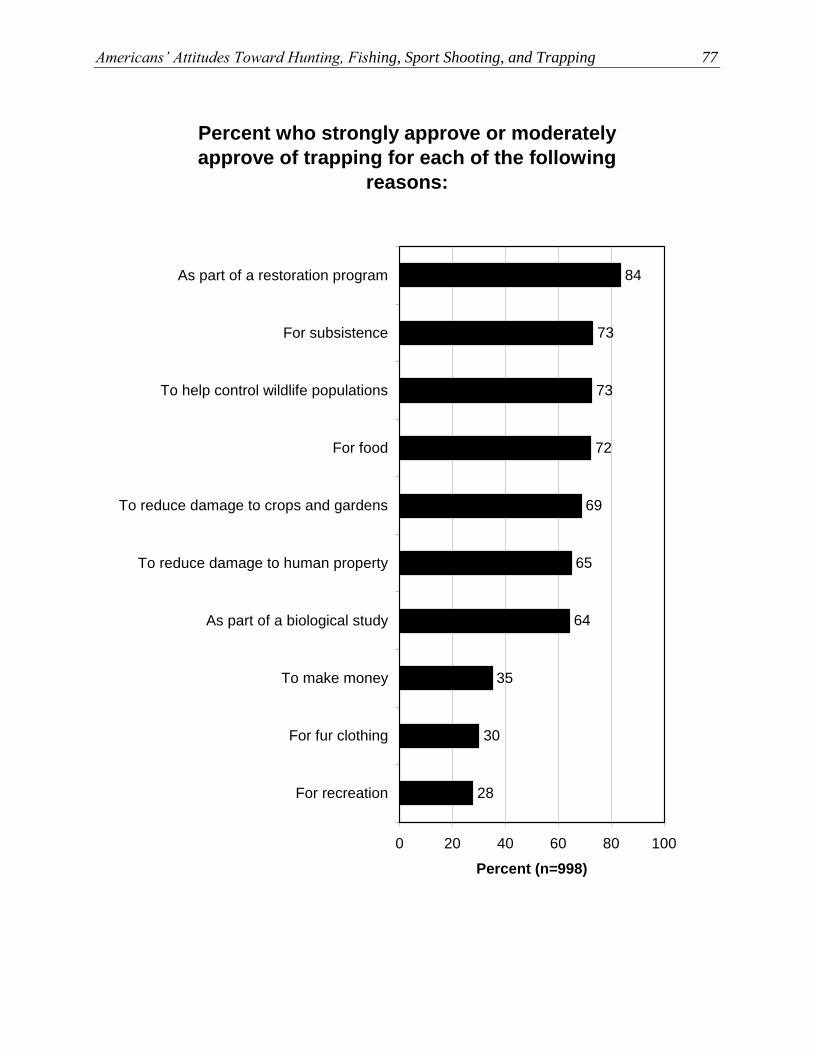
Americans’ Attitudes Toward Hunting, Fishing, Sport Shooting, and Trapping 77
Percent who strongly approve or moderately
approve of trapping for each of the following
reasons:
28
65
69
72
73
73
84
64
35
30
0 20 40 60 80 100
As part of a restoration program
For subsistence
To help control wildlife populations
For food
To reduce damage to crops and gardens
To reduce damage to human property
As part of a biological study
To make money
For fur clothing
For recreation
Percent (n=998)
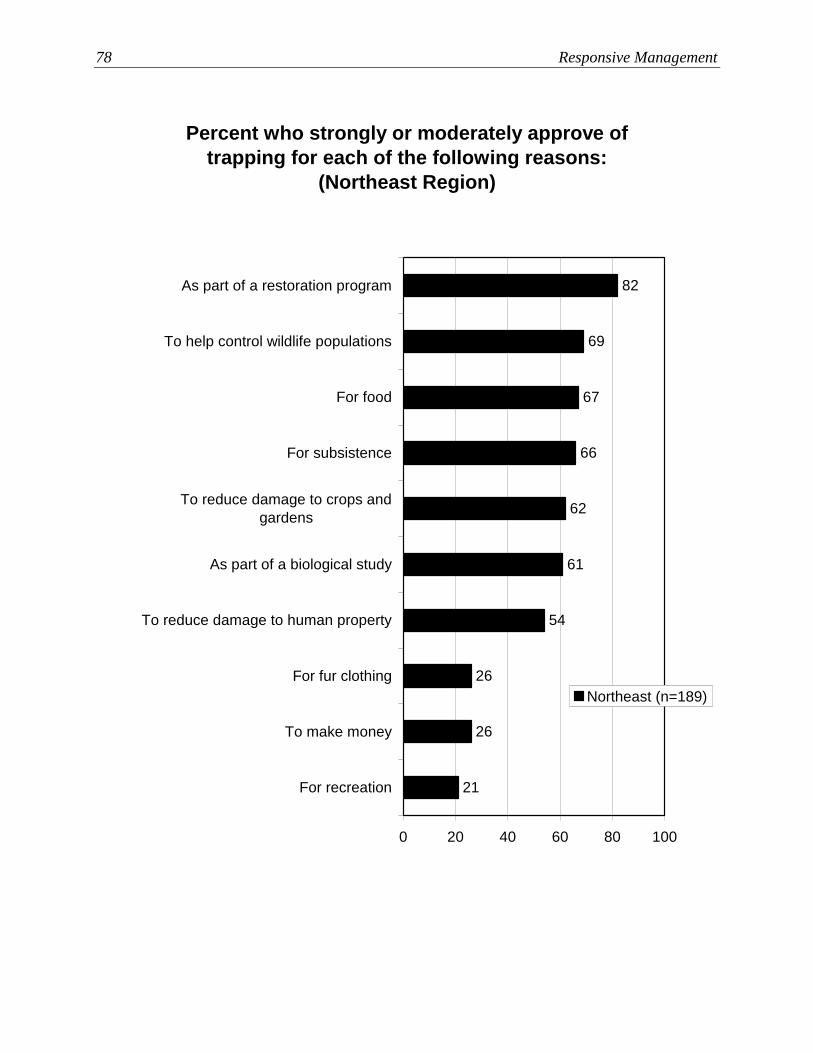
78 Responsive Management
Percent who strongly or moderately approve of
trapping for each of the following reasons:
(Northeast Region)
26
26
54
82
69
67
66
62
61
21
0 20 40 60 80 100
As part of a restoration program
To help control wildlife populations
For food
For subsistence
To reduce damage to crops and
gardens
As part of a biological study
To reduce damage to human property
For fur clothing
To make money
For recreation
Northeast (n=189)
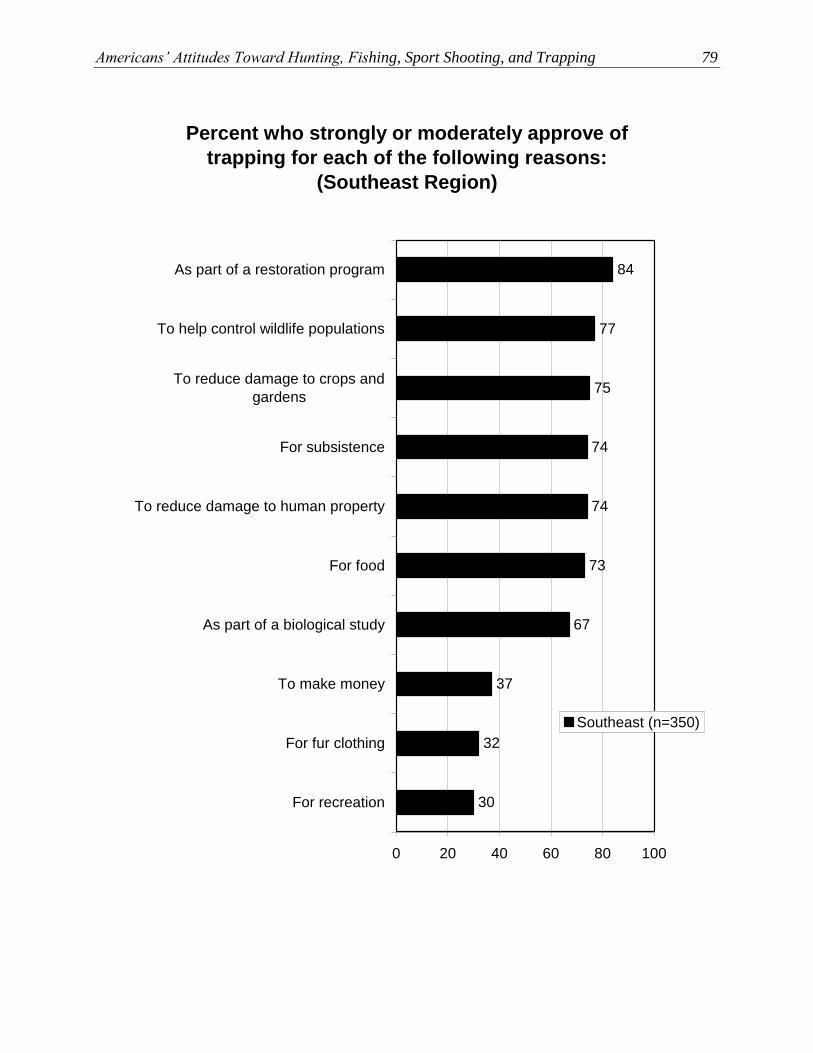
Americans’ Attitudes Toward Hunting, Fishing, Sport Shooting, and Trapping 79
Percent who strongly or moderately approve of
trapping for each of the following reasons:
(Southeast Region)
32
37
67
84
77
75
74
74
73
30
0 20 40 60 80 100
As part of a restoration program
To help control wildlife populations
To reduce damage to crops and
gardens
For subsistence
To reduce damage to human property
For food
As part of a biological study
To make money
For fur clothing
For recreation
Southeast (n=350)
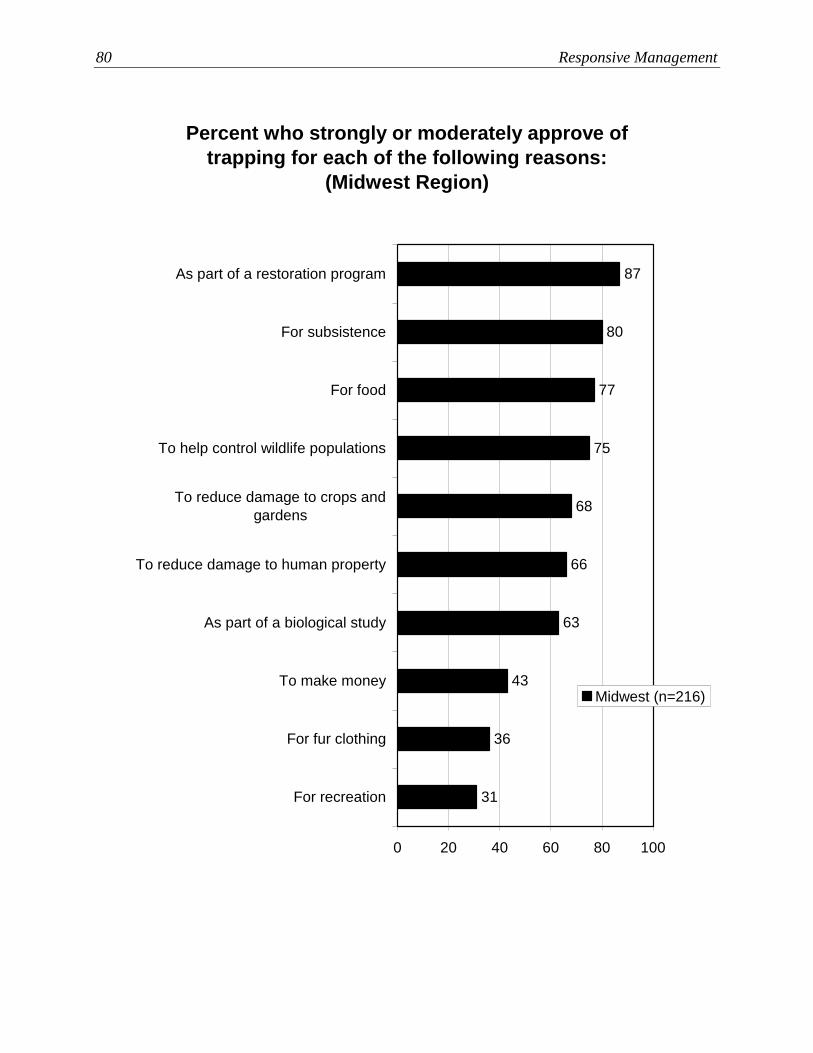
80 Responsive Management
Percent who strongly or moderately approve of
trapping for each of the following reasons:
(Midwest Region)
36
43
63
87
80
77
75
68
66
31
0 20 40 60 80 100
As part of a restoration program
For subsistence
For food
To help control wildlife populations
To reduce damage to crops and
gardens
To reduce damage to human property
As part of a biological study
To make money
For fur clothing
For recreation
Midwest (n=216)
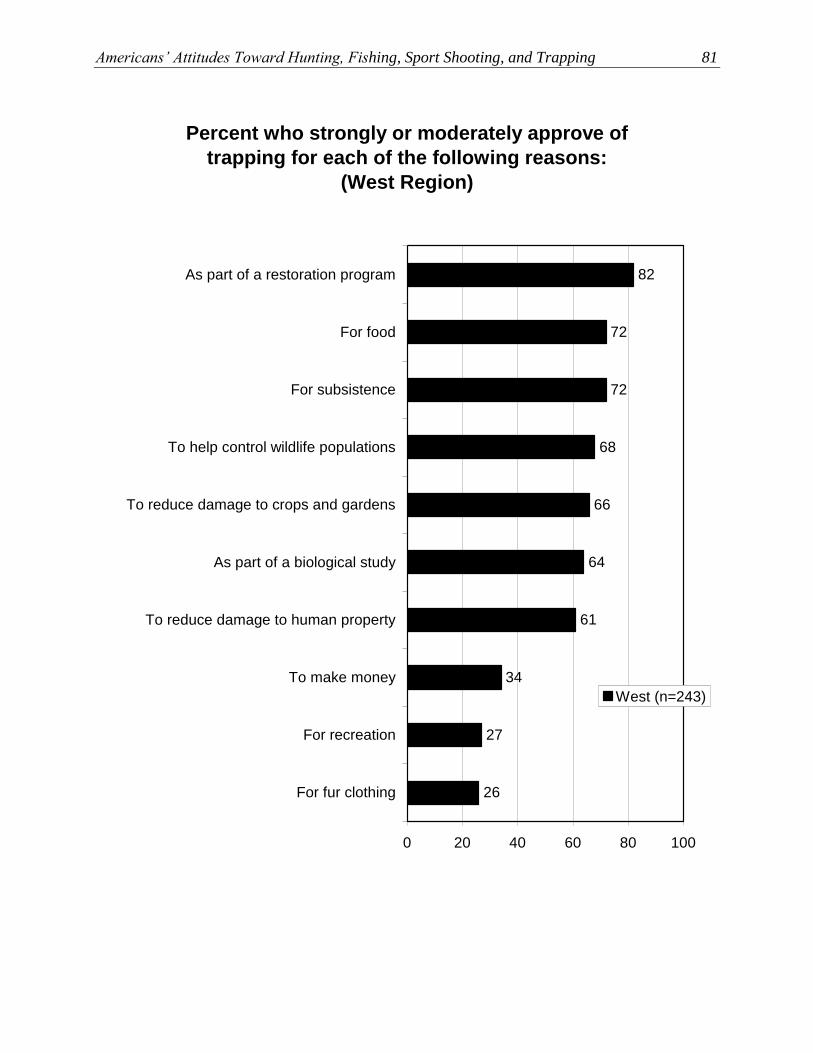
Americans’ Attitudes Toward Hunting, Fishing, Sport Shooting, and Trapping 81
Percent who strongly or moderately approve of
trapping for each of the following reasons:
(West Region)
27
34
61
82
72
72
68
66
64
26
0 20 40 60 80 100
As part of a restoration program
For food
For subsistence
To help control wildlife populations
To reduce damage to crops and gardens
As part of a biological study
To reduce damage to human property
To make money
For recreation
For fur clothing
West (n=243)
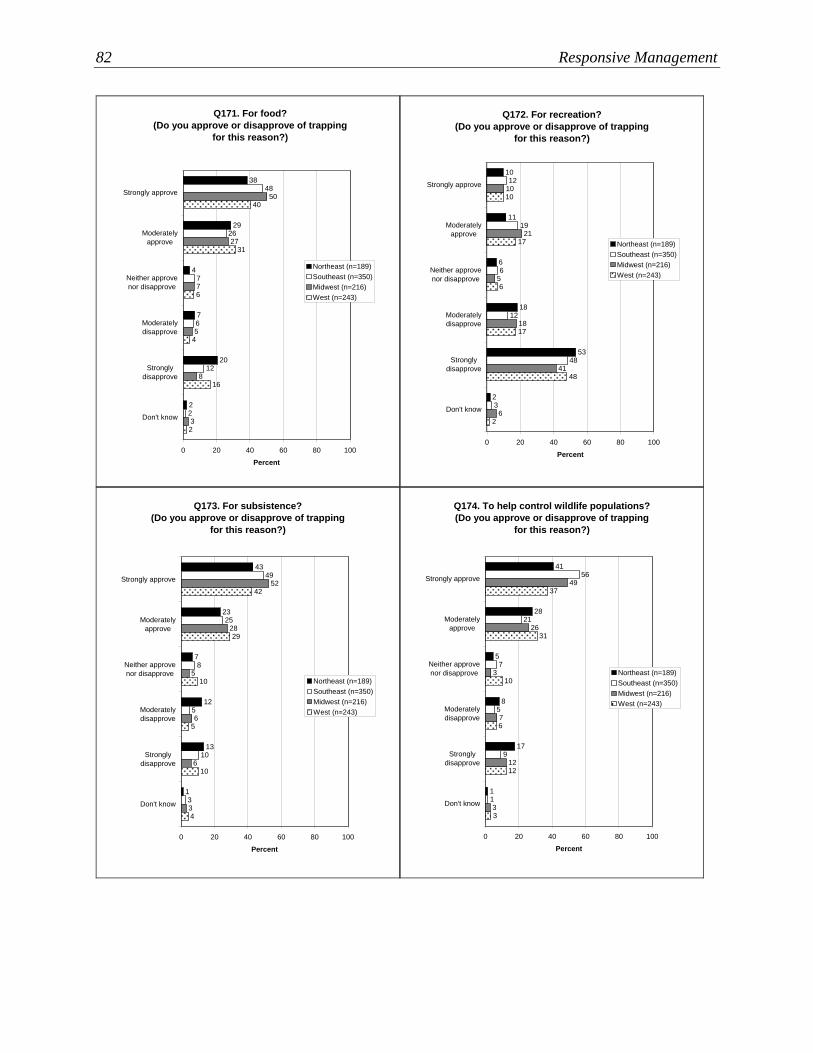
82 Responsive Management
Q171. For food?
(Do you approve or disapprove of trapping
for this reason?)
38
29
4
7
20
22
12
6
7
26
48
3
8
5
50
27
7
2
16
4
40
31
6
0 20 40 60 80 100
Strongly approve
Moderately
approve
Neither approve
nor disapprove
Moderately
disapprove
Strongly
disapprove
Don't know
Percent
Northeast (n=189)
Southeast (n=350)
Midwest (n=216)
West (n=243)
Q172. For recreation?
(Do you approve or disapprove of trapping
for this reason?)
10
11
6
18
53
23
48
12
6
19
12
6
41
18
10
21
5
2
48
17
10
17
6
0 20 40 60 80 100
Strongly approve
Moderately
approve
Neither approve
nor disapprove
Moderately
disapprove
Strongly
disapprove
Don't know
Percent
Northeast (n=189)
Southeast (n=350)
Midwest (n=216)
West (n=243)
Q173. For subsistence?
(Do you approve or disapprove of trapping
for this reason?)
43
23
7
12
13
13
10
5
8
25
49
3
6
6
52
28
5
4
10
5
42
29
10
0 20 40 60 80 100
Strongly approve
Moderately
approve
Neither approve
nor disapprove
Moderately
disapprove
Strongly
disapprove
Don't know
Percent
Northeast (n=189)
Southeast (n=350)
Midwest (n=216)
West (n=243)
Q174. To help control wildlife populations?
(Do you approve or disapprove of trapping
for this reason?)
41
28
5
8
17
11
9
5
7
21
56
3
12
7
49
26
3
3
12
6
37
31
10
0 20 40 60 80 100
Strongly approve
Moderately
approve
Neither approve
nor disapprove
Moderately
disapprove
Strongly
disapprove
Don't know
Percent
Northeast (n=189)
Southeast (n=350)
Midwest (n=216)
West (n=243)
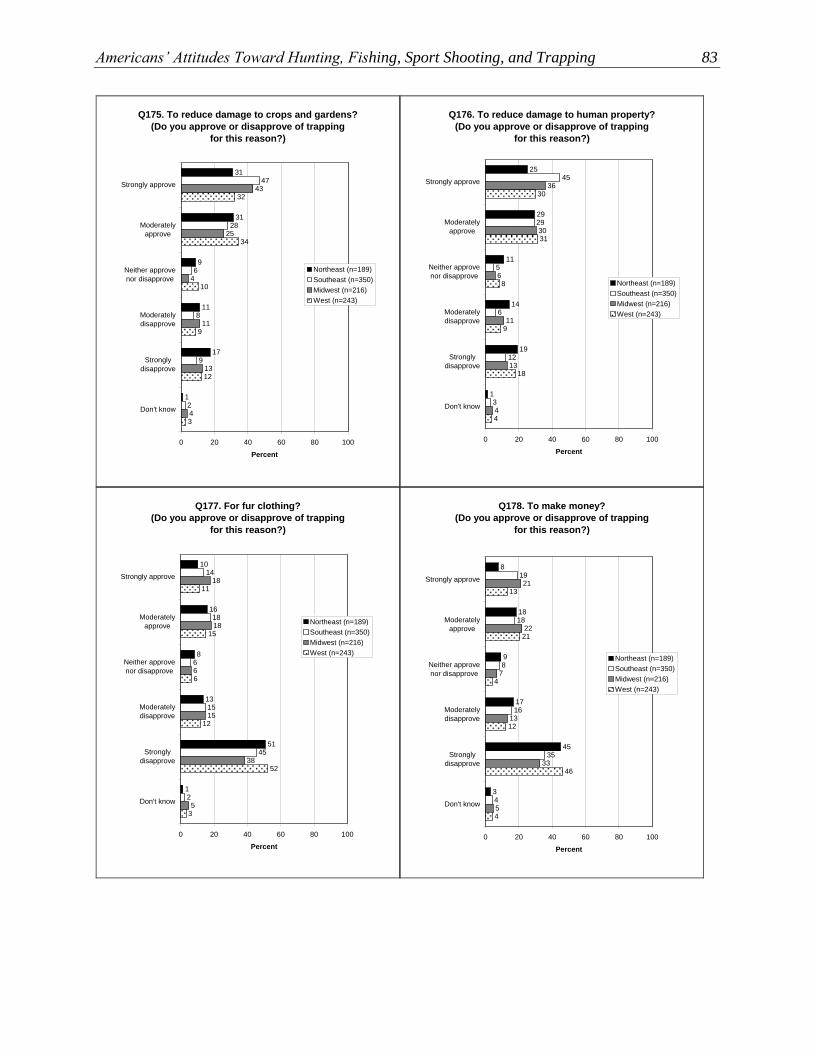
Americans’ Attitudes Toward Hunting, Fishing, Sport Shooting, and Trapping 83
Q175. To reduce damage to crops and gardens?
(Do you approve or disapprove of trapping
for this reason?)
31
31
9
11
17
12
9
8
6
28
47
4
13
11
43
25
4
3
12
9
32
34
10
0 20 40 60 80 100
Strongly approve
Moderately
approve
Neither approve
nor disapprove
Moderately
disapprove
Strongly
disapprove
Don't know
Percent
Northeast (n=189)
Southeast (n=350)
Midwest (n=216)
West (n=243)
Q176. To reduce damage to human property?
(Do you approve or disapprove of trapping
for this reason?)
25
29
11
14
19
13
12
6
5
29
45
4
13
11
36
30
6
4
18
9
30
31
8
0 20 40 60 80 100
Strongly approve
Moderately
approve
Neither approve
nor disapprove
Moderately
disapprove
Strongly
disapprove
Don't know
Percent
Northeast (n=189)
Southeast (n=350)
Midwest (n=216)
West (n=243)
Q177. For fur clothing?
(Do you approve or disapprove of trapping
for this reason?)
10
16
8
13
51
12
45
15
6
18
14
5
38
15
18
18
6
3
52
12
11
15
6
0 20 40 60 80 100
Strongly approve
Moderately
approve
Neither approve
nor disapprove
Moderately
disapprove
Strongly
disapprove
Don't know
Percent
Northeast (n=189)
Southeast (n=350)
Midwest (n=216)
West (n=243)
Q178. To make money?
(Do you approve or disapprove of trapping
for this reason?)
8
18
9
17
45
34
35
16
8
18
19
5
33
13
21
22
7
4
46
12
13
21
4
0 20 40 60 80 100
Strongly approve
Moderately
approve
Neither approve
nor disapprove
Moderately
disapprove
Strongly
disapprove
Don't know
Percent
Northeast (n=189)
Southeast (n=350)
Midwest (n=216)
West (n=243)
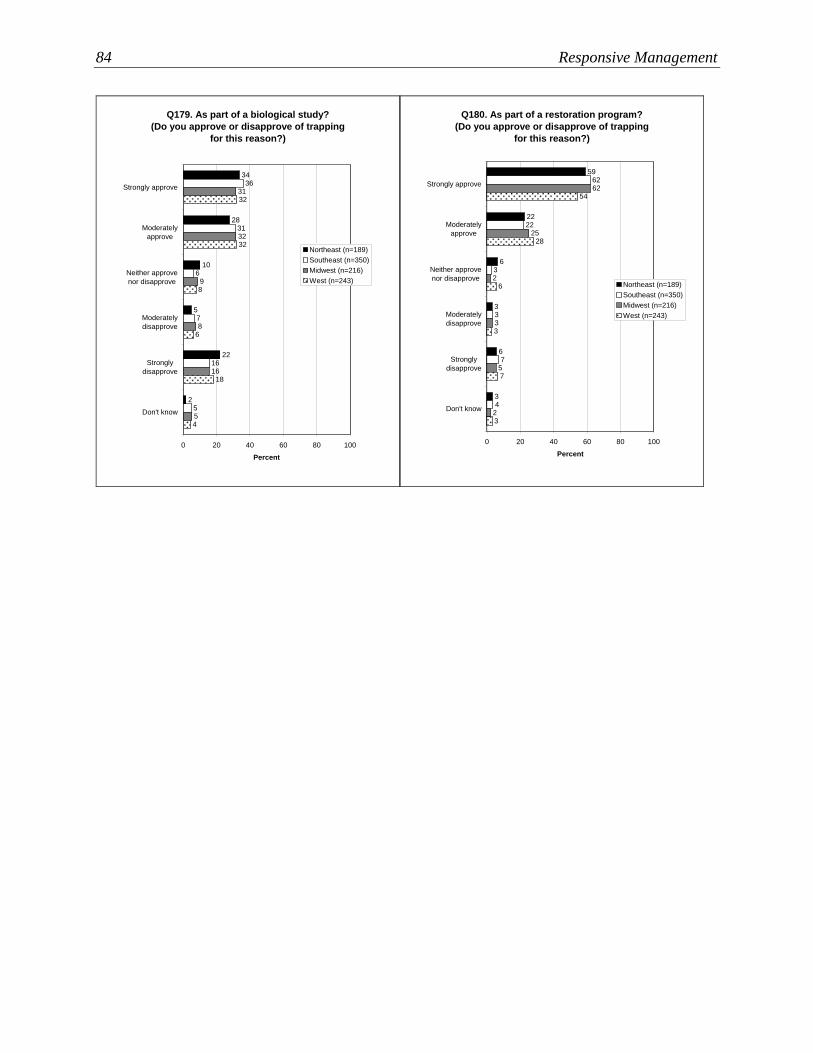
84 Responsive Management
Q179. As part of a biological study?
(Do you approve or disapprove of trapping
for this reason?)
34
28
10
5
22
25
16
7
6
31
36
5
16
8
31
32
9
4
18
6
32
32
8
0 20 40 60 80 100
Strongly approve
Moderately
approve
Neither approve
nor disapprove
Moderately
disapprove
Strongly
disapprove
Don't know
Percent
Northeast (n=189)
Southeast (n=350)
Midwest (n=216)
West (n=243)
Q180. As part of a restoration program?
(Do you approve or disapprove of trapping
for this reason?)
59
22
6
3
6
34
7
3
3
22
62
2
5
3
62
25
2
3
7
3
54
28
6
0 20 40 60 80 100
Strongly approve
Moderately
approve
Neither approve
nor disapprove
Moderately
disapprove
Strongly
disapprove
Don't know
Percent
Northeast (n=189)
Southeast (n=350)
Midwest (n=216)
West (n=243)
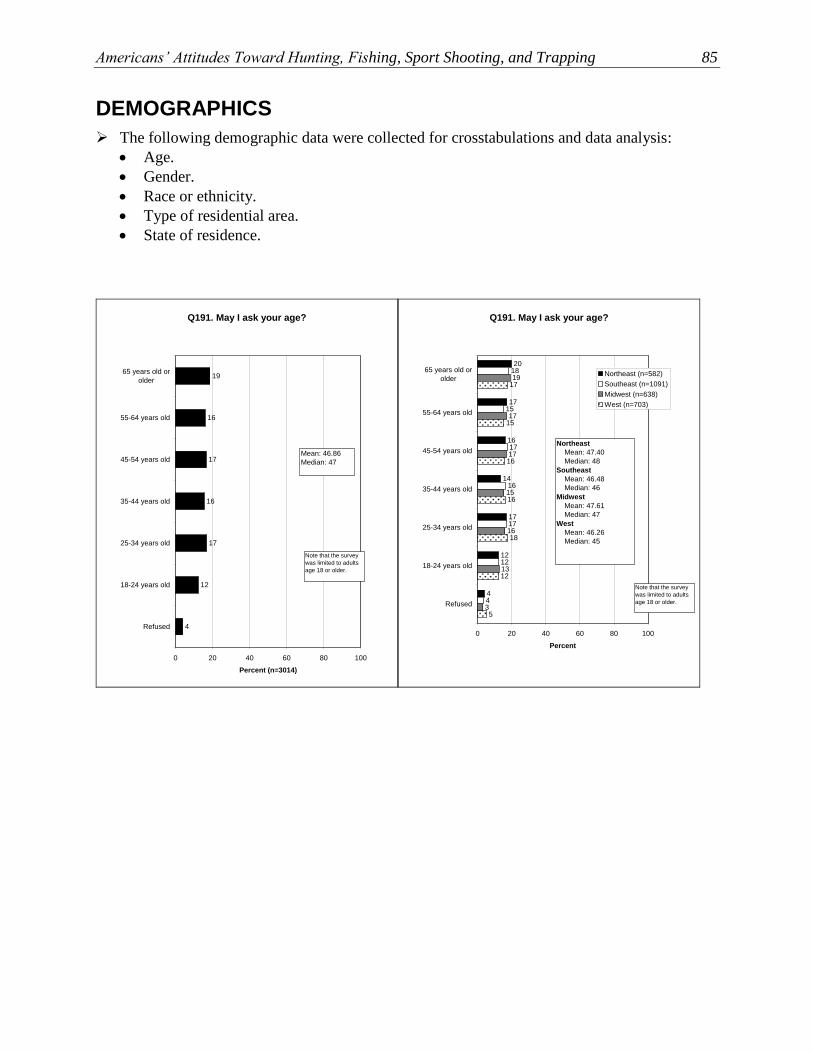
Americans’ Attitudes Toward Hunting, Fishing, Sport Shooting, and Trapping 85
DEMOGRAPHICS
➢ The following demographic data were collected for crosstabulations and data analysis:
• Age.
• Gender.
• Race or ethnicity.
• Type of residential area.
• State of residence.
Q191. May I ask your age?
4
19
16
17
16
17
12
0 20 40 60 80 100
65 years old or
older
55-64 years old
45-54 years old
35-44 years old
25-34 years old
18-24 years old
Refused
Percent (n=3014)
Mean: 46.86
Median: 47
Note that the survey
was limited to adults
age 18 or older.
Q191. May I ask your age?
4
20
17
16
14
17
12
4
12
17
16
17
15
18
3
13
16
15
19
17
17
5
12
18
16
17
15
16
0 20 40 60 80 100
65 years old or
older
55-64 years old
45-54 years old
35-44 years old
25-34 years old
18-24 years old
Refused
Percent
Northeast (n=582)
Southeast (n=1091)
Midwest (n=638)
West (n=703)
Northeast
Mean: 47.40
Median: 48
Southeast
Mean: 46.48
Median: 46
Midwest
Mean: 47.61
Median: 47
West
Mean: 46.26
Median: 45
Note that the survey
was limited to adults
age 18 or older.
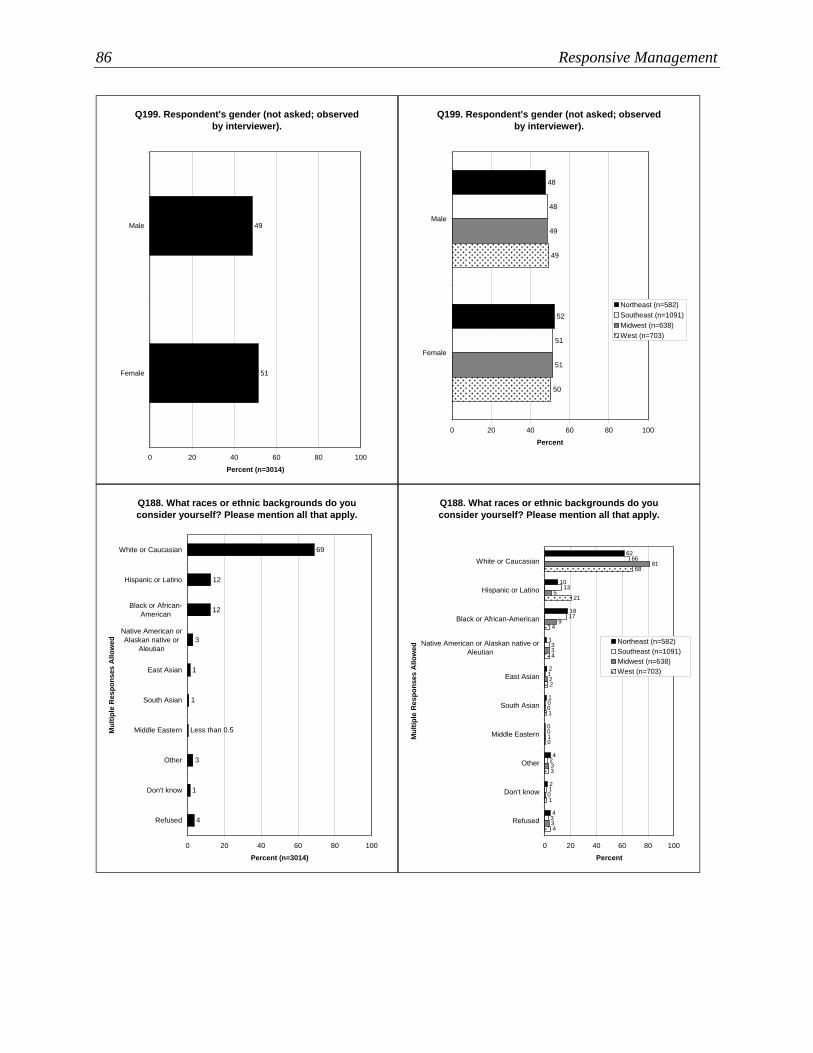
86 Responsive Management
Q199. Respondent's gender (not asked; observed
by interviewer).
49
51
0 20 40 60 80 100
Male
Female
Percent (n=3014)
Q199. Respondent's gender (not asked; observed
by interviewer).
48
52
51
48
49
51
49
50
0 20 40 60 80 100
Male
Female
Percent
Northeast (n=582)
Southeast (n=1091)
Midwest (n=638)
West (n=703)
Q188. What races or ethnic backgrounds do you
consider yourself? Please mention all that apply.
3
1
1
3
1
4
Less than 0.5
69
12
12
0 20 40 60 80 100
White or Caucasian
Hispanic or Latino
Black or African-
American
Native American or
Alaskan native or
Aleutian
East Asian
South Asian
Middle Eastern
Other
Don't know
Refused
Mu
ltip
le R
es
po
nse
s A
llo
we
d
Percent (n=3014)
Q188. What races or ethnic backgrounds do you
consider yourself? Please mention all that apply.
0
0
2
1
3
2
0
1
3
0
3
68
21
4
4
2
1
0
3
1
4
4
1
2
1
18
10
62
0
4
2
17
13
66
3
1
3
81
5
9
0 20 40 60 80 100
White or Caucasian
Hispanic or Latino
Black or African-American
Native American or Alaskan native or
Aleutian
East Asian
South Asian
Middle Eastern
Other
Don't know
Refused
Mu
ltip
le R
es
po
nse
s A
llo
we
d
Percent
Northeast (n=582)
Southeast (n=1091)
Midwest (n=638)
West (n=703)
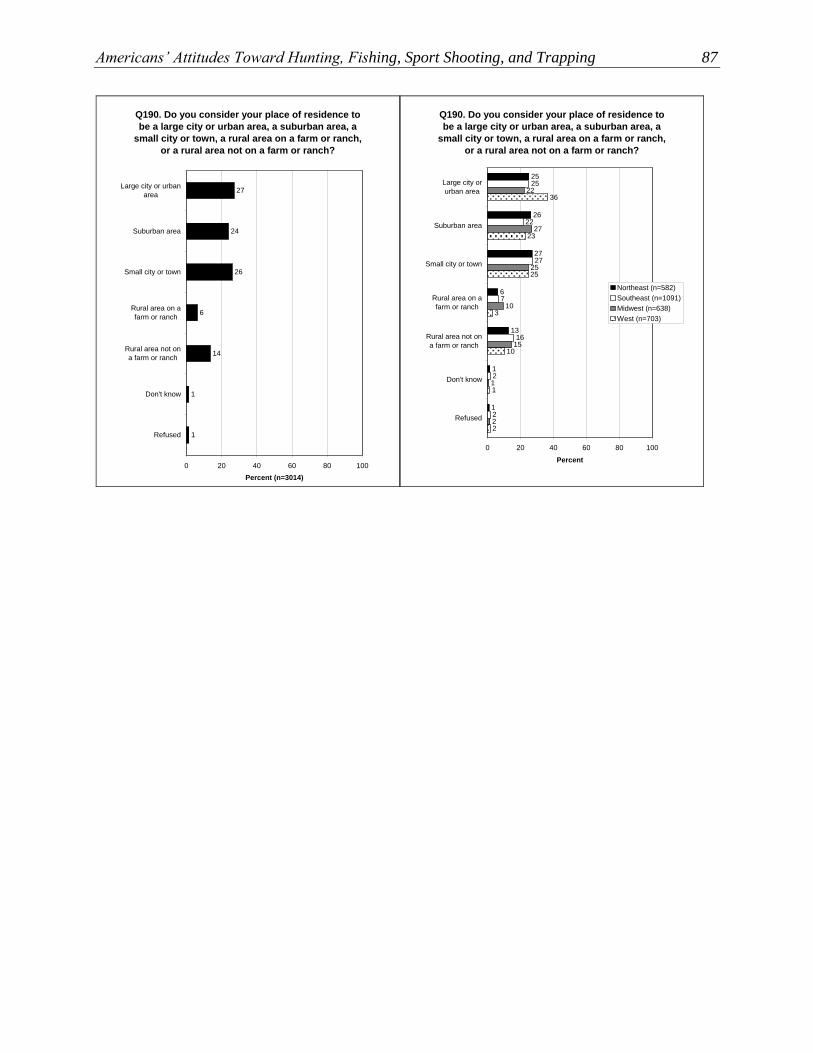
Americans’ Attitudes Toward Hunting, Fishing, Sport Shooting, and Trapping 87
Q190. Do you consider your place of residence to
be a large city or urban area, a suburban area, a
small city or town, a rural area on a farm or ranch,
or a rural area not on a farm or ranch?
1
27
24
26
6
14
1
0 20 40 60 80 100
Large city or urban
area
Suburban area
Small city or town
Rural area on a
farm or ranch
Rural area not on
a farm or ranch
Don't know
Refused
Percent (n=3014)
Q190. Do you consider your place of residence to
be a large city or urban area, a suburban area, a
small city or town, a rural area on a farm or ranch,
or a rural area not on a farm or ranch?
1
25
26
27
6
13
1
2
2
16
7
27
22
25
2
1
15
10
22
27
25
2
1
10
3
36
23
25
0 20 40 60 80 100
Large city or
urban area
Suburban area
Small city or town
Rural area on a
farm or ranch
Rural area not on
a farm or ranch
Don't know
Refused
Percent
Northeast (n=582)
Southeast (n=1091)
Midwest (n=638)
West (n=703)
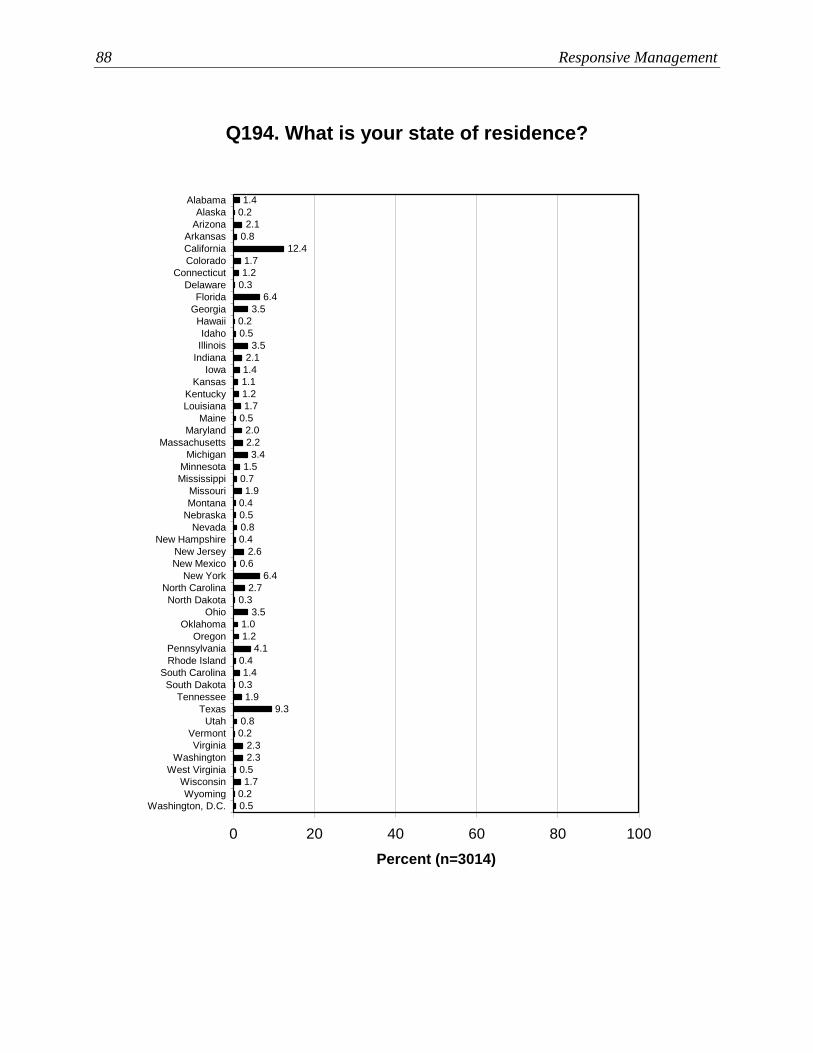
88 Responsive Management
Q194. What is your state of residence?
1.1
1.2
1.7
0.5
2.0
2.2
3.4
1.5
0.7
1.9
0.4
0.5
0.8
0.4
2.6
0.6
6.4
2.7
0.3
3.5
1.0
1.2
4.1
0.4
1.4
0.3
1.9
9.3
0.8
0.2
2.3
2.3
0.5
1.7
0.2
0.5
6.4
0.3
1.2
1.4
0.2
2.1
0.8
12.4
1.7
3.5
0.2
0.5
3.5
2.1
1.4
0 20 40 60 80 100
Alabama
Alaska
Arizona
Arkansas
California
Colorado
Connecticut
Delaware
Florida
Georgia
Hawaii
Idaho
Illinois
Indiana
Iowa
Kansas
Kentucky
Louisiana
Maine
Maryland
Massachusetts
Michigan
Minnesota
Mississippi
Missouri
Montana
Nebraska
Nevada
New Hampshire
New Jersey
New Mexico
New York
North Carolina
North Dakota
Ohio
Oklahoma
Oregon
Pennsylvania
Rhode Island
South Carolina
South Dakota
Tennessee
Texas
Utah
Vermont
Virginia
Washington
West Virginia
Wisconsin
Wyoming
Washington, D.C.
Percent (n=3014)
Americans’ Attitudes Toward Hunting, Fishing, Sport Shooting, and Trapping 89
ABOUT NATIONAL SHOOTING SPORTS FOUNDATIONThe National Shooting Sports Foundation is the trade association for the firearms, ammunition, hunting and recreational shooting sports industry. Our mission is to promote, protect and preserve hunting and the shooting sports. Formed in 1961, NSSF's memberships consists of manufacturers, distributors, firearms retailers, shooting ranges, sportsmen's organizations and publishers. For more information visit www.nssf.org
ABOUT RESPONSIVE MANAGEMENT
Responsive Management is an internationally recognized survey research firm specializing in
attitudes toward natural resource and outdoor recreation issues. Our mission is to help natural
resource and outdoor recreation agencies, businesses, and organizations better understand and
work with their constituents, customers, and the public. responsivemanagement.com

© 2019 National Shooting Sports Foundation, Inc. All Rights Reserved Item #33151 3/19