Embed Size (px)
Citation preview
Cover Design by Prof. (Dr.) Diwakar S. Meshram
Institute of Town Planners, India Journal 12 x 4, October - December 2015
i
Editorial
This issue contains ten papers out of which first paper is jointly authored by Sindhuja Kasthala and Harshit S. Lakra on the theme “Mass Religious Gatherings and Disaster Preparedness: A Planning Perspective”; in which the authors highlights that the influx of millions of people during religious gatherings and pilgrimages create tremendous amount of pressure on their host cities. Taking the specific case studies of mass gatherings of Saudi Arabia’s Hajj pilgrimage in 2006, Cambodia’s water festival in 2010 and India’s Kumbh Mela in 2013, the authors identified the gaps in infrastructure and strategies adopted for the disaster preparedness, to derive future strategies to improve disaster preparedness.
In the second paper on the theme “Pedestrian Flow Characteristics Around Bus Terminal, Dehradun” written by Nand Kishore, Pritikana Das and M. Parida, its is mentioned that Inter State Bus Terminal (ISBT) is one of the places in any city where pedestrians flow experienced is the highest. Taking ISBT Dehradun as case study, it is argued that pedestrian walkway to bus stop partially or fully encroached by daily vendors, and pedestrians are forced to move along with plying vehicles (mixed traffic). The study also elaborates different flow characteristics of pedestrians near ISBT when pedestrian move along with vehicles.
“An Integrated Approach to Plan Development of a Historic City” authored by Anika Kapoor highlights that heritage is an identity of the space, a pride, a reflection of the glorious past and not just the records of the past. This article also examines the current conflict between heritage conservation and urban development. An attempt has also been made to carve out an integrated sustainable approach for the future planning of historic cities.
Dhwani Shah has written the paper on “Transforming Public Transport in Small and Medium Size Cities: A Case of Alwar”, in which it is argued that the development of public transport systems is focussed on large cities whereas for small and medium towns it is neglected. If the growth of private vehicles is reduced by providing a good public transport system at a stage when vehicular density is still low, the problem can be tackled effectively. The paper also focuses on how Alwar, a city in the state of Rajasthan, provided for an Intermediate Public Transport system known as ‘Alwar Vahini’ using an innovative approach.
The focus of the paper on “Inter-relationship between Transport System, Safety and City Sizes Distribution”, written jointly by Mukti Advani, Neelam J. Gupta, Purnima Parida and B. K. Durai, lays emphasis on usage of motorized modes as well as non-motorized modes for any city/area which is the simplest parameter to measure the sustainability of road transport. The paper also attempts to study the inter-relationship among the road network, geography and demographic characteristics of an area/city to understand the usage of motorized and non-motorized transport.
The paper on “Street Modifications: Stimulating Social Gathering”, written by Arunika Sharma, presents the multiple roles of streets as public spaces and element of communication. A methodical approach needs to be followed to impart functions other than transportation, to streets and make them an integral asset of a neighborhood. The paper has also assimilated cases in which streets have been freed from the controls of motorized vehicles and released for social welfare.
Institute of Town Planners, India Journal 12 x 4, October - December 2015
ii
“Slums of Ludhiana: The Need for Housing in the Prevailing Schemes and Programs”, authored by Ankur Prabhakar, examines slums of the city of Ludhiana in Punjab and concludes that a vast majority i.e. 87 percent of the slums are located in residential areas whereas only 12.9 percent slums are located in industrial and commercial areas, and further states that most of the slums are located on private lands and are not eligible for improvement under Government Schemes.
“A Mid Term Review of the Master Plan Delhi - 2021” jointly authored by Kshitij Mehra, Mutum Chaobisana Devi and Pawan Sharma, provides an overview of the process of the Mid-term Review of the Master Plan for Delhi - 2021 after the plan was implemented for a period of five years. The paper provides useful details about the procedures followed in organizing the review exercise, on a large scale.
Kuldip Singh and Arun Kumar Sharma written a paper on the theme “Widening of Roads in Residential Areas in Chandigarh: A Safely Hazard”, argues that the roads in residential areas have to cater for mobility, access and parking of vehicles. The speed of vehicles on roads in residential areas should not be more than 10 km ph from safety considerations. By widening the roads in residential areas with bituminous surface, the speed of vehicles in the lean hours will rise to more than 30 km ph which is not desirable, and advocates for providing of “grass paver blocks” and also suggests to follow the concept of ‘Woonerf”.
“Urban Growth and Road Network Development: Case of Jodhpur” written by Ansuya Tater, emphasis on land use and road network development in the context of Jodhpur. It also highlight the premises of planning and developmental process, pathways of urban accessibility, correlation among various aspects of development as well as its impact on road network and urban growth.
The paper written by M. Palaniappan on the theme - “Peripheral Areas and 74th Constitution Amendment Act, 1992” highlights that the Metropolitan Planning Committees as envisaged in 74th Constitution Amendment Act, 1992 are the democratically elected bodies for the metropolitan areas. These bodies are expected to take into account the linkages between the town and peripheral areas for the formulation of Metropolitan Development Plans and implement the development schemes relating to the subjects set out in the Twelfth Schedule. Therefore, the paper argues that adequate mechanism has already been provided in the 74th Constitution Amendment Act, 1992 for the planning of peripheral areas which can be achieved, provided a political will coupled with administrative acumen, prevails amongst the concerned.
Prof. Ashok Kumar, Ph.D. Editor
Cover Design by Prof. (Dr.) Diwakar S. Meshram
Institute of Town Planners, India Journal 12 x 4, October - December 2015
iii
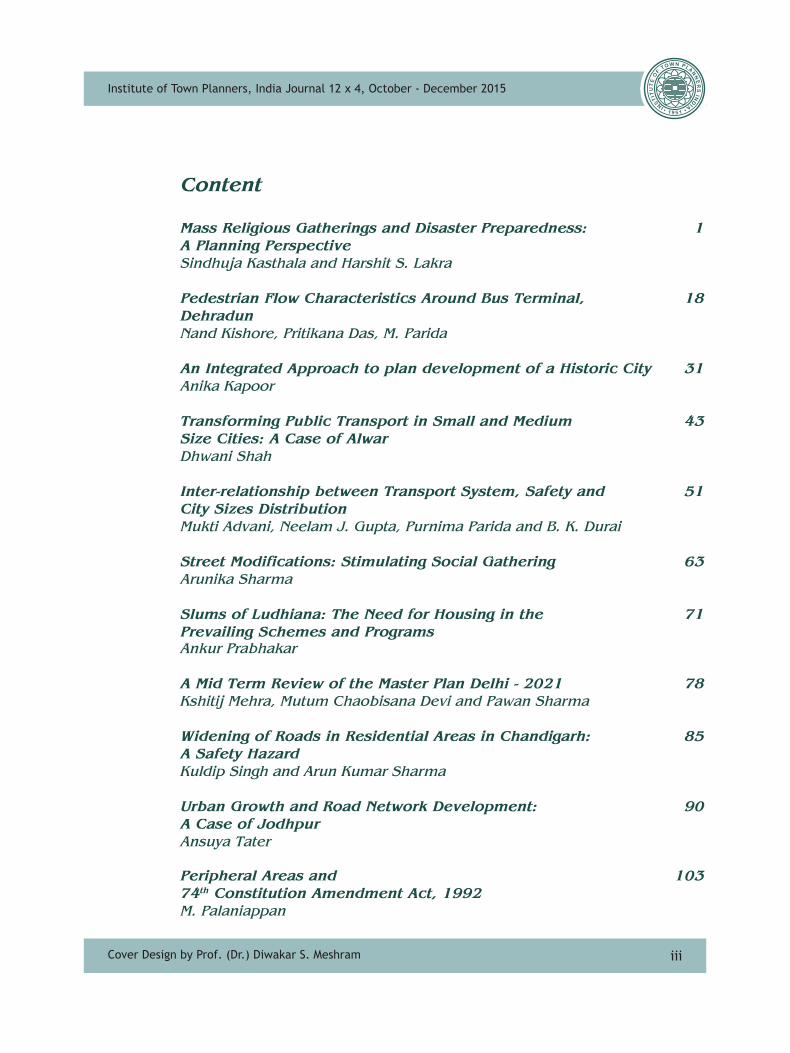
Content
Mass Religious Gatherings and Disaster Preparedness: 1 A Planning PerspectiveSindhuja Kasthala and Harshit S. Lakra
Pedestrian Flow Characteristics Around Bus Terminal, 18 DehradunNand Kishore, Pritikana Das, M. Parida
An Integrated Approach to plan development of a Historic City 31Anika Kapoor
Transforming Public Transport in Small and Medium 43 Size Cities: A Case of AlwarDhwani Shah
Inter-relationship between Transport System, Safety and 51 City Sizes Distribution Mukti Advani, Neelam J. Gupta, Purnima Parida and B. K. Durai
Street Modifications: Stimulating Social Gathering 63Arunika Sharma
Slums of Ludhiana: The Need for Housing in the 71Prevailing Schemes and ProgramsAnkur Prabhakar
A Mid Term Review of the Master Plan Delhi - 2021 78Kshitij Mehra, Mutum Chaobisana Devi and Pawan Sharma
Widening of Roads in Residential Areas in Chandigarh: 85 A Safety HazardKuldip Singh and Arun Kumar Sharma
Urban Growth and Road Network Development: 90 A Case of JodhpurAnsuya Tater
Peripheral Areas and 10374th Constitution Amendment Act, 1992M. Palaniappan
Institute of Town Planners, India Journal 12 x 4, October - December 2015
iv
1. Following members of the Institute shall be only eligible to borrow / refer books.
(a) Fellows (b) Associates (c) Students appearing for AITP Examination.
2. Entry to the Library shall be permitted on showing ID Card issued by the ITPI. The Institute reserves right of entry into the Library.
(a) No belongings shall be permitted to be taken inside the Library.
(b) Silence shall be maintained in the Library.
(c) In case of loss or mutilation of Library card, the following shall be charges for issuing of duplicate card.
Loss of Cards : Rs. 100 per card. Mutilated Cards : Rs. 50 per card.
3. Persons, other than those mentioned in Section 1 of these guidelines, may refer to books in the Library on showing their ID Cards and after signing the visitors’ register. They can refer to newspapers and serials but for referring books they will have to fill in a requisition slip. They will not be issued any book even for photocopying.
4. For photocopying a part of a book / journal the reader shall fill in a requisition slip, pay the necessary charges (Rs. 1/- per page) and leave the slip with the Librarian who shall arrange for photocopying and handover the papers when ready.
5. Borrowed books must be returned within 15 days failing which 50 paise per day shall be charged as fine.
(a) Librarian shall issue the first reminder to return the book after the expiry of 15 days. If the book is not returned, a maximum number of 5 reminders shall be sent at an interval of 15 days by the Librarian.
(b) After expiry of 15 days from the date of the fifth reminder if the book is not returned, the borrower will forfeit the security deposit and also the right of entry to the Library. The cost of books shall be adjusted against security deposit.
INSTITUTE OF TOWN PLANNERS,INDIA Library Guidelines
D. S. Meshram
Institute of Town Planners, India Journal 12 x 4, October - December 2015
1
Sindhuja Kasthala, Master Student, Centre of Excellence in Disaster Mitigation and Management, IIT Roorkee, India
Harshit S. Lakra, Assistant Professor, Department of Architecture and Planning, IIT Roorkee, India
Mass Religious Gatherings and Disaster Preparedness: A Planning Perspective
Sindhuja Kasthala and Harshit S. Lakra
1. INTRODUCTION
India, the fifth largest and the second most populated country in the world, hosts a large number of religious, political and entertainment gatherings. Where ever people crowd together, there are always high chances of stampedes and other hazards such as fire and terrorism. Nearly seventy nine percent of stampedes in India are from religious gatherings and pilgrimages only (Illiyas, 2013). The factors that can trigger disasters during any gathering may vary widely. The causes can be structural failures, defective infrastructure systems, difficult access, underestimation of crowd, uncontrolled movement of crowds and vehicles, mass evacuation because of a natural disaster, rumors of a disaster to happen, lack of adequate security and co-ordination (NDMA, 2014). Poor facilities, lack of basic infrastructure and absence of suitable strategies have increased the vulnerability of mass gatherings. Incident of disasters in such gatherings may lead to huge number of causalities along with anguish and economic loss. Increase in population and influx of a large number of people for the gatherings is increasing the probability of such events.
Learning from past incidents by identifying the breaches in overall planning will help India and other countries in effectively managing the forthcoming mass gatherings. Outlining the good practices will aid to embrace them easily in any forthcoming event. The scope of the paper is to review the case studies, the measures taken and their potential for disaster preparedness; and evolve
AbstractThe influx of millions of people during religious gatherings and pilgrimages creates tremendous amount of pressure on their host cities. And the result of any kind of disaster in those gatherings will result in widespread human and infrastructure impact. With the current trend of increase in both man-made and natural disasters there is a huge need of disaster preparedness. This paper discusses specific case studies of mass gatherings to ascertain the gaps in infrastructure and strategies adopted for the disaster preparedness, to derive strategies to improve disaster preparedness for mass gatherings. The study examines a few incidents during the Saudi Arabia’s Hajj pilgrimage in 2006, incidents during the Cambodia’s water festival in 2010 and incidents during the India’s Kumbh mela in 2013.
Sindhuja Kasthala and Harshit S. Lakra
Institute of Town Planners, India Journal 12 x 4, October - December 2015
2
strategies in crowd management, traffic management, safety and security, capacity building, information management and use of modern technology. This paper discusses selected case studies of mass gatherings in the global as well as India context. The gatherings that will be deliberated in the paper are the annual muslim religious pilgrimage of Hajj in Saudi Arabia with the main focus on the tragedy of 2006, the water festival held in Cambodia with emphasis on the 2010 tragedy in Phnom Penh, the Hindu religious gathering of Kumbh Mela in India with a focus on Allahabad Kumbh Mela of 2013. The experience from the past indicates that a small flaw in the system can trigger disasters. The paper also discusses the measures taken during these selected gatherings and the gaps in measures of disaster preparedness.
This study is conducted to understand the disaster preparedness in various mass gatherings. The mass gatherings were identified from reviewed literature, newspapers and online reports and the information was used to understand the occurrence of tragedies, measures taken by respective authorities to improve the safety and security, triggering factors and the gaps in the measures taken, which led to such incidents. The study looks at the improvements made in the infrastructure to manage the crowds, ability to monitor the crowds and advanced techniques adopted. The retrospective analysis of the case studies and outlining the gaps will lead to the formulation of strategies for better disaster preparedness. This paper is a part of research going on in IIT Roorkee on “Developing Disaster Resilient strategies for the city of Haridwar in the context of Ardh Kumbh mela 2016”
2. THE HAJJ PILGRIMAGE IN SAUDI ARABIA
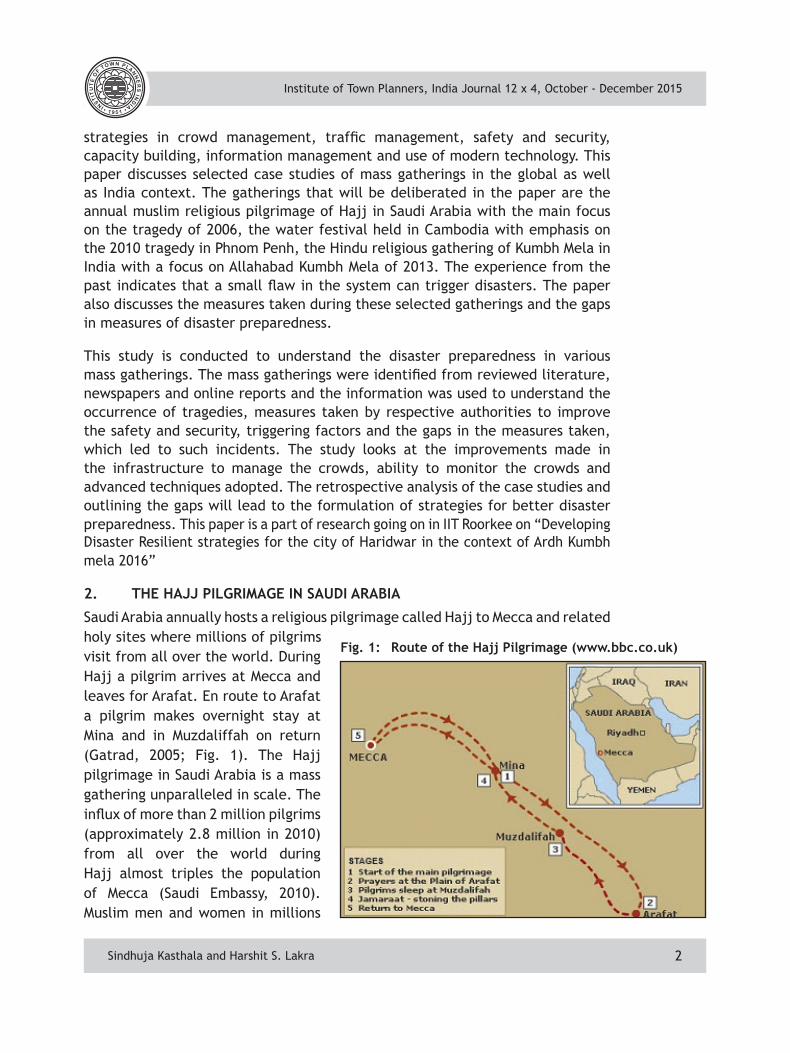
Saudi Arabia annually hosts a religious pilgrimage called Hajj to Mecca and related holy sites where millions of pilgrims visit from all over the world. During Hajj a pilgrim arrives at Mecca and leaves for Arafat. En route to Arafat a pilgrim makes overnight stay at Mina and in Muzdaliffah on return (Gatrad, 2005; Fig. 1). The Hajj pilgrimage in Saudi Arabia is a mass gathering unparalleled in scale. The influx of more than 2 million pilgrims (approximately 2.8 million in 2010) from all over the world during Hajj almost triples the population of Mecca (Saudi Embassy, 2010). Muslim men and women in millions
Sindhuja Kasthala and Harshit S. Lakra
Fig. 1: Route of the Hajj Pilgrimage (www.bbc.co.uk)
Institute of Town Planners, India Journal 12 x 4, October - December 2015
3
from more than 183 counties gather for Hajj in Mecca for five specific days each year and often halt for over a month (Blatt, 2015). More than two million people dressed in similar garments, affirming a common identity, perform identical rituals. With this spirit of unity many Hajjis undergo the most significant religious event of their lives. Even though the ritual last for only five days, many Hajjis tend to stay for nearly 40 days in the cities of Mecca and Medina (Qanta and Ahmed, 2006). The extended stays and crowded accommodation create extreme congestion of people and vehicles. The extreme traffic and disordered traffic flow leads to extended traffic jams. The extreme heat (between 44°C and 50°C during Hajj season) and inadequate stored or prepared food along with jam-packed lodging encourage transmission of diseases (Rassool, 2014). To prevent the occurrence of tragedies such as riots, massacres, fires and stampedes, the crowd is monitored centrally by the authorities. The Hajj pilgrimage has seen many tragedies despite the attempts to increase safety (Davids, 2006).
2.1 Incidents during the Hajj
In the last 20 years at Hajj, people have died in various tragedies like stampedes, fires in camping areas, bomb explosion near Mosque, etc. City officials are required to manage huge crowds and provide food, amenities and emergency services. Unfortunately, they cannot prevent all the disasters from happening. A stampede in a pedestrian tunnel led to the death of 1,426 pilgrims in 1990 (Ross, 2015). Tent fires in camping areas claimed many lives (1975, 1997), and the tents are now made fireproof (The Guardian, 2006). The pilgrimage was also disrupted by the attack of militants on grand Mosque in 1979 and two bombs explosions in 1989 (Gad-el-Hak, 2008). The worst of the tragedies have occurred during the stoning ritual, which is the most dangerous part of the pilgrimage where huge crowds cross the massive Jamarat Bridge to reach the pillars (Googelberg). Stoning ceremony has claimed lives of at least thousand pilgrims in the stampedes of 1994, 2001, 2003, 2004 and 2006 (Ross, 2015). Similar Jamarat incident claimed the lives of at least 1621 in 2015 making it the worst incident in the (Gambrell and Batrawy, 2015). Besides all these, the Saudi Government also deals with disease breakouts during the Hajj (Gad-el-Hak, 2008).
2.2 The Hajj Tragedy, 2006
The Hajj tragedy of 2006 happened despite many attempts to manage the crowd and after improving access to Al-Jamart site. Nearly 2.3 million pilgrims performed Hajj in 2006 (Saudi Embassy, 2006). The causes for the occurrence of tragedies in Hajj 2006 are:
• Unforeseen ingress of pilgrims who were trying to access the ramps to Jamarat Bridge; and
• Many people tripping over the luggage that fell from the moving buses resulted in the stampede (Qanta and Ahmed, 2006)
Sindhuja Kasthala and Harshit S. Lakra
Institute of Town Planners, India Journal 12 x 4, October - December 2015
4
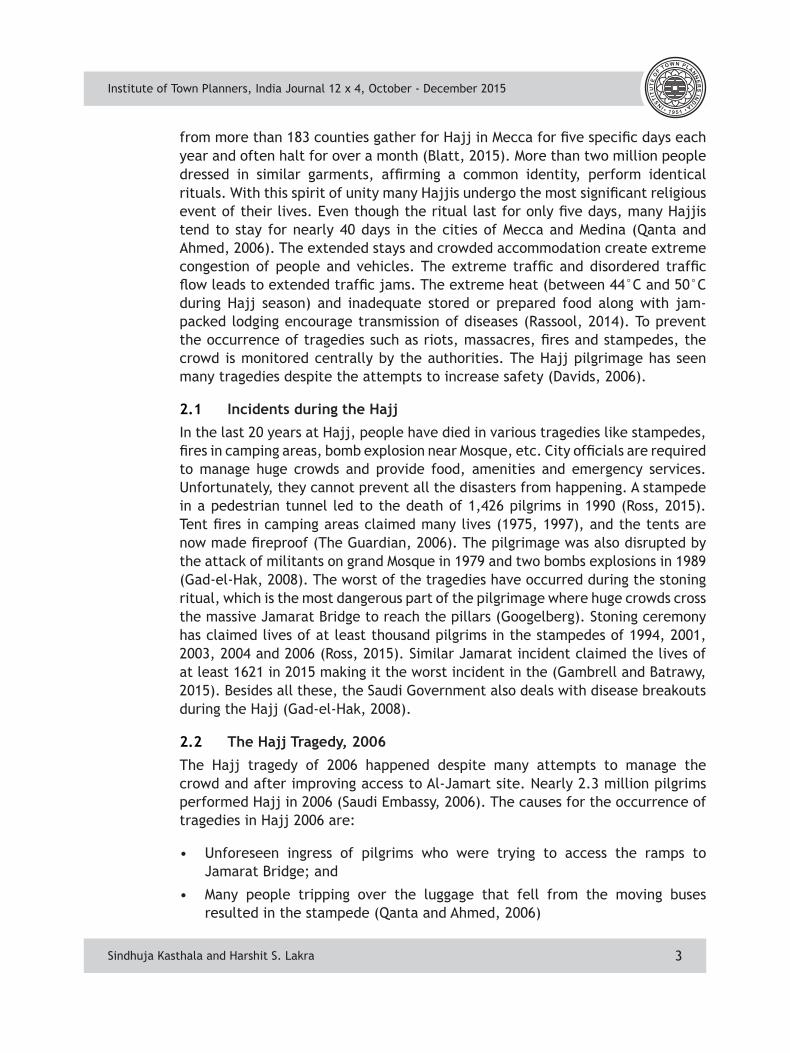
The sudden flow and pressure of people at various points on the already disaster prone two- layered fly-over styled Jamarat bridge in Mina resulted in a stampede; and as many as 363 pilgrims lost their lives and more than 389 got injured (Still, 2013). This was believed to be the worst incident in 16 years in the holy site. Fig. 2 shows the Jamarat bridge layout in 2006 with the site of accident. A structural failure led to the collapse of a hotel in a narrow street, which lodged pilgrims; and claimed the lives of 76 (Gad-el-Hak, 2008). The aid could not reach the victims quickly due to large crowds (Qanta and Ahmed, 2006). Exhaustion in the people caused by the heat and tiring physical work in the ritual and the exposed spaces with limited or no shade led to the death of 243 pilgrims (Sapa-afp, 2006).
2.3 Measures Taken
Measures taken for the Hajj pilgrimage in 2006 are:
• To control the pilgrim flow, the Saudi Government has taken up construction of many foot bridges, access ways, and emergency exits;
• Multi-lane roads have been built;
• Walk ways were widened to almost 80 meters to reduce congestion (Oliver, 2006);
• New air ports have come up. Following many incidents the Jamarat Bridge and pillars were abolished and reconstructed. The round pillars and tall obelisks were replaced by 26 meter long wall to improve access and reduce crowd densities (Oliver, 2006);
• A wider bridge was built and now the bridge allows easy and safer access to the pillars;
• Ramps and walkways to the Jamarat site have been widened. It was hoped that by widening the site and giving people a wider area to do the stoning ritual will make the site safer;
• 60,000 personnel were put on the site to avoid accidents and attacks by extremists (Gad-el-Hak, 2008);
• Helicopters flied overhead watching the crowds and authorities monitored the crowd with the help of CCTVs from a control room;
• Special elevators are provided for the handicapped people; and
• To ensure high resistance to fire, the tents were constructed of fiberglass coated with Teflon in every sector of land.
Figure 1 Jamarat Bridge Layout in 2006
Fig. 2: Jamarat Bridge Layout in 2006
Sindhuja Kasthala and Harshit S. Lakra
Institute of Town Planners, India Journal 12 x 4, October - December 2015
5
2.4 Gaps in the Measures and Subsequent Developments
During Hajj 2006 it was hoped that by widening the Jamarat site and by giving access to more pilgrims to do the stoning ritual, the tragedies in the disaster prone Jamarat site could be prevented. But the signs giving directions on the site were scant. There are two ramps leading to the pillars and two ramps for exit, but the pilgrims ignored the rules and often went up and down as they wish creating a chance for stampede. A proper system of public transport can move masses more quickly. Sudden ingress of people was the reason for stampede. Inflow and outflow movements of people should be regulated more efficiently. Many pilgrims camped on the sidewalks hindering the free passage of crowds, which was further disrupted by the vendors. Encroached vendors and hawkers selling souvenirs and food to pilgrims narrowed the access routes, disturbed the crowd flow jammed up traffic. The authorities should have limited the vendors and hawkers in the area by giving identity to few. The guidelines for structural safety were not considered. Cautious use of bridges and fly-overs was not properly communicated with the pilgrims. Emergency response services were not efficient, thus delaying the rescue operations.
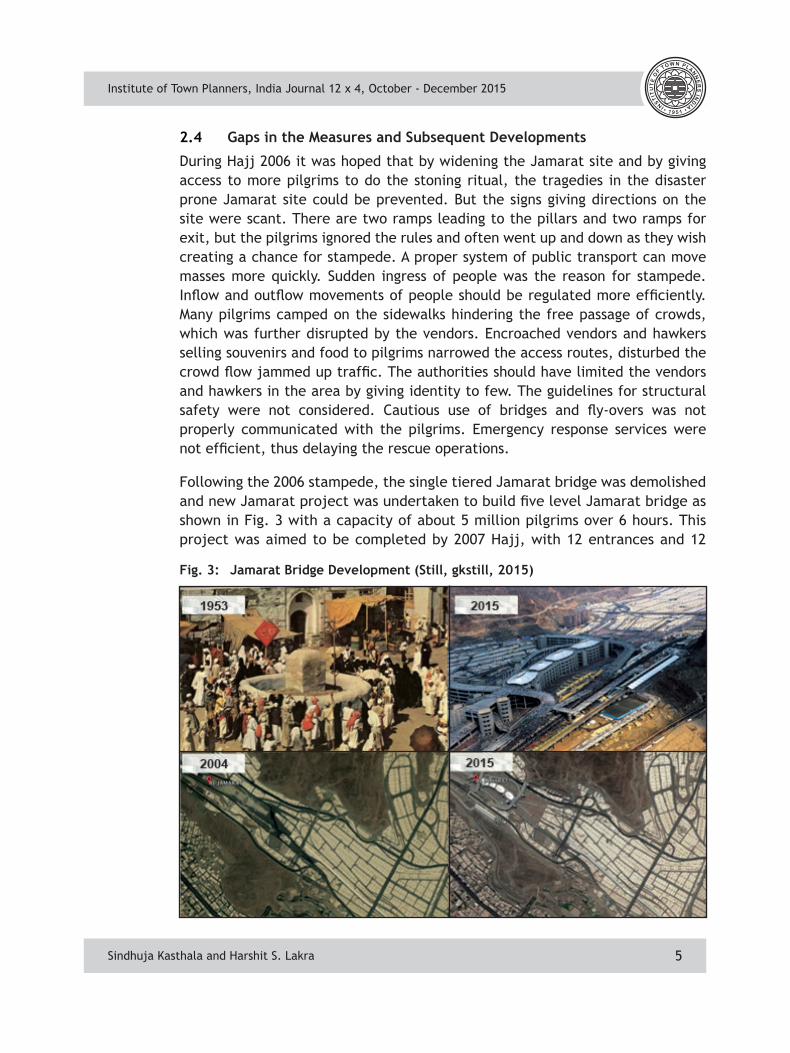
Following the 2006 stampede, the single tiered Jamarat bridge was demolished and new Jamarat project was undertaken to build five level Jamarat bridge as shown in Fig. 3 with a capacity of about 5 million pilgrims over 6 hours. This project was aimed to be completed by 2007 Hajj, with 12 entrances and 12
Fig. 3: Jamarat Bridge Development (Still, gkstill, 2015)
Sindhuja Kasthala and Harshit S. Lakra
Institute of Town Planners, India Journal 12 x 4, October - December 2015
6
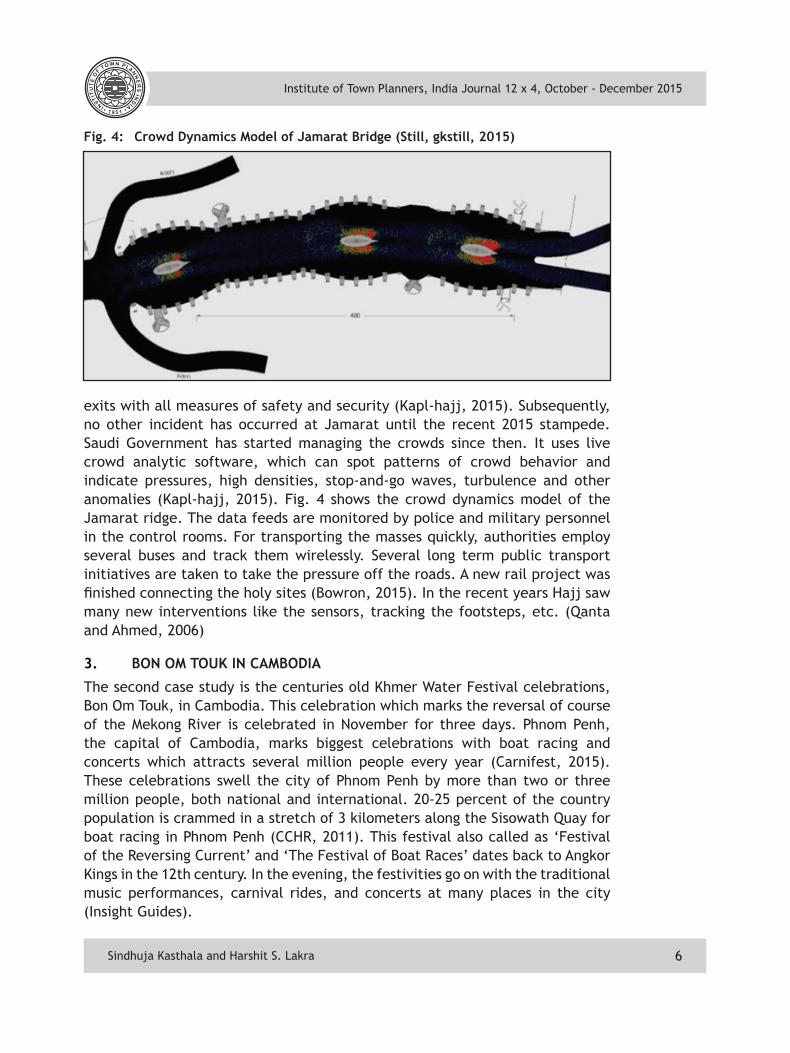
exits with all measures of safety and security (Kapl-hajj, 2015). Subsequently, no other incident has occurred at Jamarat until the recent 2015 stampede. Saudi Government has started managing the crowds since then. It uses live crowd analytic software, which can spot patterns of crowd behavior and indicate pressures, high densities, stop-and-go waves, turbulence and other anomalies (Kapl-hajj, 2015). Fig. 4 shows the crowd dynamics model of the Jamarat ridge. The data feeds are monitored by police and military personnel in the control rooms. For transporting the masses quickly, authorities employ several buses and track them wirelessly. Several long term public transport initiatives are taken to take the pressure off the roads. A new rail project was finished connecting the holy sites (Bowron, 2015). In the recent years Hajj saw many new interventions like the sensors, tracking the footsteps, etc. (Qanta and Ahmed, 2006)
3. BON OM TOUK IN CAMBODIA
The second case study is the centuries old Khmer Water Festival celebrations, Bon Om Touk, in Cambodia. This celebration which marks the reversal of course of the Mekong River is celebrated in November for three days. Phnom Penh, the capital of Cambodia, marks biggest celebrations with boat racing and concerts which attracts several million people every year (Carnifest, 2015). These celebrations swell the city of Phnom Penh by more than two or three million people, both national and international. 20-25 percent of the country population is crammed in a stretch of 3 kilometers along the Sisowath Quay for boat racing in Phnom Penh (CCHR, 2011). This festival also called as ‘Festival of the Reversing Current’ and ‘The Festival of Boat Races’ dates back to Angkor Kings in the 12th century. In the evening, the festivities go on with the traditional music performances, carnival rides, and concerts at many places in the city (Insight Guides).
Figure 1crowd dynamics model of Jamarat Bridge (Still, gkstill, 2015)
Fig. 4: Crowd Dynamics Model of Jamarat Bridge (Still, gkstill, 2015)
Sindhuja Kasthala and Harshit S. Lakra
Institute of Town Planners, India Journal 12 x 4, October - December 2015
7
3.1 Water Festival Crowd Tragedy, 2010
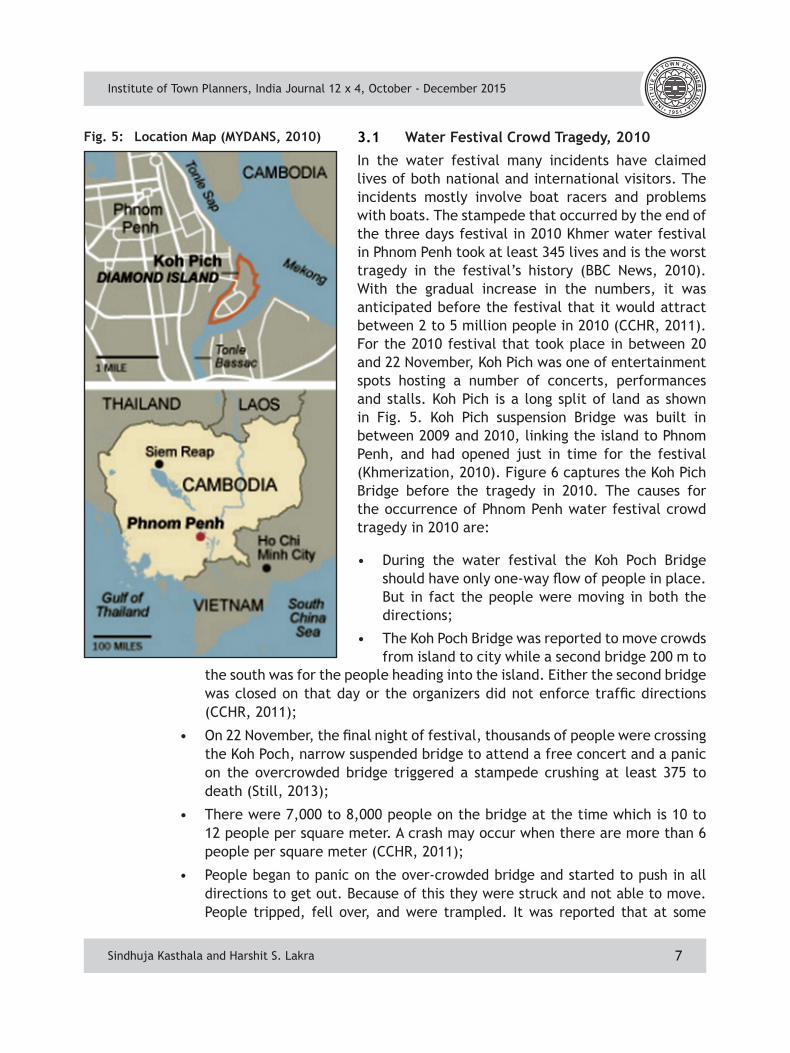
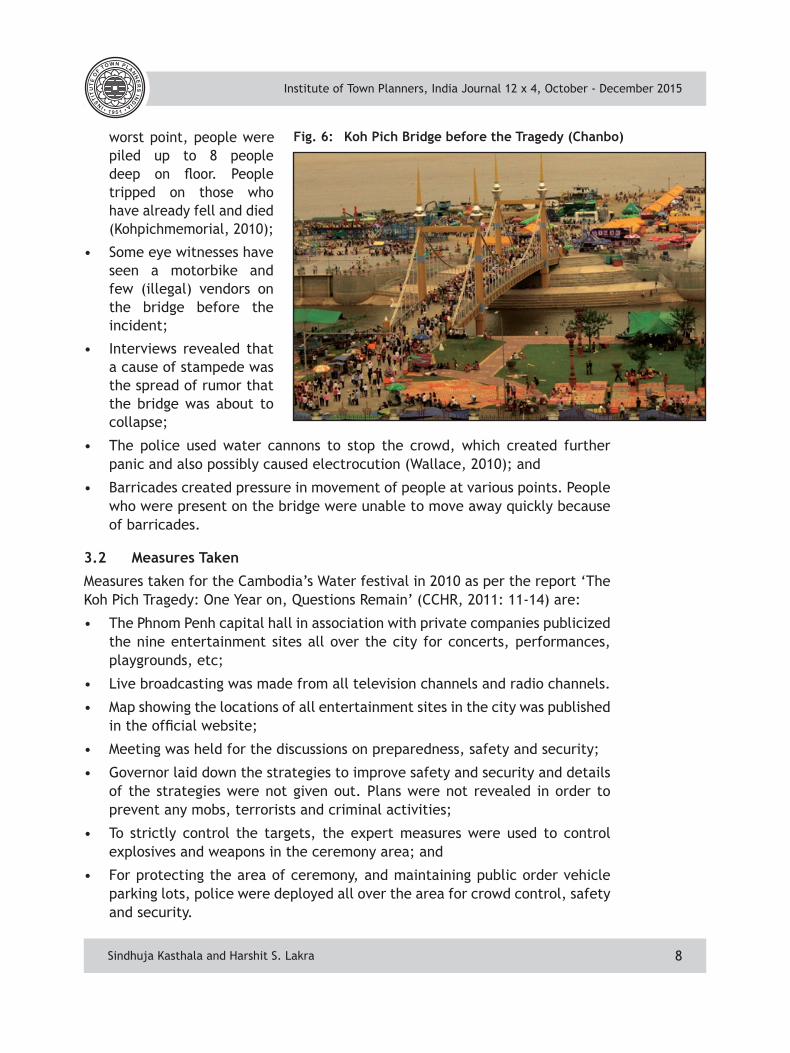
In the water festival many incidents have claimed lives of both national and international visitors. The incidents mostly involve boat racers and problems with boats. The stampede that occurred by the end of the three days festival in 2010 Khmer water festival in Phnom Penh took at least 345 lives and is the worst tragedy in the festival’s history (BBC News, 2010). With the gradual increase in the numbers, it was anticipated before the festival that it would attract between 2 to 5 million people in 2010 (CCHR, 2011). For the 2010 festival that took place in between 20 and 22 November, Koh Pich was one of entertainment spots hosting a number of concerts, performances and stalls. Koh Pich is a long split of land as shown in Fig. 5. Koh Pich suspension Bridge was built in between 2009 and 2010, linking the island to Phnom Penh, and had opened just in time for the festival (Khmerization, 2010). Figure 6 captures the Koh Pich Bridge before the tragedy in 2010. The causes for the occurrence of Phnom Penh water festival crowd tragedy in 2010 are:
• During the water festival the Koh Poch Bridge should have only one-way flow of people in place. But in fact the people were moving in both the directions;
• The Koh Poch Bridge was reported to move crowds from island to city while a second bridge 200 m to
Fig. 5: Location Map (MYDANS, 2010)
Sindhuja Kasthala and Harshit S. Lakra
the south was for the people heading into the island. Either the second bridge was closed on that day or the organizers did not enforce traffic directions (CCHR, 2011);
• On 22 November, the final night of festival, thousands of people were crossing the Koh Poch, narrow suspended bridge to attend a free concert and a panic on the overcrowded bridge triggered a stampede crushing at least 375 to death (Still, 2013);
• There were 7,000 to 8,000 people on the bridge at the time which is 10 to 12 people per square meter. A crash may occur when there are more than 6 people per square meter (CCHR, 2011);
• People began to panic on the over-crowded bridge and started to push in all directions to get out. Because of this they were struck and not able to move. People tripped, fell over, and were trampled. It was reported that at some
Institute of Town Planners, India Journal 12 x 4, October - December 2015
8
worst point, people were piled up to 8 people deep on floor. People tripped on those who have already fell and died (Kohpichmemorial, 2010);
• Some eye witnesses have seen a motorbike and few (illegal) vendors on the bridge before the incident;
• Interviews revealed that a cause of stampede was the spread of rumor that the bridge was about to collapse;
• The police used water cannons to stop the crowd, which created further panic and also possibly caused electrocution (Wallace, 2010); and
• Barricades created pressure in movement of people at various points. People who were present on the bridge were unable to move away quickly because of barricades.
3.2 Measures Taken
Measures taken for the Cambodia’s Water festival in 2010 as per the report ‘The Koh Pich Tragedy: One Year on, Questions Remain’ (CCHR, 2011: 11-14) are:
• The Phnom Penh capital hall in association with private companies publicized the nine entertainment sites all over the city for concerts, performances, playgrounds, etc;
• Live broadcasting was made from all television channels and radio channels.
• Map showing the locations of all entertainment sites in the city was published in the official website;
• Meeting was held for the discussions on preparedness, safety and security;
• Governor laid down the strategies to improve safety and security and details of the strategies were not given out. Plans were not revealed in order to prevent any mobs, terrorists and criminal activities;
• To strictly control the targets, the expert measures were used to control explosives and weapons in the ceremony area; and
• For protecting the area of ceremony, and maintaining public order vehicle parking lots, police were deployed all over the area for crowd control, safety and security.
Fig. 6: Koh Pich Bridge before the Tragedy (Chanbo)
Sindhuja Kasthala and Harshit S. Lakra
Institute of Town Planners, India Journal 12 x 4, October - December 2015
9
3.3 Gaps in the Measures and Subsequent Developments
During the 2010 Cambodian Water festival, the number of security guards and police personnel who were there was well below the number sent on duty. They might have assisted properly when the incident broke out. The city hospitals and emergency response teams were not able to deal with the large number of causalities quickly. Preparedness for such tragedies was inefficient. Cautious use of bridges was not articulated. The capacity of the bridge and its capability to handle the anticipated crowd was not defined. A course of action in case of a tragedy was not prepared and shared with the officials. Access routes were narrowed by the vendors. Official must have restricted the entry of hawkers and vendors on to the bridge. The path for vehicles was not separated from pedestrian ways. Movement of people was not regulated and multiple routes should have been encouraged. Information management was poor and using an announcement system must have controlled the rumors in crowd. Capacity building was not to the mark; responsiveness was poor; and the police officers were not trained for extreme incidents.
Following the incident, the Phnom Penh municipality linked the Koh Pich to mainland by inaugurating two new bridges parallel to Koh Pich Bridge. A draft law on disaster management was brought in including the man-made disasters (Kongkea, 2010). Instead of using roadblocks police are asked to be stationed at many locations to prevent traffic jams and manage crowd congestion. Medical, emergency response and law personnel will be trained and prepared for such incidents.
4. KUMBH MELA IN INDIA
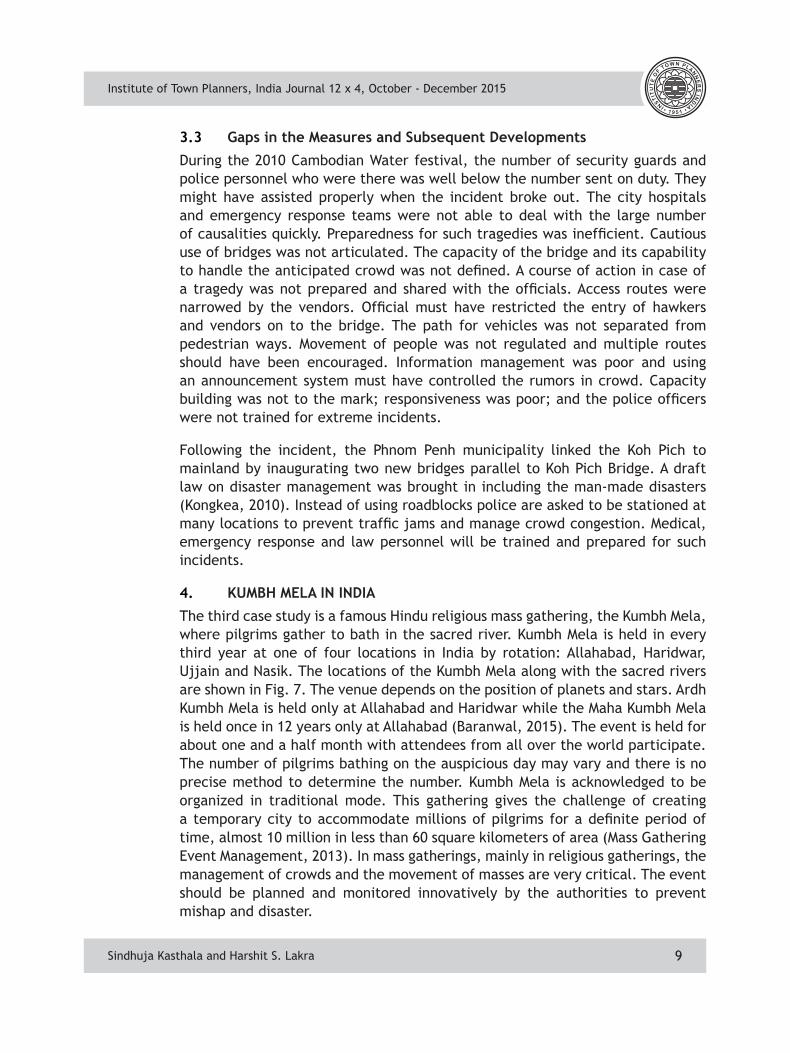
The third case study is a famous Hindu religious mass gathering, the Kumbh Mela, where pilgrims gather to bath in the sacred river. Kumbh Mela is held in every third year at one of four locations in India by rotation: Allahabad, Haridwar, Ujjain and Nasik. The locations of the Kumbh Mela along with the sacred rivers are shown in Fig. 7. The venue depends on the position of planets and stars. Ardh Kumbh Mela is held only at Allahabad and Haridwar while the Maha Kumbh Mela is held once in 12 years only at Allahabad (Baranwal, 2015). The event is held for about one and a half month with attendees from all over the world participate. The number of pilgrims bathing on the auspicious day may vary and there is no precise method to determine the number. Kumbh Mela is acknowledged to be organized in traditional mode. This gathering gives the challenge of creating a temporary city to accommodate millions of pilgrims for a definite period of time, almost 10 million in less than 60 square kilometers of area (Mass Gathering Event Management, 2013). In mass gatherings, mainly in religious gatherings, the management of crowds and the movement of masses are very critical. The event should be planned and monitored innovatively by the authorities to prevent mishap and disaster.
Sindhuja Kasthala and Harshit S. Lakra
Institute of Town Planners, India Journal 12 x 4, October - December 2015
10
4.1 Allahabad Kumbh Mela, 2013
In these gatherings many people go missing, get injured, and die in incidents like fires, stampedes, accidents, etc. The most tragic incident is the Kumbh Mela stampede of 1954 in Allahabad where as many as 1,000 people lost their lives (Saksena, 1987). A stampede in Nasik Kumbh Mela of 2003 claimed lives of 39 (Vijapurkar, 2003). Allahabad Kumbh Mela of 2013 has also seen a series of tragedies despite the measures taken by the authorities.
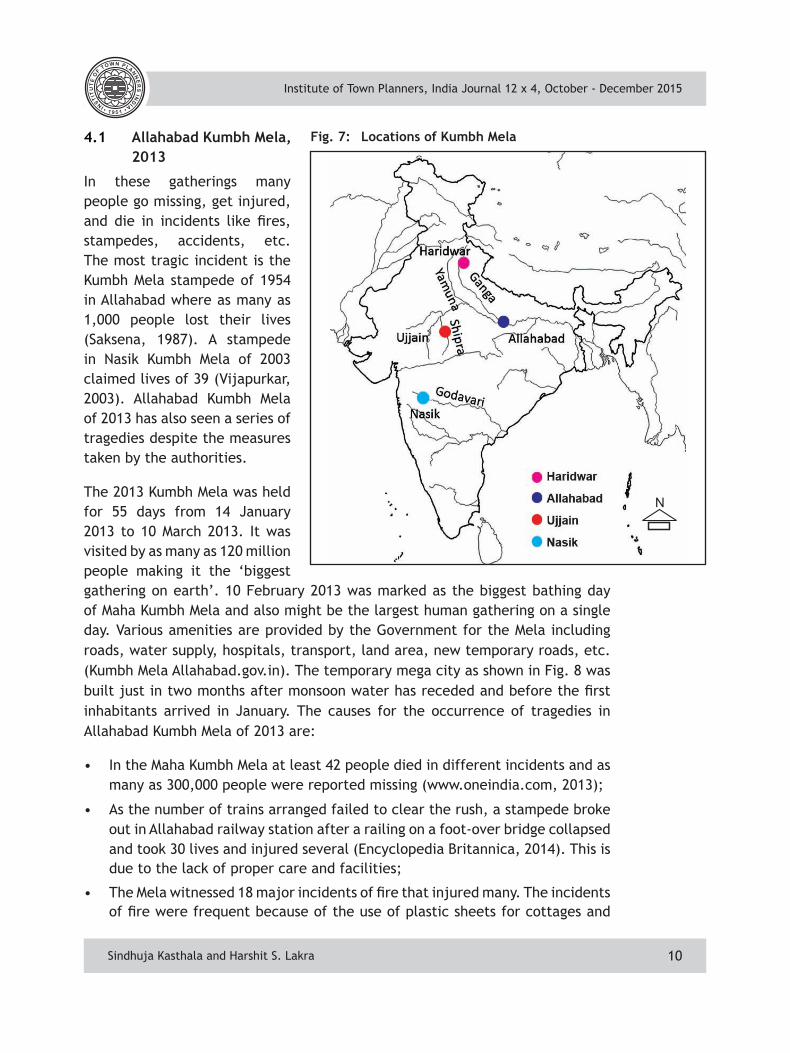
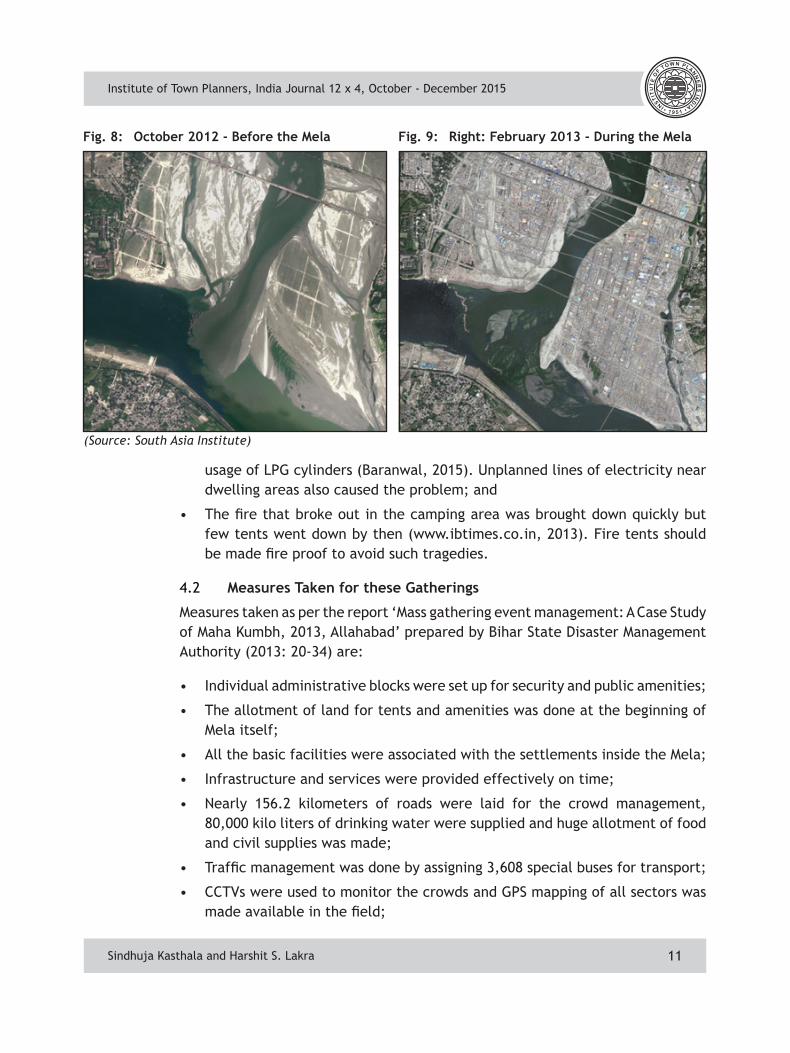
The 2013 Kumbh Mela was held for 55 days from 14 January 2013 to 10 March 2013. It was visited by as many as 120 million people making it the ‘biggest gathering on earth’. 10 February 2013 was marked as the biggest bathing day of Maha Kumbh Mela and also might be the largest human gathering on a single day. Various amenities are provided by the Government for the Mela including roads, water supply, hospitals, transport, land area, new temporary roads, etc. (Kumbh Mela Allahabad.gov.in). The temporary mega city as shown in Fig. 8 was built just in two months after monsoon water has receded and before the first inhabitants arrived in January. The causes for the occurrence of tragedies in Allahabad Kumbh Mela of 2013 are:
• In the Maha Kumbh Mela at least 42 people died in different incidents and as many as 300,000 people were reported missing (www.oneindia.com, 2013);
• As the number of trains arranged failed to clear the rush, a stampede broke out in Allahabad railway station after a railing on a foot-over bridge collapsed and took 30 lives and injured several (Encyclopedia Britannica, 2014). This is due to the lack of proper care and facilities;
• The Mela witnessed 18 major incidents of fire that injured many. The incidents of fire were frequent because of the use of plastic sheets for cottages and
Fig. 7: Locations of Kumbh Mela
Sindhuja Kasthala and Harshit S. Lakra
Institute of Town Planners, India Journal 12 x 4, October - December 2015
11
usage of LPG cylinders (Baranwal, 2015). Unplanned lines of electricity near dwelling areas also caused the problem; and
• The fire that broke out in the camping area was brought down quickly but few tents went down by then (www.ibtimes.co.in, 2013). Fire tents should be made fire proof to avoid such tragedies.
4.2 Measures Taken for these Gatherings
Measures taken as per the report ‘Mass gathering event management: A Case Study of Maha Kumbh, 2013, Allahabad’ prepared by Bihar State Disaster Management Authority (2013: 20-34) are:
• Individual administrative blocks were set up for security and public amenities;
• The allotment of land for tents and amenities was done at the beginning of Mela itself;
• All the basic facilities were associated with the settlements inside the Mela;
• Infrastructure and services were provided effectively on time;
• Nearly 156.2 kilometers of roads were laid for the crowd management, 80,000 kilo liters of drinking water were supplied and huge allotment of food and civil supplies was made;
• Traffic management was done by assigning 3,608 special buses for transport;
• CCTVs were used to monitor the crowds and GPS mapping of all sectors was made available in the field;
Fig. 8: October 2012 - Before the Mela Fig. 9: Right: February 2013 - During the Mela
Sindhuja Kasthala and Harshit S. Lakra
(Source: South Asia Institute)
Institute of Town Planners, India Journal 12 x 4, October - December 2015
12
• Each sector in the Mela got its own sector market with all the essential commodities for the people;
• Entire information related to the Mela was made available on the website;
• 36 Fire stations were set up in the Mela area and firemen were deployed all over the area;
• To provide emergency services, motorcycle mounted firemen were made available to provide services in the area inaccessible by fire tenders;
• Information of the missing persons was instantly uploaded on the website; and
• Electronic techniques were used in lost and found camps and electronic signboards were also used by traffic police to give important messages.
4.3 Gaps in the Measures and Subsequent Developments
There were some shortfalls in the well planned and well-coordinated Kumbh Mela of 2013. Fires broke out at many places and the fire stations were not strategically located. The settlement patterns were violated and the fire could have been controlled if the settlement pattern was strictly organized. Mere arrangement of fire stations near police stations did not completely help. Fire stations can be arranged in hexagonal pattern to reduce the response time. Fire proof tents should have been adopted like in the case of Hajj. Co-ordination between railway and roadway administrations was not proper. Transport provisions should be in synchronization with the growing number of pilgrims. The number of trains arranged during the Mela failed to clear the rush. The stampede was the result of unforeseen large crowd exiting in the city. Proper arrangements should be made for clearing the rush in bus and train stations. Maps of Mela were not displayed and clear information on exits and routes were not known. Access to the disabled people was not considered. The communication system was substandard as the voice quality was poor and it was difficult to hear the announcements. The solid waste management was not satisfactory and pollution level got increased in the Ganga Ghat because of the offerings made by devotees. Kumbh Melas are managed traditionally and technological interventions can assist in managing the events more effectively.
5. FUTURE STRATEGIES
The strategies that can be recommended for the forthcoming gatherings after reviewing the case studies are:
5.1 Crowd Management
By strictly monitoring the crowd flow into areas like tunnels, bridges and flyovers Incidents like the stampede of Hajj 2006 can be avoided. The bottlenecks and
Sindhuja Kasthala and Harshit S. Lakra
Institute of Town Planners, India Journal 12 x 4, October - December 2015
13
compression points in infrastructure should be avoided to prevent the crush of people as in case of Hajj 2006 stampede. Control on the flow of people can be better achieved by managing multiple routes, several entrances and exits which can be seen from the remodelling of Jamarat Bridge.
Understanding the behavior of crowd will help to efficiently manage the crowd than managing by force. But in today’s mass gatherings like the Hajj and Kumbh Mela it is not just enough to guess the human nature we should be able to model and predict the crowd movement with all risks, pressures, delays and reactions. The Hajj pilgrimage has some experience on crowd dynamics which can also be incorporated in other mass gatherings for better crowd management plans and to prevent stampedes.
5.2 Traffic Management
The traffic directions and guidelines should be imposed by the authorities. Multiple access roads with varying speed gradients like expressways, emergency, should be encouraged to manage huge traffic. Such measures will avoid tragedies like Koh Pich stampede, where vehicular traffic was not completely separated from pedestrian traffic. The stampede in Allahabad Railway station during Kumbh Mela was caused as the transport system has failed to clear the rush of the pilgrims. Such situations can be avoided with a suitable transportation system. Systems like metro and light rail can transport large number of people in less time and also reduce the dependence on buses which can cause traffic congestion.
5.3 Safety and Security
In pilgrimages like Kumbh Mela, the fire can be controlled if the tents are made fire proof. In Hajj the tents were constructed of fiberglass coated with Teflon in order to ensure high resistance to fire. The damage during 2013 Kumbh Mela could have been minimized if settlement patterns were not violated and if the fire services were arranged in certain patterns to reduce the response time. The electrical lines should follow the patterns of dwellings units to avoid breaches.
Cautious use of bridges, fly-overs, ropeways should be communicated to staff and public. By calculating the load bearing capacity of such structures and managing crowd accordingly will prevent incidents like Koh Pich stampede. Barriers can be used to stop motor vehicles and effectively regulate the crowd but the barrier location should not funnel the crowd to an already packed area. In Koh Pich tragedy the people exiting on the bridge were unable to move quickly because of barricades. In case of an emergency a course of actions to be taken should be given in advance to the officials and staff to follow the same. The course of action
Sindhuja Kasthala and Harshit S. Lakra
Institute of Town Planners, India Journal 12 x 4, October - December 2015
14
should include instructions such as what should be done, who is responsible, where does it take place and what is needed
5.4 Capacity Building
The infrastructure can be improvised based on the research that helps in determining the acceptable crowd velocities and densities at various locations. Extensive simulations and modelling work, extensive analysis of the existing Jamarat Bridge resulted in the massive expansion of the Bridge. For mass gatherings the suitable infrastructure can stop crowd related accidents. The damage in Koh Pich tragedy could have been minimized if the security personnel were trained to operate in such situations. Training the security personnel for any disaster should be undertaken promptly. Mock drills and exercises can train them to execute things such as evacuating people and controlling the masses.
5.5 Information Management
In pilgrimages like Hajj and Kumbh Mela, people come from different ethnic backgrounds and use different languages. So there is a need for sign language or other means of communication. With more than 300,000 persons missing during the 2013 Kumbh Mela, the authorities managed the situation by constantly updating websites and by announcements. To ease such situations the layout of the area and venue, location of facilities, circulation routes, locations of entrances and exit points should be specified to the public. Leaflets can be given with dos and do-nots, route maps, locations and emergency contacts.
5.6 Use of Modern Technology
Tracking and identifying individuals in mass congregations is a very complex task. It becomes more complex if the people use different languages and have different social backgrounds. But modern technology can give remedies to such situations. Technology based solutions can be given for problems like pilgrim identification such as providing pilgrims with RFID (Radio-frequency identification) tags. Measures like sensors, processors and display screens once in place, will provide solutions to many problems associated with the identification of pilgrims. In the recent years Hajj pilgrimage witnessed many new interventions such as the sensors and tracking systems. Kumbh Mela can learn from the strategies of Hajj. The effective management of crowd can be achieved by adopting new technological interventions.
6. CONCLUSIONS
Several mass gatherings, mainly the religious gatherings in India, have not yet realized the importance and crucial role of disaster preparedness in
Sindhuja Kasthala and Harshit S. Lakra
Institute of Town Planners, India Journal 12 x 4, October - December 2015
15
event management. A review of past gatherings says that any small trigger can cause huge impacts on mass gatherings. Although few Governments and organizations have recognized the importance of disaster preparedness, a study of the past gatherings will help in identifying the existing problems and will help in formulating strategies to overcome the problems. Even after the infrastructure development and technological interventions by the Governments, the gatherings such as Hajj continue to face major challenges. The results in this study indicate a major gap in the strategies adopted for disaster preparedness. The aim of this effort is to bring radical changes in Authorities to include disaster preparedness in the organization of mass gatherings. Proper documentation of the managerial and planning aspects of the gatherings will help in the future. The strategies mentioned in this paper can be considered in forthcoming gatherings to improve disaster preparedness. Success in this endeavor will not be easy as it requires persistent and continuous efforts and depends on multiple factors. However, the degree of Government willingness to engage in disaster preparedness, their level of commitment, and their intent to collaborate with other sectors to build disaster preparedness will ensure safe gatherings.
REFERENCES
Saudi Embassy. (2006, December 30) Retrieved November 15, 2015, from Saudi Embassy: http://www.saudiembassy.net/archive/2006/news/page5.aspx
The Guardian (2006, January 12) Retrieved 08 20, 015, from the guardian: http://www.theguardian.com/world/2006/jan/13/saudiarabia
www.theguardian.com. (2006, 01 14) Retrieved 08 25, 2015, from the guardian: http://www.theguardian.com/world/2006/jan/14/saudiarabia.religion1
BBC News. (2010, November 22). Retrieved October 15, 2015, from bbc news: http://www.bbc.com/news/world-asia-pacific-11814894
Khmerization (2010, November 24) Retrieved October 10, 2015, from khmerization: http://khmerization.blogspot.in/2010/11/cambodia-stampede-i-was-in-middle.html
Kohpichmemorial (2010, Nov 27) Retrieved 08 24, 2015, from kohpichmemorial: http://www.kohpichmemorial.org/
Saudi Embassy. (2010, November 18) Retrieved October 15, 2015, from saudiembassy: http://www.saudiembassy.or.jp/En/PressReleases/2010/20101118.htm
Gangapedia (2011, Jan 1) Retrieved Oct 10, 2015, from gangapedia: http://www.gangapedia.in/?q=content/kumbh-Mela-drops-elixir-immortality-fell-these-places-map (2011) The Koh Pich Tragedy: One Year on, Questions Remain. Phnom Penh: Cambodian
Center for Human Rights (2013) Mass gathering event management, Patna: Bihar State Disaster Management Authority.
Sindhuja Kasthala and Harshit S. Lakra
Institute of Town Planners, India Journal 12 x 4, October - December 2015
16
www.ibtimes.co.in. (2013, 2 15) Retrieved 9 2, 2015, from ibtimes: http://www.ibtimes.co.in/kumbh-Mela-2013-marred-by-series-of-tragedies-worst-stampedes-till-date-photos-435636
www.oneindia.com. (2013, 2 12) Retrieved 2 9, 2015, from one India: http://www.oneindia.com/2013/02/11/kumbh-blighted-by-tragedy-people-missing-many-dead-1147600.html
Carnifest (2015) Retrieved October 10, 2015, from Carnifest: http://www.carnifest.com/events/cambodia/phnom-penh/125/festival-of-the-reversing-current-2015-cambodian-water-festival-bon-om-tuk.aspx
Kapl-hajj (2015) Retrieved October 5, 2015, from The King Abdulaziz Public Library website: http://www.kapl-hajj.org/
Abdul Rashid Gatrad, A.S. (2005) Hajj: journey of a lifetime, BMJ , 330.
Annu Baranwal, A. A. (2015, Apr 13) Managing the Earth’s Biggest Mass Gathering Event and WASH Conditions: Maha Kumbh Mela (India), PLOS Currents Disasters, 10.
Blatt, A. J. (2015) Health, Science, and Place: A New Model. Springer .
CCHR. (2011) The Koh Pich Tragedy: One Year on, Questions Remain. Phnom Penh: Cambodian Center for Human Rights (CCHR).
Chanbo (n.d.) web6.camboda.com. Retrieved 09 01, 2015, from Cambodia: http://web6.camboda.com/xphoto.php?gcm=4111&gimi=54273
Christopher S. Bowron, S.M. (2015, July 10) Centers for Disease Control and Prevention. Retrieved October 18, 2015, from Centers for Disease Control and Prevention: http://wwwnc.cdc.gov/travel/yellowbook/2016/select-destinations/saudi-arabia-hajj-pilgrimage
Davids, A. M. (2006) Getting the Best Out of Hajj. Riyadh: King Fahad National library.
Encyclopedia Britannica, I. (2014) Britannica Book of the Year 2014. Encyclopedia Britannica.
Faisel T. Illiyas, S.K. (2013). Human stampedes during religious festivals: A comparative review of mass gathering emergencies in India. International Journal of Disaster Risk Reduction, Volume 5, 10–18.
Gad-el-Hak, M. (2008) Large-Scale Disasters: Prediction, Control, and Mitigation. Cambridge.
Googelberg. (n.d.). Hajj. In Googelberg, Islam (pp. 188-190).
Insight Guides (n.d.) Retrieved September 20, 2015, from insightguides: https://www.insightguides.com/destinations/asia-pacific/cambodia/cultural-features/bon-om-tuk-water-festival
Institute, S.A. (n.d.) Allahabad Kumbh Mela Administration, Harvard University, Harvard.
Jon Gambrell and Aya Batrawy (2015, October 14) www.businessinsider.com. Retrieved October 16, 2015, from Associated Press: http://www.businessinsider.com/ap-new-tally-shows-at-least-1621-killed-in-saudi-hajj-tragedy-2015-10?IR=T
Sindhuja Kasthala and Harshit S. Lakra
Institute of Town Planners, India Journal 12 x 4, October - December 2015
17
Kongkea, B.R. (2010, Dec 30) phnompenhpost. Retrieved Oct 15, 2015, from phnompenhpost:http://www.phnompenhpost.com/national/disaster-law-set-passage-2011
kumbhMelaallahabad.gov.in. (n.d.) Retrieved 08 29, 015, from Kumbh Mela Allahabad: http://kumbhMelaallahabad.gov.in/english/index.html
Mydans, S. (2010, November 22) New York Times. Retrieved October 20, 2015, from nytimes: http://www.nytimes.com/2010/11/23/world/asia/23cambodia.html?_r=0
NDMA (2014) Managing crowd at events and venues of Mass Gathering. NDMA.
Oliver, M. (2006, January 12). The Guardian. Retrieved October 15, 2006, from the guardian: http://www.theguardian.com/world/2006/jan/12/saudiarabia.religion
Singh, S.K. (December 2014) Environmental Management in Mass Gatherings: A Case Study of Maha Kumbh Mela 2013 at Prayag, India. IJIRST – International Journal for Innovative Research in Science and Technology, Volume 1, Issue 7, 9.
Qanta, A. and Ahmed, Y.M. (2006) Health risks at the Hajj, The Lancet, 9.
Rassool, G. (2014) Cultural Competence in Caring for Muslim Patients. London: Saffron House.
Ross, J.I. (2015) Religion and Violence: An Encyclopedia of Faith and Conflict from Antiquity to the present. New York: Routledge.
Saksena, N.S. (1987) 1954 Kumbh stampede, In Law and order in India (pp. page 81, page 164). Abhinav Publications.
Sapa-afp (2016, December 28) iol news. Retrieved October 18, 2015, from iol news: http://www.iol.co.za/news/world/millions-descend-on-mecca-for-haj-1.309057#.ViSiUfkrLWI
Still, G.K. (2013) Introduction to Crowd Science. Boca Raton: Taylor and Francis Group, LLC.
Still, G.K. (2015) gkstill Retrieved October 15, 2015, from gkstill: http://www.gkstill.com/CV/Projects/Jamarat.html
Vijapurkar, M. (2003, Aug 28) The Hindu. Retrieved Oct 19, 2015, from the Hindu: http://www.thehindu.com/2003/08/28/stories/2003082805310100.htm
Wallace, J. (2010) The Atlantic. Retrieved October 9, 2015, from the Atlantic: http://www.theatlantic.com/international/archive/2010/11/among-the-dead-after-phnom-penh-stampede/66977/
www.bbc.co.uk. (n.d.) Retrieved 08 20, 2015, from bbc.co: http://www.bbc.co.uk/religion/galleries/hajj/
Sindhuja Kasthala and Harshit S. Lakra
Institute of Town Planners, India Journal 12 x 4, October - December 2015
18
Nand Kishore, EE(c), Post Graduate Student, Transportation Engineering Group, Department of Civil Engineering, Indian Institute of Technology Roorkee, [email protected]
Pritikana Das, Research Scholar, CTRANS, Indian Institute of Technology Roorkee, [email protected]
M. Parida, MoRTH Chair Professor and Highway Systems, Department of Civil Engineering, Indian Institute of Technology Roorkee, [email protected]
1. INTRODUCTION Dehradun is a home to prestigious national institutions like Survey of India, the ONGC, and Forest Research Institute, etc. The city is emerging as a busy, economically active vibrant city serving the state as a whole from its age old image of a residential and institutional centre in the midst of peace, quiet and serene environment. Natural environment is one of the most prized elements of this city, being situated in the beautiful Doon valley. Pedestrian facilities perhaps is the most troubled one with annual vehicular growth reaching an unprecedented rate of 10 percent since most of the places, pedestrians are forced to share path with plying vehicles. This study helps to find out different parameters of design regarding facility of pedestrians around Transport Terminal or ISBT. Under the JNNURM, road and transport sectors projected Rs. 3,666.90 crore estimated budget to meet the requirements of the city and transport pedestrian facilities, which play important role for overall growth of the city.
In 1981 and 1991, the decadal growth of population of Dehradun was 21.53 percent and 21.85 percent respectively. The sudden jump to 39.73 percent in the next decade is explained by the fact that in this decade Uttarakhand was made a separate state with Dehradun as its temporary capital. In the decade 1991-2001, Dehradun achieved decadal population growth rate of 39.73 percent, which was
Nand Kishore, Pritikana Das and M. Parida
AbstractInter State Bus Terminal (ISBT) is one of the places in any city where pedestrians flow experi-enced is the highest. ISBT Dehradun is also one such place where pedestrian walkway to bus stop partially or fully encroached by daily vendors. Pedestrians are forced to move along with plying vehicles (mixed traffic). Present study elaborates different flow characteristics of pedestrians near ISBT when pedestrian move along with vehicles. Data was recorded manually and through recording of video. Percentage of male pedestrian was 62.5 percent and female pedestrians were 37.5 percent. Pedestrians flow highly depends on arrival and departure of buses. Mean speed of pedestrians found 82.25 m/min. Free flow values obtained 83.52 m/min and jam density achieved 3.60p/m2. qmax obtained 78 p/m/min at critical density 1.8 p/m2. and critical speed obtained was 41.5 m/min.
Pedestrian Flow Characteristics Around Bus Terminal, Dehradun
Nand Kishore, Pritikana Das and M. Parida
Institute of Town Planners, India Journal 12 x 4, October - December 2015
19Nand Kishore, Pritikana Das and M. Parida
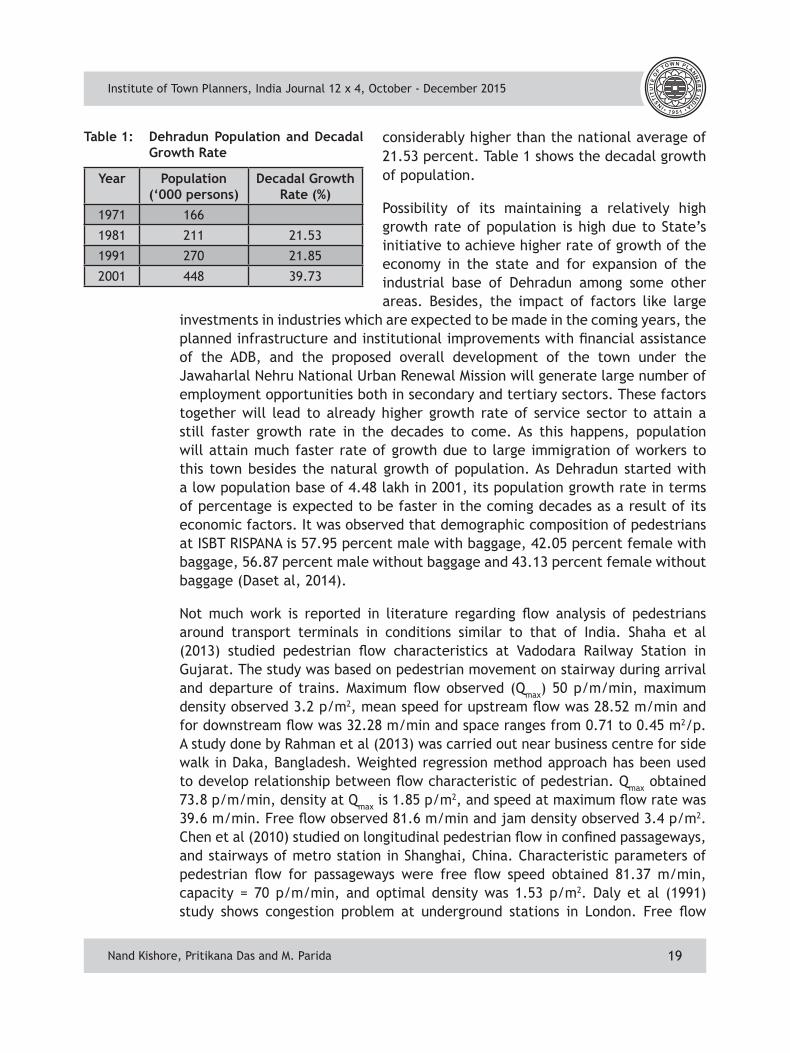
considerably higher than the national average of 21.53 percent. Table 1 shows the decadal growth of population.
Possibility of its maintaining a relatively high growth rate of population is high due to State’s initiative to achieve higher rate of growth of the economy in the state and for expansion of the industrial base of Dehradun among some other areas. Besides, the impact of factors like large
investments in industries which are expected to be made in the coming years, the planned infrastructure and institutional improvements with financial assistance of the ADB, and the proposed overall development of the town under the Jawaharlal Nehru National Urban Renewal Mission will generate large number of employment opportunities both in secondary and tertiary sectors. These factors together will lead to already higher growth rate of service sector to attain a still faster growth rate in the decades to come. As this happens, population will attain much faster rate of growth due to large immigration of workers to this town besides the natural growth of population. As Dehradun started with a low population base of 4.48 lakh in 2001, its population growth rate in terms of percentage is expected to be faster in the coming decades as a result of its economic factors. It was observed that demographic composition of pedestrians at ISBT RISPANA is 57.95 percent male with baggage, 42.05 percent female with baggage, 56.87 percent male without baggage and 43.13 percent female without baggage (Daset al, 2014).
Not much work is reported in literature regarding flow analysis of pedestrians around transport terminals in conditions similar to that of India. Shaha et al (2013) studied pedestrian flow characteristics at Vadodara Railway Station in Gujarat. The study was based on pedestrian movement on stairway during arrival and departure of trains. Maximum flow observed (Qmax) 50 p/m/min, maximum density observed 3.2 p/m2, mean speed for upstream flow was 28.52 m/min and for downstream flow was 32.28 m/min and space ranges from 0.71 to 0.45 m2/p. A study done by Rahman et al (2013) was carried out near business centre for side walk in Daka, Bangladesh. Weighted regression method approach has been used to develop relationship between flow characteristic of pedestrian. Qmax obtained 73.8 p/m/min, density at Qmax is 1.85 p/m2, and speed at maximum flow rate was 39.6 m/min. Free flow observed 81.6 m/min and jam density observed 3.4 p/m2. Chen et al (2010) studied on longitudinal pedestrian flow in confined passageways, and stairways of metro station in Shanghai, China. Characteristic parameters of pedestrian flow for passageways were free flow speed obtained 81.37 m/min, capacity = 70 p/m/min, and optimal density was 1.53 p/m2. Daly et al (1991) study shows congestion problem at underground stations in London. Free flow
Table 1: Dehradun Population and Decadal Growth Rate
Year Population (‘000 persons)
Decadal Growth Rate (%)
1971 166
1981 211 21.53
1991 270 21.85
2001 448 39.73
Institute of Town Planners, India Journal 12 x 4, October - December 2015
20
speed obtained at passageway was 91.8 m/min and speed at capacity was 36 m/min. Laxman et al (2010) studied pedestrian side-flow characteristic near Anand Vihar Inter State Bus Terminal, New Delhi. The flow was mixed type i.e. pedestrian share the lane with vehicular traffic. Free flow observed was 83.79 m/min, jam density was 4.17 p/m2, maximum flow rate (Qmax) was 87.79 p/m/min, area module at qmax was 0.53 m2/ped and minimum found 0.24 m2/ped. Sarkar et al (2000) studied pedestrian flow characteristics at an inter-modal transfer terminal in Calcutta. At Howrah Station Subway results were: pedestrian speed was 87.59 m/min, maximum flow 92 p/m/min, and space required at maximum flow 0.48 m2/ped. Hofei et al (2009) studied pedestrian flow characteristics analysis and model parameter calibration in comprehensive Transport Terminal. Results of study were in corridors maximum flow (Qmax) was 70p/m/min, space required at maximum flow was 0.61 m2/p, minimum space 0.3 m2/p, free flow 101.22 m/min, and jam density obtained 2.864 p/m2. T. Ilango (2011) in an unpublished thesis on Modelling of Pedestrian Behaviour in Urban Area suggested mean speed of pedestrian near ISBT New Delhi was 71.53 m/min, near Railway Station, Coimbatore was 69.39 m/min and near Bus Terminal, Coimbatore was 62.95 m/min. Free flow obtained at ISBT New Delhi was 98.16 m/min, and near Railway Station, Coimbatore 91.60 m/min. Fruin (1971) studied 1,000 passengers without bags walking inside the Port Authority Bus Terminal and Penn Station in New York City. He observed females walk slower than males and after the age of 65 walking speed generally reduces. Mean speed observed was 81.00 m/min.
2. DATA COLLECTION
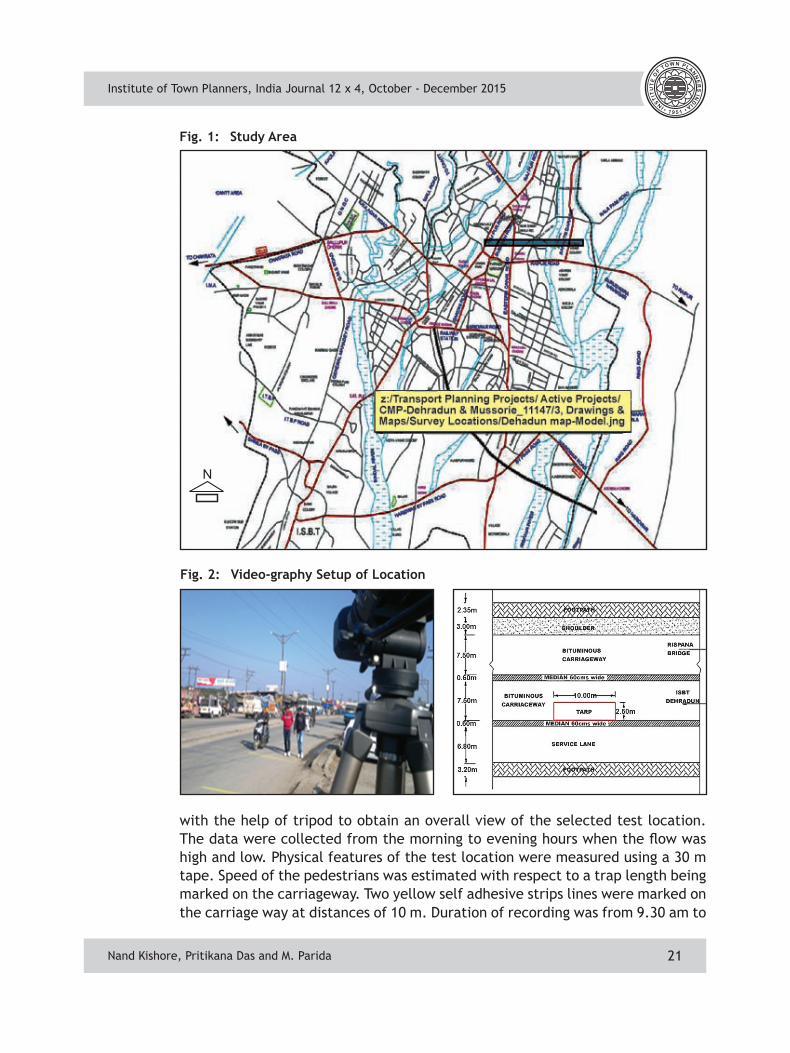
A map of the study area Dehradun ISBT is shown in Fig. 1. Sketch and actual video-graphy set up of the location shown in Fig. 2. Dehradun is one of the gateways of Uttarakhand. In addition it is a border of two states: Himachal Pradesh and Uttar Pradesh. To select a suitable location for carrying out pedestrian flow study, the following general points were given consideration:
• Pedestrians share in the total traffic is high;
• Effective width of the road remains uniform along the segment considered;
• No intersection falls within the segment and adjacent it which can influence the speeds; and
• The road segment is clearly visible from an accessible vantage point
Considering the above pedestrian flow was recorded with video camera make Sony,details of camera and site are summarized (Table 2).
Manual and video graphic method was used to capture traffic flow at the selected locations. Hourly pedestrian volume study was done manually during 16 hour at ISBT Dehradun and graphical representation of hourly pedestrian volume is shown in Fig. 3, 4 and 5. In video-graphy survey camera was fixed at an elevated position
Nand Kishore, Pritikana Das and M. Parida
Institute of Town Planners, India Journal 12 x 4, October - December 2015
21
with the help of tripod to obtain an overall view of the selected test location. The data were collected from the morning to evening hours when the flow was high and low. Physical features of the test location were measured using a 30 m tape. Speed of the pedestrians was estimated with respect to a trap length being marked on the carriageway. Two yellow self adhesive strips lines were marked on the carriage way at distances of 10 m. Duration of recording was from 9.30 am to
Fig. 1: Study Area
Fig. 2: Video-graphy Setup of Location
Nand Kishore, Pritikana Das and M. Parida
Institute of Town Planners, India Journal 12 x 4, October - December 2015
22
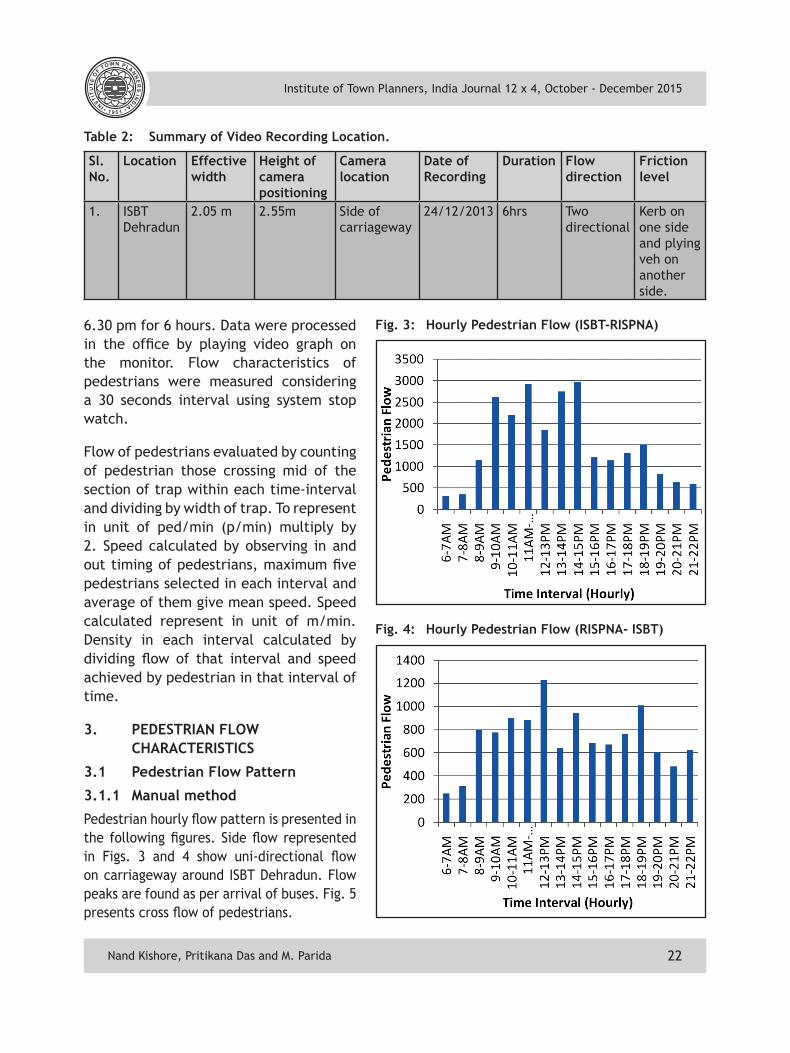
6.30 pm for 6 hours. Data were processed in the office by playing video graph on the monitor. Flow characteristics of pedestrians were measured considering a 30 seconds interval using system stop watch.
Flow of pedestrians evaluated by counting of pedestrian those crossing mid of the section of trap within each time-interval and dividing by width of trap. To represent in unit of ped/min (p/min) multiply by 2. Speed calculated by observing in and out timing of pedestrians, maximum five pedestrians selected in each interval and average of them give mean speed. Speed calculated represent in unit of m/min. Density in each interval calculated by dividing flow of that interval and speed achieved by pedestrian in that interval of time.
3. PEDESTRIAN FLOW CHARACTERISTICS
3.1 Pedestrian Flow Pattern
3.1.1 Manual method
Pedestrian hourly flow pattern is presented in the following figures. Side flow represented in Figs. 3 and 4 show uni-directional flow on carriageway around ISBT Dehradun. Flow peaks are found as per arrival of buses. Fig. 5 presents cross flow of pedestrians.
Sl. No.
Location Effective width
Height of camera positioning
Camera location
Date of Recording
Duration Flow direction
Friction level
1. ISBT Dehradun
2.05 m 2.55m Side of carriageway
24/12/2013 6hrs Two directional
Kerb on one side and plying veh on another side.
Table 2: Summary of Video Recording Location.
Fig. 3: Hourly Pedestrian Flow (ISBT-RISPNA)
Fig. 4: Hourly Pedestrian Flow (RISPNA- ISBT)
Nand Kishore, Pritikana Das and M. Parida
Institute of Town Planners, India Journal 12 x 4, October - December 2015
23
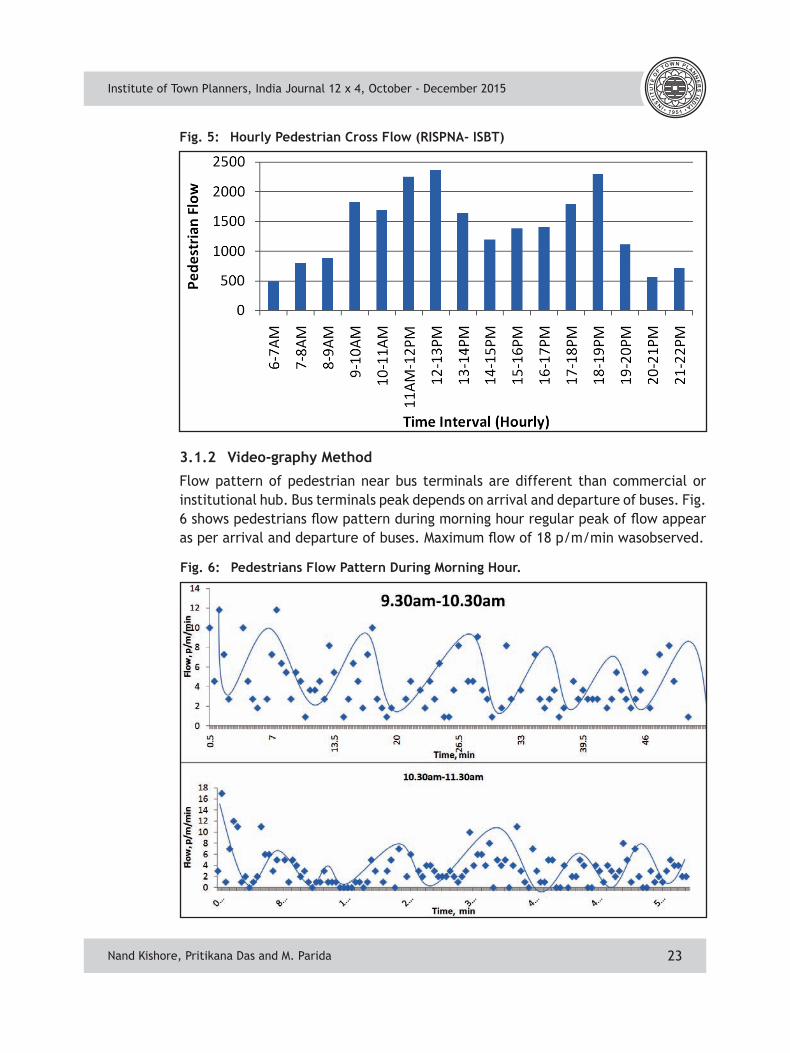
3.1.2 Video-graphy Method
Flow pattern of pedestrian near bus terminals are different than commercial or institutional hub. Bus terminals peak depends on arrival and departure of buses. Fig. 6 shows pedestrians flow pattern during morning hour regular peak of flow appear as per arrival and departure of buses. Maximum flow of 18 p/m/min wasobserved.
Fig. 5: Hourly Pedestrian Cross Flow (RISPNA- ISBT)
Nand Kishore, Pritikana Das and M. Parida
Fig. 6: Pedestrians Flow Pattern During Morning Hour.
Institute of Town Planners, India Journal 12 x 4, October - December 2015
24
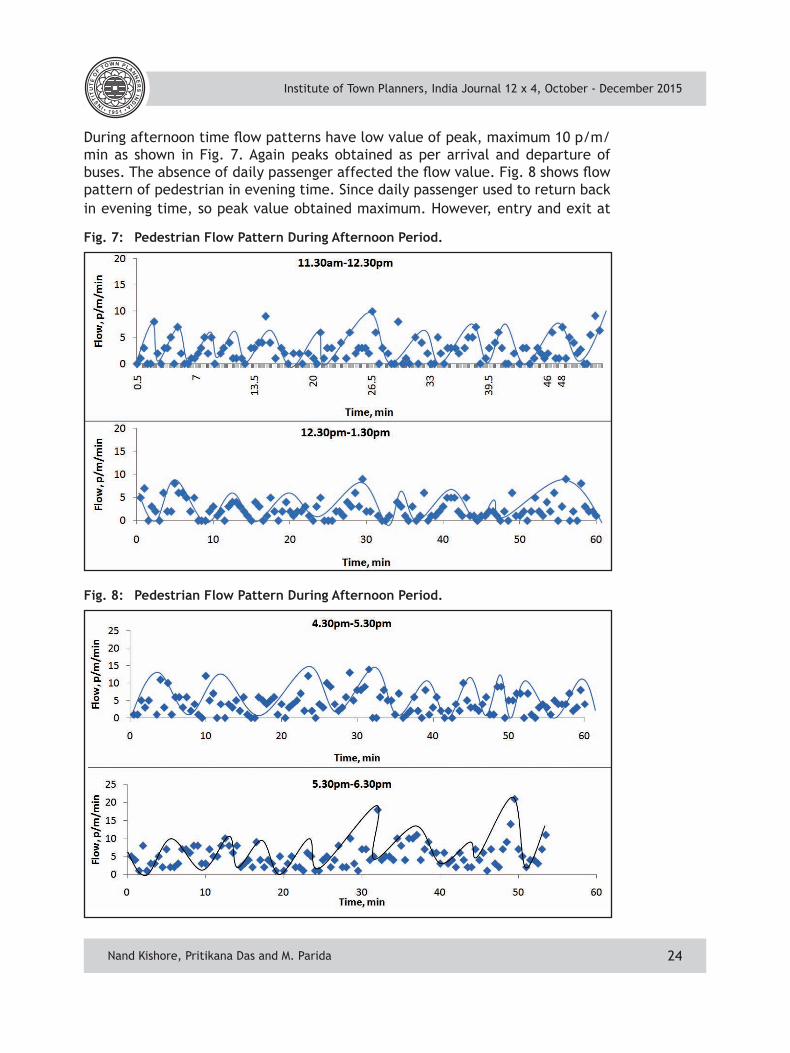
During afternoon time flow patterns have low value of peak, maximum 10 p/m/min as shown in Fig. 7. Again peaks obtained as per arrival and departure of buses. The absence of daily passenger affected the flow value. Fig. 8 shows flow pattern of pedestrian in evening time. Since daily passenger used to return back in evening time, so peak value obtained maximum. However, entry and exit at
Fig. 7: Pedestrian Flow Pattern During Afternoon Period.
Nand Kishore, Pritikana Das and M. Parida
Fig. 8: Pedestrian Flow Pattern During Afternoon Period.
Institute of Town Planners, India Journal 12 x 4, October - December 2015
25
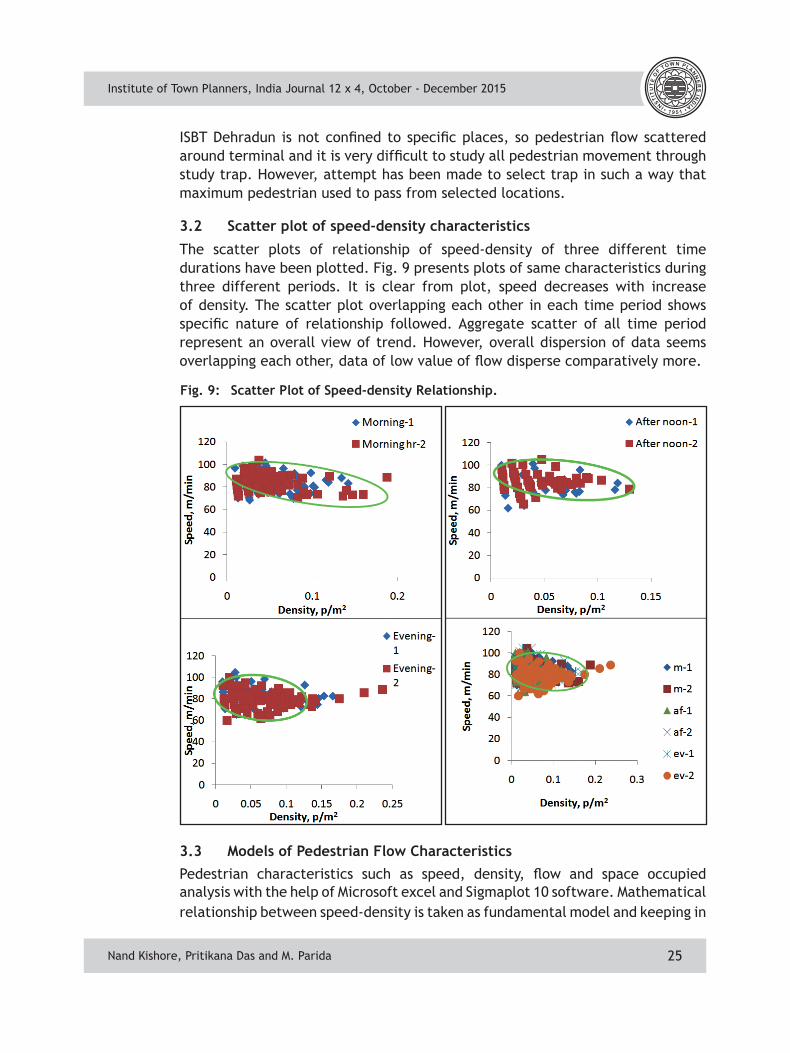
Fig. 9: Scatter Plot of Speed-density Relationship.
Nand Kishore, Pritikana Das and M. Parida
ISBT Dehradun is not confined to specific places, so pedestrian flow scattered around terminal and it is very difficult to study all pedestrian movement through study trap. However, attempt has been made to select trap in such a way that maximum pedestrian used to pass from selected locations.
3.2 Scatter plot of speed-density characteristics
The scatter plots of relationship of speed-density of three different time durations have been plotted. Fig. 9 presents plots of same characteristics during three different periods. It is clear from plot, speed decreases with increase of density. The scatter plot overlapping each other in each time period shows specific nature of relationship followed. Aggregate scatter of all time period represent an overall view of trend. However, overall dispersion of data seems overlapping each other, data of low value of flow disperse comparatively more.
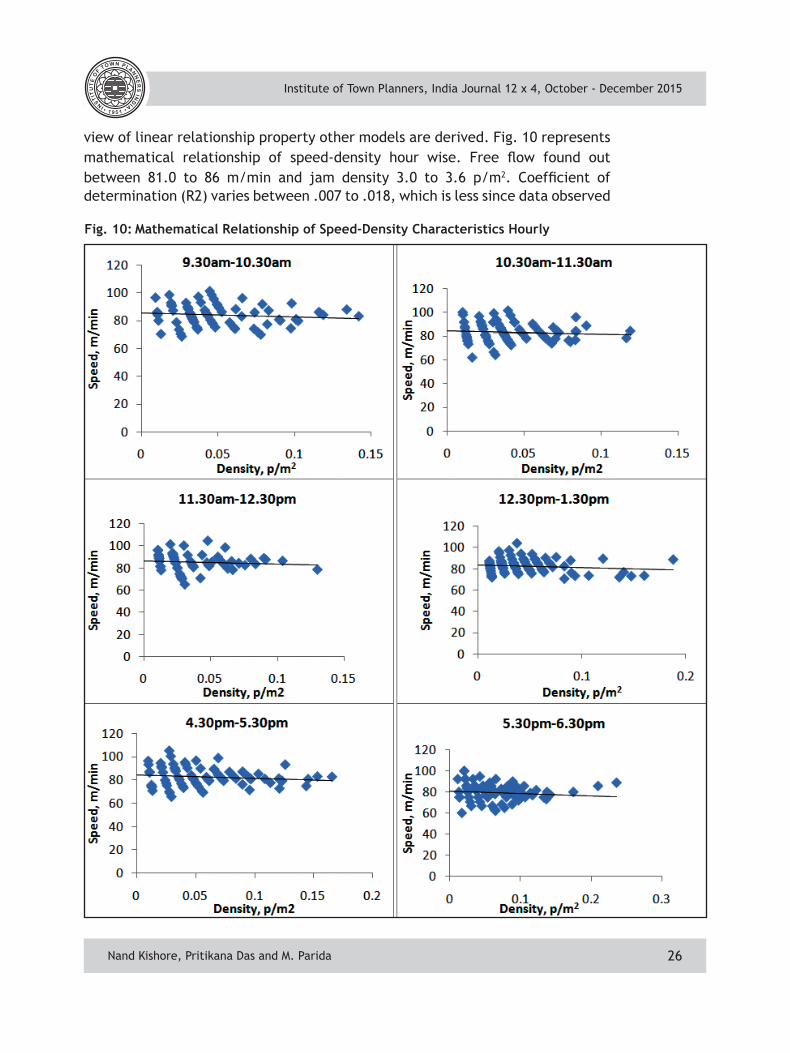
3.3 Models of Pedestrian Flow CharacteristicsPedestrian characteristics such as speed, density, flow and space occupied analysis with the help of Microsoft excel and Sigmaplot 10 software. Mathematical relationship between speed-density is taken as fundamental model and keeping in
Institute of Town Planners, India Journal 12 x 4, October - December 2015
26
view of linear relationship property other models are derived. Fig. 10 represents mathematical relationship of speed-density hour wise. Free flow found out between 81.0 to 86 m/min and jam density 3.0 to 3.6 p/m2. Coefficient of determination (R2) varies between .007 to .018, which is less since data observed
Fig. 10: Mathematical Relationship of Speed-Density Characteristics Hourly
Nand Kishore, Pritikana Das and M. Parida
Institute of Town Planners, India Journal 12 x 4, October - December 2015
27
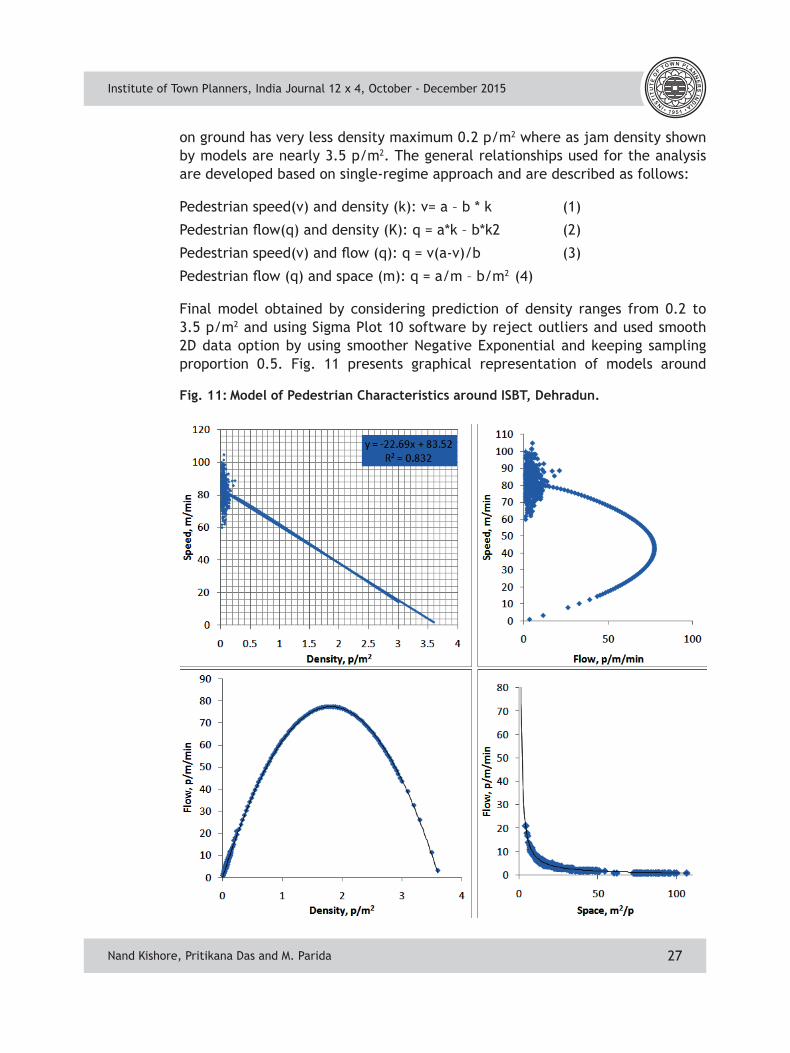
on ground has very less density maximum 0.2 p/m2 where as jam density shown by models are nearly 3.5 p/m2. The general relationships used for the analysis are developed based on single-regime approach and are described as follows:
Pedestrian speed(v) and density (k): v= a – b * k (1)
Pedestrian flow(q) and density (K): q = a*k – b*k2 (2)
Pedestrian speed(v) and flow (q): q = v(a-v)/b (3)
Pedestrian flow (q) and space (m): q = a/m – b/m2 (4)
Final model obtained by considering prediction of density ranges from 0.2 to 3.5 p/m2 and using Sigma Plot 10 software by reject outliers and used smooth 2D data option by using smoother Negative Exponential and keeping sampling proportion 0.5. Fig. 11 presents graphical representation of models around
Fig. 11: Model of Pedestrian Characteristics around ISBT, Dehradun.
Nand Kishore, Pritikana Das and M. Parida
Institute of Town Planners, India Journal 12 x 4, October - December 2015
28
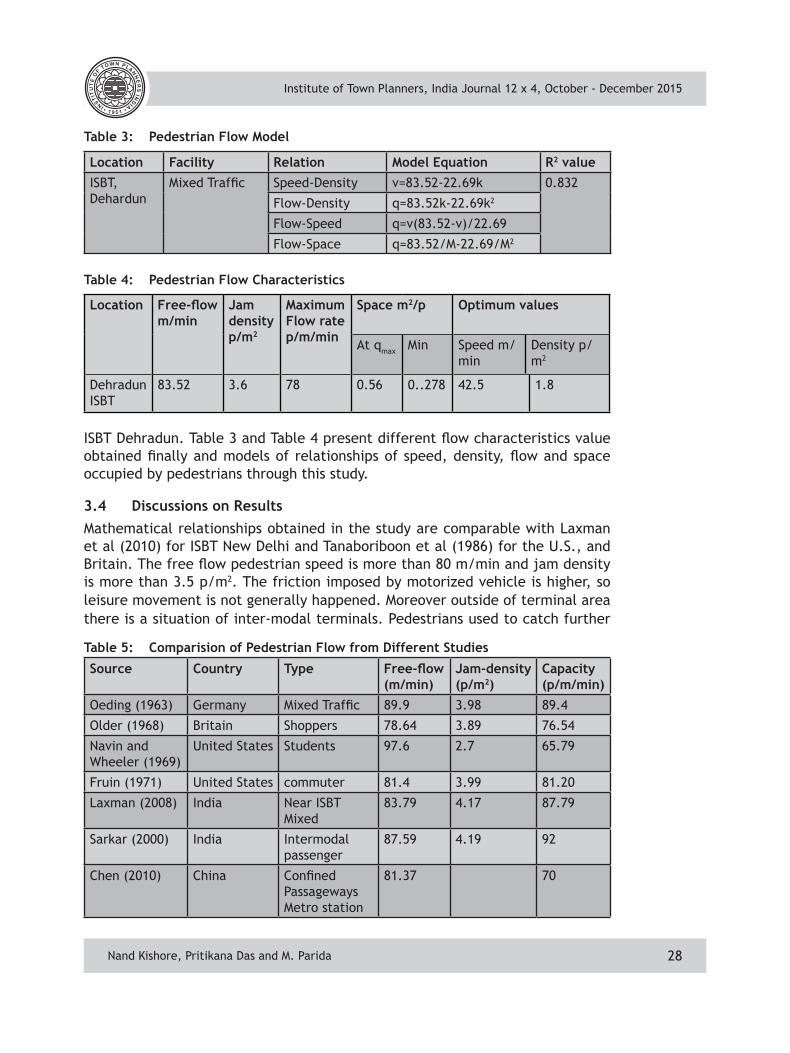
ISBT Dehradun. Table 3 and Table 4 present different flow characteristics value obtained finally and models of relationships of speed, density, flow and space occupied by pedestrians through this study.
3.4 Discussions on ResultsMathematical relationships obtained in the study are comparable with Laxman et al (2010) for ISBT New Delhi and Tanaboriboon et al (1986) for the U.S., and Britain. The free flow pedestrian speed is more than 80 m/min and jam density is more than 3.5 p/m2. The friction imposed by motorized vehicle is higher, so leisure movement is not generally happened. Moreover outside of terminal area there is a situation of inter-modal terminals. Pedestrians used to catch further
Table 5: Comparision of Pedestrian Flow from Different Studies
Source Country Type Free-flow (m/min)
Jam-density (p/m2)
Capacity (p/m/min)
Oeding (1963) Germany Mixed Traffic 89.9 3.98 89.4
Older (1968) Britain Shoppers 78.64 3.89 76.54
Navin and Wheeler (1969)
United States Students 97.6 2.7 65.79
Fruin (1971) United States commuter 81.4 3.99 81.20
Laxman (2008) India Near ISBT Mixed
83.79 4.17 87.79
Sarkar (2000) India Intermodal passenger
87.59 4.19 92
Chen (2010) China Confined Passageways Metro station
81.37 70
Location Facility Relation Model Equation R2 valueISBT, Dehardun
Mixed Traffic Speed-Density v=83.52-22.69k 0.832
Flow-Density q=83.52k-22.69k2
Flow-Speed q=v(83.52-v)/22.69
Flow-Space q=83.52/M-22.69/M2
Location Free-flow m/min
Jam density p/m2
Maximum Flow rate p/m/min
Space m2/p Optimum values
At qmax Min Speed m/min
Density p/m2
Dehradun ISBT
83.52 3.6 78 0.56 0..278 42.5 1.8
Table 3: Pedestrian Flow Model
Table 4: Pedestrian Flow Characteristics
Nand Kishore, Pritikana Das and M. Parida
Institute of Town Planners, India Journal 12 x 4, October - December 2015
29
mode of transport for their destination. So they used to walk fast. Capacity found 78 p/m/min, which is comparable with U.S., and Britain. Sarkar (2000) found higher value of capacity of pedestrian than present study, probably being a mostly daily passenger in Kolkatta having less or no luggage than passenger of present study. Table 3 shows the flow characteristics models obtained by present study. The flow characteristic values of present study are summarized in Table 4 and compared with values obtained through other studies (Table 5).
4. CONCLUSIONS
Pedestrian flow characteristics were analyzed around Transport Terminal at ISBT Dehradun in this study. The results were found comparable to those locations having higher flow globally. Inter-modal transfer terminal in Kolkata experienced higher speed since there was no friction with plying vehicles and moreover all pedestrians are daily passengers having no luggage with them and have to reach office in time. ISBT New Delhi and a metro station in China show comparable results. The present study shows that the characteristics of bus time table (arrival and departure) and friction of traffics have their effect on pedestrian flow characteristics. The plying vehicles play important role to affect the flow and speed of pedestrians. It is therefore important to provide pedestrian facilities fully protected from encroachments by elevating or guard-railing pathways. So that pedestrians are not forced to move on carriage-ways. The optimum area required per pedestrian may decide the size of a pedestrian facility to be provided. Segregation of pedestrian from vehicular traffic should be based on the flow characteristics i.e. flow-density. Speed can help to find out the time in which facilities can be cleared out. Thus, the findings of this paper have some implications for designing pedestrian facilities around transport terminals.
REFERENCESAl-Masaeid, H.R., Al-Suleiman, T.I., and Nelson, D.C. (1993) Pedestrian speed flow relationship for central business areas in developing countries, Transp. Res. Rec., Vol. 1396, pp. 69–74.Arasan, V.T., Rengaraju, V.R., and Rao, K.V.K. (1994) Characteristics of trips by foot and bicycle modes in Indian city, J. Transp. Eng., Vol. 120, No. 2, pp. 283–294.Chen, X., Ye, J., and Jian, N. (2010) Relationships and Characteristics of Pedestrian Traffic Flow in Confined Passageways, TRB No. 2198, pp. 32-40.Curtin University of Technology (2006) West Perth Pedestrian Study, Curtin University of Technology, City of Perth and Geographia, Perth.Das, P., Parida, M. and Katiyar, V.K. (2014) Characteristics of Macro-level Pedestrian Movement for Planning of Pedestrian Infrastructure, International Civil Engineering Symposium-ICES’14, 306-315. Fruin, J.J. (1971) Pedestrian Planning and Design, Elevator World Inc., Ala.Gerilla, G.P. (1995) Proposed level of service standards for walkways in Metro Manila, J. East. Asia Soc. Transp. Stud., Vol. 1, No. 3, pp. 1041–1060.
Nand Kishore, Pritikana Das and M. Parida
Institute of Town Planners, India Journal 12 x 4, October - December 2015
30
Gupta, R.G. (1986) Delhi 2010 AD: Cycle—An important mode even after the 20th century, Proc., Int. Conf. on Transportation System Studies, IIT, Delhi, India, 625–632.Hoel, L. A. (1968) Pedestrian travel rates in central business district, Traffic Eng., Vol. 39, No. 4, pp. 10–13.Kamino, K. (1980) People’s movement and town design, Shôkokusha, Japan.Koushki, P.A. (1988) “Walking characteristics in Central Riyadh, Saudi Arabia.” J. Transp. Eng., 4(6), 735–744.Koushki, P.A., and Ali, S.Y. (1993) “Pedestrian characteristics and the promotion of walking in Kuwait City Center, Transp. Res. Rec., Vol. 1396, pp. 30–33.Lam, W.H.K., Morrall, J.F., and Ho, H. (1995) Pedestrian flow characteristics in Hong Kong, Transp. Res. Rec., Vol. 1487, pp. 56–61.Morrall, J.F., Ratnayake, L.L., and Seneviratne, P.N. (1991) Comparison of central business district pedestrian characteristics in Canada and Sri Lanka, Transp. Res. Rec., Vol. 1294, pp. 57–61.Navin, F.P.D., and Wheeler, R.J. (1969) Pedestrian flow characteristics, Traffic Eng. Control, Vol. 39, No. 9, pp.30–36.O’Flaherty, C. A. (1997) Transport Planning and Traffic Engineering, Arnold, London.Oeding, D. (1963) Verkehrsbelastung und dimensionierung von gehwegen und anderen anlagen des fussgangerverkehrs, Vol. 22, Strassenbau und Stasserverkehrstechnik, Bonn, Germany _in German_.Older, S.J. (1968) Movement of pedestrians on footways in shopping streets, Traffic Eng. Control, Vol. 10, No. 4, pp. 160–163.Polus, A., Schofer, J.L., and Ushpiz, A. (1983) Pedestrian flow and level of service, J. Transp. Eng., Vol. 109, No. 1, pp. 46–56.Rastogi, R., Kotkar, K.L., and Chandra, S. (2008) Pedestrian flow characteristics on a walkway near bus terminus, Proc., Int. Conf. on Best Practices to Relieve Congestion on Mixed Traffic Urban Streets in Developing Countries, IIT Madras, Chennai, India, 267–276.Sarkar, A.K., and Janardhan, K. (2000) Pedestrian Flow Characteristics at an Intermodal Transfer Terminal in Calcutta, W.T. P and P, Vol. 6, pp. 32-38.Tanaboriboon, Y., and Guyano, J.A. (1991) Analysis of pedestrian movements in Bangkok, Transp. Res. Rec., Vol. 1294, pp. 52–56.Tanaboriboon, Y., Hwa, S.S., and Chor, C.H. (1986) Pedestrian characteristics study in Singapore, J. Transp. Eng., Vol. 112, No. 3, pp. 229–235.Tanaboriboon, Y., and Jing, Q. (1994) Chinese pedestrians and their walking characteristics: Case study in Beijing, Transp. Res. Rec., Vol. 1441, pp. 16–26.Victor, D.J. (1989) Pedestrian traffic management in Indian cities, Presented at 5th World Conf. on Transportation Research, Yokohama, Japan.Virkler, M.R., and Elayadath, S. (1994) Pedestrian speed-flow-density relationships, Transp. Res. Rec., Vol. 1438, pp. 51–58.
Nand Kishore, Pritikana Das and M. Parida
Institute of Town Planners, India Journal 12 x 4, October - December 2015
31
Anika Kapoor, Faculty at Amity School of Architecture and Planning; [email protected]
An Integrated Approach to Plan Development of a Historic City
Anika Kapoor
1. INTRODUCTION
As an urban planner, having done research for conservation projects with different heritage related authorities and agencies; I have closely witnessed the impact of heritage resources on the city and vice versa. Over a period of time, my realization developed into a perspective that actually these two components i.e. heritage and city planning are integral and complimentary parts of each other. Heritage conservation and urban planning has to go hand in hand for preservation and development of both. But there is a missing link between the two which is causing deterioration of the city and its heritage. This paper, argues for following an integrated approach as a link between the two subjects to ensure a holistic development of a historic city.
A historic city represents layers that have been evolved, developed, interpreted, and transformed by generations and therefore, reflects accumulation of cultures and values. Present morphology, built form, open and green spaces, and infrastructure of a city is a replica of its past. Thus, its future development and growth is also dependent on its history. The fabric of the historic cities is endangered of being partially or completely destroyed in the name of urbanization. Therefore, there is an increased realization of the importance of heritage in the urban set up and one has to gradually move away from simply making an inventory of heritage resources to an integrated and authentic approach to conservation in the process of urban development.
AbstractHeritage is an identity of the space, a pride, a reflection of the glorious past and not just the records of the past. Therefore, there is a need to realize whether heritage conversation is the responsibility of the government, community or it is a shared responsibility. It is important in the present scenario to identify forces that control planning so as to derive heritage led approach to city planning for historic cities. In fact, an integrated approach is required to plan future cities so as to understand relationship between what is already built and what ought to be built as it is critical to incorporate heritage conservation as integral part in the overall process of urban development. This article examines the current conflict between heritage conservation and urban development. An attempt has been made to carve out an integrated sustainable approach for the future planning of historic cities.
Anika Kapoor
Institute of Town Planners, India Journal 12 x 4, October - December 2015
32
2. EXISTING TOOLS AND POLICIES
A feature of urban planning in post independent India is the tendency to develop new areas instead of developing around the old areas. It took years for government to realize the importance of heritage and the need to make the inventory of remaining historic buildings and protect them through the systematic planning. Heritage is not something that can be left unattended to the people who only appreciate its aesthetics and value. It seeks a framework, an approach for the government to take action upon. Therefore, it is crucial to understand the existing heritage acts and policies and their relationships with other elements of urban set up.
The important heritage legislations that impact city development also are the Indian Treasure Trove Act (1878), the Ancient Monuments Preservation Act of (1904), the Ancient Monuments and Archaeological Sites and Remains Act (1958), the Antiquities and Art Treasures Act (1972) and the Ancient Monuments and Archaeological Sites and Remains( Amendment and Validation) Act 2010. Existing acts, policies and laws are supreme in the process of planning and thus become links and encouraging factors for conservation in the view of urban development. The existing heritage law seems to be monument and heritage centric and rigid, restricting the local people to interact with the heritage and thus resulting in lost of their interest in them whereas any development that takes place has to be people - centric to be appreciated and accepted. According to section 20A of the Ancient Monument and Archaeological Sites and Remains Act (amendment and validation act), 2010, every area, beginning at the limit of the protected area or the protected monument, as the case may be, and extending to a distance of one hundred meters in all directions shall be the prohibited area in respect of such protected area or protected monument and no construction is allowed in this zone. Area starting from the boundary of the protected or prohibited area extended up to a distance of 200 meters in all directions shall be called the regulated area. This is an area where one has to go through a lengthy and tortuous process of seeking permission from ASI for any development.
National Monuments Authority and the competent authority are established under section 20C and 20D of Ancient Monuments and Archaeological Sites and Remains (Validation and Amendment) Act, 2010 for grant of permission in prohibited and regulated areas in respect of 174 centrally protected monuments and archaeological sites in NCT of Delhi. As per section 20 (E) of AMASR Act, 2010 and Rule 18 of NMA rules, heritage byelaws are required to be prepared for each monument separately. Each monument and its surroundings are different, so site specific guidelines and recommendations were to be made based on location, land use, physical characteristics, socio-economic profile, density and other
Anika Kapoor
Institute of Town Planners, India Journal 12 x 4, October - December 2015
33
assessment. This would have been a very positive step towards integration of heritage and city planning. But unfortunately, after the notification of Shershah Gate in 2012 by the ASI, the pace declined because of lack of will and no more byelaws have been made.
The agencies concerned with the protection of heritage structures and sites are ASI, State Archaeology Department, GNCTD, and New Delhi Municipal Council, the three municipal corporations of Delhi, Cantonment Board and DDA. Out of all the monuments in Delhi, the Delhi Circle of ASI lists 174 monuments. A list of 250 unprotected monuments has been prepared by the State Department of Archaeology and they have already protected 48 monuments. MCD and NDMC have prepared a list of 1,200 monuments across the city to be protected and conserved in future.
Master Plan for Delhi, 2021 devotes a chapter on heritage as it is one of the important aspects of city planning. As part of its efforts to preserve the city’s heritage fabric, the DDA has identified six heritage zones and designated three archaeological parks in the Master Plan for Delhi, 2021. Delhi Development Authority realized the importance of heritage conservation only in 1993 and an annual ‘DDA Urban Heritage Award’ was instituted, but it was only offered till 1997. The award was aimed at encouraging the preservation of both public and private heritage buildings. In 1999, it established a full-fledged Delhi Urban Heritage Foundation (DUHF) with the Lt Governor as its chairman, and the body instead started providing aid for preservation of heritage buildings.
This development is an outcome of a plan that is worked out comprehensively and cohesively with all aspects of planning, be it housing, transport, open green spaces, infrastructure or heritage, dealt together. Unfortunately, in our cities, all the departments work in isolation without consent or coordination with others, thereby resulting in faulty urban practices. Heritage is confined to the smallest of government departments and not at all involved in overall city planning mechanisms. Heritage conservation cannot be effective through the uncoordinated actions of different stakeholders. It is a two way process. There is a relationship between beneficiaries, promoters, propagators and sponsors and financiers. The list of the stakeholders and their role in heritage led development of a historic city is given in Table-1, which explains that all the stakeholders are beneficiaries one way or the other but only those who can either be heard by the authorities or the authorities themselves can promote the heritage led development. Key players are listed as sponsors or financiers. They are actually the contributors to preserve heritage but unfortunately the links between them is weak at each level. The demand and interest to conserve
Anika Kapoor
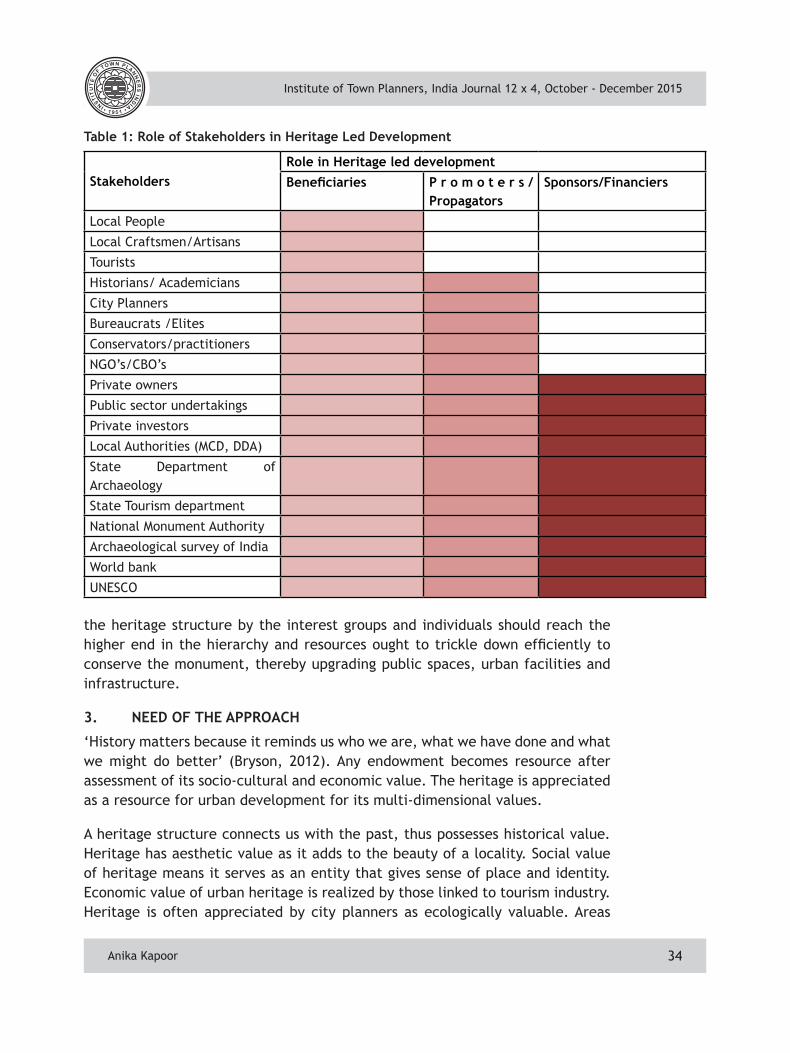
Institute of Town Planners, India Journal 12 x 4, October - December 2015
34
the heritage structure by the interest groups and individuals should reach the higher end in the hierarchy and resources ought to trickle down efficiently to conserve the monument, thereby upgrading public spaces, urban facilities and infrastructure.
3. NEED OF THE APPROACH
‘History matters because it reminds us who we are, what we have done and what we might do better’ (Bryson, 2012). Any endowment becomes resource after assessment of its socio-cultural and economic value. The heritage is appreciated as a resource for urban development for its multi-dimensional values.
A heritage structure connects us with the past, thus possesses historical value. Heritage has aesthetic value as it adds to the beauty of a locality. Social value of heritage means it serves as an entity that gives sense of place and identity. Economic value of urban heritage is realized by those linked to tourism industry. Heritage is often appreciated by city planners as ecologically valuable. Areas
StakeholdersRole in Heritage led developmentBeneficiaries P r o m o t e r s /
PropagatorsSponsors/Financiers
Local People
Local Craftsmen/Artisans
Tourists
Historians/ Academicians
City Planners
Bureaucrats /Elites
Conservators/practitioners
NGO’s/CBO’s
Private owners
Public sector undertakings
Private investors
Local Authorities (MCD, DDA)
State Department of Archaeology
State Tourism department
National Monument Authority
Archaeological survey of India
World bank
UNESCO
Anika Kapoor
Table 1: Role of Stakeholders in Heritage Led Development
Institute of Town Planners, India Journal 12 x 4, October - December 2015
35
in and around heritage are preserved as green open spaces, which act as lung spaces for the sprawling city. Heritage is threatened not just by bricks and mortar, but more by haphazard and unplanned urban sprawl that is ruining the visual environment too.
For many years, planners, architects, politicians and other influential groups of society have paid little or no attention to heritage preservation and have marked significant portion of historic fabric as areas for urban renewal in urban development plans. The concern for the disappearing culture has led historians, intellectuals, artists and experts to propagate heritage since recent past. After a long period of neglect, the government too has realized the importance of the heritage.
4. A CASE STUDY- MEHRAULI
A case study of Mehrauli is taken up to showcase the rising need to protect and conserve heritage. Mehrauli is one of the seven ancient cities that make up the present state of Delhi. The Mehrauli area has seen habitation for many centuries and thus is historically an eminent part of the city. This area inhabits monument of different eras and time periods, many of which are still alive in the urban morphology while numerous have been lost in the history. Rich history has left a lasting legacy in Mehrauli. This includes not only a density of heritage structures, but a living, vibrant, spiritual and cultural tradition, which is unique to Mehrauli and has been in existence for more than two centuries.
Today Mehrauli lies in the South West district of Delhi. The Master Plan for Delhi marks part of this area as residential, which forms the Mehrauli village, and other is shown as reserved forest i.e. Mehrauli Archaeological Park. Together this area houses more than 100 identified heritage structures and many lie unidentified. The Fig. 1 shows the density of heritage buildings in and around Mehrauli.
Protected and unprotected monuments in the Mehrauli area have been reviewed and their status has been assessed to understand the importance of heritage for the city planners, heritage experts and other stakeholders, thereby affecting city development. There are 16 centrally protected monuments in Mehrauli and surrounding areas. They fetch large number of tourists and visitors every year. Although these buildings are not just heritage but also economic assets, these heritage structures are not periodically maintained and thus they too suffer from neglect and negligence.
There are many historically and architecturally important monuments in Mehrauli that are unprotected which are being destroyed, illegally encroached upon or completely demolished and there is no policy for the safeguard of these heritage buildings. Few of the monuments have been shown in the Fig. 2. After the analysis of the monuments and heritage structures on site, it was discovered that there
Anika Kapoor
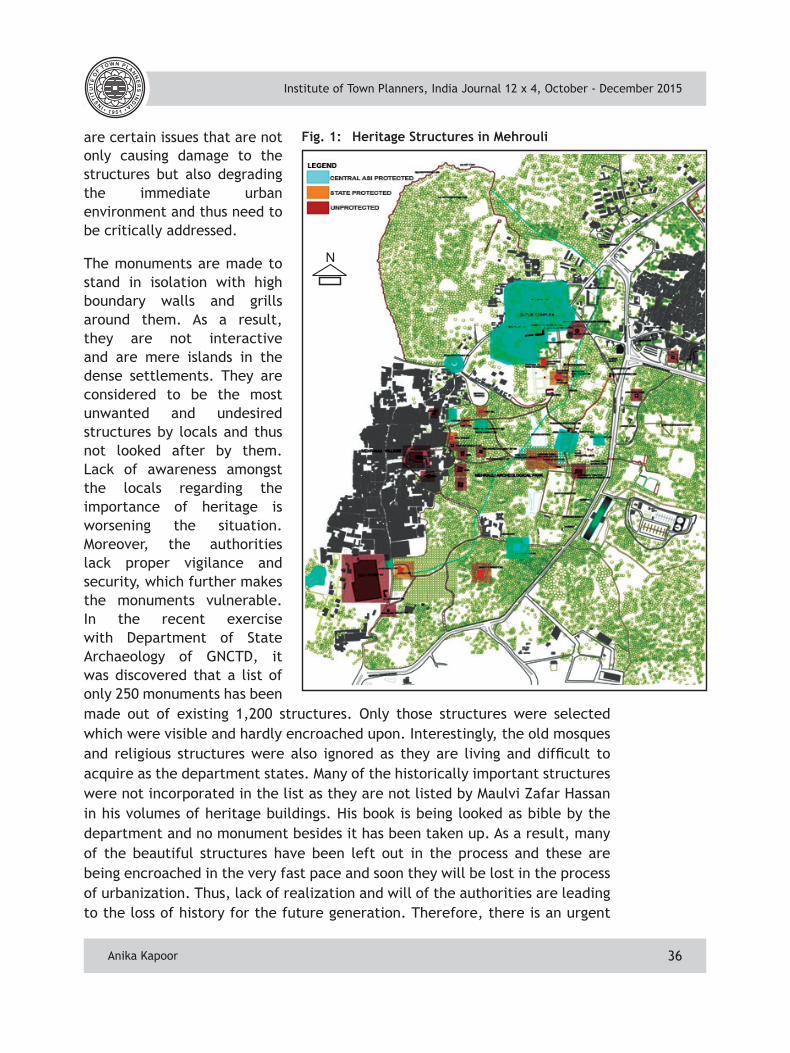
Institute of Town Planners, India Journal 12 x 4, October - December 2015
36
are certain issues that are not only causing damage to the structures but also degrading the immediate urban environment and thus need to be critically addressed.
The monuments are made to stand in isolation with high boundary walls and grills around them. As a result, they are not interactive and are mere islands in the dense settlements. They are considered to be the most unwanted and undesired structures by locals and thus not looked after by them. Lack of awareness amongst the locals regarding the importance of heritage is worsening the situation. Moreover, the authorities lack proper vigilance and security, which further makes the monuments vulnerable. In the recent exercise with Department of State Archaeology of GNCTD, it was discovered that a list of only 250 monuments has been made out of existing 1,200 structures. Only those structures were selected which were visible and hardly encroached upon. Interestingly, the old mosques and religious structures were also ignored as they are living and difficult to acquire as the department states. Many of the historically important structures were not incorporated in the list as they are not listed by Maulvi Zafar Hassan in his volumes of heritage buildings. His book is being looked as bible by the department and no monument besides it has been taken up. As a result, many of the beautiful structures have been left out in the process and these are being encroached in the very fast pace and soon they will be lost in the process of urbanization. Thus, lack of realization and will of the authorities are leading to the loss of history for the future generation. Therefore, there is an urgent
Fig. 1: Heritage Structures in Mehrouli
Anika Kapoor
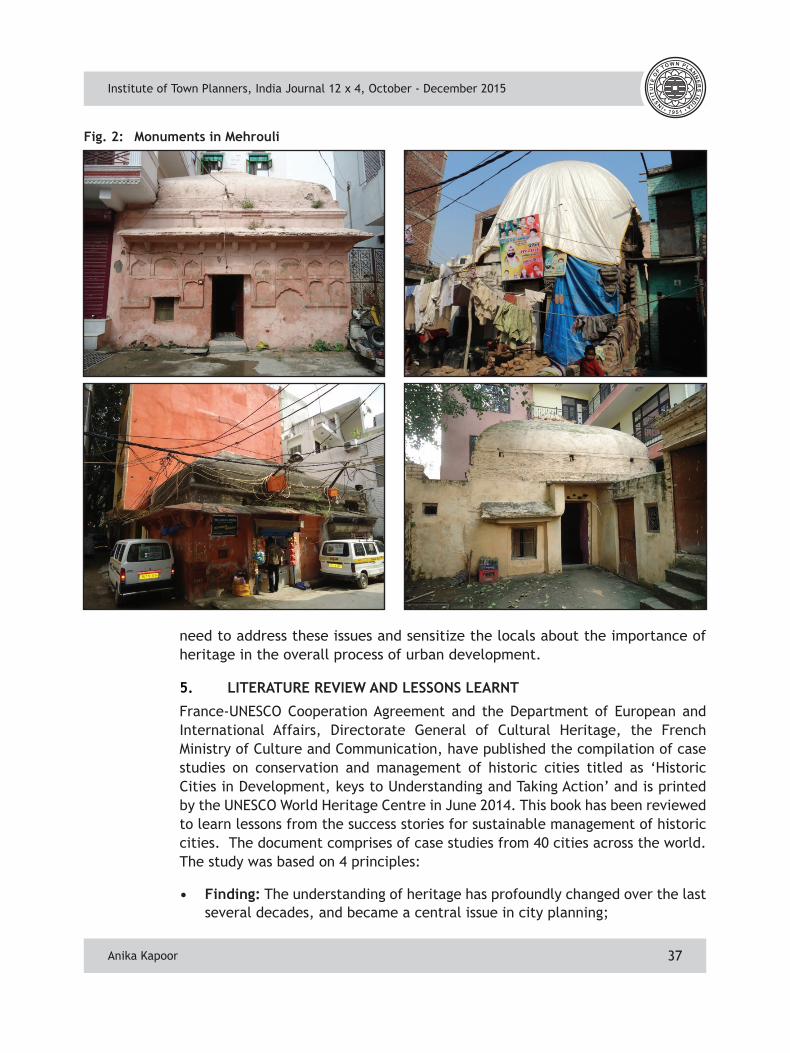
Institute of Town Planners, India Journal 12 x 4, October - December 2015
37
need to address these issues and sensitize the locals about the importance of heritage in the overall process of urban development.
5. LITERATURE REVIEW AND LESSONS LEARNT
France-UNESCO Cooperation Agreement and the Department of European and International Affairs, Directorate General of Cultural Heritage, the French Ministry of Culture and Communication, have published the compilation of case studies on conservation and management of historic cities titled as ‘Historic Cities in Development, keys to Understanding and Taking Action’ and is printed by the UNESCO World Heritage Centre in June 2014. This book has been reviewed to learn lessons from the success stories for sustainable management of historic cities. The document comprises of case studies from 40 cities across the world. The study was based on 4 principles:
• Finding: The understanding of heritage has profoundly changed over the last several decades, and became a central issue in city planning;
Fig. 2: Monuments in Mehrouli
Anika Kapoor
Institute of Town Planners, India Journal 12 x 4, October - December 2015
38
• Certainty: Heritage values are unique, as they cannot be reproduced, but the actions taken by cities in managing their heritage represent an important body of knowledge and experience, rich with lessons and useful for other historic cities.
• Conviction: Heritage management by local governments necessarily forms part of a larger urban project.
• Ambition: Protecting and highlighting heritage can and should be a lever for city development.
It is realized that it is a challenge to reconcile heritage with urban development as on the one hand heritage is ought to be preserved and conserved, while on the other hand the users have specific needs that demands habitat improvements for new uses for public spaces, mobility and transportation and tourist attractions. To integrate the heritage preservation with the city development planning process, the paper proposes certain elements as a part of initial analytical framework.
Knowledge is the key in the process of protecting heritage. Documentation and inventory making of the available heritage resources and making the general masses aware of the importance of the heritage and connected glorious past would involve them in the process of preservation. It is the crucial aspect of planning. Governance is another critical element as it is the driving force that defines the public policies and leads to a transparent and participatory decision making. Besides, the study of urban form and morphology is important. Urban texture is a result of spontaneous unplanned or planned changes as per the will of development authorities. Although the study, the historical, political, and cultural processes that shape and change the urban setup can be determined that are critical for planning future developments. Public spaces form an important part of urban forms that include transportation networks, open spaces and recreational areas. Heritage forms a part of public spaces. Therefore, available public spaces other than heritage have to be analyzed. Within an urban setup, the monument, has not changed but is expressed differentially over a period of time. Earlier the settlement started around a monument where as now it is a sheer landmark in the entire urban form. The inventory of recognized monuments is important to initiate the process of integrating heritage with urban planning.
With the growing urbanization, there is a growing need of habitat. It is this requirement of the city that is resulting in vanishing heritage. Therefore, assessing the habitat requirements of the city has to be the foremost task in the process of planning in order to save the heritage. Socio-economic diversity of the inhabitants is critical as it was the base of urban planning in 1960s.
Anika Kapoor
Institute of Town Planners, India Journal 12 x 4, October - December 2015
39
Today, planners encourage mixed land use in order to amalgamate the society and its functions, where people of different social identities inhabit the same territory and form the neighborhood. Infrastructure refers to the facilities that are needed for the proper and sustainable functioning of the city. It includes social and physical aspects of it. The complexities of managing infrastructures (their design, financing, installation, maintenance, etc.) pose challenges to heritage at time and thus are critical in the planning process. Transportation and mobility is an issue of priority for the management of developing historic cities. As a result of environmental degradation, urban sprawl and degrading non-renewable sources of energy, new forms of transportation are emerging. Public transport is encouraged and an increase in the number of users has been witnessed in the recent past. Moreover, cycles and pedestrianization have been encouraged for the sake of healthy environment. The study of transportation networks and modes is thus critical for heritage conservation and urban planning.
In the era of economic assets evaluation, it has been realized that development of heritage parallels development of tourism. Tourism is often presented as a potential way to capitalize on heritage for economic development. Thus, it is an important indicator of heritage conservation and should be analyzed in details. All these indicators should be incorporated in the integrated planning process of planning and development of a historic city. A Master Plan is the key document and provides the base of development of the city.
A Master Plan of a city refers to the comprehensive plan of action. As per Delhi Development Authority “A Master Plan is the long term perspective plan for guiding the sustainable planned development of the city. This document lays down the planning guidelines, policies, development code and space requirements for various socio-economic activities supporting the city population during the plan period. It is also the basis for all infrastructure requirements”. This is a comprehensive document that incorporates all critical indicators of development and gives a direction for development for a city. Even the first Master Plan of Delhi in 1962 provides a conceptual framework and policies for conservation of monuments in Delhi and is a also followed in MPD, 2021.
Thus, it is assessed that although Delhi’s Master Plan incorporates all the elements of city development planning process mentioned above, directly or indirectly but unfortunately, heritage has been compartmentalized under a chapter and the links between the heritage and other areas are missing and effective protection and management of heritage is only possible when it is integrated with the planning process. This integration seeks a comprehensive approach over all the existing approaches of city planning.
Anika Kapoor
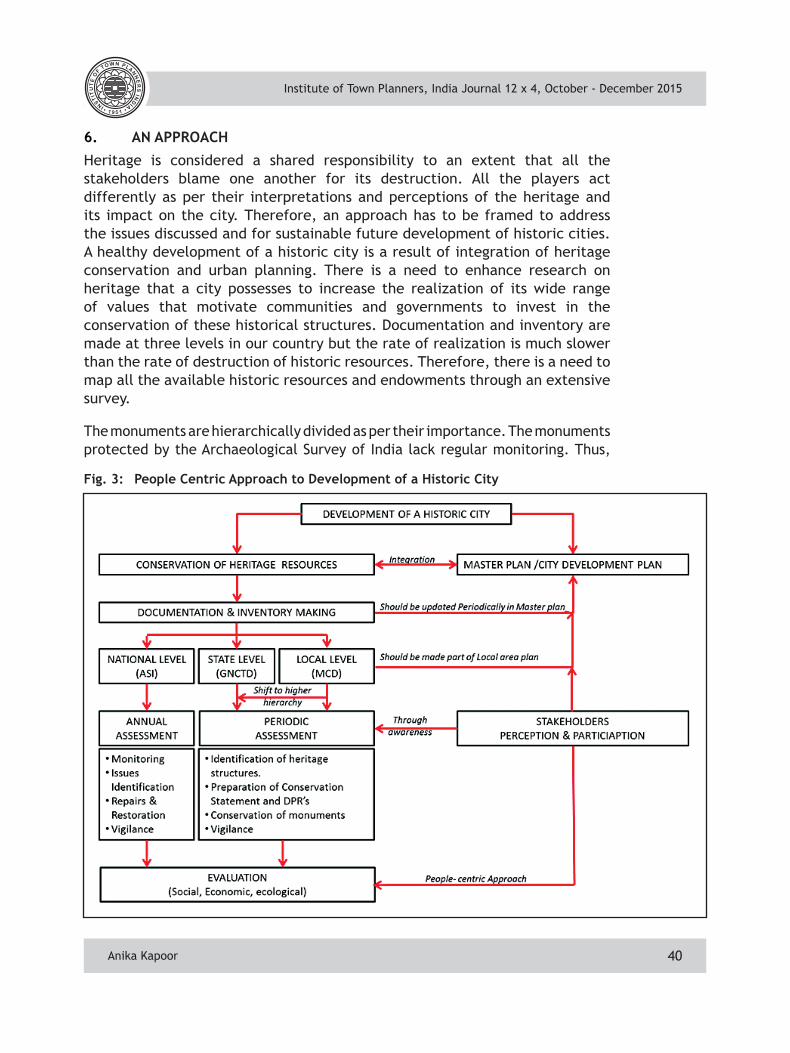
Institute of Town Planners, India Journal 12 x 4, October - December 2015
40
6. AN APPROACH
Heritage is considered a shared responsibility to an extent that all the stakeholders blame one another for its destruction. All the players act differently as per their interpretations and perceptions of the heritage and its impact on the city. Therefore, an approach has to be framed to address the issues discussed and for sustainable future development of historic cities. A healthy development of a historic city is a result of integration of heritage conservation and urban planning. There is a need to enhance research on heritage that a city possesses to increase the realization of its wide range of values that motivate communities and governments to invest in the conservation of these historical structures. Documentation and inventory are made at three levels in our country but the rate of realization is much slower than the rate of destruction of historic resources. Therefore, there is a need to map all the available historic resources and endowments through an extensive survey.
The monuments are hierarchically divided as per their importance. The monuments protected by the Archaeological Survey of India lack regular monitoring. Thus,
Fig. 3: People Centric Approach to Development of a Historic City
Anika Kapoor
Institute of Town Planners, India Journal 12 x 4, October - December 2015
41
this seeks an annual assessment and vigilance thereafter. Similarly, other monuments need to be identified and conserved to increase the numbers in the inventory. Moreover, out of the list of 1,200 monuments notified by the MCD, the Department of State Archaeology should take over monuments before they lose their authenticity or footprints on ground. Once the heritage resources are mapped, their value should be assessed socially economically and ecologically to make them sustainable.
The inventory should be updated in a city Master Plan for the people to see and plan development. Monuments at local level can be dealt with in a local area plan. This level of planning seeks participatory approach which in turn makes the local people aware and involves them in the planning process. There is a need to sensitize local people about the locally available heritage resources and their viability to help them contribute in the best of their capacities. This approach is meant to involve stakeholders at each level of planning so as to seek acceptance and sense of ownership amongst the people for any development in the historic city (Fig. 3).
7. RECOMMENDATIONS
The above mentioned approach can be sustained substantially by implementing the following recommendations.
• Making Heritage Interactive - Heritage monuments once protected and conserved are caged with grills and boundaries. There is a need to bring historic spaces to life again without losing integrity and authenticity. Heritage spaces should be allowed to be reused for public use so that people interact with the structure and feel connected to it.
• Connecting the Heritage and History - Connectivity to the structure is critical for people to know and admire the history. Moreover, not only literally but the heritage should also be connected through festivals, fairs, exhibitions, light and sound shows, etc.
• People - centric Development - Existing urban laws and policies direct the future development of the city but not of its people. Heritage laws restrict people to develop and grow which in turn raises the feeling of animosity amongst the masses. The development should be made people-centric and not monument specific. Monument specific byelaws should be made so that each monument can be dealt separately according to its importance and location. However, people understand development only when they seek their benefits.
• Review of Existing Acts and Policies - Existing acts and policies were made in 1990s when the population was half of what it is now and demands and aspirations were different. The acts and policies should be reviewed
Anika Kapoor
Institute of Town Planners, India Journal 12 x 4, October - December 2015
42
periodically to match increasing needs, technological advancements, infrastructural developments, and aspirations of the people. Institutional reforms must also be looked into for realignment of interests of all the stakeholders involved in the process of planning and development.
• Adding Economic Dimension to Heritage - The heritage structure stands as sheer old building in the urban set up. There is a need to add economic dimension to the heritage structure through tourism, building reuse and other innovative ways to generate revenues from the building.
• Adding Lung Spaces to the City in the Name of Heritage – The process of urbanization is eating up green spaces to meet the increasing housing demands. Heritage is the hope. Many of the monuments stand in the green areas and many have precincts. Monuments and the area around them should also be conserved and the area should be made to use as garden or park by the locals.
• Building Awareness - General public should be made aware of history and heritage to encourage people to conserve it. Fairs, festivals and competitions should be arranged for people. Moreover, the role of publications, institutes, trusts, NGOs, universities and schools is critical in imparting heritage education and awareness building.
• Urban Heritage Research and Education - Schools and universities must develop training and research programs on the preservation and conservation strategies of heritage.
8. CONCLUSIONS
Urban development is visualized as a positive growth of the city in the desired direction. The role of city planners becomes even more critical, if the city is historic in nature. History has to be realized as crucial aspect in the planning process to make heritage an integral part of development. There is a need to persuade government that heritage has a big role to play in urban development and economic regeneration of the country. Heritage is the shared responsibility of all the stakeholders and thus should be conserved for future generations to understand their history better. Therefore, an integrated sustainable approach for future planning of historic cities should be adopted for better understanding of relationship between old and new and to incorporate heritage as an integral part of overall process of development.
Anika Kapoor
Institute of Town Planners, India Journal 12 x 4, October - December 2015
43
Dhwani Shah, Assistant Professor, Bhaikaka Centre for Human Settlements, APIED, Sardar Patel University, Anand, Gujarat. [email protected], [email protected],
Transforming Public Transport in Small and Medium Size Cities: A Case of Alwar
Dhwani Shah
1. INTRODUCTION
India, with 377.10 million urban population (31.16 percent) out of total 1,210 million persons as per 2011 Census is urbanizing at a very fast rate. The level of urbanization has increased from 17.97 percent in 1961 Census to 31.16 percent in 2011(Census of India, 2011). Although there was increase in the level of urbanization, higher growth in the vehicular population was recorded during the period 1961 to 2011. India has experienced tremendous growth in the total number of registered vehicles from about 0.7 million in 1961 to about 141.9 million in 2011. The total registered vehicles in the country grew at a compound annual growth rate (CAGR) of 10.5 percent between 2002 (58.9 million) and 2012 (159.5 million), an addition of 100.6 million vehicles in a decade. Out of 159.5 million registered vehicles in 2012, the major share of 72.4 percent was of two-wheelers, 13.5 percent was of cars, jeeps and taxis i.e. 85.9 percent of the total registered vehicles are used for private transport. The contribution of buses was only 1 percent and that of goods vehicles was 4.8 percent. Tractors, trailers, three wheelers (passenger vehicles), LMV and other miscellaneous vehicles contribute remaining 8.3 percent (Ministry of Road Transport and Highway, 2013).
According to Central Pollution Control Board, the increase in the vehicular population has resulted in the rise of the air pollution, accidents and congestions. Among all the modes of transport, road transport contributes
AbstractThe development of public transport systems is focussed on large cities whereas for small and medium towns it is neglected. If the growth of private vehicles is reduced by providing a good public transport system at a stage when vehicular density is still low, the problem can be tackled effectively. But, due to the lack of funds, low-density of the city and smaller trip lengths the Urban Local Bodies (ULBs) are not able to provide public transport facilities. The paper focuses on how Alwar, a city in the state of Rajasthan, provided for an Intermediate Public Transport system known as ‘Alwar Vahini’ using an innovative plan. ‘Alwar Vahini’ is a passenger service which uses vehicles that comply with the Bharat Standard-IV norms. The investment and resources for the service came in from the private sector and administration of Alwar played role of a facilitator.
Dhwani Shah
Institute of Town Planners, India Journal 12 x 4, October - December 2015
44
the major share of around 73 percent towards total carbon dioxide (CO2) emissions. Road transport alone emits around 16 percent of the global CO2 emissions and contributes around 14 percent towards the global emissions of greenhouse gases (Central Pollution Control Board, 2010). The poor ambient air quality affects people both directly and indirectly such as reduced visibility, respiratory and cardiovascular problems and death in some cases due to acute pollution exposure.
There is need to introduce better technologies and bring a shift from private vehicles to public transport. In India it is common to take decisions in favor of public transport at a stage when the traffic is unmanageable. Moreover, the public transport system is focused on large cities whereas for small and medium towns it is neglected. If the growth of private vehicles is reduced by providing a good public transport system at a stage when vehicular density is low, the problem can be tackled effectively. But, the urban local bodies (ULBs) are not able to provide public transport facilities due to the lack of initiatives or funds. The public transport function is not among the core functions listed in an urban local body acts, for example, in Rajasthan Municipalities Act, 2009. Since the public transport service is not mandatory, it is often neglected. In addition to this, providing transportation facilities in small cities becomes a challenge due to its low density and smaller trip length.
The present study focuses on how Alwar city, administrative headquarters of Alwar district in the state of Rajasthan, provided for an Intermediate Public Transport System known as ‘Alwar Vahini’ using an innovative plan. Alwar Vahini is a passenger service which uses vehicles that comply with the Bharat Standard - IV norms. The old polluting three wheelers in Alwar were replaced by Alwar Vahini with the joint efforts of various organizations such as Regional Transport Office, Lead Bank (Punjab National Bank), Urban Improvement Trust Alwar, UIT- Bhiwadi and District Administration, Alwar. The paper is based on the field observations and interviews conducted with different stakeholders during April 2013 and October 2015.
2. ALWAR AND ITS TRANSPORTATION PROBLEMS
The city of Alwar is located around 160 km south of Delhi, and about 150 km north of Jaipur. It is also known as the Gateway to Rajasthan and is a part of the National Capital Region (NCR). With an area of 49.3 sq km, population of Alwar Municipal Council in 2011 was 315,379 persons (Census of India, 2011). Alwar is growing at a fast pace with rapid industrialization. Alwar is an agriculturally productive area and initially had only agro based industries. With its inclusion in the National Capital Region (NCR), it got diversified into textile, chemical, engineering and mineral industries (Jones Lang LaSalle, 2013). Alwar’s transportation facilities have not developed with the fast
Dhwani Shah
Institute of Town Planners, India Journal 12 x 4, October - December 2015
45
pace of growth due to which the people of Alwar faced a lot of problems in commuting. Alwar did not have any government provided city transportation service. The city has shared auto service using three-wheeled vehicles known as ‘Vikram’ and ‘Ganesh’ for the local transportation. These tempos were 20-25 years old and unreliable.
After Alwar’s inclusion in the NCR, it became mandatory for the ULBs to follow the Central Pollution Control Board (CPCB) norms for Nation Capital Region. According to the norms only Bharat Standard IV vehicles could be registered after 1 April 2010 for NCR for all private vehicles, city public service vehicles and city commercial vehicles (National Auto Fuel Policy, 2015). According to the norm, vehicles older than 10 and 15 years in diesel and petrol respectively would not be allowed on the road.1
Alwar’s intermediate transportation service, three-wheelers such as, ‘Vikram’ and ‘Ganesh’ did not meet pollution norms. Alwar had 750 such three-wheelers which had to be discontinued. But it was the only public transport service in the city; so it could not be discontinued abruptly. Doing so would cause inconvenience to a large number of people who used them daily. The city of Alwar was studied and it was found that being a medium sized city, it would be difficult to even provide city bus service. Vehicles with a carrying capacity of 7-10 people could be used to get the public transport at a frequency of 5 minutes. The center of the city has narrow roads, and smaller vehicle size could facilitate the provision of public transport to the core area. Additionally, discontinuing the three-wheelers abruptly would have left a large number of people unemployed. Looking at all these issues the administration of Alwar came up with the concept of ‘Alwar Vahini’.2
3. CONCEPT AND THE IMPLEMENTATION OF THE SYSTEM
A blend of the issues discussed above and the need for providing comfortable, safe and quick transport service firmed the idea of legalizing the intermediate public transport system using Bharat Standard IV compliant vehicles. The effort was to make the three-wheeler drivers to sift from their old vehicles to vehicles that comply with the Bharat Standard-IV norms. But the switch was not easy as Alwar had a strong auto union, and to implement the new system it required co-operation from the union. The companies like Tata and Mahindra offered a discount-cum-exchange scheme. The owners of the old three-wheelers could
1 Source: Telephonic Interview of Mr. Vijay Veer Yadav, D.T.O, RTO office, Alwar on 9th Oct 2015. [The fitness certificate for these vehicle where not issued and transfer of ownership was not allowed for vehicles older than the specified limit. But, the on ground enforcement for removing these vehicles from the city premises was not done].
2 Source: Interview with the then collector of Alwar, Mr. Ashutosh A T Pednekar on 18th April 2013
Dhwani Shah
Institute of Town Planners, India Journal 12 x 4, October - December 2015
46
purchase a new Bharat Standard-IV compliant vehicle by getting a discount of Rs. 45,000 on exchange of their old three-wheelers.
Banks like the Punjab National Bank supported the administration by launching a special scheme where people could purchase Alwar Vahini with an increased payback period of five years. The interest rate was charged at 14.25 percent without any collateral from their end. Punjab National Bank was the lead financier. Government acted as the guarantor under the Credit Guarantee Fund Trust for Micro and Small Enterprises (CGTMSE). Anybody who had a driving license for a four-wheeler and a valid route-permit, issued by the RTO, could apply for the loan. 75 percent of the total amount of the vehicle was given as loan and 25 percent of the total amount has to be borne by the applicant.3
The Auto Union was invited by the Collector, Alwar and was presented with the offer. The unions did not agree for the purchase of a new vehicle at first instance and wanted to continue with their three-wheelers. Their major concern was that by purchasing a new vehicle they would be compelled to pay a monthly installment. Applications to operate Alwar Vahini were then invited from people who wanted to work and did not have a job. Alwar Vahini was launched with 58 vehicles in December 2011. It was launched on one of the busiest routes that already had around 150 three-wheelers. Alwar Vahini operated with the same fare charges as three-wheelers. It was found that people preferred Alwar Vahini over the old three-wheelers. The three-wheeler drivers realized that they would not be able to make profit unless they switch to Alwar Vahini. The union then had a meeting with the Collector where they agreed to phase out their old three-wheelers and replace them with Alwar Vahini. But they had a demand that the existing auto drivers should be given preference in issuing permits over the new applicants.
A total fleet of Alwar Vahini was 1,310 as on April 2013 for Alwar district. It is estimated that the city would require around 2,200 Alwar Vahini vehicles. Out of the 1,310 Alwar Vahini’s around 600-700 play in the city of Alwar. The rest connect the city to the nearby villages.4
4. BRANDING ‘ALWAR VAHINI’
Intermediate public transport system was branded as ‘Alwar Vahini’ which means Alwar’s Vehicle. Stickers were designed to be pasted on the vehicles. This gave a brand image to the intermediate public transport system and it started getting recognition from people. The drivers started taking pride in their profession. Different types of services were started including transport within the city limits, connecting
3 Source: Telephonic Interview with Mr. Gera, Chief Manager, Punjab National Bank, Alwar4 Source: Interview with the then collector of Alwar, Mr. Ashutosh A T Pednekar on 18th
April 2013
Dhwani Shah
Institute of Town Planners, India Journal 12 x 4, October - December 2015
47
the city with the nearby villages, special vehicles for the ladies and on-call taxi. The different types of services were further branded by painting the vehicles with different colors to make it easier for people to identify them. The route of the vehicle was earmarked on the front of the vehicle along with unique number for identification. The different types of ‘Alwar Vahini’ services are as follows:
Sheher Alwar Vahini: The vehicles operating within the city limits are branded as ‘Sheher Alwar Vahini’. These vehicles were painted white in color. Alwar has 31 Sheher Alwar Vahini routes with an average route length of 10 km as on October 2015.
Gramin Alwar Vahini: The vehicles connecting the city to nearby villages are branded as ‘Gramin Alwar Vahini’. These vehicles were painted red in color. Alwar has 64 Gramin Alwar Vahini routes with an average route length of 15 km as on October 20155
Mahila Alwar Vahini: This provided service exclusively for the ladies. The driver for this vehicle would be a lady.
On - Call Taxi Services: Apart from this an on-call city taxi service was also introduced where any vehicle could be used for this service.
5. DEVELOPMENT OF SUPPORT INFRASTRUCTUREUrban Improvement Trust (UIT) of Alwar had borne the costs for developing the support infrastructure which could enhance the performance of the new system and would add to the convenience of the people. Some of the initiatives taken by UIT are as follows:6
• Constructing 20 bus stands for Alwar Vahini at important and major landmarks;
• Providing traffic management barriers in the city;
• Re-designing the round-about and tri-junctions; and
• The UIT and ULB got engaged with a Non-Government Organization (NGO) and gave the drivers training on proper ways of interacting with their customers and health check-up was organized for the drivers.
Nine CCTVs were installed for traffic monitoring, four at important junctions and five at Alwar entry. The control room was made at the police station and one in collector’s room.
6. MANAGEMENT OF THE ALWAR VAHINI Regional Transport Office (RTO) issues permit for the routes. The administration of Alwar has facilitated the setting up of the system initially but the operation of
5 Source: Data collected from RTO office, Alwar from Ms. Rani Jain, ARTO, Alwar.6 Source: Interview conducted with official at Urban Improvement Trust, Alwar in April
2013
Dhwani Shah
Institute of Town Planners, India Journal 12 x 4, October - December 2015
48
the Vahini is managed through Unions. Each route is managed by a Union.7 The Union keeps a check on the timely functioning of Alwar Vahini. Each union has appointed people who monitor the movement of Vahini’s. They make sure that the frequency of five minutes is achieved and there is no bunching of the Vahini’s at a particular stand. An amount of Rs. 25 per day is levied on the driver of each Alwar Vahini for the operations of the Union.8
7. FEEDBACK OF ALWAR VAHINI
People were asked for their feedback about the new service. A Facebook page and website was created for Alwar Vahini (https://www.facebook.com/AlwarVahini-195604900529301/ and http://www.alwarvahini.com/) where people could get updates about recent developments and give their opinion and feedback. A study by a student in 2013 from Modern Institute of Technology and Research Centre, Alwar to gauge user satisfaction finds that customers are happy with the service as it is more comfortable, less polluting and made less noise than the earlier three-wheelers. They are not happy with the minor fare increase and complained about the over speeding of vehicles by the drivers. 9
While discussing the user’s satisfaction on ‘Alwar Vahini’ at the author’s visit to Alwar in 2013, it was found that people were satisfied with the service. They mentioned that it has good coverage and frequency; it takes less time and makes less noise compared to the earlier modes of transport. They however have a problem of overloading of passengers at peak hours (up to 11 passengers per vehicle). The frequency of Alwar Vahini was less in the late evenings and night. When the drivers were questioned about overloading the vehicles, they said that, “If we go as per the specified vehicle capacity of seven passengers all-round the day, it would not be viable for us to run the Vahini. We operate on less than seven passengers in off peak period and need to compensate it”.
8. VIABILITY OF ALWAR VAHINI
To find if the system was viable and the driver earned profit, a basic calculation was done by subtracting the expenditure from his income. The passenger fare collection was subtracted by the bank loan, fuel cost, maintenance cost and all other fees required for insurance, permit or union charges. The data used for the calculations are based on the interview conducted of the three stakeholders: driver, union leader and TATA Magic employee. The interviews were conducted in April 2013. It is considered that Alwar Vahini will be operational for 26 days in a month.
7 Source: Telephonic interview with Ms. Rani Jain, ARTO, Alwar on 13th Oct 20158 Interview of one of the Union leader on 18th April 20139 Source: Telephonic interview with Mr. Vikas Mehlarat, HOD-Management Dept., MITRC,
Alwar on 13th Oct 2015
Dhwani Shah
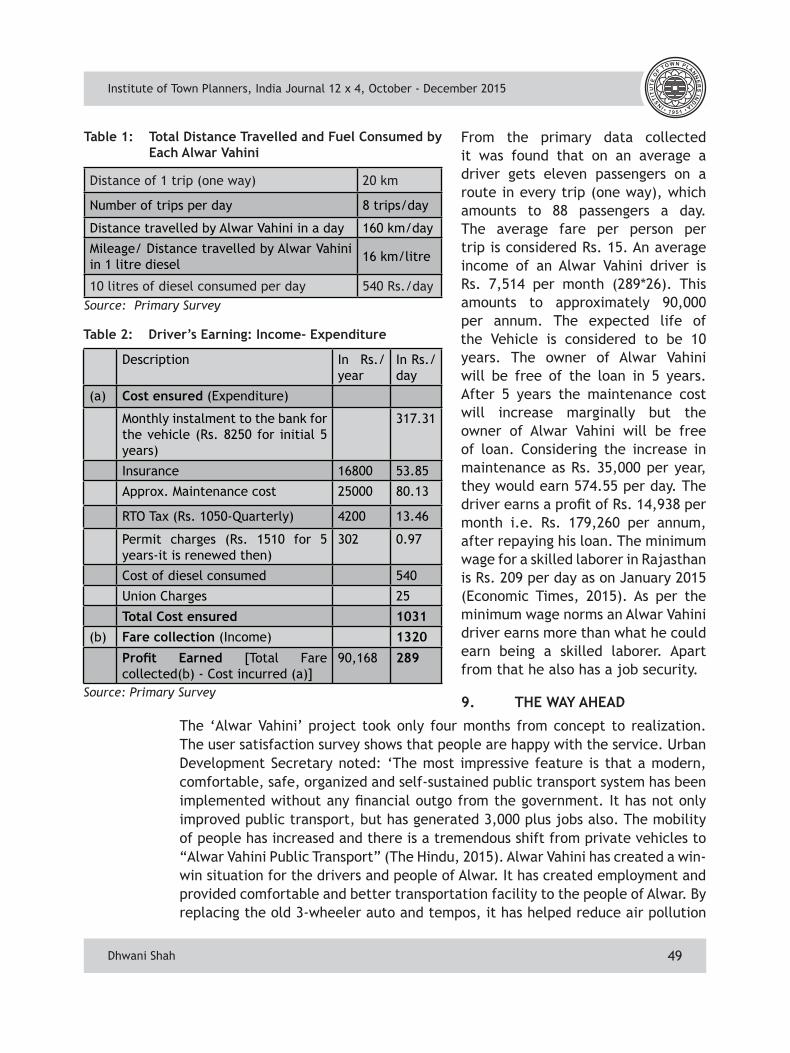
Institute of Town Planners, India Journal 12 x 4, October - December 2015
49
From the primary data collected it was found that on an average a driver gets eleven passengers on a route in every trip (one way), which amounts to 88 passengers a day. The average fare per person per trip is considered Rs. 15. An average income of an Alwar Vahini driver is Rs. 7,514 per month (289*26). This amounts to approximately 90,000 per annum. The expected life of the Vehicle is considered to be 10 years. The owner of Alwar Vahini will be free of the loan in 5 years. After 5 years the maintenance cost will increase marginally but the owner of Alwar Vahini will be free of loan. Considering the increase in maintenance as Rs. 35,000 per year, they would earn 574.55 per day. The driver earns a profit of Rs. 14,938 per month i.e. Rs. 179,260 per annum, after repaying his loan. The minimum wage for a skilled laborer in Rajasthan is Rs. 209 per day as on January 2015 (Economic Times, 2015). As per the minimum wage norms an Alwar Vahini driver earns more than what he could earn being a skilled laborer. Apart from that he also has a job security.
9. THE WAY AHEAD
The ‘Alwar Vahini’ project took only four months from concept to realization. The user satisfaction survey shows that people are happy with the service. Urban Development Secretary noted: ‘The most impressive feature is that a modern, comfortable, safe, organized and self-sustained public transport system has been implemented without any financial outgo from the government. It has not only improved public transport, but has generated 3,000 plus jobs also. The mobility of people has increased and there is a tremendous shift from private vehicles to “Alwar Vahini Public Transport” (The Hindu, 2015). Alwar Vahini has created a win-win situation for the drivers and people of Alwar. It has created employment and provided comfortable and better transportation facility to the people of Alwar. By replacing the old 3-wheeler auto and tempos, it has helped reduce air pollution
Table 1: Total Distance Travelled and Fuel Consumed by Each Alwar Vahini
Distance of 1 trip (one way) 20 km
Number of trips per day 8 trips/day
Distance travelled by Alwar Vahini in a day 160 km/day
Mileage/ Distance travelled by Alwar Vahini in 1 litre diesel 16 km/litre
10 litres of diesel consumed per day 540 Rs./day
Table 2: Driver’s Earning: Income- Expenditure
Description In Rs./year
In Rs./day
(a) Cost ensured (Expenditure)
Monthly instalment to the bank for the vehicle (Rs. 8250 for initial 5 years)
317.31
Insurance 16800 53.85
Approx. Maintenance cost 25000 80.13
RTO Tax (Rs. 1050-Quarterly) 4200 13.46
Permit charges (Rs. 1510 for 5 years-it is renewed then)
302 0.97
Cost of diesel consumed 540
Union Charges 25
Total Cost ensured 1031(b) Fare collection (Income) 1320
Profit Earned [Total Fare collected(b) - Cost incurred (a)]
90,168 289
Source: Primary Survey
Source: Primary Survey
Dhwani Shah
Institute of Town Planners, India Journal 12 x 4, October - December 2015
50
level in the city. The major success of the system is that better transportation facilities could be provided without using government funds. The administration played the role of a facilitator and the investment and resources came in from the private sector. It was found that, in certain cases even if a person had got the permit from the Regional Transport Office (RTO), he was not allowed to operate his vehicle on that route. The union had calculated the number of vehicles they would require according to the traffic flow and did not allow any new members to operate. In these cases, a complaint is lodged with the police. It is imperative that Government should monitor these Unions and the power of the Union should be checked by the Government by coming up with certain guidelines. It can be concluded that there is no doubt about the success of the project but supervision by a Government body would help make the system effective in the long run.
REFERENCESDipak Kumar Dash (2013) http://timesofindia.indiatimes.com/. 23 Jan 2013. Times of India. 12 Oct 2015. Bhagat, R. B. “Emerging Pattern of Urbanisation in India.” Economic & Political Weekly (2011): 11. English. <http://suburbin.hypotheses.org/files/2011/09/RBBhagatUrbanisation.pdf>.Census, Government of India (15 July 2011) Ed. Dr C. Chandramouli. Census of India. English. 27 September 2015. <http://censusindia.gov.in/2011-prov-results/paper2/data_files/india/Rural_Urban_2011.pdf>.Central Pollution Control Board. Status of the Vehicular Pollution Control Programme in India. Delhi: Ministry of Environment & Forests, Govt. of India, March, 2010. English.Economic Times (2015) Rajasthan government revises minimum wages for labourers. 28 Jan 2015. English. 14 Oct 2015. <http://articles.economictimes.indiatimes.com/2015-01-28/news/58546857_1_minimum-wage-skilled-labourers-rs-199>.Jones Lang LaSalle (2013) “Market Research and Assessment of Capital Values for Proposed Residential Development Located in Neemrana, Behror and Bhiwadi, Rajasthan.” February 2013. English.Ministry of Road Transport and Highway (2013) Road Transport Year Book (2011-12). New Delhi, 2013. English. 27 September 2015. <http://in.tool-alfa.com/LinkClick.aspx?fileticket=RhX00HSiIT4 percent3D&tabid=72&mid=486>.National Auto Fuel Policy (2015) Standing Committee on Petroleum & Natual Gas. Delhi: Lok Sabha, 2014-15. English. <http://164.100.47.134/lsscommittee/Petroleum percent20& percent20Natural percent20Gas/16_Petroleum_And_Natural_Gas_5.pdf>.Rajasthan Municipalities Act (2009) “Rajasthan Municipalities Act.” 2009. English. <http://www.rielrc.org/content/eo911.pdf>.Shrivastava R. K., Saxena Neeta and Gautam Geeta (2013) “Air pollution due to road transportation in India.” Journal of Environmental Research And Development (2013): 69. English.The Hindu (2015) A model fit for replication. 2 Feb 2013. 14 Oct 2015. <http://www.thehindu.com/todays-paper/tp-national/a-model-fit-for-replication/article4370980.ece>.
Dhwani Shah
Institute of Town Planners, India Journal 12 x 4, October - December 2015
51
Mukti Advani, Scientist, TP Division, CSIR-CRRI, New Delhi-25, [email protected]
Neelam J. Gupta, Senior Scientist, TES Division, CSIR-CRRI, New Delhi-25, [email protected]
Purnima Parida, Principal Scientist, TP Division, CSIR-CRRI, New Delhi-25, [email protected]
B.K. Durai, Chief Scientist, PME, CSIR-CRRI, New Delhi-25, [email protected]
Inter-relationship between Transport System, Safety and City Sizes Distribution
Mukti Advani, Neelam J. Gupta, Purnima Parida and B. K. Durai
1. INTRODUCTION
Urbanization throughout the world is increasing rapidly and India is no different. This is primarily due to immigrants pouring into the cities searching for better employment opportunities and quality of life (Kenworthy, 1996). Spatial characteristics have been found to alter the way in which people travel and the modes of transport that they use (Cervero, 1997; Newman, 1989). However, Gordon (1997) says that there is no correlation between population size and modal choice in US urban areas. ECOTEC (1993) study estimates that the settlements with population over 250,000 have lower travel distances per person and a smaller proportion uses cars. Further, according to Banister (1997), the most energy efficient settlement in terms of transport is one with a population size of 25,000-100,000 or 250,000 plus. Therefore, city size in terms of population and geographical area has influence on the transport system and travel characteristics.
The relationship between urban form and transportation is a well discussed issue in literature (Dodson 2011, Turok 2011, Banister 2005, Cameron 2004, Newman 1999, Gorden and Richardson 1997, Breheny 2001, ECOTEC 1993; Newman and Kenworthy, 1988; Stead and Marshall, 2001; Taylor and Sloman, 2008). Shim et al (2006) also conducted an investigation of the effect of density on fuel consumption. The authors use Korean city data to separately regress a number of
AbstractUsage of motorized modes as well as non-motorized mode for any city/area is the simplest parameter to measure the sustainability of road transport. Factors affecting to such share could be many including city size, population density, road network density, per-capita income, safe infrastructure in using alternate modes, etc. Many researchers have studied such interrelationships for different countries. However, in India, the cities having the characteristics of mix land use type has not been studied in that manner. In this paper attempt has been made to study the interrelationship among the road network, geography and demographic characteristics of an area/city to understand the usage of motorized and non-motorized transport.
Mukti Advani, Neelam J. Gupta, Purnima Parida and B. K. Durai
Institute of Town Planners, India Journal 12 x 4, October - December 2015
52
urban form characteristics including urban density, on gasoline consumption per car. They conclude that urban density is associated with reduced fuel consumption and suggest that high density policies can be used as a tool to decrease transport energy use in Korean cities; Van de Covering and Schwanen (2006) model for travel behavior variables rather than fuel consumption. They estimate models for total annual distance by car per capita, total annual distance by public transport per capita, commuting distance, commuting time and the shares of commuting trips by car, by public transport and by walking and cycling. Urban density was found to be negatively correlated with total car distance and the share of the car for commuting trips, and positively correlated with the share of walking and cycling for commuting trips.
Although the inter-relationship among transport needs, modal choice, city size, density, etc.; is discussed in literature, very little information is available for developing countries and more specifically for Indian cities which are typically considered as mixed land use type cities with wide range of transport and land use characteristics. The focus of study is on understanding the interrelationship between different parameters of urban form and transport for different Indian cities. This is based on secondary data collected from different sources.
2. AREA, POPULATION-DENSITY, VEHICLE OWNERSHIP AND ITS USAGE
Area and population density data of 23 million plus populated cities of India have been listed in Table 1 and plotted in Fig. 1. The relationship between population density and geographical area of selected cities has been studied. Fig. 1 indicates the inverse trend between area and population among selected cities i.e. density of larger cities is less compared to the smaller cities. Larger areas with lower population densities could be the main reason for longer trips. As most of the primary facilities like schools, hospitals, markets, etc.; cannot survive with lower density due to low level of demand for these facilities. Banister (1996) argues that a population of at least 10,000 is required for the settlement to have a diversity of facilities and services.
An attempt has also been made to understand the relationship between population density and the average trip length and trip rates. Table - 2 provides the information regarding density, average trip length and average trip rate for 15 cities of India. Fig. 2 presents the plot of average trip length versus average trip rate. This shows the proportionate relationship among trip rate and trip length for 15 cities of India.
Fig. 3(a) and 3(b) show the interrelationship of average trip length with area and density of the city respectively. An increase in area or density also resulted in increased average trip length for the selected cities. However, the growth rate in case of density is very low compared to the growth rate of area. As shown
Mukti Advani, Neelam J. Gupta, Purnima Parida and B. K. Durai
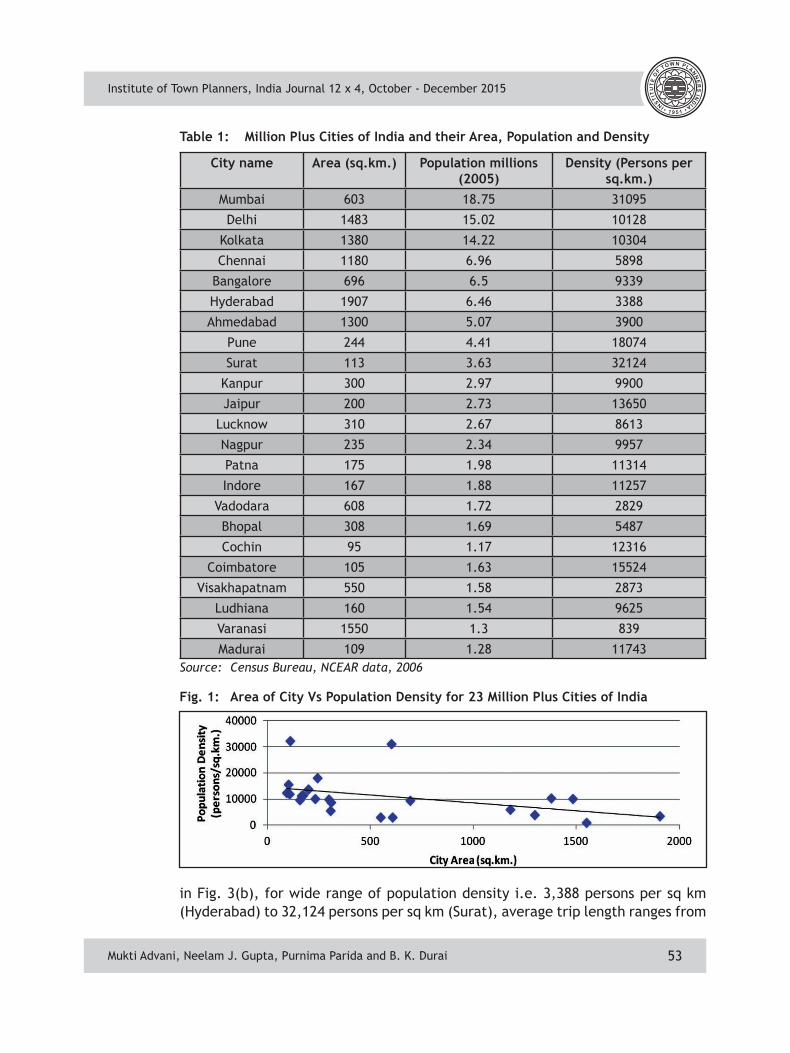
Institute of Town Planners, India Journal 12 x 4, October - December 2015
53
Table 1: Million Plus Cities of India and their Area, Population and Density
City name Area (sq.km.) Population millions (2005)
Density (Persons per sq.km.)
Mumbai 603 18.75 31095
Delhi 1483 15.02 10128
Kolkata 1380 14.22 10304
Chennai 1180 6.96 5898
Bangalore 696 6.5 9339
Hyderabad 1907 6.46 3388
Ahmedabad 1300 5.07 3900
Pune 244 4.41 18074
Surat 113 3.63 32124
Kanpur 300 2.97 9900
Jaipur 200 2.73 13650
Lucknow 310 2.67 8613
Nagpur 235 2.34 9957
Patna 175 1.98 11314
Indore 167 1.88 11257
Vadodara 608 1.72 2829
Bhopal 308 1.69 5487
Cochin 95 1.17 12316
Coimbatore 105 1.63 15524
Visakhapatnam 550 1.58 2873
Ludhiana 160 1.54 9625
Varanasi 1550 1.3 839
Madurai 109 1.28 11743Source: Census Bureau, NCEAR data, 2006
Fig. 1: Area of City Vs Population Density for 23 Million Plus Cities of India
in Fig. 3(b), for wide range of population density i.e. 3,388 persons per sq km (Hyderabad) to 32,124 persons per sq km (Surat), average trip length ranges from
Mukti Advani, Neelam J. Gupta, Purnima Parida and B. K. Durai
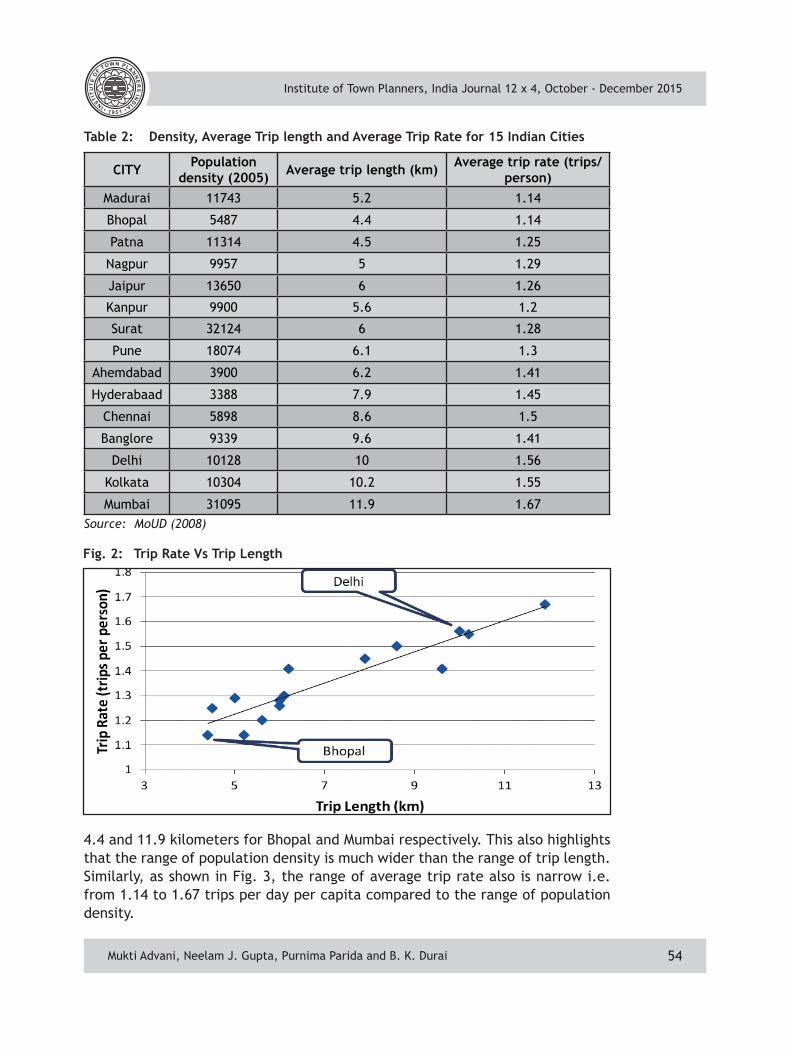
Institute of Town Planners, India Journal 12 x 4, October - December 2015
54
Table 2: Density, Average Trip length and Average Trip Rate for 15 Indian Cities
CITY Population density (2005) Average trip length (km) Average trip rate (trips/
person)Madurai 11743 5.2 1.14
Bhopal 5487 4.4 1.14
Patna 11314 4.5 1.25
Nagpur 9957 5 1.29
Jaipur 13650 6 1.26
Kanpur 9900 5.6 1.2
Surat 32124 6 1.28
Pune 18074 6.1 1.3
Ahemdabad 3900 6.2 1.41
Hyderabaad 3388 7.9 1.45
Chennai 5898 8.6 1.5
Banglore 9339 9.6 1.41
Delhi 10128 10 1.56
Kolkata 10304 10.2 1.55
Mumbai 31095 11.9 1.67
Fig. 2: Trip Rate Vs Trip Length
Source: MoUD (2008)
4.4 and 11.9 kilometers for Bhopal and Mumbai respectively. This also highlights that the range of population density is much wider than the range of trip length. Similarly, as shown in Fig. 3, the range of average trip rate also is narrow i.e. from 1.14 to 1.67 trips per day per capita compared to the range of population density.
Mukti Advani, Neelam J. Gupta, Purnima Parida and B. K. Durai
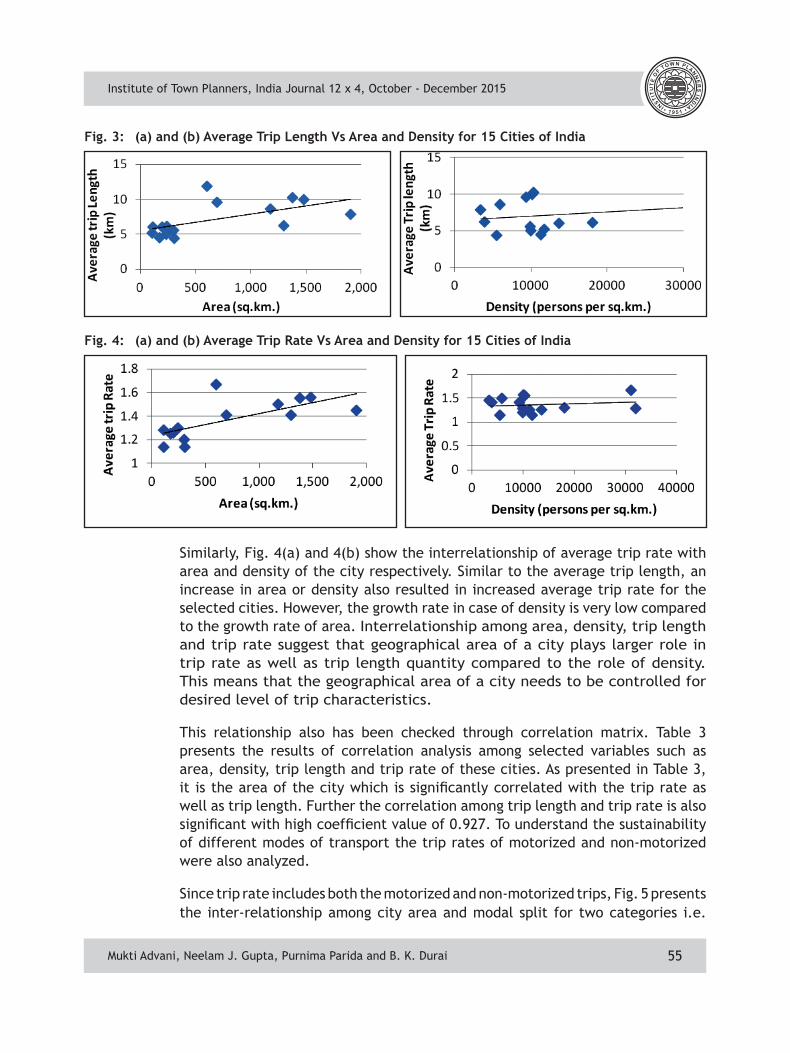
Institute of Town Planners, India Journal 12 x 4, October - December 2015
55
Similarly, Fig. 4(a) and 4(b) show the interrelationship of average trip rate with area and density of the city respectively. Similar to the average trip length, an increase in area or density also resulted in increased average trip rate for the selected cities. However, the growth rate in case of density is very low compared to the growth rate of area. Interrelationship among area, density, trip length and trip rate suggest that geographical area of a city plays larger role in trip rate as well as trip length quantity compared to the role of density. This means that the geographical area of a city needs to be controlled for desired level of trip characteristics.
This relationship also has been checked through correlation matrix. Table 3 presents the results of correlation analysis among selected variables such as area, density, trip length and trip rate of these cities. As presented in Table 3, it is the area of the city which is significantly correlated with the trip rate as well as trip length. Further the correlation among trip length and trip rate is also significant with high coefficient value of 0.927. To understand the sustainability of different modes of transport the trip rates of motorized and non-motorized were also analyzed.
Since trip rate includes both the motorized and non-motorized trips, Fig. 5 presents the inter-relationship among city area and modal split for two categories i.e.
Fig. 3: (a) and (b) Average Trip Length Vs Area and Density for 15 Cities of India
Fig. 4: (a) and (b) Average Trip Rate Vs Area and Density for 15 Cities of India
Mukti Advani, Neelam J. Gupta, Purnima Parida and B. K. Durai
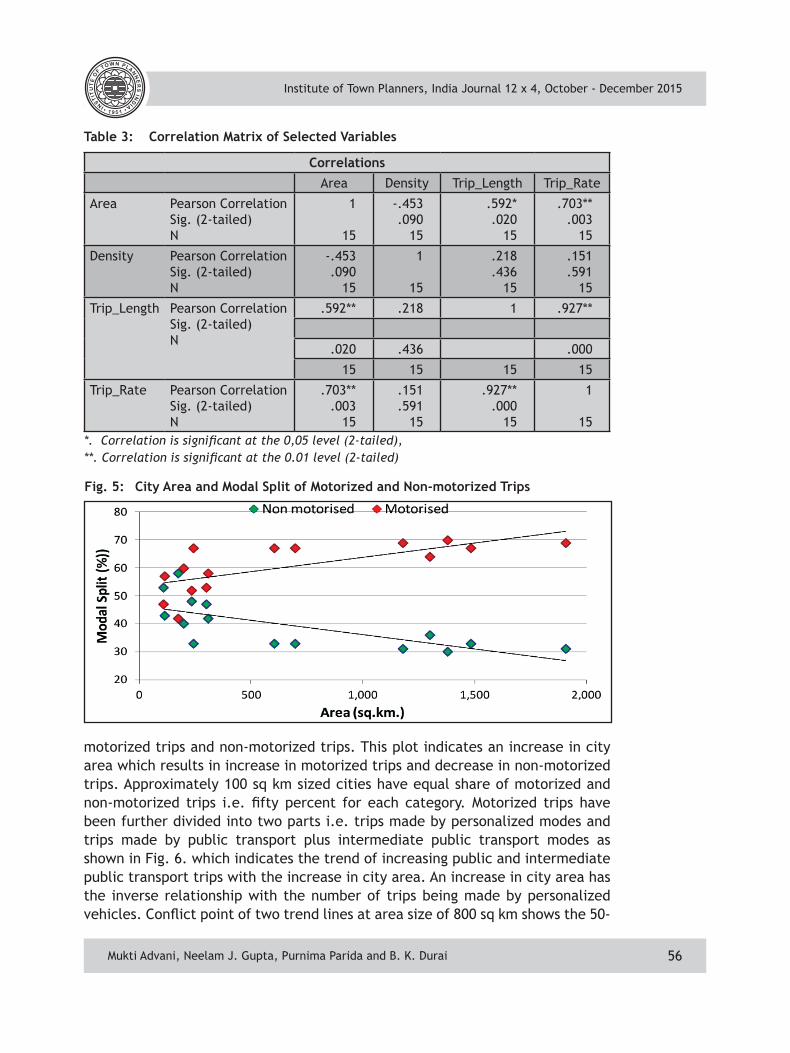
Institute of Town Planners, India Journal 12 x 4, October - December 2015
56
Fig. 5: City Area and Modal Split of Motorized and Non-motorized Trips
motorized trips and non-motorized trips. This plot indicates an increase in city area which results in increase in motorized trips and decrease in non-motorized trips. Approximately 100 sq km sized cities have equal share of motorized and non-motorized trips i.e. fifty percent for each category. Motorized trips have been further divided into two parts i.e. trips made by personalized modes and trips made by public transport plus intermediate public transport modes as shown in Fig. 6. which indicates the trend of increasing public and intermediate public transport trips with the increase in city area. An increase in city area has the inverse relationship with the number of trips being made by personalized vehicles. Conflict point of two trend lines at area size of 800 sq km shows the 50-
Table 3: Correlation Matrix of Selected Variables
CorrelationsArea Density Trip_Length Trip_Rate
Area Pearson CorrelationSig. (2-tailed)N
1
15
-.453.090
15
.592*.020
15
.703**.003
15
Density Pearson CorrelationSig. (2-tailed)N
-.453.090
15
1
15
.218
.43615
.151
.59115
Trip_Length Pearson CorrelationSig. (2-tailed)N
.592** .218 1 .927**
.020 .436 .000
15 15 15 15
Trip_Rate Pearson CorrelationSig. (2-tailed)N
.703**.003
15
.151
.59115
.927**.000
15
1
15*. Correlation is significant at the 0,05 level (2-tailed), **. Correlation is significant at the 0.01 level (2-tailed)
Mukti Advani, Neelam J. Gupta, Purnima Parida and B. K. Durai
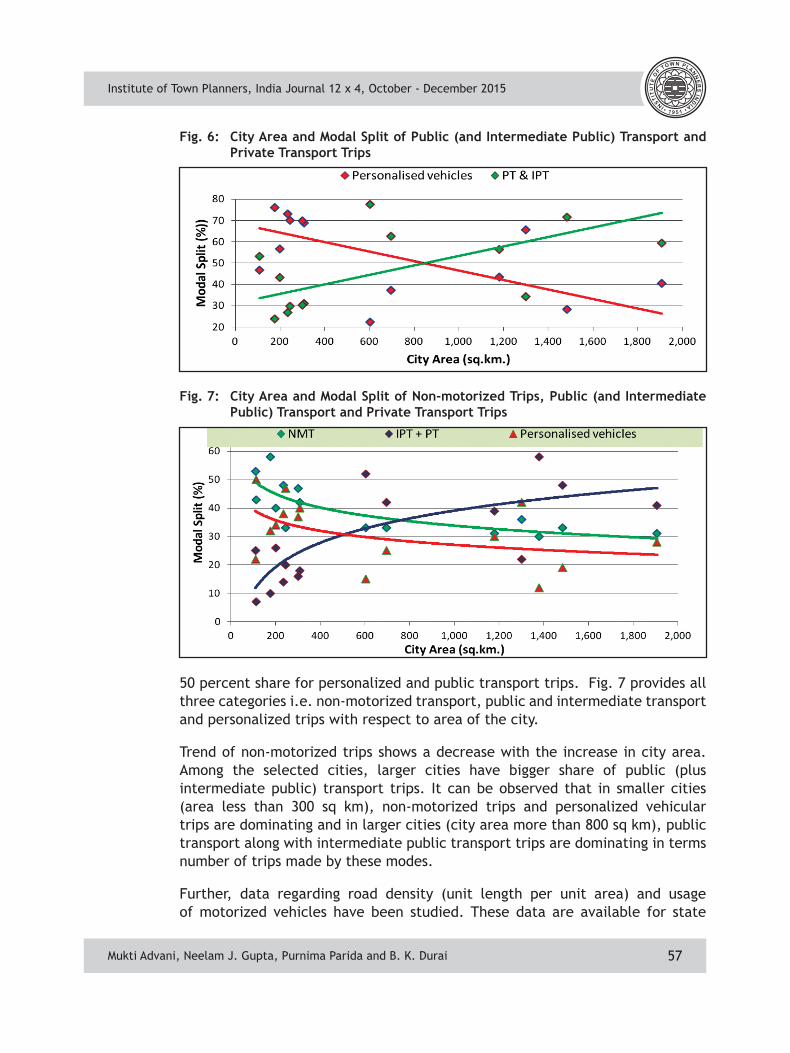
Institute of Town Planners, India Journal 12 x 4, October - December 2015
57
Fig. 6: City Area and Modal Split of Public (and Intermediate Public) Transport and Private Transport Trips
Fig. 7: City Area and Modal Split of Non-motorized Trips, Public (and Intermediate Public) Transport and Private Transport Trips
50 percent share for personalized and public transport trips. Fig. 7 provides all three categories i.e. non-motorized transport, public and intermediate transport and personalized trips with respect to area of the city.
Trend of non-motorized trips shows a decrease with the increase in city area. Among the selected cities, larger cities have bigger share of public (plus intermediate public) transport trips. It can be observed that in smaller cities (area less than 300 sq km), non-motorized trips and personalized vehicular trips are dominating and in larger cities (city area more than 800 sq km), public transport along with intermediate public transport trips are dominating in terms number of trips made by these modes.
Further, data regarding road density (unit length per unit area) and usage of motorized vehicles have been studied. These data are available for state
Mukti Advani, Neelam J. Gupta, Purnima Parida and B. K. Durai
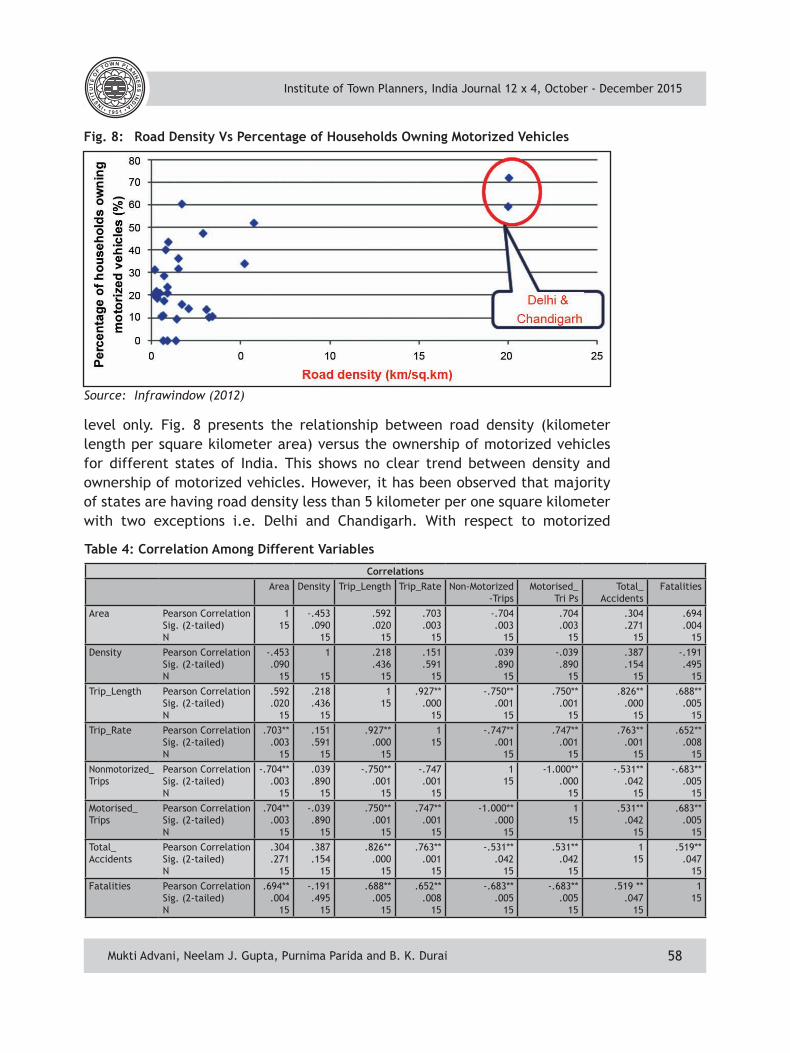
Institute of Town Planners, India Journal 12 x 4, October - December 2015
58
Table 4: Correlation Among Different Variables
CorrelationsArea Density Trip_Length Trip_Rate Non-Motorized
-TripsMotorised_
Tri PsTotal_
AccidentsFatalities
Area Pearson CorrelationSig. (2-tailed)N
115
-.453.090
15
.592
.02015
.703
.00315
-.704.003
15
.704
.00315
.304
.27115
.694
.00415
Density Pearson CorrelationSig. (2-tailed)N
-.453.090
15
1
15
.218
.43615
.151
.59115
.039
.89015
-.039.890
15
.387
.15415
-.191.495
15Trip_Length Pearson Correlation
Sig. (2-tailed)N
.592
.02015
.218
.43615
115
.927**.000
15
-.750**.001
15
.750**.001
15
.826**.000
15
.688**.005
15Trip_Rate Pearson Correlation
Sig. (2-tailed)N
.703**.003
15
.151
.59115
.927**.000
15
115
-.747**.001
15
.747**.001
15
.763**.001
15
.652**.008
15Nonmotorized_Trips
Pearson CorrelationSig. (2-tailed)N
-.704**.003
15
.039
.89015
-.750**.001
15
-.747.001
15
115
-1.000**.000
15
-.531**.042
15
-.683**.005
15Motorised_Trips
Pearson CorrelationSig. (2-tailed)N
.704**.003
15
-.039.890
15
.750**.001
15
.747**.001
15
-1.000**.000
15
115
.531**.042
15
.683**.005
15Total_Accidents
Pearson CorrelationSig. (2-tailed)N
.304
.27115
.387
.15415
.826**.000
15
.763**.001
15
-.531**.042
15
.531**.042
15
115
.519**.047
15Fatalities Pearson Correlation
Sig. (2-tailed)N
.694**.004
15
-.191.495
15
.688**.005
15
.652**.008
15
-.683**.005
15
-.683**.005
15
.519 **.047
15
115
level only. Fig. 8 presents the relationship between road density (kilometer length per square kilometer area) versus the ownership of motorized vehicles for different states of India. This shows no clear trend between density and ownership of motorized vehicles. However, it has been observed that majority of states are having road density less than 5 kilometer per one square kilometer with two exceptions i.e. Delhi and Chandigarh. With respect to motorized
Source: Infrawindow (2012)
Fig. 8: Road Density Vs Percentage of Households Owning Motorized Vehicles
Mukti Advani, Neelam J. Gupta, Purnima Parida and B. K. Durai
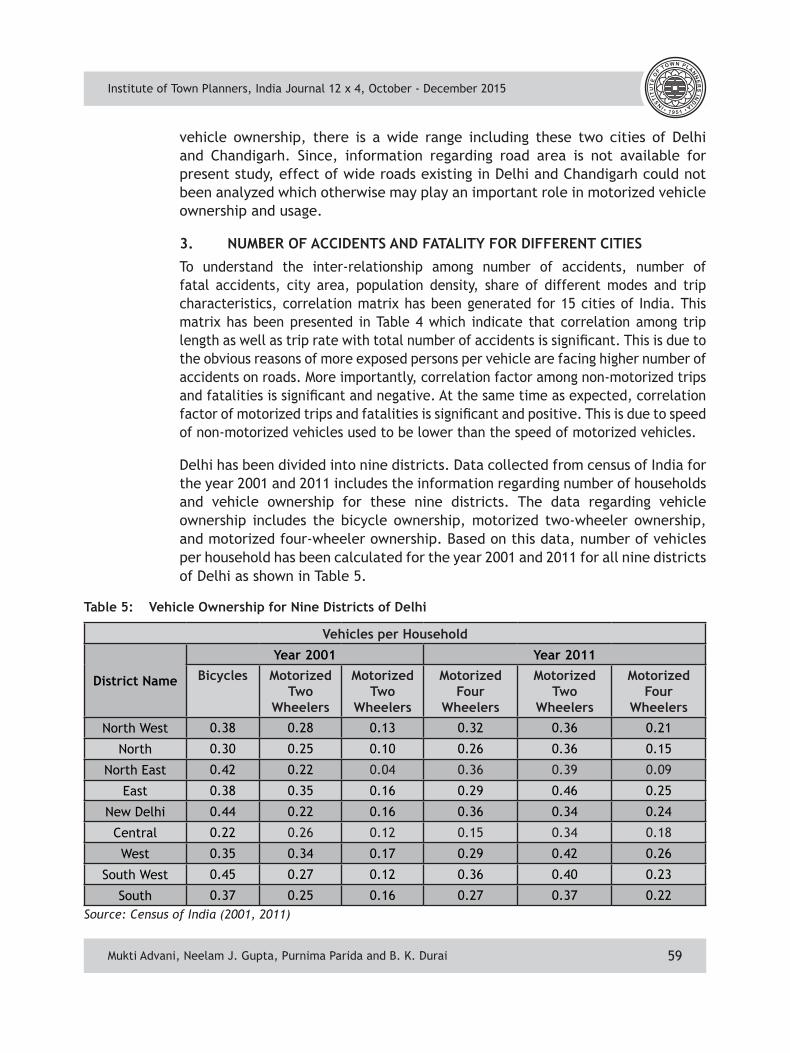
Institute of Town Planners, India Journal 12 x 4, October - December 2015
59
vehicle ownership, there is a wide range including these two cities of Delhi and Chandigarh. Since, information regarding road area is not available for present study, effect of wide roads existing in Delhi and Chandigarh could not been analyzed which otherwise may play an important role in motorized vehicle ownership and usage.
3. NUMBER OF ACCIDENTS AND FATALITY FOR DIFFERENT CITIES
To understand the inter-relationship among number of accidents, number of fatal accidents, city area, population density, share of different modes and trip characteristics, correlation matrix has been generated for 15 cities of India. This matrix has been presented in Table 4 which indicate that correlation among trip length as well as trip rate with total number of accidents is significant. This is due to the obvious reasons of more exposed persons per vehicle are facing higher number of accidents on roads. More importantly, correlation factor among non-motorized trips and fatalities is significant and negative. At the same time as expected, correlation factor of motorized trips and fatalities is significant and positive. This is due to speed of non-motorized vehicles used to be lower than the speed of motorized vehicles.
Delhi has been divided into nine districts. Data collected from census of India for the year 2001 and 2011 includes the information regarding number of households and vehicle ownership for these nine districts. The data regarding vehicle ownership includes the bicycle ownership, motorized two-wheeler ownership, and motorized four-wheeler ownership. Based on this data, number of vehicles per household has been calculated for the year 2001 and 2011 for all nine districts of Delhi as shown in Table 5.
Mukti Advani, Neelam J. Gupta, Purnima Parida and B. K. Durai
Table 5: Vehicle Ownership for Nine Districts of Delhi
Vehicles per Household
District Name
Year 2001 Year 2011Bicycles Motorized
Two Wheelers
Motorized Two
Wheelers
Motorized Four
Wheelers
Motorized Two
Wheelers
Motorized Four
WheelersNorth West 0.38 0.28 0.13 0.32 0.36 0.21
North 0.30 0.25 0.10 0.26 0.36 0.15
North East 0.42 0.22 0.04 0.36 0.39 0.09
East 0.38 0.35 0.16 0.29 0.46 0.25
New Delhi 0.44 0.22 0.16 0.36 0.34 0.24
Central 0.22 0.26 0.12 0.15 0.34 0.18
West 0.35 0.34 0.17 0.29 0.42 0.26
South West 0.45 0.27 0.12 0.36 0.40 0.23
South 0.37 0.25 0.16 0.27 0.37 0.22Source: Census of India (2001, 2011)
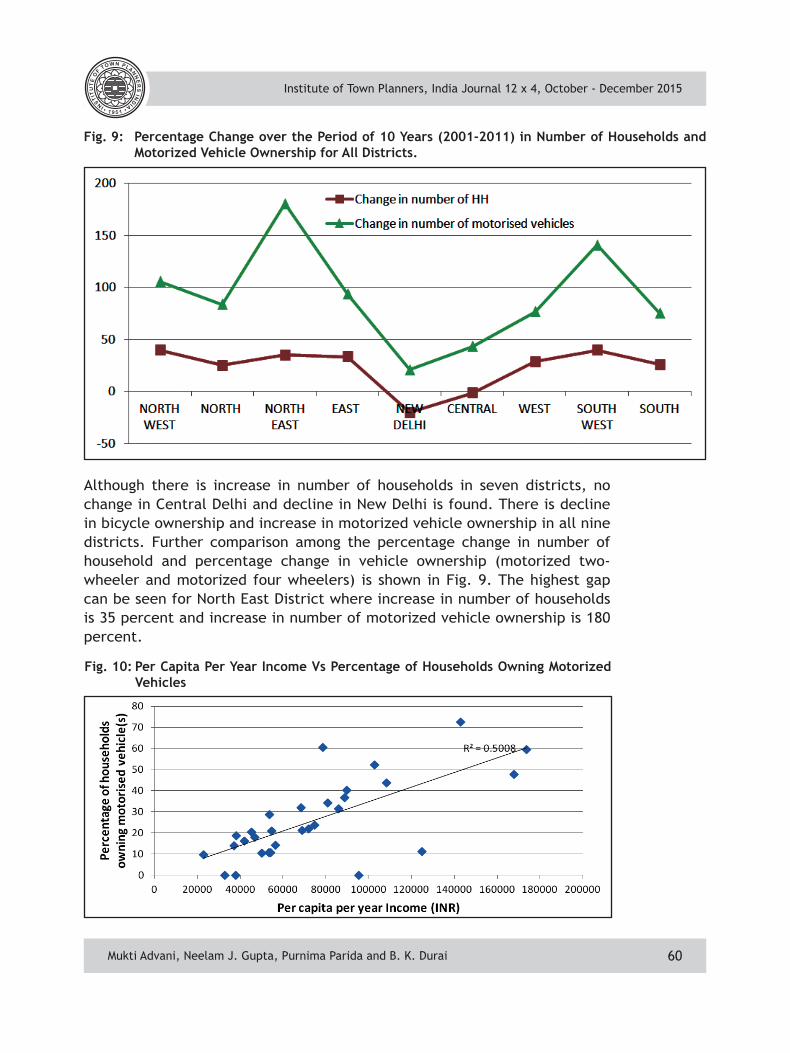
Institute of Town Planners, India Journal 12 x 4, October - December 2015
60
Fig. 10: Per Capita Per Year Income Vs Percentage of Households Owning Motorized Vehicles
Although there is increase in number of households in seven districts, no change in Central Delhi and decline in New Delhi is found. There is decline in bicycle ownership and increase in motorized vehicle ownership in all nine districts. Further comparison among the percentage change in number of household and percentage change in vehicle ownership (motorized two-wheeler and motorized four wheelers) is shown in Fig. 9. The highest gap can be seen for North East District where increase in number of households is 35 percent and increase in number of motorized vehicle ownership is 180 percent.
Mukti Advani, Neelam J. Gupta, Purnima Parida and B. K. Durai
Fig. 9: Percentage Change over the Period of 10 Years (2001-2011) in Number of Households and Motorized Vehicle Ownership for All Districts.
Institute of Town Planners, India Journal 12 x 4, October - December 2015
61
4. PER-CAPITA INCOME AND MOTORIZED VEHICLE OWNERSHIP
Since per capita income data is not available for city level, state level data is used for understanding the interrelationship between income and motorized vehicle ownership. The data on these two parameters were taken from Census of India (2011) and state level statistical handbook. Graphical presentation of this information is presented in Fig. 10. This shows the relationship between per capita per year income and motorized vehicle ownership. The linear trend shows the increase in motorized vehicle ownership with the increased income.
5. CONCLUSIONS
This study is based on secondary data sources, however, an attempt has been made to see the interrelationship among different parameters playing role in existing transport characteristics, which include vehicle ownership and modal split for varying city sizes, population density, road density and per capita income. An increase in city area or density shows increase in average trip length for the selected Indian cities. Further, an increase in area or density also shows an increase in average trip rate. However, inter-relationship among area, density, trip length and trip rate suggest that area is playing larger role in trip rate as well as trip length quantity compared to the role of density. That means area needs to be controlled for desired level of trip characteristics. An increase in city area and size result in increase of motorized trips and decrease in non-motorized trips. Approximately 100 sq km sized cities have equal share of motorized and non-motorized trips i.e. fifty percent for each category. Share of motorized and non-motorized trips play role in accidents occurrence. Correlation factor among non-motorized trips and fatalities is significant and negative. At the same time as expected, correlation factor of motorized trips and fatalities is significant and positive. This is due to speed of non-motorized vehicles used to be lower than the speed of motorized vehicles. Therefore, there is a need to plan for an integrated motorized and non-motorized transport system for the cities. These data and analysis results can be used in achieving desirable share of motorized and non-motorized vehicle ownership as well as usage for varying city sizes, population density, and road density.
REFERENCESBanister, D. (1996) Energy, quality of life and the environment: the role of transport, Transport Reviews, Vol.16, No.1, pp. 23-35.Banister, D. (2005) Unsustainable transport: city transport in the new century, Routledge, London.Banister, D., Watson, S. and Woods, C. (1997) Sustainable cities – transport, energy and urban form, Environment and Planning B, Vol. 24, No.1, pp.125-143. Breheny, M. (2001) ‘Densities and Sustainable Cities: The UK Experience’, in Echinique (ed.) Cities for the New Millennium, Spon Press, London. pp. 39-51.Cameron, I., (2004) Understanding, modelling and predicting transport mobility in urban environments, Murdoch University, Perth.
Mukti Advani, Neelam J. Gupta, Purnima Parida and B. K. Durai
Institute of Town Planners, India Journal 12 x 4, October - December 2015
62
Cervero, R. (1997) Travel demand and the 3Ds: density, diversity, and design, Transportation Research Part D: Transport and Environment, Vol. 2, no. 3, p.199.Dodson, J. (2011) The principles of public transport network planning: A review of the emerging literature with select examples, Issues Paper 15.ECOTEC (1993) Reducing Transport Emissions Through Land Use Planning, HMSO, London.Gordon, P. and Richardson, H.W. (1997) Are Compact Cities a Desirable Planning Goal? Journal of the American Planning association, Vol. 63, no. 1, pp. 95-106.Infrawindow (2012) Road Density in India disparity persists, http://www.infrawindow.com/reports-statistics/road-density-in-india-disparity-persist_15/. Accessed on 30th September 2014.Kenworthy, J.R. (1996) Automobile dependence in cities: an international comparison of urban transport and land use patterns with implications for sustainability, Environmental Impact Assessment Review, Vol. 16, nos. 4-6, p.279.Limtanakool, N., Dijst, M. and Schwanen, T. (2006) The influence of socioeconomic characteristics, land use and travel time considerations on mode choice for medium- and longer-distance trips, Journal of transport geography, Vol. 14, No. 5, pp. 327-341.MoUD (2008) Study on Traffic and Transportation Policies and Strategies in Urban Areas in India, Report by Ministry of Urban Development, New Delhi.Newman, P. (1999) Sustainability and cities: overcoming automobile dependence, Island Press, Washington DC.Newman, P. (1989) Cities and automobile dependence: a sourcebook, Aldershot, Gower.Newman, P. and Kenworthy, J. (1998) Sustainability and Cities; Overcoming Automobile Dependency, Island Press (www.islandpress.org).Shim, G., Rhee, S., Ahn, K. and Chung, S. (2006) The Relationship Between the Characteristics of Transportation Energy Consumption and Urban Form, Annals of Regional Science, Vol. 40, No. 2, pp. 351-367.Stead, D. and Marshall, S. (2001) The Relationships between Urban Form and Travel Patterns: An International Review and Evaluation, European Journal of Transport and Infrastructure Research, Vol. 1, No. 2, pp. 113 – 141. Taylor, I. and Sloman, L. (2008) Master planning Checklist for Sustainable Transport in New Developments, Campaign for Better Transport.Turok, I. (2011) Deconstructing density: Strategic dilemmas confronting the post-apartheid City, Cities, Vol. 28, No. 5, pp. 470-477.
ACKNOWLEDGEMENTSThe authors are grateful to Director, CSIR-CRRI, New Delhi, India for his support and encouragement to publish this paper.
Mukti Advani, Neelam J. Gupta, Purnima Parida and B. K. Durai
Institute of Town Planners, India Journal 12 x 4, October - December 2015
63
Arunika Sharma, Human Settlement Management Institute, HUDCO New Delhi. Email: [email protected]
Street Modifications: Stimulating Social Gathering
Arunika Sharma
1. INTRODUCTION
Public spaces play a vital role in the social and economic life of communities. Human beings have lived in and around nature throughout history. It is important for a city to still be as connected as possible to the natural environment. When people are connected to the natural environment, it contributes to a feeling of less isolation and they become more eager to form connections. Therefore a greater sense of community and social ties emerge. These public spaces are hence important for creating sustainable communities. The social value of public space lies in the contribution it makes for people mixing with others. These places provide opportunities for social interactions, social mixing and social inclusion, and can facilitate the development of community ties.
People make places more than that places make people. Public space only comes into being when it is activated by the presence of people according to dynamic and changing patterns and timetables. Public spaces like streets, market areas, haats, shopping centers, community centers, parks, playgrounds and neighborhood spaces are used widely by the people. The approach taken to design a public space can help or hinder people’s use of it. The success of a particular public space is not solely in the hands of an architect, urban designer or a town planner as it also depends on people adopting, using and managing these spaces.
AbstractStreets are an important component of public open spaces and are the most significant symbols of the urban scape. Streets are multi-functional and cater to the basic needs of people and have positively been associated with the economic growth, physical health, and social well-being of a community. The hierarchy of streets decides its functionality and use, whereas the design signifies potential for exploitation. This paper presents the multiple roles of streets as public spaces and element of communication. A methodical approach needs to be followed to impart functions other than transportation, to streets and make them an integral asset of a neighborhood. This paper has also assimilated cases in which streets have been freed from the controls of motorized vehicles and released for social welfare. Such an attempt is increasing across pan India and also in other parts of the world, making cities safe, accessible and better place to live.
Arunika Sharma
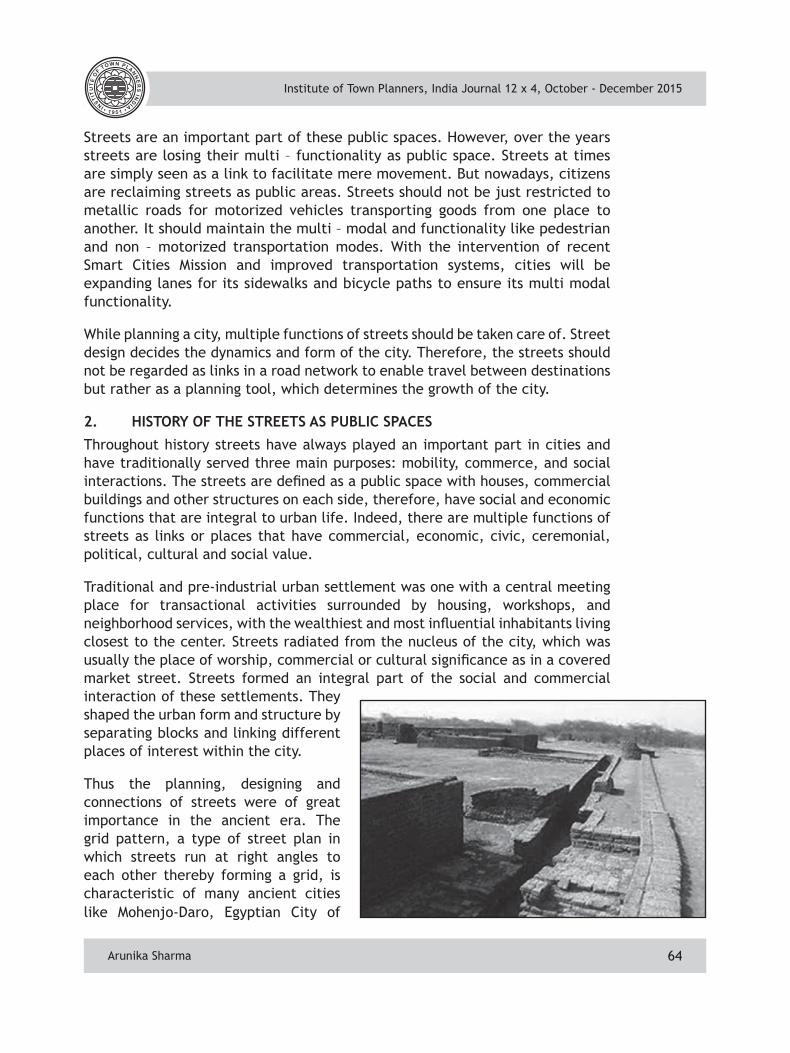
Institute of Town Planners, India Journal 12 x 4, October - December 2015
64
Streets are an important part of these public spaces. However, over the years streets are losing their multi – functionality as public space. Streets at times are simply seen as a link to facilitate mere movement. But nowadays, citizens are reclaiming streets as public areas. Streets should not be just restricted to metallic roads for motorized vehicles transporting goods from one place to another. It should maintain the multi – modal and functionality like pedestrian and non – motorized transportation modes. With the intervention of recent Smart Cities Mission and improved transportation systems, cities will be expanding lanes for its sidewalks and bicycle paths to ensure its multi modal functionality.
While planning a city, multiple functions of streets should be taken care of. Street design decides the dynamics and form of the city. Therefore, the streets should not be regarded as links in a road network to enable travel between destinations but rather as a planning tool, which determines the growth of the city.
2. HISTORY OF THE STREETS AS PUBLIC SPACES
Throughout history streets have always played an important part in cities and have traditionally served three main purposes: mobility, commerce, and social interactions. The streets are defined as a public space with houses, commercial buildings and other structures on each side, therefore, have social and economic functions that are integral to urban life. Indeed, there are multiple functions of streets as links or places that have commercial, economic, civic, ceremonial, political, cultural and social value.
Traditional and pre-industrial urban settlement was one with a central meeting place for transactional activities surrounded by housing, workshops, and neighborhood services, with the wealthiest and most influential inhabitants living closest to the center. Streets radiated from the nucleus of the city, which was usually the place of worship, commercial or cultural significance as in a covered market street. Streets formed an integral part of the social and commercial interaction of these settlements. They shaped the urban form and structure by separating blocks and linking different places of interest within the city.
Thus the planning, designing and connections of streets were of great importance in the ancient era. The grid pattern, a type of street plan in which streets run at right angles to each other thereby forming a grid, is characteristic of many ancient cities like Mohenjo-Daro, Egyptian City of
Arunika Sharma
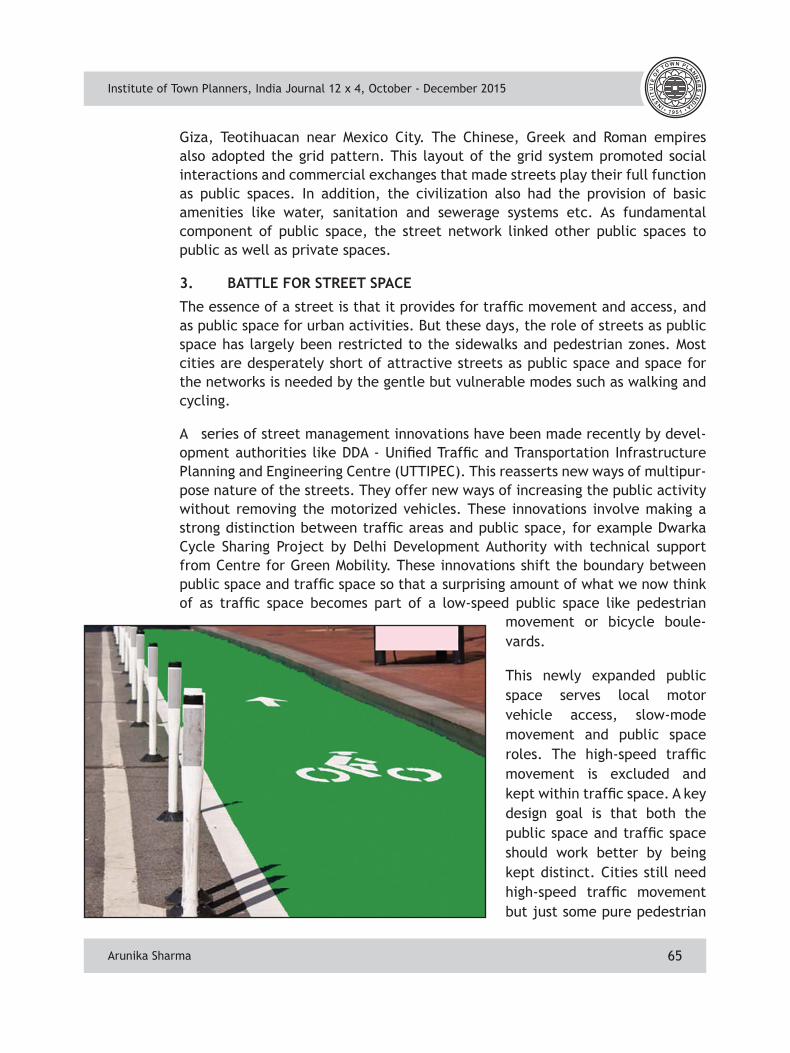
Institute of Town Planners, India Journal 12 x 4, October - December 2015
65
Giza, Teotihuacan near Mexico City. The Chinese, Greek and Roman empires also adopted the grid pattern. This layout of the grid system promoted social interactions and commercial exchanges that made streets play their full function as public spaces. In addition, the civilization also had the provision of basic amenities like water, sanitation and sewerage systems etc. As fundamental component of public space, the street network linked other public spaces to public as well as private spaces.
3. BATTLE FOR STREET SPACE
The essence of a street is that it provides for traffic movement and access, and as public space for urban activities. But these days, the role of streets as public space has largely been restricted to the sidewalks and pedestrian zones. Most cities are desperately short of attractive streets as public space and space for the networks is needed by the gentle but vulnerable modes such as walking and cycling.
A series of street management innovations have been made recently by devel-opment authorities like DDA - Unified Traffic and Transportation Infrastructure Planning and Engineering Centre (UTTIPEC). This reasserts new ways of multipur-pose nature of the streets. They offer new ways of increasing the public activity without removing the motorized vehicles. These innovations involve making a strong distinction between traffic areas and public space, for example Dwarka Cycle Sharing Project by Delhi Development Authority with technical support from Centre for Green Mobility. These innovations shift the boundary between public space and traffic space so that a surprising amount of what we now think of as traffic space becomes part of a low-speed public space like pedestrian
movement or bicycle boule-vards.
This newly expanded public space serves local motor vehicle access, slow-mode movement and public space roles. The high-speed traffic movement is excluded and kept within traffic space. A key design goal is that both the public space and traffic space should work better by being kept distinct. Cities still need high-speed traffic movement but just some pure pedestrian
Arunika Sharma
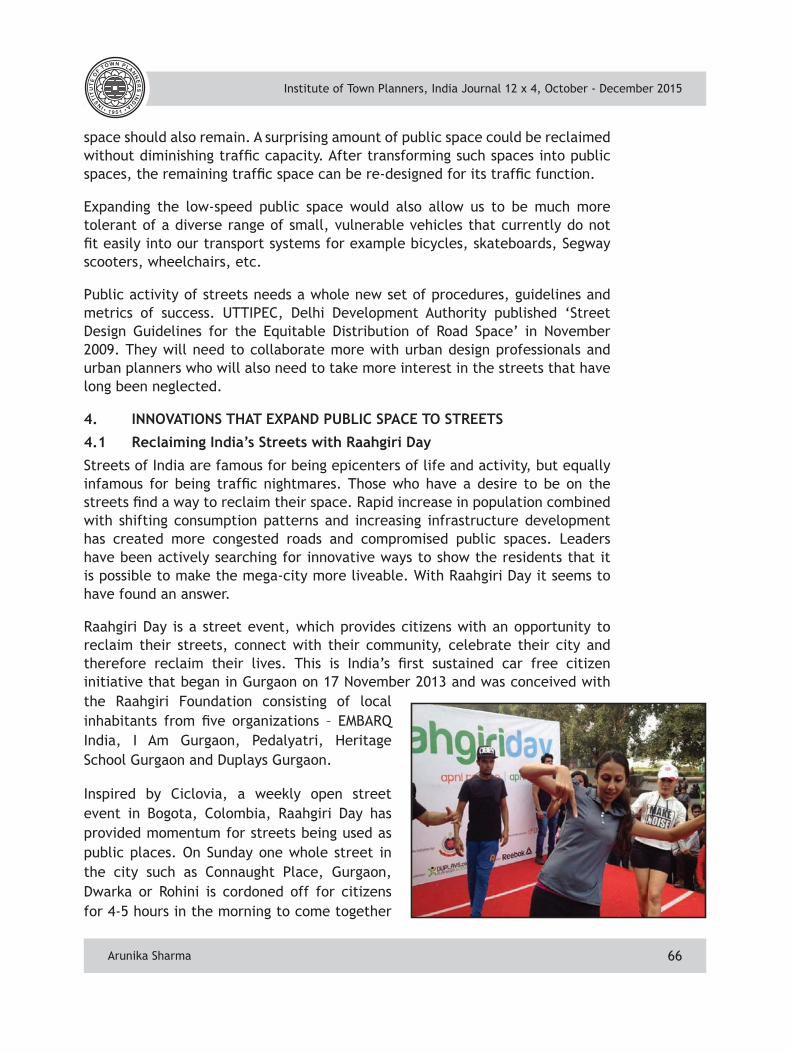
Institute of Town Planners, India Journal 12 x 4, October - December 2015
66
space should also remain. A surprising amount of public space could be reclaimed without diminishing traffic capacity. After transforming such spaces into public spaces, the remaining traffic space can be re-designed for its traffic function.
Expanding the low-speed public space would also allow us to be much more tolerant of a diverse range of small, vulnerable vehicles that currently do not fit easily into our transport systems for example bicycles, skateboards, Segway scooters, wheelchairs, etc.
Public activity of streets needs a whole new set of procedures, guidelines and metrics of success. UTTIPEC, Delhi Development Authority published ‘Street Design Guidelines for the Equitable Distribution of Road Space’ in November 2009. They will need to collaborate more with urban design professionals and urban planners who will also need to take more interest in the streets that have long been neglected.
4. INNOVATIONS THAT EXPAND PUBLIC SPACE TO STREETS
4.1 Reclaiming India’s Streets with Raahgiri Day
Streets of India are famous for being epicenters of life and activity, but equally infamous for being traffic nightmares. Those who have a desire to be on the streets find a way to reclaim their space. Rapid increase in population combined with shifting consumption patterns and increasing infrastructure development has created more congested roads and compromised public spaces. Leaders have been actively searching for innovative ways to show the residents that it is possible to make the mega-city more liveable. With Raahgiri Day it seems to have found an answer.
Raahgiri Day is a street event, which provides citizens with an opportunity to reclaim their streets, connect with their community, celebrate their city and therefore reclaim their lives. This is India’s first sustained car free citizen initiative that began in Gurgaon on 17 November 2013 and was conceived with the Raahgiri Foundation consisting of local inhabitants from five organizations – EMBARQ India, I Am Gurgaon, Pedalyatri, Heritage School Gurgaon and Duplays Gurgaon.
Inspired by Ciclovia, a weekly open street event in Bogota, Colombia, Raahgiri Day has provided momentum for streets being used as public places. On Sunday one whole street in the city such as Connaught Place, Gurgaon, Dwarka or Rohini is cordoned off for citizens for 4-5 hours in the morning to come together
Arunika Sharma
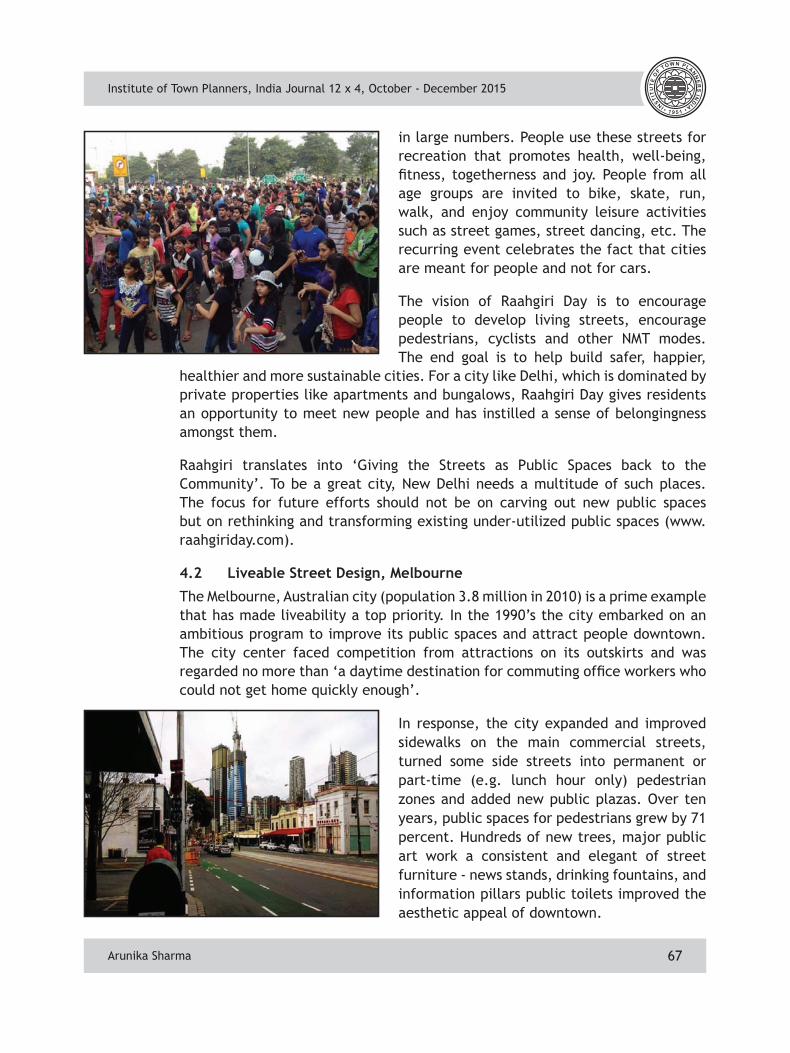
Institute of Town Planners, India Journal 12 x 4, October - December 2015
67
in large numbers. People use these streets for recreation that promotes health, well-being, fitness, togetherness and joy. People from all age groups are invited to bike, skate, run, walk, and enjoy community leisure activities such as street games, street dancing, etc. The recurring event celebrates the fact that cities are meant for people and not for cars.
The vision of Raahgiri Day is to encourage people to develop living streets, encourage pedestrians, cyclists and other NMT modes. The end goal is to help build safer, happier,
healthier and more sustainable cities. For a city like Delhi, which is dominated by private properties like apartments and bungalows, Raahgiri Day gives residents an opportunity to meet new people and has instilled a sense of belongingness amongst them.
Raahgiri translates into ‘Giving the Streets as Public Spaces back to the Community’. To be a great city, New Delhi needs a multitude of such places. The focus for future efforts should not be on carving out new public spaces but on rethinking and transforming existing under-utilized public spaces (www.raahgiriday.com).
4.2 Liveable Street Design, Melbourne
The Melbourne, Australian city (population 3.8 million in 2010) is a prime example that has made liveability a top priority. In the 1990’s the city embarked on an ambitious program to improve its public spaces and attract people downtown. The city center faced competition from attractions on its outskirts and was regarded no more than ‘a daytime destination for commuting office workers who could not get home quickly enough’.
In response, the city expanded and improved sidewalks on the main commercial streets, turned some side streets into permanent or part-time (e.g. lunch hour only) pedestrian zones and added new public plazas. Over ten years, public spaces for pedestrians grew by 71 percent. Hundreds of new trees, major public art work a consistent and elegant of street furniture - news stands, drinking fountains, and information pillars public toilets improved the aesthetic appeal of downtown.
Arunika Sharma
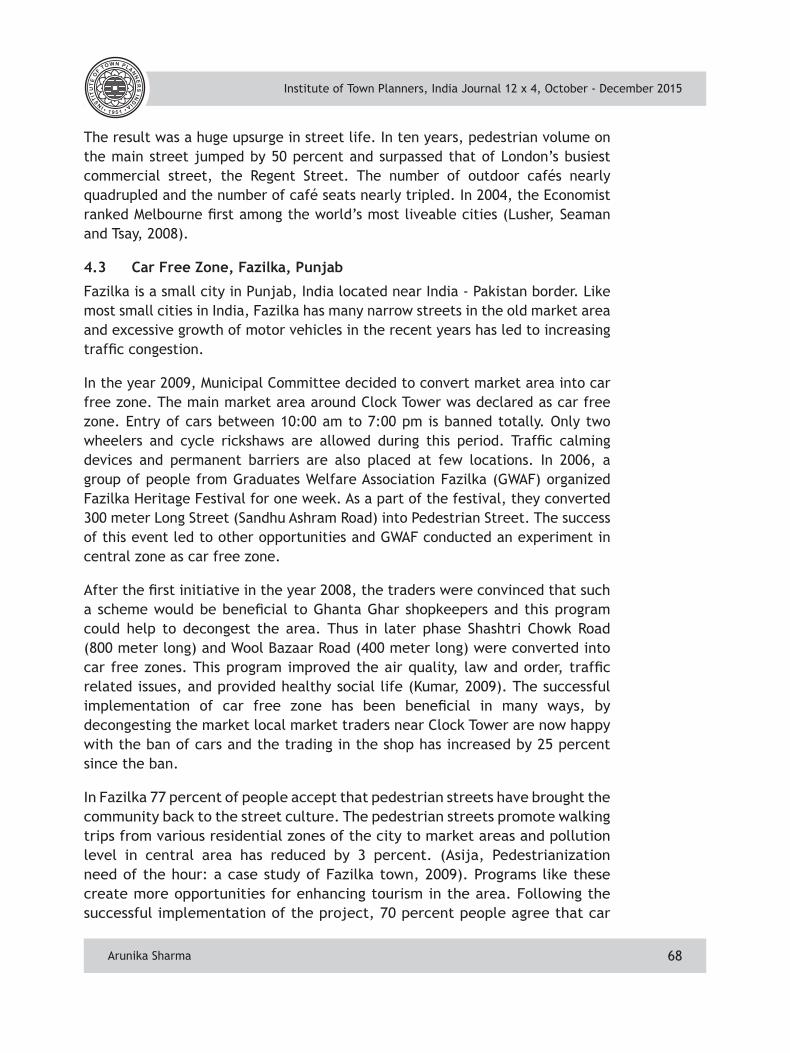
Institute of Town Planners, India Journal 12 x 4, October - December 2015
68
The result was a huge upsurge in street life. In ten years, pedestrian volume on the main street jumped by 50 percent and surpassed that of London’s busiest commercial street, the Regent Street. The number of outdoor cafés nearly quadrupled and the number of café seats nearly tripled. In 2004, the Economist ranked Melbourne first among the world’s most liveable cities (Lusher, Seaman and Tsay, 2008).
4.3 Car Free Zone, Fazilka, Punjab
Fazilka is a small city in Punjab, India located near India - Pakistan border. Like most small cities in India, Fazilka has many narrow streets in the old market area and excessive growth of motor vehicles in the recent years has led to increasing traffic congestion.
In the year 2009, Municipal Committee decided to convert market area into car free zone. The main market area around Clock Tower was declared as car free zone. Entry of cars between 10:00 am to 7:00 pm is banned totally. Only two wheelers and cycle rickshaws are allowed during this period. Traffic calming devices and permanent barriers are also placed at few locations. In 2006, a group of people from Graduates Welfare Association Fazilka (GWAF) organized Fazilka Heritage Festival for one week. As a part of the festival, they converted 300 meter Long Street (Sandhu Ashram Road) into Pedestrian Street. The success of this event led to other opportunities and GWAF conducted an experiment in central zone as car free zone.
After the first initiative in the year 2008, the traders were convinced that such a scheme would be beneficial to Ghanta Ghar shopkeepers and this program could help to decongest the area. Thus in later phase Shashtri Chowk Road (800 meter long) and Wool Bazaar Road (400 meter long) were converted into car free zones. This program improved the air quality, law and order, traffic related issues, and provided healthy social life (Kumar, 2009). The successful implementation of car free zone has been beneficial in many ways, by decongesting the market local market traders near Clock Tower are now happy with the ban of cars and the trading in the shop has increased by 25 percent since the ban.
In Fazilka 77 percent of people accept that pedestrian streets have brought the community back to the street culture. The pedestrian streets promote walking trips from various residential zones of the city to market areas and pollution level in central area has reduced by 3 percent. (Asija, Pedestrianization need of the hour: a case study of Fazilka town, 2009). Programs like these create more opportunities for enhancing tourism in the area. Following the successful implementation of the project, 70 percent people agree that car
Arunika Sharma
Institute of Town Planners, India Journal 12 x 4, October - December 2015
69
free zone will help to enhance tourism potential for the city. Car free zone has led to reduce accidents and has increased pedestrian safety during day and night time. A large majority i.e. 91 percent people have indicated that they would like to see such improvements in pedestrian safety throughout the city along with allowing for slow moving traffic. Further, they suggested that special provisions should be made to avoid fast moving motorized vehicles in the residential streets within the city (Environmental Planning Collaborative, 2013).
5. CONCLUSIONS
People are now reclaiming their streets as public spaces. The desire to have livable streets is present among people in many corners of the world. Streets as public spaces promote social inclusion by providing several opportunities to communities to interact and discuss various issues of their common interest. Streets should be planned to serve communities and continue to ease mobility to enhance economic productivity as well as social engagement. Streets are multi-functional as they provide pathways for basic amenities like pipes, power lines, drainage systems, etc. When the amount of space allocated to streets is insufficient, provision of basic services is also hindered. Therefore, in case of slums areas where there are no streets, provision of these basic services is hampered. In recent years streets have been recognized as an integral factor in the achievement of sustainable urban development. Various notions of streets have been proposed such as livable streets, streets for all, quality streets and friendly streets. These notions include concepts that touch on people’s wellbeing and that make cities more prosperous. Good street connectivity not only reduces traffic congestion and commuting time, it also reduces fares, fuel consumption, traffic, and green house gas emissions in cities by promoting low speed transportation. Streets promote mixed land use efficiency in a compact environment where multi-modal transportation systems could prevail with various accessibility benefits and cost savings.
No city can be prosperous when large segments of its population do not have access to streets. Prosperous streets enhance access to a range of well located, adequate public infrastructure and amenities including education, health, recreation, etc.; for all groups including the poor, young, old and the disabled. This ensures improved connectivity between neighborhood places. By promoting walkability and cycling, streets contribute in reducing air and noise pollution and also preserving the biodiversity. Along with public parks, waterfronts and landscape areas for recreation, streets help in reducing fragmentation of natural systems and reduce spatial footprint through careful
Arunika Sharma
Institute of Town Planners, India Journal 12 x 4, October - December 2015
70
designing of infrastructure networks and settlements. Streets thus, contribute to a major infrastructure development by promoting economic growth through enhanced productivity and by generating additional income and employment, which further elevates living conditions of the people. William H. Whyte, a famous American urbanist noted: “The street is the river of life, the place where we come together, the pathway to the center”. Hence a street is just not about transportation but about social and commercial interactions. It is not just a mere conduit for moving cars but a right place for socializing and for other civic activities. The recent innovations that expanded public areas to streets has made a significant contribution towards getting our streets right by insisting that if streets are designed in a right manner, these can accommodate all users for multipurpose interactions.
REFERENCES Barter, P. (undated) Battle for Street Space Part – 1, Earning a Public Space Dividend in the Streets, Lee Kuan Yew School of Public Policy, National University of Singapore, Singapore.
Delhi Development Authority with technical support from Centre for Green Mobility (2015) Dwarka Cycle Sharing Project, DDA, New Delhi.
Environmental Planning Collaborative (2013) Sustainable Urban Transport: Principles and Guidelines for Indian Cities, Draft Report, New Delhi.
Kumar (2009) Planning and Design for Pedestrian Safety, Fazilka.
Lusher, L., Seaman, M. and Tsay, S. (2008) Streets to Live By: How Livable Street Design can bring Economic, Health and Quality of Life Benefits to New York City, New York.
Raahgiri Foundation (2015) Raahgiri Day, Apni Rahen, Apni Azaadi, Raahgiri Foundation, New Delhi.
UTTIPEC of Delhi Development Authority (2010) Street Design Guidelines for Equitable Distribution of Road Space, New Delhi.
UTTIPEC of Delhi Development Authority (2012) Last Mile Connectivity and Multi Modal Integration, Proposed Action Plan – Projects and Programme, New Delhi.
UN – Habitat (2013) Streets as Public Spaces and Drivers of Urban Prosperity, Nairobi.
Arunika Sharma
Institute of Town Planners, India Journal 12 x 4, October - December 2015
71
Ankur Prabhakar, Research Scholar, Guru Nanak Dev University, Amritsar
Slums of Ludhiana: The Need for Housing in the prevailing Schemes and Programs
Ankur Prabhakar
1. INTRODUCTION
Growing levels of urbanization and basic human requirements like shelter and related infrastructure both at rural and urban centers due to the change in economic and social environment, mismatch in terms of demand and supply of developed land and housing at affordable rates. Further the inability of poorer sections of the population to have access to formal land markets and finances from financial institutions is leading to a non-sustainable situation. Rapid urbanization is placing an immense pressure on urban resources. With the result, people have a wide range of reasons to migrate from their native places to large cities.
Rapid growth of slums in the developing world appears to have three root causes in addition to the underlying problems of poverty - available facilities in the city, which act as a pull factor; non-availability of such facilities push population from rural areas; and the increase in population size. Inadequacy of city infrastructure and inability of the poor to access affordable developed land for housing forces majority of poor to reside in slums and squatter settlements.
As defined by Amartya Sen, poverty is lack of basic capabilities to lead the kind of life one values, and thus should therefore not be seen merely in financial terms. The crucial thing is that the number of slums and magnitude of slum population does not seem to decrease. Social, environmental and physical fabric of cities is under heavy stress due to segregation and deprivation in slums, which should be integral parts of the urban civil society.
Ankur Prabhakar
AbstractThis paper examines slums of the city of Ludhiana in Punjab. In Ludhiana in 2001, there were 209 slums with population of 314,904 comprising of 61,822 households. The slum population of Ludhiana comes out to be 22.52 percent of the total urban population of Ludhiana city. It is found that a vast majority i.e. 87 percent of the slums are located in residential areas whereas only 12.9 percent slums are located in industrial and commercial areas. Most of the slums located in industrial areas have been found to be located on vacant lands earmarked for industrial purposes. Growth of slums has kept pace with growth of population and pace of industrialization of Ludhiana metropolis. Most slums are located on private lands and are not eligible for improvement under government schemes. That is why the Municipal Corporation of Ludhiana has undertaken only 10 slums for redevelopment out of a total of 209 slums.
Institute of Town Planners, India Journal 12 x 4, October - December 2015
72
A slum refers to housing that was once of good condition but has since deteriorated and often been sub-divided and rented out to low income groups. Squatter settlements are on the other hand, areas of substandard housing built on illegally occupied land, while irregular sub-divisions originated through legal land owners sub-dividing their plots and selling them without complying relevant planning and other laws.
According to the Census of India, a slum is a compact area of at least 300 population or about 60-70 households of poorly built, congested tenements, in-hygienic environment usually with inadequate infrastructure and lack of proper sanitary and drinking water facilities. These are the areas unfit for human habitation by reason of dilapidation, over crowding, faulty arrangement and design of such buildings, narrowness or faulty arrangement of streets, lack of ventilation, light or sanitation facilities, or any combination of these factors are detrimental to safety, health or morals.
One of the major reasons for increase in number of slums and squatters is the development of towns in the name of urbanization. Urban growth is attributed to natural population growth and rural to urban migration, when there is availability of the opportunities for poor in the city who are attracted by greater job prospects and availability of services.
2. SLUMS IN PUNJAB
Punjab is one of the advanced states of the country with highly productive agriculture, a well-developed physical infrastructure and a high human development index with industrious and entrepreneur skills. With urbanization level of 33.95 percent, Punjab is ranked fifth major urbanized state of India. It has been observed that while total population of the state has increased approximately 3 times (7.5 to 24.28 million, in 2001), while urban population recorded an increase of 9 times (0.9 to 8.25 million) indicating a sharp rise in urban population. As per Census 2001, 4.3 percent of the total households in the State were living in dilapidated houses and nearly 14 percent of the urban population in the State is living in slums.
3. LUDHIANA CITY AND SLUMS
Ludhiana, the only metropolitan city of Punjab, is the largest city in Punjab, both in terms of area and population. The city is commonly known as the Manchester of India, the hub of the Indian hosiery industry and also as industrial capital of small scales industries in the country. The city covers an area of 159.37 sq km having a population of 14 lakh approximately (Census, 2001).
Growth of Ludhiana city as a major centre of production, which is considered to be the heart of Green Revolution belt and the home of small scale industries can be accompanied with the presence of poverty. Scarcity of urban land for
Ankur Prabhakar
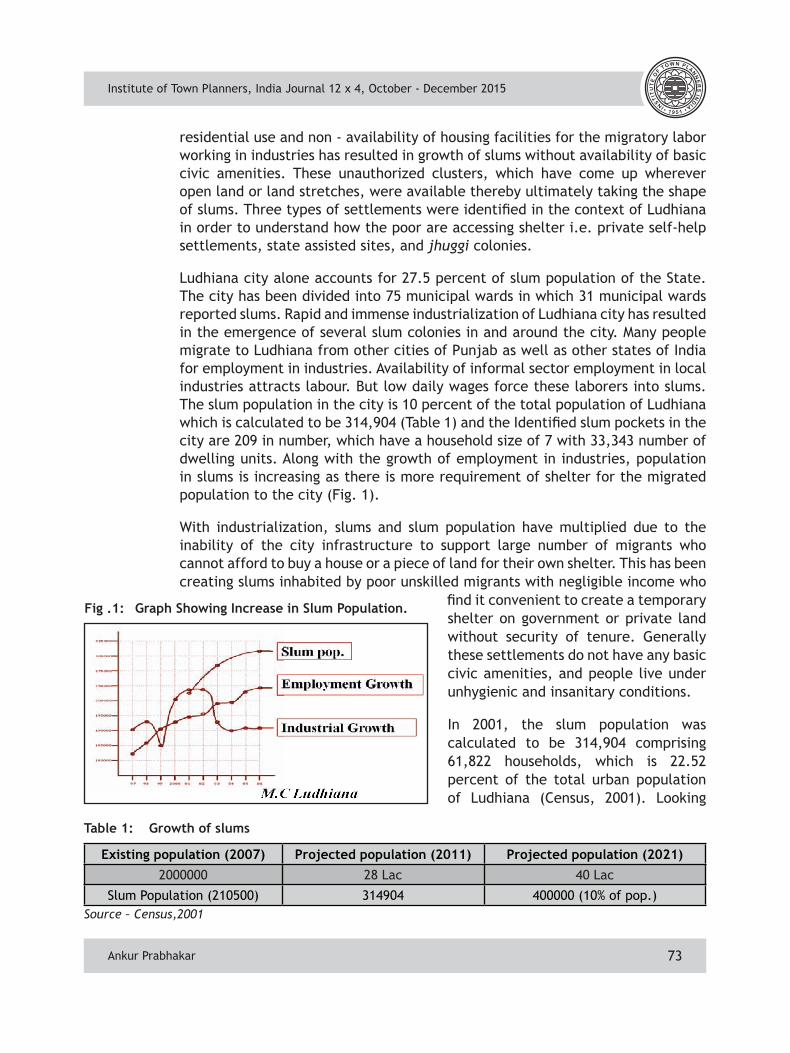
Institute of Town Planners, India Journal 12 x 4, October - December 2015
73
residential use and non - availability of housing facilities for the migratory labor working in industries has resulted in growth of slums without availability of basic civic amenities. These unauthorized clusters, which have come up wherever open land or land stretches, were available thereby ultimately taking the shape of slums. Three types of settlements were identified in the context of Ludhiana in order to understand how the poor are accessing shelter i.e. private self-help settlements, state assisted sites, and jhuggi colonies.
Ludhiana city alone accounts for 27.5 percent of slum population of the State. The city has been divided into 75 municipal wards in which 31 municipal wards reported slums. Rapid and immense industrialization of Ludhiana city has resulted in the emergence of several slum colonies in and around the city. Many people migrate to Ludhiana from other cities of Punjab as well as other states of India for employment in industries. Availability of informal sector employment in local industries attracts labour. But low daily wages force these laborers into slums. The slum population in the city is 10 percent of the total population of Ludhiana which is calculated to be 314,904 (Table 1) and the Identified slum pockets in the city are 209 in number, which have a household size of 7 with 33,343 number of dwelling units. Along with the growth of employment in industries, population in slums is increasing as there is more requirement of shelter for the migrated population to the city (Fig. 1).
With industrialization, slums and slum population have multiplied due to the inability of the city infrastructure to support large number of migrants who cannot afford to buy a house or a piece of land for their own shelter. This has been creating slums inhabited by poor unskilled migrants with negligible income who
find it convenient to create a temporary shelter on government or private land without security of tenure. Generally these settlements do not have any basic civic amenities, and people live under unhygienic and insanitary conditions.
In 2001, the slum population was calculated to be 314,904 comprising 61,822 households, which is 22.52 percent of the total urban population of Ludhiana (Census, 2001). Looking
Fig .1: Graph Showing Increase in Slum Population.
Existing population (2007) Projected population (2011) Projected population (2021)2000000 28 Lac 40 Lac
Slum Population (210500) 314904 400000 (10% of pop.)
Table 1: Growth of slums
Source – Census,2001
Ankur Prabhakar
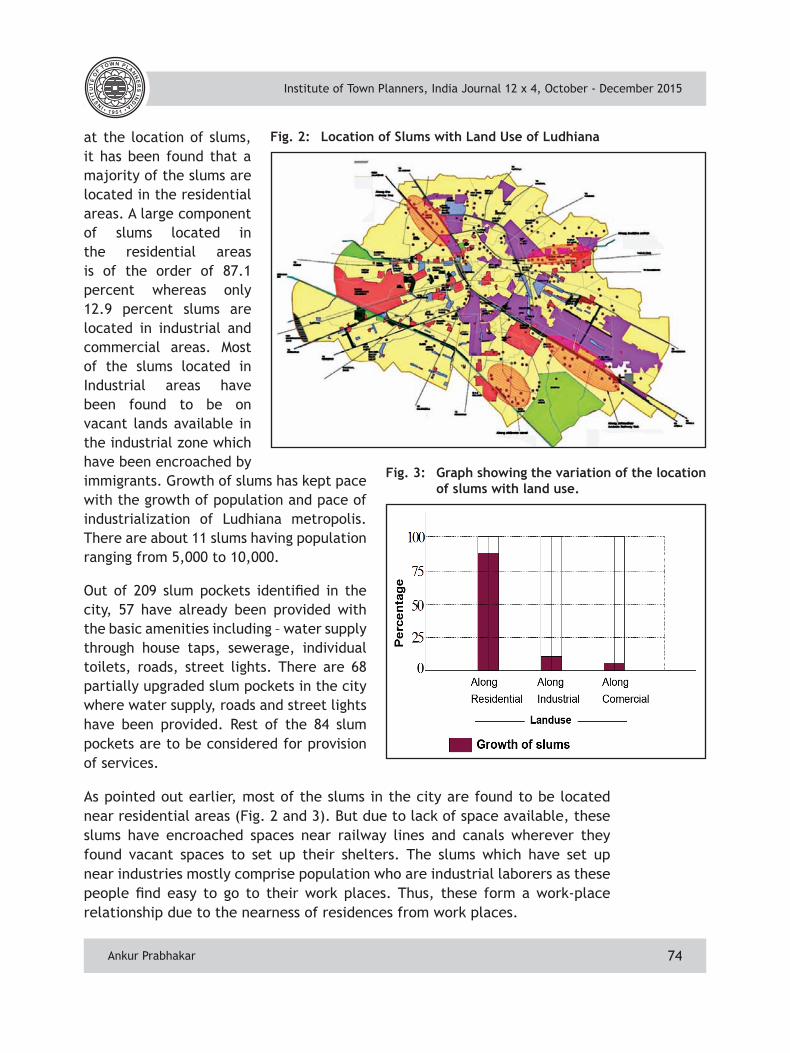
Institute of Town Planners, India Journal 12 x 4, October - December 2015
74
at the location of slums, it has been found that a majority of the slums are located in the residential areas. A large component of slums located in the residential areas is of the order of 87.1 percent whereas only 12.9 percent slums are located in industrial and commercial areas. Most of the slums located in Industrial areas have been found to be on vacant lands available in the industrial zone which have been encroached by immigrants. Growth of slums has kept pace with the growth of population and pace of industrialization of Ludhiana metropolis. There are about 11 slums having population ranging from 5,000 to 10,000.
Out of 209 slum pockets identified in the city, 57 have already been provided with the basic amenities including – water supply through house taps, sewerage, individual toilets, roads, street lights. There are 68 partially upgraded slum pockets in the city where water supply, roads and street lights have been provided. Rest of the 84 slum pockets are to be considered for provision of services.
As pointed out earlier, most of the slums in the city are found to be located near residential areas (Fig. 2 and 3). But due to lack of space available, these slums have encroached spaces near railway lines and canals wherever they found vacant spaces to set up their shelters. The slums which have set up near industries mostly comprise population who are industrial laborers as these people find easy to go to their work places. Thus, these form a work-place relationship due to the nearness of residences from work places.
Fig. 2: Location of Slums with Land Use of Ludhiana
Fig. 3: Graph showing the variation of the location of slums with land use.
Ankur Prabhakar
Institute of Town Planners, India Journal 12 x 4, October - December 2015
75
As 87 percent of the total slums in Ludhiana are found near residential areas, these areas create an unhealthy environment for planned residences around and forming an eyesore for the surroundings. Concentration of slums found near industries is due to the reason that it becomes easy for the migrated population to cover the distance between their work places. A majority of slums are located on the private land which accounts for 174 out of the total of 209 slums and the rest are located on government land. This peculiar situation can help in finding appropriate solutions for removal of slums with the involvement of land owners based on providing higher incentives and subsidies for creating appropriate shelter for slum dwellers occupying such lands. Housing is one of the basic human needs and ranks after food and clothing in terms of priority. It constitutes one of the most important parts of the social environment where an individual is nurtured, grows and matures as a human being as a part of the society and as a citizen.
In Ludhiana, problems of the city persist with regard to rapid population growth and large scale migration and poverty, haphazard growth of slums and squatter settlements. Slums can be seen near almost all residential areas causing unplanned urban development. There is no formal housing for workers leading to growth of slums coming up near industrial areas. As a result, the gap between supply and demand of adequate and affordable houses has increased considerably in the city. Slums have largely emerged as a corollary of urbanization. Due to high rate of development there is increase in land prices. Land speculation is undertaken by high income population and less affordability by lower income groups causing shortage of land. Hence, remaining lower strata gets negligible attention by the concerned local authorities.
4. STATUS OF SCHEMES
There has been no reliable urban poverty reduction strategy or policy for the city. Slum identification for up-gradation was not done according to well accepted criteria and similarly identification of beneficiaries. There is inadequate support structure due to non-representation of beneficiaries, lack of sector representation and co-ordination with line departments, untrained and non-responsive resident community volunteers, lack of networking within community organizations and poor community participation. Most of the deficiencies in implementation of urban poverty alleviation programs are due to weak functional and fiscal base. Programs like the Rajiv Awas Yojna are coming up in the city for the up-liftment of slum dwellers providing shelter to such people.
4.1 Rajiv Gandhi Awas Yojana
Rajiv Awas Yojana or RAY for slum dwellers and the urban poor envisages a Slum Free India through encouraging states and union territories to tackle the problem of slums. Its main focus is to bring existing slums within the formal system and
Ankur Prabhakar
Institute of Town Planners, India Journal 12 x 4, October - December 2015
76
enabling them to avail of the same level of basic amenities as the rest of the town.
Slum Free Plan of Action is an integrated and holistic plan to be prepared for the up-gradation of all existing slums, notified or non-notified, in each identified city. In considering the plan of action, the Centre would particularly assess that cities have been chosen to maximize cross-subsidization, that the extent of commitment for cross-subsidization through PPP has been fully explored, and that the mechanisms for community participation have been clearly delineated and activated (Ministry of Housing and Urban Poverty Alleviation). An amount of Rs. 585 lakh, has been sanctioned to Government of Punjab as the first installment for Slum Free Plan of action scheme under the RAY to cover five cities including Ludhiana (Rajiv Awas Yojana, 2011).
4.2 Housing Provision Under JnNURM
New schemes such as BSUP and IHSDP under the JnNURM introduced by the Ministry of Urban Development, Government of India has an integrated approach to improving the conditions of slum dwellers that do not possess adequate shelter and reside in dilapidated conditions.
Municipal Corporation Ludhiana has initiated five housing projects for slum improvement in Ludhiana city. Under this scheme, Rs. 66.64 crore was sanctioned by the Ministry of Housing and Urban Poverty Alleviation, Government of India. Areas under this scheme include Giaspura with 1696 dwelling units, Mundian Kalan to be having 1,200 dwelling units, Dhandari Kalan 1,136 dwelling units, and Village Giaspura with 800 dwelling units (Municipal Corporation of Ludhiana: www.mcldh.org).
4.3 Selection of Areas under the BSUP
Identified areas by Ludhiana Municipal Corporation on priority basis, which are inhabited by poor, deprived of house as well as infrastructure for basic amenities. Out of the total 209 slums, only 10 slum colonies have been selected which covers 1,503 house hold beneficiaries, namely Industrial Area, Rishi Nagar (Block F and G), BRS Nagar near Canal, Village Sunet, Sigligarh, Salem Tabri, Luv Kush Nagar, Mata Dudh Kursi, Dhakka Colony, KW Colony. These slum colonies are located on government land and cover a population of 8,940 people.
Under this scheme, shelter to households has been provided by partly insitu up-gradation and colonies located on government lands have been relocated on other sites having same kind of provisions on every site with similar features of tenements including sizes of each dwelling unit and that of blocks along with a common area. Under the scheme, a total of 4,832 dwelling units will be constructed each covering an area of 25.64 sq m.
Ankur Prabhakar
Institute of Town Planners, India Journal 12 x 4, October - December 2015
77
5. CONCLUSIONS
Municipal Corporation of Ludhiana has implemented various poverty alleviation and infrastructure development programs, but the multi - dimensional problem of poverty continues to exist. Most significantly these programs failed to achieve targets for slum improvement due to a number of reasons including the paucity of funds with local authorities. Local bodies depend upon other schemes especially under the JnNURM, which is wholly responsible for the up-gradation of slums due to lack of funds with urban local bodies. Slum improvement under this scheme has made a great stride in providing shelter to such population. Hence, a large number of slums can be covered accommodating a large population, and this population could be provided with basic facilities perceived as basic human needs.
REFERENCES Bhasin, R. (2001) Urban Poverty and Urbanization, Deep Publishers, New Delhi.
Desai, A.R. and Pillai, D. (1970) Slums and Urbanisation, Bombay Publications, Bombay.
Ministry of Urban Employment and Poverty Alleviation (2005) Jawaharlal National Urban Renewal Mission or JNNURM, Ministry of Urban Employment and Poverty Alleviation, New Delhi.
Municipal Corporation of Ludhiana (2001) City Development Plan, Ludhiana (2001-2021), Municipal Corporation of Ludhiana, Ludhiana.
Municipal Corporation of Ludhiana (2007) Inception Report on Urban Poverty Reduction Strategy for the City of Ludhiana, Municipal Corporation of Ludhiana, Ludhiana.
Sandhu, R. (1989) The City and its Slums, The University Press, Amritsar, Amritsar.
Schuler, N. (2006) Urban Poverty: A Summary of Methods and Approaches, eBook, World Bank, Washington.
Prabhakar, A. (2011) Provision of housing for Slum Dwellers in Ludhiana, An unpublished thesis, G.R.D School of Planning, GNDU, Amritsar.
Purewal, N.K. (2008) Paths to Housing Access for the Slum Dwellers in Punjab, UK, GBER Vol. 4., University of Manchester, Manchester.
Zachariah, P. and Zachariah, A. (2007) The Slums of Ludhiana City, Ludhiana.
Ankur Prabhakar
Institute of Town Planners, India Journal 12 x 4, October - December 2015
78
Kshitij Mehra, Associate of Institute of Town Planners, India
Mutum Chaobisana Devi, Associate of Institute of Town Planners, India
Pawan Sharma, Associate of Institute of Town Planners, India
A Mid Term Review of the Master Plan Delhi - 2021
Kshitij Mehra, Mutum Chaobisana Devi and Pawan Sharma
1. INTRODUCTION
The process of planned development of the National Capital began with the enactment of Delhi Development Act 1957 followed by promulgation of the Master Plan of Delhi in 1962 (MPD-62).
A Master Plan is the long term perspective plan for guiding sustainable and planned development of the city. This document lays down the planning guidelines, policies, development codes and space requirements for various activities supporting the city population. It is also the basis for all infrastructure requirements. Master Plan describes all works required to be undertaken in next 20 years in a phased manner.
2. A REVIEW OF THE MASTER PLAN FOR DELHI
Experiences of planning urban areas through a policy document like Master Plan has time and again shown that there is a need to respond to urban dynamics. At the same time, the process has to be transparent and accountable.
A periodic review of the Master Plan for Delhi is not a new initiative. The Master Plan for Delhi (1961-81) provided for periodic review and revision every 20 years. Demands of the city due to changes in economic activities, population and continued growth have necessitated this. Based on the experience of the plan and to cater to the increasing population and changing requirements of the city for the next 20 years up to year 2001, modifications to MPD-1962 were made under Section 11-A of Delhi Development Act, 1957 and the Master Plan for Delhi - 2001 was finalized. This was to ensure that the plan is responsive to
Kshitij Mehra, Mutum Chaobisana Devi and Pawan Sharma
AbstractThis paper provides an overview of the process of the Mid-term Review of the Master Plan for Delhi - 2021 after the plan was implemented for a period of five years. The paper provides useful details about the procedures followed in organizing the review exercise. The paper underscores that this review has led to a number of significant changes in the Master Plan policies. Several policy changes pertain to enhancement in FARs and ground coverage.
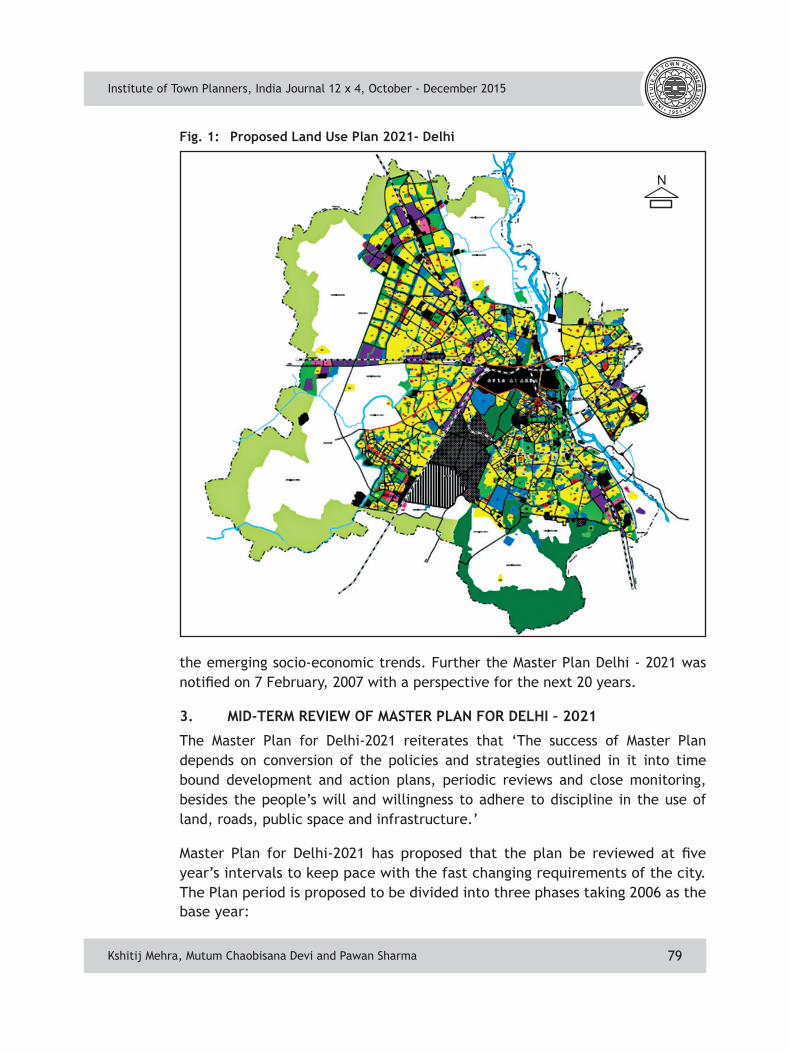
Institute of Town Planners, India Journal 12 x 4, October - December 2015
79Kshitij Mehra, Mutum Chaobisana Devi and Pawan Sharma
the emerging socio-economic trends. Further the Master Plan Delhi - 2021 was notified on 7 February, 2007 with a perspective for the next 20 years.
3. MID-TERM REVIEW OF MASTER PLAN FOR DELHI – 2021
The Master Plan for Delhi-2021 reiterates that ‘The success of Master Plan depends on conversion of the policies and strategies outlined in it into time bound development and action plans, periodic reviews and close monitoring, besides the people’s will and willingness to adhere to discipline in the use of land, roads, public space and infrastructure.’
Master Plan for Delhi-2021 has proposed that the plan be reviewed at five year’s intervals to keep pace with the fast changing requirements of the city. The Plan period is proposed to be divided into three phases taking 2006 as the base year:
Fig. 1: Proposed Land Use Plan 2021- Delhi
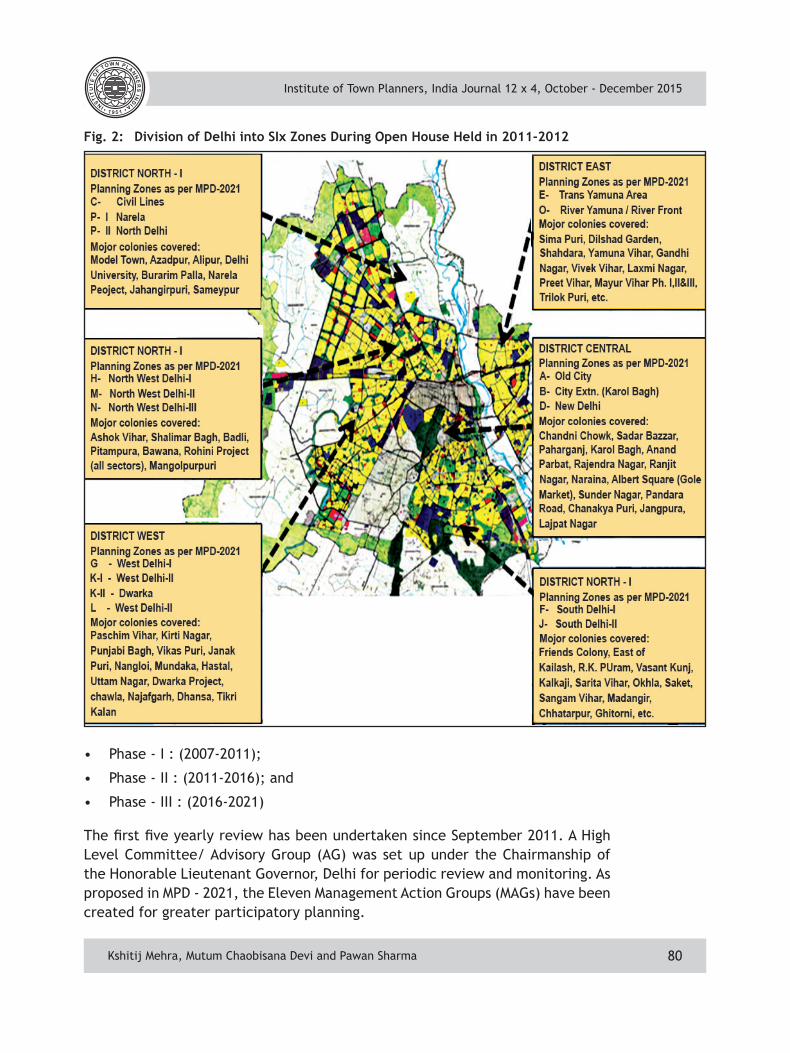
Institute of Town Planners, India Journal 12 x 4, October - December 2015
80
• Phase - I : (2007-2011);
• Phase - II : (2011-2016); and
• Phase - III : (2016-2021)
The first five yearly review has been undertaken since September 2011. A High Level Committee/ Advisory Group (AG) was set up under the Chairmanship of the Honorable Lieutenant Governor, Delhi for periodic review and monitoring. As proposed in MPD - 2021, the Eleven Management Action Groups (MAGs) have been created for greater participatory planning.
Fig. 2: Division of Delhi into SIx Zones During Open House Held in 2011-2012
Kshitij Mehra, Mutum Chaobisana Devi and Pawan Sharma
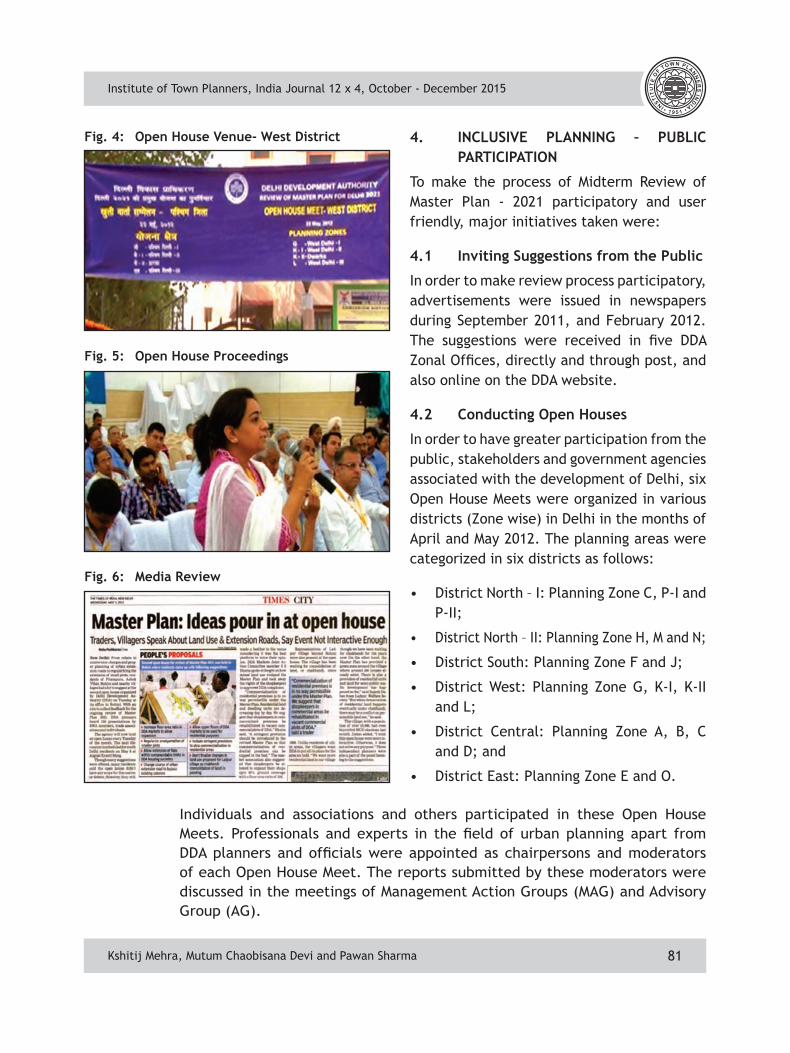
Institute of Town Planners, India Journal 12 x 4, October - December 2015
81
4. INCLUSIVE PLANNING – PUBLIC PARTICIPATION
To make the process of Midterm Review of Master Plan - 2021 participatory and user friendly, major initiatives taken were:
4.1 Inviting Suggestions from the Public
In order to make review process participatory, advertisements were issued in newspapers during September 2011, and February 2012. The suggestions were received in five DDA Zonal Offices, directly and through post, and also online on the DDA website.
4.2 Conducting Open Houses
In order to have greater participation from the public, stakeholders and government agencies associated with the development of Delhi, six Open House Meets were organized in various districts (Zone wise) in Delhi in the months of April and May 2012. The planning areas were categorized in six districts as follows:
• District North – I: Planning Zone C, P-I and P-II;
• District North – II: Planning Zone H, M and N;
• District South: Planning Zone F and J;
• District West: Planning Zone G, K-I, K-II and L;
• District Central: Planning Zone A, B, C and D; and
• District East: Planning Zone E and O.
Fig. 4: Open House Venue- West District
Fig. 5: Open House Proceedings
Fig. 6: Media Review
Kshitij Mehra, Mutum Chaobisana Devi and Pawan Sharma
Individuals and associations and others participated in these Open House Meets. Professionals and experts in the field of urban planning apart from DDA planners and officials were appointed as chairpersons and moderators of each Open House Meet. The reports submitted by these moderators were discussed in the meetings of Management Action Groups (MAG) and Advisory Group (AG).
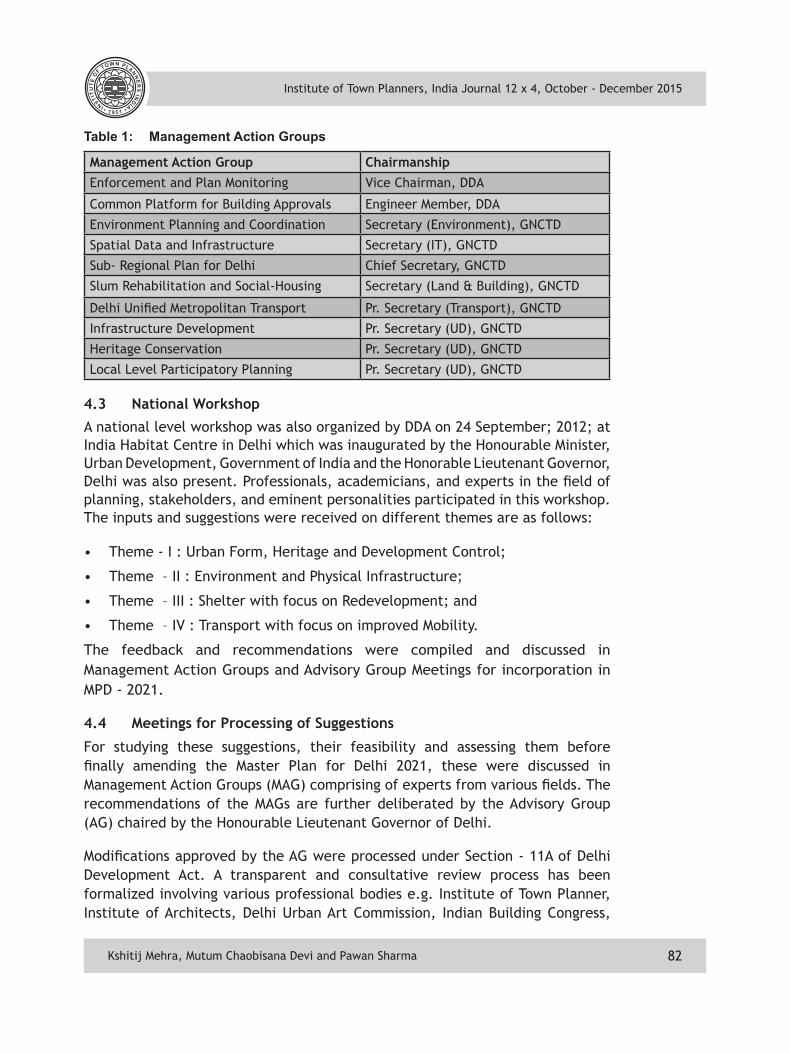
Institute of Town Planners, India Journal 12 x 4, October - December 2015
82
4.3 National Workshop
A national level workshop was also organized by DDA on 24 September; 2012; at India Habitat Centre in Delhi which was inaugurated by the Honourable Minister, Urban Development, Government of India and the Honorable Lieutenant Governor, Delhi was also present. Professionals, academicians, and experts in the field of planning, stakeholders, and eminent personalities participated in this workshop. The inputs and suggestions were received on different themes are as follows:
• Theme - I : Urban Form, Heritage and Development Control;
• Theme – II : Environment and Physical Infrastructure;
• Theme – III : Shelter with focus on Redevelopment; and
• Theme – IV : Transport with focus on improved Mobility.
The feedback and recommendations were compiled and discussed in Management Action Groups and Advisory Group Meetings for incorporation in MPD - 2021.
4.4 Meetings for Processing of Suggestions
For studying these suggestions, their feasibility and assessing them before finally amending the Master Plan for Delhi 2021, these were discussed in Management Action Groups (MAG) comprising of experts from various fields. The recommendations of the MAGs are further deliberated by the Advisory Group (AG) chaired by the Honourable Lieutenant Governor of Delhi.
Modifications approved by the AG were processed under Section - 11A of Delhi Development Act. A transparent and consultative review process has been formalized involving various professional bodies e.g. Institute of Town Planner, Institute of Architects, Delhi Urban Art Commission, Indian Building Congress,
Management Action Group Chairmanship Enforcement and Plan Monitoring Vice Chairman, DDA
Common Platform for Building Approvals Engineer Member, DDA
Environment Planning and Coordination Secretary (Environment), GNCTD
Spatial Data and Infrastructure Secretary (IT), GNCTD
Sub- Regional Plan for Delhi Chief Secretary, GNCTD
Slum Rehabilitation and Social-Housing Secretary (Land & Building), GNCTD
Delhi Unified Metropolitan Transport Pr. Secretary (Transport), GNCTD
Infrastructure Development Pr. Secretary (UD), GNCTD
Heritage Conservation Pr. Secretary (UD), GNCTD
Local Level Participatory Planning Pr. Secretary (UD), GNCTD
Table 1: Management Action Groups
Kshitij Mehra, Mutum Chaobisana Devi and Pawan Sharma
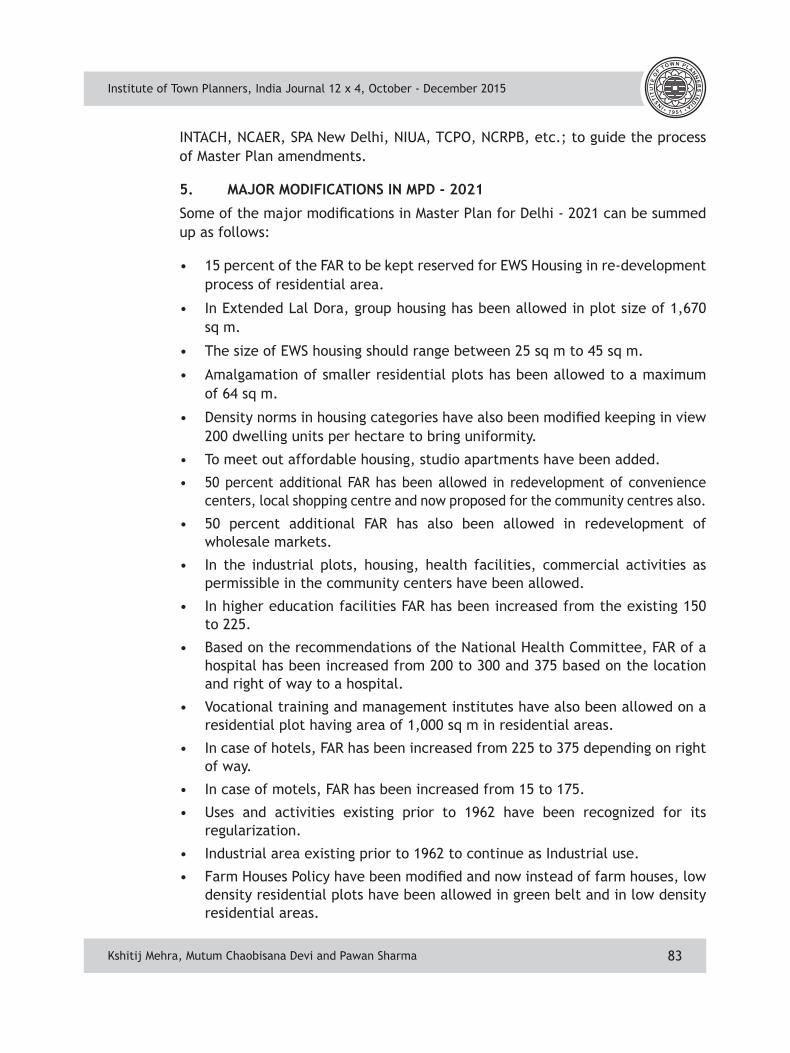
Institute of Town Planners, India Journal 12 x 4, October - December 2015
83
INTACH, NCAER, SPA New Delhi, NIUA, TCPO, NCRPB, etc.; to guide the process of Master Plan amendments.
5. MAJOR MODIFICATIONS IN MPD - 2021
Some of the major modifications in Master Plan for Delhi - 2021 can be summed up as follows:
• 15 percent of the FAR to be kept reserved for EWS Housing in re-development process of residential area.
• In Extended Lal Dora, group housing has been allowed in plot size of 1,670 sq m.
• The size of EWS housing should range between 25 sq m to 45 sq m.
• Amalgamation of smaller residential plots has been allowed to a maximum of 64 sq m.
• Density norms in housing categories have also been modified keeping in view 200 dwelling units per hectare to bring uniformity.
• To meet out affordable housing, studio apartments have been added.
• 50 percent additional FAR has been allowed in redevelopment of convenience centers, local shopping centre and now proposed for the community centres also.
• 50 percent additional FAR has also been allowed in redevelopment of wholesale markets.
• In the industrial plots, housing, health facilities, commercial activities as permissible in the community centers have been allowed.
• In higher education facilities FAR has been increased from the existing 150 to 225.
• Based on the recommendations of the National Health Committee, FAR of a hospital has been increased from 200 to 300 and 375 based on the location and right of way to a hospital.
• Vocational training and management institutes have also been allowed on a residential plot having area of 1,000 sq m in residential areas.
• In case of hotels, FAR has been increased from 225 to 375 depending on right of way.
• In case of motels, FAR has been increased from 15 to 175.
• Uses and activities existing prior to 1962 have been recognized for its regularization.
• Industrial area existing prior to 1962 to continue as Industrial use.
• Farm Houses Policy have been modified and now instead of farm houses, low density residential plots have been allowed in green belt and in low density residential areas.
Kshitij Mehra, Mutum Chaobisana Devi and Pawan Sharma
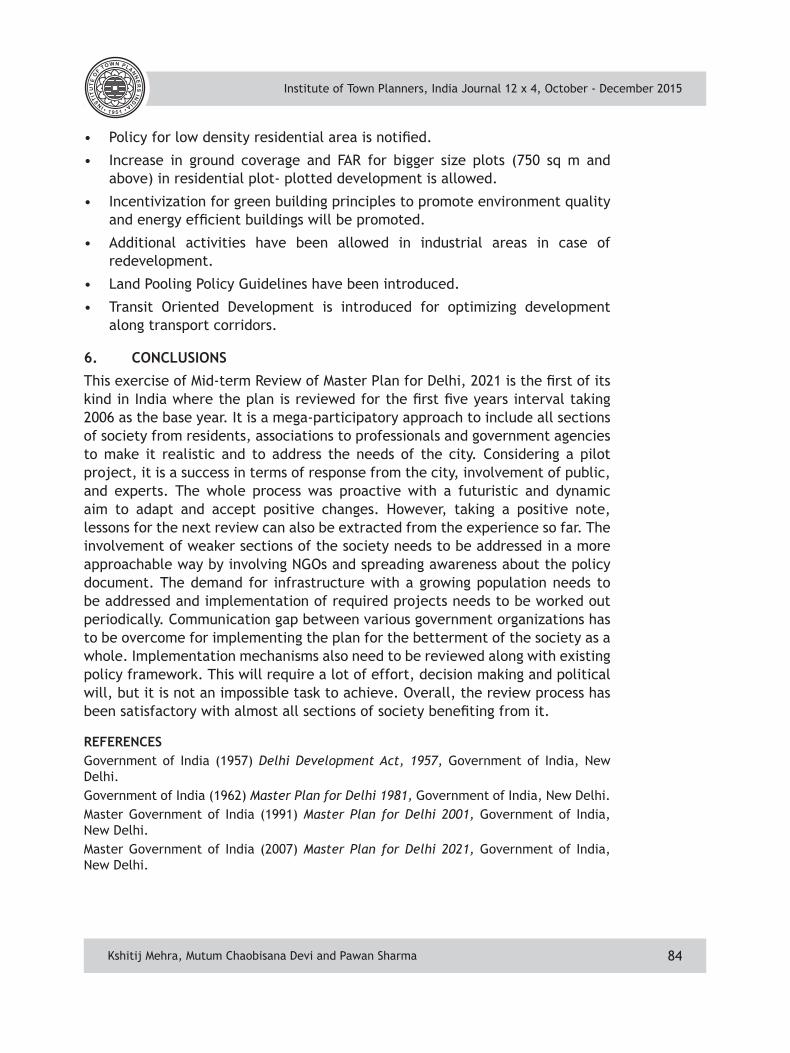
Institute of Town Planners, India Journal 12 x 4, October - December 2015
84
• Policy for low density residential area is notified.
• Increase in ground coverage and FAR for bigger size plots (750 sq m and above) in residential plot- plotted development is allowed.
• Incentivization for green building principles to promote environment quality and energy efficient buildings will be promoted.
• Additional activities have been allowed in industrial areas in case of redevelopment.
• Land Pooling Policy Guidelines have been introduced.
• Transit Oriented Development is introduced for optimizing development along transport corridors.
6. CONCLUSIONS
This exercise of Mid-term Review of Master Plan for Delhi, 2021 is the first of its kind in India where the plan is reviewed for the first five years interval taking 2006 as the base year. It is a mega-participatory approach to include all sections of society from residents, associations to professionals and government agencies to make it realistic and to address the needs of the city. Considering a pilot project, it is a success in terms of response from the city, involvement of public, and experts. The whole process was proactive with a futuristic and dynamic aim to adapt and accept positive changes. However, taking a positive note, lessons for the next review can also be extracted from the experience so far. The involvement of weaker sections of the society needs to be addressed in a more approachable way by involving NGOs and spreading awareness about the policy document. The demand for infrastructure with a growing population needs to be addressed and implementation of required projects needs to be worked out periodically. Communication gap between various government organizations has to be overcome for implementing the plan for the betterment of the society as a whole. Implementation mechanisms also need to be reviewed along with existing policy framework. This will require a lot of effort, decision making and political will, but it is not an impossible task to achieve. Overall, the review process has been satisfactory with almost all sections of society benefiting from it.
REFERENCESGovernment of India (1957) Delhi Development Act, 1957, Government of India, New Delhi.Government of India (1962) Master Plan for Delhi 1981, Government of India, New Delhi.Master Government of India (1991) Master Plan for Delhi 2001, Government of India, New Delhi.Master Government of India (2007) Master Plan for Delhi 2021, Government of India, New Delhi.
Kshitij Mehra, Mutum Chaobisana Devi and Pawan Sharma
Institute of Town Planners, India Journal 12 x 4, October - December 2015
85
Kuldip Singh, Former Chief Engineer; Punjab PWD, Building and Road Punjab
Arun Kumar Sharma, Former Chief Engineer; Ministry of Road Transport and Highways, New Delhi
Widening of Roads in Residential Areas in Chandigarh: A Safety Hazard
Kuldip Singh and Arun Kumar Sharma
AbstractThe roads in residential areas have to cater for mobility, access and parking of vehicles. The speed of vehicles on roads in residential areas should not be more than 10 kmph from safety considerations. By widening the roads in residential areas with bituminous surface, the speed of vehicles in lean hours will rise to more than 30 kmph which is not desirable. The space for parking of vehicles on roads in residential areas can be provided with “grass paver blocks” and for movement of traffic bituminous surface is retained. Roads in the residential areas need to be designed on concept of ‘Woonerf”. If the residents feel usefulness of this approach then the same may be implemented in other Sectors.
1. INTRODUCTIONCountries namely Netherlands, USA and Canada are reducing speeds of vehicles on roads in residential areas whereas in our country we are inadvertently increasing speed of vehicles on roads in residential areas by increasing width of such roads.
In Netherlands the roads in residential areas have been remodeled for reducing speed of vehicular traffic to walking speed of human being which is 5 kmph. Instead of bituminous black topped roads, concrete paver blocks have been provided. The thinking behind this move is to utilize space in the neighborhood of residences for socializing and for the activities of children. Roads in residential areas have been remodeled for the needs of children and residents. Small round-about and plantation has been done to restrict the speed of vehicles to walking speed. The scheme for remodeling of roads in residential areas has been named ‘Woonerf’.
2. WIDENING OF ROADS AND THEIR CONSEQUENCESWidening of roads in residential areas is not merely digging earth and laying pavement layers, but is associated with increase in capacity of roads and speed of vehicular traffic which affects safety of vehicles, pedestrians, cyclists and residents of area. The increase in speed of vehicles affects the environment as at high speed vehicles generate more noise and exhaust gases. Reflection of heat from black topped roads is higher than earthen shoulders. Reduction in green cover to accommodate increase in width of roads will make the climate warmer in summer.
Kuldip Singh and Arun Kumar Sharma
Institute of Town Planners, India Journal 12 x 4, October - December 2015
86
The main functions of roads in residential areas is to provide safe access to residences and parking areas; to provide for movement of traffic from residential area to arterial roads (at periphery of sectors); to cater to the needs of pedestrians and bicycle traffic; to preserve the environment of the residential areas by discouraging movement of through traffic on the residential area; and not to allow commercial traffic on the roads in residential areas.
3. CHANDIGARH: ROAD NETWORKLe Corbusier, town planner of the city beautiful - Chandigarh invented and followed “grid pattern of road network” and designated roads in the city as per purpose they serve, namely, “V-1 to V-7” which gave a unique character to city in deviating from usual radial-ring road system. The authors having been resident of Chandigarh since 1950’s and have seen the city growing and coming up including growth in vehicular traffic from cyclist dominance to passenger cars and consequent up-gradation of road system (in terms of widening of roads) which is still continuing and being taken up in a phased manner.
With economic up-liftment in general, the vehicular traffic in the city has been increasing every year nearly exponentially and bound to increase further. The peripheral roads (V-3) around the sectors are being up-graded to dual-divided to increase capacity of the road with the aim to maintain desired level of service and to avoid head-on collision. The shopping streets (V-4) and sector-approach road (V-5) are being widened to meet with traffic requirements. The approach roads to residential houses (i.e. V-6) are also being widened in a phased manner within the available restricted right-of-way.
3.1 V-6 Roads in ChandigarhThe authors intend to limit their reaction and express their views especially in respect of V-6 roads. Most of these roads had paved carriageway width of 3.65 m and 2.74 m wide roads-set on both sides. The road-sets had invariably beautiful greenery and landscaped by the residents themselves. The purpose of road is to:
• Provide walking space to the pedestrians;
• To provide refuge to vehicular traffic in case of break down and for parking; and
• For laying underground and overhead infrastructure services.
The city to begin with (at time of its birth in 1950’s) was almost accommodating single family in each house / storey but over six decades even third generation in many cases are occupying the same accommodation and to ease for the required space, Administration had allowed increase in covered area for most category of houses. The present scenario is such that each earning member of a family has a four-wheeler. Even the usual garages in houses of one kanal (500 sq yard land area)
Kuldip Singh and Arun Kumar Sharma
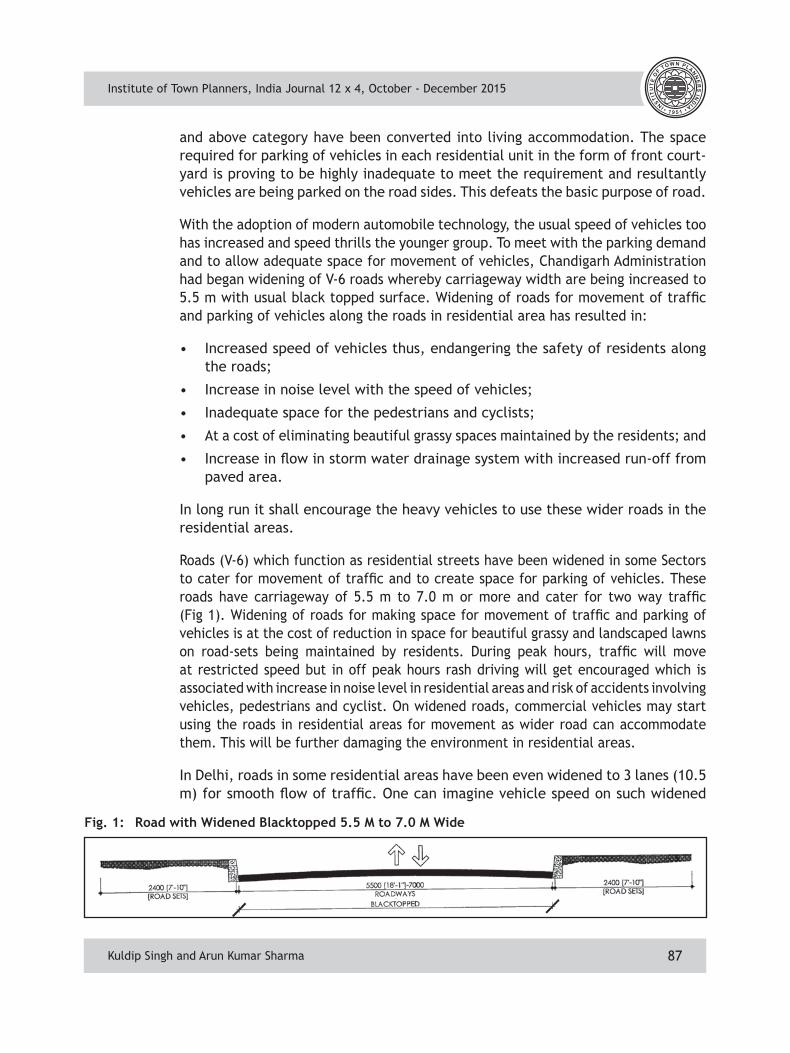
Institute of Town Planners, India Journal 12 x 4, October - December 2015
87
and above category have been converted into living accommodation. The space required for parking of vehicles in each residential unit in the form of front court-yard is proving to be highly inadequate to meet the requirement and resultantly vehicles are being parked on the road sides. This defeats the basic purpose of road.
With the adoption of modern automobile technology, the usual speed of vehicles too has increased and speed thrills the younger group. To meet with the parking demand and to allow adequate space for movement of vehicles, Chandigarh Administration had began widening of V-6 roads whereby carriageway width are being increased to 5.5 m with usual black topped surface. Widening of roads for movement of traffic and parking of vehicles along the roads in residential area has resulted in:
• Increased speed of vehicles thus, endangering the safety of residents along the roads;
• Increase in noise level with the speed of vehicles;
• Inadequate space for the pedestrians and cyclists;
• At a cost of eliminating beautiful grassy spaces maintained by the residents; and
• Increase in flow in storm water drainage system with increased run-off from paved area.
In long run it shall encourage the heavy vehicles to use these wider roads in the residential areas.
Roads (V-6) which function as residential streets have been widened in some Sectors to cater for movement of traffic and to create space for parking of vehicles. These roads have carriageway of 5.5 m to 7.0 m or more and cater for two way traffic (Fig 1). Widening of roads for making space for movement of traffic and parking of vehicles is at the cost of reduction in space for beautiful grassy and landscaped lawns on road-sets being maintained by residents. During peak hours, traffic will move at restricted speed but in off peak hours rash driving will get encouraged which is associated with increase in noise level in residential areas and risk of accidents involving vehicles, pedestrians and cyclist. On widened roads, commercial vehicles may start using the roads in residential areas for movement as wider road can accommodate them. This will be further damaging the environment in residential areas.
In Delhi, roads in some residential areas have been even widened to 3 lanes (10.5 m) for smooth flow of traffic. One can imagine vehicle speed on such widened
Kuldip Singh and Arun Kumar Sharma
Fig. 1: Road with Widened Blacktopped 5.5 M to 7.0 M Wide
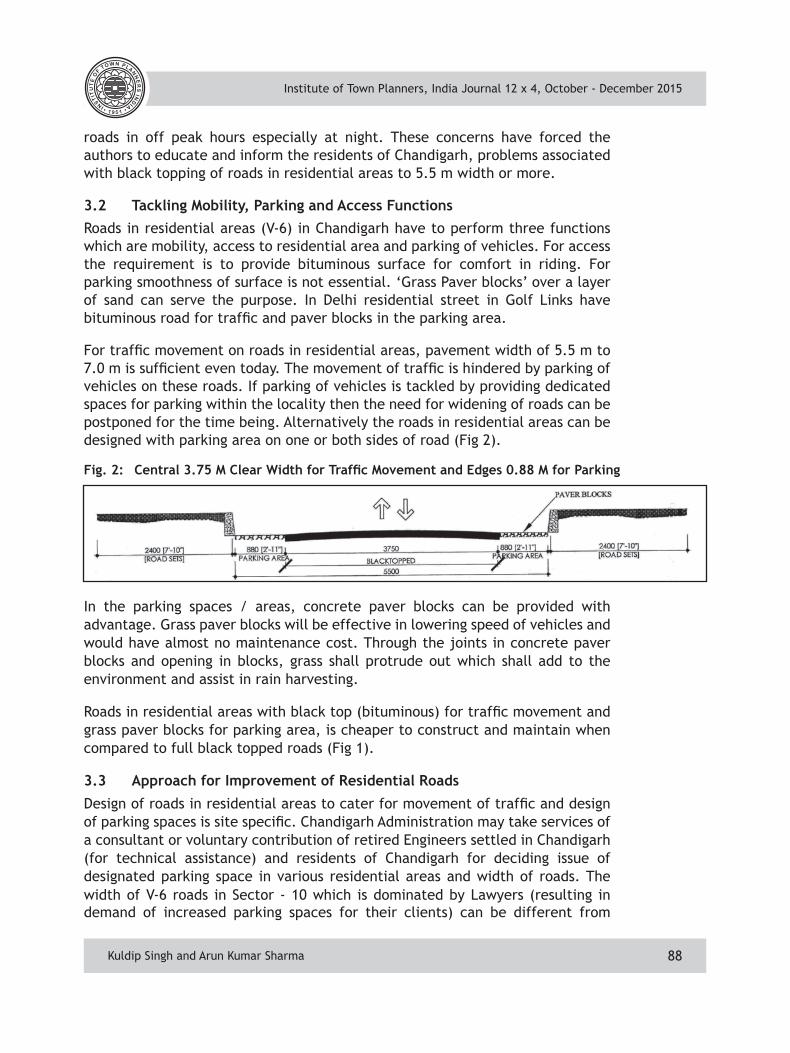
Institute of Town Planners, India Journal 12 x 4, October - December 2015
88
roads in off peak hours especially at night. These concerns have forced the authors to educate and inform the residents of Chandigarh, problems associated with black topping of roads in residential areas to 5.5 m width or more.
3.2 Tackling Mobility, Parking and Access FunctionsRoads in residential areas (V-6) in Chandigarh have to perform three functions which are mobility, access to residential area and parking of vehicles. For access the requirement is to provide bituminous surface for comfort in riding. For parking smoothness of surface is not essential. ‘Grass Paver blocks’ over a layer of sand can serve the purpose. In Delhi residential street in Golf Links have bituminous road for traffic and paver blocks in the parking area.
For traffic movement on roads in residential areas, pavement width of 5.5 m to 7.0 m is sufficient even today. The movement of traffic is hindered by parking of vehicles on these roads. If parking of vehicles is tackled by providing dedicated spaces for parking within the locality then the need for widening of roads can be postponed for the time being. Alternatively the roads in residential areas can be designed with parking area on one or both sides of road (Fig 2).
Fig. 2: Central 3.75 M Clear Width for Traffic Movement and Edges 0.88 M for Parking
Kuldip Singh and Arun Kumar Sharma
In the parking spaces / areas, concrete paver blocks can be provided with advantage. Grass paver blocks will be effective in lowering speed of vehicles and would have almost no maintenance cost. Through the joints in concrete paver blocks and opening in blocks, grass shall protrude out which shall add to the environment and assist in rain harvesting.
Roads in residential areas with black top (bituminous) for traffic movement and grass paver blocks for parking area, is cheaper to construct and maintain when compared to full black topped roads (Fig 1).
3.3 Approach for Improvement of Residential Roads
Design of roads in residential areas to cater for movement of traffic and design of parking spaces is site specific. Chandigarh Administration may take services of a consultant or voluntary contribution of retired Engineers settled in Chandigarh (for technical assistance) and residents of Chandigarh for deciding issue of designated parking space in various residential areas and width of roads. The width of V-6 roads in Sector - 10 which is dominated by Lawyers (resulting in demand of increased parking spaces for their clients) can be different from
Institute of Town Planners, India Journal 12 x 4, October - December 2015
89
other Sectors and may not be required in Sector - 18. Widening requirement of roads in residential areas is related to traffic and parking demand which need to be assessed before undertaking and implementing any project. These can be anticipated in advance and provided for in the Master Plan in new areas to be developed. An example can be, lack of parking space at new Court Complex, Sector - 43, where the Administration has failed to address parking requirement. Alternatively as the demand grows requirement of widening can be reviewed.
There is a need to design roads in residential areas in any one Sector on the concept of “Woonerf”. Based on the acceptability of the concept by residents of Chandigarh further remodeling work of roads in residential areas in some other Sectors can be considered and implemented in phased manner.
Town planning in Chandigarh is marvelous and residents have contributed to keep the city in present shape. The author’s appreciate the efforts of Department of Urban Planning and Architecture in keeping the city in present form.
Town planning of Chandigarh by architect Le Corbusier is of very high order. Most of the new cities, developed in our country after Chandigarh, have taken development ideas and concepts from town planning of Chandigarh. In case roads in residential areas in one or two sectors are remodeled on lines of “Woonerf” concept then town planning of Chandigarh gets updated to present day concept of residential streets in advanced countries. Chandigarh Administration can get projects approved and financed from Urban Development Ministry Government of India. The authors sincerely wish authorities will keep the above said observations in view, while approving further widening of roads in residential areas.
4. CONCLUSIONSThe roads in residential areas have to cater for mobility, access and parking of vehicles. The speed of vehicles on roads in residential areas should not be more than 10 kmph from safety considerations. By widening the roads in residential areas with bituminous surface, the speed of vehicles in lean hours will rise to more than 30 kmph which is not desirable. The space for parking of vehicles on roads in residential areas can be provided with “grass paver blocks” and for movement of traffic bituminous surface in retained. Roads in the residential areas need to be designed on concept of ‘Woonerf”. If the residents feel usefulness of this approach then the same may be implemented in other Sectors.
Guidelines for design of residential roads on ‘Woonerf’ concept should be prepared by town planners and have the feeling thereof by implementing the same. Indian Roads Congress need to frame suitable guidelines to meet local conditions. In Chandigarh where in some Sector roads (V-6) in residential areas have already been widened to 5.5 m or more, for which speed flow studies needs to be conducted especially in off-peak hours and night time to study its side, effects including reaction from the residents.
Kuldip Singh and Arun Kumar Sharma
Institute of Town Planners, India Journal 12 x 4, October - December 2015
90
Ansuya Tater, Urban Planner, Jodhpur Development Authority, Jodhpur
1. INTRODUCTION
Indian cities are urbanizing at an unprecedented scale and pace. Over the next few decades India’s urban population is expected to increase significantly from 377 million in 2011 to 590 million by 2030. This paper discusses about the urban growth and road network of Jodhpur. It is the second highest populated city of Rajasthan state. As per figures given in the Draft Master Development Plan, 2031 of Jodhpur Region, the population projected to be 13 lakh for year 2013 and 31 lakh for the horizon year 2031. The region determines demographic, economic and geographical changes and also indicate the need of adequate planning and development. The paper explains trend of urban growth, sprawl, expansion and development of road network and its inefficiencies.
Every city has its own specialties with socioeconomic, physical and environmental aspects. In case of Rajasthan cities where 60 percent area counts under the desert prone climatic condition with lower density, has different identity with plain land and dry hot climate. Jodhpur city is the second highest populated metropolitan city after Jaipur. The pattern of urban development of the city is made up of a combination of factors facilitating accessibility within metropolitan region, which creates economies, agglomeration growth and networking advantages. (Fig. 1) The share of road network depends on transport availability and the future need of alternative pathways to sustain the increasing number of vehicles. Fig. 2 shows the regional connectivity of Jodhpur to major districts as well as other metropolitan cities and Fig. 3 shows urban expansion as per Master Plan - 2023 and 2031 (draft) of Jodhpur.
Recognition of this interrelationship between transport and urban form is particularly important at a time of unprecedented urban expansion. Some
AbstractThis research is emphasis on land use and road network development in the context of Jodhpur. It highlight the premises of planning and developmental process, pathways of urban accessibil-ity, correlation among various aspects of development as well as its impact on road network and urban growth. It is explained by the measures and examples. Smart growth and sprawl are two concepts used to recognise the density to introduce the importance of land use and road network which led to the development of new approaches in planning.
Urban Growth and Road Network Development: A Case of Jodhpur
Ansuya Tater
Ansuya Tater
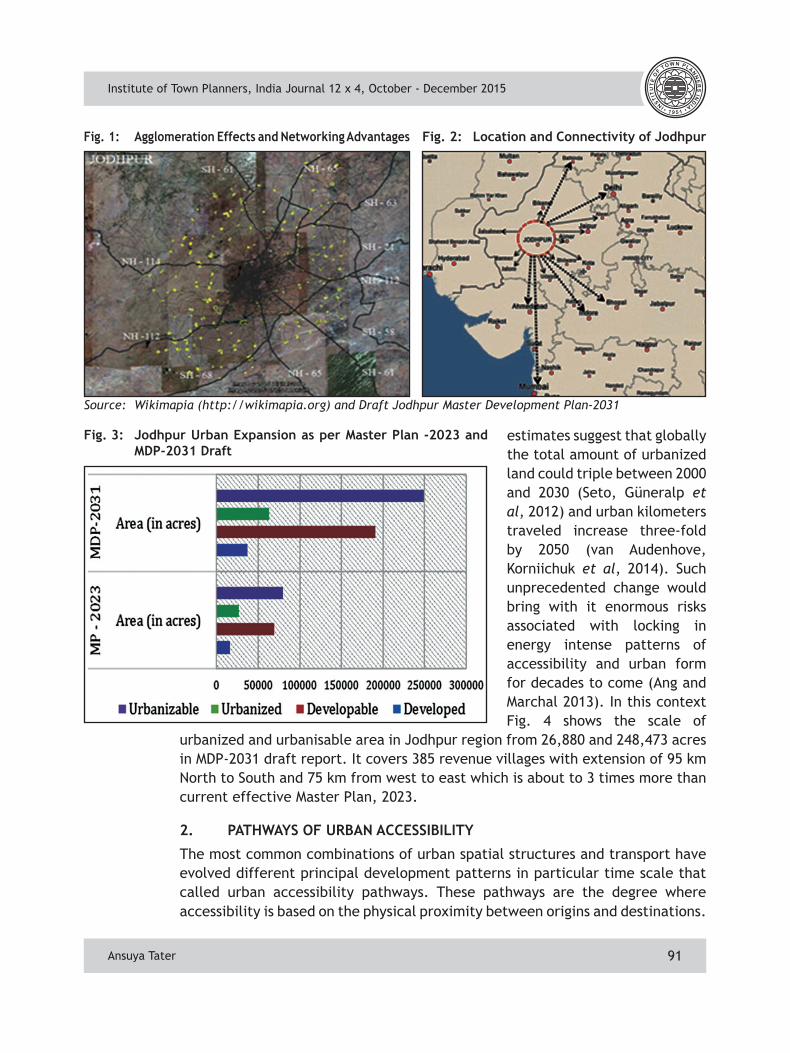
Institute of Town Planners, India Journal 12 x 4, October - December 2015
91
estimates suggest that globally the total amount of urbanized land could triple between 2000 and 2030 (Seto, Güneralp et al, 2012) and urban kilometers traveled increase three-fold by 2050 (van Audenhove, Korniichuk et al, 2014). Such unprecedented change would bring with it enormous risks associated with locking in energy intense patterns of accessibility and urban form for decades to come (Ang and Marchal 2013). In this context Fig. 4 shows the scale of
urbanized and urbanisable area in Jodhpur region from 26,880 and 248,473 acres in MDP-2031 draft report. It covers 385 revenue villages with extension of 95 km North to South and 75 km from west to east which is about to 3 times more than current effective Master Plan, 2023.
2. PATHWAYS OF URBAN ACCESSIBILITY
The most common combinations of urban spatial structures and transport have evolved different principal development patterns in particular time scale that called urban accessibility pathways. These pathways are the degree where accessibility is based on the physical proximity between origins and destinations.
Fig. 1: Agglomeration Effects and Networking Advantages
Fig. 3: Jodhpur Urban Expansion as per Master Plan -2023 and MDP-2031 Draft
Source: Wikimapia (http://wikimapia.org) and Draft Jodhpur Master Development Plan-2031
Fig. 2: Location and Connectivity of Jodhpur
Ansuya Tater
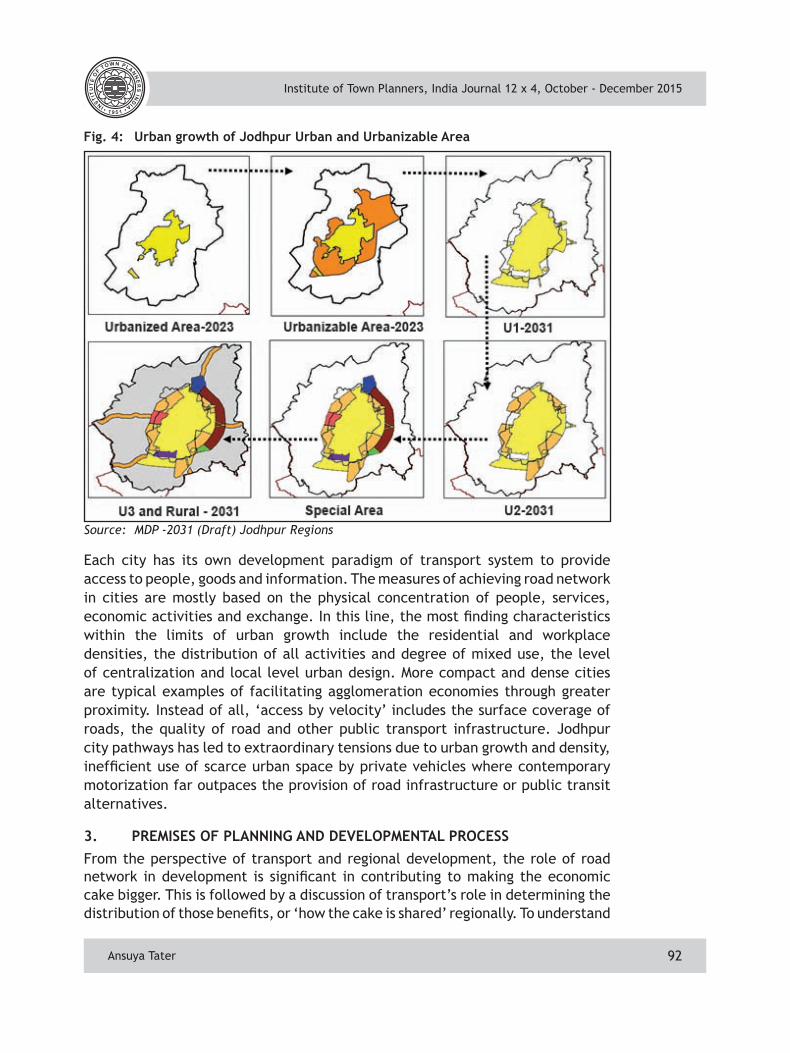
Institute of Town Planners, India Journal 12 x 4, October - December 2015
92
Each city has its own development paradigm of transport system to provide access to people, goods and information. The measures of achieving road network in cities are mostly based on the physical concentration of people, services, economic activities and exchange. In this line, the most finding characteristics within the limits of urban growth include the residential and workplace densities, the distribution of all activities and degree of mixed use, the level of centralization and local level urban design. More compact and dense cities are typical examples of facilitating agglomeration economies through greater proximity. Instead of all, ‘access by velocity’ includes the surface coverage of roads, the quality of road and other public transport infrastructure. Jodhpur city pathways has led to extraordinary tensions due to urban growth and density, inefficient use of scarce urban space by private vehicles where contemporary motorization far outpaces the provision of road infrastructure or public transit alternatives.
3. PREMISES OF PLANNING AND DEVELOPMENTAL PROCESSFrom the perspective of transport and regional development, the role of road network in development is significant in contributing to making the economic cake bigger. This is followed by a discussion of transport’s role in determining the distribution of those benefits, or ‘how the cake is shared’ regionally. To understand
Fig. 4: Urban growth of Jodhpur Urban and Urbanizable Area
Source: MDP -2031 (Draft) Jodhpur Regions
Ansuya Tater
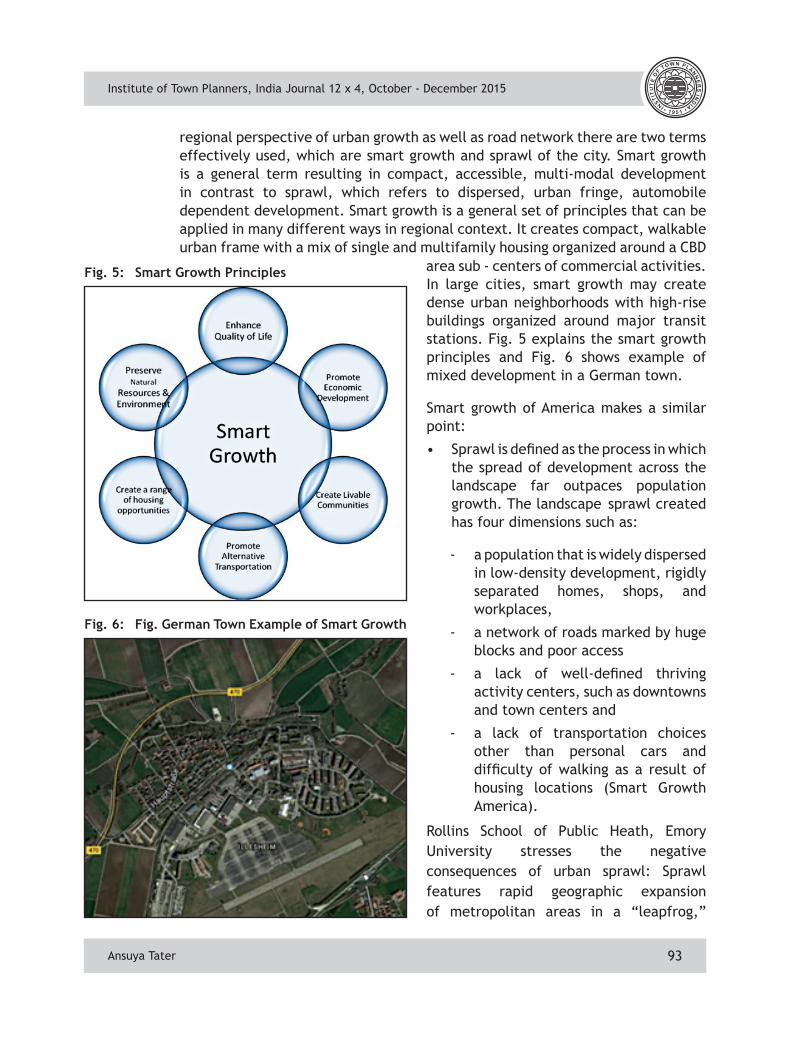
Institute of Town Planners, India Journal 12 x 4, October - December 2015
93
regional perspective of urban growth as well as road network there are two terms effectively used, which are smart growth and sprawl of the city. Smart growth is a general term resulting in compact, accessible, multi-modal development in contrast to sprawl, which refers to dispersed, urban fringe, automobile dependent development. Smart growth is a general set of principles that can be applied in many different ways in regional context. It creates compact, walkable urban frame with a mix of single and multifamily housing organized around a CBD
Fig. 5: Smart Growth Principles
Fig. 6: Fig. German Town Example of Smart Growth
Ansuya Tater
area sub - centers of commercial activities. In large cities, smart growth may create dense urban neighborhoods with high-rise buildings organized around major transit stations. Fig. 5 explains the smart growth principles and Fig. 6 shows example of mixed development in a German town.
Smart growth of America makes a similar point:
• Sprawl is defined as the process in which the spread of development across the landscape far outpaces population growth. The landscape sprawl created has four dimensions such as:
- a population that is widely dispersed in low-density development, rigidly separated homes, shops, and workplaces,
- a network of roads marked by huge blocks and poor access
- a lack of well-defined thriving activity centers, such as downtowns and town centers and
- a lack of transportation choices other than personal cars and difficulty of walking as a result of housing locations (Smart Growth America).
Rollins School of Public Heath, Emory University stresses the negative consequences of urban sprawl: Sprawl features rapid geographic expansion of metropolitan areas in a “leapfrog,”
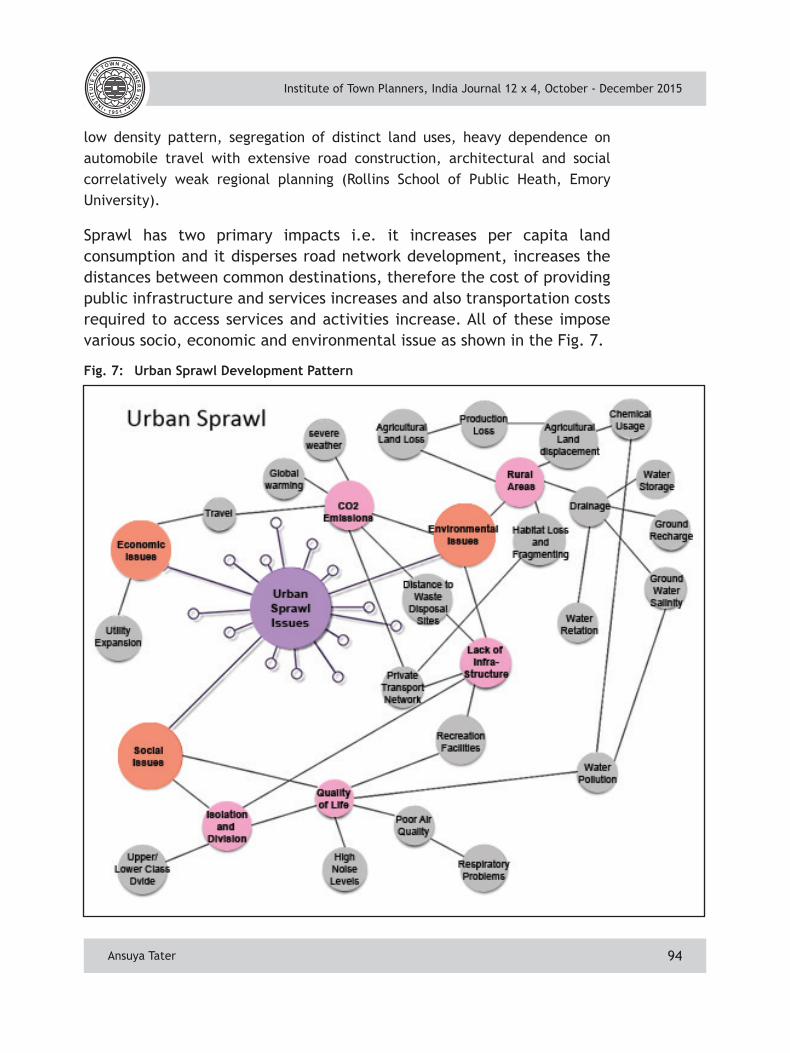
Institute of Town Planners, India Journal 12 x 4, October - December 2015
94
low density pattern, segregation of distinct land uses, heavy dependence on automobile travel with extensive road construction, architectural and social correlatively weak regional planning (Rollins School of Public Heath, Emory University).
Sprawl has two primary impacts i.e. it increases per capita land consumption and it disperses road network development, increases the distances between common destinations, therefore the cost of providing public infrastructure and services increases and also transportation costs required to access services and activities increase. All of these impose various socio, economic and environmental issue as shown in the Fig. 7.
Fig. 7: Urban Sprawl Development Pattern
Ansuya Tater
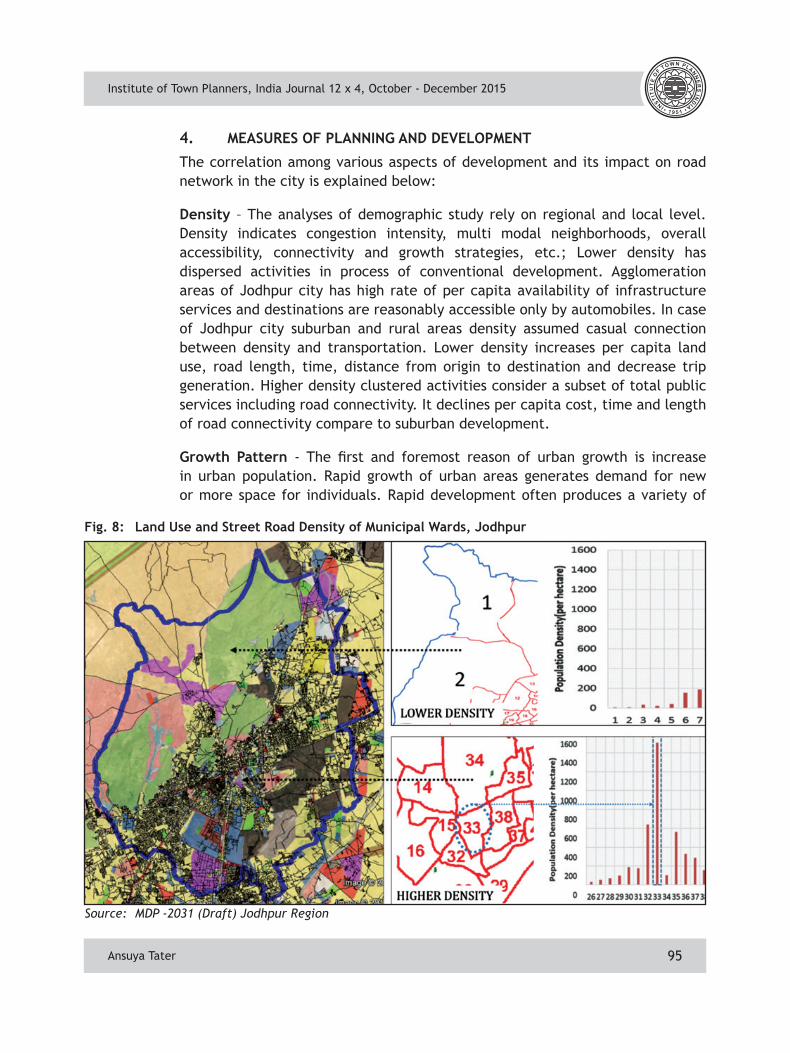
Institute of Town Planners, India Journal 12 x 4, October - December 2015
95
4. MEASURES OF PLANNING AND DEVELOPMENT
The correlation among various aspects of development and its impact on road network in the city is explained below:
Density – The analyses of demographic study rely on regional and local level. Density indicates congestion intensity, multi modal neighborhoods, overall accessibility, connectivity and growth strategies, etc.; Lower density has dispersed activities in process of conventional development. Agglomeration areas of Jodhpur city has high rate of per capita availability of infrastructure services and destinations are reasonably accessible only by automobiles. In case of Jodhpur city suburban and rural areas density assumed casual connection between density and transportation. Lower density increases per capita land use, road length, time, distance from origin to destination and decrease trip generation. Higher density clustered activities consider a subset of total public services including road connectivity. It declines per capita cost, time and length of road connectivity compare to suburban development.
Growth Pattern - The first and foremost reason of urban growth is increase in urban population. Rapid growth of urban areas generates demand for new or more space for individuals. Rapid development often produces a variety of
Fig. 8: Land Use and Street Road Density of Municipal Wards, Jodhpur
Source: MDP -2031 (Draft) Jodhpur Region
Ansuya Tater
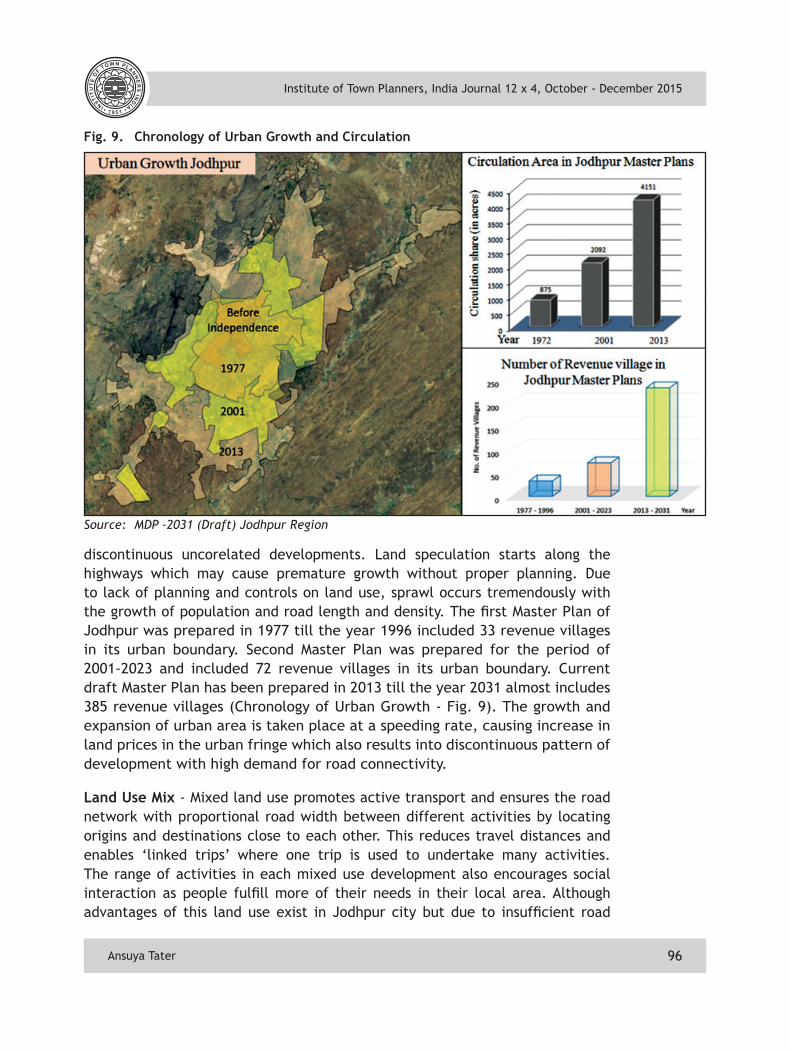
Institute of Town Planners, India Journal 12 x 4, October - December 2015
96
discontinuous uncorelated developments. Land speculation starts along the highways which may cause premature growth without proper planning. Due to lack of planning and controls on land use, sprawl occurs tremendously with the growth of population and road length and density. The first Master Plan of Jodhpur was prepared in 1977 till the year 1996 included 33 revenue villages in its urban boundary. Second Master Plan was prepared for the period of 2001-2023 and included 72 revenue villages in its urban boundary. Current draft Master Plan has been prepared in 2013 till the year 2031 almost includes 385 revenue villages (Chronology of Urban Growth - Fig. 9). The growth and expansion of urban area is taken place at a speeding rate, causing increase in land prices in the urban fringe which also results into discontinuous pattern of development with high demand for road connectivity.
Land Use Mix - Mixed land use promotes active transport and ensures the road network with proportional road width between different activities by locating origins and destinations close to each other. This reduces travel distances and enables ‘linked trips’ where one trip is used to undertake many activities. The range of activities in each mixed use development also encourages social interaction as people fulfill more of their needs in their local area. Although advantages of this land use exist in Jodhpur city but due to insufficient road
Fig. 9. Chronology of Urban Growth and Circulation
Source: MDP -2031 (Draft) Jodhpur Region
Ansuya Tater
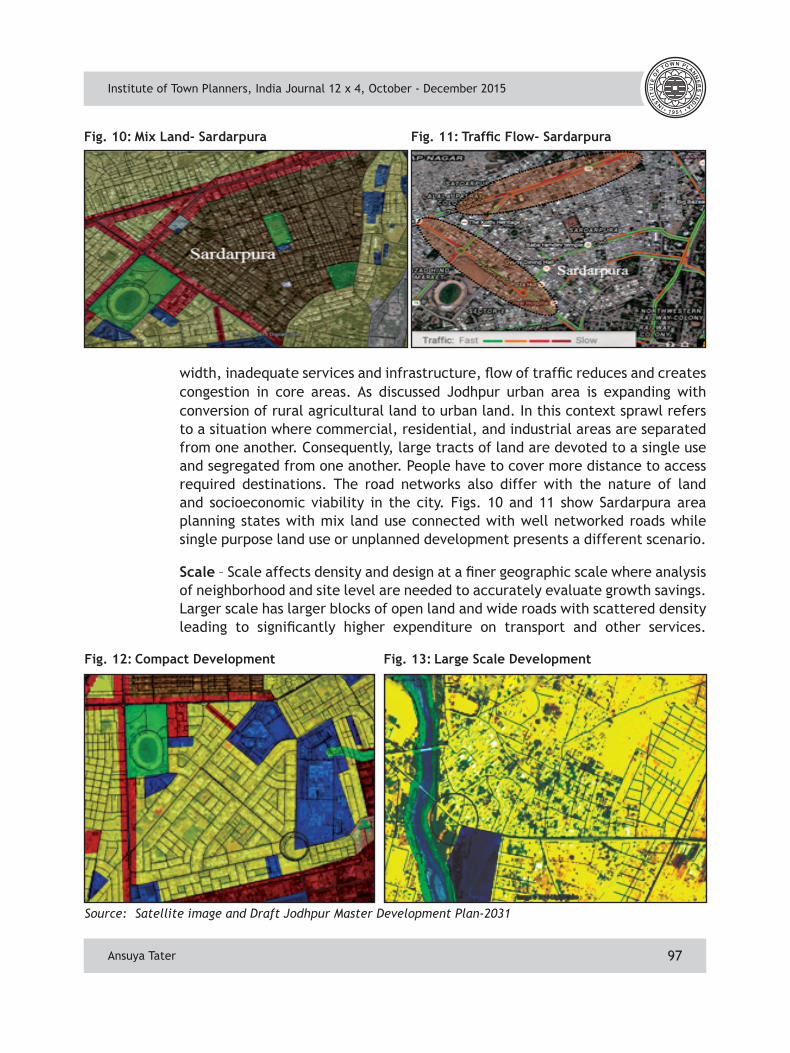
Institute of Town Planners, India Journal 12 x 4, October - December 2015
97
width, inadequate services and infrastructure, flow of traffic reduces and creates congestion in core areas. As discussed Jodhpur urban area is expanding with conversion of rural agricultural land to urban land. In this context sprawl refers to a situation where commercial, residential, and industrial areas are separated from one another. Consequently, large tracts of land are devoted to a single use and segregated from one another. People have to cover more distance to access required destinations. The road networks also differ with the nature of land and socioeconomic viability in the city. Figs. 10 and 11 show Sardarpura area planning states with mix land use connected with well networked roads while single purpose land use or unplanned development presents a different scenario.
Scale – Scale affects density and design at a finer geographic scale where analysis of neighborhood and site level are needed to accurately evaluate growth savings. Larger scale has larger blocks of open land and wide roads with scattered density leading to significantly higher expenditure on transport and other services.
Fig. 10: Mix Land- Sardarpura Fig. 11: Traffic Flow- Sardarpura
Fig. 12: Compact Development Fig. 13: Large Scale Development
Source: Satellite image and Draft Jodhpur Master Development Plan-2031
Ansuya Tater
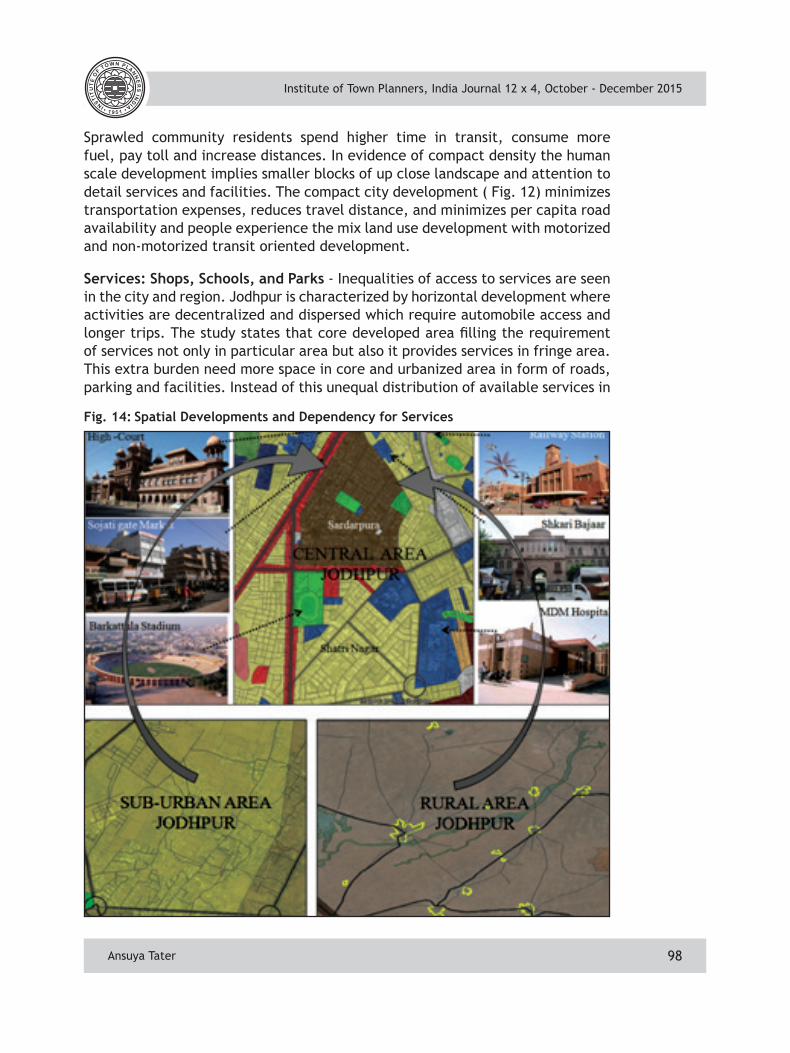
Institute of Town Planners, India Journal 12 x 4, October - December 2015
98
Sprawled community residents spend higher time in transit, consume more fuel, pay toll and increase distances. In evidence of compact density the human scale development implies smaller blocks of up close landscape and attention to detail services and facilities. The compact city development ( Fig. 12) minimizes transportation expenses, reduces travel distance, and minimizes per capita road availability and people experience the mix land use development with motorized and non-motorized transit oriented development.
Services: Shops, Schools, and Parks - Inequalities of access to services are seen in the city and region. Jodhpur is characterized by horizontal development where activities are decentralized and dispersed which require automobile access and longer trips. The study states that core developed area filling the requirement of services not only in particular area but also it provides services in fringe area. This extra burden need more space in core and urbanized area in form of roads, parking and facilities. Instead of this unequal distribution of available services in
Fig. 14: Spatial Developments and Dependency for Services
Ansuya Tater
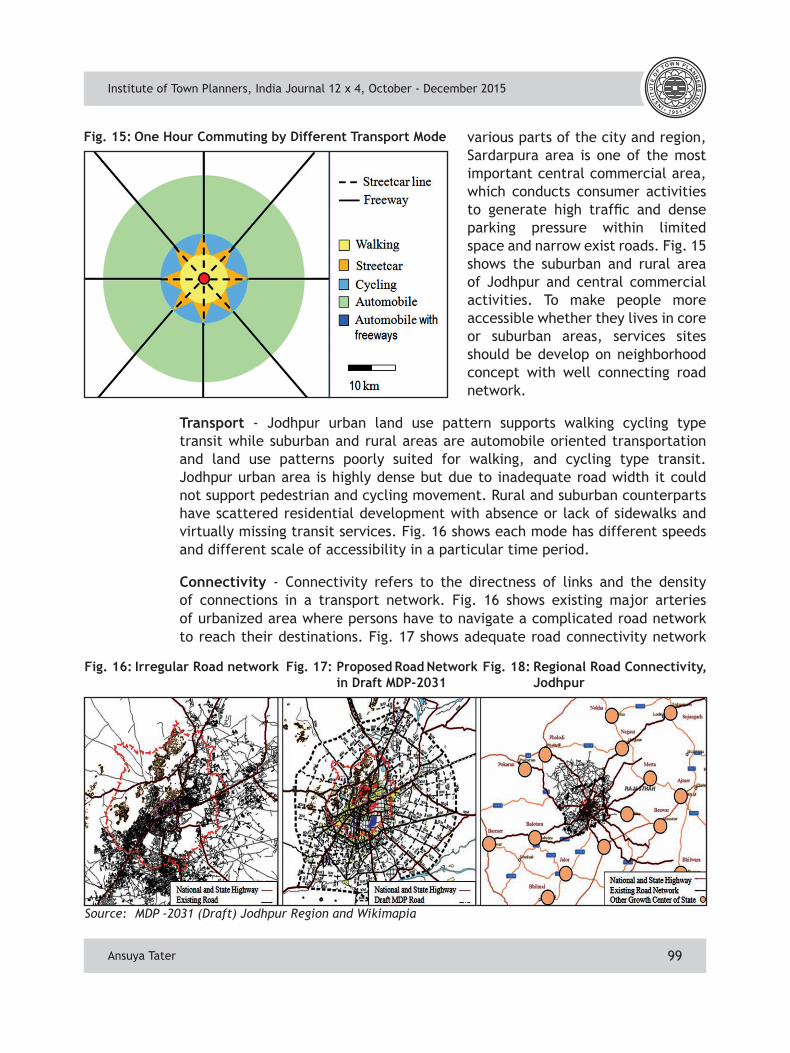
Institute of Town Planners, India Journal 12 x 4, October - December 2015
99
various parts of the city and region, Sardarpura area is one of the most important central commercial area, which conducts consumer activities to generate high traffic and dense parking pressure within limited space and narrow exist roads. Fig. 15 shows the suburban and rural area of Jodhpur and central commercial activities. To make people more accessible whether they lives in core or suburban areas, services sites should be develop on neighborhood concept with well connecting road network.
Transport - Jodhpur urban land use pattern supports walking cycling type transit while suburban and rural areas are automobile oriented transportation and land use patterns poorly suited for walking, and cycling type transit. Jodhpur urban area is highly dense but due to inadequate road width it could not support pedestrian and cycling movement. Rural and suburban counterparts have scattered residential development with absence or lack of sidewalks and virtually missing transit services. Fig. 16 shows each mode has different speeds and different scale of accessibility in a particular time period.
Connectivity - Connectivity refers to the directness of links and the density of connections in a transport network. Fig. 16 shows existing major arteries of urbanized area where persons have to navigate a complicated road network to reach their destinations. Fig. 17 shows adequate road connectivity network
Fig. 15: One Hour Commuting by Different Transport Mode
Fig. 16: Irregular Road network Fig. 17: Proposed Road Network in Draft MDP-2031
Fig. 18: Regional Road Connectivity, Jodhpur
Source: MDP -2031 (Draft) Jodhpur Region and Wikimapia
Ansuya Tater
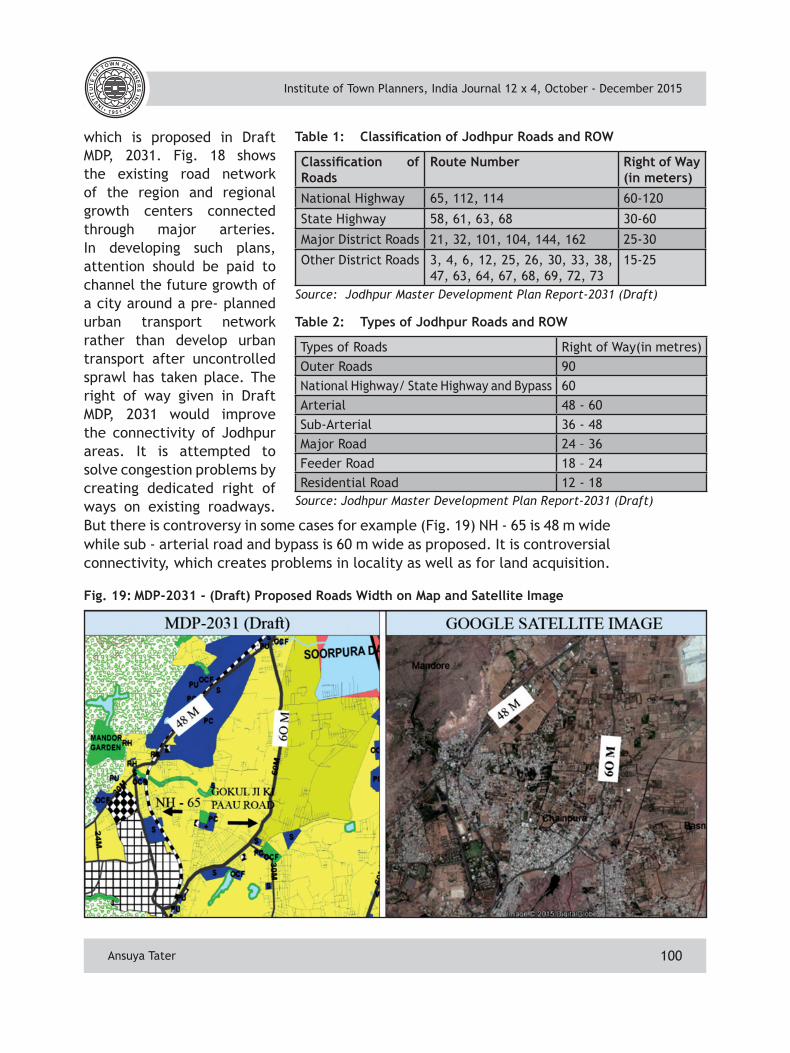
Institute of Town Planners, India Journal 12 x 4, October - December 2015
100
which is proposed in Draft MDP, 2031. Fig. 18 shows the existing road network of the region and regional growth centers connected through major arteries. In developing such plans, attention should be paid to channel the future growth of a city around a pre- planned urban transport network rather than develop urban transport after uncontrolled sprawl has taken place. The right of way given in Draft MDP, 2031 would improve the connectivity of Jodhpur areas. It is attempted to solve congestion problems by creating dedicated right of ways on existing roadways. But there is controversy in some cases for example (Fig. 19) NH - 65 is 48 m wide while sub - arterial road and bypass is 60 m wide as proposed. It is controversial connectivity, which creates problems in locality as well as for land acquisition.
Table 1: Classification of Jodhpur Roads and ROW
Classification of Roads
Route Number Right of Way(in meters)
National Highway 65, 112, 114 60-120
State Highway 58, 61, 63, 68 30-60
Major District Roads 21, 32, 101, 104, 144, 162 25-30
Other District Roads 3, 4, 6, 12, 25, 26, 30, 33, 38, 47, 63, 64, 67, 68, 69, 72, 73
15-25
Source: Jodhpur Master Development Plan Report-2031 (Draft)
Table 2: Types of Jodhpur Roads and ROW
Fig. 19: MDP-2031 - (Draft) Proposed Roads Width on Map and Satellite Image
Types of Roads Right of Way(in metres)Outer Roads 90National Highway/ State Highway and Bypass 60Arterial 48 - 60Sub-Arterial 36 - 48Major Road 24 – 36Feeder Road 18 – 24Residential Road 12 - 18
Source: Jodhpur Master Development Plan Report-2031 (Draft)
Ansuya Tater
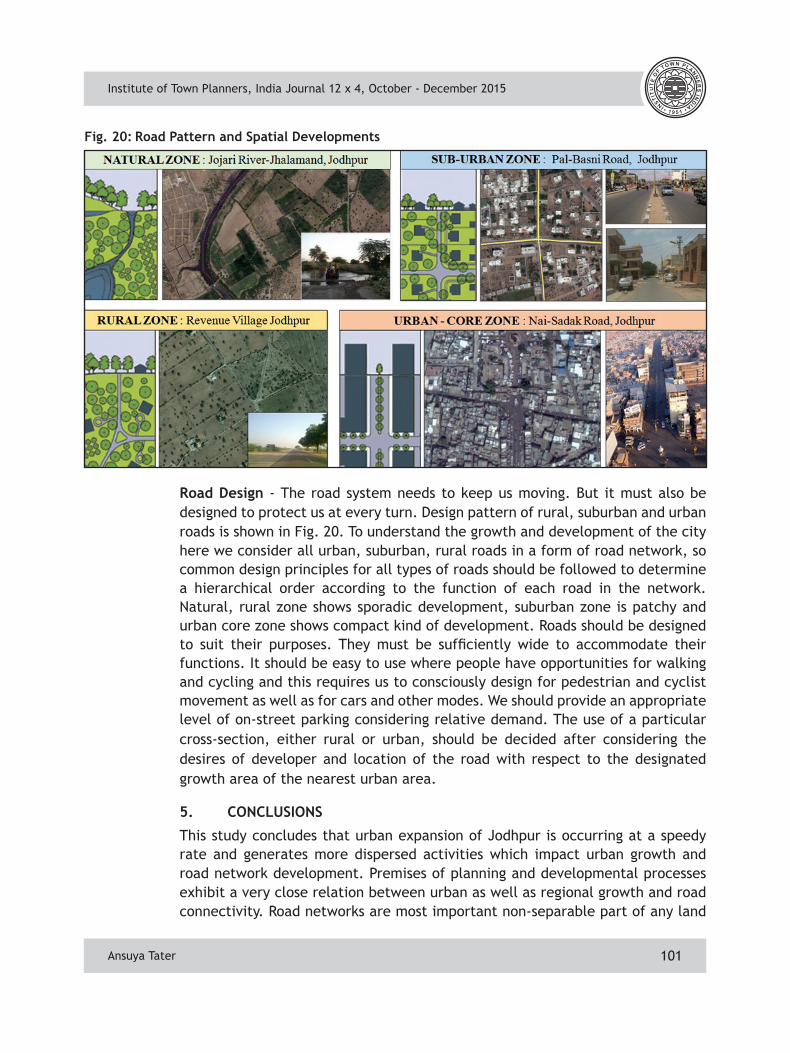
Institute of Town Planners, India Journal 12 x 4, October - December 2015
101
Road Design - The road system needs to keep us moving. But it must also be designed to protect us at every turn. Design pattern of rural, suburban and urban roads is shown in Fig. 20. To understand the growth and development of the city here we consider all urban, suburban, rural roads in a form of road network, so common design principles for all types of roads should be followed to determine a hierarchical order according to the function of each road in the network. Natural, rural zone shows sporadic development, suburban zone is patchy and urban core zone shows compact kind of development. Roads should be designed to suit their purposes. They must be sufficiently wide to accommodate their functions. It should be easy to use where people have opportunities for walking and cycling and this requires us to consciously design for pedestrian and cyclist movement as well as for cars and other modes. We should provide an appropriate level of on-street parking considering relative demand. The use of a particular cross-section, either rural or urban, should be decided after considering the desires of developer and location of the road with respect to the designated growth area of the nearest urban area.
5. CONCLUSIONS
This study concludes that urban expansion of Jodhpur is occurring at a speedy rate and generates more dispersed activities which impact urban growth and road network development. Premises of planning and developmental processes exhibit a very close relation between urban as well as regional growth and road connectivity. Road networks are most important non-separable part of any land
Fig. 20: Road Pattern and Spatial Developments
Ansuya Tater
Institute of Town Planners, India Journal 12 x 4, October - December 2015
102
parcel. It plays an important role in urban spatial structure. Core urban and suburban area include a range and location of activities and services with high and low connectivity of roads where mix land use minimize travel time and distance as central magnetic hub of commercial patches. According to NUTP, 2014 ‘Compact city, mix land use pattern are some of the urban growth policies that will restrict transport demand’. The road network of the city needs to reduce dead ends and irregular interconnections to minimize travel distances by providing direct access. Urban development should come in an integrated manner with concentration on smart growth, density, cost and distance, etc. Regional and suburban transport services should be integrated with the city networks for easy dispersal. An important criterion in suburban and regional transport planning is the trip time. Average trip time for such travel should be about one hour from origin to destination. Sectors of city and region should be well connected to each other with adequate road hierarchy and provide choice of routes to generate adequate transport network and pathways, which would help in commutation between origin and destination and facilitate faster movement of traffic. Dedicated facilities must be provided in core areas for pedestrians, cyclists and other non-motorized vehicles. The safety concerns of cyclists and pedestrians have to be addressed by encouraging the construction of segregated rights of way for walk and cycles. Each and every intersection of a city must be designed for the safe and convenient passage.
REFERENCESGovernment of Rajasthan (2009) Master Development Plan, 2031 (Draft Report) Jodhpur Region, Jodhpur.Litman Todd, Victoria Planning Policy Institute (2015) Understanding Smart Growth Savings.Ministry of Urban Development (2006) National Urban Transport Policy (NUTP) 2006, Government of India, New Delhi.Ministry of Urban Development (2014) National Urban Transport Policy, 2014, Government of India, New Delhi.Wilbur Smith Associates (2010) Draft final report on Comprehensive Mobility Plan for Jodhpur,Master Plan 2023 (Report), Jodhpur.World Bank (2008) Indian road construction industry – Capacity Issues, constraints and Recommendations, Research, development and technology initiatives in the road sector, Annexure IV, Report No: 46326-IN, November 2008.Vickerman, R. (2015) A journal of the world conference on transport research society.
Ansuya Tater
Institute of Town Planners, India Journal 12 x 4, October - December 2015
103
M. Palaniappan, Assistant Professor, School of Planning and Architecture, New Delhi
1. INTRODUCTION
The enactment of the 74th Amendment to the Constitution was indeed, a first step in the process of devolution of power to the people at the grass-root level. After passing of this Act, the State Legislatures were supposed to amend / repeal the existing laws related with this to bring them in conformity with the provisions of the amendments made in 74th Constitute Amendment Act 1922 (74th C.A.A.). This was aimed at to provide adequate time to the state governments to bring the changes in the existing laws which are inconsistent with the provisions of the Constitution 74th C.A.A. However, during this transition period, the existing laws, even though inconsistent with the provisions of the 74th C.A.A.; were allowed to remain in force.
Looking back, wide ranging consultations with the elected representatives of the municipal bodies were held and a number of regional Nagar Palika Sammelans were organized in 1989, preceded by a seminar of municipal officers from all over the country. The basic issue of all these discussions related to strengthening and proper functioning of urban local self governments. On the basis of these discussions, the Constitution (65th Amendment) Bill was introduced in the Parliament in August 1989, and was passed by the Lok Sabha but could not be passed by the Rajya Sabha. Subsequently, with the change of government, the Constitution Amendment Bill was reviewed and the revised Bill was introduced in the Lok Sabha in September, 1990. But, this Bill lapsed with the dissolution of the then Lok Sabha. Later the Constitution (74th Amendment) Bill 1989 was introduced in Lok Sabha on 16th September, 1991. It was referred to a Joint
AbstractThe Metropolitan Planning Committees as envisaged in 74th Constitution Amendment Act, 1992 are the democratically elected bodies for the metropolitan areas. These bodies are expected to take into account the linkages between the town and peripheral areas for the formulation of Metropolitan Development Plans and implement the development schemes relating to the subjects set out in the Twelfth Schedule. Therefore, the paper argues that adequate mechanism has already been provided in the 74th Constitution Amendment Act, 1992 for the planning of peripheral areas which can be achieved, provided a political will coupled with administrative acumen, prevails amongst the concerned.
Peripheral Areas and 74th Constitution Amendment Act, 1992
M. Palaniappan
M. Palaniappan
Institute of Town Planners, India Journal 12 x 4, October - December 2015
104
Parliamentary Committee (JPC) which held detailed discussions with various municipalities and elected representatives and also with the state governments. Based on the report of JPC, the Lok Sabha considered the Constitution (74th Amendment) Bill and passed it on 22nd December, 1992 and received the assent of the President of India on 20th April, 1993.
2. LOCAL SELF GOVERNMENT
The Constitution of India contains detailed provisions for ensuring protection of democracy in Parliament and in the State Legislatures which has been responsible for the survival of democracy in these institutions. There is no constitutional obligation for Local Self Government in urban areas, even though there is a reference to Village Panchayats in the Directive Principles of State’s Policy, but there is no reference to municipalities except by way of entry No. 5 in the State List, as the subject of local self government is the function of the state. As such there is inadequate constitutional protection for urban local self government which results in the democracy in municipal government being very unstable. It is common knowledge that the municipal bodies are frequently suspended and superseded even though the municipal acts provide for regular elections to them. Quite often more than half of the corporations stand superseded and some of the suspensions extend over decades. These suspensions / supersessions have a very deleterious effect on democracy at the grass root level and have been responsible for eroding the very basis of Local Self Government in urban areas.
The Constitution 74th Amendment Act, 1992 has introduced a new part - Part IX-A in the Constitution which deals with matters relating to the municipalities such as structure and composition of municipalities, reservation of seats, elections, powers and functions, finances, planning at the district and metropolitan levels, apart from miscellaneous provisions.
3. URBAN LOCAL BODIES
With regard to the structure and composition of municipalities, the existing practice varies widely from one part of the country to the other and there is no generally accepted set of criteria with regard to an urban agglomeration. With the result, it has led to discrepancies between one state and another.
According to the definition given by the Registrar General of Census, an area is considered to be urban if the following three conditions are fulfilled together:
• Population is 5000 and more;
M. Palaniappan
Institute of Town Planners, India Journal 12 x 4, October - December 2015
105
• Density is more than 400 persons per sq km; and
• 75% of the male working force is engaged in non-agricultural activities.
The first question relates to the population cut off size for declaring an area as urban. The present cut off size in terms of population is 5000. However, in some cases there are towns having a population of less than 5000 where an urban local body has been constituted. Besides, it may be necessary to consider other factors to declare a particular area as urban for example, in the case of hill states of the North-East, even State Headquarters and other important towns within the state should be declared urban even though the population is Less. Similarly, there may be areas of religious or tourist importance having a large floating population but the resident population in the towns may not be very large. Likewise, density of population, income and employment structure have a strong bearing for declaring an area as urban. In order to bring about uniformity in the constitution of municipalities three types of urban local bodies have been envisaged in the 74th C.A.A., 1992. These are:
• A Nagar Panchayat, for a transitional area that is to say - an area in transition from a rural area to an urban area;
• A Municipal Council for a small urban area; and
• Municipal Corporation for a large urban area.
In the 74th C.A.A.; “a transitional area”, means areas having regard to the population of area, density of population therein, revenue generated from local administration, percentage of employment in non-agricultural activities, economic importance or such other factors as the state government may consider it.
In this connection, it would need to be ascertained that at what stage a rural area starts assuming an urban character. It is not merely a question of population, but there are other factors as listed above which would warrant the rural area being redesignated as urban. For example, an area of Gram Panchayat is basically urban in character which over a period of time develops urban characteristics. Thus, the Nagar Panchayat is to perform both rural and urban functions. The Municipal Councils are to be constituted for small urban areas and Municipal Corporations for large urban areas. Since the demographic and other conditions for determination of a particular type of urban local body vary from state to state, the Act has left to the state government to decide which type of municipality would be constituted for each urban area. In this way, a fair degree of elasticity is built into the Act for the States to constitute different types of urban local bodies, keeping in view the local conditions prevalent in the state.
M. Palaniappan
Institute of Town Planners, India Journal 12 x 4, October - December 2015
106
The composition of Municipalities has been designed in such a manner that all the seats are to be filled by direct elections to make it more responsive to the people. For the purpose of elections, the territorial constituencies in the municipal areas have been divided into Wards and each seat shall represent a Ward in the municipality.
In small towns, the size of the Ward is small which provides access to the citizens to its councils but in many bigger municipalities, the population of ward is over 10,000 and in some cases as high as 50,000 which renders municipal administration impersonal and inaccessible. In order to increase the accessibility of the elected representatives to the citizen and reduce the distance between electorate and the elected, the Act has provided for the constitution of Ward Committees. However, the composition and territorial areas of the Ward Committees has been left to the State Legislature to decide keeping in view the geographical size and population of the constituencies. This provision would help the citizens to have ready access to its elected representatives and result in better understanding of local needs. It is expected that it would be a good instrument for helping implementation of programs and bring about greater involvement of the people and their representatives at the grass root level.
4. FUNCTIONS OF URBAN LOCAL BODIES
At present, there are many different agencies operating outside the framework of democratically elected local bodies, which have been entrusted the task of urban planning. Some of these authorities are City Development Authorities and City Improvement Trusts in addition to other agencies responsible to the State and not to the people. With 74th C.A.A., the Municipalities would be called to play a more active role in urban development which would require examination of the various measures to strengthen the local bodies from the management and functional point of view to enable them to take the increased role that is envisaged in Twelfth Schedule (Table – 1).
5. PERIPHERAL AREA
The 74th Constitution Amendment Act provides, (for the first time), for the constitution of a District Planning Committee in every State at the district level to consolidate the plans prepared by the Panchayats both Gram Panchayats and Nagar Panchayats (municipalities) and prepare a draft Development Plan for the district as a whole. Similarly, it is mandatory to constitute a Metropolitan Planning Committee for every metropolitan area to prepare a draft Development Plan of the metropolitan area as a whole. In this way, there are two types of cases, where interaction of municipal bodies and Panchayati Raj bodies is
M. Palaniappan
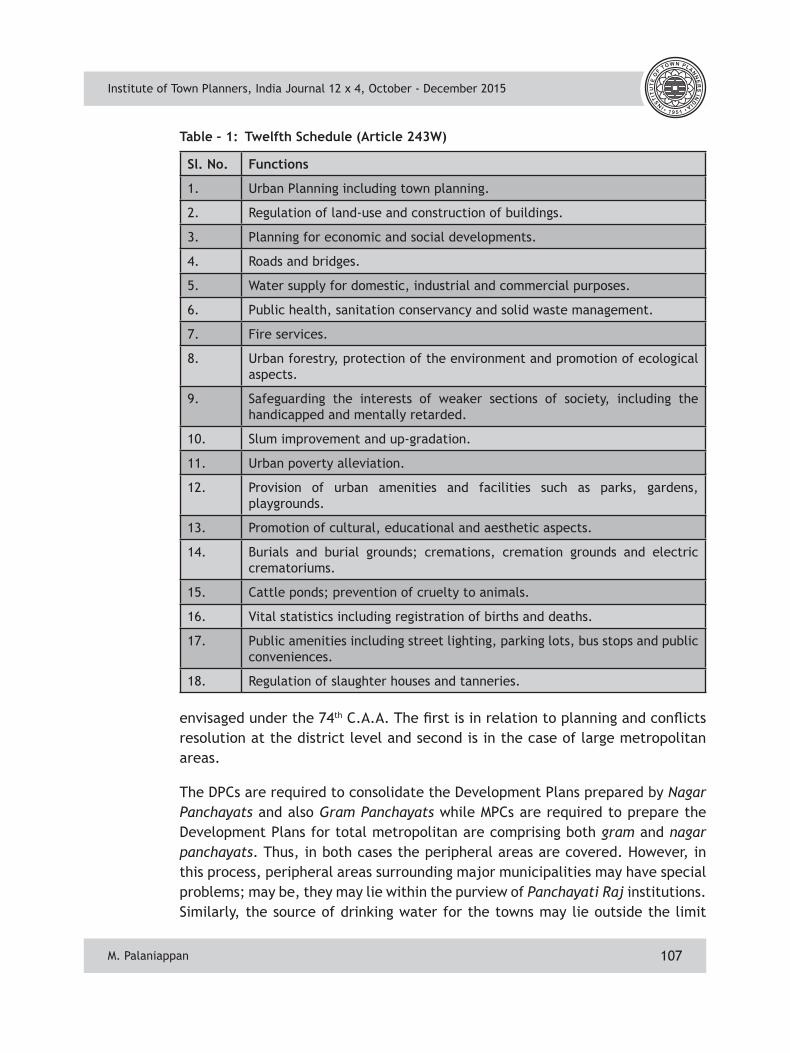
Institute of Town Planners, India Journal 12 x 4, October - December 2015
107
envisaged under the 74th C.A.A. The first is in relation to planning and conflicts resolution at the district level and second is in the case of large metropolitan areas.
The DPCs are required to consolidate the Development Plans prepared by Nagar Panchayats and also Gram Panchayats while MPCs are required to prepare the Development Plans for total metropolitan are comprising both gram and nagar panchayats. Thus, in both cases the peripheral areas are covered. However, in this process, peripheral areas surrounding major municipalities may have special problems; may be, they may lie within the purview of Panchayati Raj institutions. Similarly, the source of drinking water for the towns may lie outside the limit
Table – 1: Twelfth Schedule (Article 243W)
Sl. No. Functions
1. Urban Planning including town planning.
2. Regulation of land-use and construction of buildings.
3. Planning for economic and social developments.
4. Roads and bridges.
5. Water supply for domestic, industrial and commercial purposes.
6. Public health, sanitation conservancy and solid waste management.
7. Fire services.
8. Urban forestry, protection of the environment and promotion of ecological aspects.
9. Safeguarding the interests of weaker sections of society, including the handicapped and mentally retarded.
10. Slum improvement and up-gradation.
11. Urban poverty alleviation.
12. Provision of urban amenities and facilities such as parks, gardens, playgrounds.
13. Promotion of cultural, educational and aesthetic aspects.
14. Burials and burial grounds; cremations, cremation grounds and electric crematoriums.
15. Cattle ponds; prevention of cruelty to animals.
16. Vital statistics including registration of births and deaths.
17. Public amenities including street lighting, parking lots, bus stops and public conveniences.
18. Regulation of slaughter houses and tanneries.
M. Palaniappan
Institute of Town Planners, India Journal 12 x 4, October - December 2015
108
of the town as also the source for disposal of waste. The district roads may be passing through the municipal area but are maintained by the Zila Parishads. All such issues are required to be resolved for taking an integrated view to coordinate urban planning not only for towns but it’s peripheral areas.
6. CONCLUSIONS
While the urban and rural bodies are free to plan for matters which fall exclusively within their jurisdiction, the 74th C.A.A., 1992 has recognized that the growth impulses largely stem from the interaction between urban agglomerations and their rural hinterland / peripheral areas. The Metropolitan Planning Committees as envisaged a 74th Constitution Amendment Act, 1992 are democratically elected local bodies for the metropolitan areas. These bodies are expected to take into account the linkages between the town and peripheral areas for the formulation of Metropolitan Plans and implement the development schemes relating to the subjects set out in the Twelfth Schedule. Thus, proper mechanism has been in built in the 74th Constitution Amendment Act 1992 for the planning of peripheral areas, which can be accomplished provided a political will coupled with administrative acumen prevails amongst the concerned.
ITPI PUBLICATIONSReader Volumes (Rs. 100/- each)
Advanced Transportation PlanningCity and Metropolitan Planning and Design
Development ManagementEcology and Resource DevelopmentEnvironmental Impact AssessmentEnvironmental Planning and Design
History of Human SettlementsHousing
Land EconomicsNetwork and Services
Planning Legislation and Professional PracticePlanning Techniques
Planning TheoryProject Formulation and Appraisal
Regional Planning and Development (Part -I)Social Formation and Changes
Statistics and Population Studies Transportation Planning
Village Planning and Rural Development
M. Palaniappan